Attached files
| file | filename |
|---|---|
| EX-21.1 - EXHIBIT 21.1 - RESOURCE AMERICA, INC. | exh21_1.htm |
| EX-23.1 - EXHIBIT 23.1 - RESOURCE AMERICA, INC. | exh23_1.htm |
| EX-12.1 - EXHIBIT 12.1 - RESOURCE AMERICA, INC. | exh12_1.htm |
| EX-32.1 - EXHIBIT 31.1 - RESOURCE AMERICA, INC. | exh31_1.htm |
| EX-32.1 - EXHIBIT 32.1 - RESOURCE AMERICA, INC. | exh32_1.htm |
| EX-32.2 - EXHIBIT 32.2 - RESOURCE AMERICA, INC. | exh32_2.htm |
| EX-31.2 - EXHIBIT 31.2 - RESOURCE AMERICA, INC. | exh31_2.htm |
| EX-10.9(F) - SEVENTH AMENDMENT BETWEEN LEAF AND NATCITY - RESOURCE AMERICA, INC. | exh10_9f.htm |
| EX-10.9(G) - EIGHTH AMENDMENT BETWEEN LEAF AND NATCITY - RESOURCE AMERICA, INC. | exh10_9g.htm |
UNITED STATES
SECURITIES AND EXCHANGE COMMISSION
WASHINGTON, DC 20549
(Mark One)
R ANNUAL REPORT PURSUANT TO SECTION 13 OR 15(d) OF THE SECURITIES EXCHANGE ACT OF
1934
For the fiscal year ended September 30, 2009
or
¨ TRANSITION REPORT PURSUANT TO SECTION 13 OR 15(d) OF THE SECURITIES EXCHANGE ACT OF
1934
For the transition period from _________ to __________
Commission file number: 0-4408

RESOURCE AMERICA, INC.
(Exact name of registrant as specified in its charter)
|
Delaware |
72-0654145 | |
|
(State or other jurisdiction of |
(I.R.S. Employer | |
|
incorporation or organization) |
Identification No.) |
|
One Crescent Drive, Suite 203, Navy Yard Corporate Center, Philadelphia, PA 19112 | ||
|
(Address of principal executive offices) (Zip code) | ||
|
(215) 546-5005 | ||
|
(Registrant's telephone number, including area code) | ||
|
Securities registered pursuant to Section 12(g) of the Act: |
|
Common stock, par value $.01 per share |
NASDAQ |
|||
|
Title of class |
Name of exchange on which registered |
Indicate by check mark if the registrant is a well-known seasoned issuer, as defined in Rule 405 of the Securities Act. Yes o No R
Indicate by check mark if the registrant is not required to file reports pursuant to Section 13 or Section 15(a) of the Act. Yes o No R
Indicate by check mark whether the registrant (1) has filed all reports required to be filed by Section 13 or 15(d) of the Securities Exchange Act of 1934 during the preceding 12 months (or for such shorter period that the registrant was required to file such reports), and (2) has been subject to such filing requirements for the past 90
days. Yes R No o
Indicate by check mark whether the registrant has submitted electronically and posted on its corporate Web site, if any, every Interactive Data File required to be submitted and posted pursuant to Rule 405 of Regulation S-T during the preceding 12 months (or for such shorter period that the registrant was required to submit and post such
files). Yes ¨ No ¨
Indicate by check mark if disclosure of delinquent filers pursuant to Item 405 of Regulation S-K is not contained herein, and will not be contained, to the best of registrant's knowledge, in definitive proxy or information statements incorporated by reference in Part III of this Form 10-K or any amendment to this Form 10-K. R
Indicate by check mark whether the registrant is a large accelerated filer, an accelerated filer, a non-accelerated filer, or a smaller reporting company. See definition of “large accelerated filer,” “accelerated filer” and “smaller reporting company” in Rule 12b-2 of the Exchange Act.
|
Large accelerated filer |
o |
Accelerated filer |
þ | ||
|
Non-accelerated filer |
o |
(Do not check if a smaller reporting company) |
Smaller reporting company |
o |
Indicate by check mark whether the registrant is a shell company (as defined in Rule 12b-2 of the Act). Yes o No R
The aggregate market value of the voting common equity held by non-affiliates of the registrant, based on the closing price of such stock on the last business day of the registrant’s most recently completed second fiscal quarter (March 31, 2009) was approximately $39,339,000.
The number of outstanding shares of the registrant’s common stock on December 1, 2009 was 18,490,971 shares.
DOCUMENTS INCORPORATED BY REFERENCE
Portions of the Registrant’s Proxy Statement to be filed with the Commission in connection with the 2010 Annual Meeting of Stockholders are incorporated by reference in Part III of this Form 10-K.
RESOURCE AMERICA, INC. AND SUBSIDIARIES
INDEX TO ANNUAL REPORT
ON FORM 10-K
|
Page | |||
|
PART I |
|||
|
Business |
3 | ||
|
Risk Factors |
10 | ||
|
Unresolved Staff Comments |
14 | ||
|
Properties |
14 | ||
|
Legal Proceedings |
15 | ||
|
Submission of Matters to a Vote of Security Holders |
15 | ||
|
PART II |
|||
|
Market for Registrant's Common Equity, Related Stockholder Matters and
Issuer Purchases of Equity Securities |
16 | ||
|
Selected Financial Data |
18 | ||
|
Management’s Discussion and Analysis of Financial Condition and Results of Operations |
19 | ||
|
Quantitative and Qualitative Disclosures About Market Risk |
44 | ||
|
Financial Statements and Supplementary Data |
45 | ||
|
Changes in and Disagreements with Accountants on Accounting and
Financial Disclosure |
94 | ||
|
Controls and Procedures |
94 | ||
|
Other Information |
96 | ||
|
PART III |
|||
|
Directors and Executive Officers and Corporate Governance |
96 | ||
|
Executive Compensation |
96 | ||
|
Security Ownership of Certain Beneficial Owners and Management and
Related Stockholder Matters |
96 | ||
|
Certain Relationships and Related Transactions, and Director Independence |
96 | ||
|
Principal Accounting Fees and Services |
96 | ||
|
PART IV |
|||
|
Exhibits and Financial Statement Schedules |
97 | ||
|
99 | |||
PART I
|
BUSINESS. |
This report contains certain forward-looking statements. Forward-looking statements relate to expectations, beliefs, projections, future plans and strategies, anticipated events or trends and similar expressions concerning matters that are not historical facts. In some cases,
you can identify forward-looking statements by terms such as “anticipate,” “believe,” “could,” “estimate,” “expects,” “intend,” “may,” “plan,” “potential,” “project,” “should,” “will” and “would” or the negative of these terms or other comparable terminology. Such statements are subject to the risks and uncertainties more particularly described
in Item 1A, under the caption “Risk Factors.” These risks and uncertainties could cause actual results and financial position to differ materially from those anticipated in such statements. Readers are cautioned not to place undue reliance on these forward-looking statements, which speak only as of the date hereof. We undertake no obligation to publicly revise or update these forward-looking statements to reflect events or circumstances after the date of this report, except as
may be required under applicable law. We make references to the fiscal years ended September 30, 2009, 2008 and 2007 as fiscal 2009, fiscal 2008 and fiscal 2007, respectively.
General
We are a specialized asset management company that uses industry specific expertise to evaluate, originate, service and manage investment opportunities in the commercial finance, real estate and financial fund management sectors. As a specialized asset manager, we seek to develop investment funds for outside investors for which
we provide asset management services, typically under long-term management arrangements either through a contract with, or as the manager or general partner of, our sponsored investment funds. We typically maintain an investment in the funds we sponsor. Assets under management were $13.7 billion at September 30, 2009.
We limit our fund development and management services to asset classes in which we have specific expertise. We believe this strategy enhances the return on investment we can achieve for our funds. In our commercial finance operations, we focus on originating small and middle-ticket equipment leases and commercial
loans secured by business-essential equipment, including technology, commercial and industrial equipment and medical equipment. In our real estate operations, we concentrate on the ownership, operation and management of multifamily and commercial real estate and real estate mortgage loans including whole mortgage loans, first priority interests in commercial mortgage loans, known as A notes, subordinated interests in first mortgage loans, known as B notes, mezzanine loans, investments in discounted
and distressed real estate loans and investments in “value-added” properties (properties which, although not distressed, need substantial improvements to reach their full investment potential). In our financial fund management operations, we concentrate on trust preferred securities of banks, bank holding companies, insurance companies and other financial companies, bank loans and asset-backed securities, or ABS.
We have developed and manage public and private investment entities, a real estate investment trust, or REIT, and, historically, collateralized debt obligation, or CDO, issuers. Our funds are marketed principally through an extensive broker-dealer/financial planner network that we have developed. During fiscal 2009,
we focused on developing investment opportunities in our commercial finance and real estate segments:
|
|
· |
In commercial finance, we completed the offering of two public limited partnerships, which obtained $135.0 million in investor funding through October 30, 2009. |
|
|
· |
In real estate, we completed the offering of one private limited partnership which obtained $32.5 million in investor funding, and commenced an offering of another $40.0 million fund that will invest in discounted real estate and real estate debt ($37.3 million of investor funding has been raised through December 4, 2009). In addition, we filed a registration statement with the Securities and Exchange
Commission, or SEC, for Resource Real Estate Opportunity REIT, Inc., which will seek to obtain up to $750.0 million in investor funding. |
|
|
· |
In financial fund management, we focused on the management of 32 CDO issuers, six investment entities (one of which is currently in the offering stage), and Resource Capital Markets through our registered broker-dealer subsidiary, Chadwick Securities, Inc. |
Assets Under Management
As of September 30, 2009 and 2008, we managed $13.7 billion and $18.0 billion of assets, respectively, for the accounts of institutional and individual investors, Resource Capital Corp., or RCC (our sponsored REIT), and for our own account in the following asset classes (in millions):
|
September 30, 2009 |
September 30,
2008 |
|||||||||||||||||||
|
Institutional and Individual Investors |
RCC |
Company |
Total |
Total |
||||||||||||||||
|
Trust preferred securities (1) |
$ | 4,458 | $ | − | $ | − | $ | 4,458 | $ | 4,787 | ||||||||||
|
Bank loans (1) |
3,006 | 914 | − | 3,920 | 4,251 | |||||||||||||||
|
Asset-backed securities (1) |
2,186 | − | − | 2,186 | 5,638 | |||||||||||||||
|
Real properties (2) |
643 | − | − | 643 | 614 | |||||||||||||||
|
Mortgage and other real estate-related loans (2) |
10 | 860 | 177 | 1,047 | 1,089 | |||||||||||||||
|
Commercial finance assets (3) |
1,212 | 2 | 147 | 1,361 | 1,535 | |||||||||||||||
|
Private equity and other assets (1) |
66 | − | − | 66 | 59 | |||||||||||||||
| $ | 11,581 | $ | 1,776 | $ | 324 | $ | 13,681 | $ | 17,973 | |||||||||||
|
(1) |
We value these assets at their amortized cost. |
|
(2) |
We value our managed real estate assets as the sum of: (i) the amortized cost of our commercial real estate loans; and (ii) the book value of each of the following: (a) real estate and other assets held by our real estate investment entities, (b) our outstanding legacy loan portfolio, and (c) our interests in real estate. |
|
(3) |
We value our commercial finance assets as the sum of the book value of the equipment and notes and future payment card receivables financed by us. |
Our assets under management are primarily managed through the investment entities we sponsor. The following table sets forth the number of entities we manage by operating segment:
|
CDOs |
Limited
Partnerships |
TIC Programs |
Other Investment Funds |
|||||||||||||
|
As of September 30, 2009 (1) |
||||||||||||||||
|
Financial fund management |
32 | 13 | − | − | ||||||||||||
|
Real estate |
2 | 8 | 7 | 5 | ||||||||||||
|
Commercial finance |
− | 4 | − | 1 | ||||||||||||
| 34 | 25 | 7 | 6 | |||||||||||||
|
As of September 30, 2008 (1) |
||||||||||||||||
|
Financial fund management |
35 | 13 | − | − | ||||||||||||
|
Real estate |
2 | 7 | 7 | 5 | ||||||||||||
|
Commercial finance |
− | 4 | − | 1 | ||||||||||||
| 37 | 24 | 7 | 6 | |||||||||||||
|
(1) |
All of our operating segments manage assets on behalf of RCC. |
We managed three less CDO investment funds at September 30, 2009 as compared to September 30, 2008, reflecting the sale of Apidos CDO VI and the liquidation of two Ischus CDO issuers that invested primarily in real estate ABS. These three funds accounted for a $1.8 billion reduction in our assets under management.
Commercial Finance
General. Through LEAF Financial Corporation, or LEAF, we focus our commercial finance operations on equipment leases and equipment-secured notes to small and mid-sized companies. Our financing is generally for “business-essential” equipment including
technology, commercial, industrial and medical equipment, with a primary financed transaction size of under $500,000 and an average size of $20,000 to $75,000.
During fiscal 2009, we originated $401.0 million in commercial finance assets. As of September 30, 2009, we managed a $1.4 billion commercial finance portfolio, of which $1.2 billion were on behalf of five investment entities we sponsored.
Since we originate equipment leases and loans to sell to our investment entities, our originations primarily depend on the purchasing capacity of those entities. The purchasing capacity of our investment entities depends upon their ability to raise equity capital, to obtain debt and the payments received on existing leases and
loans. We anticipate that current credit market conditions may limit our ability to obtain new debt facilities for our investment entities at least during fiscal 2010 and, if so, our originations may decline from the level of originations in previous years.
We receive acquisition fees, management fees and reimbursements of our operating and administrative expenses incurred from the investment entities we manage. Acquisition fees range from 1% to 2% of the value of the equipment leases and loans sold. Management fees range from 1% to 4% of gross rental or loan payments.
Real Estate
General. Through our real estate segment, we focus on four different areas:
|
|
· |
the acquisition, ownership and management of portfolios of discounted real estate and real estate related debt, which have been acquired to date through joint ventures with institutional investors and a sponsored real estate investment entity; |
|
|
· |
the sponsorship and management of real estate investment entities that principally invest in multifamily housing; |
|
|
· |
the management, principally for RCC, of general investments in commercial real estate debt, including first mortgage debt, whole loans, mortgage participations, notes, mezzanine debt and related commercial real estate securities; and |
|
|
· |
to a lesser extent, the management and resolution of a portfolio of real estate loans and property interests that we acquired at various times between 1991 and 1999, which we refer to as our legacy portfolio. |
Discounted Real Estate Operations. On September 26, 2007, we entered into a joint venture with an institutional partner that acquired a pool of eleven mortgage loans from HUD. This portfolio was acquired at an overall discount of 51% to the approximately $75.0
million face value of the mortgage loans. Through September 30, 2009, we have sold three of the mortgages, foreclosed on the properties underlying eight of the mortgage loans, and have sold three of the foreclosed properties.
In May 2008, we entered into a second joint venture, structured as a credit facility, with the same institutional investor, that makes available up to $500.0 million to finance the acquisition of distressed properties and mortgage loans and that has the objective of repositioning both the directly owned properties and the properties
underlying the mortgage loans to enhance their value. Through September 30, 2009, the joint venture had acquired four distressed loans and two properties for an aggregate of $47.9 million and, in the first quarter of fiscal 2010, acquired an additional distressed loan for $7.2 million. On December 1, 2009, we sold our joint venture interest to RCC at its book value. We retained management of the joint venture assets and will continue to receive fees in connection with the acquisition,
investment management and disposition of new assets acquired by the joint venture.
In July 2009, we filed a registration statement with the Securities and Exchange Commission, or SEC, for Resource Real Estate Opportunity REIT, Inc., that intends to purchase a diversified portfolio of U.S. commercial real estate and real estate related debt that has been significantly discounted due to the effects of economic events and
high levels of leverage, including properties that may benefit from extensive renovations intended to increase their long-term values.
Real Estate Investment Entities. Since 2003, we have sponsored 17 real estate investment entities, all of which have commenced operations having raised $300.4 million in investor funds. The entities using a portion of these funds have acquired interests in 50
multifamily apartment complexes comprising 12,794 units with a combined acquisition cost of $609.8 million, including interests owned by third parties and excluding properties sold.
We receive acquisition, debt placement and bridge equity fees from the partnerships in their acquisition stage. These fees, in the aggregate, have ranged from 1% to 2% of the acquisition costs of the properties or the debt financing, in the case of debt placement fees. In their operational stage, we receive property
management fees of 5% of gross revenues as well as 1% on third-party partnership capital that has been deployed.
Resource Capital Corp. As of September 30, 2009, our real estate operations managed approximately $860.2 million of commercial real estate loan assets on behalf of RCC, including $799.1 million held in CDOs we sponsored in which RCC holds the equity interests. We
discuss RCC in more detail in “− Resource Capital Corp.,” below.
In December 2009, RCC announced that it priced a public offering of 10 million shares of its common stock at a price of $4.50 per share for expected net proceeds, after underwriting discounts and expenses, of $42.2 million.
Resource Residential. In October 2007, we established our internal property management division, Resource Real Estate Management, Inc., or Resource Residential, which has assumed the property management for our investment entities and for the properties we have in our
legacy portfolio. Our property management division has provided us with a source of stable revenues for our real estate operations. Furthermore, we believe that having direct management control over the properties in our investment programs has not only enabled us to enhance their profitability, but also provides us with a competitive edge in marketing our funds by distinguishing us from other sponsors of real estate investment funds. As of September 30, 2009, our property management
division manages all of our fund multifamily properties located in 14 states, with the exception of one property, in addition to managing the distressed/value-added properties in our joint ventures. Resource Residential had 318 employees as of September 30, 2009.
Legacy Portfolio of Loan and Property Interests. Between fiscal 1991 and 1999, our real estate operations focused on the purchase of commercial real estate loans at a discount to their outstanding loan balances and the appraised value of their underlying properties. Since
1999, management has focused on resolving and disposing of these assets. At September 30, 2009, our legacy portfolio consisted of five loans with a book value of $2.9 million and six property interests with a book value of $24.5 million. During fiscal 2009, the number of loans in this portfolio decreased from eight to five through the payoff of two loans and the foreclosure of another loan.
Our real estate operation has consolidated certain variable interest entities, or VIEs, in our financial statements. Loans held by two such VIEs are included in our legacy portfolio. Although included in our consolidated balance sheet and consolidated statement of operations, the assets, liabilities, revenues, costs
and expenses of these VIEs are not ours, and their liabilities will be satisfied only from the operations of the respective VIE and not from our assets.
Financial Fund Management
General. We conduct our financial fund management operations primarily through seven separate operating entities:
|
|
· |
Apidos Capital Management, LLC, or Apidos, finances, structures and manages investments in bank loans, high yield bonds and equity investments; |
|
|
· |
Trapeza Capital Management, LLC, or TCM, a joint venture between us and an unrelated third-party, originates, structures, finances and manages investments in trust preferred securities and senior debt securities of banks, bank holding companies, insurance companies and other financial companies. TCM together with the Trapeza CDO issuers and Trapeza Partnerships are collectively referred to as Trapeza; |
|
|
· |
Resource Capital Markets, Inc., which, through our registered broker-dealer subsidiary, Chadwick Securities, Inc., acts as an agent in the primary and secondary markets for trust preferred securities of banks, bank holding companies, insurance companies, other financial companies, real estate companies, REITS, and other real estate related companies as well as securities of CDO issuers; |
|
|
· |
Resource Europe Management Ltd., or Resource Europe, structures and manages investments in international bank loans; |
|
|
· |
Resource Financial Institutions Group, Inc., or RFIG, serves as the general partner for six (one of which is currently in the offering stage) company-sponsored affiliated partnerships which invest in financial institutions; |
|
|
· |
Ischus Capital Management, LLC, or Ischus, finances, structures and manages investments in asset-backed securities or ABS, including residential mortgage-backed securities, or RMBS, and commercial mortgage-backed securities, or CMBS; and |
|
|
· |
Resource Capital Manager, Inc., or RCM, an indirect wholly-owned subsidiary, provides investment management and administrative services to RCC under a management agreement between RCM and RCC. |
We derive revenues from our existing financial fund management operations through management and administration fees. We are also entitled to receive distributions on amounts we have invested directly in CDOs or in limited partnerships we formed that purchased equity in the CDO issuers we sponsored. Our CDO management
fees generally consist of base and subordinated management fees. For the Trapeza CDO issuers we sponsored and manage, we share the base and subordinated management fees with our co-sponsors. For CDO issuers we sponsored and manage on behalf of RCC, we receive fees directly from RCC pursuant to our management agreement in lieu of asset management fees from the CDO issuers. We describe the management fees we receive from RCC in “− Resource Capital Corp” below. Base
management fees generally are a fixed percentage of the aggregate principal balance of the assets held by the CDO. Our base management fees range from 0.10% to 0.25% of a managed CDO’s assets. Subordinated management fees are also a percentage of the aggregate principal balance of the assets held by the CDO, and range from 0.08% to 0.45%, but typically are subordinated to debt service payments on the CDOs. The management fees are payable monthly, quarterly or semi-annually,
as long as we continue to manage portfolio assets on behalf of the CDO issuer. While we were receiving subordinated management fees from 8 CDOs at September 30, 2009 and have subsequently begun to receive such fees from two additional CDOs, we cannot assure you that we will continue to receive these subordinated management fees in the future.
CDOs. We expect that we will continue to focus on managing the assets of our existing CDOs in fiscal 2010 while we will also seek opportunities to manage additional assets where we can use our existing financial fund management platform and personnel with little or no
equity investment exposure. No such opportunities became available to us in fiscal 2009, and we may be unable to identify any such opportunities in fiscal 2010.
As of September 30, 2009, our financial fund management operations have sponsored and manage 32 CDO issuers (three of which we manage on behalf of RCC) holding approximately $10.6 billion in assets as set forth in the following table:
|
Sponsor/Manager |
Asset Class |
Number of
CDO Issuers |
Assets Under Management (1) |
|||||||
|
(in billions) |
||||||||||
|
Trapeza (2)(3) |
Trust preferred securities |
13 | $ | 4.5 | ||||||
|
Apidos |
Bank loans |
11 | 3.5 | |||||||
|
Ischus (2) |
RMBS/CMBS/ABS |
7 | 2.2 | |||||||
|
Resource Europe |
Bank loans |
1 | 0.4 | |||||||
| 32 | $ | 10.6 | ||||||||
|
(1) |
Calculated as set forth in “Assets Under Management,” above. |
|
(2) |
We also own a 50% interest in the general partners of the limited partnerships that own a portion of the equity interests in each of five Trapeza CDO issuers and one Ischus CDO issuer. |
|
(3) |
Through Trapeza, we own a 50% interest in an entity that manages 11 of the Trapeza CDO issuers and a 33.33% interest in another entity that manages two of the Trapeza CDO issuers. |
Resource Capital Corp. As of September 30, 2009, our financial fund management operations manage $913.6 million of bank loans on behalf of RCC, all of which are in Apidos CDOs we sponsored in which RCC holds the equity interests. We discuss RCC in more detail
in “ − Resource Capital Corp.,” below.
Company-Sponsored Partnerships. We sponsored, structured and currently manage six (one of which is currently in the offering stage) investment entities for individual and institutional investors, five of which invest in banks and other financial institutions and one of
which has been organized as a credit opportunities fund. At September 30, 2009, these partnerships held $65.6 million of assets.
Resource Capital Corp.
RCC, a publicly-traded (NYSE: RSO) REIT that we sponsored and manage, invests in a diversified portfolio of whole loans, B notes, CMBS and other real estate-related loans and commercial finance assets. At September 30, 2009, we owned 2.2 million shares of RCC common stock, or approximately 8.2% of RCC’s outstanding common
stock, and held options to acquire 2,166 shares (at an exercise price of $15.00 per share).
We manage RCC through RCM. At September 30, 2009, we managed a total of $1.8 billion of assets on behalf of RCC. Under our management agreement with RCC, RCM receives a base management fee, incentive compensation and a reimbursement for out-of-pocket expenses. The base management fee is 1/12th of
1.50% of RCC’s equity per month. The management agreement defines “equity” as, essentially, shareholder’s equity, subject to adjustment for non-cash equity compensation expense and non-recurring charges to which the parties agree. The incentive compensation is 25% of (i) the amount by which RCC’s adjusted operating earnings (as defined in the agreement) of RCC (before incentive compensation but after the base management fee) for such quarter per common share
(based on the weighted average number of common shares outstanding for such quarter) exceeds (ii) an amount equal to (a) the weighted average of the price per share of RCC’s common shares in the initial offering by RCC and the prices per share of the common shares in any subsequent offerings of RCC, in each case at the time of issuance thereof, multiplied by (b) the greater of (1) 2.00% and (2) 0.50% plus one-fourth of the ten year treasury rate (as defined in the agreement)
for such quarter, multiplied by the weighted average number of common shares outstanding during such quarter; provided, that the foregoing calculation of incentive compensation will be adjusted to exclude events pursuant to changes in accounting principles generally accepted in the United States, or U.S. GAAP, or the application of U.S. GAAP, as well as non-recurring or unusual transactions or events, after discussion between us, RCC and the approval of a majority of RCC’s directors in the case of non-recurring
or unusual transactions or events. RCM receives at least 25% of its incentive compensation in additional shares of RCC common stock and has the option to receive more of its incentive compensation in stock under the management agreement. We also receive an acquisition fee of 1% of the carrying value of the commercial finance assets we sell to RCC. In fiscal 2009, the management, incentive, servicing and acquisition fees we received from RCC were $8.2 million, or 8% of our consolidated
revenues. These fees have been reported as revenues through our operating segments.
Credit Facilities
We, or our subsidiaries, have access to three separate credit facilities, which we describe in this section.
Commercial Finance - Secured revolving credit facility.
PNC Bank, N.A. (previously National City Bank), or PNC Bank. LEAF has had a revolving warehouse credit facility with a group of banks led by PNC Bank since July 2006. On November 30, 2009, the facility was amended to extend the maturity of the facility to January
29, 2010 to provide additional time for the negotiation of a new longer-term facility. The amendment reduces the maximum credit facility to $125.0 million on December 30, 2009 and to $115.0 million on January 19, 2010, increase the interest rates on base rate borrowings to the base rate (as defined below) plus 4% and on LIBOR-based borrowings to LIBOR plus 5%, reduces the advance rate and alters certain covenants.
The $150.0 million credit facility was previously amended in July and September 2009. The $150.0 million credit facility was previously amended in July and September 2009. As of November 15, 2009, the facility was reduced to $135.0 million. The
July 2009 amendment increased the rate of interest on borrowings outstanding to either (i) the base rate plus 2.75% or (ii) LIBOR plus 3.75%. The base rate is the higher of (i) the prime rate, as defined or (ii) the Federal Funds Rate plus 0.5% and (iii) the LIBOR plus 1%. Prior to July 31, 2009, interest was charged at one of two rates: (i) LIBOR plus 1.5%, or (ii) the prime rate. The facility is non-recourse to us and the underlying equipment being leased or financed collateralizes
the borrowings. In September 2007, LEAF entered into a two-year $75.0 million interest rate swap agreement in order to mitigate the effect of fluctuations in LIBOR. The swap agreement terminated in September 2009. Weighted average borrowings for fiscal 2009 and 2008 were $133.7 million and $136.1 million, respectively, at an effective interest rate of 5.0% and 5.7%, respectively.
Corporate – Secured revolving credit facilities:
TD Bank, N.A. (previously Commerce Bank, N.A.), or TD Bank). We have had a revolving credit facility with TD Bank since May 2007. In November 2009, the facility was amended to (i) extend the maturity date of the loan for an additional year to October 15, 2011,
(ii) decrease the available borrowings to $20.0 million as of November 6, 2009, (iii) reduce the interest rate on the loan to (a) the prime rate of interest plus 3% with a floor of 7% or (b) LIBOR plus 4.5% with a floor of 7.5% and (iv) reduce the monthly reduction in maximum credit facility amount from $850,000 to $150,000 per month. The amendment requires us to further reduce the maximum revolving credit amount to $15.0 million as of June 30, 2010. In consideration for these modifications,
we paid a fee of $345,000 to the lender in lieu of our obligation to pay a $500,000 fee due from the May 2009 amendment.
The facility had previously been amended on May 15, 2009 to (i) extend the maturity to October 15, 2010, (ii) reduce the maximum revolving credit facility amount to $35.0 million (from $45.0 million), (iii) provide for a monthly reduction in the maximum credit facility by $850,000 commencing June 15, 2009, (iv) increase the interest rate
on borrowings to the greater of 10.0% or the prime rate of interest plus 5.0%, (v) eliminate the net worth covenant and (vi) increase the letter of credit fee to 5.25%. In consideration for these modifications, we paid a $1.0 million fee to the lender as of the amendment date and were committed, except under certain circumstances, to pay an additional $500,000 fee in December 2009.
The facility has an unused fee of 0.25% per annum, payable quarterly in arrears. Borrowings are secured by a first priority security interest in certain of our assets and certain subsidiary guarantors, including (i) the present and future fees and investment income earned in connection with the management of, and investments
in, sponsored CDO issuers, (ii) a pledge of 12,972 shares of TBBK common stock, and (iii) the pledge of 1,491,088 shares of RCC common stock. Availability under the facility is limited to the lesser of (a) 75% of the net present value of future management fees to be earned or (b) the maximum revolving credit facility amount. Weighted average borrowings for fiscal 2009 and 2008 were $39.6 million and $50.8 million, respectively, at an effective interest rate of 8.7% and 7.0%, respectively. As
of September 30, 2009, borrowings outstanding were $26.5 million and the line was fully utilized.
Through March 25, 2009, interest was charged at one of two rates at our election: (i) the prime rate plus 1%, or (ii) LIBOR plus 2.25%. From March 26, 2009 to May 15, 2009, the rates had been increased to: (i) the prime rate plus 2.25%, or (ii) LIBOR plus 3.5%.
Sovereign Bank. We have a revolving line of credit with Sovereign Bank with $577,000 of outstanding borrowings as of September 30, 2009. The facility has expired. We are currently negotiating a long term
renewal. The facility is secured by certain investment securities available-for-sale. There was no availability based on the value of the collateral at September 30, 2009. Interest is charged on outstanding borrowings at one of two rates elected at our option: (i) LIBOR plus 2.0%, or (ii) the prime rate. Weighted average borrowings for fiscal 2009 and 2008 were $3.1 million and $6.0 million, respectively, at an effective interest rate of 5.1% and 6.7%, respectively.
Asset Sourcing for Commercial Finance and Real Estate
Commercial finance. LEAF is responsible for sourcing commercial finance investments primarily through program relationships with manufacturers and dealers of essential use equipment and software as well as through acquisitions of existing portfolios originated by third
parties. LEAF’s strategy for originations involves integrating its finance products into the sales and marketing organizations of its program partners such as Dell, Mitel, 3M, Toshiba, OCE, Konica Minolta, Extreme Networks, Honeywell, Sage, Phillips, and Sullivan Schein. By developing and maintaining program relationships with manufacturers and dealers, LEAF is able to leverage and utilize the sales organizations of its partners to market its commercial finance products and services to the highly
dispersed population of small- to medium-sized businesses, which is LEAF’s targeted demographic. On acquisitions, LEAF seeks organizations with a portfolio of financing contracts that provide acceptable returns for its investment entities coupled with proven origination teams.
Real estate. Resource Real Estate is responsible for sourcing investments for our real estate operations and CMBS, which our financial fund management operations have secured. In addition, we maintain relationships with asset owners, institutions, existing partners
and borrowers, who often source investment opportunities directly to us. We maintain offices in Philadelphia, New York, Denver and Los Angeles that provide us with a national platform of acquisition and loan origination specialists that source deals from key intermediaries such as commercial real estate brokers, mortgage brokers and specialists in selling discounted and foreclosed assets. We systematically work to exchange market data and asset knowledge across the platform to provide instant
market feedback on potential investments that is based on empirical data as well as on our $1.7 billion portfolio of assets under management.
Employees
As of September 30, 2009, excluding our property management team, we employed 451 full-time workers, a decrease of 95, or 17%, from 546 employees at September 30, 2008. The following table summarizes our employees by operating segment:
|
Total |
Financial Fund Management |
Real Estate |
Commercial Finance |
Corporate/ Other |
||||||||||||||||
|
September 30, 2009 |
||||||||||||||||||||
|
Investment professionals |
121 | 32 | 26 | 61 | 2 | |||||||||||||||
|
Other |
330 | 16 | 17 | 259 | 38 | |||||||||||||||
| 451 | 48 | 43 | 320 | 40 | ||||||||||||||||
|
Property management |
318 | − | 318 | − | − | |||||||||||||||
|
Total |
769 | 48 | 361 | 320 | 40 | |||||||||||||||
|
September 30, 2008 |
||||||||||||||||||||
|
Investment professionals |
179 | 39 | 31 | 104 | 5 | |||||||||||||||
|
Other |
367 | 19 | 18 | 294 | 36 | |||||||||||||||
| 546 | 58 | 49 | 398 | 41 | ||||||||||||||||
|
Property management |
253 | − | 253 | − | − | |||||||||||||||
|
Total |
799 | 58 | 302 | 398 | 41 | |||||||||||||||
Operating Segments
We provide information on our operating segments in Note 23 to our consolidated financial statements included in Item 8 of this report.
Available Information
We file annual, quarterly and current reports, proxy statements and other information with the SEC. The public may read and copy information we file with the SEC at the SEC’s public reference room at 450 Fifth Street, NW, Washington, D.C. 20549. The public may obtain information on the operations of the Public
Reference Room by calling the SEC at 1-800-SEC-0330. The SEC maintains an internet website that contains reports, proxy and information statements and other information regarding issuers that file electronically with the SEC. The internet address of the SEC site is http://www.sec.gov. Our internet address is http://www.resourceamerica.com. We
make our SEC filings available free of charge on or through our internet website as soon as reasonably practicable after we electronically file such material with, or furnish it to, the SEC. We are not incorporating by reference in this report any material from our website.
|
RISK FACTORS. |
You should carefully consider the following risks together with all of the other information contained in this report in evaluating our company. If any of these risks develop into actual events, our business, financial condition and results of operations could be materially adversely affected and the trading price of our common
stock could decline.
Risks Related to Our Business Generally
Our business depends upon our ability to sponsor, and raise debt and equity capital for, our investment funds.
Our business as a specialized asset manager depends upon our ability to sponsor investment funds, raise sufficient debt financing for these funds and to generate management fees by managing those funds and the assets they hold. If we are unable to raise capital or obtain financing through these funds, we will not be able to
increase our assets under management and, accordingly, our revenues from management fees will be significantly reduced. Our ability to raise capital and obtain financing through these funds depends upon numerous factors, many of which are beyond our control, including:
|
|
· |
existing capital markets conditions. As a result of the ongoing credit market turmoil, we may not be able to obtain debt financing on attractive terms. As a result, we may be required to use a greater proportion of our equity funds to complete asset acquisitions and originations, reducing the number of investments we would otherwise make. If the current capital markets environment
persists, we may modify our investment strategy in order to optimize our portfolio performance. Our options would include limiting or eliminating the use of debt and focusing on those investments that do not require the use of leverage to meet our portfolio goals. During fiscal 2009, the market constraints on our ability to obtain debt financing caused our commercial finance operations to reduce originations of leases and loans held for our investment entities, as well as for our account,
which reduced our operating revenues. For our financial fund management operations, the availability of financing has been largely halted; |
|
|
· |
market acceptance of the types of funds we sponsor and market perceptions about the types of assets which we seek to acquire for our funds which has been impaired by current market conditions; |
|
|
· |
the willingness or ability of retail investors, a principal source of investment funds for our commercial finance and real estate investment funds, to invest in long-term, relatively illiquid investments of the type sponsored by us; |
|
|
· |
the performance of our existing funds. During fiscal 2009, several of our funds reduced or ceased to make equity distributions as a result of reduced operations. In one of those funds, we have deferred our management fees until such time as we are able to resume those distributions in full; |
|
|
· |
the availability of qualified personnel to manage our funds; |
|
|
· |
the availability of suitable investments in the types of loans, real estate, commercial finance assets and other assets that we seek to acquire for our funds; and |
|
|
· |
interest rate changes and their effect on both the assets we seek to acquire for our funds, and the amount, cost and availability of acquisition financing. |
Declines in the market values of our investments may reduce periodic reported results, credit availability and our ability to make distributions.
We classify a substantial portion of our assets for accounting purposes as “available-for-sale.” As a result, changes in the market values of those assets are directly charged or credited to stockholders’ equity. A decline in these values will reduce
the book value of our assets. Moreover, if the decline in value of an available-for-sale asset is other-than-temporary, such decline will reduce earnings. As a result of market conditions, the market value of many of our assets has declined. We cannot assure you that there will not be further declines in the value of our assets, or that the declines will not be material.
A decline in the market value of our assets may also adversely affect us in instances where we have borrowed money based on the market value of those assets. If the market value of those assets declines, the lender may require us to post additional collateral to support the loan. If we were unable to post the additional
collateral, we could have to sell the assets under adverse market conditions. As a result, a reduction in credit availability may reduce our earnings.
Interest rate changes may reduce the value of our assets, our returns on these assets and our ability to generate and increase our management fee revenues.
Changes in interest rates will affect the market value of assets we hold for our own account and our returns from such assets. In general, as interest rates rise, the value of fixed-rate investments, such as equipment leases and loans, will decrease, while as interest rates fall, the return on variable rate assets will fall. In
addition, changes in interest rates may affect the value and return on assets we manage for our investment funds, thereby affecting both our management fees from those funds as well as our ability to sponsor additional investment funds, which, in turn, may affect our ability to generate and increase our management fee revenues.
Increases in interest rates will increase our operating costs.
As of September 30, 2009, we had two corporate credit facilities and one commercial finance credit facility. We may seek to obtain other credit facilities depending upon capital markets conditions. All of our current credit facilities are at variable interest rates, and any facilities that we may be required to consolidate
will also be at variable rates. As a result, increases in interest rates on our credit facilities, to the extent they are with recourse to us and are not matched by increased interest rates or other income from the assets whose acquisition was financed by these facilities, or are not subject to effective hedging arrangements, will increase our interest costs, which would reduce our net income or cause us to sustain losses. In addition, any financing we obtain may require us to maintain a
specified ratio of the amount of the loan to the value of the underlying assets. A decrease in the value of these assets may lead to margin calls or calls for the pledge to, or deposit with, the lender of additional assets. We may not have sufficient funds or unpledged assets to satisfy these calls. While losses sustained by CDOs or other VIEs we consolidate are typically without recourse to us, financing we obtain may impose financial covenants calculated pursuant to U.S. GAAP,
which would include the effects of the these consolidated VIEs. As a result, asset value declines or other adverse occurrences in the CDOs may cause us to breach these covenants, which could lead to margin calls or, possibly, constitute events of default under our corporate or other credit facilities.
Changes in interest rates may impair the operating results of our investment funds and thereby impair our operating results.
The investments made by many of our funds are interest rate sensitive. As a result, changes in interest rates could reduce the value of the assets held and the returns to investors, thereby impairing our ability to raise capital, reducing the management and other fees from those funds and reducing our returns on, and the value
of, amounts we have invested in those funds.
If we cannot generate sufficient cash to fund our participations in our investment funds, our ability to maintain and increase our revenues may be impaired.
We typically participate in our investment funds along with our investors, and believe that our participation enhances our ability to raise capital from investors. We typically fund our participations through cash derived from operations or from financing. If our cash from operations is insufficient to fund our participation
in future investment funds we sponsor, and we cannot arrange for financing, our continuing ability to raise funds from investors and, thus, our ability to maintain and increase the revenues we receive from fund management, will be impaired.
Termination of management arrangements with one or more of our investment funds could harm our business.
We provide management services to our investment funds through management agreements, through our position as the sole or managing general partner of partnership funds, through our position as the operating manager of other fund entities, or combinations thereof. Our arrangements are long-term, and frequently have no specified
termination dates. However, our management arrangements with, or our position as general partner or operating manager of, an investment fund typically may be terminated by action taken by the investors. Upon any such termination, our management fees, after payment of any termination payments required, would cease, thereby reducing our expected revenues. Moreover, under our credit facility with TD Bank, the borrowing base depends upon the value of the collateral pledged, which
includes management fees from our financial fund management segment. As a result, termination of one or more management arrangements would reduce our collateral which could reduce our borrowing base. If the borrowing base were reduced below amounts outstanding on the facility, we would be required to repay the excess. To the extent we do not have cash available to repay the excess, we may be required to sell assets to obtain the necessary cash; any such sale may not be on economically
attractive terms, particularly under current economic condition.
We may have difficulty managing our asset portfolios under current market conditions.
Current market conditions have increased the complexity of managing the assets held by us and our investment funds. As a result, we depend on the ability of our officers and key employees to continue to implement and improve our operational, financial and management controls, reporting systems and procedures to deal effectively
with the complexity of the conditions under which we operate. We may not be able to implement improvements to our management information and control systems in an efficient or timely manner and may discover deficiencies in existing systems and controls. Consequently, we may experience strains on our administrative and operations infrastructure, increasing our costs or reducing or eliminating our profitability.
Our allowance for credit losses may not be sufficient to cover future losses.
At September 30, 2009, our allowances for possible credit losses were $3.2 million in commercial finance (57% of the book value of our leases and loans held for investment in our commercial finance segment) and $1.6 million in real estate (36% of the book value of our investments in real estate loans). We cannot assure you that
these allowances will prove to be sufficient to cover future losses, or that future provisions for credit losses will not be materially greater than those we have recorded to date. Losses that exceed our allowance for credit losses, or cause an increase in our provision for credit losses, could materially reduce our earnings.
Many of the assets we hold in our portfolios are illiquid, and we may not be able to divest them in response to changing economic, financial and investment conditions.
Many of the assets in our portfolio, including those of VIEs included in our consolidated financial statements, do not have ready markets. Moreover, we believe that the market for many of the assets in our portfolio, particularly real estate and CDO interests, have been severely constricted as a result of current economic conditions. As
a result, many of our portfolio assets are relatively illiquid investments. We may be unable to vary our portfolio in response to changing economic, financial and investment conditions or to sell our investments on acceptable terms should we desire to do so.
We are subject to substantial competition in all aspects of our business.
Our ability to sponsor investment funds is highly dependent on our access to various distribution systems of national, regional and local securities firms, and our ability to locate and acquire appropriate assets for our investment funds. We are subject to substantial competition in each area. In the distribution
area, our investment funds compete with those sponsored by other asset managers, which are being distributed through the same networks, as well as investments sponsored by the securities firms themselves. While we have been successful in maintaining access to these distribution channels, we cannot assure you that we will continue to do so. The inability to have continued access to our distribution channels could reduce the number of funds we sponsor and assets we manage, thereby impeding
and possibly impairing our revenues and revenue growth.
In acquiring appropriate assets for our investment funds, we compete with numerous public and private investment entities, commercial banks, investment banks and other financial institutions, as well as industry participants in each of our separate asset management areas. Many of our competitors are substantially larger and
have considerably greater financial, technical and marketing resources than we do. Competition for desirable investments may result in higher costs and lower investment returns, and may delay our sponsorship of investment funds.
There are few economic barriers to entry in the asset management business.
Our investment funds compete against an ever-increasing number of investment and asset management products and services sponsored by investment banks, banks, insurance companies, financial services companies and others. There are few economic barriers to entry into the investment or asset management industries and, as a result,
we expect that competition for access to distribution channels and appropriate assets to acquire will increase.
The Company’s ability to realize its deferred tax asset may be reduced, which may adversely impact results of operations.
Realization of a deferred tax asset requires us to exercise significant judgment and is inherently uncertain because it requires the prediction of future occurances. Our deferred tax asset may be reduced in the future if estimates of future income or our tax planning strategies do not support
the amount of the deferred tax asset. If it is determined that a valuation allowance of its deferred tax asset is necessary, the Company may incur a charge to earnings.
Risks Relating to Particular Aspects of Our Commercial Finance, Financial Fund Management and Real Estate Operations
If LEAF cannot renew, extend or replace its existing credit facility, its ability to originate equipment leases and loans may be impaired and it may have to sell assets to obtain cash to repay the facility.
LEAF's existing secured revolving credit facility expires on January 29, 2010. If LEAF cannot renew or extend the facility, or obtain a replacement facility, LEAF's ability to originate new equipment leases and loans may be impaired. Even
if LEAF is able to renew, extend or replace the facility, the economic terms upon which it is able to do so may be less favorable to LEAF than the terms currently in effect which would reduce LEAF's net revenues and, as a consequence, adversely affect our earnings. Moreover, if LEAF is unable to renew, extend or replace the facility, it will be required to repay the outstanding balance of the facility on its January 29, 2010 maturity. We believe LEAF would repay the balance by accelerating
sales to the investment entities they sponsor. If these entities lack capacity to purchase the assets, LEAF would have to seek sales to third parties. There can be no assurance that LEAF would be able to make any such sales on acceptable terms, or at all, and, as a consequence, that LEAF would not experience material reductions in net income, or losses which would adversely affect our earnings.
The Company may incur impairments to goodwill.
At September 30, 2009, we had $8.0 million recorded as goodwill. We review our goodwill at least annually. Significant negative industry or economic trends, including the lack of recovery in the market price of the Company’s common stock, reduced estimates of future cash flows or disruptions to the commercial
finance business, could indicate that goodwill might be impaired. Our valuation methodology for assessing impairment requires management to make judgements and assumptions based on historical experience and to rely on projections of future operating performance. Our commercial finance business operates in competitive environments and projections of future operating results and cash flows may vary significantly from actual results. If our analysis results in an impairment to its
goodwill, we would be required to record a non-cash charge to earnings in its financial statements during the period in which such impairment is determined to exist. Any such change could have a material adverse effect on our results of operation and our stock price.
While we expect that we will transfer to third-party programs a substantial portion of the commercial finance assets that we originate or acquire, we may retain some assets for our own account. Many of the entities seeking equipment financing from us are small- to middle-size businesses which may have less resources than larger
businesses and which may be disproportionally affected by current economic conditions. As a result, we may be subject to higher risks of a default than if we provided equipment financing to larger businesses. While we will seek to repossess and re-lease or sell the equipment subject to a defaulted lease or other commercial finance instrument, we may not be able to do so on advantageous terms. If a borrower files for protection under the bankruptcy laws, we may experience difficulties
and delays in recovering the equipment. Moreover, the equipment may be returned in poor condition and we may be unable to enforce important lease or loan provisions against an insolvent borrower, including the contract provisions that require the borrower to return the equipment in good condition. In some cases, the deteriorating financial condition of a borrower may make trying to recover what it owes impractical. The costs of recovering equipment upon a default, enforcing obligations
under the lease or loan, and transporting, storing, repairing and finding a new borrower or purchaser for the equipment may be high. All the foregoing risks may be heightened by economic conditions currently existing in the United States. Higher than expected lease defaults will result in a loss of anticipated revenues and will reduce our ability to operate LEAF at a profit.
As a result of recent conditions in the global credit markets, our ability to sponsor investment entities and increase our assets under management may be limited.
Our financial fund management business has largely consisted of the sponsorship and management of CDO issuers. As a result of recent conditions in the global credit markets, sponsorship of new CDOs was impracticable in fiscal 2009 and likely will continue to be impracticable in fiscal 2010. Moreover, our ability to
sponsor investment funds in our commercial finance and real estate segments depends to a significant extent on our ability to obtain financing. Our ability to obtain new financing, and refinance existing financing, both for us and for our investment funds, was adversely impacted by credit market conditions in fiscal 2009. We cannot assure you that we will be able to obtain new financing or refinance existing financing in the future on acceptable financial terms, or at all. An
inability to obtain financing could limit or eliminate our ability to sponsor investment entities and increase our assets under management and, accordingly, impair our ability to generate asset management fees.
We typically have retained some portion or all of the equity in the CDOs we sponsored. CDO equity receives distributions from the CDO only if the CDO generates enough income to first pay the holders of the debt securities and the CDO’s expenses.
We typically have retained some portion or all of the equity interest in CDOs we sponsored either directly or through limited partnership investments. The equity is usually entitled to all of the income generated by the CDO after the CDO pays all of the interest due on the debt securities and its other expenses, and is entitled
to a return on capital only when the principal amount and accrued interest of all of the debt securities has been paid. However, there will be little or no income available to the CDO equity if covenants regarding the operations of a CDO (primarily relating to the value of collateral and interest coverage) are not met, or if there are excessive payment defaults, payment deferrals or rating agency downgrades by the issuers of the underlying collateral, and there may be little or no amounts available
to return our capital. In that event, the value of our direct or indirect investment in the CDO’s equity, which for all CDOs was approximately $8.2 million at September 30, 2009, could decrease substantially or be eliminated. In addition, the equity securities of CDOs are generally illiquid, and because they represent a leveraged investment in the CDO’s assets, the value of the equity securities will generally have greater fluctuations than the value of the underlying collateral.
In some of our investment funds, a portion of our management fees may depend upon the performance of the fund and, as a result, our management fee income may be volatile.
As of September 30, 2009, a portion of our management fees is subordinated to the investors’ receipt of specified returns in 11 of the CDOs we manage. In addition, with respect to RCC and six of our investment entities, we receive incentive or subordinated compensation in addition to our base management fee, depending
upon whether RCC or those partnerships achieve returns above specified levels. During fiscal 2009 and 2008, we earned incentive and subordinated management fees from RCC and from 21 and 22 CDOs, respectively, which constituted 17% and 20%, respectively, of our aggregate management fee income for both periods. As a result of current economic conditions, the amount of incentive or subordinated management fee income we receive maybe reduced, and any such reduction may be material.
Real estate loans in our portfolio are subject to a higher risk of loss than conventional mortgage loans.
Real estate loans in our portfolio differ significantly from conventional mortgage loans. In particular, these loans:
|
|
· |
are junior mortgage loans; |
|
|
· |
involve payment structures other than equal periodic payments that retire a loan over its term; |
|
|
· |
require the borrower to pay a large lump sum at loan maturity (which will depend upon the borrower’s ability to obtain financing or otherwise raise a substantial amount of cash at maturity); and |
|
|
· |
while producing income, do not generate sufficient revenues to pay the full amount of debt service on the loan as originally structured. |
As a result, real estate loans in our portfolio may have a higher risk of default and loss than conventional mortgage loans, and may require us to become involved in expensive and time-consuming workouts, or bankruptcy, reorganization or foreclosure proceedings.
In addition, the principal or sole source of recovery for our real estate loans is typically the underlying property and, accordingly, the value of our loans, and our ability to collect loan payments will depend upon local, regional and national economic conditions, and conditions affecting the property specifically, including the cost
of compliance with, and liability under environmental, health and safety laws, changes in interest rates and the availability of financing, casualty losses, the attractiveness of the property, the availability of tenants, the ability of tenants to pay rent, competition from similar properties in the area and neighborhood values. Operating and other expenses of real properties, particularly significant expenses such as real estate taxes, insurance and maintenance costs, generally do not decrease when
revenues decrease and, even if revenues increase, operating and other expenses may increase faster than revenues.
|
UNRESOLVED STAFF COMMENTS. |
None
|
PROPERTIES. |
Philadelphia, Pennsylvania:
We maintain our executive and corporate offices at One Crescent Drive in the Philadelphia Navy Yard under a lease for 13,484 square feet that expires in May 2019. Certain of our financial fund management and real estate operations are also located in these offices. We lease
21,554 square feet for additional executive office space and for certain of our real estate operations at 1845 Walnut Street, Philadelphia, Pennsylvania. We sublease a portion of this space to Atlas Energy, Inc. (formerly Atlas America, Inc., or Atlas Energy, our former energy subsidiary). This lease, which expires in May 2013, is in an office building in which we own a 5% equity interest. Our commercial finance operations
are located in another office building at One Commerce Square, 2005 Market Street, 15th Floor, Philadelphia, Pennsylvania under a lease for 59,448 square feet that expires in August 2013.
New York, New York:
We maintain additional executive offices in a 19,590 square foot location (of which a portion is sublet to Atlas Energy) at 712 5th Avenue, New York, New York under a lease agreement that expires in March 2010.
Other Locations:
Our commercial finance operations own a 29,500 square foot building at 1720A Crete Street, Moberly, Missouri. In addition, we maintain various office leases in the following cities: Omaha, Nebraska; Los Angeles and Santa Ana, California; Denver, Colorado and Columbia, South Carolina. We also lease office
space in London, England for our European operations.
|
LEGAL PROCEEDINGS. |
In August 2009, Riverside National Bank of Florida, or Riverside, initiated a lawsuit now captioned Riverside National Bank of Florida v. The McGraw-Hill Companies, Inc. et al., New York Supreme Court, New York County, No. 650665/2009, against several investment banks, rating
agencies, and collateral managers of CDOs, including Trapeza Capital Management, LLC, or TCM. We own a 50% interest in TCM, and an unaffiliated third-party owns the other 50% interest.
The complaint seeks monetary damages in an unspecified amount against TCM arising out of Riverside’s investment in certain CDOs between 2005 and 2007. Riverside’s claims against TCM stem from its role as collateral manager for various Trapeza CDOs, which were sold by various investment banks. The complaint
alleges that the offering materials for the CDOs were prepared in part by TCM and were false and misleading. The complaint further alleges that TCM breached fiduciary and contractual obligations by failing to properly monitor the collateral for the CDOs, failing to mitigate losses and failing to disclose known quality and performance problems with the underlying collateral. TCM believes that none of the claims have merit and intends to vigorously defend itself in this matter.
We are also a party to various routine legal proceedings arising out of the ordinary course of our business. Management believes that none of these actions, individually or in the aggregate, will have a material adverse effect on our financial condition or operations.
|
ITEM 4. |
SUBMISSION OF MATTERS TO A VOTE OF SECURITY HOLDERS. |
No matter was submitted to a vote of security holders during the quarter ended September 30, 2009.
PART II
|
MARKET FOR REGISTRANT'S COMMON EQUITY, RELATED STOCKHOLDER | |
|
MATTERS AND ISSUER PURCHASES OF EQUITY SECURITIES. |
Our common stock is quoted on the NASDAQ Global Select Market under the symbol "REXI." The following table sets forth the high and low sale prices as reported by NASDAQ on a quarterly basis for our last two fiscal years:
|
As Reported |
||||||||
|
High |
Low |
|||||||
|
Fiscal 2009 |
||||||||
|
Fourth Quarter |
$ | 6.23 | $ | 4.68 | ||||
|
Third Quarter |
$ | 6.60 | $ | 3.42 | ||||
|
Second Quarter |
$ | 4.19 | $ | 2.76 | ||||
|
First Quarter |
$ | 9.36 | $ | 3.25 | ||||
|
Fiscal 2008 |
||||||||
|
Fourth Quarter |
$ | 13.61 | $ | 8.35 | ||||
|
Third Quarter |
$ | 10.84 | $ | 8.01 | ||||
|
Second Quarter |
$ | 14.47 | $ | 9.44 | ||||
|
First Quarter |
$ | 18.71 | $ | 14.18 | ||||
As of December 1, 2009, there were 18,490,971 shares of common stock outstanding held by 402 holders of record.
We have paid regular quarterly cash dividends since the fourth quarter of fiscal 1995. Commencing with the dividend payable in the first quarter of fiscal 2006, we increased our quarterly dividend by 20% to $0.06 per common share and, beginning with the dividend payable in the first quarter
of fiscal 2007 and continuing to the second quarter of fiscal 2009, we further increased our quarterly dividend by 17% to $0.07 per common share. For the third and fourth quarters of fiscal 2009, we decreased our quarterly dividend by 57% to $0.03 per common share due to the volatility and reduction in liquidity in global credit markets.
Securities Authorized for Issuance under Equity Compensation Plans
|
(a) |
(b) |
(c) | |
|
Plan category |
Number of securities to be issued upon exercise of outstanding options, warrants and rights |
Weighted-average exercise price of outstanding options, warrants and rights |
Number of securities remaining available for future issuance under equity compensation plans excluding securities reflected in column (a) |
|
Equity compensation plans approved by security holders |
3,134,596 |
$9.04 |
576,863 |
Issuer Sales of Equity Securities
In connection with the sale of $15.6 million of our 12% senior notes on September 29, 2009, we issued five-year detachable warrants which provide purchasers with the right to acquire 3,052,940 shares of our common stock at an exercise price of $5.10 per share. At
completion of the sale of an additional $3.4 million of senior notes on October 6, 2009, we issued additional warrants to purchase 637,255 shares upon the same terms. No separate consideration was paid by the purchasers for the warrants. See Note 12 to our consolidated financial statements included in Item 8 of this report. We relied upon the exemption from registration provided by Section 4(2) and Regulation D under the Securities Exchange Act of 1933, as amended. The
proceeds of the offering were used to paydown our credit facility with TD Bank by $4.7 million and for general corporate purposes.
Issuer Purchases of Equity Securities
On July 26, 2007, the Board of Directors approved a share repurchase program under which we may buy up to $50.0 million of our outstanding common stock from time to time, replacing a similar plan that had been approved by the Board in September 2004. As of September 30, 2009, we
have repurchased an aggregate of 188,123 shares at a total cost of $2.8 million under this program, at an average cost of $14.99 per share. We did not repurchase any shares during fiscal 2009.
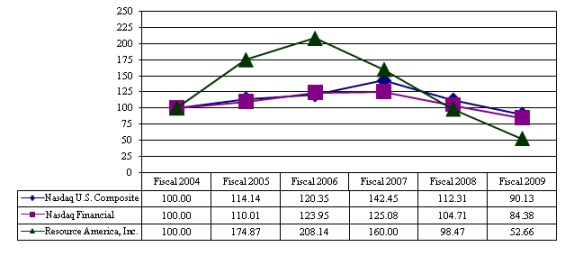
Performance Graph
The following graph compares the cumulative total stockholder return on our common stock with the cumulative total return of two other stock market indices: the NASDAQ United States Composite and the NASDAQ Financial.
Comparison of Five Year Cumulative Total Return*
|
|
* |
Assumes $100 was invested on October 1, 2004 in our common stock or in the indicated index and that all cash dividends were reinvested as received. |
|
SELECTED FINANCIAL DATA. |
The following selected financial data should be read together with our consolidated financial statements, the notes to the consolidated financial statements and "Management's Discussion and Analysis of Financial Condition and Results of Operations" in Item 7 of this report. We derived the
selected consolidated financial data for each of the fiscal years ended September 30, 2009, 2008 and 2007, and as of September 30, 2009 and 2008 from our consolidated financial statements appearing elsewhere in this report, which have been audited by Grant Thornton LLP, an independent registered public accounting firm. We derived the selected financial data for the years ended September 30, 2006 and 2005 and as of September 30, 2007, 2006 and 2005 from our consolidated internal financial statements
for those periods. As a result of our spin-off of Atlas Energy in June 2005, financial data relating to our former energy operations were reclassified as discontinued operations for fiscal 2005. The following table sets forth selected operating and balance sheet data (in thousands, except per share data):
|
As of and for the Years Ended September 30, |
||||||||||||||||||||
|
2009 |
2008 |
2007 |
2006 |
2005 |
||||||||||||||||
|
(unaudited) |
||||||||||||||||||||
|
Statement of operations data: |
||||||||||||||||||||
|
Revenues: |
||||||||||||||||||||
|
Commercial finance |
$ | 49,395 | $ | 96,881 | $ | 40,692 | $ | 23,840 | $ | 13,381 | ||||||||||
|
Real estate |
25,417 | 31,519 | 22,987 | 23,076 | 17,791 | |||||||||||||||
|
Financial fund management |
33,344 | 27,536 | 63,089 | 28,457 | 19,550 | |||||||||||||||
|
Total revenues |
$ | 108,156 | $ | 155,936 | $ | 126,768 | $ | 75,373 | $ | 50,722 | ||||||||||
|
(Loss) income from continuing operations
before cumulative effect of a change in
accounting principle |
$ | (14,487 | ) | $ | (24,944 | ) | $ | 5,254 | $ | 15,668 | $ | 7,426 | ||||||||
|
(Loss) income from discontinued operations,
net of tax |
(444 | ) | (1,299 | ) | (1,558 | ) | 1,231 | 11,070 | ||||||||||||
|
Cumulative effect of a change in accounting
principle, net of tax |
− | − | − | 1,074 | − | |||||||||||||||
|
Net (loss) income |
$ | (14,931 | ) | $ | (26,243 | ) | $ | 3,696 | $ | 17,973 | $ | 18,496 | ||||||||
|
Basic (loss) earnings per common share: |
||||||||||||||||||||
|
Continuing operations |
$ | (0.81 | ) | $ | (1.42 | ) | $ | 0.30 | $ | 0.89 | $ | 0.42 | ||||||||
|
Discontinued operations |
(0.03 | ) | (0.08 | ) | (0.09 | ) | 0.07 | 0.63 | ||||||||||||
|
Cumulative effect of a change in accounting principle |
− | − | − | 0.06 | − | |||||||||||||||
|
Net (loss) income |
$ | (0.84 | ) | $ | (1.50 | ) | $ | 0.21 | $ | 1.02 | $ | 1.05 | ||||||||
|
Diluted (loss) earnings per common share: |
||||||||||||||||||||
|
Continuing operations |
$ | (0.81 | ) | $ | (1.42 | ) | $ | 0.27 | $ | 0.82 | $ | 0.38 | ||||||||
|
Discontinued operations |
(0.03 | ) | (0.08 | ) | (0.08 | ) | 0.07 | 0.58 | ||||||||||||
|
Cumulative effect of a change in accounting principle |
− | − | − | 0.05 | − | |||||||||||||||
|
Net (loss) income |
$ | (0.84 | ) | $ | (1.50 | ) | $ | 0.19 | $ | 0.94 | $ | 0.96 | ||||||||
|
Cash dividends per common share |
$ | 0.20 | $ | 0.28 | $ | 0.27 | $ | 0.24 | $ | 0.20 | ||||||||||
|
Balance sheet data: |
||||||||||||||||||||
|
Total assets |
$ | 375,840 | $ | 758,357 | $ | 966,452 | $ | 418,858 | $ | 463,037 | ||||||||||
|
Borrowings |
$ | 191,383 | $ | 554,059 | $ | 706,372 | $ | 172,238 | $ | 147,302 | ||||||||||
|
Stockholders’ equity |
$ | 139,818 | $ | 143,733 | $ | 185,347 | $ | 195,167 | $ | 191,138 | ||||||||||
|
ITEM 7. |
MANAGEMENT'S DISCUSSION AND ANALYSIS OF FINANCIAL CONDITION |
|
AND RESULTS OF OPERATIONS. |
Overview
We are a specialized asset management company that uses industry specific expertise to evaluate, originate, service and manage investment opportunities in the commercial finance, real estate and financial fund management sectors. As a specialized asset manager, we seek to develop investment
funds for outside investors for which we provide asset management services, typically under long-term management arrangements either through a contract with, or as the manager or general partner of, our sponsored investment funds. We typically maintain an investment in the funds we sponsor. Assets under management have grown from $7.1 billion at September 30, 2005 to $13.7 billion at September 30, 2009.
We limit our fund development and management services to asset classes in which we have specific expertise. We believe this strategy enhances the return on investment we can achieve for our funds. In our commercial finance operations, we focus on originating small and middle-ticket
equipment leases and commercial loans secured by business-essential equipment, including technology, commercial and industrial equipment and medical equipment. In our real estate operations, we concentrate on the ownership, operation and management of multifamily and commercial real estate and real estate mortgage loans including whole mortgage loans, first priority interests in commercial mortgage loans, known as A notes, subordinated interests in first mortgage loans, known as B notes, mezzanine
loans and investments in discounted and distressed real estate and real estate related debt. In our financial fund management operations, we concentrate on trust preferred securities of banks, bank holding companies, insurance companies and other financial companies, bank loans and asset-backed securities, or ABS.
As a specialized asset manager, we are affected by conditions in the financial markets and, in particular, have been affected by the recent volatility and reduction in liquidity in the global credit markets which have reduced the revenues from, and the values of, many of the types of financial assets which
we manage or own. These conditions resulted in our recording the following charges during fiscal 2009:
|
|
· |
a $7.2 million charge, net of tax, from the sale of our interest in Apidos CDO VI; |
|
|
· |
a $4.2 million charge, net of minority interest and tax, to reflect the other-than-temporary impairment of certain investments in CDO issuers with investments in bank loans ($3.2 million, including $1.4 million in Europe) and financial institutions ($998,000); |
|
|
· |
a $5.3 million provision for credit losses, net of tax, which impacted our business segments as follows: commercial finance ($4.0 million), real estate ($282,000) and financial fund management ($1.1 million); and |
|
|
· |
a $1.2 million charge, net of tax, to reflect our equity losses in the unrealized depreciation in the book value of securities held by our investment entities. |
Principally, as a result of these charges, we recorded a net loss of $14.9 million in fiscal 2009 as compared to a net loss of $26.2 million for fiscal 2008 and net income of $3.7 million for fiscal 2007.
Assets Under Management
We decreased our assets under management by $4.3 billion to $13.7 billion at September 30, 2009 from $18.0 billion at September 30, 2008. The following table sets forth information relating to our assets under management by operating
segment (in millions) (1):
|
September 30, |
Decrease |
|||||||||||||||
|
2009 |
2008 |
Amount |
Percentage |
|||||||||||||
|
Financial fund management |
$ | 10,630 | $ | 14,735 | $ | (4,105 | ) (2) | 28% | ||||||||
|
Real estate |
1,690 | 1,703 | (13 | ) | 1% | |||||||||||
|
Commercial finance |
1,361 | 1,535 | (174 | ) (3) | 11% | |||||||||||
| $ | 13,681 | $ | 17,973 | $ | (4,292 | ) | 24% | |||||||||
|
(1) |
For information on how we calculate assets under management, see Item 1, “Business-Assets Under Management.” |
|
(2) |
Reduction primarily due to the following: (i) a decrease in the collateral base of our ABS portfolio resulting from payment defaults ($1.7 billion), (ii) liquidation of two of our CDO issuers invested primarily in real estate ABS ($1.6 billion), (iii) a decrease in the collateral base of our trust preferred securities resulting from payment defaults ($279.5 million), (iv) sale of Apidos CDO VI ($226.5
million), and (v) a decrease in the collateral base of our bank loan portfolio resulting from payment defaults ($95.1 million). |
|
(3) |
Reduction primarily reflects the reduction in new originations. |
Our assets under management are primarily managed through various investment entities including CDOs, public and private limited partnerships, TIC property interest programs, a real estate investment trust, or REIT, and other investment funds. The following table sets forth the number of entities we manage by operating segment:
|
CDOs |
Limited Partnerships |
TIC Programs |
Other Investment Funds |
|||||||||||||
|
As of September 30, 2009 (1) |
||||||||||||||||
|
Financial fund management |
32 | 13 | − | − | ||||||||||||
|
Real estate |
2 | 8 | 7 | 5 | ||||||||||||
|
Commercial finance |
− | 4 | − | 1 | ||||||||||||
| 34 | 25 | 7 | 6 | |||||||||||||
|
As of September 30, 2008 (1) |
||||||||||||||||
|
Financial fund management |
35 | 13 | − | − | ||||||||||||
|
Real estate |
2 | 7 | 7 | 5 | ||||||||||||
|
Commercial finance |
− | 4 | − | 1 | ||||||||||||
| 37 | 24 | 7 | 6 | |||||||||||||
|
(1) |
All of our operating segments manage assets on behalf of RCC. |
The revenues in each of our operating segments are generated by the fees we earn for structuring and managing the investment entities we sponsored on behalf of individual and institutional investors and RCC, and the income produced by the assets and investments we manage for our own account. The following table sets forth information
about our revenue sources (in thousands):
|
Years Ended September 30, |
||||||||||||
|
2009 |
2008 |
2007 |
||||||||||
|
Finance and rental revenues (1) |
$ | 38,491 | $ | 80,660 | $ | 48,981 | ||||||
|
Fund management revenues (2) |
58,879 | 53,156 | 63,490 | |||||||||
|
RCC management fees |
7,357 | 6,021 | 7,048 | |||||||||
|
Gains on resolution of loans (3) |
1,030 | 9,298 | 2,993 | |||||||||
|
Other (4) |
2,399 | 6,801 | 4,256 | |||||||||
| $ | 108,156 | $ | 155,936 | $ | 126,768 | |||||||
|
(1) |
Includes fees from each of our financial fund management, real estate and commercial finance operations and our share of the income or loss from limited and general partnership interests we own in our financial fund management and real estate operations. |
|
(2) |
Includes interest and rental income from our commercial finance operations, interest income on bank loans from our financial fund management operations, interest and accreted discount income from our real estate operations and revenues from certain real estate assets. |
|
(3) |
Includes the resolution of loans we hold in our real estate operating segment. |
|
(4) |
Includes the disposition of leases and loans as well as other charges earned by our commercial finance operations, the equity compensation earned in connection with the formation of RCC and net gains from the sale of TIC property interests. |
We provide a more detailed discussion of the revenues generated by each of our business segments under “-Results of Operations: Commercial Finance,” “:Real Estate” and “:Financial Fund Management.”
Results of Operations: Commercial Finance
During fiscal 2009, our commercial finance assets under management decreased $174.0 million (11%) to $1.4 billion as compared to $1.5 billion in fiscal 2008 because the amortization and repayment of existing commercial finance assets exceeded new originations. Our originations of new equipment financing decreased by $785.0 million
(66%) to $401.0 million in fiscal 2009 from $1.2 billion in fiscal 2008. Originations in fiscal 2008 included $581.5 million related to our November 2007 acquisitions of the Dolphin Capital Corp. and NetBank portfolios of leases and loans. Excluding these acquisitions, originations decreased by $203.5 million for fiscal 2009 as compared to fiscal 2008. Our originations have been and we expect they will continue to be impacted by the state of the credit markets and the ability
of our funds to maintain and obtain financing to acquire portfolios of leases and loans from us.
Subsequent to the acquisitions made in fiscal 2008 and the acquisition of the leasing division of Pacific Capital Bank at the end of fiscal 2007, we embarked on converting the systems and processes of the acquired entities onto the LEAF platform. These conversion efforts were substantially completed in the fourth quarter of
fiscal 2008.
During fiscal 2009, we focused our efforts on improving our financial condition by selling investments and reducing our costs by eliminating operating redundancies following conversion of the fiscal 2008 acquisitions and to reduce our staff in light of reduced origination capabilities brought on by the recession and tight debt markets.
In March 2009, two public equipment leasing partnerships we sponsored and manage formed a joint venture. The joint venture subsequently acquired a portion of our interest in LEAF Commercial Finance Fund, LLC, or LCFF, an investment fund we formed to acquire and finance leases and loans we originate. As a result of
the transaction, LCFF became a VIE for which the joint venture was determined to be the primary beneficiary and, therefore, we ceased to consolidate LCFF as of March 1, 2009. Accordingly, a total of $195.0 million of commercial finance assets and $187.6 million of debt financing were transferred to the joint venture and removed from our financial statements. As a result of this transaction and the deleveraging and due to the reduction in our warehouse borrowings, the commercial finance assets
we managed for our own account for fiscal 2009 decreased $150.0 million to $147.0 million as compared to $297.0 million for fiscal 2008. The $1.2 billion in assets we managed for others has remained the same level for fiscal 2009 and 2008.
In August 2008, we commenced a public offering of limited partnership interests in a new investment entity that commenced operations in September 2008. This offering was closed to new investors on October 30, 2009 having raised $125.7 million. In addition, through February 2009, we raised $9.4 million from the issuance
of LCFF subordinated notes.
As of September 30, 2009, we managed approximately 100,000 leases and loans that had an average original finance value of $25,000 with an original average term of 52 months. As of September 30, 2008, we managed approximately 102,000 leases and loans that had an average original finance value of $23,000 with an original average
term of 52 months.
The following table sets forth information related to commercial finance assets we manage (1) (in millions):
|
September 30, |
||||||||
|
2009 |
2008 |
|||||||
|
LEAF |
$ | 144 | $ | 113 | ||||
|
LCFF (2) |
− | 172 | ||||||
|
Merit |
3 | 12 | ||||||
|
Managed for our own account |
147 | 297 | ||||||
|
LEAF investment entities (2) |
1,181 | 1,133 | ||||||
|
RCC |
2 | 105 | ||||||
|
Other |
31 | − | ||||||
|
Managed for others |
1,214 | 1,238 | ||||||
| $ | 1,361 | $ | 1,535 | |||||
|
(1) |
For information on how we calculate assets under management, see Item 1, “Business − “Assets under Management.” |
|
(2) |
As of March 1, 2009, LCFF is no longer a consolidated entity, and at September 30, 2009 is included in assets managed for our investment entities. |
The revenues from our commercial finance operations consist primarily of:
|
|
· |
finance revenues from leases and loans held by us prior to being sold to our investment entities; |
|
|
· |
acquisition fees which we earn when we sell commercial finance assets to one of our investment entities; and |
|
|
· |
asset management fees earned over the life of the lease or loan after we sell it. |
The following table sets forth certain information relating to the revenues recognized and costs and expenses incurred in our commercial finance operations (in thousands):
|
Years Ended September 30, |
||||||||||||
|
2009 |
2008 |
2007 |
||||||||||
|
Revenues:(1) |
||||||||||||
|
Finance revenues |
$ | 22,974 | $ | 53,680 | $ | 16,859 | ||||||
|
Acquisition fees |
4,943 | 18,466 | 10,484 | |||||||||
|
Fund management fees |
19,133 | 18,275 | 11,403 | |||||||||
|
Other |
2,345 | 6,460 | 1,946 | |||||||||
| $ | 49,395 | $ | 96,881 | $ | 40,692 | |||||||
|
Costs and expenses: |
||||||||||||
|
Wages and benefit costs |
$ | 13,263 | $ | 24,212 | $ | 11,634 | ||||||
|
Other costs and expenses |
11,916 | 18,529 | 7,867 | |||||||||
| $ | 25,179 | $ | 42,741 | $ | 19,501 | |||||||
|
(1) |
Total revenues include RCC servicing and origination fees of $1.0 million, $1.5 million and $1.2 million for fiscal 2009, 2008 and 2007, respectively. |
Revenues − Fiscal 2009 Compared to Fiscal 2008
Revenues decreased $47.5 million (49%) to $49.4 million for fiscal 2009 from $96.9 million for fiscal 2008. We attribute these decreases primarily to the following:
|
|
· |
a $30.7 million decrease in commercial finance revenues. In fiscal 2008, we held a significantly higher portfolio balance of leases and loans as a result of the $412.5 million NetBank portfolio acquired in November 2007 and held by us until being completely sold in April 2008. In addition, as of March 2009, we no longer consolidated LCFF, a $195.0 million portfolio. As a result of
these transactions, our finance revenues decreased significantly; however, since these assets are now owned by our investment funds, we are earning ongoing asset management fees. Our warehouse line of credit that allows us to originate and hold equipment financings prior to selling them to our investment entities was extended until January 29, 2010, but at a lower borrowing limit of $115.0 million (previously $150.0 million). This will require us to reduce the size of the portfolio we can
hold on our balance sheet, which accordingly, will decrease of our future commercial finance revenues; |
|
|
· |
a $13.5 million decrease in acquisition fees resulting from the $1.0 billion decrease in the amount of leases sold to our funds and RCC to $281.3 million. This decrease reflects the portfolio acquisitions we sold to our investment entities in fiscal 2008. Additionally, the difficulty in obtaining debt financing by our investment funds has limited their ability to acquire equipment financings
from us. Consequently, we have reduced our commercial finance originations to match the asset acquisition capabilities of our funds; |
|
|
· |
an $858,000 increase in fund management fees. Our management fees include fees we receive to service the commercial finance assets we manage, offering fees earned for raising capital in our investment entities as well as fees received for originating loans for those entities. During fiscal 2009, management fees earned to service leases increased by $816,000 due to the growth in assets under management
created by the $1.2 billion of lease originations in fiscal 2008. These increases were offset, in part, by decreased offering fees of $136,000 related to the time between the closing of one fund and the opening of another investment fund. In addition, during fiscal 2009, we waived $425,000 of fund management fees in one of our investment entities as payment of such fees is contingent upon providing a certain annual distribution rate to the investment entity’s partners, which was not
met and is uncertain for future periods; and |
|
|
· |
a $4.1 million decrease in other income, primarily reflecting reduced gains on equipment finance dispositions and late fees derived from commercial finance assets held by us. These fees typically vary widely from period to period and are driven by the amount and seasoning of commercial finance assets held by us. The large decrease in fiscal 2009 was due to the sale of the well-seasoned NetBank
portfolio in fiscal 2008. |
Costs and Expenses − Fiscal 2009 Compared to Fiscal 2008
Costs and expenses from our commercial finance operations decreased by $17.6 million (41%) for fiscal 2009. We attribute this decrease primarily to:
|
|
· |
a $10.9 million reduction in wages and benefits. Our costs have decreased due to several factors: (i) in fiscal 2008, we held significantly higher assets and accordingly, incurred higher servicing costs; (ii) for fiscal 2009, many of these costs were reimbursed by the investment entities to whom we have sold these assets; and (iii) in conjunction with converting the operations we acquired in fiscal 2008
onto the LEAF platform, we have reduced overhead costs by eliminating redundant positions. Furthermore, in response to the ongoing recession and reduced originations, we have increased collection and customer service staff, while to a greater extent, we have decreased sales, credit and lease processing staff. In total, we reduced the number of full-time employees in our commercial finance operations by 78 to 320 as of September 30, 2009 from 398 at September 30, 2008; and |
|
|
· |
a $6.7 million reduction in other costs and expenses. This decrease is due to the decline in assets managed for our own account, which resulted in reduced costs to service our portfolio, primarily legal costs, and to our ongoing cost saving and consolidation efforts. These efforts targeted eliminating overhead redundancies occurring through our
acquisitions and taking advantage of efficiencies obtained by operating on a single platform. In addition, fiscal 2008 included one-time costs related to the portfolio acquisitions we made, which did not recur in fiscal 2009. |
Revenues − Fiscal 2008 Compared to Fiscal 2007
Revenues increased $56.2 million (138%) to $96.9 million for fiscal 2008 from $40.7 million for fiscal 2007. We attribute these increases primarily to the following:
|
|
· |
a $30.6 million increase in commercial finance revenues primarily as a result of a greater number of assets held on our balance sheet as a result of the NetBank assets acquired coupled with increased availability under our credit facilities; |
|
|
· |
a $6.2 million increase in commercial finance revenues attributable to Merit’s first full year of operations; |
|
|
· |
an $8.0 million increase in asset acquisition fees resulting from an increase in leases sold. Sales of leases increased by $617.2 million to $1.2 billion for fiscal 2008, principally related to commercial assets sold to our investment entities in connection with the NetBank and Dolphin Capital Corp. portfolio acquisitions; |
|
|
· |
a $6.9 million increase in fund management fees resulting from the $377.0 million increase in assets under management; and |
|
|
· |
a $4.5 million increase in other income, reflecting primarily $3.3 million of net gains on equipment finance dispositions which typically vary widely from period to period, but increased as a result of holding the NetBank portfolio on our books. Additionally, documentation fees increased by $1.0 million in relation to the increase in originations. |
Costs and Expenses − Fiscal 2008 Compared to Fiscal 2007
Costs and expenses from our commercial finance operations increased $23.2 million (119%) for fiscal 2008. We attribute this increase primarily to the following:
|
|
· |
an increase of $12.6 million in wages and benefits. The number of full-time employees increased to 398 as of September 30, 2008 from 240 as of September 30, 2007 due to the acquisitions of the NetBank and Dolphin portfolios and to support our expanding operations. Increases in personnel costs reflect additional costs incurred to service the increased amount of leases held on our books throughout
fiscal 2008 and that resulted in our increase in finance revenues. Additionally, we incurred additional payroll costs due to our recent acquisitions. In the fourth quarter of fiscal 2008, we consolidated certain business operations and reduced duplicative headcount; and |
|
|
· |
an increase of $10.7 million in operating expenses as a result of our increase in origination capabilities and increased facility costs, primarily due to our acquisitions. |
Results of Operations: Real Estate
We anticipate that the focus of our real estate subsidiary, Resource Real Estate, Inc., will evolve during fiscal 2010 from acquiring and managing performing multifamily assets to acquiring and managing a diversified portfolio of commercial real estate and real estate related debt that has been significantly discounted due to the effects
of economic events and high levels of leverage. We closed Resource Real Estate Investors 7, L.P. in September 2009 after raising $32.5 million. We have raised approximately $37.3 million through December 4, 2009 (and continue to raise funds) for Resource Real Estate Opportunity Fund, L.P., an offering which invests in discounted real estate and real estate related debt. We expect to close this fund by December 31, 2009. We filed a registration statement with the Securities
and Exchange Commission for Resource Real Estate Opportunity REIT, Inc. which will further invest in discounted commercial real estate and real estate related debt. In fiscal 2010, we expect our primary fundraising efforts to focus on this REIT.
In our real estate operating segment, we currently manage four classes of assets:
|
|
· |
a commercial real estate debt portfolio we manage for RCC, comprised principally of A notes, whole loans, mortgage participations, B notes, mezzanine debt and related commercial real estate securities; |
|
|
· |
real estate investment fund assets, primarily multifamily apartments; |
|
|
· |
discounted real estate and real estate related debt we acquired through joint ventures with institutional investors and our opportunity fund; and |
|
|
· |
real estate loans, owned assets and ventures, known collectively as our legacy portfolio. |
|
September 30, |
||||||||
|
2009 |
2008 |
|||||||
|
(in millions) |
||||||||
|
Assets under management (1): |
||||||||
|
Commercial real estate debt |
$ | 872 | $ | 924 | ||||
|
Real estate investment funds and programs (residential) |
547 | 498 | ||||||
|
Discounted/opportunistic portfolios |
193 | 187 | ||||||
|
Legacy portfolio |
78 | 94 | ||||||
| $ | 1,690 | $ | 1,703 | |||||
|
(1) |
For information on how we calculate assets under management, see Item 1, “Business − “Assets under Management.” |
We support our real estate investment funds by making long-term investments in them. We record losses on these equity method investments primarily as a result of depreciation and amortization expense recorded by the property interests.
The following table sets forth information relating to the revenues recognized and costs and expenses incurred in our real estate operations (in thousands):
|
Years Ended September 30, |
||||||||||||
|
2009 |
2008 |
2007 |
||||||||||
|
Revenues: |
||||||||||||
|
Management fees: |
||||||||||||
|
Asset management fees |
$ | 3,935 | $ | 2,407 | $ | 1,462 | ||||||
|
Resource Residential property management fees |
4,362 | 2,682 | − | |||||||||
|
REIT management fees from RCC |
5,321 | 4,465 | 5,051 | |||||||||
| 13,618 | 9,554 | 6,513 | ||||||||||
|
Fee income from sponsorship of real estate investment entities |
1,929 | 3,583 | 6,904 | |||||||||
|
Master lease revenues |
3,994 | 3,660 | − | |||||||||
|
Rental property and revenues of consolidated VIEs |
5,014 | 5,208 | 4,700 | |||||||||
|
Interest, including accreted loan discount |
492 | 1,549 | 1,221 | |||||||||
|
Gains and fees on resolution of loans and other property interests |
1,030 | 9,298 | 2,993 | |||||||||
|
Equity in (losses) earnings of unconsolidated entities |
(660 | ) | (1,606 | ) | 537 | |||||||
|
Net gain on sales of TIC property interests |
− | 273 | 119 | |||||||||
| $ | 25,417 | $ | 31,519 | $ | 22,987 | |||||||
|
Cost and expenses: |
||||||||||||
|
General and administrative expenses |
$ | 9,587 | $ | 12,278 | $ | 9,942 | ||||||
|
Resource Residential expenses |
4,459 | 3,043 | 34 | |||||||||
|
Master lease expenses |
4,577 | 4,081 | 2 | |||||||||
|
Rental property and expenses of consolidated VIEs |
3,415 | 3,200 | 3,212 | |||||||||
| $ | 22,038 | $ | 22,602 | $ | 13,190 | |||||||
The gains we recognize on the resolution of loans, assets of VIEs we consolidate, and other real estate assets, as well as the fees we may receive will vary from transaction to transaction. There have been in the past, and we expect that in the future there will be, significant period-to-period
variations in our gains on resolution and fee income. Moreover, we anticipate that gains on resolution will likely decrease in the future as we complete the resolution of our legacy portfolio.
Revenues − Fiscal 2009 Compared to Fiscal 2008
Revenues decreased $6.1 million (19%) to $25.4 million for fiscal 2009 from $31.5 million in fiscal 2008. We attribute the decrease primarily to the following:
Management fees:
|
|
· |
a $1.5 million increase in asset management fees due to an increase in equity deployed in properties that we manage in our investment entities by six to 50 at September 30, 2009 from 44 at September 30, 2008; |
|
|
· |
a $1.7 million increase in fees earned by Resource Residential which reflects the increase in multifamily units under management to 12,794 at September 30, 2009 from 10,877 at September 30, 2008; and |
|
|
· |
an $856,000 increase in REIT management fees due principally to higher RCC net income which increased the incentive management fee RCC paid us. |
Other revenues:
|
|
· |
a $1.7 million decrease in fee income related to the purchase and third-party financing of property through the sponsorship of real estate investment entities. During fiscal 2009, we earned fees from the acquisition of four distressed notes for $31.9 million and seven property acquisitions with an aggregate purchase price of $62.7 million, as compared to the acquisition of seven properties with an aggregate
purchase price of $89.7 million during fiscal 2008. During fiscal 2009, the fees earned were 1.0% to 1.75% of the acquisition price as compared to 1.75% of the acquisition price during fiscal 2008; |
|
|
· |
a $334,000 increase in master lease revenues from one TIC property due to improved occupancy; |
|
|
· |
a $194,000 decrease in rental property income and revenues of consolidated VIEs due to a 17% reduction in the daily rate charged at the Savannah, Georgia hotel we own in addition to the sale of our entire interest in another asset to one of our real estate investment funds; |
|
|
· |
a $1.1 million decrease in interest income attributable to the principal paydown of two loans and the foreclosure of another loan; |
|
|
· |
an $8.3 million decrease in gains and fees on the resolution of loans and other property interests. During fiscal 2009, we received proceeds of $9.9 million from the payoff of one loan, resulting in a gain of $991,000, received discounted proceeds of $1.2 million from the payoff of another loan resulting in a loss of $313,000 and recorded a $330,000 gain on an asset sold in the prior year. In
fiscal 2008, we collected $18.4 million in connection with a substantial settlement of a discounted loan, which was secured by an office building in Washington, D.C. As a result of this repayment, we recognized a pre-tax gain in the quarter ended September 30, 2008 of approximately $7.5 million. Also, in fiscal 2008, we received $1.0 million in net proceeds plus a $130,000 structuring fee from the sale of a 19.99% interest in a partnership that owns a hotel property resulting in a gain of
$574,000, and received $1.9 million in net proceeds from the sale of a 10% interest in a real estate venture resulting in a gain of $891,000; |
|
|
· |
a $946,000 decrease in equity losses of unconsolidated entities due to a favorable change in an interest rate swap; and |
|
|
· |
a $273,000 decrease in net gain on sales of TIC property interests due to the sale of a $50.0 million TIC property during fiscal 2008; there were no TIC sales in fiscal 2009. |
Costs and Expenses − Fiscal 2009 Compared to Fiscal 2008
Costs and expenses of our real estate operations decreased $564,000 (2%) to $22.0 million for fiscal 2009 from $22.6 million for fiscal 2008. We attribute the decrease primarily to the following:
|
|
· |
a $2.7 million decrease in general and administrative expenses, primarily $1.7 million of wages and benefits, of which $1.2 million related to reduced bonuses; |
|
|
· |
a $1.4 million increase in Resource Residential expenses due to an increase in wages and benefits related to an increase in the number of employees required to manage the increase in properties; and |
|
|
· |
a $496,000 increase in master lease expenses from one TIC asset due to turnover costs related to occupancy. |
Revenues − Fiscal 2008 Compared to Fiscal 2007
Revenues increased $8.5 million (37%) to $31.5 million for fiscal 2008 from $23.0 million in fiscal 2007. We attribute the increase primarily to the following:
|
|
· |
a $945,000 increase in asset management fees due to an increase in equity deployed in properties that we manage in our investment entities to 44 at September 30, 2008 from 25 at September 30, 2007; |
|
|
· |
a $2.7 million increase in fees earned by Resource Residential which reflects the increase in apartment and condominium units it managed or whose management it supervises to 10,877 at September 30, 2008 from 8,432 at September 30, 2007; |
|
|
· |
a $586,000 decrease in REIT management fees, primarily due to lower RCC net income which decreased the incentive management fees RCC paid to us; |
|
|
· |
a $3.3 million decrease in fee income related to the purchase and third-party financing of property through the sponsorship of real estate investment entities and TIC property interests. During fiscal 2008, we acquired eight assets with an aggregate purchase price of $102.0 million, as compared to ten assets acquired for $166.7 million during fiscal 2007; |
|
|
· |
a $3.7 million increase in master lease revenues from one TIC asset as a result of having executed a master lease in October 2007 for a residential property owned by the TIC investors; |
|
|
· |
a $508,000 increase in rental property income due to increased occupancy at a hotel property in Savannah, Georgia; |
|
|
· |
a $328,000 increase in interest income attributable to a higher payment rate on a note under a forbearance agreement, income payable on a new note delivered to us in connection with the sale on March 31, 2008 of a 10% interest in a real estate venture and income on a note held temporarily by us to facilitate the acquisition of the note by a related real estate investment fund; |
|
|
· |
a $6.3 million increase in gains and fees on resolutions. In fiscal 2008, we collected $18.4 million in connection with the substantial settlement of a discounted loan, which was secured by an office building in Washington, D.C. As a result of this repayment, we recognized a pre-tax gain in the quarter ended September 30, 2008 of approximately $7.5 million. We received $1.0 million
in net proceeds plus a $130,000 structuring fee from the sale of a 19.99% interest in a partnership that owns a hotel property resulting in a gain of $574,000. We also received $1.9 million in net proceeds from the sale of a 10% interest in a real estate venture resulting in a gain of $891,000. For fiscal 2007, we received $2.9 million from the sale of a 15% interest in the same real estate venture, resulting in a gain of $2.7 million; |
|
|
· |
a $2.1 million decrease in our equity income primarily due to the operating losses of an entity which holds an office building in Washington, DC; and |
|
|
· |
a $154,000 increase in net gains on sale of TIC property interests. We sold our interests in a $50.0 million TIC property during fiscal 2008 as compared to a $33.0 million TIC property during fiscal 2007. |
Costs and Expenses − Fiscal 2008 Compared to Fiscal 2007
Costs and expenses of our real estate operations increased $9.4 million (71%) to $22.6 million for fiscal 2008 from $13.2 million for fiscal 2007. We attribute the increase primarily to the following:
|
|
· |
a $2.3 million increase in general and administrative expenses due to an increase in wages and benefits; |
|
|
· |
a $3.0 million increase in Resource Residential management expenses which represents expenses from our new internal property manager; and |
|
|
· |
a $4.1 million increase in master lease expenses as a result of having executed a master lease for a TIC residential property. |
Results of Operations: Financial Fund Management
General. We conduct our financial fund management operations through seven separate operating entities:
|
|
· |
Apidos finances, structures and manages investments in bank loans, high yield bonds and equity investments; |
|
|
· |
Trapeza, a joint venture between us and an unrelated third-party, originates, structures, finances and manages investments in trust preferred securities and senior debt securities of banks, bank holding companies, insurance companies and other financial companies; |
|
|
· |
Resource Capital Markets, Inc., through our registered broker-dealer subsidiary, Chadwick Securities, Inc., acts as an agent in the primary and secondary markets for trust preferred securities of banks, bank holding companies, insurance companies, other financial companies, real estate companies, REITS, and other real estate related companies as well as securities of CDO issuers; |
|
|
· |
Resource Europe structures and manages investments in international bank loans; |
|
|
· |
RFIG serves as the general partner for six (one of which is currently in the offering stage) company-sponsored affiliated partnerships which invest in financial institutions; |
|
|
· |
Ischus finances, structures and manages investments in asset-backed securities, or ABS, including residential mortgage-backed securities, or RMBS, and commercial mortgage-backed securities, or CMBS; and |
|
|
· |
RCM, an indirect wholly-owned subsidiary, provides investment management and administrative services to RCC under a management agreement between RCM and RCC. |
The following table sets forth information relating to assets managed by us on behalf of institutional and individual investors, RCC and ourselves (in millions) (1):
|
September 30, 2009 |
||||||||||||
|
Institutional and Individual Investors |
RCC |
Total by Type |
||||||||||
|
Trapeza |
$ | 4,458 | $ | − | $ | 4,458 | ||||||
|
Apidos |
2,570 | 914 | 3,484 | |||||||||
|
Ischus |
2,186 | − | 2,186 | |||||||||
|
Resource Europe |
436 | − | 436 | |||||||||
|
Other company-sponsored partnerships |
66 | − | 66 | |||||||||
| $ | 9,716 | $ | 914 | $ | 10,630 | |||||||
|
September 30, 2008 |
||||||||||||
|
Institutional and Individual Investors |
RCC |
Total by Type |
||||||||||
|
Trapeza |
$ | 4,787 | $ | − | $ | 4,787 | ||||||
|
Apidos |
2,906 | 941 | 3,847 | |||||||||
|
Ischus |
5,273 | 365 | 5,638 | |||||||||
|
Resource Europe |
404 | − | 404 | |||||||||
|
Other company-sponsored partnerships |
59 | − | 59 | |||||||||
| $ | 13,429 | $ | 1,306 | $ | 14,735 | |||||||
|
(1) |
For information on how we calculate assets under management, see the table and related notes at the end of “Assets under Management,” as presented earlier in this section. |
In our financial fund management operating segment, we earn monthly fees on assets managed on behalf of institutional and individual investors as follows:
|
|
· |
Collateral management fees − we receive fees for managing the assets held by CDO issuers we have sponsored. These fees vary by CDO issuer, with our annual fees ranging between 0.10% and 0.60% of the aggregate principal balance of the collateral securities owned by the CDO issuers. CDO indentures require certain overcollateralization
test ratios, or O/C ratio(s), to be maintained. O/C ratios measure the ratio of assets (collateral) to liabilities (notes) of a given CDO issuer. Losses incurred on collateral due to payment defaults, payment deferrals or rating agency downgrades reduce the O/C ratios. If O/C ratios are not met, incentive or subordinate management fees are deferred and interest collections from collateral are applied to outstanding principal note balances. |
|
|
· |
Administration fees − we receive fees for managing the assets held by partnerships sponsored by us and for managing their general operations. These fees vary by limited partnership, with our annual fee ranging between 0.75% and 2.00% of the partnership capital balance. |
We also receive distributions on our investments in the entities we manage, which vary depending on our investment and with respect to the particular limited partnerships. Based on the terms of our general partner interest, two of the partnerships we manage as general partner include a clawback
provision. We discuss the basis for our fees and revenues for each area in more detail in the following sections.
Our financial fund management operations have depended upon our ability to sponsor CDO issuers and sell their CDOs. Although we continue to manage and receive fees from CDO issuers that we formed and sponsored, we do not expect to sponsor any new CDO issuers as a result of current conditions
in the global credit markets. Accordingly, we expect that these management fee revenues will continue to decline. For risks applicable to our financial fund management operations, see Item 1A “Risk Factors – Risks Relating to Particular Aspects of our Financial Fund Management, Real Estate and Commercial Finance Operations.”
Apidos
We sponsored, structured and/or currently manage 11 CDO issuers for institutional and individual investors and RCC which hold approximately $3.5 billion in bank loans at September 30, 2009, of which $913.6 million are managed on behalf of RCC through three CDO issuers. In
addition, we sponsored, structured and currently manage one CDO issuer holding $435.6 million in international bank loans at September 30, 2009.
We derive revenues from our Apidos operations through base and subordinate management fees. Base management fees vary by CDO issuer, but range from between 0.10% and 0.15% of the aggregate principal balance of the collateral held by the CDO issuers. Subordinate management fees vary by CDO issuer, but range from between
0.08% and 0.45% of the aggregate principal balance of the collateral held by the CDO issuers, all of which are subordinated to debt service payments on the CDOs. We are also entitled to receive incentive management fees; however, we did not receive any such fees in fiscal 2009 and do not expect to receive any such fees in the future. Incentive management fees are subordinated to debt service payments on the CDOs.
Trapeza
We have co-sponsored, structured and currently co-manage 13 CDO issuers holding approximately $4.5 billion in trust preferred securities of banks, bank holding companies, insurance companies and other financial companies.
We own a 50% interest in an entity that manages 11 Trapeza CDO issuers and a 33.33% interest in another entity that manages two Trapeza CDO issuers. We also own a 50% interest in the general partners of limited partnerships that own the equity interests of five Trapeza CDO issuers. Additionally, we have invested as
a limited partner in each of these limited partnerships.
We derive revenues from our Trapeza operations through base and subordinate management and administration fees. We also are entitled to receive distributions on amounts we have invested in five limited partnerships that own the equity interest in five Trapeza CDO issuers. Base
management fees vary by CDO issuer, but range from between 0.10% and 0.25% of the aggregate principal balance of the collateral held by the CDO issuers. Subordinate management fees vary by CDO issuer, but range from between 0.15% and 0.25% of the aggregate principal balance of the collateral held by the CDO issuers, all of which are subordinated to debt service payments on the CDOs. These fees are also shared with our co-sponsors. In 11 of the CDO issuers, we currently do not
meet the O/C ratio requirements; therefore, we do not receive subordinated management fees from them currently, nor do we expect to receive any such fees for the foreseeable future. Based upon projected cash flows, we expect to be able to receive subordinated management fees from two of these issuers in the future. We are also entitled to receive incentive management fees; however, no such fees have been received in fiscal 2009 nor do we expect to receive any such fees for the foreseeable
future, since these fees are subordinated to debt service payments on the CDOs.
Company-Sponsored Partnerships
We sponsored, structured and, through RFIG, currently manage six (of which one is currently in the offering stage) affiliated partnerships for individual and institutional investors which hold approximately $59.9 million of investments in financial institutions. We derive revenues from these operations through an annual management
fee, based on 2.0% of equity. We also have invested as the general partner of these partnerships and may receive a carried interest of up to 20% upon meeting specific investor return rates.
In March 2009, we sponsored, structured and currently manage a new affiliated partnership organized as a credit opportunities fund which holds approximately $5.7 million in bank loans, high yield bonds and uninvested capital. We have invested as a general and limited partner
in this partnership. We derive revenues from this partnership through base and incentive management fees. Base management fees are calculated at 1.5% of the partnership’s net assets and are payable quarterly in advance. Incentive management fees are calculated annually at 20% of the partnership’s annual net profits, but are subject to a loss carryforward provision and an investor hurdle rate.
We previously sponsored, structured and managed another affiliated partnership organized as a hedge fund. In March 2008, we decided to liquidate this partnership and completed the dissolution and liquidation during the third quarter of fiscal 2009.
Ischus
We sponsored, structured and currently manage seven CDO issuers for institutional investors, individuals and RCC which hold approximately $2.2 billion in primarily real estate ABS including RMBS, CMBS and credit default swaps. Two of our managed CDO issuers, holding approximately
$1.4 billion in real estate ABS, were liquidated during fiscal 2009. We expect that the reduction in the aggregate principal balance of managed assets as a result of the liquidation of these two CDO issuers will lower our financial fund management revenues in the future.
Through Ischus, we own a 50% interest in the general partner and manager of Structured Finance Fund, L.P. and Structured Finance Fund II, L.P., collectively referred to as the SFF partnerships. These partnerships own a portion of the equity interests of three Trapeza CDO
issuers and one of the Ischus CDO issuers. We also have invested as a limited partner in each of these limited partnerships.
We derive revenues from our Ischus operations through base and subordinated management and administration fees. We are also entitled to receive distributions on amounts we have invested in the limited partnerships. Base management fees vary by CDO issuer, ranging from between 0.10% and 0.20% of the aggregate principal
balance of the collateral held by the CDO issuer. In three CDO issuers, we currently do not meet the O/C ratio requirements; therefore, we do not receive subordinated management fees from them currently, nor do we expect to receive any such fees for the foreseeable future. We are also entitled to receive incentive management fees; however, we do not expect to receive incentive management fees for the foreseeable future because these fees are subordinated to debt service payments on the CDOs.
The following table sets forth certain information relating to the revenues recognized and costs and expenses incurred in our financial fund management operations (in thousands):
|
Years Ended September 30, |
||||||||||||
|
2009 |
2008 |
2007 |
||||||||||
|
Revenues: |
||||||||||||
|
Limited and general partner interests: |
||||||||||||
|
Fair value adjustments |
$ | (266 | ) | $ | (23,483 | ) | $ | (2,901 | ) | |||
|
Operations |
(68 | ) | 2,752 | 6,062 | ||||||||
|
Total limited and general partner interests |
(334 | ) | (20,731 | ) | 3,161 | |||||||
|
Fund and RCC management fees |
20,673 | 24,232 | 25,762 | |||||||||
|
Interest income on loans |
6,017 | 16,563 | 26,201 | |||||||||
|
Introductory agent, due diligence and placement fees |
5,166 | 2,593 | 1,901 | |||||||||
|
Earnings from unconsolidated CDOs |
1,610 | 2,670 | 2,649 | |||||||||
|
Earnings of SFF partnerships |
158 | 1,641 | 2,043 | |||||||||
|
Other |
54 | 568 | 1,372 | |||||||||
| $ | 33,344 | $ | 27,536 | $ | 63,089 | |||||||
|
Costs and expenses: |
||||||||||||
|
General and administrative |
$ | 20,399 | $ | 27,539 | $ | 19,333 | ||||||
|
Equity compensation expense − RCC |
3 | 134 | 1,861 | |||||||||
|
Expenses of SFF partnerships |
66 | 64 | 70 | |||||||||
| $ | 20,468 | $ | 27,737 | $ | 21,264 | |||||||
Fees and/or reimbursements that we receive vary by transaction and, accordingly, there may be significant variations in the revenues we recognize from our financial fund management operations from period to period.
Revenues − Fiscal 2009 Compared to Fiscal 2008
Revenues increased $5.8 million (21%) to $33.3 million in fiscal 2009 from $27.5 million in fiscal 2008. We attribute the increase primarily to the following:
|
|
· |
Limited and general partner interests: |
|
|
- |
during fiscal 2009 and 2008, we recorded $1.6 million and ($23.2 million), respectively, in realized and unrealized fair value adjustments on Trapeza partnership securities and swap agreements and ($1.9 million) and ($287,000), respectively, in realized and unrealized fair value adjustments in the book value of securities we hold in unconsolidated other company-sponsored partnerships; and |
|
|
- |
during fiscal 2009 and 2008, we recorded ($4,000) and $3.2 million, respectively, in revenues (other than fair value adjustments) from our limited and general partner share of operating results of the unconsolidated Trapeza partnerships and ($64,000) and ($402,000), respectively, from our limited and general partner share of operating results of unconsolidated other company-sponsored partnerships. |
|
|
· |
a $3.6 million decrease in fund and RCC management fees, primarily from the following: |
|
|
- |
a $2.1 million net decrease in senior, subordinated and incentive management fees from our Trapeza operations, primarily from the following: |
|
|
- |
a $2.6 million decrease in subordinated management fees. During fiscal 2009 and 2008, we recorded subordinated management fees of ($242,000) and $2.3 million, respectively, on 11 CDO issuers. The loss recorded during fiscal 2009 was primarily the result of the write-off of cumulative accrued subordinated management fees that we no longer expect to receive from nine CDO issuers; and |
|
|
- |
a $278,000 decrease in senior management fees as a result of portfolio defaults which reduced our collateral base. |
These decreases were partially offset by:
|
|
- |
a $591,000 increase in incentive management fees. During fiscal 2009, we reversed $57,000 in incentive management fees from two CDO issuers as compared to a reversal of $648,000 of similar fees from three CDO issuers during fiscal 2008; and |
|
|
- |
a $147,000 reduction in the net discount taken on incentive management fees. During fiscal 2008, a discount of $147,000 was applied to the cumulative accrued incentive management fee balance for three CDO issuers. No such discount was taken during fiscal 2009. |
|
|
- |
a $3.8 million net decrease in collateral management fees from our Ischus operations primarily due to a reduction in subordinated management fees as a result of an increase in rating agency downgrades which reduced our collateral base and the liquidation of two of our CDO issuers during fiscal 2009; |
|
|
- |
a $481,000 decrease in management fees from other company-sponsored partnerships primarily due to the liquidation of our previously sponsored hedge fund and a decline in fair values of other company-sponsored partnership investments. These management fees are net asset based; and |
|
|
- |
a $262,000 decrease in collateral management fees from the European CDO issuer we manage due to a decrease in the euro to dollar exchange rate for fiscal 2009 as compared to fiscal 2008. |
These decreases were partially offset by:
|
|
- |
a $1.4 million increase in collateral management fees resulting from a full year of fees on four bank loan CDO issuers whose management we assumed from an unaffiliated third-party asset manager in May 2008; |
|
|
- |
a $940,000 increase in RCC management fees and equity compensation, reflecting a $440,000 increase in management fees and a $500,000 increase in equity compensation; and |
|
|
- |
an $851,000 decrease in our share of expenses for the management of Trapeza Capital Management LLC and Trapeza Management Group LLC, primarily due to a decrease in asset management personnel and state taxes. |
|
|
· |
a $10.5 million decrease in interest income on loans held for investment, resulting primarily from the following: |
|
|
- |
a $3.2 million decrease in interest income from CDO issuers whose loan assets were held by us in warehouse facilities and consolidated in our financial statements for fiscal 2008, including one Apidos and one Resource Europe CDO issuer. The weighted average loan balance was $49.3 million at a weighted average interest rate of 7.16%. We did not have any such consolidation during fiscal 2009;
and |
|
|
- |
a $7.3 million decrease from Apidos CDO VI. In December 2007, we closed Apidos CDO VI, repaid all borrowings under the warehouse facility and purchased 100% of the subordinated notes. The weighted average loan balances of Apidos CDO VI for fiscal 2009 and 2008 was $115.5 million and $221.0 million, respectively, at an effective interest rate of 4.38% and 5.81%, respectively. As of
March 31, 2009, we agreed to sell our interest in Apidos CDO VI and no longer consolidated it. This transaction settled on May 6, 2009. |
|
|
· |
a $2.6 million increase in introductory agent fees resulting from the receipt of $5.1 million and $2.6 million in introductory agent fees earned in connection with 91 and 16 trust preferred transactions during fiscal 2009 and 2008, respectively. |
|
|
· |
a $1.1 million net decrease in earnings from 12 unconsolidated CDO issuers we previously sponsored and manage. Through fiscal 2009, we have fully impaired nine CDO investments. The cost-recovery method will be used to realize any future income on these investments; |
|
|
· |
a $1.5 million decrease in the earnings of our SFF partnerships related to a decrease in earnings from four CDO investments which we have fully impaired. We will utilize the cost-recovery method to realize any future income on these investments; and |
|
|
· |
a $514,000 decrease in other income, primarily as a result of a decrease in interest income we earned on the restricted cash balances of Apidos CDO VI, which we deconsolidated in May 2009. |
Costs and Expenses − Fiscal 2009 Compared to Fiscal 2008
Costs and expenses of our financial fund management operations decreased $7.3 million (26%) in fiscal 2009 principally due to the decrease in our general and administrative expenses reflecting our efforts to realign costs with existing operations. We attribute this decrease primarily to the following:
|
|
· |
a $4.7 million decrease in wages and benefits due to the reduction in asset management and support personnel; |
|
|
· |
a $1.6 million decrease in professional fees, primarily due to a decrease in consulting fees related to our European operations and an overall decrease in general legal expenses; |
|
|
· |
a $581,000 decrease in financial software expenses; and |
|
|
· |
a $336,000 decrease in broker fees paid to an affiliated party in connection with our Trapeza operations. |
Revenues − Fiscal 2008 Compared to Fiscal 2007
Revenues decreased $35.6 million (56%) to $27.5 million in fiscal 2008 from $63.1 million in fiscal 2007. We attribute the decrease to the following:
|
|
· |
Limited and general partner interests: |
|
|
- |
during fiscal 2008 and 2007, we recorded ($23.2 million) and ($2.7 million), respectively, in realized and unrealized fair value adjustments on Trapeza partnership securities and swap agreements and ($287,000) and ($176,000), respectively, in realized and unrealized fair value adjustments in the book value of investments we hold in unconsolidated other company-sponsored partnerships; and |
|
|
- |
during fiscal 2008 and 2007, we recorded $3.2 million and $6.2 million, respectively, in revenues (other than fair value adjustments) from our limited and general partner share of operating results of the unconsolidated Trapeza partnerships and ($402,000) and ($141,000), respectively, from our limited and general partner share of operating results of unconsolidated other company-sponsored partnerships. |
|
|
· |
a $1.5 million decrease in fund and RCC management fees, primarily from the following: |
|
|
- |
a $1.8 million decrease in RCC management fees and equity compensation, reflecting a $438,000 decrease in management fees and a $1.3 million decrease in equity compensation; |
|
|
- |
a $1.7 million decrease in fund management fees received in connection with the formation of Trapeza CDO XI and Trapeza CDO XII during fiscal 2007. No such fees were received during fiscal 2008; |
|
|
- |
a $1.4 million net decrease in collateral management fees from our Trapeza operations, reflecting a $2.3 million decrease due to a discount recorded in connection with subordinate and incentive management fees we expect to receive in the future partially offset by an $889,000 increase primarily due to a full twelve months of collateral management fees for three previously completed CDOs; and |
|
|
- |
a $397,000 net decrease in collateral management fees from our Ischus operations. |
These decreases were partially offset by:
|
|
- |
a $3.0 million net increase in collateral management fees from our Apidos and Resource Europe operations primarily due to a full twelve months of collateral management fees for three previously completed CDOs; and |
|
|
- |
an $860,000 increase in collateral management fees resulting from the assumption of management of four new bank loan CDOs from an unaffiliated third-party asset manager in May 2008. |
|
|
· |
a $9.6 million decrease in interest income on loans held for investment, resulting primarily from the following: |
|
|
- |
a $12.1 million decrease from the consolidation in our financial statements of one Apidos CDO issuer and one Resource Europe CDO issuer during fiscal 2008 as compared to two Resource Europe CDO issuers and two Apidos CDO issuers during fiscal 2007 while they accumulated assets through separate warehouse facilities. The weighted average loan balances of CDO issuers we consolidated through warehouse facilities
for fiscal 2008 and 2007 were $49.3 million and $230.3 million, respectively, at weighted average interest rates of 7.16% and 6.70%, respectively; offset in part by |
|
|
- |
a $2.5 million increase from the consolidation in our financial statements of Apidos CDO VI during fiscal 2008 as compared to fiscal 2007 while it accumulated assets through a warehouse facility. In December 2007, we closed Apidos CDO VI, repaid all borrowings under the warehouse facility and purchased 100% of the subordinated notes. The weighted average loan balances of Apidos CDO VI for fiscal
2008 and 2007 were $221.0 million and $138.1 million, respectively, at weighted average interest rates of 5.81% and 7.59%, respectively. |
|
|
· |
a $692,000 increase in introductory agent, due diligence and placement fees as a result of the following: |
|
|
- |
during fiscal 2008, we received $2.6 million in introductory agent fees earned in connection with 16 trust preferred security transactions. We expect to earn introductory agent fees in the future, which will vary depending upon the terms of the transactions; and |
|
|
- |
during fiscal 2007, we received $1.9 million in due diligence and placement fees in connection with 11 bank trust preferred and REIT trust preferred security transactions. We do not expect to earn similar due diligence and placement fees in the future due to market conditions. |
|
|
· |
a $402,000 decrease in the earnings of our SFF partnerships related to a decrease in earnings from four CDO investments. As of September 30, 2008, we have fully impaired one CDO investment. We will utilize the cost-recovery method to realize any future income on this investment. |
|
|
· |
an $804,000 decrease in other revenue primarily from the following: |
|
|
- |
a $582,000 decrease from the interest spread earned on loans and ABS assets accumulating on warehouse facilities with third parties based on the terms of warehousing agreements during fiscal 2007. No such spread was received during fiscal 2008; and |
|
|
- |
a $300,000 decrease from the gain on the sale of a security during fiscal 2007. No such gain occurred during fiscal 2008. |
Costs and Expenses − Fiscal 2008 Compared to Fiscal 2007
Costs and expenses of our financial fund management operations increased $6.5 million (30%) in fiscal 2008 as compared to fiscal 2007. We attribute the increase to the following:
|
|
· |
an $8.2 million increase in general and administrative expenses, primarily from the following: |
|
|
- |
a $3.7 million increase in compensation expense due to higher wages and benefits as well as severance payments of $932,000 made to terminated employees; |
|
|
- |
a $3.0 million decrease in reimbursed expenses from our Trapeza, Ischus and Apidos operations; the amount of reimbursed expenses primarily depends upon the terms of the transactions; |
|
|
- |
a $1.5 million increase in professional fees primarily due to an increase in consulting fees related to our European operations and additional legal fees; offset, in part, by |
|
|
· |
a $1.7 million decrease in equity compensation expense related to the award of RCC restricted stock and options to members of management. |
Results of Operations: Other Costs and Expenses
General and Administrative Expenses
Fiscal 2009 Compared to Fiscal 2008. General and administrative costs were $14.4 million in fiscal 2009, a decrease of $1.7 million (11%) as compared to $16.1 million in fiscal 2008, primarily reflecting a $1.5 million decrease in wages and benefits.
Fiscal 2008 Compared to Fiscal 2007. General and administrative costs were $16.1 million in fiscal 2008, an increase of $4.2 million (35%) as compared to $11.9 million in fiscal 2007, primarily reflecting a $4.3 million increase in wages and benefits
including:
|
|
· |
a $2.7 million increase related to the amortization of restricted stock awards given to our employees, of which $468,000 was due to accelerated vesting for certain terminated employees; and |
|
|
· |
an additional charge of $389,000 related to the final release of shares in the Employee Stock Ownership Plan. |
Provision for Credit Losses
The following table reflects provision for credit losses as reported by segment (in thousands):
|
Years Ended September 30, |
||||||||||||
|
2009 |
2008 |
2007 |
||||||||||
|
Commercial finance |
$ | 6,410 | $ | 7,505 | $ | 229 | ||||||
|
Financial fund management |
1,738 | 2,622 | − | |||||||||
|
Real estate |
456 | 500 | − | |||||||||
| $ | 8,604 | $ | 10,627 | $ | 229 | |||||||
The provisions for credit losses we recorded in fiscal 2009 and 2008 are reflective of the weakness in the United States economy and our current write-offs and write-downs of assets affected by that weakness. Specifically, by operating segment:
|
|
· |
Commercial finance – The provision for credit losses we recorded in fiscal 2009 for these assets decreased by $1.1 million as compared to the provision we made for fiscal 2008 primarily due to the decrease in the assets held for investment as a result of the sale of LCFF in March 2009; |
|
|
· |
Financial fund management – We consolidated Apidos CDO VI, a $240.0 million securitization of corporate loans, from December 2007 until its sale in March 2009. During fiscal 2008 and the period prior to the sale, our evaluation of the creditworthiness of that portfolio of loans included an analysis of observable secondary market prices and general market conditions. As a result, management
concluded that a provision for credit losses of $1.7 million and $2.6 million was warranted during fiscal 2009 and fiscal 2008, respectively; and |
|
|
· |
Real estate - While we continue to monetize our legacy loan portfolio to reduce our overall exposure, we determined that economic conditions continue to negatively impact one of our remaining loans in the portfolio. Accordingly, we recorded a provision for credit losses of $456,000 and $500,000 during fiscal 2009 and 2008, respectively. |
Depreciation and Amortization
Fiscal 2009 Compared to Fiscal 2008. Depreciation and amortization expense was $6.9 million in fiscal 2009, an increase of $2.3 million (49%) as compared to $4.7 million in fiscal 2008. The increase relates primarily to acquisitions
made by our commercial finance operations during fiscal 2008, including increased depreciation on operating leases of $1.3 million and capital assets of $345,000 in addition to $247,000 of amortization of intangible assets.
Fiscal 2008 Compared to Fiscal 2007. During fiscal 2008, depreciation and amortization expense was $4.7 million, an increase of $1.7 million (59%) as compared to $2.9 million in fiscal 2007. This increase relates primarily
to the addition of $4.2 million of leaseholds and equipment during fiscal 2008 and a $1.7 million building we acquired in conjunction with the November 2007 Dolphin Capital acquisition.
Interest Expense
The following table reflects interest expense as reported by segment (in thousands):
|
Years Ended September 30, |
||||||||||||
|
2009 |
2008 |
2007 |
||||||||||
|
Commercial finance |
$ | 10,524 | $ | 27,466 | $ | 11,796 | ||||||
|
Financial fund management |
5,014 | 14,559 | 19,485 | |||||||||
|
Real estate |
966 | 1,222 | 1,040 | |||||||||
|
Corporate |
3,695 | 4,019 | 1,245 | |||||||||
| $ | 20,199 | $ | 47,266 | $ | 33,566 | |||||||
Facility utilization (in millions) and interest rates for our commercial finance, financial fund management and corporate borrowings were as follows:
|
Years Ended September 30, |
||||||||||||
|
2009 |
2008 |
2007 |
||||||||||
|
Commercial finance: |
||||||||||||
|
Average borrowings |
$ | 201.2 | $ | 423.6 | $ | 172.1 | ||||||
|
Average interest rates |
5.0 | % | 6.4 | % | 6.9 | % | ||||||
|
Financial fund management: |
||||||||||||
|
Average borrowings |
$ | 108.7 | $ | 255.6 | $ | 366.1 | ||||||
|
Average interest rates |
4.6 | % | 5.6 | % | 5.3 | % | ||||||
|
Corporate – Secured credit facilities: |
||||||||||||
|
Average borrowings |
$ | 42.8 | $ | 56.8 | $ | 12.2 | ||||||
|
Average interest rates |
11.1 | % | 6.9 | % | 10.1 | % | ||||||
Fiscal 2009 Compared to Fiscal 2008. Interest expense decreased by $27.1 million (57%) for fiscal 2009. The decrease in interest expense primarily reflects the $362.7 million decrease in borrowings by all of our operating segments.
Commercial finance interest expense decreased by $16.9 million due to a $222.4 million decrease in average borrowings in combination with lower interest rates. In March 2009, we sold LCFF thereby eliminating $187.6 million of debt.
Interest expense incurred by our financial fund management operations decreased by $9.5 million for fiscal 2009. As a result of the sale of Apidos CDO VI, there was no interest expense on the $218.0 million of its senior notes for the last six months of fiscal 2009.
Corporate interest expense decreased by $324,000 due to reduced average borrowings of $14.0 million, reflecting the paydown of borrowings on our TD Bank facility with proceeds from our 12% senior notes offering, offset in part, by an increase in the interest rate on those borrowings outstanding.
Fiscal 2008 Compared to Fiscal 2007. Interest expense increased by $13.7 million (41%) for fiscal 2008. The increase in interest expense primarily reflects the increased borrowings by our commercial finance businesses to fund their expanded operations
as well as increased corporate borrowings, offset, in part, by decreased borrowings by our financial fund management business.
Commercial finance operations interest increased by $15.7 million for fiscal 2008 due to an increase in average borrowings, in part, offset by a reduction in average interest rates as a result of our use of interest rate swaps and caps to fix rates. The growth in borrowings
was driven by LEAF’s acquisitions in the later part of fiscal 2007 and early fiscal 2008, continued growth in new and existing vendor programs and the introduction of new commercial finance products.
Interest expense incurred by our financial fund management business decreased by $4.9 million for fiscal 2008 reflecting our termination in January 2008 of two outstanding warehouse facilities that were previously consolidated. There were no outstanding borrowings on warehouse facilities from January 2008 to September 30,
2008. The decrease in interest expense from the termination of the warehouse facilities was partially offset by the issuance in December 2007 of $218.0 million of senior notes by Apidos CDO VI.
Corporate interest expense increased by $2.8 million for fiscal 2008. We increased borrowings on our corporate credit facilities by $21.0 million from September 30, 2007 to September 30, 2008. Weighted average borrowings were $56.8 million and $12.2 million for
fiscal 2008 and 2007, respectively.
Minority Interests
Minority interest income, net of expense, decreased by $2.6 million (62%) in fiscal 2009 as compared to fiscal 2008. The following table reflects minority interests by entity (in thousands):
|
Years Ended September 30, |
||||||||||||
|
2009 |
2008 |
2007 |
||||||||||
|
SFF partnerships (1) |
$ | 1,549 | $ | 6,578 | $ | (1,473 | ) | |||||
|
Commercial finance minority ownership (2) |
− | (1,485 | ) | (530 | ) | |||||||
|
Commercial finance fund participation (3) |
− | (693 | ) | − | ||||||||
|
Other (4) |
54 | (157 | ) | (139 | ) | |||||||
| $ | 1,603 | $ | 4,243 | $ | (2,142 | ) | ||||||
|
(1) |
We own a 15% and 36% limited partner interest in SFF I and SFF II, respectively. The SFF partnerships invest in the equity of certain of the CDO issuers we have structured. |
|
(2) |
Senior executives of LEAF hold a 14.1% interest in LEAF, reflecting LEAF common stock issued to them upon the conversion of a note in fiscal 2006 and the issuance of LEAF restricted stock, net of shares repurchased in December 2008. |
|
(3) |
In January 2008, LEAF sold a 49% participation interest in one of its subsidiaries that held a portfolio of leases acquired from NetBank to one of its investment partnerships and sold the remaining 51% interest to it in April 2008. |
|
(4) |
Reflects the approximately 20% interest held by a related party in a real estate property we own. Fiscal 2008 and 2007 also included the interest spread earned by warehouse providers while assets were in the accumulation stage. As of January 2008, all warehouse facilities were terminated. |
Loss on Sale of Loans and Investment Securities, net
As a result of the sale of Apidos CDO VI, we recorded a receivable for the proceeds of $7.2 million (which we fully collected) and recognized a loss of $11.6 million ($7.2 million, net of tax, for fiscal 2009). During fiscal 2008, we incurred a $17.7 million loss from the termination of two secured warehouse facilities for which
we provided limited guarantees. Our losses of $5.0 million for fiscal 2007 related to the sale of loans held for investment, principally in Europe.
Impairment Charges on Investment Securities
In connection with the volatility in the global credit markets and reduction in liquidity affecting banks, thrifts and other financial institutions as well as direct and indirect real estate investments, we incurred other-than temporary impairment charges on CDO securities of $8.5 million, $14.5 million and $12.6 million during fiscal
2009, 2008 and 2007, respectively. The impairment charges recorded for fiscal 2009 were in CDO securities, primarily those with investments in bank loans ($5.2 million of charges, including $2.3 million in Europe) and financial institutions ($3.2 million of charges). The charges for fiscal 2008 and 2007 were primarily in CDOs with investments in financial institutions ($8.9 million and $2.1 million of charges, respectively) and real estate asset-backed securities, including RMBS and CMBS
($5.5 million and $10.5 million of charges, respectively). Additionally, in fiscal 2009, we also recorded a $73,000 other-than-temporary impairment loss on our investment in TBBK as management no longer has the intent to hold the security to recovery.
Other Income
The following table details our other income, net of other expenses (in thousands):
|
Years Ended September 30, |
||||||||||||
|
2009 |
2008 |
2007 |
||||||||||
|
RCC dividend income (1) |
$ | 3,405 | $ | 2,421 | $ | 3,173 | ||||||
|
(Loss) gain on sales of equity securities (2) |
(393 | ) | − | 3,533 | ||||||||
|
Interest income (3) |
340 | 547 | 761 | |||||||||
|
Other (expense) income, net (4) |
(196 | ) | 68 | 518 | ||||||||
|
Write-off of European real estate investment fund costs (5) |
− | − | (4,775 | ) | ||||||||
|
Other income, net |
$ | 3,156 | $ | 3,036 | $ | 3,210 | ||||||
|
(1) |
In fiscal 2009, we recognized five dividend payments on our investment in RCC as compared to three and four dividend payments in fiscal 2008 and 2007, respectively. |
|
(2) |
In fiscal 2009, we sold 99,318 shares of common stock of The Bancorp, Inc., or TBBK, at loss of $393,000. In fiscal 2007, we recorded a gain of $3.5 million from the sale of 240,000 shares of TBBK. No shares of TBBK were sold during fiscal 2008. |
|
(3) |
Interest income decreased in fiscal 2009 by $207,000 from fiscal 2008, of which $273,000 was due to a decrease in cash balances at LEAF due to the deconsolidation of LCFF. |
|
(4) |
Included in other income for fiscal 2009 is $192,000 of amortized losses in the retirement plan for our former CEO and in fiscal 2007 includes a $263,000 foreign exchange gain on our European operations. |
|
(5) |
In fiscal 2007, we wrote-off $4.8 million of reimbursable costs related to a European real estate fund that we sponsored that did not close due to the market conditions. |
Income Taxes
Fiscal 2009 Compared to Fiscal 2008. Our effective income tax rate (income taxes as a percentage of income from continuing operations, before taxes) was 42% for fiscal 2009 as compared
to 39% for fiscal 2008. The increase in the rate primarily relates to the greater impact of permanent items relative to the pre-tax loss for fiscal 2009. Our effective income tax rate excluding adjustments for one-time items would have been 38% for fiscal 2009.
We expect our effective tax rate to be between 44% and 49% for fiscal 2010. Our effective income tax rate can vary from period to period depending on, among other factors, the geographic and business mix of our earnings and the level of our tax credits. Certain of these and other factors, including our history of
pre-tax earnings, are taken into account in assessing our ability to realize our net deferred tax assets.
We are subject to examination by the U.S. Internal Revenue Service, or IRS, and by the taxing authorities in other states in which we have significant business operations, such as Pennsylvania and New York. We are no longer subject to U.S. federal income tax examinations for fiscal years before 2006 and are no longer subject
to state and local income tax examinations by tax authorities for fiscal years before 2003.
We adopted the guidance of the Financial Accounting Standards Board, or FASB, for accounting for uncertainties in income taxes effective October 1, 2007. This clarifies the accounting for uncertainty in income taxes recognized in financial statements and requires the impact of a tax position to be recognized in the financial
statements if that position is more likely than not of being sustained by the taxing authority. This adoption did not have a material impact on our consolidated balance sheets or statements of operations.
Fiscal 2008 Compared to Fiscal 2007. Our effective income tax rate (income taxes as a percentage of income from continuing operations, before taxes) was 39% for fiscal 2008 compared
to 32% for fiscal 2007. The increase in the rate primarily relates to the greater impact of permanent items relative to pre-tax loss for fiscal 2008 and the reversal of a $1.2 million valuation allowance in fiscal 2007. Additionally, we recorded $1.2 million of tax expense related to adjustments to our deferred tax assets and related valuation allowances in fiscal 2008 as compared to $1.1 million of adjustments in fiscal 2007. Our effective income tax rate, as adjusted to exclude
adjustments primarily related to state net operating losses, valuation allowances and reversal of a $1.5 million tax reserve would have been 38% for fiscal 2008.
In August 2008, we settled our 2005 IRS examination relating to disallowed bad debt deductions taken in the 2005 tax year and partially paid the tax assessment. As a result of the 2004 and 2005 IRS examinations, we incurred $3.0 million of interest expense, of which we charged to discontinued operations $1.1 million during fiscal
2008 and $1.9 million during fiscal 2007. Additionally, in August 2008, we settled our 2006 IRS examination which resulted in no tax liability change.
Discontinued Operations
Our decision to dispose of certain entities has resulted in the presentation of these operations as discontinued. Losses from discontinued operations for fiscal 2009, 2008 and 2007 primarily reflect $433,000, $1.1 million and $1.9 million, respectively, of interest and penalty assessments related to the 2004 and 2005 IRS tax
examinations. In addition, we closed an operating subsidiary within the commercial finance operating segment in fiscal 2008 and have reflected its results as discontinued.
The discontinued operations within our real estate operating segment were as follows (in thousands):
|
Years Ended September 30, |
||||||||||||
|
2009 |
2008 |
2007 |
||||||||||
|
Operating loss (for period prior to disposition) |
$ | (370 | ) | $ | (1,104 | ) | $ | (2,095 | ) | |||
|
Loss on disposal, net |
− | − | (329 | ) | ||||||||
|
Income tax (provision) benefit |
(70 | ) | 386 | 848 | ||||||||
|
Discontinued loss, net of tax |
$ | (440 | ) | $ | (718 | ) | $ | (1,576 | ) | |||
The discontinued operations of the operating subsidiary within our commercial finance operating segment were as follows (in thousands):
|
|
Years Ending September 30, |
|||||||||||
|
2009 |
2008 |
2007 |
||||||||||
|
Loss from discontinued operations before taxes |
$ | (14 | ) | $ | (856 | ) | $ | (180 | ) | |||
|
Benefit for income taxes |
5 | 300 | 68 | |||||||||
|
Loss from discontinued operations, net of tax |
$ | (9 | ) | $ | (556 | ) | $ | (112 | ) | |||
Liquidity and Capital Resources
At September 30, 2009, our liquidity consisted of two primary sources:
|
|
· |
cash of $26.2 million, including cash proceeds from the issuance of $15.6 million of 12% senior notes (of which $4.7 million was used to paydown our borrowings outstanding under the TD facility), and restricted cash of $2.7 million comprised of various escrow balances (principally $1.3 million held in LEAF collection accounts and $1.2 million escrowed for taxes and capital improvements for our investment in a hotel
property); and |
|
|
· |
cash generated from operations, as well as payments received on leases and loans. |
During fiscal 2009, we have concentrated our efforts on deleveraging our balance sheet, reducing our assets by $382.5 million and borrowings by $362.7 million, principally from the sale of our interests in Apidos CDO VI (which generated $7.2 million in cash) and LCFF (which, together with the repayment of some outstanding receivables from
managed entities, generated a total of $9.5 million in cash). We also received total proceeds of $10.0 million from the resolution of certain of our legacy portfolio assets. We have employed these funds principally to reduce the outstanding borrowings on our existing credit facilities and to fund our asset management operations.
For fiscal 2010, we expect to fund our asset management businesses through a combination of cash on hand, cash generated by operations, and the continued monetization of our non-strategic investments, including the legacy portfolio. Our legacy portfolio at September 30, 2009 consists of five loans and six property interests. Because
of current economic conditions, the amount of cash we may be able to derive from resolution of our legacy portfolio and other non-strategic investments in the future may be limited; in any event, the amount of cash we may derive from them is subject to significant variations. Accordingly, we cannot assure you that our legacy portfolio will be a source of significant on-going cash generation in the future. Furthermore, we may defer or discount our fees from investment entities based upon
current economic conditions. In certain circumstances, we may also waive all or part of these fees based upon required priority distributions to our investors.
As an asset manager, our liquidity needs consist principally of capital needed to make investments and to pay our operating expenses, primarily for employee wages and benefits. Our ability to meet our liquidity needs will be subject to our ability to generate cash from operations and, with respect to our strategic investments,
our ability to raise investor funds and more importantly, to obtain adequate debt financing. However, the availability of any such financing will depend on market conditions which, as we discuss in “- Overview”, have been subject to significant constraints. In September and October 2009, we completed our private placement offering of three-year 12% senior notes, which generated $18.8 million in cash. We used a portion of the offering proceeds to paydown our corporate
line of credit borrowings under the TD Bank facility. In November 2009, we amended the TD facility to provide additional flexibility and reduce our debt costs. In particular, the amendment lowered the minimum interest rate on borrowings, reinstated the LIBOR rate option on borrowings, lowered the required monthly principal paydowns from $850,000 to $150,000, and extended the term to October 2011.
The tight credit market continues to limit the ability of LEAF and its investment entities to obtain debt financing and as such, reduces its opportunities to grow the commercial finance business. Accordingly, LEAF will further monitor and scale back its commercial finance business, as necessary, to accommodate the limited availability
of debt financing to its investment entities. During fiscal 2009, borrowing capacity on our LEAF credit facilities has been reduced by $278.5 million, primarily reflecting the $250.0 million facility that was transferred on the sale of LCFF in addition to reduced limits on the LEAF secured revolving credit facility as well as the credit facilities. An amendment to the LEAF facility with PNC in the first quarter of fiscal 2010 has further reduced the borrowing capacity. Accordingly,
we will continue to scale back our commercial finance business to accommodate the limited availability of debt financing.
If we are unable to renew, replace or expand our sources of financing on substantially similar terms, we may be unable to implement our investment strategies successfully and may be required to liquidate portfolio investments. If required, a sale of portfolio investments could be at prices lower than the carrying value of such
investments, which could result in losses and reduced income.
Capital Requirements
Our capital needs consist principally of funds to make investments in the investment vehicles we sponsor or for our own account and to provide bridge financing or other temporary financial support to facilitate asset acquisitions by our sponsored investment vehicles. Accordingly, the amount of capital we require will depend
to a significant extent upon our level of activity in making investments for our own account or in sponsoring investment vehicles, all of which is largely within our discretion.
Dividends
For fiscal 2009, 2008 and 2007, we paid cash dividends of $3.6 million, $4.9 million and $4.8 million, respectively. We have paid quarterly cash dividends since August 1995.
Our 12% senior notes limit the amount of future cash dividends to $0.03 per share unless our basic earnings per common share from continuing operations from the preceding fiscal quarter exceeds $0.25 per share. Subject to the limitations imposed by our 12% senior notes, the determination of the amount of future cash dividends,
if any, is at the discretion of our board of directors and will depend on the various factors affecting our financial condition and other matters the board of directors deems relevant.
Contractual Obligations and Other Commercial Commitments
The following tables summarize our contractual obligations and other commercial commitments at September 30, 2009 (in thousands):
|
Payments Due By Period |
||||||||||||||||||||
|
Total |
Less than 1 Year |
1 – 3 Years |
4 – 5 Years |
After 5 Years |
||||||||||||||||
|
Contractual obligations: |
||||||||||||||||||||
|
Other debt (1) |
$ | 32,061 | $ | 1,898 | $ | 28,268 | $ | 496 | $ | 1,399 | ||||||||||
|
Capital lease obligations (1) |
684 | 323 | 308 | 53 | − | |||||||||||||||
|
Secured credit facilities (1) |
163,579 | 149,029 | (2) | 14,550 | − | − | ||||||||||||||
|
Operating lease obligations |
9,866 | 2,470 | 3,685 | 1,815 | 1,896 | |||||||||||||||
|
Other long-term liabilities |
14,746 | 3,481 | 2,020 | 1,496 | 7,749 | |||||||||||||||
|
Total contractual obligations |
$ | 220,936 | $ | 157,201 | $ | 48,831 | $ | 3,860 | $ | 11,044 | ||||||||||
|
(1) |
Not included in the table above are estimated interest payments calculated at rates in effect at September 30, 2009; less than 1 year: $5.5 million; 1-3 years: $5.9 million; 4-5 years: $261,000; and after 5 years: $1.6 million. |
|
(2) |
Includes $136.5 million of principal payments on our commercial finance secured revolving credit facility, which is non-recourse to us and which is collateralized by the underlying equipment being leased or financed. |
|
Amount of Commitment Expiration Per Period |
||||||||||||||||||||
|
Total |
Less than
1 Year |
1 – 3
Years |
4 – 5
Years |
After
5 Years |
||||||||||||||||
|
Other commercial commitments: |
||||||||||||||||||||
|
Guarantees |
$ | 3,263 | $ | 3,263 | $ | − | $ | - | $ | - | ||||||||||
|
Standby letters of credit |
546 | 546 | − | - | - | |||||||||||||||
|
Total commercial commitments |
$ | 3,809 | $ | 3,809 | $ | − | $ | − | $ | − | ||||||||||
Legal Proceedings. In August 2009, Riverside National Bank of Florida, or Riverside, initiated a lawsuit now captioned Riverside National
Bank of Florida v. The McGraw-Hill Companies, Inc. et al., New York Supreme Court, New York County, No. 650665/2009, against several investment banks, rating agencies, and collateral managers of CDOs, including TCM. We own a 50% interest in TCM, and an unaffiliated third-party owns the other 50% interest.
The complaint seeks monetary damages in an unspecified amount against TCM arising out of Riverside’s investment in certain CDOs between 2005 and 2007. Riverside’s claims against TCM stem from its role as collateral manager for various Trapeza CDOs, which were sold by various investment banks. The complaint
alleges that the offering materials for the CDOs were prepared in part by TCM and were false and misleading. The complaint further alleges that TCM breached fiduciary and contractual obligations by failing to properly monitor the collateral for the CDOs, failing to mitigate losses and failing to disclose known quality and performance problems with the underlying collateral. TCM believes that none of the claims have merit and intends to vigorously defend itself in this matter.
We are also a party to various routine legal proceedings arising out of the ordinary course of our business. Management believes that none of these actions, individually or in the aggregate, will have a material adverse effect on our financial condition or operations.
Guarantees. In connection with the sale of a real estate loan in March 2006, we have agreed that in exchange for the current property owner relinquishing certain control rights, we would make payments to the current property owner under stipulated circumstances,
including the sale or foreclosure of the property or a subsequent resale of the loan. A payment of $2.6 million, increasing $16,234 per month to a maximum of $3.6 million, would be due upon the occurrence of specified events. In addition, the current property owner has the right to receive collateral as security for this obligation equal to or greater than 105% of the value of the obligation upon the occurrence of certain specified events or if our net worth falls below $80.0 million. Our
obligation runs through December 31, 2014. In addition, we agreed to partially indemnify the purchaser of the loan for a portion of the difference between ordinary income tax rates and capital gain rates on accrued interest on the note between the date of sale of the loan in March 2006 and December 31, 2011.
Real estate carveouts. TIC investment programs and real estate partnerships obtain senior lien financing with respect to acquired properties, on a non-recourse basis, with the lenders’ remedies
limited to the properties securing the senior lien financing. Although non-recourse in nature, these loans are subject to limited standard exceptions, which we have guaranteed, or carveouts. These carveouts will expire as the related indebtedness is paid down over the next ten years. Subsidiaries of the ours are both (i) the general partner of the real estate limited partnerships or the asset manager of the TIC investment programs and (ii) the property manager of all of these
properties. Accordingly, we have control over the operations of the underlying assets which mitigates the potential risk associated with these carveouts, and accordingly, no liabilities for these obligations have been recorded in the consolidated financial statements. To date, we have not been required to make any carveout payments.
General corporate commitments. As a specialized asset manager, we sponsor investment funds in which we may make an equity investment along with outside investors. This equity investment
is generally based on a percentage of funds raised and varies among investment programs.
We have committed to purchase units equal to 5% of one of our real estate funds gross offering proceeds, or $1.1 million at September 30, 2009. We will purchase our shares at the close of funding which is anticipated to be in December 2009.
We are also party to employment agreements with senior executives that provide for compensation and other benefits, including severance payments under specified circumstances.
Our wholly-owned broker-dealer subsidiary, Chadwick Securities, Inc., or Chadwick, serves as a dealer-manager for the sale of securities of direct participation investment programs, both public and private, sponsored by subsidiaries
of ours who also serve as general partners and/or managers of these programs. Additionally, Chadwick serves as an introducing agent for transactions involving sales of securities of financial services companies, REITs and insurance companies. As a broker-dealer, Chadwick is subject to the net capital provision of rule 15c3-1 under the Securities Exchange Act of 1934, which requires the maintenance of minimum net capital, as defined. As applied to Chadwick, the rule required net
capital of $121,000 and $71,000 as of September 30, 2009 and 2008, respectively. As of September 30, 2009 and 2008, Chadwick’s adjusted net capital was $1.2 million and $547,000, respectively, which exceeds the minimum requirements by $1.1 million and $476,000, respectively.
Two financial fund management investment entities that have incentive distributions, also known as carried interest, are subject to a potential clawback to the extent that such distributions exceed their cumulative net profits, as defined in the respective partnership
agreements. During fiscal 2009, based upon the evaluation of current information, we reduced the total potential clawback obligation by $1.8 million to $5.7 million at September 30, 2009 from $7.5 million at September 30, 2008. The estimated liability is included in accrued expenses and other liabilities in our consolidated balance sheets. On November 1, 2009, we purchased substantially all the remaining third-party limited partner interests in these investment entities for $2.1 million. We
believe that this transaction will result in a further reduction of our potential clawback liability.
As of September 30, 2009, except for the clawback liability recorded for the two financial fund management investment entities, we do not believe it is probable that any payments will be required under any of our indemnifications and accordingly, no liabilities for these obligations have been recorded in the consolidated financial statements.
Critical Accounting Policies
The discussion and analysis of our financial condition and results of operations are based upon our consolidated financial statements, which have been prepared in accordance with accounting principles generally accepted in the United States of America. The preparation of these financial statements requires us to make estimates
and judgments that affect the reported amounts of our assets, liabilities, revenues and cost and expenses, and related disclosure of contingent assets and liabilities. We make estimates of our allowance for credit losses, the valuation allowance against our deferred tax assets, discounts on management fees, and in determining whether a decrease in the fair value of an investment is an other-than-temporary impairment. Significant estimates for the commercial finance segment include the unguaranteed
residual values of leased equipment, impairment of long-lived assets and goodwill and the fair value and effectiveness of interest rate swaps. The financial fund management segment makes assumptions in determining the fair value of our investments in securities available-for-sale and in estimating the liability, if any, for clawback provisions on certain of our partnership interests. We used assumptions, specifically inputs to the Black-Scholes pricing model and the discounted cash flow
model, in computing the fair value of the 12% senior notes and warrants. On an on-going basis, we evaluate our estimates, which are based on historical experience and on various other assumptions that we believe reasonable under the circumstances, the results of which form the basis for making judgments about the carrying values of assets and liabilities that are not readily apparent from other sources. Actual results may differ from these estimates under different assumptions or conditions.
We have identified the following policies as critical to our business operations and the understanding of our results of operations.
Stock-Based Compensation
Employee Stock Options. We expense employee stock option grants over their respective vesting periods, based on the estimated fair value of each award as determined on the date of grant.
Loans
Loans held for investment. Prior to March 31, 2009, Apidos CDO VI purchased participations in secured bank loans in the secondary market and through syndications of newly originated loans. These loans
were held for investment and, as such, were initially recorded at their purchase price and subsequently accounted for based on their outstanding principal plus or minus any unamortized premiums or discounts and reduced as needed by an allowance for credit losses. Purchases and sales of loans held for investment were recorded on a trade date basis. Trades that did not settle as of September 30, 2008 were classified as loans sold, not settled.
Interest income on these loans included interest at stated rates as adjusted for the amortization or accretion of premiums and discounts. Premiums and discounts were amortized or accreted into interest income using the effective interest method which recognized a level interest rate as
a percentage of the carrying amount of the loan.
Loans held for investment were generally evaluated for impairment individually, but loans purchased on a pooled basis with relatively smaller balances and substantially similar characteristics could have been evaluated collectively for impairment. Loans held for investment were separated into four categories for evaluation of
impairment. When a loan became impaired, the credit loss was increased by the amount of the excess of the amortized cost basis of the loan over its fair value. Fair value was based on (i) market price, if available; (ii) the fair value of the collateral less estimated disposition costs; or (iii) the present value of estimated cash flows. Increases in the allowance for credit losses were recognized in the statements of operations as a provision for credit losses. When
a loan, or a portion thereof, was considered uncollectible and pursuit of the collection was not warranted, we recorded a charge-off or write-down of the loan against the allowance for credit losses.
Real estate loans. Real estate loans that management has the intent and ability to hold for the foreseeable future or until maturity or payoff are stated at the amount of unpaid principal, reduced by unearned income and an allowance for credit losses, if necessary. These
loans are included in investments in real estate in the consolidated balance sheets. Interest on these loans is calculated based upon the principal amount outstanding. Accrual of interest is stopped on a loan when management believes, after considering economic factors, business conditions and collection efforts, that the borrower’s financial condition is such that collection of interest is doubtful.
An impaired real estate loan may remain on accrual status during the period in which we are pursuing repayment of the loan; however, the loan is placed on non-accrual status at such time as either (i) management believes that contractual debt service payments will not be met; (ii) the loan becomes 90 days
delinquent; and (iii) management determines the borrower is incapable of, or has ceased efforts toward, curing the cause of the impairment. While on non-accrual status, we recognize interest income only when an actual payment is received.
We maintain an allowance for real estate loans at a level deemed sufficient to absorb probable losses. We consider general and local economic conditions, neighborhood values, competitive overbuilding, casualty losses and other factors that may affect the value of real
estate loans. The value of loans and real estate may also be affected by factors such as the cost of compliance with regulations and liability under applicable environmental laws, changes in interest rates and the availability of financing. Income from a property will be reduced if a significant number of tenants are unable to pay rent or if available space cannot be rented on favorable terms. In addition, we review all credits on a quarterly basis and continually monitor collections
and payments from our borrowers and maintain an allowance for credit losses based upon our historical experience and knowledge of specific borrower collection issues. We reduce our investments in real estate loans and real estate by an allowance for amounts that may become unrealizable in the future. Such allowance can be either specific to a particular loan or property or general to all loans and real estate.
Investments in Commercial Finance
Our investments in commercial finance consist of loans, direct financing leases, operating leases and future payment card receivables. Those investments that we are holding for sale to our investment entities are reflected separately at fair value as held for
sale in the consolidated balance sheets.
Loans. For term loans, the investment consists of the sum of the total future minimum loan payments receivable less unearned finance income. Unearned finance income, which is recognized as revenue over the term of the financing by the effective interest method, represents the excess of the
total future minimum contracted payments over the original cost of the loan. For all other loans, interest income is recorded at the stated rate on the accrual basis to the extent that such amounts are expected to be collected.
Direct financing leases. Certain of our lease transactions are accounted for as direct financing leases (as distinguished from operating leases). Such leases transfer substantially all benefits and risks of equipment ownership to the customer. Our
investment in direct financing leases consists of the sum of the total future minimum contracted payments receivable and the estimated unguaranteed residual value of leased equipment, less unearned finance income. Unearned finance income, which is recognized as revenue over the term of the financing by the effective interest method, represents the excess of the total future minimum lease payments plus the estimated unguaranteed residual value expected to be realized at the end of the lease term over
the cost of the related equipment. Initial direct costs incurred in the consummation of the lease are capitalized as part of the investment in lease receivables and amortized over the lease term as a reduction of the yield. We discontinue recognizing revenue for lease and loans for which payments are more than 90 days past due. Fees from delinquent payments are recognized when received.
Operating leases. Leases not meeting any of the criteria to be classified as direct financing leases are deemed to be operating leases. Under the accounting for operating leases, the cost of the leased equipment, including acquisition fees associated with lease
placements, is recorded as an asset and depreciated on a straight-line basis over the equipment’s estimated useful life, generally up to seven years. Rental income consists primarily of monthly periodic rental payments due under the terms of the leases. We recognize rental income on a straight-line basis.
During the lease term of existing operating leases, we may not recover all of the cost and related expenses of our rental equipment and, therefore, it is prepared to remarket the equipment in future years. Our policy is to review, on at least a quarterly basis, the expected
economic life of its rental equipment in order to determine the recoverability of its undepreciated cost. We write down our rental equipment to its estimated net realizable value when it is probable that its carrying amount exceeds such value and the excess can be reasonably estimated; gains are only recognized upon actual sale of the rental equipment. There were no write-downs of equipment during fiscal 2009, 2008 and 2007.
Future payment card receivables. Merit provides capital advances to small businesses based on future credit card receipts. The future payment card receivables in the Merit portfolio have risk characteristics
that are different than those in other portfolios originated by us. Revenues from Merit are recorded under the effective interest method. Under this method, an effective interest rate, IRR, is applied to the cost basis of the future credit card receivable. The IRR that is calculated when the future credit card receivable is originated remains constant and is the basis for subsequent impairment testing and income recognition. We discontinue revenue recognition when no
payments have been received for 60 days. If the amount and timing of the future cash collections are not reasonably estimable, we account for the future credit card receivable on the cost recovery method. Under the cost recovery method of accounting, no income is recognized until the basis of the future payment card receivable have been recovered.
Allowance for credit losses. We evaluate the adequacy of the allowance for credit losses in commercial finance (including investments in leases, loans and future payment card receivables) based upon, among other factors, our historical experience with the commercial finance
portfolios we manage, an analysis of contractual delinquencies, economic conditions and trends, industry statistics and equipment finance portfolio characteristics, as adjusted for expected recoveries. In evaluating historic performance of leases and loans, we perform a migration analysis, which estimates the likelihood that an account progresses through delinquency stages to ultimate write-off. For Merit, the allowance for losses is based upon its previous loss history, economic conditions
and trends. Our policy is to charge-off to the allowance those financings for which we believe the collectability is unlikely.
Investments in commercial finance assets - held for sale. Commercial finance assets, which we do not have the intent to hold until maturity, are classified as commercial finance assets held for sale. These investments,
which primarily consist of loans and direct financing leases, are carried at the lower of cost or fair value. Cost basis includes deferred origination fees and costs. Fair value is determined based upon discounted cash flow models.
Investment Securities Available-for-Sale
Our investment securities available-for-sale, including the investments in the CDO issuers we sponsored, which are owned directly as well as indirectly through the consolidation of the SFF entities, are carried at fair value. The fair value of these CDO investments is based
primarily on internally generated expected cash flow models that require significant management judgment and estimation due to the lack of market activity and unobservable pricing inputs. Our investments in affiliates, including holdings in The Bancorp, Inc. (“TBBK”) (NASDAQ: TBBK) and RCC, are valued at the closing price of the respective stock. The fair value of the cumulative net unrealized gains and losses on these investment securities, net of tax, are reported through
accumulated other comprehensive income (loss). Realized gains and losses on the sale of investments are determined on the basis of specific identification and are included in net income.
We recognize a realized loss when it is probable there has been an adverse change in the security holder’s estimated cash flow from that estimated in previous projections. The security is written down to fair value, and the unrealized loss is transferred from accumulated other comprehensive loss to the statement of operations as a reduction of current earnings. The
cost basis adjustment for other-than-temporary impairment would be recoverable only upon the sale or maturity of the security.
Periodically, we review the carrying value of our available-for-sale securities. If we deem an unrealized loss to be other-than-temporary, it will record an impairment charge. We process for identifying declines in the fair value of investments that are other-than-temporary involves
consideration of several factors. These factors include (i) the duration of a significant decline in value, (ii) the liquidity, business prospects and overall financial condition of the issuer, (iii) the magnitude of the decline, (iv) the collateral structure and other credit support, as applicable, and (v) our intent and ability to hold the investment until the value recovers. When the analysis of the above factors results in a conclusion that a decline in fair value is other-than-temporary,
the cost of the investment is written down to fair value.
We recognize dividend income on our securities classified as available-for-sale on the ex-dividend date.
Accounting for Income Taxes
We adjust the balance of our deferred taxes to reflect the tax rates at which future taxable amounts will likely be settled or realized. The effects of tax rate changes on deferred tax liabilities and deferred tax assets, as well as other changes in income tax laws, are recognized in net earnings
in the period during which such changes are enacted. Valuation allowances are established and adjusted, when necessary, to reduce deferred tax assets to the amounts expected to be realized. We assess our ability to realize deferred tax assets primarily based on the earnings history and future earnings potential of the legal entities through which the deferred tax assets will be realized.
Goodwill and Intangible Assets
Goodwill and other intangible assets with indefinite lives are not amortized. Instead, a review for impairment is performed at least annually or more frequently if events and circumstances indicate impairment might have occurred. Goodwill is tested at the reporting unit level using a two-step process. The
first step is a screen for potential impairment by comparing the fair value of a reporting unit to its carrying value. If the fair value of a reporting unit exceeds the carrying value of the net assets assigned to a reporting unit, goodwill is considered not impaired and no further testing is required. If the fair value is less than the carrying value, step two is completed to measure the amount of impairment, if any. In step two, the implied fair value of goodwill is compared
to its carrying amount. The implied fair value of goodwill is computed by subtracting the sum of the fair values of the individual asset categories (tangible and intangible) from the indicated fair value of the reporting unit as determined under step one. To the extent that the carrying amount of goodwill exceeds its implied fair value, an impairment loss is recognized.
We utilize the discounted cash flow approach to estimate the fair value of our reporting units for our impairment review of goodwill. The discounted cash flow approach requires assumptions and estimates of many critical factors, including revenue and market growth, operating
cash flows, market multiples, and discount rates. These assumptions are based on the current economic environment and credit market conditions.
Long-lived assets and identifiable intangibles with finite lives are reviewed for impairment whenever events or changes in circumstances indicate that the carrying amount of an asset may not be recoverable. Recoverability of assets to be held and used is measured by a comparison of the carrying amount of an asset to future undiscounted
net cash flows expected to be generated by the asset. If such assets are considered to be impaired, the impairment recognized is measured by the amount by which the carrying amount of the assets exceeds the fair value of the assets. Assets to be disposed of are reported at the lower of the carrying amount or fair value less costs to sell.
In fiscal 2007, LEAF acquired the leasing division of Pacific Capital Bank N.A. and recorded goodwill of $8.0 million. We test for impairment on an annual basis as of May 31st. Due to the potential impact of the economic recession and the
scarcity of debt financing in the marketplace we performed, as of December 31, 2008 and September 30, 2009, interim assessments of our goodwill for impairment at the commercial finance reporting unit. Based on a third-party valuation as well as test results that were internally generated, we concluded that there was no impairment of our goodwill at December 31, 2008, May 31, 2009 or September 30, 2009.
Additionally, in connection with the Pacific Capital Bank acquisition, we acquired customer relationships with Pacific Capital’s third-party originators, classified as a customer related intangible asset. The value of the intangible asset consists of the estimated excess of future cash inflows over the related cash outflows
generated by the acquired customer base and relationships with third-party originators. We amortize the intangible asset over the expected useful life of the asset and continually monitor events and changes in circumstances that could indicate carrying amounts of the intangible asset may not be recoverable. We determined that the intangible asset was not impaired as of September 30, 2009, 2008 and 2007.
Derivative Instruments
Our policies permit it to enter into derivative contracts, including interest rate swaps and caps to add stability to its financing costs and to manage its exposure to interest rate movements or other identified risks. We have designed these transactions as cash
flow hedges. The contracts or hedge instruments are evaluated at inception and at subsequent balance sheet dates to determine if they continue to qualify for hedge accounting and, accordingly, derivatives are recognized on the balance sheet at fair value. We record changes in the estimated fair value of the derivative in accumulated other comprehensive income to the extent that it is effective. Any
ineffective portion of a derivative’s change in fair value will be immediately recognized in earnings.
Recent Accounting Standards
In June 2009, the FASB identified the FASB Accounting Standards Codification, or ASC, as the authoritative source of U.S. GAAP other than guidance put forth by the U.S. Securities and Exchange Commission. All other accounting literature not included in the ASC will be considered non-authoritative. We adopted this
standard in the fourth quarter of fiscal 2009 and revised our disclosures accordingly for references to U.S. GAAP.
Accounting Standards Issued But Not Yet Effective
The FASB has issued the following accounting standards which are not yet effective for us as of September 30, 2009:
Fair Value of Liabilities. In August 2009, the FASB clarified techniques for valuing a liability in circumstances where a quoted price for an identical liability is not available. The provisions of this guidance are effective for us beginning in the first quarter
of fiscal 2010.
Contingencies in Business Combinations. In April 2009, the FASB issued guidance which requires an acquirer to recognize at fair value, at the acquisition date, an asset acquired and/or a liability assumed in a business combination that arises from a contingency if the
acquisition-date fair value of that asset or liability can be determined during the measurement period. This standard is effective for us for assets or liabilities arising from contingencies in business combinations for which the acquisition date is after September 30, 2009.
Consolidations. In June 2009, the FASB issued guidance which requires a qualitative approach to identifying a controlling financial interest in an entity, and an ongoing assessment of whether an entity is a variable interest entity, or VIE, and whether an interest in a
VIE makes the holder the primary beneficiary of the VIE and, thus, is required to consolidate the VIE in its financial statements. This guidance is effective for us beginning October 1, 2010.
The FASB also issued guidance which eliminates the concept of a qualifying special-purpose entity, or SPE, changes the requirements for derecognizing financial assets and requires greater transparency of related disclosures. This
guidance is effective for our fiscal year and interim periods beginning October 1, 2010.
Disclosure of Plan Assets of Pension and Other Postretirement Plans. The FASB enhanced the disclosures required for the plan assets of defined benefit pension and other postretirement plans. These disclosures are intended to provide users of financial statements with a
greater understanding of: (i) how investment allocation decisions are made, including the factors that are pertinent to an understanding of investment policies and strategies; (ii) the major categories of plan assets; (iii) the inputs and valuation techniques used to measure the fair value of plan assets; (iv) the effect of fair value measurements using significant unobservable inputs on changes in plan assets for the period; and (v) significant concentrations of risk within plan assets.
This guidance is effective for us in fiscal 2010.
Participating Securities. In June 2008, the FASB issued guidance which addresses whether instruments granted in share-based payment transactions are participating securities prior to vesting and, therefore, need to
be included in the earnings allocation in computing earnings per share. Unvested share-based payment awards that contain non-forfeitable rights to dividends or dividend equivalents (whether paid or unpaid) are participating securities and are to be included in the computation of earnings per share. All prior-period earnings per share data presented must be adjusted retrospectively. This guidance is effective for us in fiscal 2010.
Useful Life of Intangible Assets. In April 2008, the FASB amended the factors to be considered in developing a renewal or extension of assumptions used for purposes
of determining the useful life of a recognized intangible asset. This guidance is intended to improve the consistency between the useful life of a recognized intangible asset and the period of expected cash flows used to measure the fair value of the asset and is effective for us in fiscal 2010.
Business Combinations. In December 2007, the FASB established principles and requirements for how the acquirer in a business combination (i) recognizes and measures the identifiable assets acquired, the liabilities assumed,
and any noncontrolling (minority) interest in the acquiree; (ii) recognizes and measures the goodwill acquired in the business combination or a gain from a bargain purchase and (iii) determines what information to disclose to enable users of the financial statements to evaluate the nature and financial effects of the business combination. Additionally, all costs related to an acquisition are to be expensed as incurred. This guidance applies prospectively to business combinations made by us on or after
October 1, 2009.
Noncontrolling Interests. In December 2007, the FASB established accounting and reporting standards for the noncontrolling (minority) interest in a subsidiary and for the deconsolidation of a subsidiary. It clarifies that a noncontrolling interest in a subsidiary
is an ownership interest in the consolidated entity that should be reported as equity in the consolidated financial statements. This guidance is effective for us in fiscal 2010.
With the exception of the guidance on the consolidation of VIEs which we are still evaluating, we do not believe that these standards will have a material impact on our consolidated financial position, results of operations or cash flows.
Newly Adopted Accounting Principles – We adopted the following accounting standards during fiscal 2009:
Fair Value and Other-Than-Temporary Impairment, or OTTI. In April 2009, the FASB issued the following new financial staff positions which provided further guidance on fair value and OTTI which we adopted in the third quarter of fiscal 2009:
|
|
· |
A two-step approach to determine whether or not a market is active. The guidance further provides that if a transaction is considered to have been entered into on a distressed basis, the entity should use its own judgment rather than relying on observable transactions. |
|
|
· |
An entity must recognize an OTTI only at the time at which it intends or is required to sell the asset prior to the recovery of its cost basis. The guidance also changes the presentation of OTTI for debt securities that the entity does not intend to sell. Impairments are separated into two components: (i) the amount of impairments related to credit losses and (ii) the amount
related to other factors. The amount of impairment related to credit losses is reflected as a charge to earnings, while the amount deemed to be related to other factors is reflected as an adjustment to shareholders’ equity through other comprehensive income. |
|
|
· |
Disclosures about fair value of financial instruments are required in interim as well as in annual financial statements. These disclosures are also required in summarized financial information at interim reporting periods. |
Subsequent Events. In May 2009, the FASB issued guidance which establishes general standards of accounting for and disclosure of events that occur after the balance sheet date but before financial statements are issued or available to be issued. We adopted this
guidance in the third quarter of fiscal 2009.
Disclosures about Derivative Instruments and Hedging Activities. In March 2008, the FASB issued guidance that requires enhanced disclosures for derivative instruments, including those used in hedging activities. We
adopted this guidance in the second quarter of fiscal 2009. Although the adoption did not have a significant impact on our financial statements, additional disclosures were added to the notes to the consolidated financial statements.
Fair Value Measurements in Inactive and Distressed Markets. In October 2008, the FASB issued clarification of when the market for a financial asset is inactive. This guidance had no effect on our consolidated financial statements.
Transfers of Financial Assets and Interests in VIEs. In December 2008, the FASB issued guidance that requires public entities to provide additional disclosures about transfers of financial assets. It also requires
public enterprises, including sponsors that have a variable interest in a VIE, to provide additional disclosures about the VIE. Additionally, this guidance requires certain disclosures to be provided by a public enterprise that is (i) a sponsor of a SPE that holds a variable interest in the qualifying SPE but was not the transferor of financial assets to the qualifying SPE and (ii) a servicer of a qualifying SPE that holds a significant variable interest in the qualifying SPE but was not the transferor
of financial assets to the qualifying SPE. The required disclosures are intended to provide greater transparency to financial statement users about a transferor’s continuing involvement with transferred financial assets and an enterprise’s involvement with VIEs and qualifying SPEs. We adopted this pronouncement as of October 1, 2008 and have included the appropriate disclosures within our consolidated financial statements as of September 30, 2009.
Enhanced Disclosures about Credit Derivatives and Guarantees. In September 2008, the FASB issued guidance to improve disclosures about credit derivatives by requiring more information about the potential adverse effects
of changes in credit risk on financial position, financial performance, and cash flows of the sellers of credit derivatives. We adopted this pronouncement as of December 31, 2008 and have included the appropriate disclosures within our consolidated financial statements.
Fair Value Measurements. In February 2007, the FASB issued guidance which permits entities to choose to measure many financial instruments and certain other items at fair value. The fair value option permits an entity to choose to measure eligible items at fair
value at specified election dates. Entities choosing the fair value option are required to report unrealized gains and losses on items for which the fair value option has been elected in earnings at each subsequent reporting date. We elected to not to apply this guidance to any of our existing assets or liabilities.
|
QUANTITATIVE AND QUALITATIVE DISCLOSURES ABOUT MARKET RISK. |
Resource America is exposed to market risk from changes in interest rates. We have not entered into any market sensitive instruments for trading purposes. The analysis below presents the sensitivity of the market value of our financial instruments to selected changes in market interest rates. The range
of changes presented reflects our view of changes that are reasonably possible over a one-year period and provides indicators of how we view and manage our ongoing market risk exposures.
General
We are exposed to various market risks, principally fluctuating interest rates. These risks can impact our results of operations, cash flows and financial position. We manage these risks through regular operating and financing activities.
The following analyzes the potential impact on our earnings, cash flows and financial position from a hypothetical change in market risk factors as of September 30, 2009. Our analysis does not consider other possible effects that could impact our business.
Commercial Finance
We hold commercial finance assets for sale which are comprised of loans and leases at fixed rates of interest. These assets are generally sold to our leasing investment entities at fair value, generally within three months from the date acquired. Accordingly,
our exposure to changes in market interest rates on these assets is minimized. To finance these assets, we have a $150.0 million variable rate revolving warehouse credit facility with a group of banks led by National City Bank, which had an outstanding balance of $136.5 million at September 30, 2009. Interest is charged at one of two rates: (i) LIBOR plus 1.5%, or (ii) the prime rate. A hypothetical 10% change in LIBOR would change our annual interest expense by $176,000.
Real Estate
Portfolio Loans and Related Senior Liens. As of September 30, 2009, we believe that a loan held in our legacy portfolio that is subordinate to senior liens is not sensitive to changes in interest rates since:
|
|
· |
the loan is subject to forbearance or other agreements that require all of the operating cash flow from the property underlying the loan, after debt service on senior lien interest, to be paid to us and therefore is not currently being paid based on the stated interest rate of the loan; |
|
|
· |
the senior lien interest ahead of our interest is at a fixed rate and is not subject to interest rate fluctuation that would affect payments to us; and |
|
|
· |
the loan has significant accrued and unpaid interest and other charges outstanding to which cash flow from the underlying property would be applied even if cash flows were to exceed the interest due, as originally underwritten. |
Other Loans. A mortgage owned by a VIE that we consolidated at September 30, 2009 is at a fixed interest rate and, therefore, not subject to interest rate fluctuations.
Other
At September 30, 2009, we had two secured revolving credit facilities for general business use. Weighted average borrowings on these two facilities were $42.8 million for fiscal 2009 at an effective interest rate of 11.1%. A hypothetical 10% change in the interest rate on these facilities would change our annual interest
expense by $248,000.
|
FINANCIAL STATEMENTS AND SUPPLEMENTARY DATA. |
[THE REMAINDER OF THIS PAGE INTENTIONALLY LEFT BLANK]
REPORT OF INDEPENDENT REGISTERED PUBLIC ACCOUNTING FIRM
Stockholders and Board of Directors
RESOURCE AMERICA, INC.
We have audited the accompanying consolidated balance sheets of Resource America, Inc. (a Delaware corporation) and subsidiaries (the Company) as of September 30, 2009 and 2008, and the related consolidated statements of operations, changes in stockholders' equity and cash flows for each of the three years in the period ended
September 30, 2009. Our audits of the basic financial statements include the financial schedules listed in the index appearing under Item 15(2). These financial statements and financial statement schedules are the responsibility of the Company's management. Our responsibility is to express an opinion on these financial statements and financial statement schedules based on our audits.
We conducted our audits in accordance with the standards of the Public Company Accounting Oversight Board (United States). Those standards require that we plan and perform the audits to obtain reasonable assurance about whether the financial statements are free of material misstatement. An audit includes examining,
on a test basis, evidence supporting the amounts and disclosures in the financial statements. An audit also includes assessing the accounting principles used and significant estimates made by management, as well as evaluating the overall financial statement presentation. We believe that our audits provide a reasonable basis for our opinion.
In our opinion, the financial statements referred to above present fairly, in all material respects, the consolidated financial position of Resource America, Inc. and subsidiaries as of September 30, 2009 and 2008 and the consolidated results of their operations and cash flows for each of the three years in the period ended September
30, 2009 in conformity with accounting principles generally accepted in the United States of America. Also in our opinion, the related financial statement schedules, when considered in relation to the basic financial statements taken as a whole, present fairly, in all material respects, the information set forth therein.
The Company adopted Securities and Exchange Commission Staff Accounting Bulletin No. 108, Considering the Effects of Prior Year Misstatements, when Quantifying Misstatements in the Current Year Financial Statements, effective October 1, 2006.
We have also audited, in accordance with the standards of the Public Company Accounting Oversight Board (United States), Resource America, Inc. and subsidiaries internal control over financial reporting as of September 30, 2009, based on criteria established in Internal Control—Integrated Framework issued by the Committee of Sponsoring
Organizations of the Treadway Commission and our report dated December 11, 2009, expressed an unqualified opinion on internal control over financial reporting.
/s/ GRANT THORNTON LLP
Philadelphia, Pennsylvania
December 11, 2009
RESOURCE AMERICA, INC.
CONSOLIDATED BALANCE SHEETS
(in thousands, except share data)
|
September 30, |
||||||||
|
2009 |
2008 |
|||||||
|
ASSETS |
||||||||
|
Cash |
$ | 26,197 | $ | 14,910 | ||||
|
Restricted cash |
2,741 | 23,689 | ||||||
|
Receivables |
1,358 | 2,014 | ||||||
|
Receivables from managed entities and related parties, net |
55,047 | 35,674 | ||||||
|
Loans sold, not settled, at fair value |
− | 662 | ||||||
|
Loans held for investment, net |
− | 219,664 | ||||||
|
Investments in commercial finance - held for investment, net |
2,429 | 182,315 | ||||||
|
Investments in commercial finance - held for sale, net |
142,701 | 110,773 | ||||||
|
Investments in real estate, net |
27,313 | 37,972 | ||||||
|
Investment securities available-for-sale, at fair value |
19,500 | 22,746 | ||||||
|
Investments in unconsolidated entities |
16,241 | 18,523 | ||||||
|
Property and equipment, net |
13,435 | 16,886 | ||||||
|
Deferred tax assets |
45,656 | 44,467 | ||||||
|
Goodwill |
7,969 | 7,969 | ||||||
|
Intangible assets, net |
3,637 | 4,329 | ||||||
|
Other assets |
11,616 | 15,764 | ||||||
|
Total assets |
$ | 375,840 | $ | 758,357 | ||||
|
LIABILITIES AND STOCKHOLDERS’ EQUITY |
||||||||
|
Liabilities: |
||||||||
|
Accrued expenses and other liabilities |
$ | 40,986 | $ | 56,309 | ||||
|
Payables to managed entities and related parties |
1,284 | 586 | ||||||
|
Borrowings |
191,383 | 554,059 | ||||||
|
Deferred tax liabilities |
2,046 | 1,060 | ||||||
|
Minority interests |
323 | 2,610 | ||||||
|
Total liabilities |
236,022 | 614,624 | ||||||
|
Commitments and contingencies |
||||||||
|
Stockholders’ equity: |
||||||||
|
Preferred stock, $1.00 par value, 1,000,000 shares authorized;
none outstanding |
- | - | ||||||
|
Common stock, $.01 par value, 49,000,000 shares authorized; 27,757,849
and 27,421,552 shares issued, respectively (including nonvested
restricted stock of 552,461 and 513,386, respectively) |
272 | 269 | ||||||
|
Additional paid-in capital |
277,944 | 269,689 | ||||||
|
Accumulated deficit |
(22,471 | ) | (3,980 | ) | ||||
|
Treasury stock, at cost; 9,213,665 and 9,312,232 shares, respectively |
(100,367 | ) | (101,440 | ) | ||||
|
Accumulated other comprehensive loss |
(15,560 | ) | (20,805 | ) | ||||
|
Total stockholders’ equity |
139,818 | 143,733 | ||||||
| $ | 375,840 | $ | 758,357 | |||||
The accompanying notes are an integral part of these statements
RESOURCE AMERICA, INC.
CONSOLIDATED STATEMENTS OF OPERATIONS
(in thousands, except per share data)
|
Years Ended September 30, |
||||||||||||
|
2009 |
2008 |
2007 |
||||||||||
|
REVENUES |
||||||||||||
|
Commercial finance |
$ | 49,395 | $ | 96,881 | $ | 40,692 | ||||||
|
Real estate |
25,417 | 31,519 | 22,987 | |||||||||
|
Financial fund management |
33,344 | 27,536 | 63,089 | |||||||||
| 108,156 | 155,936 | 126,768 | ||||||||||
|
COSTS AND EXPENSES |
||||||||||||
|
Commercial finance |
25,179 | 42,741 | 19,501 | |||||||||
|
Real estate |
22,038 | 22,602 | 13,190 | |||||||||
|
Financial fund management |
20,468 | 27,737 | 21,264 | |||||||||
|
General and administrative |
14,369 | 16,080 | 11,875 | |||||||||
|
Provision for credit losses |
8,604 | 10,627 | 229 | |||||||||
|
Depreciation and amortization |
6,922 | 4,660 | 2,924 | |||||||||
| 97,580 | 124,447 | 68,983 | ||||||||||
|
OPERATING INCOME |
10,576 | 31,489 | 57,785 | |||||||||
|
OTHER (EXPENSE) INCOME |
||||||||||||
|
Impairment losses on investment securities |
(9,827 | ) | − | − | ||||||||
|
Recognized in other comprehensive loss |
1,288 | − | − | |||||||||
|
Net impairment losses recognized in earnings |
(8,539 | ) | (14,467 | ) | (12,580 | ) | ||||||
|
Interest expense |
(20,199 | ) | (47,266 | ) | (33,566 | ) | ||||||
|
Minority interest income (expense), net |
1,603 | 4,243 | (2,142 | ) | ||||||||
|
Loss on sale of loans and investment securities, net |
(11,588 | ) | (17,674 | ) | (5,025 | ) | ||||||
|
Other income, net |
3,156 | 3,036 | 3,210 | |||||||||
| (35,567 | ) | (72,128 | ) | (50,103 | ) | |||||||
|
(Loss) income from continuing operations before income taxes |
(24,991 | ) | (40,639 | ) | 7,682 | |||||||
|
(Benefit) provision for income taxes |
(10,504 | ) | (15,695 | ) | 2,428 | |||||||
|
(Loss) income from continuing operations |
(14,487 | ) | (24,944 | ) | 5,254 | |||||||
|
Loss from discontinued operations, net of tax |
(444 | ) | (1,299 | ) | (1,558 | ) | ||||||
|
NET (LOSS) INCOME |
$ | (14,931 | ) | $ | (26,243 | ) | $ | 3,696 | ||||
|
Basic (loss) earnings per common share: |
||||||||||||
|
Continuing operations |
$ | (0.81 | ) | $ | (1.42 | ) | $ | 0.30 | ||||
|
Discontinued operations |
(0.03 | ) | (0.08 | ) | (0.09 | ) | ||||||
|
Net (loss) income |
$ | (0.84 | ) | $ | (1.50 | ) | $ | 0.21 | ||||
|
Weighted average shares outstanding |
17,835 | 17,518 | 17,467 | |||||||||
|
Diluted (loss) earnings per common share: |
||||||||||||
|
Continuing operations |
$ | (0.81 | ) | $ | (1.42 | ) | $ | 0.27 | ||||
|
Discontinued operations |
(0.03 | ) | (0.08 | ) | (0.08 | ) | ||||||
|
Net (loss) income |
$ | (0.84 | ) | $ | (1.50 | ) | $ | 0.19 | ||||
|
Weighted average shares outstanding |
17,835 | 17,518 | 19,085 | |||||||||
|
Dividends declared per common share |
$ | 0.20 | $ | 0.28 | $ | 0.27 | ||||||
The accompanying notes are an integral part of these statements
RESOURCE AMERICA, INC.
CONSOLIDATED STATEMENTS OF CHANGES IN STOCKHOLDERS’ EQUITY
YEARS ENDED SEPTEMBER 30, 2009, 2008 AND 2007
(in thousands)
|
Retained |
Accumulated |
|||||||||||||||||||||||||||||||
|
Additional |
Earnings |
ESOP |
Other |
Total |
||||||||||||||||||||||||||||
|
Common |
Paid-In |
(Accumulated |
Treasury |
Loan |
Comprehensive |
Stockholders’ |
Comprehensive |
|||||||||||||||||||||||||
|
Stock |
Capital |
Deficit) |
Stock |
Receivable |
Income (Loss) |
Equity |
Income (Loss) |
|||||||||||||||||||||||||
|
Balance, September 30, 2006 |
$ | 264 | $ | 259,882 | $ | 27,569 | $ | (96,960 | ) | $ | (465 | ) | $ | 4,877 | $ | 195,167 | ||||||||||||||||
|
Cumulative effect adjustment |
− | − | 676 | − | − | − | 676 | |||||||||||||||||||||||||
|
Balance, October 1, 2006 |
264 | 259,882 | 28,245 | (96,960 | ) | (465 | ) | 4,877 | 195,843 | |||||||||||||||||||||||
|
Net income |
− | − | 3,696 | − | − | − | 3,696 | $ | 3,696 | |||||||||||||||||||||||
|
Treasury shares issued |
− | 443 | − | 314 | − | − | 757 | |||||||||||||||||||||||||
|
Stock-based compensation |
− | 934 | − | − | − | − | 934 | |||||||||||||||||||||||||
|
Restricted stock awards |
− | 1,004 | − | − | − | − | 1,004 | |||||||||||||||||||||||||
|
Issuance of common shares |
4 | 1,222 | − | − | − | − | 1,226 | |||||||||||||||||||||||||
|
Tax benefit from exercise
of stock options |
− | 2,090 | − | − | − | − | 2,090 | |||||||||||||||||||||||||
|
Purchase of treasury shares |
− | − | − | (5,368 | ) | − | − | (5,368 | ) | |||||||||||||||||||||||
|
Cash dividends |
− | − | (4,770 | ) | − | − | − | (4,770 | ) | |||||||||||||||||||||||
|
Other comprehensive loss |
− | − | − | − | − | (9,479 | ) | (9,479 | ) | (9,479 | ) | |||||||||||||||||||||
|
Settlement of equity conversion
feature underlying
a subsidiary’s debt |
− | (611 | ) | − | − | − | − | (611 | ) | |||||||||||||||||||||||
|
Repayment of ESOP loan |
− | (217 | ) | − | − | 242 | − | 25 | ||||||||||||||||||||||||
|
Balance, September 30, 2007 |
268 | 264,747 | 27,171 | (102,014 | ) | (223 | ) | (4,602 | ) | 185,347 | $ | (5,783 | ) | |||||||||||||||||||
|
Net loss |
− | − | (26,243 | ) | − | − | − | (26,243 | ) | $ | (26,243 | ) | ||||||||||||||||||||
|
Treasury shares issued |
− | 306 | − | 811 | − | − | 1,117 | |||||||||||||||||||||||||
|
Stock-based compensation |
− | 1,007 | − | − | − | − | 1,007 | |||||||||||||||||||||||||
|
Restricted stock awards |
− | 3,448 | − | − | − | − | 3,448 | |||||||||||||||||||||||||
|
Issuance of common shares |
1 | 181 | − | − | − | − | 182 | |||||||||||||||||||||||||
|
Purchase of treasury shares |
− | − | − | (237 | ) | − | − | (237 | ) | |||||||||||||||||||||||
|
Cash dividends |
− | − | (4,908 | ) | − | − | − | (4,908 | ) | |||||||||||||||||||||||
|
Other comprehensive loss |
− | − | − | − | − | (16,203 | ) | (16,203 | ) | (16,203 | ) | |||||||||||||||||||||
|
Repayment of ESOP loan |
− | − | − | − | 223 | − | 223 | |||||||||||||||||||||||||
|
Balance, September 30, 2008 |
269 | 269,689 | (3,980 | ) | (101,440 | ) | − | (20,805 | ) | 143,733 | $ | (42,446 | ) | |||||||||||||||||||
|
Net loss |
− | − | (14,931 | ) | − | − | − | (14,931 | ) | $ | (14,931 | ) | ||||||||||||||||||||
|
Treasury shares issued |
− | (650 | ) | − | 1,073 | − | − | 423 | ||||||||||||||||||||||||
|
Stock-based compensation |
− | 613 | − | − | − | − | 613 | |||||||||||||||||||||||||
|
Restricted stock awards |
− | 3,615 | − | − | − | − | 3,615 | |||||||||||||||||||||||||
|
Issuance of warrants in
Senior Notes offering |
− | 4,941 | − | − | − | − | 4,941 | |||||||||||||||||||||||||
|
Issuance of common shares |
3 | − | − | − | − | − | 3 | |||||||||||||||||||||||||
|
Purchase of subsidiary stock
held by a noncontrolling
stockholder |
− | (264 | ) | − | − | − | − | (264 | ) | |||||||||||||||||||||||
|
Cash dividends |
− | − | (3,560 | ) | − | − | − | (3,560 | ) | |||||||||||||||||||||||
|
Other comprehensive income |
− | − | − | − | 5,245 | 5,245 | 5,245 | |||||||||||||||||||||||||
|
Balance, September 30, 2009 |
$ | 272 | $ | 277,944 | $ | (22,471 | ) | $ | (100,367 | ) | $ | − | $ | (15,560 | ) | $ | 139,818 | $ | (9,686 | ) | ||||||||||||
The accompanying notes are an integral part of these statements
RESOURCE AMERICA, INC.
CONSOLIDATED STATEMENTS OF CASH FLOWS
(in thousands)
|
Years Ended September 30, |
||||||||||||
|
2009 |
2008 |
2007 |
||||||||||
|
CASH FLOWS FROM OPERATING ACTIVITIES: |
||||||||||||
|
Net (loss) income |
$ | (14,931 | ) | $ | (26,243 | ) | $ | 3,696 | ||||
|
Adjustments to reconcile net (loss) income to net cash
(used in) provided by operating activities: |
||||||||||||
|
Loss on sale of loans and investment securities, net |
11,588 | 17,674 | 5,025 | |||||||||
|
Net impairment losses recognized in earnings |
8,539 | 14,467 | 12,580 | |||||||||
|
Depreciation and amortization |
8,876 | 6,024 | 3,699 | |||||||||
|
Provision for credit losses |
8,604 | 10,627 | 229 | |||||||||
|
Minority interest (income) expense |
(1,603 | ) | (4,243 | ) | 2,142 | |||||||
|
Equity in (earnings) losses of unconsolidated entities |
(1,279 | ) | 15,656 | (13,960 | ) | |||||||
|
Distributions from unconsolidated entities |
6,128 | 15,647 | 16,212 | |||||||||
|
Gain on sale of investments in commercial finance assets |
(628 | ) | (1,956 | ) | (568 | ) | ||||||
|
Gain on sale of assets |
(1,041 | ) | (9,488 | ) | (3,974 | ) | ||||||
|
Loss (gain) on sale of investment securities available-for-sale |
399 | − | (3,533 | ) | ||||||||
|
Deferred income tax benefits |
(13,249 | ) | (16,031 | ) | (14,891 | ) | ||||||
|
Non-cash compensation on long-term incentive plans |
4,651 | 5,572 | 2,695 | |||||||||
|
Non-cash compensation issued |
3 | 136 | 1,861 | |||||||||
|
Non-cash compensation received |
(867 | ) | 159 | (1,404 | ) | |||||||
|
(Increase) decrease in commercial finance investments, held for sale |
(37,330 | ) | 65,297 | 84,950 | ||||||||
|
Changes in operating assets and liabilities |
(19,016 | ) | (18,002 | ) | 8,278 | |||||||
|
Net cash (used in) provided by operating activities of
continuing operations |
(41,156 | ) | 75,296 | 103,037 | ||||||||
|
CASH FLOWS FROM INVESTING ACTIVITIES: |
||||||||||||
|
Capital expenditures |
(335 | ) | (6,401 | ) | (5,441 | ) | ||||||
|
Payments received on real estate loans and real estate |
10,052 | 23,182 | 17,501 | |||||||||
|
Investments in real estate |
(4,694 | ) | (9,802 | ) | (20,917 | ) | ||||||
|
Purchase of commercial finance assets held for investment |
(41,942 | ) | (111,700 | ) | (180,205 | ) | ||||||
|
Payments received on commercial finance assets held for investment |
46,246 | 74,332 | 27,342 | |||||||||
|
Purchase of loans and investment securities |
(19,290 | ) | (251,585 | ) | (23,225 | ) | ||||||
|
Proceeds from sale of loans and investment securities |
5,367 | 40,360 | 7,172 | |||||||||
|
Principal payments received on loans |
4,061 | 13,931 | − | |||||||||
|
Net cash paid for acquisitions |
− | (8,022 | ) | (20,708 | ) | |||||||
|
Other |
(477 | ) | (17,050 | ) | (2,862 | ) | ||||||
|
Net cash used in investing activities of continuing operations |
(1,012 | ) | (252,755 | ) | (201,343 | ) | ||||||
|
CASH FLOWS FROM FINANCING ACTIVITIES: |
||||||||||||
|
Increase in borrowings |
438,897 | 930,731 | 745,598 | |||||||||
|
Principal payments on borrowings |
(395,905 | ) | (715,914 | ) | (649,055 | ) | ||||||
|
Repayment from managed entity on RCC lease portfolio purchase |
4,500 | − | − | |||||||||
|
Distributions paid to minority interest holders |
(73 | ) | − | (2,368 | ) | |||||||
|
Dividends paid |
(3,560 | ) | (4,908 | ) | (4,770 | ) | ||||||
|
Decrease (increase) in restricted cash |
10,297 | (31,194 | ) | (10,156 | ) | |||||||
|
Proceeds from issuance of stock |
3 | 182 | 1,226 | |||||||||
|
Purchase of treasury stock |
(264 | ) | (237 | ) | (5,368 | ) | ||||||
|
Tax benefit from exercise of stock options |
− | − | 2,090 | |||||||||
|
Other |
2 | 315 | (611 | ) | ||||||||
|
Net cash provided by financing activities of continuing operations |
53,897 | 178,975 | 76,586 | |||||||||
|
CASH FLOWS FROM DISCONTINUED OPERATIONS: |
||||||||||||
|
Operating activities |
(2 | ) | (494 | ) | (133 | ) | ||||||
|
Financing activities |
(440 | ) | (736 | ) | (1,145 | ) | ||||||
|
Net cash used in discontinued operations |
(442 | ) | (1,230 | ) | (1,278 | ) | ||||||
|
Increase (decrease) in cash |
11,287 | 286 | (22,998 | ) | ||||||||
|
Cash, beginning of year |
14,910 | 14,624 | 37,622 | |||||||||
|
Cash, end of year |
$ | 26,197 | $ | 14,910 | $ | 14,624 | ||||||
The accompanying notes are an integral part of these statements
RESOURCE AMERICA, INC.
NOTES TO CONSOLIDATED FINANCIAL STATEMENTS
SEPTEMBER 30, 2009
NOTE 1 - NATURE OF OPERATIONS
Resource America, Inc. (the "Company") (NASDAQ: REXI) is a specialized asset management company that uses industry specific expertise to evaluate, originate, service and manage investment opportunities through its commercial finance, real estate and financial fund management operating segments. As
a specialized asset manager, the Company seeks to develop investment funds for outside investors for which the Company provides asset management services, typically under long-term management and operating arrangements either through a contract with, or as the manager or general partner of the sponsored fund. The Company limits its investment entities to investment areas where it owns existing operating companies or has specific expertise. The Company manages assets on behalf of institutional
and individual investors and Resource Capital Corp. (“RCC”) (NYSE: RSO), a diversified real estate finance company that qualifies as a real estate investment trust (“REIT”).
All references to “fiscal”, unless otherwise noted, refer to the Company’s fiscal year, which ends on September 30. For example, a reference to “fiscal 2009” means the 12-month period that ended on September 30, 2009. All references to quarters,
unless otherwise noted, refer to the quarters of the Company’s fiscal year.
The Company conducts its commercial finance operations through the following subsidiaries:
|
|
· |
LEAF Financial Corporation (“LEAF”) sponsored and manages five investment entities and as the general and limited partner or managing member, originates and acts as the servicer of the leases and loans sold to these entities. Four of these entities are publicly-held partnerships and one is a limited liability company that the Company consolidated through March 2009, but no longer consolidates;
and |
|
|
· |
Merit Capital Advance (“Merit”), a subsidiary that commenced operations in March 2007 and has substantially reduced its operations as of September 2009, provided capital to small businesses by advancing funds against their future credit card receipts. The average advance is $25,000 and Merit secures its repayments by having its customer’s credit card receipts from its credit card processor
deposited directly into Merit’s collection account. |
The Company conducts real estate operations through the following subsidiaries:
|
|
· |
Resource Capital Partners, Inc. acts as the general partner in all of the Company’s investment limited partnerships and provides asset management services to the entire portfolio; |
|
|
· |
Resource Real Estate Management, Inc. (“Resource Residential”) provides property management services to the entire multifamily apartment portfolio, including fund assets, distressed assets and joint venture assets; |
|
|
· |
Resource Real Estate Funding, Inc., on behalf of RCC, manages the commercial real estate debt portfolio comprised principally of A notes, whole mortgage loans, mortgage participations, B notes, mezzanine debt and related commercial real estate securities. In addition, it manages a separate portfolio of discounted real estate and real estate loans; and |
|
|
· |
Resource Real Estate manages loans, owned assets and ventures, which are collectively referred to as the “legacy portfolio.” |
RESOURCE AMERICA, INC.
NOTES TO CONSOLIDATED FINANCIAL STATEMENTS − (Continued)
SEPTEMBER 30, 2009
NOTE 1 - NATURE OF OPERATIONS − (Continued)
The Company conducts its financial fund management operations primarily through the following subsidiaries:
|
|
· |
Apidos Capital Management, LLC (“Apidos”) finances, structures and manages investments in bank loans, high yield bonds and equity investments; |
|
|
· |
Trapeza Capital Management, LLC (“TCM”), a joint venture between the Company and an unrelated third-party, originates, structures, finances and manages investments in trust preferred securities and senior debt securities of banks, bank holding companies, insurance companies and other financial companies. TCM together with the Trapeza CDO issuers and Trapeza Partnerships are collectively referred
to as "Trapeza"; |
|
|
· |
Resource Capital Markets, Inc., through the Company’s registered broker-dealer subsidiary, Chadwick Securities, Inc., acts as an agent in the primary and secondary markets for trust preferred securities of banks, bank holding companies, insurance companies, other financial companies, real estate companies, REITS and other real estate related companies as well as securities of collateralized debt obligation
(“CDO”) issuers; |
|
|
· |
Resource Europe Management Ltd. structures and manages investments in international bank loans; |
|
|
· |
Resource Financial Institutions Group, Inc. serves as the general partner for six (one of which is currently in the offering stage) company-sponsored affiliated partnerships which invest in financial institutions; |
|
|
· |
Ischus Capital Management, LLC finances, structures and manages investments in asset-backed securities (“ABS”), including residential mortgage-backed securities (“RMBS”) and commercial mortgage-backed securities (“CMBS”); and |
|
|
· |
Resource Capital Manager, Inc., an indirect wholly-owned subsidiary, provides investment management and administrative services to RCC in accordance with a management agreement. |
NOTE 2 - SUMMARY OF SIGNIFICANT ACCOUNTING POLICIES
Principles of Consolidation
The consolidated financial statements include the accounts of the Company and its subsidiaries.
The Company is the general and a limited partner of two structured finance funds (the “SFF entities”). The limited partners do not have the substantive ability to remove the general partner without cause based on a simple majority vote. The
Company, as the general partner, is presumed to control these entities, and therefore consolidates the SFF entities. Investment securities available-for-sale contain the interests in unconsolidated CDO issuers owned by the SFF entities and, as a result, are consolidated in the Company’s financial statements. The Company's combined general and limited partner interests in the SFF entities range from 15% to 36% and the interests owned by third parties are reflected as minority interests.
When the Company obtains an explicit or implicit interest in an entity, the Company evaluates the entity to determine if the entity is a variable interest entity (“VIE”), and, if so, whether or not the Company is deemed to be the primary beneficiary of the VIE. Generally,
the Company consolidates VIEs for which the Company is deemed to be the primary beneficiary or for non-VIEs which the Company controls. The primary beneficiary of a VIE is the variable interest holder that absorbs the majority of the variability in the expected losses or the residual returns of the VIE. When determining the primary beneficiary of a VIE, the Company considers its aggregate explicit and implicit variable interests as a single variable interest. If the Company’s
single variable interest absorbs the majority of the variability in the expected losses or the residual returns of the VIE, the Company is considered the primary beneficiary of the VIE. The Company reconsiders its determination of whether an entity is a VIE and whether the Company is the primary beneficiary of such VIE if certain events occur.
Variable interests in the Company’s real estate segment primarily relate to subordinated financings in the form of mezzanine loans or unconsolidated real estate interests. As of September 30, 2009, the Company has two such interests wherein the Company is deemed to be the primary beneficiary of the VIE and the entities
are included in the consolidated financial statements. In May 2008, the Company created a wholly-owned indirect subsidiary for the purpose of acquiring distressed real estate loans with third-party partner. The entity was determined to be a VIE. While the Company owns all of the equity interests of this VIE, it does not consolidate it since the partner was determined to be the primary beneficiary.
All intercompany transactions and balances have been eliminated in the Company’s consolidated financial statements.
RESOURCE AMERICA, INC.
NOTES TO CONSOLIDATED FINANCIAL STATEMENTS – (Continued)
SEPTEMBER 30, 2009
NOTE 2 - SUMMARY OF SIGNIFICANT ACCOUNTING POLICIES – (Continued)
Deconsolidation of Entities
Apidos CDO VI. In December 2007, the Company acquired for $21.3 million all of the equity interest of Apidos CDO VI and consolidated it. In March 2009, the Company agreed to all the terms and conditions
to sell its interest in Apidos CDO VI and assign its investment management responsibilities to the buyer. This transaction settled on May 6, 2009. As a result of the agreement and sale, the Company deconsolidated Apidos CDO VI from its consolidated financial statements as of March 31, 2009. The Company received proceeds of $7.2 million and recognized a loss of $11.6 million on the transaction. The Company has no further loss exposure with respect to Apidos CDO VI.
LEAF Commercial Finance Fund (“LCFF”). In March 2009, two of LEAF’s investment partnerships formed a joint venture which acquired a portion of LEAF’s interest in LCFF. No gain or loss was recorded by
the Company on the sale. As a result of the transaction, LCFF was determined to be a VIE for which the joint venture was determined to be the primary beneficiary and, therefore, LEAF no longer consolidates LCFF. Accordingly, $195.0 million of commercial finance assets and $187.6 million of debt financing in addition to the associated interest rate swaps and caps on the debt were transferred to the joint venture.
Investments in Unconsolidated Entities
The Company accounts for the investments it has in the commercial finance, real estate and financial fund management investment entities it has sponsored and manages under the equity method of accounting since the Company has the ability to exercise significant influence over the operating
and financial decisions of these entities.
Commercial finance. The Company has interests in four company-sponsored commercial finance investment partnerships, one of which closed its offering as of October 30, 2009. The Company’s combined
general and limited partner interests in these partnerships range from approximately 1% to 6%.
Real estate. The Company has sponsored and manages eight real estate limited partnerships, including one in the offering stage, five limited liability companies and seven tenant in common (“TIC”) property interest
programs that invest in multifamily residential properties. The Company’s combined interests in these investment entities range from approximately 3% to 11%.
Financial fund management. The Company has general and limited partnership interests in five company-sponsored and managed partnerships that invest in regional banks. The Company’s combined general and limited partnership interests in these partnerships
range from approximately 5% to 10%. The Company also manages and has a combined 7% general and limited partnership interest in an affiliated partnership organized as a credit opportunities fund that invests in bank loans and high yield bonds.
Use of Estimates
Preparation of the Company’s consolidated financial statements in conformity with U.S. GAAP requires management to make estimates and assumptions that affect the reported amounts of assets and liabilities and the disclosure of contingent assets and liabilities as of the date of the consolidated financial statements and the reported
amounts of revenues and costs and expenses during the reporting period. The Company makes estimates of its allowance for credit losses, the valuation allowance against its deferred tax assets, discounts on management fees, and in determining whether a decrease in the fair value of an investment is an other-than-temporary impairment. Significant estimates for the commercial finance segment include the unguaranteed residual values of leased equipment, impairment of long-lived assets and goodwill
and the fair value and effectiveness of interest rate swaps. The financial fund management segment makes assumptions in determining the fair value of its investments in securities available-for-sale and in estimating the liability, if any, for clawback provisions on certain of its partnership interests. The Company used assumptions, specifically inputs to the Black-Scholes pricing model and the discounted cash flow model, in computing the fair value of the 12% senior notes and warrants. Actual
results could differ from these estimates.
RESOURCE AMERICA, INC.
NOTES TO CONSOLIDATED FINANCIAL STATEMENTS – (Continued)
SEPTEMBER 30, 2009
NOTE 2 - SUMMARY OF SIGNIFICANT ACCOUNTING POLICIES – (Continued)
Reclassifications
Certain reclassifications have been made to the fiscal 2008 and fiscal 2007 consolidated financial statements to conform to the fiscal 2009 presentation; including:
|
|
· |
security deposits, previously included in accrued expenses and other liabilities, were reclassified to investments in commercial finance assets held for investment, net and held for sale, net; |
|
|
· |
loss on sale of loans and impairment charges on investment securities were separately disclosed in the consolidated statements of operations; and |
|
|
· |
$1.9 million was reclassified from loss on sale of loans to provision for credit losses. |
Concentration of Credit Risk
Financial instruments, which potentially subject the Company to concentrations of credit risk, consist principally of periodic temporary investments of cash and restricted cash. The Company places its temporary cash investments and restricted cash in high quality short-term money market instruments with high-quality financial
institutions and brokerage firms. At September 30, 2009, the Company had $29.7 million (excluding restricted cash) in deposits at various banks, of which $25.6 million was over the temporary insurance limit of the Federal Deposit Insurance Corporation (“FDIC”) of $250,000 through December 31, 2013. No losses have been experienced on such investments.
In addition, the Company’s receivables from managed entities are comprised of unsecured amounts due from its investment entities and other affiliated entities which the Company has sponsored and manages. The Company evaluates the collectability of these receivables and records a discount in the event the entities
are unable to repay the Company in the near term. In the event that any of these entities fail, the corresponding receivable balance would be at risk.
Restricted Cash
Restricted cash primarily reflects payments made by LEAF customers to a lockbox account which are being processed by the bank as well as funds held in escrow for a real estate property investment. The restricted cash in fiscal 2008 also included amounts held in escrow by Apidos CDO VI.
Foreign Currency Translation
Foreign currency transaction gains and losses of the Company’s European operations are recognized in the determination of net income. Foreign currency translation adjustments related to these foreign operations are included in accumulated other comprehensive loss,
a separate component of shareholders’ equity. The amount included in accumulated other comprehensive loss related to foreign currency translation adjustments were net gains of $16,000 and $296,000 as of September 30, 2009 and 2008, respectively.
Revenue Recognition – Fee Income
RCC management fees. The Company earns a base management and incentive management fee for managing RCC. In addition, the Company is reimbursed for its expenses incurred on behalf of RCC and its operations. Management
fees and reimbursed expenses are recognized monthly when earned.
The quarterly incentive compensation to the Company is payable seventy-five percent (75%) in cash and twenty-five percent (25%) in restricted shares of RCC common stock. The Company may elect to receive more than 25% of its incentive compensation in RCC restricted stock. However,
the Company’s ownership percentage in RCC, direct and indirect, cannot exceed 15%. All shares are fully vested upon issuance, provided that the Company may not sell such shares for one year after the incentive compensation becomes due and payable. The restricted stock is valued at the average of the closing prices of RCC common stock over the thirty day period ending three days prior to the issuance of such shares.
In fiscal 2009, 2008 and 2007, the management, incentive, servicing and acquisition fees that the Company received from RCC were 8%, 5% and 7%, respectively, of the Company’s consolidated revenues. These fees have been allocated and, accordingly, reported as revenues by each of the Company’s operating segments.
RESOURCE AMERICA, INC.
NOTES TO CONSOLIDATED FINANCIAL STATEMENTS – (Continued)
SEPTEMBER 30, 2009
NOTE 2 - SUMMARY OF SIGNIFICANT ACCOUNTING POLICIES – (Continued)
Revenue Recognition – Fee Income – (Continued)
Commercial finance fees. The Company records acquisition fees from its leasing investment entities (based on a percentage of the cost of the leased equipment acquired) as compensation for expenses incurred by the Company related to the lease acquisition. Acquisition
fees, which range from 1% to 2%, are earned at the time of the sale of the related leased equipment to the investment entities. The Company also records management fees from its investment entities for managing and servicing the leased assets acquired when the service is performed. During fiscal 2009, the Company waived $425,000 of management fees from one of its investment entities since the entity’s payment of such fees is contingent upon it providing a certain annual distribution
rate to its partners, which was not met and is uncertain for future periods. Further, the Company is reimbursed by the investment entities for the operating and administrative expenses the Company incurs to manage these entities.
The Company routinely sells its investments in commercial finance assets held for sale to its affiliated investment entities as well as third parties. Leases and loans are accounted for as sold when control of the lease is surrendered. Control over the leases are deemed
surrendered when (i) the leases have been transferred to the leasing partnership or third-party, (ii) the buyer has the right (free of conditions that constrain it from taking advantage of that right) to pledge or exchange the leases and (iii) the Company does not maintain effective control over the leases through either (a) an agreement that entitles and obligates the Company to repurchase or redeem the leases before maturity, or (b) the ability to unilaterally cause the buyer to return specific
leases. In connection with these sales, the Company is the General Partner of the leasing partnerships and the servicer of the leases. Subsequent to the sale, the Company remains the servicer for the leases and loans sold to its leasing partnerships and, in some cases, for those assets sold to third parties. In exchange, the Company receives “adequate compensation.” The assets and liabilities associated with the respective servicing agreements are not material
and are substantially offsetting.
Real estate fees. The Company records acquisition fees of 1% to 1.75% of the net purchase price of properties acquired by real estate investment entities it sponsors and financing fees equal to 1.75% of the debt obtained
or assumed related to the properties acquired. The Company recognizes these fees when its sponsored partnerships or TIC programs acquire the properties and obtain the related financing. Also, in conjunction with TIC properties acquired in fiscal 2008 and 2007, the Company recorded bridge equity fees.
The Company records a monthly property management fee equal to 5% of the gross operating revenues from the underlying properties and a monthly debt management fee equal to 0.167% (2% per year) of the gross offering proceeds deployed in debt investments. The Company recognizes
this fee monthly when earned.
Additionally, the Company records an annual investment management fee from its limited partnerships equal to 1% of the gross offering proceeds of each partnership for its services. The Company records an annual asset management fee from its TIC programs equal to 1% of the gross revenues from the property in connection with
its performance of its asset management responsibilities. The Company records an annual asset management fee from one limited liability company equal to 1.5% of the gross revenues of the underlying properties. These investment management fees and asset management fees are recognized monthly when earned and are discounted to the extent that these fees are deferred.
The Company records quarterly asset management fees from its joint ventures with an institutional partner equal to 1% of the gross funds invested in distressed real estate loans and assets. The Company recognizes these fees monthly over each annual period.
Financial fund management fees. The Company earns monthly fees on assets managed in CDOs on behalf of institutional and individual investors. Collateral management fees are received for managing the assets held by CDO issuers that the Company sponsors. These fees, which
vary by CDO, range between 0.10% and 0.60% of the aggregate principal balance of the collateral securities owned by the CDO issuer. These investment management fees and asset management fees are recognized monthly when earned and are discounted to the extent that these fees are deferred. Additionally, the Company records fees for managing the assets held by the partnerships it has sponsored and for managing their general operations. These fees, which vary by limited partnership,
range between 0.75% and 2.00% of the partnership capital balance.
Introductory agent fees. The Company earns fees for acting as an introducing agent for transactions involving sales of securities of financial services companies, REITs and insurance companies. The Company
recognizes these fees monthly when earned.
RESOURCE AMERICA, INC.
NOTES TO CONSOLIDATED FINANCIAL STATEMENTS – (Continued)
SEPTEMBER 30, 2009
NOTE 2 - SUMMARY OF SIGNIFICANT ACCOUNTING POLICIES – (Continued)
Stock-Based Compensation
Employee stock options. The Company expenses the employee stock options it grants over the respective vesting periods, based on the estimated fair value of the award as determined on the date of grant.
Restricted common stock. The Company values the restricted stock it issues based on the closing price of its stock on the date of grant and amortizes this cost to compensation expense over the respective vesting periods.
Earnings (Loss) Per Share
Basic earnings per share (“Basic EPS”) is determined by dividing net income by the weighted average number of shares of common stock outstanding during the period. Diluted earnings per share (“Diluted EPS”) is computed by dividing net income by the sum of the weighted average number of shares of common
stock outstanding after giving effect to the potential dilution from the exercise of securities, such as stock options and warrants, into shares of common stock as if those securities were exercised, as well as the dilutive effect of other award plans, including restricted stock and director units.
Loans
Loans held for investment. Prior to March 31, 2009, Apidos CDO VI purchased participations in secured bank loans in the secondary market and through syndications of newly originated loans. These loans were
held for investment and, as such, were initially recorded at their purchase price and subsequently accounted for based on their outstanding principal plus or minus any unamortized premiums or discounts and reduced as needed by an allowance for credit losses. Purchases and sales of loans held for investment were recorded on a trade date basis. Trades that did not settle as of September 30, 2008 were classified as loans sold, not settled.
Interest income on these loans included interest at stated rates as adjusted for the amortization or accretion of premiums and discounts. Premiums and discounts were amortized or accreted into interest income using the effective interest method which recognized a level interest
rate as a percentage of the carrying amount of the loan.
Loans held for investment were generally evaluated for impairment individually, but loans purchased on a pooled basis with relatively smaller balances and substantially similar characteristics could have been evaluated collectively for impairment. Loans held for investment were separated into four categories for evaluation of
impairment. When a loan became impaired, the credit loss was increased by the amount of the excess of the amortized cost basis of the loan over its fair value. Fair value was based on (i) market price, if available; (ii) the fair value of the collateral less estimated disposition costs; or (iii) the present value of estimated cash flows. Increases in the allowance for credit losses were recognized in the statements of operations as a provision for credit losses. When
a loan, or a portion thereof, was considered uncollectible and pursuit of the collection was not warranted, the Company recorded a charge-off or write-down of the loan against the allowance for credit losses.
Real estate loans. Real estate loans that management has the intent and ability to hold for the foreseeable future or until maturity or payoff are stated at the amount of unpaid principal, reduced by unearned income and an allowance for credit losses, if necessary. These
loans are included in investments in real estate in the consolidated balance sheets. Interest on these loans is calculated based upon the principal amount outstanding. Accrual of interest is stopped on a loan when management believes, after considering economic factors, business conditions and collection efforts, that the borrower’s financial condition is such that collection of interest is doubtful.
An impaired real estate loan may remain on accrual status during the period in which the Company is pursuing repayment of the loan; however, the loan is placed on non-accrual status at such time as either (i) management believes that contractual debt service payments will not be met;
(ii) the loan becomes 90 days delinquent; and (iii) management determines the borrower is incapable of, or has ceased efforts toward, curing the cause of the impairment. While on non-accrual status, the Company recognizes interest income only when an actual payment is received.
RESOURCE AMERICA, INC.
NOTES TO CONSOLIDATED FINANCIAL STATEMENTS – (Continued)
SEPTEMBER 30, 2009
NOTE 2 - SUMMARY OF SIGNIFICANT ACCOUNTING POLICIES – (Continued)
Loans – (Continued)
The Company maintains an allowance for real estate loans at a level deemed sufficient to absorb probable losses. The Company considers general and local economic conditions, neighborhood values, competitive overbuilding, casualty losses and other factors that may affect
the value of real estate loans. The value of loans and real estate may also be affected by factors such as the cost of compliance with regulations and liability under applicable environmental laws, changes in interest rates and the availability of financing. Income from a property will be reduced if a significant number of tenants are unable to pay rent or if available space cannot be rented on favorable terms. In addition, the Company reviews all credits on a quarterly basis
and continually monitors collections and payments from its borrowers and maintains an allowance for credit losses based upon its historical experience and its knowledge of specific borrower collection issues. The Company reduces its investments in real estate loans and real estate by an allowance for amounts that may become unrealizable in the future. Such allowance can be either specific to a particular loan or property or general to all loans and real estate.
Investments in Commercial Finance
The Company’s investments in commercial finance consist of loans, direct financing leases, operating leases and future payment card receivables. Those investments that the Company is holding for sale to its investment entities are reflected separately at fair value
as held for sale in the consolidated balance sheets.
Loans. For term loans, the investment consists of the sum of the total future minimum loan payments receivable less unearned finance income. Unearned finance income, which is recognized as revenue over the term of
the financing by the effective interest method, represents the excess of the total future minimum contracted payments over the original cost of the loan. For all other loans, interest income is recorded at the stated rate on the accrual basis to the extent that such amounts are expected to be collected.
Direct financing leases. Certain of the Company’s lease transactions are accounted for as direct financing leases (as distinguished from operating leases). Such leases transfer substantially all benefits and risks of equipment ownership to the customer. The
Company’s investment in direct financing leases consists of the sum of the total future minimum contracted payments receivable and the estimated unguaranteed residual value of leased equipment, less unearned finance income. Unearned finance income, which is recognized as revenue over the term of the financing by the effective interest method, represents the excess of the total future minimum lease payments plus the estimated unguaranteed residual value expected to be realized at the end of the
lease term over the cost of the related equipment. Initial direct costs incurred in the consummation of the lease are capitalized as part of the investment in lease receivables and amortized over the lease term as a reduction of the yield. The Company discontinues recognizing revenue for lease and loans for which payments are more than 90 days past due. Fees from delinquent payments are recognized when received.
Operating leases. Leases not meeting any of the criteria to be classified as direct financing leases are deemed to be operating leases. Under the accounting for operating leases, the cost of the leased equipment, including acquisition fees associated with
lease placements, is recorded as an asset and depreciated on a straight-line basis over the equipment’s estimated useful life, generally up to seven years. Rental income consists primarily of monthly periodic rental payments due under the terms of the leases. The Company recognizes rental income on a straight-line basis.
During the lease term of existing operating leases, the Company may not recover all of the cost and related expenses of its rental equipment and, therefore, it is prepared to remarket the equipment in future years. The Company’s policy is to review, on at least a quarterly basis, the expected economic life of its rental equipment in order to determine the recoverability of its undepreciated
cost. The Company writes down its rental equipment to its estimated net realizable value when it is probable that its carrying amount exceeds such value and the excess can be reasonably estimated; gains are only recognized upon actual sale of the rental equipment. There were no write-downs of equipment during fiscal 2009, 2008 and 2007.
RESOURCE AMERICA, INC.
NOTES TO CONSOLIDATED FINANCIAL STATEMENTS – (Continued)
SEPTEMBER 30, 2009
NOTE 2 - SUMMARY OF SIGNIFICANT ACCOUNTING POLICIES – (Continued)
Investments in Commercial Finance – (Continued)
Future payment card receivables. Merit provides capital advances to small businesses based on future credit card receipts. The future payment card receivables in the Merit portfolio have risk characteristics
that are different than those in other portfolios originated by the Company. Revenues from Merit are recorded under the effective interest method. Under this method an effective interest rate ("IRR") is applied to the cost basis of the future credit card receivable. The IRR that is calculated when the future credit card receivable is originated remains constant and is the basis for subsequent impairment testing and income recognition. The Company discontinues revenue
recognition when no payments have been received for 60 days. If the amount and timing of the future cash collections are not reasonably estimable, the Company accounts for the future credit card receivable on the cost recovery method. Under the cost recovery method of accounting, no income is recognized until the basis of the future payment card receivable have been fully recovered.
Allowance for credit losses. The Company evaluates the adequacy of the allowance for credit losses in commercial finance (including investments in leases, loans and future payment card receivables) based upon, among other factors, management’s
historical experience with the commercial finance portfolios it manages, an analysis of contractual delinquencies, economic conditions and trends, industry statistics and equipment finance portfolio characteristics, as adjusted for expected recoveries. In evaluating historic performance of leases and loans, the Company performs a migration analysis, which estimates the likelihood that an account progresses through delinquency stages to ultimate write-off. For Merit, the allowance for losses
is based upon its previous loss history, economic conditions and trends. The Company’s policy is to charge-off to the allowance those financings for which management believes the collectability is unlikely.
Investment Securities Available-for-Sale
The Company’s investment securities available-for-sale, including its investments in CDO issuers it sponsors, which are owned directly as well as indirectly through the consolidation of the SFF entities, are carried at fair value. The fair value of these CDO investments
is based primarily on internally generated expected cash flow models that require significant management judgment and estimation due to the lack of market activity and unobservable pricing inputs. The Company’s investments in affiliates, including holdings in The Bancorp, Inc. (“TBBK”) (NASDAQ: TBBK) and RCC, are valued at the closing price of the respective stock. The fair value of the cumulative net unrealized gains and losses on these investment securities, net
of tax, are reported through accumulated other comprehensive income (loss). Realized gains and losses on the sale of investments are determined on the basis of specific identification and are included in net income.
The Company recognizes a realized loss when it is probable there has been an adverse change in the security holder’s estimated cash flow from that estimated in previous projections. The security is then written down to fair value, and the unrealized loss is transferred
from accumulated other comprehensive loss to the consolidated statements of operations as a reduction of current earnings. The cost basis adjustment for other-than-temporary impairment would be recoverable only upon the sale or maturity of the security.
Periodically, the Company reviews the carrying value of its available-for-sale securities. If the Company deems an unrealized loss to be other-than-temporary, it will record an impairment charge. The Company’s process for identifying declines in the fair
value of investments that are other-than-temporary involves consideration of several factors. These factors include (i) the duration of a significant decline in value, (ii) the liquidity, business prospects and overall financial condition of the issuer, (iii) the magnitude of the decline, (iv) the collateral structure and other credit support, as applicable, and (v) the Company’s intent and ability to hold the investment until the value recovers. When the analysis of the above factors
results in a conclusion that a decline in fair value is other-than-temporary, the cost of the investment is written down to fair value.
The Company recognizes dividend income on its securities classified as available-for-sale on the ex-dividend date.
RESOURCE AMERICA, INC.
NOTES TO CONSOLIDATED FINANCIAL STATEMENTS – (Continued)
SEPTEMBER 30, 2009
NOTE 2 - SUMMARY OF SIGNIFICANT ACCOUNTING POLICIES – (Continued)
Property and Equipment
Property and equipment, which includes amounts recorded under capital leases, is stated at cost. Depreciation and amortization are based on cost, less estimated salvage value, using the straight-line method over the asset’s estimated useful life. Maintenance
and repairs are expensed as incurred. Major renewals and improvements that extend the useful lives of property and equipment are capitalized. The amortization of assets classified under capital leases is included in depreciation expense.
Accounting for Income Taxes
The objectives of accounting for income taxes are to recognize the amount of taxes payable or refundable for the current year and deferred tax liabilities and assets for the future tax consequences of events that have been recognized in the Company’s consolidated financial statements
or tax returns.
The Company adjusts the balance of its deferred taxes to reflect the tax rates at which future taxable amounts will likely be settled or realized. The effects of tax rate changes on deferred tax liabilities and deferred tax assets, as well as other changes in income tax
laws, are recognized in net earnings in the period during which such changes are enacted. Valuation allowances are established and adjusted, when necessary, to reduce deferred tax assets to the amounts expected to be realized. The Company assesses its ability to realize deferred tax assets primarily based on the earnings history and future earnings potential of the legal entities through which the deferred tax assets will be realized.
Goodwill and Intangible Assets
Goodwill and other intangible assets with indefinite lives are not amortized. Instead, a review for impairment is performed at least annually or more frequently if events and circumstances indicate impairment might have occurred. Goodwill is tested at the reporting unit level using a two-step process. The
first step is a screen for potential impairment by comparing the fair value of a reporting unit to its carrying value. If the fair value of a reporting unit exceeds the carrying value of the net assets assigned to a reporting unit, goodwill is considered not impaired and no further testing is required. If the fair value is less than the carrying value, step two is completed to measure the amount of impairment, if any. In step two, the implied fair value of goodwill is compared
to its carrying amount. The implied fair value of goodwill is computed by subtracting the sum of the fair values of the individual asset categories (tangible and intangible) from the indicated fair value of the reporting unit as determined under step one. To the extent that the carrying amount of goodwill exceeds its implied fair value, an impairment loss is recognized.
The Company utilizes the discounted cash flow approach to estimate the fair value of its reporting units for its impairment review of goodwill. The discounted cash flow approach requires assumptions and estimates of many critical factors, including revenue and market growth,
operating cash flows, market multiples, and discount rates. These assumptions are based on the current economic environment and credit market conditions.
Long-lived assets and identifiable intangibles with finite lives are reviewed for impairment whenever events or changes in circumstances indicate that the carrying amount of an asset may not be recoverable. Recoverability of assets to be held and used
is measured by a comparison of the carrying amount of an asset to future undiscounted net cash flows expected to be generated by the asset. If such assets are considered to be impaired, the impairment recognized is measured by the amount by which the carrying amount of the assets exceeds the fair value of the assets. Assets to be disposed of are reported at the lower of the carrying amount or fair value less costs to sell.
In fiscal 2007, LEAF acquired the leasing division of Pacific Capital Bank N.A. and recorded goodwill of $8.0 million. The Company tests for impairment on an annual basis as of May 31st. Due to the potential impact of the economic
recession and the scarcity of debt financing in the marketplace the Company performed, as of December 31, 2008 and September 30, 2009, interim assessments of its goodwill for impairment at the commercial finance reporting unit. Based on a third-party valuation as well as test results that were internally generated, the Company concluded that there was no impairment of its goodwill at December 31, 2008, May 31, 2009 or September 30, 2009.
RESOURCE AMERICA, INC.
NOTES TO CONSOLIDATED FINANCIAL STATEMENTS – (Continued)
SEPTEMBER 30, 2009
NOTE 2 - SUMMARY OF SIGNIFICANT ACCOUNTING POLICIES – (Continued)
Goodwill – (Continued)
Additionally, in connection with the Pacific Capital Bank acquisition, the Company acquired customer relationships with Pacific Capital’s third-party originators, classified as a customer related intangible asset. The value of the intangible asset consists of the estimated excess of future cash inflows over the related
cash outflows generated by the acquired customer base and relationships with third-party originators. The Company amortizes the intangible asset over the expected useful life of the asset and continually monitors events and changes in circumstances that could indicate carrying amounts of the intangible asset may not be recoverable. The Company determined that the intangible asset was not impaired as of September 30, 2009, 2008 and 2007.
Derivative Instruments
The Company’s policies permit it to enter into derivative contracts, including interest rate swaps and caps to add stability to its financing costs and to manage its exposure to interest rate movements or other identified risks. The Company has designed
these transactions as cash flow hedges. The contracts or hedge instruments are evaluated at inception and at subsequent balance sheet dates to determine if they continue to qualify for hedge accounting and, accordingly, derivatives are recognized on the balance sheet at fair value. The Company records changes in the estimated fair value of the derivative in accumulated other comprehensive income to the extent that it is effective. Any ineffective portion of a derivative’s
change in fair value will be immediately recognized in earnings.
Recent Accounting Standards
In June 2009, the Financial Accounting Standards Board (“FASB”) identified the FASB Accounting Standards Codification (“ASC”) as the authoritative source of U.S. GAAP other than guidance put forth by the U.S. Securities and Exchange Commission. All other accounting literature not included in the
ASC will be considered non-authoritative. The Company adopted this standard in the fourth quarter of fiscal 2009 and revised its disclosures accordingly for references to U.S. GAAP.
Accounting Standards Issued But Not Yet Effective
The FASB has issued the following accounting standards which are not yet effective for the Company as of September 30, 2009:
Fair Value of Liabilities. In August 2009, the FASB clarified techniques for valuing a liability in circumstances where a quoted price for an identical liability is not available. The provisions of this guidance are effective for the Company beginning in
the first quarter of fiscal 2010.
Contingencies in Business Combinations. In April 2009, the FASB issued guidance which requires an acquirer to recognize at fair value, at the acquisition date, an asset acquired and/or a liability assumed in a business combination that arises from a contingency if
the acquisition-date fair value of that asset or liability can be determined during the measurement period. This standard is effective for the Company for assets or liabilities arising from contingencies in business combinations for which the acquisition date is after September 30, 2009.
Consolidations. In June 2009, the FASB issued guidance which requires a qualitative approach to identifying a controlling financial interest in an entity, and an ongoing assessment of whether an entity is a VIE and whether an interest in a VIE makes the holder the
primary beneficiary of the VIE. This guidance is effective for the Company beginning October 1, 2010.
RESOURCE AMERICA, INC.
NOTES TO CONSOLIDATED FINANCIAL STATEMENTS – (Continued)
SEPTEMBER 30, 2009
NOTE 2 - SUMMARY OF SIGNIFICANT ACCOUNTING POLICIES – (Continued)
Recent Accounting Standards – (Continued)
The FASB also issued guidance which eliminates the concept of a qualifying special-purpose entity, changes the requirements for derecognizing financial assets and requires greater transparency of related disclosures. This
guidance is effective for the Company’s fiscal year and interim periods beginning October 1, 2010.
Disclosure of Plan Assets of Pension and Other Postretirement Plans. The FASB enhanced the disclosures about the plan assets of defined benefit pension and other postretirement plans. These disclosures are intended to provide users of financial statements with a greater
understanding of: (i) how investment allocation decisions are made, including the factors that are pertinent to an understanding of investment policies and strategies; (ii) the major categories of plan assets; (iii) the inputs and valuation techniques used to measure the fair value of plan assets; (iv) the effect of fair value measurements using significant unobservable inputs on changes in plan assets for the period; and (v) significant concentrations of risk within plan assets. This
guidance is effective for the Company in fiscal 2010.
Participating Securities. In June 2008, the FASB issued guidance which addresses whether instruments granted in share-based payment transactions are participating securities prior to vesting and, therefore, need to
be included in the earnings allocation in computing earnings per share. Unvested share-based payment awards that contain non-forfeitable rights to dividends or dividend equivalents (whether paid or unpaid) are participating securities and are to be included in the computation of earnings per share. All prior-period earnings per share data presented will be adjusted retrospectively. This guidance is effective for the Company in fiscal 2010.
Useful Life of Intangible Assets. In April 2008, the FASB amended the factors to be considered in developing a renewal or extension of assumptions used for purposes
of determining the useful life of a recognized intangible asset. This guidance is intended to improve the consistency between the useful life of a recognized intangible asset and the period of expected cash flows used to measure the fair value of the asset and is effective for the Company in fiscal 2010.
Business Combinations. In December 2007, the FASB established principles and requirements for how the acquirer in a business combination (i) recognizes and measures
the identifiable assets acquired, the liabilities assumed, and any noncontrolling (minority) interest in the acquiree; (ii) recognizes and measures the goodwill acquired in the business combination or a gain from a bargain purchase and (iii) determines what information to disclose to enable users of the financial statements to evaluate the nature and financial effects of the business combination. Additionally, all costs related to an acquisition are to be expensed as incurred. This guidance applies
prospectively to business combinations made by the Company on or after October 1, 2009.
Noncontrolling Interests. In December 2007, the FASB established accounting and reporting standards for the noncontrolling (minority) interest in a subsidiary and for the deconsolidation of a subsidiary. It
clarifies that a noncontrolling interest in a subsidiary is an ownership interest in the consolidated entity that should be reported as equity in the consolidated financial statements. This guidance is effective for the Company in fiscal 2010.
With the exception of the guidance on the consolidation of VIEs which the Company is still evaluating, the Company does not believe that these standards will have a material impact on its consolidated financial position, results of operations or cash flows.
NOTES TO CONSOLIDATED FINANCIAL STATEMENTS – (Continued)
SEPTEMBER 30, 2009
NOTE 2 - SUMMARY OF SIGNIFICANT ACCOUNTING POLICIES – (Continued)
Recent Accounting Standards – (Continued)
Newly Adopted Accounting Principles – the Company adopted the following accounting standards during fiscal 2009:
Fair Value and Other-Than-Temporary Impairment (“OTTI”). In April 2009, the FASB issued the following new financial staff positions which provided further guidance on fair value and OTTI which the Company adopted in the third quarter of fiscal 2009:
|
|
· |
A two-step approach to determine whether or not a market is active and further provides that if a transaction is considered to be distressed, the entity should use it own judgment rather than relying on observable transactions within a market that is not active. |
|
|
· |
An entity must recognize an OTTI only at the time at which it intends or is required to sell the asset prior to the recovery of its cost basis. The guidance also changes the presentation of OTTI for debt securities that the entity does not intend to sell. Impairments are separated into two components: (a) the amount of impairments related to credit losses and (b) and the amount related
to other factors. The amount of impairment related to credit losses is reflected as a charge to earnings, while the amount deemed to be related to other factors is reflected as an adjustment to shareholders’ equity through other comprehensive income. |
|
|
· |
Disclosures about fair value of financial instruments are required in interim as well as in annual financial statements. These disclosures are also required in summarized financial information at interim reporting periods. |
Subsequent Events. In May 2009, the FASB issued guidance which establishes general standards of accounting for and disclosure of events that occur after the balance sheet date but before financial statements are issued or available to be issued. The Company
adopted this guidance in the third quarter of fiscal 2009.
Disclosures about Derivative Instruments and Hedging Activities. In March 2008, the FASB issued guidance that requires enhanced disclosures for derivative instruments, including those used in hedging activities. The
Company adopted this guidance in the second quarter of fiscal 2009. Although the adoption did not have a significant impact on the Company’s financial statements, additional disclosures were added to the notes to the consolidated financial statements.
Fair Value Measurements in Inactive and Distressed Markets. In October 2008, the FASB issued clarification of when the market for a financial asset is inactive. This guidance had no effect on the Company’s consolidated financial statements.
Transfers of Financial Assets and Interests in VIEs. In December 2008, the FASB issued guidance that requires public entities to provide additional disclosures about transfers of financial assets. It also requires
public enterprises, including sponsors that have a variable interest in a VIE, to provide additional disclosures about the VIE. Additionally, this guidance requires certain disclosures to be provided by a public enterprise that is (i) a sponsor of a SPE that holds a variable interest in the qualifying SPE but was not the transferor of financial assets to the qualifying SPE and (ii) a servicer of a qualifying SPE that holds a significant variable interest in the qualifying SPE but was not the transferor
of financial assets to the qualifying SPE. The required disclosures are intended to provide greater transparency to financial statement users about a transferor’s continuing involvement with transferred financial assets and an enterprise’s involvement with VIEs and qualifying SPEs. The Company adopted this pronouncement as of October 1, 2008 and has included the appropriate disclosures within its consolidated financial statements as of September 30, 2009.
Enhanced Disclosures about Credit Derivatives and Guarantees. In September 2008, the FASB issued guidance to improve disclosures about credit derivatives by requiring more information about the potential adverse effects
of changes in credit risk on financial position, financial performance, and cash flows of the sellers of credit derivatives. The Company adopted this pronouncement as of December 31, 2008 and has included the appropriate disclosures within its consolidated financial statements.
Fair Value Measurements. In February 2007, the FASB issued guidance which permits entities to choose to measure many financial instruments and certain other items at fair value. The fair value option permits an entity to choose to measure eligible items at fair
value at specified election dates. Entities choosing the fair value option are required to report unrealized gains and losses on items for which the fair value option has been elected in earnings at each subsequent reporting date. The Company elected to not to apply this guidance to any of its existing assets or liabilities.
RESOURCE AMERICA, INC.
NOTES TO CONSOLIDATED FINANCIAL STATEMENTS – (Continued)
SEPTEMBER 30, 2009
NOTE 2 - SUMMARY OF SIGNIFICANT ACCOUNTING POLICIES – (Continued)
Recent Accounting Standards – (Continued)
In September 2006, the FASB issued guidance on measuring the fair value of financial assets and liabilities and required additional disclosures in both annual and quarterly reports. The Company adopted this guidance as of October 1, 2008.
The adoption of these standards did not have a material impact on the Company’s consolidated financial position, results of operations or cash flows.
NOTE 3 – SUPPLEMENTAL CASH FLOW INFORMATION
Supplemental disclosure of cash flow information (in thousands):
|
Years Ended September 30, |
||||||||||||
|
2009 |
2008 |
2007 |
||||||||||
|
Cash paid for: |
||||||||||||
|
Interest |
$ | 18,975 | $ | 57,845 | $ | 18,929 | ||||||
|
Income taxes |
$ | 2,638 | $ | 3,880 | $ | 3,251 | ||||||
|
Non-cash activities include the following: |
||||||||||||
|
Fair value of warrants recorded as a discount to the Senior Notes |
$ | 4,941 | $ | − | $ | − | ||||||
|
Transfer of loans held for investment: |
||||||||||||
|
Reduction of loans held for investment |
$ | − | $ | 325,365 | $ | 418,801 | ||||||
|
Termination of associated warehouse credit facilities |
$ | − | $ | (337,276 | ) | $ | 418,284 | |||||
|
Activity on secured warehouse facilities related to bank loans: |
||||||||||||
|
Purchase of loans |
$ | − | $ | (51,524 | ) | $ | (1,085,863 | ) | ||||
|
(Repayments of) borrowings to fund purchases of loans |
$ | − | $ | (100,368 | ) | $ | 788,527 | |||||
|
Proceeds from sale of loans |
$ | − | $ | 7,366 | $ | 280,970 | ||||||
|
Principal payments on loans |
$ | − | $ | 6,322 | $ | 60,896 | ||||||
|
Use of funds held in escrow for purchases of loans |
$ | − | $ | − | $ | 3,000 | ||||||
|
(Loss) gain on sales of loans |
$ | − | $ | − | $ | (5,025 | ) | |||||
|
(Settlement) sale of loans traded, not settled, including use of
escrow funds |
$ | − | $ | (152,706 | ) | $ | 152,706 | |||||
|
Acquisition of commercial finance assets (see Note 6): |
||||||||||||
|
Commercial finance assets acquired |
$ | − | $ | 412,439 | $ | 67,816 | ||||||
|
Purchase of building and other assets |
$ | − | $ | 7,835 | $ | 4,810 | ||||||
|
Goodwill acquired |
$ | − | $ | 28 | $ | 7,941 | ||||||
|
Debt incurred for acquisitions |
$ | − | $ | (391,176 | ) | $ | (59,800 | ) | ||||
|
Liabilities assumed |
$ | − | $ | (21,176 | ) | $ | − | |||||
|
Receipt of notes upon the resolution of real estate investments |
$ | − | $ | 1,500 | $ | − | ||||||
|
Property received on foreclosure of a real estate loans: |
||||||||||||
|
Investment in real estate loans |
$ | (2,837 | ) | $ | − | $ | − | |||||
|
Investment in real estate owned |
$ | 2,837 | $ | − | $ | − | ||||||
|
Non-cash effects from the deconsolidation of Apidos CDO VI and LCFF: |
||||||||||||
|
Cash |
$ | 959 | $ | − | $ | − | ||||||
|
Restricted cash |
$ | 10,651 | $ | − | $ | − | ||||||
|
Due from affiliates |
$ | (8,410 | ) | $ | − | $ | − | |||||
|
Receivables |
$ | (6,564 | ) | $ | − | $ | − | |||||
|
Loans held for investment |
$ | 229,097 | $ | − | $ | − | ||||||
|
Investments in commercial finance-held for investment, net |
$ | 185,784 | $ | − | $ | − | ||||||
|
Other assets |
$ | 4,230 | $ | − | $ | − | ||||||
|
Accrued expense and other liabilities |
$ | (7,540 | ) | $ | − | $ | − | |||||
|
Borrowings |
$ | (401,162 | ) | $ | − | $ | − | |||||
|
Equity |
$ | (7,045 | ) | $ | − | $ | − | |||||
RESOURCE AMERICA, INC.
NOTES TO CONSOLIDATED FINANCIAL STATEMENTS – (Continued)
SEPTEMBER 30, 2009
NOTE 4 − LOANS
Loans held for investment, net. As of March 31, 2009, the Company agreed to sell its interest in Apidos CDO VI and no longer consolidated it. In December 2007, the Company closed Apidos CDO VI, a $240.0
million securitization of corporate loans, and purchased 100% of the equity for $21.3 million and consolidated it in its financial statements.
At September 30, 2008, the Apidos CDO VI portfolio consisted of floating rate loans at various London Inter-Bank Offered Rates (“LIBOR”) plus 1.15% to 9.50% with maturity dates ranging from December 2010 to June 2022. The following is a summary of the secured bank loans held for investment as of September 30,
2008 (in thousands):
|
Bank loans: |
||||
|
Principal |
$ | 223,659 | ||
|
Unamortized premium |
226 | |||
|
Unamortized discount |
(2,626 | ) | ||
| 221,259 | ||||
|
Allowance for credit losses |
(1,595 | ) | ||
|
Loans held for investment, net |
$ | 219,664 | ||
The following table summarizes the activity in the allowance for credit losses for the loan portfolio for the period prior to the sale of the Company’s interests in Apidos CDO VI (in thousands):
|
Years Ended September 30, |
||||||||
|
2009 |
2008 |
|||||||
|
Balance, beginning of year |
$ | 1,595 | $ | − | ||||
|
Provision for credit losses |
1,738 | 2,622 | ||||||
|
Charge-offs |
(715 | ) | (1,027 | ) | ||||
|
Reduction due to the sale of interest |
(2,618 | ) | − | |||||
|
Balance, end of year |
$ | − | $ | 1,595 | ||||
As of September 30, 2009, the Company had no loans held for investment or loans sold, not settled.
NOTE 5 – INVESTMENTS IN COMMERCIAL FINANCE
Commercial Finance Assets
The Company’s investments in commercial finance include the following (in thousands):
|
September 30, 2009 |
September 30, 2008 |
||||||||||||||||||||||||
|
Held for Investment |
Held for Sale |
Total |
Held for Investment |
Held for Sale |
Total | ||||||||||||||||||||
|
Notes receivable (1) |
$ | 385 | $ | 60,441 | $ | 60,826 | $ | 125,904 | $ | 71,988 | $ | 197,892 | |||||||||||||
|
Direct financing leases, net |
1,480 | 72,236 | 73,716 | 44,396 | 36,073 | 80,469 | |||||||||||||||||||
|
Future payment card receivables, net |
3,774 | − | 3,774 | 13,667 | − | 13,667 | |||||||||||||||||||
|
Assets subject to operating leases,net (2) |
− | 10,024 | 10,024 | 98 | 2,712 | 2,810 | |||||||||||||||||||
|
Allowance for credit losses |
(3,210 | ) | − | (3,210 | ) | (1,750 | ) | − | (1,750 | ) | |||||||||||||||
|
Investments in commercial finance, net |
$ | 2,429 | $ | 142,701 | $ | 145,130 | $ | 182,315 | $ | 110,773 | $ | 293,088 | |||||||||||||
|
(1) |
The interest rates on notes receivable generally range from 8% to 15%. |
|
(2) |
Net of accumulated depreciation of $737,000 and $105,000 for commercial finance assets held for sale as of September 30, 2009 and 2008, respectively, and $0 and $28,000 for those commercial assets held for investment as of September 30, 2009 and 2008, respectively. |
RESOURCE AMERICA, INC.
NOTES TO CONSOLIDATED FINANCIAL STATEMENTS – (Continued)
SEPTEMBER 30, 2009
NOTE 5 – INVESTMENTS IN COMMERCIAL FINANCE
Commercial Finance Assets – (Continued)
The components of direct financing leases are as follows (in thousands):
|
September 30, 2009 |
September 30, 2008 |
|||||||||||||||||||||||
|
Held for Investment |
Held for Sale |
Total |
Held for Investment |
Held for Sale |
Total |
|||||||||||||||||||
|
Total future minimum lease payments
receivables |
$ | 1,959 | $ | 84,534 | $ | 86,493 | $ | 54,090 | $ | 44,286 | $ | 98,376 | ||||||||||||
|
Initial direct costs, net of amortization |
6 | 1,157 | 1,163 | 549 | 1,289 | 1,838 | ||||||||||||||||||
|
Unguaranteed residuals |
17 | 3,376 | 3,393 | 109 | 450 | 559 | ||||||||||||||||||
|
Security deposits |
(87 | ) | (69 | ) | (156 | ) | (2,336 | ) | (1,957 | ) | (4,293 | ) | ||||||||||||
|
Unearned income |
(415 | ) | (16,762 | ) | (17,177 | ) | (8,016 | ) | (7,995 | ) | (16,011 | ) | ||||||||||||
|
Investments in direct financing leases,
net |
$ | 1,480 | $ | 72,236 | $ | 73,716 | $ | 44,396 | $ | 36,073 | $ | 80,469 | ||||||||||||
The following table summarizes the activity in the allowance for credit losses for commercial finance assets held for investment (in thousands):
|
Years Ended September 30, |
||||||||||||
|
2009 |
2008 |
2007 |
||||||||||
|
Balance, beginning of year |
$ | 1,750 | $ | 120 | $ | − | ||||||
|
Provision for credit losses |
6,410 | 7,505 | 229 | |||||||||
|
Charge-offs |
(3,557 | ) | (6,099 | ) | (195 | ) | ||||||
|
Recoveries |
107 | 224 | 86 | |||||||||
|
Reduction due to sale of LCFF |
(1,500 | ) | − | − | ||||||||
|
Balance, end of year |
$ | 3,210 | $ | 1,750 | $ | 120 | ||||||
The amount of leases and loans on non-accrual status as of September 30, 2009 and 2008 totaled $1.9 million and $3.4 million, respectively. The amount of future payment card receivables on non-accrual totaled $2.6 million and $3.1 million as of September 30, 2009 and 2008, respectively. The allowance for credit losses
related to future payment card receivables on non-accrual was $2.6 million and $1.1 million as of September 30, 2009 and 2008, respectively. At September 30, 2009, the Company determined that the amount and timing of future cash collections on the remaining $1.2 million, net of allowance, of credit card payment receivables was not reasonably estimable. Accordingly, the Company will recognize revenue on these receivables using the cost recovery method.
Lease and note terms extend over many years. The contractual future minimum lease and note payments and related rental payments scheduled to be received on direct financing non-cancelable leases, notes receivable and operating leases that are held for investment for each of the five succeeding annual periods ending September
30 and thereafter, are as follows (in thousands):
|
Notes
Receivable |
Direct Financing Leases |
Operating
Leases (1) |
||||||||||
|
2010 |
$ | 26,720 | $ | 23,056 | $ | 3,834 | ||||||
|
2011 |
11,549 | 21,537 | 3,431 | |||||||||
|
2012 |
10,074 | 18,732 | 2,797 | |||||||||
|
2013 |
7,576 | 13,112 | 513 | |||||||||
|
2014 |
4,620 | 9,346 | 4 | |||||||||
|
Thereafter |
287 | 710 | − | |||||||||
| $ | 60,826 | $ | 86,493 | $ | 10,579 | |||||||
|
|
(1) |
Operating lease amounts as shown are net of the residual value, if any, at the end of the lease term. |
Portfolio Acquisitions − Fiscal 2008
NetBank Business Finance. In November 2007, the Company acquired a portfolio of approximately 10,000 equipment leases and loans from the FDIC as receiver for NetBank for $412.5 million. Financing for this transaction was provided by borrowings under an
existing warehouse credit facility and a new facility with Morgan Stanley Bank and Morgan Stanley Asset Funding Inc. In fiscal 2008, the Company sold its interest in the entity that held the portfolio to one of its leasing investment partnerships for its fair value of $16.2 million.
RESOURCE AMERICA, INC.
NOTES TO CONSOLIDATED FINANCIAL STATEMENTS – (Continued)
SEPTEMBER 30, 2009
NOTE 5 – INVESTMENTS IN COMMERCIAL FINANCE
Portfolio Acquisitions − Fiscal 2008 – (Continued)
Dolphin Capital Corp. In November 2007, the Company and one of its investment entities acquired Dolphin Capital Corp. of Moberly, MO, an equipment finance subsidiary of Lehman Brothers. The total purchase price of $170.5 million included a $169.0 million portfolio
of small ticket leases which was acquired directly by an investment entity sponsored and managed by LEAF in addition to, customer lists, a lease origination team, business platform and other intangibles. The investment entities financed this transaction with bank borrowings.
The following table summarizes the allocation of the estimated fair value of the assets acquired and liabilities assumed by the Company at the date of the respective acquisitions and the deferred financing costs incurred in connection with the NetBank acquisition (in thousands):
|
NetBank |
Dolphin Capital Corp. |
Total |
||||||||||
|
Leases and loans |
$ | 412,539 | $ | − | $ | 412,539 | ||||||
|
Other assets and property and equipment |
6,168 | 1,667 | 7,835 | |||||||||
|
Liabilities assumed |
(21,176 | ) | − | (21,176 | ) | |||||||
|
Borrowings under LEAF debt facilities |
(389,683 | ) | (1,493 | ) | (391,176 | ) | ||||||
|
Net cash paid for acquisitions |
$ | 7,848 | $ | 174 | $ | 8,022 | ||||||
Portfolio Acquisition − Fiscal 2007
Pacific Capital Bank. In June 2007, LEAF acquired the leasing division of Pacific Capital Bank, N.A. (“PCB”) based in Santa Barbara, California and accounted for it as a business acquisition. The acquisition included a portfolio of small ticket leases
and loans, customer lists, a lease origination team, business platform and other intangibles. In conjunction with the acquisition, LEAF’s investment partnership was assigned and subsequently acquired $201.7 million of the PCB leases and loans. In September 2008, LEAF consolidated the Santa Barbara facility with its Columbia, South Carolina offices.
The following table summarizes the allocation of the estimated fair value of the assets acquired and liabilities assumed at the date of the acquisition (in thousands):
|
Leases and loans |
$ | 269,481 | ||
|
Goodwill and customer list |
12,701 | |||
|
Borrowings under LEAF debt facility |
(59,809 | ) | ||
|
Leases and loans acquired by LEAF’s investment partnership |
(201,665 | ) | ||
|
Net cash paid for acquisition |
$ | 20,708 |
RESOURCE AMERICA, INC.
NOTES TO CONSOLIDATED FINANCIAL STATEMENTS – (Continued)
SEPTEMBER 30, 2009
NOTE 6 – INVESTMENTS IN REAL ESTATE
The following is a summary of the changes in the Company’s investments in real estate (in thousands):
|
September 30, |
||||||||
|
2009 |
2008 |
|||||||
|
Real estate loans: |
||||||||
|
Balance, beginning of year |
$ | 17,413 | $ | 27,765 | ||||
|
New loans |
− | 1,500 | ||||||
|
Collection of principal |
(9,373 | ) | (9,180 | ) | ||||
|
Foreclosure |
(2,837 | ) | − | |||||
|
Interest received |
(1,249 | ) | (4,221 | ) | ||||
|
Accreted and accrued interest income |
493 | 1,549 | ||||||
|
Balance, end of year |
4,447 | 17,413 | ||||||
|
Less allowance for credit losses |
(1,585 | ) | (1,129 | ) | ||||
|
Real estate loans, net |
2,862 | 16,284 | ||||||
|
Real estate: |
||||||||
|
Ventures |
8,189 | 7,837 | ||||||
|
Owned, net of accumulated depreciation of $3,212 and $2,515 |
16,262 | 13,851 | ||||||
|
Total real estate |
24,451 | 21,688 | ||||||
|
Investments in real estate, net |
$ | 27,313 | $ | 37,972 | ||||
The following table summarizes the activity in the allowance for credit losses on real estate loans (in thousands):
|
Years Ended September 30, |
||||||||||||
|
2009 |
2008 |
2007 |
||||||||||
|
Balance, beginning of year |
$ | 1,129 | $ | 629 | $ | 770 | ||||||
|
Provision for credit losses |
456 | 500 | − | |||||||||
|
Charge-offs |
− | − | (141 | ) | ||||||||
|
Balance, end of year |
$ | 1,585 | $ | 1,129 | $ | 629 | ||||||
The balance of one loan which was on non-accrual was $1.6 million at September 30, 2009 and 2008. The amount of interest foregone on this non-accrual loan during fiscal 2009, 2008 and 2007 was $91,000, $92,000 and $94,000, respectively.
NOTE 7 − INVESTMENT SECURITIES AVAILABLE-FOR-SALE
The following table discloses the pre-tax unrealized gains (losses) relating to the Company’s investments in available-for-sale securities (in thousands):
|
Cost or
Amortized Cost |
Unrealized Gains |
Unrealized Losses |
Fair Value |
|||||||||||||
|
September 30, 2009: |
||||||||||||||||
|
CDO securities |
$ | 9,777 | $ | 268 | $ | (1,800 | ) | $ | 8,245 | |||||||
|
Equity securities |
30,180 | − | (18,925 | ) | 11,255 | |||||||||||
|
Total |
$ | 39,957 | $ | 268 | $ | (20,725 | ) | $ | 19,500 | |||||||
|
September 30, 2008: |
||||||||||||||||
|
CDO securities |
$ | 18,875 | $ | − | $ | (8,722 | ) | $ | 10,153 | |||||||
|
Equity securities |
30,900 | − | (18,307 | ) | 12,593 | |||||||||||
|
Total |
$ | 49,775 | $ | − | $ | (27,029 | ) | $ | 22,746 | |||||||
RESOURCE AMERICA, INC.
NOTES TO CONSOLIDATED FINANCIAL STATEMENTS – (Continued)
SEPTEMBER 30, 2009
NOTE 7 − INVESTMENT SECURITIES AVAILABLE-FOR-SALE – (Continued)
The CDO securities represent the Company’s investment in 16 and 18 CDO issuers that it has sponsored and manages at September 30, 2009 and 2008, respectively, of which it has fully impaired 10 and seven investments, respectively. These investments are held directly through the Company’s financial fund management
entities and indirectly through the consolidation of the SFF entities that the Company manages as the general partner. Interest owned by third parties in the SFF entities, reflected as minority interest, totaled $0 and $611,000 as of September 30, 2009 and 2008, respectively. The investments held by the respective CDO issuers are sensitive to interest rate fluctuations, which accordingly, impact their fair value.
The Company held approximately 2.2 million shares of RCC common stock at September 30, 2009 and 2008, respectively. In addition, the Company has options to acquire 2,166 shares of RCC common at an exercise price of $15.00 per share. The
Company held 18,972 and 118,290 shares of TBBK common stock at September 30, 2009 and 2008, respectively. In September 2009, the Company sold 99,318 shares of TBBK for $601,000 and realized a loss of $393,000.
The Company’s investments available-for-sale are pledged as collateral on its corporate secured credit facilities.
Unrealized losses along with the related fair value and aggregated by the length of time the investments were in a continuous unrealized loss position, are as follows (in thousands, except number of securities):
|
Less than 12 Months |
More than 12 Months |
|||||||||||||||||||||||
|
Fair Value |
Unrealized Losses |
Number of Securities |
Fair Value |
Unrealized Losses |
Number of Securities |
|||||||||||||||||||
|
September 30, 2009: |
||||||||||||||||||||||||
|
CDO securities |
$ | − | $ | − | − | $ | 7,111 | $ | (1,800 | ) | 4 | |||||||||||||
|
Equity securities |
− | − | − | 11,255 | (18,925 | ) | 1 | |||||||||||||||||
|
Total |
$ | − | $ | − | − | $ | 18,366 | $ | (20,725 | ) | 5 | |||||||||||||
|
September 30, 2008: |
||||||||||||||||||||||||
|
CDO securities |
$ | − | $ | − | − | $ | 10,153 | $ | (8,722 | ) | 11 | |||||||||||||
|
Equity securities |
591 | (583 | ) | 1 | 12,002 | (17,724 | ) | 1 | ||||||||||||||||
|
Total |
$ | 591 | $ | (583 | ) | 1 | $ | 22,155 | $ | (26,446 | ) | 12 | ||||||||||||
The unrealized losses in the above table are considered to be temporary impairments due to market factors and are not reflective of credit deterioration. The Company has performed credit analyses in relation to these investments and believes the carrying value of these investments to be fully recoverable over their expected
holding period. The Company considers, among other factors, the expected cash flows to be received from investments, recent transactions in the public markets, portfolio quality and industry sector of the investees when determining impairment. Further, because of its intent and ability to hold these investments, the Company does not consider these unrealized losses to be other-than-temporary impairments.
Realized losses. The global credit markets have been subject to substantial volatility and reduction in liquidity. This volatility and reduction in liquidity has affected banks, thrifts and other financial institutions as well as direct and indirect real estate
investments. Consequently, in fiscal 2009, 2008 and 2007, the Company recorded charges of $8.5 million, $14.5 million and $12.6 million, respectively, for the other-than-temporary impairment of certain of its investments in CDOs, primarily those with investments in financial institutions and real estate ABS, including RMBS and CMBS. Additionally, in fiscal 2009, the Company recorded a charge of $73,000 for the other-than-temporary impairment
of its investment in TBBK as management no longer has the intent to hold the security to recovery.
RESOURCE AMERICA, INC.
NOTES TO CONSOLIDATED FINANCIAL STATEMENTS – (Continued)
SEPTEMBER 30, 2009
NOTE 8 − INVESTMENTS IN UNCONSOLIDATED ENTITIES
The following table details the Company’s investments in unconsolidated entities, including the range of partnership interests owned (in thousands, except percentages):
|
September 30, |
|
|||||||||
|
2009 |
2008 |
Partnership Interests |
||||||||
|
Real estate investment entities |
$ | 11,918 | $ | 10,422 |
3% to 11% |
|||||
|
Financial fund management partnerships |
3,429 | 4,927 |
5% to 10% |
|||||||
|
Commercial finance investment entities |
− | 1,636 |
1% to 6% |
|||||||
|
Trapeza entities (1) |
894 | 1,538 |
33% to 50% |
|||||||
|
Total investments in unconsolidated entities |
$ | 16,241 | $ | 18,523 | ||||||
|
(1) |
Includes total write-downs to fair value of $164,000 and $23.2 million for fiscal 2009 and 2008, respectively. These amounts are reflected as a reduction of financial fund management revenues. |
The Company is entitled to incentive distributions (carried interests) in four of the Trapeza partnerships it manages. For two of the partnerships, the incentive distributions are subject to potential clawbacks to the extent that such distributions exceed cumulative net
profits, as defined in the respective partnership agreements. At September 30, 2009 and 2008, the Company had an estimated clawback liability of $5.7 million and $7.5 million, respectively, based on the performance of two of the Trapeza partnerships (see Note 21).
NOTE 9 – VARIABLE INTEREST ENTITIES
Consolidated VIEs
Variable interests in the Company’s real estate segment primarily relate to subordinated financings in the form of mezzanine loans or unconsolidated real estate interests. The Company has two interests in real estate loans for which the Company is deemed to be the
primary beneficiary of the VIE holding the loan and, therefore, consolidates the VIEs. The Company’s maximum loss exposure on these loans is limited to its investment.
The following table reflects the assets and liabilities of the two real estate VIEs that are included in the Company’s consolidated balance sheets (in thousands):
|
September 30, |
||||||||
|
2009 |
2008 |
|||||||
|
Cash |
$ | 42 | $ | 103 | ||||
|
Property and equipment, net |
2,868 | 3,111 | ||||||
|
Other assets |
373 | 11 | ||||||
|
Total assets |
$ | 3,283 | $ | 3,225 | ||||
|
Accrued expenses and other liabilities |
$ | 170 | $ | 56 | ||||
|
Borrowings |
1,057 | 1,227 | ||||||
|
Total liabilities |
$ | 1,227 | $ | 1,283 | ||||
VIE Not Consolidated
In May 2008, the Company entered into a joint venture with an institutional partner to originate, invest in and manage distressed real estate assets. Under the terms of the joint venture agreement, the institutional partner has provided a $500.0 million credit facility to RRE VIP Borrower, LLC (“VIP Borrower”), a
VIE and a wholly-owned subsidiary of the Company, which will acquire and manage the discounted/distressed assets. As loans are made under the facility, VIP Borrower must contribute 3% of each acquired asset as equity and has a right to acquire a 2% participation in the associated funding for that asset under the facility. The facility is available until May 1, 2010. Each loan will have a 60-month term during which interest will accrue at 12% per year. Each loan will
be repaid from gross receipts of the underlying loan or real estate asset securing such loan. In addition to accrued interest, the institutional partner will be entitled to distributions of net available cash flow, after payment/reimbursement of costs, protective advances, management fees, interest, and equity, as follows: 75% to the institutional partner and 25% to VIP Borrower until the institutional partner has earned an 18% internal rate of return; thereafter, 60% will be distributed to the institutional
partner and 40% to VIP Borrower. Accordingly, the institutional partner will receive the majority of the expected losses/residual returns and, as a result, was determined to be the primary beneficiary. As such, VIP Borrower is not consolidated by the Company. The Company’s maximum loss exposure on VIP Borrower is limited to its investment, which was $1.6 million at September 30, 2009.
RESOURCE AMERICA, INC.
NOTES TO CONSOLIDATED FINANCIAL STATEMENTS – (Continued)
SEPTEMBER 30, 2009
NOTE 9 – VARIABLE INTEREST ENTITIES – (Continued)
Sale of Interests in VIP Borrower to RCC. On December 1, 2009, the Company sold its interests in VIP Borrower to RCC at its book value. The Company retains management of the joint venture assets and will continue to receive fees in connection with the acquisition,
investment management and disposition of new assets acquired by the joint venture.
The following table reflects the assets and liabilities of VIP Borrower, which were not included in the Company’s consolidated balance sheets (in thousands):
|
September 30, |
||||||||
|
2009 |
2008 |
|||||||
|
Restricted cash |
$ | 350 | $ | 130 | ||||
|
Loans held for investment, net |
17,028 | 9,086 | ||||||
|
Total assets |
$ | 17,378 | $ | 9,216 | ||||
|
Accrued expenses and other liabilities |
$ | 2,591 | $ | 31 | ||||
|
Borrowings |
19,068 | 9,213 | ||||||
|
Total liabilities |
$ | 21,659 | $ | 9,244 | ||||
VIEs Previously Consolidated
The Company sold its interests in two VIEs, Apidos CDO VI and LCFF, and no longer consolidates them. The following table reflects the assets and liabilities of these VIEs that the Company included in its consolidated balance sheet at September 30, 2008 (in thousands) (unaudited):
|
Apidos
CDO VI |
LCFF |
|||||||
|
Cash |
$ | − | $ | 1,093 | ||||
|
Restricted cash |
13,737 | 7,006 | ||||||
|
Receivables |
1,164 | − | ||||||
|
Loans held for investment, net |
220,326 | − | ||||||
|
Investments in commercial finance - held for investment, net |
− | 180,873 | ||||||
|
Other assets |
− | 2,953 | ||||||
|
Total assets |
$ | 235,227 | $ | 191,925 | ||||
|
Accrued expenses and other liabilities |
$ | 1,991 | $ | 17,484 | ||||
|
Borrowings (1) |
213,321 | 173,813 | ||||||
|
Total liabilities |
$ | 215,312 | $ | 191,297 | ||||
|
(1) |
Apidos CDO VI senior notes were reflected net of unamortized deferred issuance costs of $4.5 million. |
NOTE 10 − PROPERTY AND EQUIPMENT
Property and equipment, net, consist of the following (in thousands):
|
Estimated Useful |
September 30, |
|||||||||||
|
Lives |
2009 |
2008 |
||||||||||
|
Land |
− | $ | 200 | $ | 200 | |||||||
|
Building |
39 years |
1,666 | 1,666 | |||||||||
|
Leasehold improvements |
1-15 years |
6,185 | 6,228 | |||||||||
|
Real estate assets – consolidated VIE |
40 years |
3,900 | 3,900 | |||||||||
|
Furniture and equipment |
3-10 years |
12,699 | 12,394 | |||||||||
| 24,650 | 24,388 | |||||||||||
|
Accumulated depreciation and amortization |
(11,215 | ) | (7,502 | ) | ||||||||
|
Property and equipment, net |
$ | 13,435 | $ | 16,886 | ||||||||
RESOURCE AMERICA, INC.
NOTES TO CONSOLIDATED FINANCIAL STATEMENTS – (Continued)
SEPTEMBER 30, 2009
NOTE 11 − INTANGIBLE ASSETS
The components of intangible assets consist of the following (in thousands):
|
Estimated Useful |
September 30, |
||||||||||
|
Lives |
2009 |
2008 |
|||||||||
|
Customer lists |
10 years |
$ | 4,727 | $ | 4,727 | ||||||
|
Accumulated amortization |
(1,090 | ) | (398 | ) | |||||||
|
Intangible assets, net |
$ | 3,637 | $ | 4,329 | |||||||
All of the intangible assets have finite lives and, as such, are subject to amortization. Amortization of intangible assets totaled $692,000, $445,000 and $80,000 for fiscal 2009, 2008 and 2007, respectively. Estimated amortization expense of the Company’s intangible assets for the years ending September 30
and thereafter is as follows (in thousands):
|
2010 |
$ | 809 | ||
|
2011 |
836 | |||
|
2012 |
699 | |||
|
2013 |
459 | |||
|
2014 |
310 | |||
|
Thereafter |
524 | |||
| $ | 3,637 |
NOTE 12 – BORROWINGS
The credit facilities and other debt of the Company, as well as those of the VIEs that the Company consolidates, and related borrowings outstanding are as follows (in thousands):
|
As of September 30, |
||||||||||||||||
|
2009 |
2008 |
|||||||||||||||
|
Amount of Facility |
Amount Available |
Borrowings Outstanding |
Borrowings Outstanding |
|||||||||||||
|
Commercial finance: |
||||||||||||||||
|
Secured revolving credit facilities: |
||||||||||||||||
|
PNC Bank |
$ | 150,000 | $ | 13,500 | $ | 136,500 | $ | 128,950 | ||||||||
|
Morgan Stanley |
− | − | − | 140,369 | ||||||||||||
|
LCFF subordinated notes |
− | − | − | 3,416 | ||||||||||||
|
Subtotal − Commercial finance |
$ | 150,000 | 13,500 | 136,500 | 272,735 | |||||||||||
|
Corporate: |
||||||||||||||||
|
Secured revolving credit facilities: |
||||||||||||||||
|
TD Bank |
$ | 26,502 | − | 26,502 | (1) | 43,600 | ||||||||||
|
Sovereign |
14,000 | − | 577 | 7,000 | ||||||||||||
|
Subtotal – Corporate |
$ | 40,502 | − | 27,079 | 50,600 | |||||||||||
|
Senior notes (2) |
10,629 | − | ||||||||||||||
|
Financial fund management: |
||||||||||||||||
|
Apidos CDO VI senior notes, net |
− | 213,321 | ||||||||||||||
|
Other debt |
17,175 | 17,403 | ||||||||||||||
|
Total borrowings outstanding |
$ | 13,500 | $ | 191,383 | $ | 554,059 | ||||||||||
|
(1) |
Does not reflect a $246,000 letter of credit which reduces availability on the TD facility. |
|
(2) |
The Company’s outstanding 12% senior notes are reflected net of an unamortized discount ($4.9 million at September 30, 2009) related to the fair value of the detachable warrants issued with the notes. |
RESOURCE AMERICA, INC.
NOTES TO CONSOLIDATED FINANCIAL STATEMENTS – (Continued)
SEPTEMBER 30, 2009
NOTE 12 – BORROWINGS − (Continued)
Commercial Finance – Secured revolving credit facility.
PNC, N.A. (previously National City Bank)(“PNC Bank”). LEAF has had a revolving warehouse credit facility with a group of banks led by PNC Bank since July 2006. On November 30, 2009, the facility was amended to extend the maturity of the
facility to January 29, 2010 to provide additional time for the negotiation of a new longer-term facility. The amendment reduces the maximum credit facility to $125.0 million on December 30, 2009 and to $115.0 million on January 19, 2010, increases the interest rates on base rate borrowings to the base rate (as defined below) plus 4% and on LIBOR-based borrowings to LIBOR plus 5%, reduces the advance rate and alters certain covenants.
The $150.0 million credit facility was previously amended in July and September 2009. As of November 15, 2009, the facility was reduced to $135.0 million. The July 2009 amendment increased the rate of interest on borrowings outstanding to either (i) the base rate plus 2.75% or (ii) LIBOR plus 3.75%. The
base rate is the higher of (i) the prime rate, as defined or (ii) the Federal Funds Rate plus 0.5% and (iii) the LIBOR plus 1%. Prior to July 31, 2009, interest was charged at one of two rates: (i) LIBOR plus 1.5%, or (ii) the prime rate. The facility is non-recourse to the Company and the underlying equipment being leased or financed collateralizes the borrowings. In September 2007, LEAF entered into a two-year $75.0 million interest rate swap agreement in order to mitigate the
effect of fluctuations in LIBOR. The swap agreement terminated in September 2009. Weighted average borrowings for fiscal 2009 and 2008 were $133.7 million and $136.1 million, respectively, at an effective interest rate of 5.0% and 5.7%, respectively.
Corporate − Secured Revolving Credit Facilities
TD Bank, N.A. (previously Commerce Bank, N.A.) (“TD Bank”). The Company has had a revolving credit facility with TD Bank since May 2007. In November 2009, the facility was amended primarily to (i) extend the maturity date of the facility for
an additional year to October 15, 2011, (ii) decrease the available borrowings to $20.0 million as of November 6, 2009, (iii) reduce the interest rate on the loan to (a) the prime rate of interest plus 3% with a floor of 7% or (b) LIBOR plus 4.5% with a floor of 7.5% and (c) reduce the monthly reduction in maximum credit facility amount from $850,000 to $150,000 per month. The amendment requires the Company to further reduce the maximum revolving credit amount to $15.0 million as of June 30, 2010. In
consideration for these modifications, the Company paid a fee of $345,000 to the lender in lieu of the Company’s obligation to pay a $500,000 fee due from the May 2009 amendment.
The facility was previously amended on May 15, 2009 to (i) extend the maturity to October 15, 2010, (ii) reduce the maximum revolving credit facility amount to $35.0 million (from $45.0 million), (iii) provide for a monthly reduction in the maximum credit facility by $850,000 commencing June 15, 2009, (iv) increase the interest rate on
borrowings to the greater of 10.0% or the prime rate of interest plus 5.0%, (v) eliminate the net worth covenant and (vi) increase the letter of credit fee to 5.25%. In consideration for these modifications, the Company paid a $1.0 million fee to the lender as of the amendment date and was committed, except under certain circumstances, to pay an additional fee of $500,000 in December 2009.
The facility has an unused fee of 0.25% per year, payable quarterly in arrears. Borrowings are secured by a first priority security interest in certain assets of the Company and certain subsidiary guarantors, including (i) the present and future fees and investment income earned in connection with the management of, and investments
in, sponsored CDO issuers, (ii) a pledge of 12,972 shares of TBBK common stock, and (iii) the pledge of 1,491,088 shares of RCC common stock. Availability under the facility is limited to the lesser of (i) 75% of the net present value of future management fees to be earned or (ii) the maximum revolving credit facility amount. Weighted average borrowings for fiscal 2009 and 2008 were $39.6 million and $50.8 million, respectively, at an effective interest rate of 8.7% and 7.0%, respectively. As
of September 30, 2009, borrowings outstanding were $26.5 million and the line was fully utilized.
Through March 25, 2009, interest was charged at one of two rates at the Company’s election: (i) the prime rate plus 1%, or (ii) LIBOR plus 2.25%. From March 26, 2009 to May 15, 2009, the rates increased to: (i) the prime rate plus 2.25%, or (ii) LIBOR plus 3.5%.
Sovereign Bank. The Company has a revolving line of credit with Sovereign Bank with $577,000 of outstanding borrowings as of September 30, 2009. The facility
has expired. We are currently negotiating a long term renewal. The facility is secured by certain investment securities available-for-sale. There was no availability based on the value of the collateral at September 30, 2009. Interest is charged on outstanding borrowings at one of two rates elected at the Company’s option: (i) LIBOR plus 2.0%, or (ii) the prime rate. Weighted average borrowings for fiscal 2009 and 2008 were $3.1 million and $6.0 million,
respectively, at an effective interest rate of 5.1% and 6.7%, respectively.
RESOURCE AMERICA, INC.
NOTES TO CONSOLIDATED FINANCIAL STATEMENTS – (Continued)
SEPTEMBER 30, 2009
NOTE 12 – BORROWINGS − (Continued)
Corporate – Senior Notes
On September 29, 2009, the Company sold $15.6 million of its 12% senior notes due 2012 (the “Senior Notes”) in a private placement to certain senior executives and shareholders of the Company. The Senior Notes require quarterly payments of interest in arrears on March 31, June 30, September 30 and December 31 each
year, beginning December 31, 2009. The Senior Notes were sold with detachable 5-year warrants which provide the purchasers the right to acquire 3,052,940 shares of the Company’s common stock at an exercise price of $5.10 per share. The notes are unsecured, senior obligations and are junior to the Company’s existing and future secured indebtedness. In conjunction with the offering of the Senior Notes, the Company was required to pay down the TD Bank credit facility
with not less than 30% of the proceeds from the offering. On October 6, 2009, the Company completed the offering with the sale of an additional $3.2 million of Senior Notes and detachable warrants to purchase 637,255 shares with the same terms as the original issue. In total, the Company sold $18.8 million of Senior Notes with detachable warrants to purchase 3,690,195 shares. In addition, until all of the Senior Notes are paid in full, retired or repurchased, the Company cannot
declare or pay future quarterly cash dividends in excess of $0.03 per share without the prior approval of all of the holders of the Senior Notes unless basic earnings per common share from continuing operations from the preceding fiscal quarter exceeds $0.25 per share.
The proceeds from the Senior Notes were allocated to the notes and the warrants based on their relative fair values. The Company used a Black-Scholes pricing model to calculate the fair value of the warrants at $4.9 million for the first issuance and $1.0 million for the subsequent issuance. The model included assumptions
regarding the Company’s dividend yield (2.3%), stock price volatility (44.1%) risk-free interest rate (2.3%) and expected life of three years. The Company accounted for the warrants as an increase to additional paid in capital and as a debt discount. The debt discount is being amortized into interest expense over the 3-year term of the Senior Notes using the effective interest method.
Other Debt
Mortgages. In November 2007, in conjunction with the acquisition of Dolphin Capital Corp., the Company entered into a $1.5 million first mortgage due December 2037 on an office building in Moberly, Missouri. The mortgage, with an outstanding balance of $1.5 million
at September 30, 2009 and 2008, has an 8% fixed rate and requires monthly payments of principal and interest of $11,077.
In June 2006, the Company obtained a $12.5 million first mortgage on a hotel property in Savannah, Georgia. The mortgage is due on July 6, 2011, has a 7.1% fixed rate, and requires monthly payments of principal and interest of $84,220. The principal balance as of September 30, 2009 and 2008 was $12.1 million
and $12.3 million, respectively.
As of September 30, 2009 and 2008, a VIE consolidated by the Company, was the obligor under an outstanding first mortgage secured by real estate with an outstanding principal balance of $1.1 million and $1.2 million, respectively. The mortgage requires monthly payments
of principal and interest at a fixed interest rate of 8.8% and matures in July 2014. The mortgage is not a legal obligation of the Company; however, it is senior to the VIE’s obligation to the Company. Mortgage payments are paid from the cash flows of the VIE.
Secured notes. At September 30, 2009 and 2008, the Company also had an outstanding balance of $302,000 and $499,000, respectively, on a secured note with Sovereign Bank. The note, secured by the furniture and computer equipment of the Company’s commercial
finance business, requires monthly payments of principal and interest of $18,796 over five years at a fixed interest rate of 6.9%, maturing in February 2011.
In June 2006, the Company borrowed $1.5 million from JP Morgan under a promissory note for the purchase of its equity investment in a CDO issuer the Company sponsored and manages. The note requires quarterly payments of principal and interest at LIBOR plus 1.0% and matures
in July 2010. The Company’s share of the equity distributions and its share of the collateral management fees from the CDO issuer collateralize the note. The outstanding balance as of September 30, 2009 and 2008 was $375,000 and $750,000, respectively.
Capital leases. The Company has entered into various capital leases for the purchase of equipment. These capital leases have interest rates ranging from 5.4% to 8.6% and terms ranging from three years to
five years. The principal balance of these leases at September 30, 2009 and 2008 was $684,000 and $704,000, respectively.
Term notes. In September 2008, the Company entered into a three-year unsecured term note for $473,000 to finance the purchase of software. The loan requires 36 monthly principal and interest payments
of $14,176. The outstanding balance at September 30, 2009 and 2008 was $323,000 and $473,000, respectively.
RESOURCE AMERICA, INC.
NOTES TO CONSOLIDATED FINANCIAL STATEMENTS – (Continued)
SEPTEMBER 30, 2009
NOTE 12 – BORROWINGS − (Continued)
In August and September 2009, the Company entered into three term notes totaling $971,000 to finance the payment of various insurance policies. The notes are secured by the return premiums, dividend payments and certain loss payments of the insurance policies. The loans require nine monthly principal and interest
payments of $110,614. The principal balance outstanding at September 30, 2009 was $821,000.
Debt repayments. Annual principal payments on the Company’s aggregate borrowings over the next five years ending September 30 and thereafter, based on current collateral contractual obligations, are as follows (in thousands):
|
2010 |
$ | 151,250 | ||
|
2011 |
14,528 | |||
|
2012 |
28,598 | |||
|
2013 |
278 | |||
|
2014 |
271 | |||
|
Thereafter |
1,399 | |||
| $ | 196,324 |
Covenants
The Company’s debt agreements are subject to certain financial covenants which are customary for the type and size of its related debt facilities. The Company was in compliance with all debt covenants as of September 30, 2009.
For the Company’s commercial finance secured revolving credit facility, the covenants include minimum tangible net worth, maximum leverage ratios and interest coverage. The minimum tangible net worth covenants measure the Company’s and LEAF’s equity adjusted for intangibles and components of accumulated other
comprehensive income related to hedge accounting as well as intercompany debt. The maximum leverage covenants restrict the amount LEAF can borrow based on a ratio of the total debt compared to its net worth. Debt services ratios measure LEAF’s ability to service debt.
For the Company’s corporate secured revolving credit facilities, debt covenants include consolidated tangible net worth, debt service coverage ratios and debt to equity ratios. The debt to equity ratio restricts the amount of recourse debt the Company can borrow based on a ratio of recourse debt compared to net worth. The
consolidated tangible net worth covenant measures the Company’s total assets reduced by intangibles, including goodwill and liabilities. Debt service ratios measure the Company’s ability to service its debt.
Facilities Terminated and/or Transferred
Commercial Finance − Morgan Stanley secured revolving credit facility and LCFF subordinated notes. In conjunction with the sale of a portion of LCFF, $187.6 million of debt financing, as described below, was transferred:
|
|
· |
a $250.0 million line of credit with Morgan Stanley. The interest rate was based on one-month LIBOR plus 1.15%. Weighted average borrowings for fiscal 2009 and 2008 were $67.5 million and $130.7 million, respectively, at an effective interest rate of 4.9%, and 6.0%, respectively. The Company utilized interest rate swaps and caps on this facility to mitigate fluctuations in LIBOR;
and |
|
|
· |
$9.4 million of LCFF fixed subordinated notes. Weighted average borrowings for fiscal 2009 and 2008 were $2.6 million and $245,000, respectively, at an effective interest rate of 10.9% and 8.4%, respectively. |
Financial Fund Management – Apidos CDO VI senior notes. Apidos CDO VI issued $218.0 million of its senior notes in December 2007. These notes were non-recourse to the Company and consisted of the following classes/interest rates: (i) $181.5 million
of class A-1 notes at LIBOR plus 0.64%; (ii) $6.0 million of class A-2 notes LIBOR plus 1.25%; (iii) $13.0 million of class B notes at LIBOR plus 2.25%; (iv) $8.0 million of class C notes at LIBOR plus 4.0%; and (v) $9.5 million of class D notes at LIBOR plus 6.75%. For the period prior to the sale of Apidos CDO VI in March 2009, the weighted average interest rate for these notes was 4.6% and 5.6% for fiscal 2009 and 2008, respectively.
RESOURCE AMERICA, INC.
NOTES TO CONSOLIDATED FINANCIAL STATEMENTS – (Continued)
SEPTEMBER 30, 2009
NOTE 13 – COMPREHENSIVE LOSS
Comprehensive loss includes net (loss) income and all other changes in the equity of a business from transactions and other events and circumstances from non-owner sources. These changes, other than net (loss) income, are referred to as “other comprehensive loss” and for the Company include primarily changes in the
fair value, net of tax, of its investment securities available-for-sale and hedging contracts. Other comprehensive loss also includes the Company’s share of unrealized losses on hedging contracts held by the commercial finance investment partnerships.
The following table reflects the changes in comprehensive loss (in thousands):
|
Years Ended September 30, |
||||||||||||
|
2009 |
2008 |
2007 |
||||||||||
|
Net (loss) income |
$ | (14,931 | ) | $ | (26,243 | ) | $ | 3,696 | ||||
|
Other comprehensive (loss) income: |
||||||||||||
|
Unrealized losses on investment securities available-for-sale,
net of tax of $(1,391), $(11,375) and $(11,908) |
(1,584 | ) | (21,134 | ) | (14,027 | ) | ||||||
|
Less: reclassification for losses realized, net of tax of $3,484,
$5,524 and $4,431 |
5,455 | 9,010 | 4,612 | |||||||||
| 3,871 | (12,124 | ) | (9,415 | ) | ||||||||
|
Minimum pension liability adjustment, net of tax of $(673), $(941)
and $(245) |
(569 | ) | (1,680 | ) | (256 | ) | ||||||
|
Less: reclassification for losses realized, net of tax of $84, $0 and $0 |
108 | − | − | |||||||||
| (461 | ) | (1,680 | ) | (256 | ) | |||||||
|
Unrealized losses on hedging contracts, net of tax of $(2,256), $(1,101)
and $(703) |
(1,374 | ) | (1,771 | ) | (732 | ) | ||||||
|
Transfer of interest rate swaps and caps to affiliated entities, net of tax
of $3,574, $0 and $0 |
3,170 | − | − | |||||||||
|
Swap termination due to expiration, net of tax of $233, $0 and $0 |
319 | − | − | |||||||||
|
Foreign currency translation (loss) gain |
(280 | ) | (628 | ) | 924 | |||||||
|
Comprehensive loss |
$ | (9,686 | ) | $ | (42,446 | ) | $ | (5,783 | ) | |||
The changes in accumulated other comprehensive loss (income) by category follows (in thousands):
|
Investment securities available-for-sale |
Cash flow
hedges |
Foreign currency translation adjustments |
SERP
pension liability |
Total |
||||||||||||||||
|
Balance, September 30, 2007, net of tax
of $(4,361), $(703), $0 and $(246) |
$ | (4,538 | ) | $ | (732 | ) | $ | 924 | $ | (256 | ) | $ | (4,602 | ) | ||||||
|
Changes during fiscal 2008 |
(12,124 | ) | (1,771 | ) | (628 | ) | (1,680 | ) | (16,203 | ) | ||||||||||
|
Balance, September 30, 2008, net of tax
of $(10,202), $(1,804), $0 and (1,186) |
(16,662 | ) | (2,503 | ) | 296 | (1,936 | ) | (20,805 | ) | |||||||||||
|
Changes during fiscal 2009 |
3,871 | 2,115 | (280 | ) | (461 | ) | 5,245 | |||||||||||||
|
Balance, September 30, 2009, net of tax
of $(8,119), $(252), $0 and $(1,859) |
$ | (12,791 | ) | $ | (388 | ) | $ | 16 | $ | (2,397 | ) | $ | (15,560 | ) | ||||||
NOTE 14 – DERIVATIVES INSTRUMENTS
The Company’s investments in commercial finance assets are structured on a fixed-rate basis, but the Company’s borrowings through the related bank debt are obtained on a floating-rate basis. As a result, the Company is exposed to risk if interest rates rise, which in turn will increase the Company’s borrowing
costs. In addition, when the Company acquires assets, it bases its pricing in part on the spread it expects to achieve between the interest rate it charges its customers and the effective interest cost the Company will pay when it funds the respective borrowings. Increases in interest rates that increase the Company’s permanent funding costs between the time the assets are originated and the time they are funded could narrow, eliminate or even reverse this spread.
RESOURCE AMERICA, INC.
NOTES TO CONSOLIDATED FINANCIAL STATEMENTS – (Continued)
SEPTEMBER 30, 2009
NOTE 14 – DERIVATIVES INSTRUMENTS – (Continued)
To manage interest rate risk, the Company employs a hedging strategy using derivative financial instruments such as interest rate swaps, which are designated as cash flow hedges. Accordingly, changes in fair value of those derivatives are recorded in Accumulated Other Comprehensive Loss and are subsequently reclassified into
earnings when the hedged forecasted interest payments are recognized in earnings. The Company does not use derivative financial instruments for trading or speculative purposes. The Company manages the credit risk of possible counterparty default in the derivative transactions by dealing exclusively with counterparties with high credit quality.
Before entering into a derivative transaction for hedging purposes, the Company determines whether a high degree of initial effectiveness exists between the change in the value of the hedged forecasted transaction and the change in the value of the derivative from a movement in interest
rates. High effectiveness means that the change in the value of the derivative is expected to provide a high degree of offset against changes in the value of the hedged forecasted transactions caused by changes in interest rate risk. The Company measures the effectiveness of each cash flow hedge throughout the hedge period. Any hedge ineffectiveness on cash flow hedging relationships, as defined by U.S. GAAP, will be recognized in the consolidated statements of operations.
There can be no assurance that the Company’s hedging strategies or techniques will be effective, that profitability will not be adversely affected during any period of change in interest rates, or that the costs of hedging will not exceed the benefits.
As of September 30, 2009, the Company had no hedging contracts. Included in accumulated other comprehensive loss at September 30, 2009 and 2008 is a net unrealized loss of $388,000 (net of tax benefit of $253,000) and $181,000 (net of tax benefit of $132,000) related to
hedging instruments held by LEAF’s investment partnerships in which the Company owns an equity interest. At September 30, 2008, the Company had 13 interest rate swaps and four interest rate caps. All but one of these interest rate swaps and all of the interest rate caps were held by LCFF and were transferred upon its deconsolidation.
NOTE 15 - INCOME TAXES
The following table details the components of the Company's (benefit) provision for income taxes from continuing operations (in thousands):
|
Years Ended September 30, |
||||||||||||
|
2009 |
2008 |
2007 |
||||||||||
|
Current provision: |
||||||||||||
|
Federal |
$ | 2,270 | $ | 336 | $ | 11,015 | ||||||
|
State |
475 | − | 6,304 | |||||||||
|
Deferred benefit |
(13,249 | ) | (16,031 | ) | (14,891 | ) | ||||||
|
Income tax (benefit) provision |
$ | (10,504 | ) | $ | (15,695 | ) | $ | 2,428 | ||||
A reconciliation between the federal statutory income tax rate and the Company's effective income tax rate is as follows:
|
Years Ended September 30, |
||||||||||||
|
2009 |
2008 |
2007 |
||||||||||
|
Statutory tax rate |
35% | 35% | 35% | |||||||||
|
State and local taxes, net of federal benefit |
5 | 5 | 5 | |||||||||
|
Deferred tax assets for net operating losses |
(5) | 1 | (4) | |||||||||
|
Valuation allowance for deferred tax assets |
4 | (4) | (14) | |||||||||
|
Non-deductible compensation |
− | − | 5 | |||||||||
|
Equity compensation expense |
(1) | (1) | 6 | |||||||||
|
Other items |
4 | 3 | (1) | |||||||||
| 42% | 39% | 32% | ||||||||||
Deferred tax assets are provided for the effects of temporary differences between the tax basis of an asset or liability and its reported amount in the consolidated balance sheets. These temporary differences will result in taxable or deductible amounts in future years.
RESOURCE AMERICA, INC.
NOTES TO CONSOLIDATED FINANCIAL STATEMENTS – (Continued)
SEPTEMBER 30, 2009
NOTE 15 - INCOME TAXES − (Continued)
The components of the Company’s deferred tax assets and liabilities are as follows (in thousands):
|
September 30, |
||||||||
|
2009 |
2008 |
|||||||
|
Deferred tax assets related to: |
||||||||
|
Investments in partnership interests |
$ | 7,757 | $ | 11,013 | ||||
|
Capital loss carryforwards |
11,743 | − | ||||||
|
Unrealized loss on investments |
11,955 | 14,827 | ||||||
|
Provision for credit losses |
1,670 | 8,349 | ||||||
|
Foreign, state and local loss carryforwards |
6,533 | 6,909 | ||||||
|
Employee stock options and restricted stock awards |
4,653 | 3,752 | ||||||
|
Accrued expenses |
− | 1,213 | ||||||
|
Investments in real estate assets |
2,310 | 422 | ||||||
|
Gross deferred tax assets |
46,621 | 46,485 | ||||||
|
Less: valuation allowance |
(965 | ) | (2,018 | ) | ||||
|
Total deferred tax assets, net |
$ | 45,656 | $ | 44,467 | ||||
|
Deferred tax liabilities related to: |
||||||||
|
Accrued expenses |
$ | (484 | ) | $ | − | |||
|
Property and equipment basis differences |
(1,562 | ) | (1,060 | ) | ||||
|
Total deferred tax liabilities |
$ | (2,046 | ) | $ | (1,060 | ) | ||
The tax rates used to determine deferred tax assets or liabilities are the enacted tax rates in effect for the year in which the differences are expected to reverse. The future realization of deferred tax assets is dependent upon the generation of future taxable income during
the periods in which those temporary differences become deductible. The Company continually evaluates its ability to realize the tax benefits associated with deferred tax assets by analyzing forecasted taxable income using both historical and projected future operating results, the reversal of existing temporary differences, taxable income in prior carryback years (if permitted) and the availability of tax planning strategies. A valuation allowance is required to be established unless management determines
that it is more likely than not that the Company will ultimately realize the tax benefit associated with a deferred tax asset.
The Company is subject to examination by the U.S. Internal Revenue Service (“IRS”) and by the taxing authorities in states in which the Company has significant business operations, such as Pennsylvania and New York. The Company is not currently undergoing any
examinations by taxing authorities. The Company is not subject to IRS examination for fiscal years before 2006 and is not subject to state and local income tax examinations for fiscal years before 2003.
At September 30, 2009, the Company had foreign, state and local net operating tax loss carryforwards ("NOLs") of $80.7 million that will expire between fiscal 2010 and 2030. The Company believes it will be able to utilize up to $60.2 million of these NOLs (tax effected benefit
of $5.6 million) prior to their expiration; therefore, it has established a gross valuation allowance of $20.5 million (tax effected expense of $965,000). Management will continue to assess its estimate of the amount of NOLs that the Company will be able to utilize. Furthermore, its estimate of the required valuation allowance could be adjusted in the future if projections of taxable income are revised. Management believes the other net deferred tax assets will be realized based on projected
future taxable income during the periods in which these temporary differences become deductible.
Effective October 1, 2007, the Company adopted the FASB guidance on accounting for uncertainties in income taxes, which prescribes that a tax position should only be recognized if it is more likely than not that the position will be sustained upon examination by the appropriate taxing
authority. A tax position that meets this threshold is measured as the largest amount of benefit that is greater than 50 percent likely of being realized upon ultimate settlement. The Company is required to disclose its accounting policy for classifying interest and penalties, the amount of interest and penalties charged to expense each period as well as the cumulative amounts recorded in the consolidated balance sheets. The Company will continue to classify any tax penalties
as general and administrative expenses and any interest as interest expense. The Company does not have any unrecognized tax benefits that would affect the effective tax rate.
RESOURCE AMERICA, INC.
NOTES TO CONSOLIDATED FINANCIAL STATEMENTS – (Continued)
SEPTEMBER 30, 2009
NOTE 16 – EARNINGS (LOSS) PER SHARE
The following table presents a reconciliation of the components used in the computation of Basic and Diluted EPS (in thousands):
|
Years Ended September 30, |
||||||||||||
|
2009 |
2008 |
2007 |
||||||||||
|
Shares (1) |
||||||||||||
|
Basic shares outstanding |
17,835 | 17,518 | 17,467 | |||||||||
|
Dilutive effect of equity award plans |
− | − | 1,618 | |||||||||
|
Dilutive shares outstanding |
17,835 | 17,518 | 19,085 | |||||||||
|
(1) |
For fiscal 2009, 2008 and 2007, the following were antidilutive and, therefore, excluded from the computation of Diluted EPS: (i) outstanding options to purchase 1,056,000, 982,000 and 527,000 shares of common stock at a weighted average price of $32.53, $29.84 and $17.84 per share, respectively, and (ii) 385,000, 555,000 and 200,000 shares of nonvested restricted stock at a weighted average price of $14.44, $15.53
and $23.17 per share, respectively. The option exercise prices and the restricted stock grant date prices for these equity awards were greater than the average market price of the Company’s common stock for the respective periods. |
NOTE 17 - BENEFIT PLANS
Employee stock options. During fiscal 2009, the Company had four employee stock plans: the 1997 Plan, the 1999 Plan, the 2002 Plan and the 2005 Plan. Grants generally become exercisable 25% per year after
the date of grant but may vest immediately at management’s discretion and expire no later than ten years after the date of grant.
The Company’s employee stock plans allow for grants of the Company’s common stock in the form of incentive stock options (“ISOs”), non-qualified stock options, and stock appreciation rights. Under the 2005 Plan, the Company may also grant restricted
stock, stock units, performance shares, stock awards, dividend equivalents and other stock-based awards. The Company does not record a tax benefit for options at the grant date since the options it issues are generally ISOs and employees have typically held the stock received on exercise for the requisite holding period.
No options were granted during fiscal 2009. In fiscal 2008 and 2007, the Company granted 102,000 and 57,500 employee stock options, respectively, and computed their fair value as of the grant date using the Black-Scholes option pricing model with the following assumptions:
|
Years Ended September 30, |
||||||||
|
2008 |
2007 |
|||||||
|
Fair value of stock options granted |
$ | 3.49 | $ | 10.50 | ||||
|
Expected life (years) |
6.3 | 6.3 | ||||||
|
Expected stock volatility |
47.4% | 30.1% | ||||||
|
Risk-free interest rate |
3.9% | 4.9% | ||||||
|
Dividend yield |
2.9% | 1.8% | ||||||
At September 30, 2009, 2008 and 2007, the Company had unamortized compensation expense related to unvested stock options of $453,000, $1.1 million and $1.8 million, respectively, which is expected to be amortized over a weighted average period of 1.4 years as of September 30, 2009. For
fiscal 2009, 2008 and 2007, the Company recorded compensation expense of $613,000, $1.0 million and $934,000, respectively.
Restricted stock. During fiscal 2009, 2008 and 2007, the Company issued 225,839, 505,817 and 137,446 shares of restricted stock, respectively, valued at $828,000, $6.8 million and $3.5 million, respectively. Most
of the Company’s restricted shares vest 25% annually commencing one year from the grant date. For fiscal 2009, 2008 and 2007, the Company recorded compensation expense related to restricted stock awards of $3.4 million, $3.4 million and $1.0 million, respectively, of which $600,000, $468,000 and $0 related to accelerated vesting for certain terminated employees in fiscal 2009, 2008 and 2007, respectively.
RESOURCE AMERICA, INC.
NOTES TO CONSOLIDATED FINANCIAL STATEMENTS – (Continued)
SEPTEMBER 30, 2009
NOTE 17 - BENEFIT PLANS − (Continued)
In April 2009, LEAF granted 215,000 shares of its restricted stock valued at $189,000, of which 50% vested immediately, and 25% will vest at one and two years after the grant date. These shares were issued from the 300,000 of restricted shares that LEAF had repurchased in December 2008.During
fiscal 2007 and 2006, LEAF issued 135,000 and 300,000 shares of its restricted stock, respectively, valued at $39,000 and $69,000, respectively. Additionally, in March 2007, a majority-owned subsidiary of LEAF issued 8% of its units valued at $53,000. The Company recorded compensation expense related to the LEAF restricted stock and subsidiary units during fiscal 2009, 2008 and 2007 of $142,000, $17,000 and $69,000, respectively.
Performance-based awards. During fiscal 2009 and 2008, the Company awarded 100,000 and 222,203 shares of restricted stock, respectively, that will be earned based on the achievement of certain performance goals over
the respective performance periods. These goals include such measures as earnings per share, return on equity, revenues and assets under management. As of September 30, 2009, the remaining number of stock units that may be earned based on attainment of these performance goals is 260,364 units based on management’s assessment of obtaining the performance goals. The Company has recorded compensation expense of $113,000 during fiscal 2009 relative to these awards. No
compensation expense was recorded in fiscal 2008 or 2007 for performance shares.
|
Restricted stock – unearned performance awards |
Shares | |||
|
Outstanding, beginning of year |
604,203 | |||
|
Awarded |
100,000 | |||
|
Issued |
(20,625 | ) | ||
|
Forfeited |
(423,214 | ) | ||
|
Outstanding, end of year |
260,364 | |||
|
Nonvested restricted performance stock |
||||
|
Outstanding, beginning of year |
− | |||
|
Awarded |
41,214 | |||
|
Issued |
(20,625 | ) | ||
|
Forfeited |
− | |||
|
Outstanding, end of year |
20,589 | |||
Aggregate information regarding the Company’s employee stock options as of September 30, 2009 is as follows:
|
Weighted |
Weighted |
|||||||||||||||
|
Average |
Average |
Aggregate |
||||||||||||||
|
Exercise |
Contractual |
Intrinsic |
||||||||||||||
|
Stock Options Outstanding |
Shares |
Price |
Life |
Value |
||||||||||||
|
Balance, beginning of year |
3,373,199 | $ | 8.49 | |||||||||||||
|
Granted |
− | $ | − | |||||||||||||
|
Exercised |
− | $ | − | |||||||||||||
|
Forfeited |
(834,583 | ) | $ | (6.82 | ) | |||||||||||
|
Balance, end of year |
2,538,616 | $ | 9.04 | 4.0 | $ | 1,325,000 | ||||||||||
|
Exercisable, September 30, 2009 |
2,434,679 | $ | 9.04 | |||||||||||||
|
Available for grant |
449,865 | (1) | ||||||||||||||
|
(1) |
Reduced for restricted stock awards granted, net of forfeitures, under the Company’s 2005 Plan. |
RESOURCE AMERICA, INC.
NOTES TO CONSOLIDATED FINANCIAL STATEMENTS – (Continued)
SEPTEMBER 30, 2009
NOTE 17 - BENEFIT PLANS − (Continued)
The following table summarizes the activity for nonvested employee stock options and restricted stock during fiscal 2009:
|
Shares |
Weighted Average Grant Date
Fair Value |
|||||||
|
Nonvested Stock Options |
||||||||
|
Outstanding, beginning of year |
260,185 | $ | 6.23 | |||||
|
Granted |
− | $ | − | |||||
|
Vested |
(145,184 | ) | $ | (6.84 | ) | |||
|
Exercised |
− | $ | − | |||||
|
Forfeited |
(11,063 | ) | $ | − | ||||
|
Outstanding, end of year |
103,938 | $ | 5.47 | |||||
|
Nonvested Restricted Stock |
||||||||
|
Outstanding, beginning of year |
612,934 | $ | 15.29 | |||||
|
Granted |
225,839 | $ | 3.67 | |||||
|
Vested |
(276,597 | ) | $ | (13.75 | ) | |||
|
Forfeited |
(9,715 | ) | $ | (14.55 | ) | |||
|
Outstanding, end of year (1) |
552,461 | $ | 11.32 | |||||
|
(1) |
At September 30, 2009, includes 69,300 shares of nonvested restricted stock that do not have dividend equivalent rights and, therefore, are not included in the shares outstanding in the consolidated balance sheets. |
Deferred stock and deferred compensation plans. In addition to the employee stock plans, the Company has two plans for its non-employee directors (“Eligible
Directors”), the 1997 Non-Employee Director Deferred Stock and Deferred Compensation Plan (the “1997 Director Plan”) and the 2002 Non-Employee Director Deferred Stock and Deferred Compensation Plan (the “2002 Director Plan”). Each unit granted under these plans represents the right to receive one share of the Company’s common stock.
The 1997 Director Plan has issued all of its authorized 173,450 units. As of September 30, 2009 and 2008, there were 104,070 units vested and outstanding under this plan.
Eligible Directors are eligible to participate in the 2002 Director Plan. Upon becoming a director, each Eligible Director receives units equal to a share compensation amount divided by the closing price of the Company’s common stock on the date of grant. Eligible
Directors receive an additional unit award on each anniversary of the date of initial grant equal to their share compensation divided by the closing price of the Company’s common stock on the date of grant. Units vest on the later of: (i) the fifth anniversary of the date the recipient became an Eligible Director and (ii) the first anniversary of the grant of those units, except that units will vest sooner upon a change in control or death or disability of an Eligible Director, provided the Eligible
Director has completed at least six months of service. Upon termination of service by an Eligible Director, shares of common stock are issued for vested units and all nonvested units are forfeited. The 2002 Director Plan provides for the issuance of 173,450 units and terminates on April 29, 2012. As of September 30, 2009, there were 87,202 units outstanding of which 43,686 were vested.
Aggregate information regarding the Company’s two director plans at September 30, 2009 is as follows:
|
Director Units |
Shares |
Weighted Average Grant Date
Fair Value |
||||||
|
Outstanding, beginning of year |
158,640 | $ | 7.15 | |||||
|
Granted |
32,635 | $ | 4.14 | |||||
|
Shares issued upon termination |
− | $ | − | |||||
|
Forfeited |
− | $ | − | |||||
|
Outstanding, end of year |
191,275 | $ | 6.63 | |||||
|
Vested units |
147,756 | $ | 6.51 | |||||
|
Available for grant |
65,251 | |||||||
RESOURCE AMERICA, INC.
NOTES TO CONSOLIDATED FINANCIAL STATEMENTS – (Continued)
SEPTEMBER 30, 2009
NOTE 17 - BENEFIT PLANS − (Continued)
The following table summarizes the activity for outstanding nonvested director units during fiscal 2009:
|
Nonvested Director Units |
Shares |
Weighted Average Grant Date
Fair Value |
||||||
|
Outstanding, beginning of year |
18,561 | $ | 12.92 | |||||
|
Granted |
32,635 | $ | 4.14 | |||||
|
Vested |
(7,677 | ) | $ | (8.79 | ) | |||
|
Forfeited |
− | $ | − | |||||
|
Outstanding, end of year |
43,519 | $ | 8.61 | |||||
Employee Stock Ownership Plan. The Company sponsors an Employee Stock Ownership Plan ("ESOP"), which is a qualified non-contributory retirement plan established to acquire shares of the Company's common stock for the benefit of its employees who are 21 years of age or
older and have completed 1,000 hours of service for the Company. Contributions to the ESOP are funded by the Company as set forth in the plan. Additional contributions can be made at the discretion of the Board of Directors. On an annual basis, the plan trustee released a portion of the common stock held by the Plan to participants’ accounts. The ESOP used a loan from the Company which it used to acquire 105,000 shares of the Company's common stock. The
loan was resolved in fiscal 2008 and all shares held by the Plan were allocated to participants accounts. Compensation expense related to the plan was $0, $497,000 and $108,000 for fiscal 2009, 2008 and 2007, respectively. Vested shares held by the plan are distributed upon the termination of the participant’s employment with the Company or upon the termination of the ESOP.
In December 2008, the Company filed an application under the voluntary correction program with the IRS in order to correct certain compliance errors that were made with respect to the ESOP. Additionally, the Company is in the process of negotiating a settlement with the U.S. Department of Labor (“DOL”) to reduce
penalties related to the filing of the annual report for the ESOP for fiscal 2007. Finally, the DOL is auditing the ESOP and the Resource America, Inc. Investment Savings Plan. The impact to the Company with respect to these matters has not yet been determined.
Investment Savings Plan. The Company sponsors an Investment Savings Plan under Section 401(k) of the Internal Revenue Code which allows employees to defer up to 15% of their income, subject to certain limitations, on a pre-tax basis through contributions to the savings
plan. The Company matches up to 50% of each employee's contribution, subject to certain limitations. The Company recorded compensation expense of $951,000, $968,000 and $573,000 for matching contributions for fiscal 2009, 2008 and 2007, respectively.
Supplemental Employment Retirement Plan (“SERP”). The Company established a SERP, which has Rabbi and Secular Trust components, for Edward E. Cohen (“E. Cohen”). The Company pays an annual benefit equal to $838,000 payable during his
life or for a period of 10 years from June 2004, whichever is longer. The Company holds 123,719 shares of TBBK common stock as well as other equity securities with an aggregate value of $850,000 and $1.0 million at September 30, 2009 and 2008, respectively, to support the Rabbi Trust component of the SERP.
The components of net periodic benefit costs for the SERP were as follows (in thousands):
|
Years Ended September 30, |
||||||||||||
|
2009 |
2008 |
2007 |
||||||||||
|
Interest cost |
$ | 484 | $ | 499 | $ | 518 | ||||||
|
Expected return on plan assets |
(53 | ) | (190 | ) | (210 | ) | ||||||
|
Amortization of unrecognized loss |
192 | − | − | |||||||||
|
Net cost |
$ | 623 | $ | 309 | $ | 308 | ||||||
RESOURCE AMERICA, INC.
NOTES TO CONSOLIDATED FINANCIAL STATEMENTS – (Continued)
SEPTEMBER 30, 2009
NOTE 17 - BENEFIT PLANS − (Continued)
The reconciliation of the beginning and ending balances in benefit obligation and fair value of plan assets, comprised entirely of equity securities, as well as the funded status of the Company’s SERP liability is as follows (in thousands):
|
September 30, |
||||||||
|
2009 |
2008 |
|||||||
|
Projected benefit obligation, beginning of year |
$ | 6,472 | $ | 6,649 | ||||
|
Interest cost |
484 | 499 | ||||||
|
Actuarial loss |
1,368 | 162 | ||||||
|
Benefit payments |
(838 | ) | (838 | ) | ||||
|
Projected benefit obligation, end of year |
$ | 7,486 | $ | 6,472 | ||||
|
Fair value of plan assets, beginning of year |
$ | 884 | $ | 3,154 | ||||
|
Actual gain (loss) on plan assets |
95 | (2,270 | ) | |||||
|
Fair value of plan assets, end of year |
$ | 979 | $ | 884 | ||||
|
Unfunded status |
$ | (6,507 | ) | $ | (5,588 | ) | ||
|
Unrecognized net actuarial loss |
4,256 | 3,122 | ||||||
|
Net accrued cost |
$ | (2,251 | ) | $ | (2,466 | ) | ||
|
Amounts recognized in the consolidated balance sheets consist of: |
||||||||
|
Accrued benefit liability |
$ | (6,507 | ) | $ | (5,588 | ) | ||
|
Accumulated other comprehensive loss |
2,397 | (1) | 1,936 | (1) | ||||
|
Deferred tax assets |
1,859 | 1,186 | ||||||
|
Net liability recognized |
$ | (2,251 | ) | $ | (2,466 | ) | ||
|
(1) |
The estimated net loss for the plan that is expected to be amortized from accumulated other comprehensive loss into net periodic pension benefit cost over the next fiscal year is $273,000. The unrealized loss included in accumulated other comprehensive loss related to the SERP was $2.4 million and $1.9 million as of September 30, 2009 and 2008, respectively. |
The SERP is expected to make benefit payments based on the same assumptions used to measure the Company’s benefit obligation at September 30, 2009 (8% discount rate, 6% expected return on assets) as follows (in thousands):
|
2010 |
$ | 828 | ||
|
2011 |
807 | |||
|
2012 |
785 | |||
|
2013 |
761 | |||
|
2014 |
735 | |||
|
Thereafter |
2,043 |
RESOURCE AMERICA, INC.
NOTES TO CONSOLIDATED FINANCIAL STATEMENTS – (Continued)
SEPTEMBER 30, 2009
NOTE 18 - CERTAIN RELATIONSHIPS AND RELATED PARTY TRANSACTIONS
In the ordinary course of its business operations, the Company has sponsored and manages investment entities. Additionally, it has ongoing relationships with several related entities. The following table details these receivables and payables (in thousands):
|
September 30, |
||||||||
|
2009 |
2008 |
|||||||
|
Receivables from managed entities and related parties, net: |
||||||||
|
Commercial finance investment entities (1) |
$ | 36,285 | $ | 22,844 | ||||
|
Financial fund management investment entities |
3,523 | 4,151 | ||||||
|
Real estate investment entities |
10,905 | 6,563 | ||||||
|
RCC |
4,101 | 1,870 | ||||||
|
Other |
233 | 246 | ||||||
|
Receivables from managed entities and related parties |
$ | 55,047 | $ | 35,674 | ||||
|
Payables due to managed entities and related parties, net: |
||||||||
|
Real estate investment entities |
$ | 1,284 | $ | 316 | ||||
|
Other |
− | 270 | ||||||
|
Payables to managed entities and related parties |
$ | 1,284 | $ | 586 | ||||
|
(1) |
Reflects the $263,000 discount recorded in fiscal 2009 in connection with management fees and reimbursed expenses that the Company expects to receive in the future. |
The Company receives fees, dividends and reimbursed expenses from several related/managed entities. In addition, the Company reimburses another related entity for certain operating expenses. The following table details those activities (in thousands):
|
Years Ended September 30, |
||||||||||||
|
2009 |
2008 |
2007 |
||||||||||
|
Financial fund management - fees from managed entities (1) |
$ | 3,105 | $ | 7,996 | (2) | $ | 13,215 | |||||
|
Real estate - fees from investment entities (3) |
11,343 | 9,407 | 9,216 | |||||||||
|
Commercial finance - fees from investment entities (4) |
20,168 | 35,193 | 17,048 | |||||||||
|
RCC: |
||||||||||||
|
Management, incentive and servicing fees |
8,181 | 7,480 | 8,963 | |||||||||
|
Reimbursement of expenses |
600 | 636 | 1,938 | |||||||||
|
Dividends |
3,405 | 2,421 | 3,173 | |||||||||
|
Commitment fee |
180 | − | − | |||||||||
|
Atlas Energy - reimbursement of net costs and expenses |
1,369 | 1,269 | 1,114 | |||||||||
|
1845 Walnut Associates Ltd. - payment of rent and
operating expenses |
(475 | ) | (549 | ) | (492 | ) | ||||||
|
9 Henmar LLC - payment of broker and consulting fees |
(81 | ) | (417 | ) | (455 | ) | ||||||
|
Ledgewood P.C. - payment of fees for legal services |
(549 | ) | (1,255 | ) | (521 | ) | ||||||
|
Anthem Securities: |
||||||||||||
|
Payment of broker-dealer expenses |
− | − | (826 | ) | ||||||||
|
Reimbursement of costs and expenses |
− | − | 688 | |||||||||
|
(1) |
For fiscal 2009, excludes a $1.7 million reduction in the Company’s clawback liability associated with two Trapeza partnerships. For fiscal 2008 and 2007, excludes the non-cash incentive fee on the unrealized depreciation in the book value of Trapeza partnership securities totaling $11.2 million and $1.6 million, respectively. |
|
(2) |
Reflects a $2.3 million discount recorded in fiscal 2008 in connection with subordinate and incentive management fees that the Company expects to receive in the future. |
|
(3) |
Reflects discounts of $394,000 and $956,000 recorded in fiscal 2009 and 2008, respectively, in connection with management fees that the Company expects to receive in the future. |
|
(4) |
In 2009, the Company waived $425,000 of fund management fees from one of its investment entities. |
RESOURCE AMERICA, INC.
NOTES TO CONSOLIDATED FINANCIAL STATEMENTS – (Continued)
SEPTEMBER 30, 2009
NOTE 18 - CERTAIN RELATIONSHIPS AND RELATED PARTY TRANSACTIONS − (Continued)
Relationship with RCC. On June 30, 2009, one of the LEAF investment partnerships acquired net assets of $89.8 million, primarily a pool of leases, and assumed $82.3 million in related debt from a subsidiary of RCC. No gain or loss was recognized by any of the parties on
the acquisition or sale. In relation to this transaction, the Company owed $7.5 million to RCC under a promissory note bearing interest at LIBOR plus 3%. In addition, the Company was due $3.0 million from the investment partnership for this transaction. The note was repaid in full to RCC and the Company received full repayment from the investment partnership in August 2009.
On May 14, 2009, the Company loaned RCC $4.5 million. RCC repaid the loan the same day and paid the Company a commitment fee of $180,000.
LEAF originated and manages commercial finance assets on behalf of RCC. The leases and loans were sold to RCC at fair value plus an origination fee of 1%. LEAF sold $6.1 million, $59.1 million and $25.6 million of leases and loans to RCC during fiscal 2009, 2008 and 2007, respectively. In addition, from
time to time, LEAF repurchased leases and loans from RCC at a price equal to their fair value as an accommodation under certain circumstances, which included the consolidation of multiple customer accounts, originations of new leases when equipment was upgraded and to facilitate the timely resolution of problem accounts when collection was considered likely. During fiscal 2009, 2008 and 2007, LEAF repurchased $1.4 million, $9.0 million and $9.1 million, respectively, of leases and loans from RCC.
Since March 2005, the Company has had a management agreement with RCC pursuant to which it provides certain services, including investment management and certain administrative services to RCC. The agreement, which had an original maturity date of March 31, 2009, continues to automatically renew for one-year terms unless at
least two-thirds of the independent directors or a majority of the outstanding common shares agree to not renew it. The agreement was amended June 30, 2008 to revise the incentive compensation. The Company receives a base management fee, incentive compensation and a reimbursement for out-of-pocket expenses. The base management fee is equal to 1/12th of the amount of RCC’s equity, as defined by
the Management Agreement, multiplied by 1.50%. The incentive compensation, as defined, was amended in June 2008. In October 2009, the management agreement was further amended such that RCC will directly reimburse the Company for the wages and benefits for its Chief Financial Officer and three accounting professionals, each of whom will be exclusively dedicated to the operations of RCC and a director of investor relations who will be 50% dedicated to RCC's operations.
Relationship with 1845 Walnut Associates Ltd. The Company owns a 5% investment in a real estate partnership that owns a building at 1845 Walnut Street, Philadelphia in which the Company also leases office space. In February 2009, the Company amended its lease
for its offices in this building to extend the lease termination date through May 2013, with an option to extend the term for up to 15 additional years. The property is managed by another related party, Brandywine Construction and Management, Inc. (“BCMI”), as further described below.
Relationship with certain directors, officers, employees and other related parties. The Company serves as the general partner of six partnerships, one of which is currently in the offering stage, that invest in regional domestic banks. The general partner may
receive a carried interest of up to 20% upon meeting specific investor return rates. Some of the partnerships’ investors wanted to ensure that certain individuals who are critical to the success of the partnerships participate in the carried interest. The total participation authorized by the Company’s compensation committee was 48.5% of the 20% carried interest, of which E. Cohen, Betsy Z. Cohen (“B. Cohen” - wife of E. Cohen) and Jonathan Z. Cohen (“J. Cohen”
- the President and CEO of the Company, and son of E. and B. Cohen) are entitled to receive 10%, 5% and 2.5%, respectively. The remaining 31% is entitled to be received by seven individuals, three of whom are employees of the Company. No carried interest has been earned by any of the individuals.
Relationship with retirement trusts. The Company has established two trusts to fund the SERP for E. Cohen. The 1999 Trust, a secular trust, purchased 100,000 shares of the common stock of TBBK ($572,000
fair value at September 30, 2009). This trust and its assets are not included in the Company’s consolidated balance sheets. However, trust assets are considered in determining the amount of the Company’s liability under the SERP. The 2000 Trust, a “Rabbi Trust,” holds 123,719 shares of common stock of TBBK carried at fair value ($708,000 at September 30, 2009) and other marketable securities. The carrying value of the assets in the 2000 Trust
was approximately $1.6 million and $1.7 million at September 30, 2009 and 2008, respectively. These assets are included in other assets in the Company’s consolidated balance sheets. The Company’s SERP liability of $6.5 million is included in accrued expenses and other liabilities in the consolidated balance sheets.
RESOURCE AMERICA, INC.
NOTES TO CONSOLIDATED FINANCIAL STATEMENTS – (Continued)
SEPTEMBER 30, 2009
NOTE 18 - CERTAIN RELATIONSHIPS AND RELATED PARTY TRANSACTIONS − (Continued)
In April 2001, the 2000 Trust acquired a loan to a limited partnership in which E. Cohen and Daniel Cohen (“D. Cohen,” the son of E. and B. Cohen and the brother of J. Cohen), own the beneficial interests for its outstanding balance from a corporation in which E. Cohen was the chairman and J. Cohen was the president. In
February 2008, the Company received full repayment of the loan.
Relationship with Atlas Energy. On June 30, 2005, the Company completed the spin-off of its subsidiary, Atlas Energy. E. Cohen is chairman of the board and CEO of Atlas Energy and J. Cohen is its vice chairman. Pursuant
to a master separation and distribution agreement, Atlas Energy reimburses the Company for various costs and expenses it continues to incur on behalf of Atlas Energy, primarily payroll and rent. At September 30, 2009, the Company has a $219,000 receivable balance from Atlas Energy.
Relationship with Anthem Securities, Inc. (“Anthem”). Anthem, a wholly-owned subsidiary of Atlas Energy and a registered broker-dealer, served until the second quarter of fiscal 2007 as the dealer-manager
of investment programs sponsored by the Company’s real estate and commercial finance segments. Some of the personnel performing services for Anthem were on the Company’s payroll and Anthem reimbursed the Company for the allocable costs of such personnel. In addition, the Company had agreed to cover some of the operating costs for Anthem’s office of supervisory jurisdiction, principally licensing fees and costs. Beginning with the second quarter of fiscal 2007,
the Company commenced its own broker-dealer operations and ceased using the services of Anthem.
Transaction with Cohen & Company. In May 2008, the Company received a fee of $231,000 for acting as the introducing agent for a transaction in which Cohen & Company purchased securities from an investment bank. D.
Cohen is the chairman of Cohen & Company.
Relationship with 9 Henmar LLC (“9 Henmar”). The Company owns interests in the Trapeza entities that have sponsored CDO issuers and manage pools of trust preferred securities acquired by the CDO issuers. The
Trapeza entities and CDO issuers were originated and developed in large part by D. Cohen. The Company agreed to pay D. Cohen’s company, 9 Henmar, 10% of the fees the Company receives, before expenses, in connection with the first four Trapeza CDOs that the Company sponsored and manages. In fiscal 2009, 2008 and 2007, the Company paid 9 Henmar $81,000, $417,000 and $455,000, respectively.
Relationship with The Bancorp, Inc. In fiscal 2009 and 2007, the Company sold 99,318 and 240,000, respectively, of its shares of TBBK common stock for $601,000 and $5.8 million, respectively, and realized a loss of
$393,000 and a gain of $3.5 million, respectively. The Company did not sell any of its TBBK stock holdings in fiscal 2008. D. Cohen is the chairman of the board and B. Cohen is the CEO of TBBK and its subsidiary bank. On June 15, 2007, Merit (a subsidiary of LEAF) entered into an agreement with TBBK under which TBBK provides banking and operational services for Merit. During fiscal 2009, 2008 and 2007, Merit paid $57,000, $76,000 and $6,000, respectively, in fees to
TBBK. Additionally, the Company had $98,000 and $217,000 in deposit accounts at TBBK at September 30, 2009 and 2008, respectively.
Relationship with RAIT Financial Trust (“RAIT”) (NYSE: RAS). On March 30, 2007, the Company purchased a trust preferred security issued by an unrelated third-party from RAIT for $19.7 million and sold the security to a warehouse facility for $20.0 million,
thereby recognizing a gain of $300,000. B. Cohen is the chairman and D. Cohen is a trustee of RAIT.
Relationship with Brandywine Construction & Management, Inc. (“BCMI”). BCMI manages the properties underlying three of the Company’s real estate loans and certain real estate assets. Adam
Kauffman, president of BCMI, or an entity affiliated with him, has also acted as the general partner, president or trustee of two of the borrowers of the loans. E. Cohen is the chairman of BCMI.
During fiscal 2009, the Company paid a $90,000 fee to BCMI in connection with the final resolution of one of its legacy assets.
RESOURCE AMERICA, INC.
NOTES TO CONSOLIDATED FINANCIAL STATEMENTS – (Continued)
SEPTEMBER 30, 2009
NOTE 18 - CERTAIN RELATIONSHIPS AND RELATED PARTY TRANSACTIONS − (Continued)
In March 2008, the Company sold a 19.99% interest in an indirect subsidiary that holds a hotel property in Savannah, Georgia to a limited liability company owned by Adam Kauffman for $1.0 million plus $130,000 in fees and recognized a gain of $612,000. The terms of the sale agreement provide for a purchase option by Mr. Kauffman
to purchase up to the balance of the Company’s interest in the hotel for $50,000 per 1% interest purchased. The purchase option expires in July 2011; thereafter, Mr. Kauffman has a right-of-first-offer to purchase the balance of the Company’s interest in the hotel. In May 2007, the Company foreclosed on a property owned by a borrower of which A. Kaufman was the general partner. The Company thereafter sold the property to an unrelated third-party and recognized a $300,000
gain on the sale.
Relationship with Ledgewood P.C. (“Ledgewood”). Until March 2006, Jeffrey F. Brotman was the managing member of Ledgewood, which provides legal services to the Company. Mr. Brotman remained
of counsel to Ledgewood through June 2007, at which time he became an Executive Vice President of the Company. In addition, Mr. Brotman was a trustee of the SERP retirement trusts until he joined the Company. In connection with his separation, Mr. Brotman will receive payments from Ledgewood through 2013.
Until April 1996, E. Cohen was of counsel to Ledgewood. E. Cohen receives certain debt service payments from Ledgewood related to the termination of his affiliation with Ledgewood and its redemption of his interest in the firm.
Transactions between LEAF and its Investment Entities. LEAF originates and manages commercial finance assets on behalf of its investment entities for which it also is the general partner. The commercial
finance assets are sold to these entities at fair value plus an origination fee not to exceed 2%. During fiscal 2009, 2008 and 2007, LEAF sold $275.2 million, $1.2 billion and $562.2 million, respectively, of commercial finance assets to its investment entities. In addition, from time to time LEAF repurchases commercial finance assets from its investment entities in the same manner as it does from RCC. During fiscal 2009, 2008 and 2007, LEAF repurchased $1.2 million, $1.4 million
and $1.7 million, respectively, of commercial finance assets from its investment entities at a price equal to their fair value.
Evening Star (“ESA”). In fiscal 2008, the Company collected $18.4 million in connection with the substantial settlement of a discounted loan, which was secured by the ESA office building in Washington, D.C. D. Cohen owned a 15% partnership interest
in ESA which secured the original discounted note and had a right-of-first-offer and a right-of-first-refusal (“Rights”) on a sale of the property. In conjunction with the settlement of the ESA loan in July 2008, D. Cohen sold his interest to the 80% partner in ESA for $19.5 million. In connection with the repayment of the loan, D. Cohen was paid $625,000 to relinquish his Rights.
Transactions with real estate investment entities. During fiscal 2008, the Company loaned affiliated real estate limited partnerships approximately $9.0 million to facilitate acquisitions. Interest paid to the Company by these
affiliated partnerships during fiscal 2008 totaled approximately $76,000. The partnerships repaid these loans in full as they raised equity funds.
NOTE 19 – OTHER INCOME, NET
The following table details the Company’s other income, net of other expenses (in thousands):
|
Years Ended September 30, |
||||||||||||
|
2009 |
2008 |
2007 |
||||||||||
|
RCC dividend income |
$ | 3,405 | $ | 2,421 | $ | 3,173 | ||||||
|
(Loss) gain on sales of equity securities |
(393 | ) | − | 3,533 | ||||||||
|
Interest income |
340 | 547 | 761 | |||||||||
|
Other (expense) income, net |
(196 | ) | 68 | 518 | ||||||||
|
Write-off of European real estate investment fund costs |
− | − | (4,775 | ) | ||||||||
|
Other income, net |
$ | 3,156 | $ | 3,036 | $ | 3,210 | ||||||
RESOURCE AMERICA, INC.
NOTES TO CONSOLIDATED FINANCIAL STATEMENTS – (Continued)
SEPTEMBER 30, 2009
NOTE 20 – FAIR VALUE OF FINANCIAL INSTRUMENTS
Assets and liabilities are categorized into one of three levels based on the assumptions (inputs) used in valuing the asset or liability. Level 1 provides the most reliable measure of fair value, while Level 3 generally requires significant management judgment. The three levels are defined as follows:
Level 1 − Quoted prices in active markets for identical assets and liabilities that the reporting entity has the ability to access at the measurement date.
Level 2 − Observable inputs other than quoted prices included within Level 1, such as quoted prices for similar assets or liabilities in active markets or quoted prices for identical assets
or liabilities in inactive markets.
Level 3 − Unobservable inputs that reflect the entity’s own assumptions about the assumptions that market participants would use in the pricing of the asset or liability and that are, consequently, not based on market activity, but upon
particular valuation techniques.
As of September 30, 2009, the fair values of the Company’s financial assets and liabilities recorded at fair value on a recurring basis were as follows (in thousands):
|
Level 1 |
Level 2 |
Level 3 |
Total |
|||||||||||||
|
Assets: |
||||||||||||||||
|
Receivables from managed entities |
$ | − | $ | − | $ | 55,047 | $ | 55,047 | ||||||||
|
Investment securities available-for-sale |
11,255 | − | 8,245 | 19,500 | ||||||||||||
|
Total |
$ | 11,255 | $ | − | $ | 63,292 | $ | 74,547 | ||||||||
The following table presents additional information about assets which are measured at fair value on a recurring basis for which the Company has utilized Level 3 inputs to determine fair value during fiscal 2009 (in thousands):
|
Investment securities available-for-sale |
Receivables from managed entities |
|||||||
|
Balance, beginning of year |
$ | 10,153 | $ | 35,674 | ||||
|
Realized losses – impairment charges on investment securities
included in operations |
(8,466 | ) | − | |||||
|
Discount |
− | (657 | ) | |||||
|
Advances and repayments, net |
− | 20,030 | ||||||
|
Purchases, sales, issuances, and settlements, net |
(603 | ) | − | |||||
|
Change in unrealized losses – included in accumulated other
comprehensive loss |
7,161 | − | ||||||
|
Balance, end of year |
$ | 8,245 | $ | 55,047 | ||||
The following is a discussion of assets that are recorded at fair value on a recurring basis as well as the valuation techniques applied to each fair value measurement:
Receivables from managed entities. The Company recorded a discount on certain of its receivable balances due from its real estate and commercial finance managed entities due to the extended term of the repayment to the Company. The discount was computed based
on estimated inputs, including the repayment term (Level 3).
Investment Securities Available-for-Sale. The Company uses quoted market prices (Level 1) to value its investment securities. The fair value of CDO investments is based primarily on internally generated expected cash flow models that require significant management judgments
and estimates due to the lack of market activity and unobservable pricing inputs. Unobservable inputs into these models include default, recovery, discount and deferral rates, prepayment speeds and reinvestment interest spreads (Level 3).
RESOURCE AMERICA, INC.
NOTES TO CONSOLIDATED FINANCIAL STATEMENTS – (Continued)
SEPTEMBER 30, 2009
NOTE 20 – FAIR VALUE OF FINANCIAL INSTRUMENTS – (Continued)
The following table presents the hierarchy level for each of the Company’s assets that are measured at fair value on a nonrecurring basis at September 30, 2009 (in thousands):
|
Level 1 |
Level 2 |
Level 3 |
Total |
|||||||||||||
|
Assets: |
||||||||||||||||
|
Investments in commercial finance – impaired
loans and leases |
$ | − | $ | − | $ | 1,945 | $ | 1,945 | ||||||||
|
Investments in commercial finance –
held for sale |
− | − | 142,701 | 142,701 | ||||||||||||
|
Total |
$ | − | $ | − | $ | 144,646 | $ | 144,646 | ||||||||
|
Liabilities: |
||||||||||||||||
|
Senior notes |
$ | − | $ | 10,629 | $ | − | $ | 10,629 | ||||||||
For cash, receivables and payables, the carrying amounts approximate fair value because of the short-term maturity of these instruments.
The fair value of financial instruments is as follows (in thousands):
|
September 30, 2009 |
September 30, 2008 |
|||||||||||||||
|
Carrying Amount |
Estimated Fair Value |
Carrying Amount |
Estimated Fair Value |
|||||||||||||
|
Assets (1) |
||||||||||||||||
|
Receivables from managed entities |
$ | 55,047 | $ | 55,047 | $ | 35,674 | $ | 35,674 | ||||||||
|
Investments in commercial finance –
held for investment − notes receivable |
385 | 385 | 125,904 | 125,904 | ||||||||||||
|
Investments in real estate loans, net |
2,862 | 823 | 16,284 | 16,957 | ||||||||||||
|
Loans held for investment |
− | − | 219,664 | 190,233 | ||||||||||||
|
Interest rate cap agreements |
− | − | 763 | 763 | ||||||||||||
| $ | 58,294 | $ | 56,255 | $ | 398,289 | $ | 369,531 | |||||||||
|
Borrowings (2) |
||||||||||||||||
|
Secured warehouse debt |
$ | − | $ | − | $ | 213,321 | $ | 213,321 | ||||||||
|
Commercial finance debt |
136,500 | 136,500 | 272,735 | 272,735 | ||||||||||||
|
Corporate secured revolving credit facilities |
27,079 | 27,079 | 50,600 | 50,600 | ||||||||||||
|
Real estate debt |
13,198 | 11,305 | 13,494 | 13,494 | ||||||||||||
|
Senior notes |
10,629 | 10,629 | − | − | ||||||||||||
|
Other debt |
3,977 | 3,977 | 3,909 | 3,909 | ||||||||||||
| $ | 191,383 | $ | 189,490 | $ | 554,059 | $ | 554,059 | |||||||||
|
Liabilities (3) |
||||||||||||||||
|
Interest rate swap contracts |
$ | − | $ | − | $ | 4,244 | $ | 4,244 | ||||||||
|
(1) |
The fair value of interest rate cap agreements was included in other assets. |
|
(2) |
The carrying value of the Company’s floating rate debt approximates its fair value because of its short-term maturity and the variable interest rates in the debt agreements. The carrying value of the Company’s fixed rate debt approximates its fair value due to its recent issuance. |
|
(3) |
The fair value of interest rate swap agreements was included in accrued expenses and other liabilities. |
RESOURCE AMERICA, INC.
NOTES TO CONSOLIDATED FINANCIAL STATEMENTS – (Continued)
SEPTEMBER 30, 2009
NOTE 21 - COMMITMENTS AND CONTINGENCIES
Leases. The Company leases office space and equipment under leases with varying expiration dates through 2019. Rental expense, net of subleases, was $4.0 million, $3.9 million and $2.7 million for fiscal 2009, 2008 and 2007, respectively. At September 30, 2009,
future minimum rental commitments under both operating and capital leases were as follows (in thousands):
|
Operating |
Capital |
Total |
||||||||||
|
2010 |
$ | 2,470 | $ | 359 | $ | 2,829 | ||||||
|
2011 |
1,885 | 269 | 2,154 | |||||||||
|
2012 |
1,800 | 57 | 1,857 | |||||||||
|
2013 |
1,452 | 41 | 1,493 | |||||||||
|
2014 |
363 | 15 | 378 | |||||||||
|
Thereafter |
1,896 | − | 1,896 | |||||||||
| $ | 9,866 | $ | 741 | $ | 10,607 | |||||||
Legal Proceedings. In August 2009, Riverside National Bank of Florida, or Riverside, initiated a lawsuit now captioned Riverside National Bank of Florida v. The McGraw-Hill Companies, Inc. et al., New
York Supreme Court, New York County, No. 650665/2009, against several investment banks, rating agencies, and collateral managers of CDOs, including Trapeza Capital Management, LLC, or TCM. The Company owns a 50% interest in TCM, and an unaffiliated third-party owns the other 50% interest.
The complaint seeks monetary damages in an unspecified amount against TCM arising out of Riverside’s investment in certain CDOs between 2005 and 2007. Riverside’s claims against TCM stem from its role as collateral manager for various Trapeza CDOs, which were sold by various investment banks. The
complaint alleges that the offering materials for the CDOs were prepared in part by TCM and were false and misleading. The complaint further alleges that TCM breached fiduciary and contractual obligations by failing to properly monitor the collateral for the CDOs, failing to mitigate losses and failing to disclose known quality and performance problems with the underlying collateral. TCM believes that none of the claims have merit and intends to vigorously defend itself in this matter.
The Company is also a party to various routine legal proceedings arising out of the ordinary course of its business. Management believes that none of these actions, individually or in the aggregate, will have a material adverse effect on its financial condition or operations.
Guarantees. In connection with the sale of a real estate loan in March 2006, the Company agreed that in exchange for the current property owner relinquishing certain control rights, the Company would make payments to the
current property owner under stipulated circumstances, including the sale or foreclosure of the property or a subsequent resale of the loan. A payment of $2.6 million, increasing $16,234 per month to a maximum of $3.6 million, would be due upon the occurrence of specified events. In addition, the current property owner has the right to receive collateral as security for this obligation equal to or greater than 105% of the value of the obligation upon the occurrence of certain specified events
or if the Company’s net worth falls below $80.0 million. The Company’s obligation runs through December 31, 2014. In addition, the Company agreed to partially indemnify the purchaser of the loan for a portion of the difference between ordinary income tax rates and capital gain rates on accrued interest on the note between the date of sale of the loan in March 2006 and December 31, 2011.
Real estate carveouts. The real estate investment entities obtain senior lien financing with respect to acquired properties, on a non-recourse basis, with the lenders’ remedies limited to the properties securing
the senior lien financing. Although non-recourse in nature, these loans are subject to limited standard exceptions, which the Company has guaranteed (“carveouts”). These carveouts will expire as the related indebtedness is paid down over the next ten years. Subsidiaries of the Company are both (i) the general partner of the real estate limited partnerships or the asset manager of the TIC investment programs and (ii) the property manager of all of these properties. As
a result, the Company has control over the operations of the underlying assets which mitigates the potential risk associated with these carveouts and, accordingly, no liabilities for these obligations have been recorded in the consolidated financial statements. To date, the Company has not been required to make any carveout payments.
General corporate commitments. As a specialized asset manager, the Company sponsors investment funds in which it may make an equity investment along with outside investors. This equity investment is generally
based on a percentage of funds raised and varies among investment programs.
The Company has committed to purchase units equal to 5% of one of its real estate funds gross offering proceeds, or $1.1 million at September 30, 2009. The Company will purchase its share at the close of funding which is anticipated to be in December 2009.
RESOURCE AMERICA, INC.
NOTES TO CONSOLIDATED FINANCIAL STATEMENTS – (Continued)
SEPTEMBER 30, 2009
NOTE 21 - COMMITMENTS AND CONTINGENCIES – (Continued)
The Company is also party to employment agreements with certain executives that provide for compensation and other benefits, including severance payments under specified circumstances.
The Company's wholly-owned broker-dealer subsidiary, Chadwick Securities, Inc. ("Chadwick"), serves as a dealer-manager for the sale of securities of direct participation investment programs, both public and private, sponsored by subsidiaries of the Company who also serve as general
partners and/or managers of these programs. Additionally, Chadwick serves as an introducing agent for transactions involving sales of securities of financial services companies, REITs and insurance companies. As a broker-dealer, Chadwick is subject to the net capital provision of rule 15c3-1 under the Securities Exchange Act of 1934, which requires the maintenance of minimum net capital, as defined. As applied to Chadwick, the rule required net capital of $121,000 and $71,000
as of September 30, 2009 and 2008, respectively. As of September 30, 2009 and 2008, Chadwick’s adjusted net capital was $1.2 million and $547,000, respectively, which exceeds the minimum requirements by $1.1 million and $476,000, respectively.
Two financial fund management investment entities that have incentive distributions, also known as carried interest, are subject to a potential clawback to the extent that such distributions exceed their cumulative net profits, as defined in the respective partnership agreements. During fiscal 2009, based upon the evaluation
of current information, the Company reduced its total potential clawback obligation by $1.8 million to $5.7 million at September 30, 2009 from $7.5 million at September 30, 2008. The estimated liability is included in accrued expenses and other liabilities in the consolidated balance sheets. On November 1, 2009, the Company purchased substantially all the remaining third-party limited partner interests in these investment entities for $2.1 million. The Company believes that
this transaction will result in a further reduction of its potential clawback liability.
As of September 30, 2009, except for the clawback liability recorded for the two financial fund management investment entities, the Company does not believe it is probable that any payments will be required under any of its indemnifications and accordingly, no liabilities for these obligations have been recorded in the consolidated
financial statements.
NOTE 22 - DISCONTINUED OPERATIONS
Real Estate. Losses from discontinued operations for fiscal 2009, 2008 and 2007 primarily reflect $433,000, $1.1 million and $1.9 million, respectively, of interest and penalty assessments related to the 2004 and 2005 IRS tax examinations. Loss
on disposal for fiscal 2007 includes a $374,000 write-down to market value of a property sold. Fiscal 2007 includes the discontinued operations of one real estate property owned by the Company. Summarized operating results of discontinued operations held for sale within the real estate operating segment are as follows (in thousands):
|
Years Ended September 30, |
||||||||||||
|
2009 |
2008 |
2007 |
||||||||||
|
Loss from discontinued operations |
$ | (370 | ) | $ | (1,104 | ) | $ | (2,095 | ) | |||
|
Loss on disposal, net |
− | − | (329 | ) | ||||||||
|
(Provision) benefit for income taxes |
(70 | ) | 386 | 848 | ||||||||
|
Loss from discontinued operations, net of tax |
$ | (440 | ) | $ | (718 | ) | $ | (1,576 | ) | |||
Commercial Finance. An operating subsidiary within the commercial finance operating segment which was in the reverse factoring business, commenced operations in fiscal 2007. Due to economic conditions in fiscal 2008, management discontinued this subsidiary in
fiscal 2008 and reflected the results of its operations as discontinued in the consolidated statements of operations as follows (in thousands):
|
Years Ended September 30, |
||||||||||||
|
2009 |
2008 |
2007 |
||||||||||
|
Loss from discontinued operations |
$ | (14 | ) | $ | (856 | ) | $ | (180 | ) | |||
|
Benefit for income taxes |
5 | 300 | 68 | |||||||||
|
Loss from discontinued operations, net of tax |
$ | (9 | ) | $ | (556 | ) | $ | (112 | ) | |||
Total. Summarized operating results of all discontinued entities are as follows (in thousands):
|
Years Ended September 30, |
||||||||||||
|
2009 |
2008 |
2007 |
||||||||||
|
Loss from discontinued operations |
$ | (377 | ) | $ | (1,999 | ) | $ | (2,275 | ) | |||
|
Loss on disposal, net |
− | − | (129 | ) | ||||||||
|
(Provision) benefit for income taxes |
(67 | ) | 700 | 846 | ||||||||
|
Loss from discontinued operations, net of tax |
$ | (444 | ) | $ | (1,299 | ) | $ | (1,558 | ) | |||
RESOURCE AMERICA, INC.
NOTES TO CONSOLIDATED FINANCIAL STATEMENTS - (Continued)
SEPTEMBER 30, 2009
NOTE 23 - OPERATING SEGMENTS
The Company’s operations include three reportable operating segments that reflect the way the Company manages its operations and makes business decisions. In addition to its reporting operating segments, certain other activities are reported in the “all other”
category. Summarized operating segment data are as follows (in thousands):
|
Commercial finance |
Real estate |
Financial fund management |
All other (1) |
Total |
||||||||||||||||
|
Year Ended September 30, 2009 |
||||||||||||||||||||
|
Revenues from external customers |
$ | 50,528 | $ | 26,077 | $ | 30,272 | $ | − | $ | 106,877 | ||||||||||
|
Equity in (losses) earnings of unconsolidated entities |
(1,133 | ) | (660 | ) | 3,072 | − | 1,279 | |||||||||||||
|
Total revenues |
49,395 | 25,417 | 33,344 | − | 108,156 | |||||||||||||||
|
Segment operating expenses |
(25,179 | ) | (22,038 | ) | (20,468 | ) | − | (67,685 | ) | |||||||||||
|
General and administrative expenses |
(409 | ) | (232 | ) | (3,414 | ) | (10,314 | ) | (14,369 | ) | ||||||||||
|
Provision for credit losses |
(6,410 | ) | (456 | ) | (1,738 | ) | − | (8,604 | ) | |||||||||||
|
Depreciation and amortization |
(4,293 | ) | (1,370 | ) | (398 | ) | (861 | ) | (6,922 | ) | ||||||||||
|
Impairment losses on investment securities |
− | − | (9,667 | ) | (160 | ) | (9,827 | ) | ||||||||||||
|
Recognized in other comprehensive loss |
− | − | 1,201 | 87 | 1,288 | |||||||||||||||
|
Net impairment losses recognized in earnings |
− | − | (8,466 | ) | (73 | ) | (8,539 | ) | ||||||||||||
|
Interest expense |
(10,524 | ) | (966 | ) | (5,014 | ) | (3,695 | ) | (20,199 | ) | ||||||||||
|
Minority interest income |
− | 54 | 1,549 | − | 1,603 | |||||||||||||||
|
Loss on sale of loans and investment securities, net |
− | − | (11,588 | ) | − | (11,588 | ) | |||||||||||||
|
Other income (expense), net |
79 | 75 | 3,440 | (438 | ) | 3,156 | ||||||||||||||
|
Income (loss) before intercompany interest expense and taxes |
2,659 | 484 | (12,753 | ) | (15,381 | ) | (24,991 | ) | ||||||||||||
|
Intercompany interest (expense) income |
(5,899 | ) | − | − | 5,899 | − | ||||||||||||||
|
Income (loss) from continuing operations before taxes |
$ | (3,240 | ) | $ | 484 | $ | (12,753 | ) | $ | (9,482 | ) | $ | (24,991 | ) | ||||||
|
Year Ended September 30, 2008 |
||||||||||||||||||||
|
Revenues from external customers |
$ | 97,214 | $ | 33,283 | $ | 41,095 | $ | − | $ | 171,592 | ||||||||||
|
Equity in losses of unconsolidated entities |
(333 | ) | (1,764 | ) | (13,559 | ) | − | (15,656 | ) | |||||||||||
|
Total revenues |
96,881 | 31,519 | 27,536 | − | 155,936 | |||||||||||||||
|
Segment operating expenses |
(42,741 | ) | (22,602 | ) | (27,737 | ) | − | (93,080 | ) | |||||||||||
|
General and administrative expenses |
(425 | ) | (217 | ) | (3,874 | ) | (11,564 | ) | (16,080 | ) | ||||||||||
|
Provision for credit losses |
(7,505 | ) | (500 | ) | (2,622 | ) | − | (10,627 | ) | |||||||||||
|
Depreciation and amortization |
(2,412 | ) | (1,093 | ) | (257 | ) | (898 | ) | (4,660 | ) | ||||||||||
|
Net impairment losses recognized in earnings |
− | − | (14,467 | ) | − | (14,467 | ) | |||||||||||||
|
Interest expense |
(27,466 | ) | (1,222 | ) | (14,559 | ) | (4,019 | ) | (47,266 | ) | ||||||||||
|
Minority interest (expense) income |
(2,178 | ) | (61 | ) | 6,482 | − | 4,243 | |||||||||||||
|
Loss on sale of loans and investment securities, net |
− | − | (17,660 | ) | (14 | ) | (17,674 | ) | ||||||||||||
|
Other income (expense), net |
352 | 288 | 2,441 | (45 | ) | 3,036 | ||||||||||||||
|
Income (loss) before intercompany interest expense and taxes |
14,506 | 6,112 | (44,717 | ) | (16,540 | ) | (40,639 | ) | ||||||||||||
|
Intercompany interest (expense) income |
(5,860 | ) | − | − | 5,860 | − | ||||||||||||||
|
Income (loss) from continuing operations before taxes |
$ | 8,646 | $ | 6,112 | $ | (44,717 | ) | $ | (10,680 | ) | $ | (40,639 | ) | |||||||
|
Year Ended September 30, 2007 |
||||||||||||||||||||
|
Revenues from external customers |
$ | 40,716 | $ | 22,808 | $ | 49,284 | $ | − | $ | 112,808 | ||||||||||
|
Equity in (losses) earnings of unconsolidated entities |
(24 | ) | 179 | 13,805 | − | 13,960 | ||||||||||||||
|
Total revenues |
40,692 | 22,987 | 63,089 | − | 126,768 | |||||||||||||||
|
Segment operating expenses |
(19,501 | ) | (13,190 | ) | (21,264 | ) | − | (53,955 | ) | |||||||||||
|
General and administrative expenses (2) |
(197 | ) | (164 | ) | (3,461 | ) | (8,053 | ) | (11,875 | ) | ||||||||||
|
Provision for credit losses |
(229 | ) | − | − | − | (229 | ) | |||||||||||||
|
Depreciation and amortization |
(1,243 | ) | (692 | ) | (103 | ) | (886 | ) | (2,924 | ) | ||||||||||
|
Net impairment losses recognized in earnings |
− | − | (12,580 | ) | − | (12,580 | ) | |||||||||||||
|
Interest expense |
(11,796 | ) | (1,040 | ) | (19,485 | ) | (1,245 | ) | (33,566 | ) | ||||||||||
|
Minority interest expense |
(530 | ) | − | (1,612 | ) | − | (2,142 | ) | ||||||||||||
|
Loss on sale of loans and investment securities, net |
− | − | (5,025 | ) | − | (5,025 | ) | |||||||||||||
|
Other income, net |
246 | 330 | 2,414 | 220 | 3,210 | |||||||||||||||
|
Income (loss) before intercompany interest expense and taxes |
7,442 | 8,231 | 1,973 | (9,964 | ) | 7,682 | ||||||||||||||
|
Intercompany interest (expense) income |
(2,769 | ) | − | (6,082 | ) | 8,851 | − | |||||||||||||
|
Income (loss) from continuing operations before taxes |
$ | 4,673 | $ | 8,231 | $ | (4,109 | ) | $ | (1,113 | ) | $ | 7,682 | ||||||||
RESOURCE AMERICA, INC.
NOTES TO CONSOLIDATED FINANCIAL STATEMENTS - (Continued)
SEPTEMBER 30, 2009
NOTE 23 - OPERATING SEGMENTS − (Continued)
|
Commercial finance |
Real estate |
Financial fund management |
All other (1) |
Total |
||||||||||||||||
|
Segment assets |
||||||||||||||||||||
|
September 30, 2009 |
$ | 212,336 | $ | 148,903 | $ | 34,596 | $ | (19,995 | ) | $ | 375,840 | |||||||||
|
September 30, 2008 |
$ | 356,671 | $ | 147,657 | $ | 274,742 | $ | (20,713 | ) | $ | 758,357 | |||||||||
|
September 30, 2007 |
$ | 283,474 | $ | 144,790 | $ | 557,839 | $ | (19,651 | ) | $ | 966,452 | |||||||||
|
(1) |
Includes general corporate expenses and assets not allocable to any particular segment. |
|
(2) |
In accordance with Company policy, certain corporate overhead expenses are allocated to the operating segments based on assets under management, which may be affected by, but not limited to, various market conditions. Accordingly, the Company recorded no allocations of corporate overhead during the fourth quarter of fiscal 2007. |
Geographic information. Revenues generated from the Company’s European operations totaled $3.2 million, $5.8 million and $15.9 million for fiscal 2009, 2008 and 2007, respectively. The Company, through
the CDO issuers it sponsored and consolidated, began to acquire European bank loans in the fourth quarter of fiscal 2006. Included in segment assets as of September 30, 2009, 2008 and 2007 were $5.6 million, $5.5 million and $247.4 million, respectively, of European assets, primarily loans held for investment in fiscal 2008 and 2007.
Major customer. In fiscal 2009, 2008 and 2007, the management, incentive, servicing and acquisition fees that the Company received from RCC were 8%, 5% and 7%, respectively, of its consolidated revenues. These
fees have been reported as revenues by each of the Company’s operating segments.
NOTE 24 – UNAUDITED QUARTERLY FINANCIAL DATA
The following sets forth the Company’s operating results by quarter (in thousands, except share data):
|
Quarterly results for fiscal 2009 (1) |
December 31 |
March 31 |
June 30 |
September 30 |
||||||||||||
|
Revenues |
$ | 32,193 | $ | 27,205 | $ | 22,629 | $ | 26,129 | ||||||||
|
Operating income (loss) |
$ | 3,799 | $ | 3,921 | $ | (73 | ) | $ | 2,929 | |||||||
|
(Loss) income from continuing operations |
$ | (3,295 | ) | $ | (11,470 | ) | $ | (126 | ) | $ | 404 | |||||
|
Net (loss) income |
$ | (3,220 | ) | $ | (11,633 | ) | $ | (204 | ) | $ | 126 | |||||
|
Basic (loss) earnings per common share: |
||||||||||||||||
|
Continuing operations |
$ | (0.18 | ) | $ | (0.64 | ) | $ | (0.01 | ) | $ | 0.02 | |||||
|
Net (loss) income |
$ | (0.18 | ) | $ | (0.65 | ) | $ | (0.01 | ) | $ | 0.01 | |||||
|
Diluted loss per common share: |
||||||||||||||||
|
Continuing operations |
$ | (0.18 | ) | $ | (0.64 | ) | $ | (0.01 | ) | $ | 0.02 | |||||
|
Net (loss) income |
$ | (0.18 | ) | $ | (0.65 | ) | $ | (0.01 | ) | $ | 0.01 | |||||
|
Quarterly results for fiscal 2008 (2) |
December 31 |
March 31 |
June 30 |
September 30 |
||||||||||||
|
Revenues |
$ | 44,059 | $ | 50,380 | $ | 29,445 | $ | 32,052 | ||||||||
|
Operating income (loss) |
$ | 15,402 | $ | 20,500 | $ | (905 | ) | $ | (3,508 | ) | ||||||
|
(Loss) income from continuing operations |
$ | (10,866 | ) | $ | 2,090 | $ | (7,898 | ) | $ | (8,270 | ) | |||||
|
Net (loss) income |
$ | (10,977 | ) | $ | 1,983 | $ | (8,025 | ) | $ | (9,224 | ) | |||||
|
Basic (loss) earnings per common share: |
||||||||||||||||
|
Continuing operations |
$ | (0.62 | ) | $ | 0.12 | $ | (0.45 | ) | $ | (0.47 | ) | |||||
|
Net (loss) income |
$ | (0.63 | ) | $ | 0.11 | $ | (0.46 | ) | $ | (0.52 | ) | |||||
|
Diluted (loss) earnings per common share: |
||||||||||||||||
|
Continuing operations |
$ | (0.62 | ) | $ | 0.12 | $ | (0.45 | ) | $ | (0.47 | ) | |||||
|
Net (loss) income |
$ | (0.63 | ) | $ | 0.11 | $ | (0.46 | ) | $ | (0.52 | ) | |||||
RESOURCE AMERICA, INC.
NOTES TO CONSOLIDATED FINANCIAL STATEMENTS - (Continued)
SEPTEMBER 30, 2009
NOTE 24 – UNAUDITED QUARTERLY FINANCIAL DATA - (Continued)
|
(1) |
Fiscal 2009 |
|
- |
Quarter Ended December 31, 2008 – included a $4.4 million non-cash impairment charge taken on investments in CDO securities ($0.59 per share-diluted). |
|
- |
Quarter Ended March 31, 2009 – included an $11.6 million loss on the sale of bank loans ($0.70 per share diluted). |
|
(2) |
Fiscal 2008 |
|
- |
Quarter Ended December 31, 2007 – included an $18.3 million loss on the sale of bank loans ($1.05 per share diluted) in Europe and the United States in late January and early February 2008 as a result of the termination in January 2008 of two secured warehouse credit facilities the Company consolidated for which it had provided limited guarantees. |
|
- |
Quarter Ended December 31, 2007 and June 30, 2008 and September 30, 2008 – included partnership level adjustments, primarily mark-to-market adjustments on investment partnerships that the Company manages, of $6.7 million ($0.70 per share diluted), $11.0 million ($0.63 per share diluted) and $6.9 million ($0.37 per share diluted), respectively. |
NOTE 25 – SUBSEQUENT EVENT
The Company has evaluated subsequent events through the filing of this Form 10-K on December 11, 2009, and determined there were no events that have occurred that would require adjustments to the consolidated financial statements.
|
CHANGES IN AND DISAGREEMENTS WITH ACCOUNTANTS | |
|
ON ACCOUNTING AND FINANCIAL DISCLOSURE. |
None.
|
CONTROLS AND PROCEDURES. |
Disclosure Controls
We maintain disclosure controls and procedures that are designed to ensure that information required to be disclosed in our periodic reports under the Securities Exchange Act of 1934, as amended, or the Exchange Act, is recorded, processed, summarized and reported within the time periods
specified in the SEC’s rules and forms, and that such information is accumulated and communicated to our management, including our chief executive officer and our chief financial officer, as appropriate, to allow timely decisions regarding required disclosure. In designing and evaluating the disclosure controls and procedures, our management recognized that any controls and procedures, no matter how well designed and operated, can provide only reasonable assurance of achieving the desired control
objectives, and our management necessarily was required to apply its judgment in evaluating the cost-benefit relationship of possible controls and procedures.
Under the supervision of our chief executive officer and chief financial officer, we have carried out an evaluation of the effectiveness of our disclosure controls and procedures as of the end of the period covered by this report. Based upon that evaluation, our chief executive
officer and chief financial officer concluded that our disclosure controls and procedures are effective.
Management’s Report on Internal Control over Financial Reporting
Our management is responsible for establishing and maintaining adequate internal control over financial reporting as defined in Rules 13a-15(f) and 15d-15(f) under the Exchange Act. Because of its inherent limitations, internal control over financial reporting may not prevent or detect misstatements. Projections
of any evaluation of effectiveness to future periods are subject to the risks that controls may become inadequate because of changes in conditions, or that the degree of compliance with the policies or procedures may deteriorate.
Our management assessed the effectiveness of our internal control over financial reporting as of September 30, 2009. In making this assessment, management used the criteria set forth by the Committee of Sponsoring Organizations of the Treadway Commission, or COSO, in Internal
Control – Integrated Framework. Based upon this assessment, our management concluded that, as of September 30, 2009, our internal control over financial reporting is effective.
Our independent registered public accounting firm, Grant Thornton LLP, audited our internal control over financial reporting as of September 30, 2009. Their report, dated December 11, 2009, expressed an unqualified opinion on our internal control over financial reporting. Their report is included following this Item
9A.
Changes in Internal Control over Financial Reporting
There has been no change in our internal control over financial reporting that occurred during our fourth fiscal quarter that has materially affected, or is reasonably likely to materially affect, our internal control over financial reporting.
REPORT OF INDEPENDENT REGISTERED PUBLIC ACCOUNTING FIRM
Stockholders and Board of Directors
RESOURCE AMERICA, INC.
We have audited Resource America, Inc. (a Delaware Corporation) and subsidiaries (the Company) internal control over financial reporting as of September 30, 2009, based on criteria established in Internal Control—Integrated Framework issued by the Committee of Sponsoring Organizations
of the Treadway Commission (COSO). The Company’s management is responsible for maintaining effective internal control over financial reporting and for its assessment of the effectiveness of internal control over financial reporting, included in the accompanying Management’s Report on Internal Control Over Financial Reporting. Our responsibility is to express an opinion on the Company’s internal control over financial reporting based on our audit.
We conducted our audit in accordance with the standards of the Public Company Accounting Oversight Board (United States). Those standards require that we plan and perform the audit to obtain reasonable assurance about whether effective internal control over financial reporting was maintained in all material respects. Our
audit included obtaining an understanding of internal control over financial reporting, assessing the risk that a material weakness exists, testing and evaluating the design and operating effectiveness of internal control based on the assessed risk, and performing such other procedures as we considered necessary in the circumstances. We believe that our audit provides a reasonable basis for our opinion.
A company's internal control over financial reporting is a process designed to provide reasonable assurance regarding the reliability of financial reporting and the preparation of financial statements for external purposes in accordance with generally accepted accounting principles. A company's internal control over financial reporting
includes those policies and procedures that (1) pertain to the maintenance of records that, in reasonable detail, accurately and fairly reflect the transactions and dispositions of the assets of the company; (2) provide reasonable assurance that transactions are recorded as necessary to permit preparation of financial statements in accordance with generally accepted accounting principles, and that receipts and expenditures of the company are being made only in accordance with authorizations of management and
directors of the company; and (3) provide reasonable assurance regarding prevention or timely detection of unauthorized acquisition, use, or disposition of the company's assets that could have a material effect on the financial statements.
Because of its inherent limitations, internal control over financial reporting may not prevent or detect misstatements. Also, projections of any evaluation of effectiveness to future periods are subject to the risk that controls may become inadequate because of changes in conditions, or that the degree of compliance with the policies
or procedures may deteriorate. In our opinion, Resource America, Inc. maintained, in all material respects, effective internal control over financial reporting as of September 30, 2009, based on criteria established in Internal Control-Integrated Framework issued by COSO.
We also have audited, in accordance with the standards of the Public Company Accounting Oversight Board (United States), the consolidated balance sheets of Resource America, Inc. and subsidiaries as of September 30, 2009 and 2008 and the related statements of operations, changes in stockholders’ equity and cash flows for each
of the three years in the period ended September 30, 2009, and our report dated December 11, 2009, expressed an unqualified opinion.
/s/ GRANT THORNTON LLP
Philadelphia, Pennsylvania
December 11, 2009
|
OTHER INFORMATION. |
None.
PART III
|
DIRECTORS, EXECUTIVE OFFICERS AND CORPORATE GOVERNANCE. |
The information required by this item will be set forth in our definitive proxy statement with respect to our 2010 annual meeting of stockholders, to be filed on or before January 28, 2010 (“2010 proxy statement”), which is incorporated herein by this reference.
|
EXECUTIVE COMPENSATION. |
The information required by this item will be set forth in our 2010 proxy statement, which is incorporated herein by this reference.
|
SECURITY OWNERSHIP OF CERTAIN BENEFICIAL OWNERS AND | |
|
MANAGEMENT AND RELATED STOCKHOLDER MATTERS. |
The information required by this item will be set forth in our 2010 proxy statement, which is incorporated herein by this reference.
|
CERTAIN RELATIONSHIPS AND RELATED TRANSACTIONS, | |
|
AND DIRECTOR INDEPENDENCE. |
The information required by this item will be set forth in our 2010 proxy statement, which is incorporated herein by this reference.
|
PRINCIPAL ACCOUNTING FEES AND SERVICES. |
The information required by this item will be set forth in our 2010 proxy statement, which is incorporated herein by this reference.
PART IV
|
EXHIBITS AND FINANCIAL STATEMENT SCHEDULES. |
The following documents are filed as part of this Annual Report on Form 10-K
|
|
1. |
Financial Statements |
|
|
Report of Independent Registered Public Accounting Firm |
|
|
Consolidated Balance Sheets at September 30, 2009 and 2008 |
|
|
Consolidated Statements of Operations for the years ended September 30, 2009, 2008 and 2007 |
|
|
Consolidated Statements of Changes in Stockholders' Equity for the years ended |
|
|
September 30, 2009, 2008 and 2007 |
|
|
Consolidated Statements of Cash Flows for the years ended September 30, 2009, 2008 and 2007 |
|
|
Notes to Consolidated Financial Statements − September 30, 2009 |
|
|
2. |
Financial Statement Schedules |
|
|
a) |
Exhibits |
|
Exhibit No. |
Description | ||
|
3.1 |
Restated Certificate of Incorporation of Resource America. (2) | ||
|
3.2 |
Amended and Restated Bylaws of Resource America. (2) | ||
|
10.1(a) |
Loan and Security Agreement, dated May 24, 2007, between Resource America, Inc., Commerce Bank, N.A. and the other parties thereto. (3) | ||
|
10.1(b) |
First Amendment and Joinder to Loan and Security Agreement, dated July 18, 2007. (4) | ||
|
10.1(c) |
Second Amendment and Joinder to Loan and Security Agreement, dated November 15, 2007. (4) | ||
|
10.1(d) |
Third Amendment to Loan and Security Agreement, dated August 7, 2008. (5) | ||
|
10.1(e) |
Fourth Amendment to Loan and Security Agreement, dated September 30, 2008. (6) | ||
|
10.1(f) |
Fifth Amendment to Loan and Security Agreement, dated December 19, 2008. (1) | ||
|
10.1(g) |
Sixth Amendment to Loan and Security Agreement, dated March 26, 2009. (10) | ||
|
10.1(h) |
Seventh Amendment to Loan and Security Agreement, dated May 15, 2009. (14) | ||
|
10.1(i) |
Eighth Amendment to Loan and Security Agreement, dated November 6, 2009. (17) | ||
|
10.2(a) |
Agreement of Purchase and Sale of Limited Liability Company Membership Interests between Resource America, Inc. and RSI Associates, LLC, dated February 21, 2008. (7) | ||
|
10.2(b) |
First Amendment to Agreement of Purchase and Sale of Limited Liability Company Membership Interests between Resource America, Inc. and RSI Associates, LLC, dated March 2008. (7) | ||
|
10.3 |
Amended and Restated Employment Agreement between Michael S. Yecies and Resource America, Inc., dated December 29, 2008. (8) | ||
|
10.4 |
Amended and Restated Employment Agreement between Thomas C. Elliott and Resource America, Inc., dated December 29, 2008. (8) | ||
|
10.5 |
Amended and Restated Employment Agreement between Jeffrey F. Brotman and Resource America, Inc., dated December 29, 2008.. (8) | ||
|
10.6 |
Amended and Restated Employment Agreement between Jonathan Z. Cohen and Resource America, Inc., dated December 29, 2008. (8) | ||
|
10.7 |
Amended and Restated Employment Agreement between Steven J. Kessler and Resource America, Inc., dated December 29, 2008. (8) | ||
|
10.8(a) |
U.S. $250,000,000 Receivables Loan and Security Agreement, dated as of October 31, 2006, among Resource Capital Funding II, LLC, as the Borrower, and LEAF Financial Corporation, as the Servicer, and Morgan Stanley Bank, as a Lender and Collateral Agent, and U.S. Bank National Association, as the Custodian and the Lender’s Bank and Lyon
Financial Services, Inc. (D/B/A U.S. Bank Portfolio Services), as the Backup Servicer. (9) | ||
|
10.8(b) |
First Amendment to Receivables Loan and Security Agreement, dated as of October 31, 2006. (9) | ||
|
10.8(c) |
Purchase and Sale Agreement, dated as of October 31, 2006. (9) | ||
|
10.8(d) |
First amendment to Purchase and Sale Agreement, dated as of December 21, 2006. (9) | ||
|
10.8(e) |
Fifth Amendment to Receivables Loan and Security Agreement, dated as of May 23, 2008. (5) | ||
|
10.8(f) |
Amended and Restated Fee Letter, dated May 23, 2008. (5) | ||
|
10.8(g) |
Sixth Amendment to Receivables Loan and Security Agreement, dated as of November 13, 2008. (8) | ||
|
10.9(a) |
Credit Agreement, dated July 31, 2006, by and among LEAF Financial Corporation, LEAF Funding, Inc. and National City Bank. (11) | ||
|
10.9(b) |
Guaranty and Suretyship Agreement by registrant and Resource Leasing, Inc. in favor of National City Bank. (11) | ||
|
10.9(c) |
First Amendment to Credit Agreement, dated August 14, 2006, by and among LEAF Financial Corporation, LEAF Funding, Inc. and National City Bank. (12) | ||
|
10.9(d) |
Second Amendment to Credit Agreement, dated December 22, 2006, between LEAF Financial Corporation, LEAF Funding, Inc. and National City Bank. (9) |
|
10.9(e) |
Third Amendment to Credit Agreement, dated March 14, 2007, between LEAF Financial Corporation, LEAF Funding, Inc. and National City Bank. (13) | ||
|
10.9(f) |
Seventh Amendment to Credit Agreement, dated July 31, 2009, between LEAF Financial Corporation, LEAF Funding, Inc. and National City Bank. | ||
|
10.9(g) |
Eighth Amendment to Credit Agreement, dated September 30, 2009, between LEAF Financial Corporation, LEAF Funding, Inc. and National City Bank. | ||
|
10.10 |
Note Purchase Agreement (including the form of Senior Note, form of Warrant and form of Registration Rights Agreement). (16) | ||
|
12.1 |
Ratio of Earnings to Fixed Charges. | ||
|
14.1 |
Insider Trading Policy.(15) | ||
|
21.1 |
Subsidiaries of Resource America, Inc. | ||
|
23.1 |
Consent of Grant Thornton LLP. | ||
|
31.1 |
Certification of Chief Executive Officer pursuant to Section 302 of the Sarbanes-Oxley Act of 2002. | ||
|
31.2 |
Certification of Chief Financial Officer pursuant to Section 302 of the Sarbanes-Oxley Act of 2002. | ||
|
32.1 |
Certification of Chief Executive Officer pursuant to Section 1350 18 U.S.C., as adopted pursuant to Section 906 of the Sarbanes-Oxley Act of 2002. | ||
|
32.2 |
Certification of Chief Financial Officer pursuant to Section 1350 18 U.S.C., as adopted pursuant to Section 906 of the Sarbanes-Oxley Act of 2002. |
|
|
(1) |
Filed previously as an exhibit to our Current Report on Form 8-K filed on December 24, 2008 and by this reference incorporated herein. |
|
|
(2) |
Filed previously as an exhibit to our Quarterly Report on Form 10-Q for the quarter ended December 31, 1999 and by this reference incorporated herein. |
|
|
(3) |
Filed previously as an exhibit to our Current Report on Form 8-K filed on June 1, 2007 and by this reference incorporated herein. |
|
|
(4) |
Filed previously as an exhibit to our Annual Report on Form 10-K for the fiscal year ended September 30, 2007 and by this reference incorporated herein. |
|
|
(5) |
Filed previously as an exhibit to our Quarterly Report on Form 10-Q for the quarter ended June 30, 2008 and by this reference incorporated herein. |
|
|
(6) |
Filed previously as an exhibit to our Current Report on Form 8-K filed on October 6, 2008 and by this reference incorporated herein. |
|
|
(7) |
Filed previously as an exhibit to our Quarterly Report on Form 10-Q for the quarter ended March 31, 2008 and by this reference incorporated herein. |
|
|
(8) |
Filed previously as an exhibit to our Quarterly Report on Form 10-Q for the quarter ended December 31, 2008 and by this reference incorporated herein. |
|
|
(9) |
Filed previously as an exhibit to our Quarterly Report on Form 10-Q for the quarter ended December 31, 2006 and by this reference incorporated herein. |
|
|
(10) |
Filed previously as an exhibit to our Current Report on Form 8-K filed on March 27, 2009 and by this reference incorporated herein. |
|
|
(11) |
Filed previously as an exhibit to our Current Report on Form 8-K filed on August 4, 2006 and by this reference incorporated herein. |
|
|
(12) |
Filed previously as an exhibit to our Current Report on Form 8-K filed on August 17, 2006 and by this reference incorporated herein. |
|
|
(13) |
Filed previously as an exhibit to our Quarterly Report on Form 10-Q for the quarter ended March 31, 2007 and by this reference incorporated herein. |
|
|
(14) |
Filed previously as an exhibit to our Quarterly Report on Form 10-Q for the quarter ended March 31, 2009 and by this reference incorporated herein. |
|
|
(15) |
Filed previously as an exhibit to our Current Report on Form 8-K filed on August 31, 2007 and by this reference incorporated herein. |
|
|
(16) |
Filed previously as an exhibit to our Current Report on Form 8-K filed on October 1, 2009 and by this reference incorporated herein. |
|
|
(17) |
Filed previously as an exhibit to our Current Report on Form 8-K filed on November 9, 2009 and by this reference incorporated herein. |
Pursuant to the requirements of Section 13 or 15(d) of the Securities Exchange Act of 1934, the registrant has duly caused this report to be signed on its behalf by the undersigned, thereunto duly authorized.
|
RESOURCE AMERICA, INC. | |
|
December 11, 2009 |
By: /s/ Jonathan Z. Cohen |
|
Chief Executive Officer and President |
Pursuant to the requirements of the Securities Exchange Act of 1934, this report has been signed below by the following persons on behalf of the registrant and in the capacities and on the dates indicated.
|
/s/ Edward E. Cohen |
Chairman of the Board |
December 11, 2009 | |
|
EDWARD E. COHEN |
|||
|
/s/ Jonathan Z. Cohen |
Director, President |
December 11, 2009 | |
|
JONATHAN Z. COHEN |
and Chief Executive Officer |
||
| (Principal Executive Officer) | |||
|
/s/ Michael J. Bradley |
Director |
December 11, 2009 | |
|
MICHAEL J. BRADLEY |
|||
|
/s/ Carlos C. Campbell |
Director |
December 11, 2009 | |
|
CARLOS C. CAMPBELL |
|||
|
/s/ Kenneth A. Kind |
Director |
December 11, 2009 | |
|
KENNETH A. KIND |
|||
|
/s/ Hersh Kozlov |
Director |
December 11, 2009 | |
|
HERSH KOZLOV |
|||
|
/s/ Andrew M. Lubin |
Director |
December 11, 2009 | |
|
ANDREW M. LUBIN |
|||
|
/s/ John S. White |
Director |
December 11, 2009 | |
|
JOHN S. WHITE |
|||
|
/s/ Steven J. Kessler |
Executive Vice President |
December 11, 2009 | |
|
STEVEN J. KESSLER |
and Chief Financial Officer |
||
| (Principal Financial Officer) | |||
| /s/ Arthur J. Miller | Vice President | December 11, 2009 | |
| ARTHUR J. MILLER | and Chief Accounting Officer | ||
| (Principal Accounting Officer) |
Schedule II – Valuation and Qualifying Accounts
(in thousands)
|
Balance at Beginning of Year |
Additions Charged to Costs and Expenses |
Amounts Written-off Against the Allowance |
Balance at
End of Year |
|||||||||||||
|
Allowance for investments in real estate loans: |
||||||||||||||||
|
September 30, 2009 |
$ | 1,129 | $ | 456 | $ | − | $ | 1,585 | ||||||||
|
September 30, 2008 |
$ | 629 | $ | 500 | $ | − | $ | 1,129 | ||||||||
|
September 30, 2007 |
$ | 770 | $ | − | $ | (141 | ) | $ | 629 | |||||||
|
Allowance for investments in commercial finance assets: |
||||||||||||||||
|
September 30, 2009 |
$ | 1,750 | $ | 6,410 | $ | (4,950 | ) (1) | $ | 3,210 | |||||||
|
September 30, 2008 |
$ | 120 | $ | 7,505 | $ | (5,875 | ) | $ | 1,750 | |||||||
|
September 30, 2007 |
$ | − | $ | 229 | $ | (109 | ) | $ | 120 | |||||||
|
Allowance for investments in loans held for investments: |
||||||||||||||||
|
September 30, 2009 |
$ | 1,595 | $ | 1,738 | $ | (3,333 | ) (2) | $ | − | |||||||
|
September 30, 2008 |
$ | − | $ | 2,622 | $ | (1,027 | ) | $ | 1,595 | |||||||
|
September 30, 2007 |
$ | − | $ | − | $ | − | $ | − | ||||||||
|
(1) |
Includes $1.5 million reduction due to the sale of LCFF. |
|
(2) |
Includes $2.6 million reduction due to the sale of Apidos CDO VI. |
Resource America, Inc.
Real Estate and Accumulated Depreciation
September 30, 2009
(dollars in thousands)
|
Column A |
Column B |
Column C |
Column D |
Column E |
Column F |
Column G |
Column H |
Column I | ||||||||||||||
|
Description |
Encumbrances |
Initial cost to Company |
Cost capitalized subsequent to acquisition |
Gross Amount at which carried at close of period |
Accumulated Depreciation |
Date of Construction |
Date Acquired |
Life on which depreciation in latest income is computed | ||||||||||||||
|
Buildings and Land Improvements |
Improvements Carrying Costs |
Buildings and Land Improvements Total |
||||||||||||||||||||
|
Real estate owned: |
||||||||||||||||||||||
|
Hotel
Savannah, GA |
$ | 12,141 | $ | 10,187 | $ | 2,114 | $ | 16,519 | $ | 3,155 | 1853 |
6/30/2005 |
40 years | |||||||||
|
Commercial
Philadelphia, PA |
− | 2,874 | 82 | 2,956 | 56 | 1924 |
1/9/2009 |
37 years | ||||||||||||||
|
Office Building
Moberly, MI |
1,472 | 1,866 | − | 1,866 | 80 | 1998 |
11/30/2007 |
39 years | ||||||||||||||
|
Assets of consolidated
variable interest entities (a): |
||||||||||||||||||||||
|
Commercial Retail
St. Cloud, MI |
− | 2,300 | − | 2,300 | 633 | 1970 |
7/01/2003 |
40 years | ||||||||||||||
|
Commercial Retail
Elkins West, WV |
1,057 | 1,600 | − | 1,600 | 400 | 1963 |
7/01/2003 |
40 years | ||||||||||||||
| $ | 14,670 | $ | 18,827 | $ | 2,196 | $ | 25,241 | $ | 4,324 | |||||||||||||
|
(a) |
Balances as of June 30, 2009 due to one-quarter lag reporting. |
|
Years Ended September 30, |
||||||||||||
|
2009 |
2008 |
2007 |
||||||||||
|
Balance at the beginning of the period |
$ | 22,132 | $ | 19,410 | $ | 19,545 | ||||||
|
Additions during period: |
||||||||||||
|
Acquired through foreclosure |
2,874 | − | − | |||||||||
|
Improvements, etc. |
235 | 2,722 | 1,249 | |||||||||
|
Other – basis adjustments |
− | − | (91 | ) | ||||||||
| 25,241 | 22,132 | 20,703 | ||||||||||
|
Deductions during the period: |
||||||||||||
|
Cost of real estate sold |
− | − | 919 | |||||||||
|
Other − write-down |
− | − | 374 | |||||||||
|
Balance at close of period |
$ | 25,241 | $ | 22,132 | $ | 19,410 | ||||||
Resource America, Inc.
Mortgage Loans on Real Estate
September 30, 2009
(in thousands)
|
Column A |
Column B |
Column C |
Column D |
Column E |
Column F |
Column G |
Column H |
|||||||||||||||
|
Description |
Interest rate |
Final maturity date |
Periodic payment term |
Prior liens |
Face amount of mortgages |
Carrying amount of mortgages |
Principal amount of loans subject to delinquent principal or interest |
|||||||||||||||
|
Second Lien Loans |
||||||||||||||||||||||
|
Office building,
Washington, DC |
Fixed interest
rate of 8% |
8/1/2018 |
(a) |
$ | − | $ | 40,987 | $ | 2,815 | $ | − | |||||||||||
|
Office building,
Omaha, NE |
Fixed interest
rate of 8% |
8/31/2011 |
Monthly | − | 70 | 47 | − | |||||||||||||||
|
Multifamily unit,
Seabrook Village, NJ |
Fixed interest
rate of 6% |
11/30/2012 |
(a) |
− | 1,585 | 1,585 | − | |||||||||||||||
| $ | − | $ | 42,642 | $ | 4,447 | $ | − | |||||||||||||||
|
(a) |
No current payments. |
|
Years Ended September 30, |
|||||||||||||
|
2009 |
2008 |
2007 |
|||||||||||
|
Balance, beginning of the period |
(b) |
$ | 15,869 | $ | 27,759 | $ | 28,584 | ||||||
|
Additions: |
|||||||||||||
|
New loans |
− | − | 1,597 | ||||||||||
|
Additions to existing loans |
− | − | 42 | ||||||||||
|
Other |
(b) |
266 | 4,795 | 760 | |||||||||
| 16,135 | 32,554 | 30,983 | |||||||||||
|
Deductions: |
|||||||||||||
|
Foreclosed loans |
2,837 | − | − | ||||||||||
|
Collections of principal |
(b) |
8,851 | 16,685 | 3,224 | |||||||||
| 11,688 | 16,685 | 3,224 | |||||||||||
|
Balance, end of the period |
$ | 4,447 | $ | 15,869 | $ | 27,759 | |||||||
|
(b) |
This balance does not include a note receivable, which is not a mortgage, relating to a partial sale of our interest in a real estate venture. This note receivable was paid off during fiscal 2009. |