Attached files
| file | filename |
|---|---|
| 8-K - FORM 8-K - PRUDENTIAL FINANCIAL INC | d8k.htm |
Exhibit 99.1

PRUDENTIAL FINANCIAL, INC.
INVESTOR DAY 2009 DECEMBER 10, 2009
Forward-Looking Statements
Certain of the statements included in this presentation constitute forward-looking statements within the meaning of the U. S. Private Securities Litigation Reform Act of 1995. It is possible that actual results may differ materially from any expectations or predictions expressed in this presentation. Words such as “expects,” “believes,” “anticipates,” “includes,” “plans,” “assumes,” “estimates,” “projects,” “intends,” “should,” “will,” “shall,” or variations of such words are generally part of forward-looking statements. Forward-looking statements are made based on management’s current expectations and beliefs concerning future developments and their potential effects upon Prudential Financial, Inc. and its subsidiaries. There can be no assurance that future developments affecting Prudential Financial, Inc. and its subsidiaries will be those anticipated by management. These forward-looking statements are not a guarantee of future performance and involve risks and uncertainties, and there are certain important factors that could cause actual results to differ, possibly materially, from expectations or estimates reflected in such forward-looking statements, including, among others: (1) general economic, market and political conditions, including the performance and fluctuations of fixed income, equity, real estate and other financial markets, particularly in light of severe economic conditions and the severe stress experienced by the global financial markets since the second half of 2007; (2) the availability and cost of external financing for our operations, which has been affected by the stress experienced by the global financial markets; (3) interest rate fluctuations; (4) reestimates of our reserves for future policy benefits and claims; (5) differences between actual experience regarding mortality, morbidity, persistency, surrender experience, interest rates or market returns and the assumptions we use in pricing our products, establishing liabilities and reserves or for other purposes; (6) changes in our assumptions related to deferred policy acquisition costs, valuation of business acquired or goodwill; (7) changes in our claims-paying or credit ratings; (8) investment losses, defaults and counterparty non-performance; (9) competition in our product lines and for personnel; (10) changes in tax law; (11) economic, political, currency and other risks relating to our international operations; (12) fluctuations in foreign currency exchange rates and foreign securities markets; (13) regulatory or legislative changes, including government actions in response to the stress experienced by the global financial markets; (14) adverse determinations in litigation or regulatory matters and our exposure to contingent liabilities, including in connection with our divestiture or winding down of businesses; (15) domestic or international military actions, natural or man-made disasters including terrorist activities or pandemic disease, or other events resulting in catastrophic loss of life; (16) ineffectiveness of risk management policies and procedures in identifying, monitoring and managing risks; (17) effects of acquisitions, divestitures and restructurings, including possible difficulties in integrating and realizing the projected results of acquisitions; (18) changes in statutory or U.S. GAAP accounting principles, practices or policies; (19) changes in assumptions for retirement expense; (20) Prudential Financial, Inc.’s primary reliance, as a holding company, on dividends or distributions from its subsidiaries to meet debt payment obligations and the ability of the subsidiaries to pay such dividends or distributions in light of our ratings objectives and/or applicable regulatory restrictions; and (21) risks due to the lack of legal separation between our Financial Services Businesses and our Closed Block Business. As noted above, the period since the second half of 2007 has been characterized by extreme adverse market and economic conditions. The foregoing risks are even more pronounced in these unprecedented market and economic conditions. Prudential Financial, Inc. does not intend, and is under no obligation, to update any particular forward-looking statement included in this presentation.
Prudential Financial, Inc. of the United States is not affiliated with Prudential PLC which is headquartered in
the United Kingdom.
2 Investor Day 12.10.09
Non–GAAP Measures
This presentation includes references to “adjusted operating income.” Adjusted operating income is a non-GAAP measure of performance of our Financial Services Businesses. Adjusted operating income excludes “Realized investment gains (losses), net,” as adjusted, and related charges and adjustments. A significant element of realized investment gains and losses are impairments and credit-related and interest rate-related gains and losses. Impairments and losses from sales of credit-impaired securities, the timing of which depends largely on market credit cycles, can vary considerably across periods. The timing of other sales that would result in gains or losses, such as interest rate-related gains or losses, is largely subject to our discretion and influenced by market opportunities as well as our tax and capital profile.
Realized investment gains (losses) representing profit or loss of certain of our businesses which primarily originate investments for sale or syndication to unrelated investors, and those associated with terminating hedges of foreign currency earnings and current period yield adjustments are included in adjusted operating income. Realized investment gains and losses from products that are free standing derivatives or contain embedded derivatives, and from associated derivative portfolios that are part of an economic hedging program related to the risk of those products, are included in adjusted operating income. Adjusted operating income excludes gains and losses from changes in value of certain assets and liabilities related to foreign currency exchange movements that have been economically hedged, as well as gains and losses on certain investments that are classified as other trading account assets and debt that is carried at fair value.
Adjusted operating income also excludes investment gains and losses on trading account assets supporting insurance liabilities and changes in experience-rated contractholder liabilities due to asset value changes, because these recorded changes in asset and liability values are expected to ultimately accrue to contractholders. Trends in the underlying profitability of our businesses can be more clearly identified without the fluctuating effects of these transactions. In addition, adjusted operating income excludes the results of divested businesses, which are not relevant to our ongoing operations. Discontinued operations, which is presented as a separate component of net income under GAAP, is also excluded from adjusted operating income.
We believe that the presentation of adjusted operating income as we measure it for management purposes enhances understanding of the results of operations of the Financial Services Businesses by highlighting the results from ongoing operations and the underlying profitability of our businesses. However, adjusted operating income is not a substitute for income determined in accordance with GAAP, and the adjustments made to derive adjusted operating income are important to an understanding of our overall results of operations. The schedules on the following pages provide a reconciliation of adjusted operating income to income from continuing operations in accordance with GAAP.
Return on equity (“ROE”) based on adjusted operating income is determined by dividing adjusted operating income after-tax (giving effect to the direct equity adjustment for earnings per share calculation), annualized for interim periods, by average attributed equity for the Financial Services Businesses excluding accumulated other comprehensive income related to unrealized gains and losses on investments and accumulated other comprehensive income related to pension and postretirement benefits.
Our expectations of Common Stock earnings per share and ROE are based on after-tax adjusted operating income. Because we do not predict future realized investment gains / losses or recorded changes in asset and liability values that are expected to ultimately accrue to contractholders, we cannot provide a measure of our Common Stock earnings per share or ROE expectations based on income from continuing operations of the Financial Services Businesses, which is the GAAP measure most comparable to adjusted operating income.
For additional information about adjusted operating income and the comparable GAAP measure please refer to our Annual Report on Form 10-K for the year ended December 31, 2008 and our Quarterly Report on Form 10-Q for the quarter ended September 30, 2009 located on the Investor Relations Web site at www.investor.prudential.com. Additional historical information relating to the Company’s financial performance, including its third quarter 2009 Quarterly Financial Supplement, is also located on the Investor Relations website.
The information referred to above and on the prior page, as well as the risks of our businesses described in our Annual Report on Form 10-K for the year ended December 31, 2008 and our Quarterly Report on Form 10-Q for the quarter ended September 30, 2009, should be considered by readers when reviewing forward-looking statements contained in this presentation.
3 Investor Day 12.10.09
Reconciliations between adjusted operating income and the comparable GAAP measure
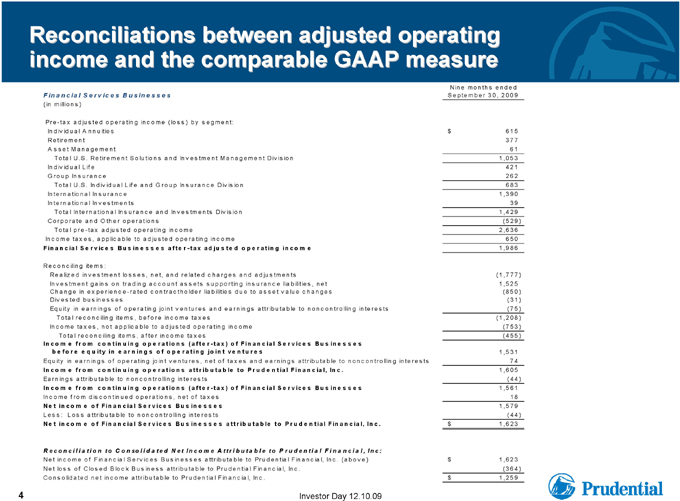
Financial Services Businesses Nine months ended September 30, 2009 (in millions) Pre-tax adjusted operating income (loss) by segment: Individual Annuities 615$ Retirement 377 Asset Management 61 Total U.S. Retirement Solutions and Investment Management Division 1,053 Individual Life 421 Group Insurance 262 Total U.S. Individual Life and Group Insurance Division 683 International Insurance 1,390 International Investments 39 Total International Insurance and Investments Division 1,429 Corporate and Other operations (529) Total pre-tax adjusted operating income 2,636 Income taxes, applicable to adjusted operating income 650 Financial Services Businesses after-tax adjusted operating income 1,986 Reconciling items: Realized investment losses, net, and related charges and adjustments (1,777) Investment gains on trading account assets supporting insurance liabilities, net 1,525 Change in experience-rated contractholder liabilities due to asset value changes (850) Divested businesses (31) Equity in earnings of operating joint ventures and earnings attributable to noncontrolling interests (75) Total reconciling items, before income taxes (1,208) Income taxes, not applicable to adjusted operating income (753) Total reconciling items, after income taxes (455) Income from continuing operations (after-tax) of Financial Services Businesses before equity in earnings of operating joint ventures 1,531 Equity in earnings of operating joint ventures, net of taxes and earnings attributable to noncontrolling interests 74 Income from continuing operations attributable to Prudential Financial, Inc. 1,605 Earnings attributable to noncontrolling interests (44) Income from continuing operations (after-tax) of Financial Services Businesses 1,561 Income from discontinued operations, net of taxes 18 Net income of Financial Services Businesses 1,579 Less: Loss attributable to noncontrolling interests (44) Net income of Financial Services Businesses attributable to Prudential Financial, Inc. $1,623 Reconciliation to Consolidated Net Income Attributable to Prudential Financial, Inc: Net income of Financial Services Businesses attributable to Prudential Financial, Inc. (above) $1,623 Net loss of Closed Block Business attributable to Prudential Financial, Inc. (364) Consolidated net income attributable to Prudential Financial, Inc. $1,259
4 Investor Day 12.10.09
Reconciliations between adjusted operating income and the comparable GAAP measure (continued)
Nine months ended
Financial Services Businesses
September 30, 2009
(in millions, except per share data)
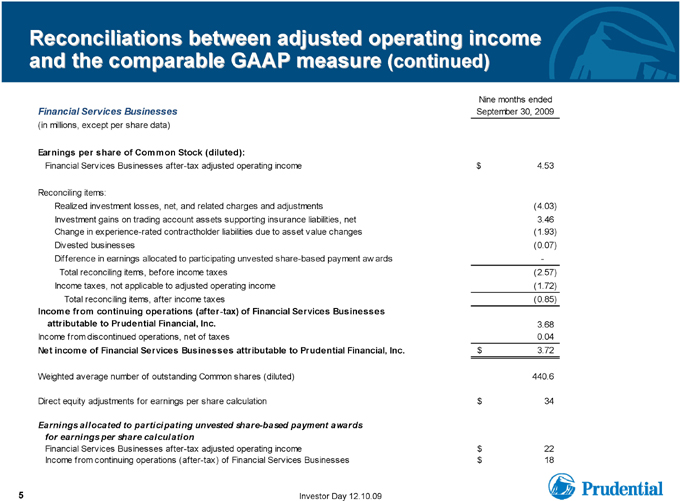
Earnings per share of Common Stock (diluted):
Financial Services Businesses after-tax adjusted operating income
$4.53
Reconciling items:
Realized investment losses, net, and related charges and adjustments
(4.03)
Investment gains on trading account assets supporting insurance liabilities, net
3.46
Change in experience-rated contractholder liabilities due to asset value changes
(1.93)
Divested businesses
(0.07)
Difference in earnings allocated to participating unvested share-based payment awards
—
Total reconciling items, before income taxes
(2.57)
Income taxes, not applicable to adjusted operating income
(1.72)
Total reconciling items, after income taxes
(0.85)
Income from continuing operations (after-tax) of Financial Services Businesses attributable to Prudential Financial, Inc.
3.68
Income from discontinued operations, net of taxes
0.04
Net income of Financial Services Businesses attributable to Prudential Financial, Inc.
$3.72
Weighted average number of outstanding Common shares (diluted)
440.6
Direct equity adjustments for earnings per share calculation
$34
Earnings allocated to participating unvested share-based payment awards for earnings per share calculation
Financial Services Businesses after-tax adjusted operating income
$22
Income from continuing operations (after-tax) of Financial Services Businesses
$18
5 Investor Day 12.10.09
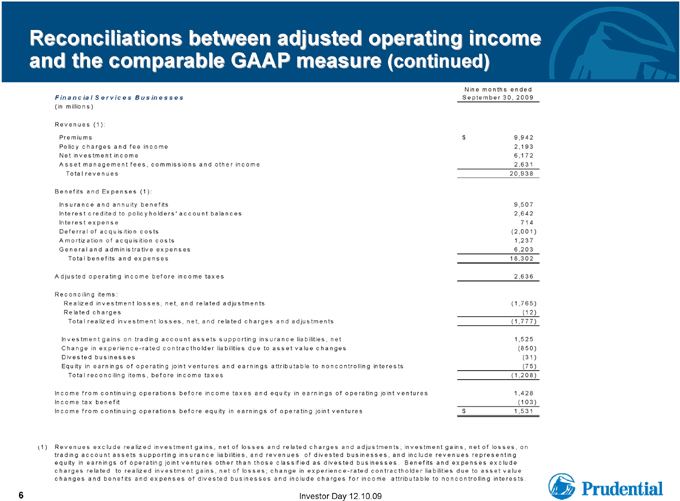
Reconciliations between adjusted operating income and the comparable GAAP measure (continued)
Financial Services Businesses Nine months ended September 30, 2009 (in millions) Revenues (1): Premiums $9,942 Policy charges and fee income 2,193 Net investment income 6,172 Asset management fees, commissions and other income 2,631 Total revenues 20,938 Benefits and Expenses (1): Insurance and annuity benefits 9,507 Interest credited to policyholders’ account balances 2,642 Interest expense 714 Deferral of acquisition costs (2,001) Amortization of acquisition costs 1,237 General and administrative expenses 6,203 Total benefits and expenses 18,302 Adjusted operating income before income taxes 2,636 Reconciling items: Realized investment losses, net, and related adjustments (1,765) Related charges (12) Total realized investment losses, net, and related charges and adjustments (1,777) Investment gains on trading account assets supporting insurance liabilities, net 1,525 Change in experience-rated contractholder liabilities due to asset value changes (850) Divested businesses (31) Equity in earnings of operating joint ventures and earnings attributable to noncontrolling interests (75) Total reconciling items, before income taxes (1,208) Income from continuing operations before income taxes and equity in earnings of operating joint ventures 1,428 Income tax benefit (103) Income from continuing operations before equity in earnings of operating joint ventures $1,531 (1) Revenues exclude realized investment gains, net of losses and related charges and adjustments; investment gains, net of losses, on trading account assets supporting insurance liabilities, and revenues of divested businesses, and include revenues representing equity in earnings of operating joint ventures other than those classified as divested businesses. Benefits and expenses exclude charges related to realized investment gains, net of losses; change in experience-rated contractholder liabilities due to asset value changes and benefits and expenses of divested businesses and include charges for income attributable to noncontrolling interests.
6 Investor Day 12.10.09

PRUDENTIAL FINANCIAL, INC.
FINANCIAL OUTLOOK
RICH CARBONE
EXECUTIVE VICE PRESIDENT AND CHIEF FINANCIAL OFFICER
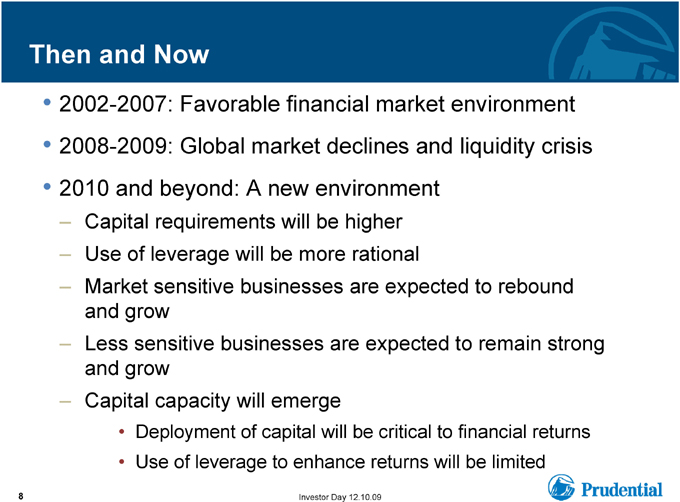
Then and Now
• 2002-2007: Favorable financial market
environment
• 2008-2009: Global market declines and liquidity crisis
• 2010 and beyond: A new environment
– Capital requirements will be higher
– Use of leverage will be more rational
– Market sensitive businesses are expected to rebound and grow
– Less sensitive businesses are expected to remain strong and grow
– Capital capacity will emerge
• Deployment of capital will be critical to financial returns
• Use of leverage to enhance returns will be limited
| 8 |
|
Investor Day 12.10.09 |
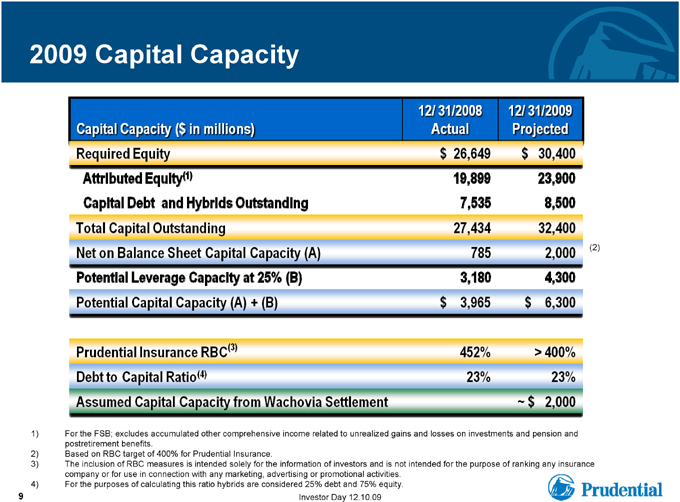
2009 Capital Capacity
12/31/2008 12/31/2009
Capital Capacity ($ in millions) Actual Projected
Required Equity $ 26,649 $ 30,400
Attributed Equity(1) Capital Debt and Hybrids Outstanding
Total Capital Outstanding 19,899 23,900 7,535 8,500
27,434 32,400
Net on Balance Sheet Capital Capacity (A) 785 2,000 (2)
Potential Leverage Capacity at 25% (B) 3,180 4,300
Potential Capital Capacity (A) + (B) $ 3,965 $ 6,300
Prudential Insurance RBC(3) 452% > 400%
Debt to Capital Ratio(4) 23% 23%
Assumed Capital Capacity from Wachovia Settlement ~$ 2,000
1) For the FSB; excludes accumulated other comprehensive income related to unrealized gains and losses on investments and pension and postretirement benefits.
2) Based on RBC target of 400% for Prudential Insurance.
3) The inclusion of RBC measures is intended solely for the information of investors and is not intended for the purpose of ranking any insurance company or for use in connection with any marketing, advertising or promotional activities.
4) For the purposes of calculating this ratio hybrids are considered 25% debt and 75% equity.
9 Investor Day 12.10.09
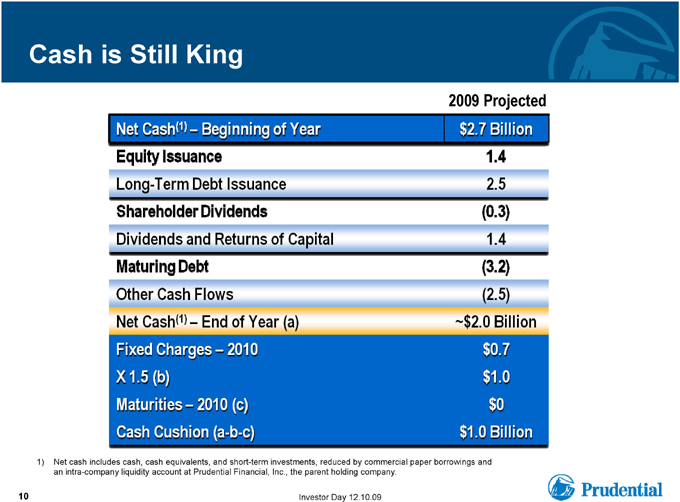
Cash is Still King
2009 Projected
Net Cash (1)-Beginning of Year
$2.7 Billion
Equity Issuance
Long-Term Debt Issuance
1.4
2.5
Shareholder Dividends
Dividends and Returns of Capital
(0.3)
1.4
Maturing Debt
(3.2)
Other Cash Flows
Net Cash (1)-End of Year (a)
(2.5) -$2.0 Billion
Fixed Charges-2010 X1.5(b) Maturities-2010(c) Cash Cushion (a-b-c)
$1.0 Billion
| 1) |
|
Net cash includes cash, cash equivalents, and short-term investments, reduced by commercial paper borrowings and an intra-company liquidity account at Prudential Financial, Inc., the parent holding company. |
10 Investor Day 12.10.09
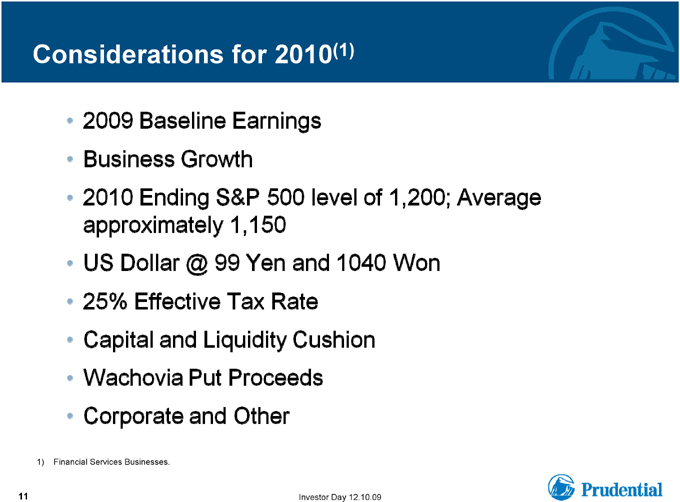
Considerations for 2010(1)
2009 Baseline Earnings
Business Growth
2010 Ending S&P 500 level of 1,200; Average
approximately 1,150
US Dollar @ 99 Yen and 1040 Won
25% Effective Tax Rate Capital and Liquidity Cushion Wachovia Put Proceeds Corporate and Other
1) Financial Services Businesses.
11 Investor Day 12.10.09

2010 EARNINGS
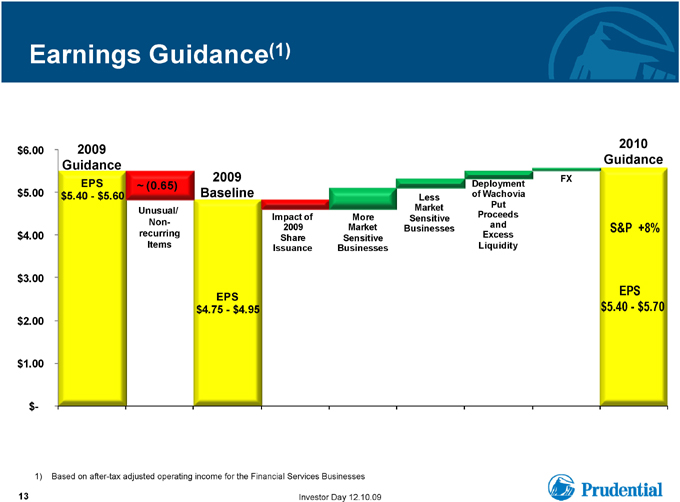
Earnings Guidance(1)
2009 2010
$6.00
Guidance Guidance 2009 FX
$5.00 EPS ~ (0.65) Deployment $5.40—$5.60 Baseline Less of Wachovia Market Put Unusual/ Proceeds Impact of More Sensitive Non- and
2009 Market Businesses S&P +8% $4.00 recurring Excess Share Sensitive Items Issuance Businesses Liquidity
$3.00
EPS
EPS $4.75—$4.95 $5.40—$5.70 $2.00
$1.00
$-
1) Based on after-tax adjusted operating income for the Financial Services Businesses
13 Investor Day 12.10.09

LONG TERM ROE CONSIDERATIONS
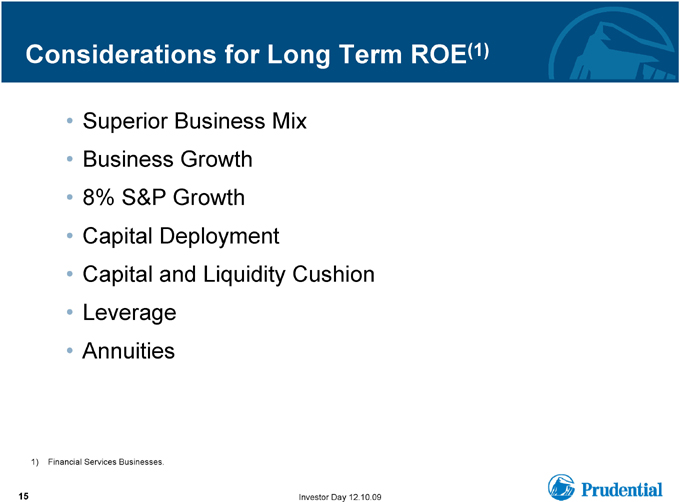
Considerations for Long Term ROE(1)
• Superior Business Mix
• Business Growth
• 8% S&P Growth
• Capital Deployment
• Capital and Liquidity Cushion
• Leverage
• Annuities
1) Financial Services Businesses.
15 Investor Day 12.10.09
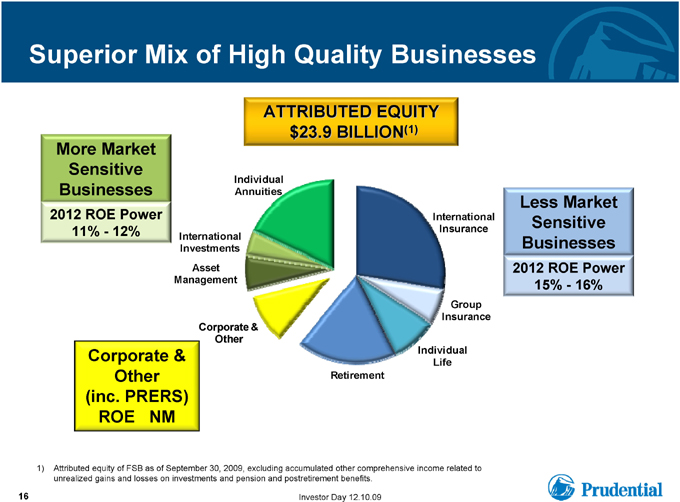
Superior Mix of High Quality Businesses
ATTRIBUTED EQUITY
$23.9 BILLION(1) More Market Sensitive
Individual
Businesses Annuities
Less Market
2012 ROE Power International Sensitive
11%—12% Insurance
International Businesses Investments
Asset 2012 ROE Power
Management 15%—16% Group Insurance Corporate & Other
Corporate & Individual
Life Other Retirement
(inc. PRERS) ROE NM
| 1) |
|
Attributed equity of FSB as of September 30, 2009, excluding accumulated other comprehensive income related to unrealized gains and losses on investments and pension and postretirement benefits. |
16 Investor Day 12.10.09
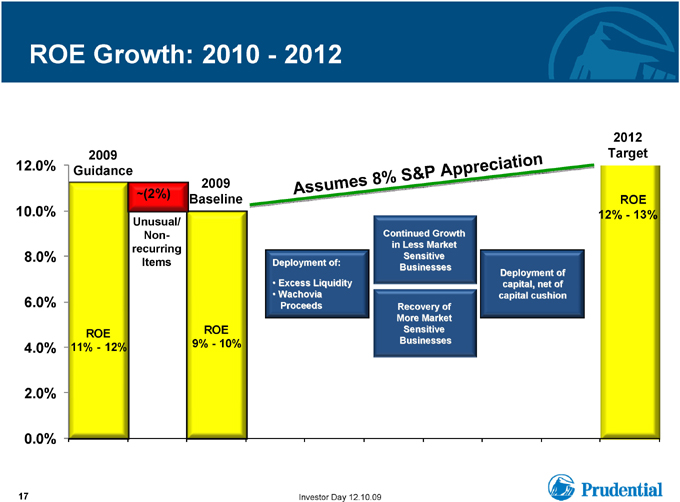
ROE Growth: 2010 -2012
12.0%ROE Growth: 2010 -2012 Assumes 8% S&P Appreciation Unusual/ Non-recurring Items 17 Investor Day 12.10.09 Deployment of: Deployment of: ••Excess Liquidity Excess Liquidity ••Wachovia Wachovia Proceeds Proceeds Deployment of Deployment of capital, net of capital, net of capital cushion capital cushion Continued Growth Continued Growth in Less Market in Less Market Sensitive Sensitive Businesses Businesses Recovery of Recovery of More Market More Market Sensitive Sensitive Businesses Businesses ROE12% -13%2009 Guidance 2009 Baseline 2012 Target
Unusual/ Non-recurring Items
~(2%)
ROE9% -10%
ROE11% -12%
12.0%
10.0%
0.0% 2.0% 4.0% 6.0%
8.0%
17 Investor Day 12.10.09

PRUDENTIAL FINANCIAL, INC.
JOHN STRANGFELD
CHAIRMAN AND CEO
ROE Targets
| • |
|
Achieve 12-13% in “normal” markets by 2012; not a “final” destination |
| • |
|
Business mix and performance drive ROE |
| • |
|
Capital cushion is a near-term drag; redeployment is an opportunity |
| • |
|
Invest to produce appropriate returns; manage capital cushion to appropriate levels |
19 Investor Day 12.10.09
Summary
| • |
|
Balanced portfolio of good businesses with favorable growth and return prospects |
| • |
|
Superior value propositions, strengthened by recent market meltdown |
| • |
|
Gaining ground: enhanced competitive position |
| • |
|
Strong capital position enables pursuit of business opportunities, both organic and “external” |
| • |
|
Risk management supports sustained financial strength |
| • |
|
Focus on talent and leadership at the highest levels |
| • |
|
Financial performance: expect to be a leader among our peers |
20 Investor Day 12.10.09