Attached files
| file | filename |
|---|---|
| 8-K - FORM 8-K - FMC CORP | d8k.htm |
 FMC
Corporation Bank of America Merrill Lynch Global Industries Conference New York, NY December 10, 2009 William G. Walter Chairman, President and CEO Exhibit 99.1 |
 1 Disclaimer Safe Harbor Statement under the Private Securities Litigation Reform Act of 1995 These slides and the accompanying presentation contain “forward-looking
statements” that represent management’s best judgment as of the date hereof based on information currently available. Actual results of the Company may differ materially from those contained in the forward-looking statements.
Additional information concerning factors that may cause results to differ materially from those in the forward-looking statements is contained in the
Company’s periodic reports filed under the Securities Exchange Act of 1934,
as amended. The Company undertakes no obligation to update or revise these forward- looking statements to reflect new events or uncertainties. Non-GAAP Financial Terms These slides contain certain “non-GAAP financial terms” which are defined in the appendix. In addition, we have provided reconciliations of non-GAAP terms
to the closest GAAP term in the appendix. |
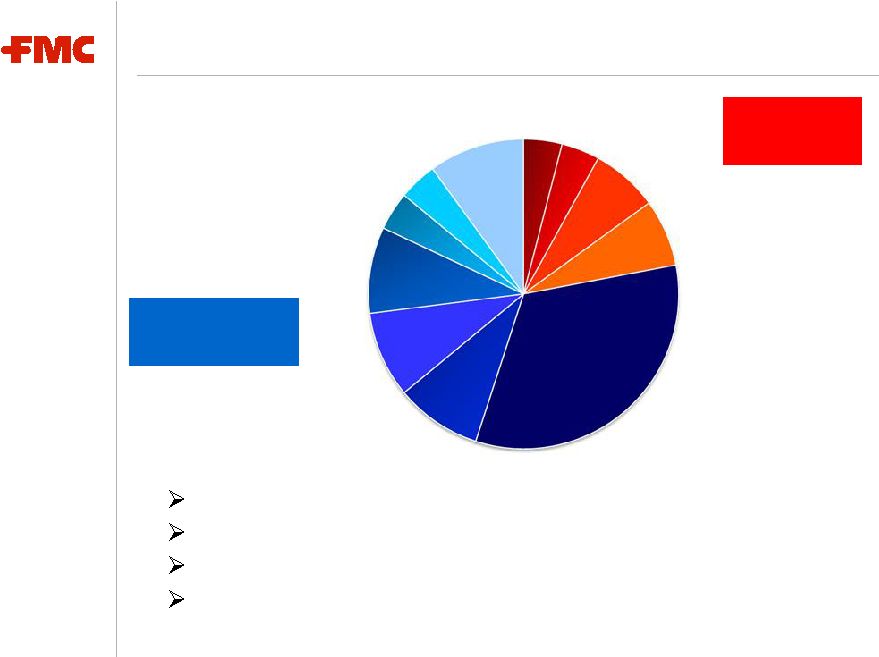
 2 FMC Corporation LTM ending September 30, 2009 ($ millions) FMC CORPORATION Revenue: $2,842 EBITDA:
$599 Margin*:
21.1% * EBITDA margin Leading Market Positions Diverse End Markets - Low Correlation to Economic Cycles Diversified and Integrated Cost Structure Limited Dependence on Petrochemical Feedstocks AGRICULTURAL PRODUCTS Revenue: $1,023 EBITDA: $288 Margin*: 28.1% SPECIALTY CHEMICALS Revenue: $749 EBITDA: $186 Margin*: 24.8% INDUSTRIAL CHEMICALS Revenue: $1,075 EBITDA: $180 Margin*: 16.7% |
 3 Realizing the inherent operating leverage within FMC • Sustaining earnings growth > 10% per year (1) • Maintaining return on capital > 12% Focusing the portfolio on higher growth businesses • Managing Specialty Chemicals and Agricultural Products for growth • Managing Industrial Chemicals for cash Maintaining financial strength and flexibility • Solid balance sheet, LTM EBITDA > Net debt (2) • Issued $300 million 10-year Senior Notes to extend maturity profile • Conservative liquidity position • Strong cash flow Disciplined Approach to Unlocking Value (1) Earnings before restructuring and other income and charges (2) As of September 30, 2009 |
 4 Leading Market Positions (1) Based on 2008 consolidated sales
(2) Shared Industrial Chemicals #1 in N.A. Soda Ash #1 in N.A. (2) Peroxygens #1 Globally Carrageenan #1 Globally Carbofuran #2 in N.A. Pyrethroids Agricultural Products #1 Globally Alginates Specialty Chemicals #1 Globally (2) #1 Globally Lithium Specialties Microcrystalline Cellulose Product Group Position (1) |
 5 Global Presence Agricultural Products Group Industrial Chemicals Group Specialty Chemicals Group Manufacturing Facilities: Based on 2008 Consolidated Sales North America 34% of Sales Latin America 24% of Sales Europe / Middle East / Africa 28% of Sales Asia / Pacific 14% of Sales |
 6 Diversified Customers and End Markets Approximately 78% of sales to non GDP-cyclical end markets Long-term relationships with blue chip customers No single customer represents more than 3% of sales Top 10 customers in total represent ~ 12% of sales Food 9% Pharmaceuticals 9% Other 10% Flat Glass 4% Pulp & Paper 4% Chemicals 7% Other 7% Container Glass 4% Detergents 9% Agriculture 33% Chemicals 4% Non-Cyclical 78% Cyclical 22% Based on 2008 Consolidated Sales |
 7 Diversified and Integrated Cost Structure Low-cost sourcing of raw materials - Backward integration: soda ash, lithium - Global sourcing of renewable resources: wood pulp, seaweed Low reliance on purchased raw materials - Total raw materials represent ~ 32% of cost of sales in 2008 - No single raw material accounted for over 12% of total raw material purchases in 2008 - Reduced volatility from limited use of petrochemical feed stocks Low energy demand requirements - Energy costs represent ~ 13% of cost of sales - Inputs are natural gas, electricity, coal and fuel oil |
 8 Agricultural Products Based on 2008 Consolidated Sales of $1.1 billion Strong niche positions in the Americas, Europe and Asia Proprietary, branded insecticides and herbicides Strategic Focus: • Selected products, crops and regions • Shifting to significantly shorter innovation cycle • Reducing global supply chain and overhead costs |
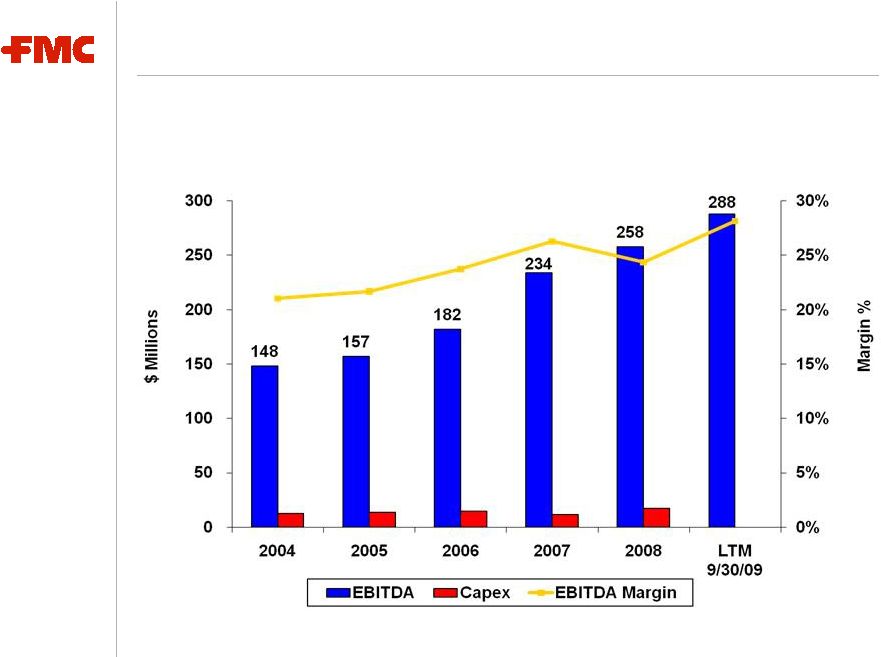 9 Agricultural Products Financial Performance 2009 segment earnings growth in the high teens -- reflecting higher selling prices, continued supply chain productivity improvements, lower raw material costs and lower selling and administrative expense |
 10 Specialty Chemicals BioPolymers – pharmaceutical and food ingredients Lithium focus on specialties – pharmaceuticals and energy storage Strategic Focus: • Growing core market segments • Commercializing new technology platforms • Pursuing financially attractive bolt-on acquisitions Based on 2008 Consolidated Sales of $764 million |
 11 Specialty Chemicals Financial Performance 2009 segment earnings up in the mid-single digits -- driven by strong BioPolymer results partially offset by lower lithium performance |
 12 Industrial Chemicals Based on 2008 Consolidated Sales of $1.3 billion #1 North American manufacturer of soda ash and peroxygens Low cost, proprietary production technologies Strategic Focus: - Managing for cash generation - Aligning capacity to highest margin markets - Controlling costs and increasing productivity |
 13 Industrial Chemicals Financial Performance 2009 segment earnings down approximately 55 percent -- driven primarily by lower volumes across the segment and reduced phosphate selling prices
|
 14 FMC in Summary Great businesses, each with EBITDA >$180 million Sustained double-digit earnings growth (1) • Diverse end-markets, low correlation to economic cycles • Diversified and integrated cost structure • Products aligned with global secular growth trends Strategic and financial flexibility • Solid balance sheet • Conservative liquidity profile • Strong cash flow Disciplined approach to unlocking value (1) Earnings before restructuring and other income and charges
|
 FMC
Corporation |
 FMC
Corporation Glossary of Financial Terms & Reconciliations of GAAP to Non-GAAP |
 17 Non-GAAP Financial Terms These slides contain certain “non-GAAP financial terms” which are defined below. In addition, we have provided reconciliations of non-GAAP terms to the closest GAAP term in the appendix of this presentation. EBITDA (Earnings Before Interest, Taxes, Depreciation and Amortization) is the sum of Income (loss) from continuing operations before income taxes and Depreciation and Amortization. EBITDA Margin is the quotient of EBITDA (defined above) divided by Revenue. ROIC (Return on Invested Capital) is the sum of Earnings from continuing operations before restructuring and other income and charges and after- tax Interest expense divided by the sum of Short-term debt, Current portion of long-term debt, Long-term debt and Total shareholders’ equity.
|
 18 Segment Financial Terms These slides contain references to segment financial items. Some of the segment financial terms are “non-GAAP financial terms” and are defined below. In addition, we have provided reconciliations of non-GAAP terms to the closest GAAP term in the appendix of this presentation. EBITDA (Earnings Before Interest, Taxes, Depreciation and Amortization) for a segment is the sum of Income (loss) from continuing operations before income taxes for that segment and Depreciation and Amortization for that segment. EBITDA Margin for a segment is the quotient of EBITDA (defined above) divided by Revenue for that segment. |
 19 Reconciliation of consolidated income from continuing operations before income taxes (a GAAP measure) to EBITDA (a Non-GAAP measure) EBITDA Reconciliation: LTM 9/30/2009 (Unaudited, in $ millions) LTM 9/30/2009 Income (loss) from continuing operations before income taxes $336.0 Net Income attributable to non-controlling interests (11.2) Restructuring and other charges/(income), net 116.5 Impairment of Perorsa Joint Venture 1.4 Purchase accounting inventory fair value impact and other related inventory adjustments 6.0 Interest expense, net 27.1 Depreciation and amortization 123.4 EBITDA (Non-GAAP) $599.2 |
 20 Reconciliation of Segment Operating Profit (a GAAP measure) to EBITDA (a Non-GAAP measure) Segment EBITDA Reconciliation: LTM 9/30/2009 (Unaudited, in $ millions) LTM 9/30/2009 Segment Industrial Chemicals Specialty Chemicals Agricultural Products Segment Operating Profit (GAAP) $110.3 $154.6 $275.9 Add: Depreciation and Amortization 69.5 30.9 11.8 EBITDA (Non-GAAP) $179.8 $185.5 $287.7 |
 FMC
Corporation |