Attached files
| file | filename |
|---|---|
| EX-32.1 - China Botanic Pharmaceutical | v167850_ex32-1.htm |
| EX-23.1 - China Botanic Pharmaceutical | v167850_ex23-1.htm |
| EX-31.2 - China Botanic Pharmaceutical | v167850_ex31-2.htm |
| EX-31.1 - China Botanic Pharmaceutical | v167850_ex31-1.htm |
| EX-32.2 - China Botanic Pharmaceutical | v167850_ex32-2.htm |
UNITED
STATES
SECURITIES
AND EXCHANGE COMMISSION
Washington,
D.C. 20549
Form
10-K
Amendment
No. 1
|
x
|
ANNUAL REPORT UNDER SECTION 13 OR
15(d) OF THE SECURITIES EXCHANGE ACT OF
1934
|
For
the fiscal year ended October 31, 2008
OR
|
o
|
TRANSITION REPORT UNDER SECTION 13 OR 15(d) OF
THE SECURITIES EXCHANGE ACT OF
1934
|
For the
transition period from_____________ to _____________.
Commission
file number O-24512
RENHUANG
PHARMACEUTICALS, INC.
(Exact
name of registrant as specified in its charter)
|
Nevada
|
88-1273503
|
|
(State
or other jurisdiction of
|
(I.R.S.
Employer
|
|
incorporation
or organization)
|
Identification
No.)
|
|
No.
218, Taiping, Taiping District
|
|
|
Harbin,
Heilongjiang Province,
|
|
|
P.R.
China
|
150050
|
|
(Address
of principal executive offices)
|
(Zip
Code)
|
Registrant’s
telephone number, including area code +86-451-5762-0378
Securities
registered pursuant to Section 12(b) of the Act: None
Securities
registered pursuant to Section 12(g) of the Act:
Common
Stock, par value $0.001
(Title of
class)
Indicate
by check mark if the registrant is a well-known seasoned issuer, as defined in
Rule 405 of the Securities Act. Yes o No x
Indicate
by check mark if the registrant is not required to file reports pursuant to
Section 13 or 15(d) of the Act. Yes x No o
Indicate
by check mark whether the registrant (1) has filed all reports required to be
filed by Section 13 or 15(d) of the Securities Exchange Act of 1934 during the
preceding 12 months (or for such shorter period that the registrant was required
to file such reports), and (2) has been subject to such filing requirements for
the past 90 days. Yes o No x
Indicate
by check mark whether the registrant has submitted electronically and posted on
its corporate Web site, if any, every Interactive Data File required to be
submitted and posted pursuant to Rule 405 of Regulation S-T ( 229.405 of this
chapter) during the preceeding 12 months (or for such shorter period that the
registrant was required to submit and post such files). Yes o No o
Indicate
by check mark if disclosure of delinquent filers pursuant to Item 405 of
Regulation S-K is not contained herein, and will not be contained, to the best
of registrant's knowledge, in definitive proxy or information statements
incorporated by reference in Part III of this Form 10-K or any amendment to this
Form 10-K. o
Indicate
by check mark whether the registrant is a large accelerated filer, an
accelerated filer, a non-accelerated filer, or a smaller reporting
company. See definition of “accelerated filer, large accelerated
filer and smaller reporting company” in Rule 12b-2 of the Exchange Act. (Check
one):
|
Large
accelerated filer
|
Accelerated
filer
|
|
Non-accelerated
filer
|
Smaller
reporting company x
|
|
(Do
not check if a smaller reporting company)
|
Indicate
by check mark whether the registrant is a shell company (as defined in Rule
12b-2 of the Act). Yes o No x
Aggregate
market value of the voting stock held by non-affiliates: $14,228,511 as based on
sales price of $0.825 per share of such stock on April 30, 2008. The voting
stock held by non-affiliates on that date consisted of 17,246,680 shares of
common stock.
As of
November 23, 2009, there were 37,239,536 shares of common stock, par value
$0.001, issued and outstanding.
EXPLANATORY
NOTE
As
previously announced in a Current Report on Form 8-K (the “Form 8-K”) filed by
Renhuang Pharmaceuticals, Inc. (the “Company”) with the Securities and Exchange
Commission (the “SEC”) on October 1,, 2009,and as amended on Form 8-K/A (the
“Form 8-K/A”) filed with the SEC on November 13, 2009, the Company’s management
concluded that the Company’s previously filed financial statements as of and for
the fiscal year ended October 31, 2008, as filed with the SEC on Form 10-K on
September 9, 2009, should no longer be relied upon due to certain significant
accounting errors. The accounting errors are described in the Form 8-K/A, which
include errors in: consolidated balance sheet table, consolidated statements of
income and comprehensive income table, consolidated statements of changes in
stockholders’ equity table, and consolidated statements of cash flows
table.
The
Company has attached to this 10-K/A updated certifications executed as of the
date of this Form 10-K/A by the Chief Executive Officer and Chief Financial
Officer as required by Sections 302 and 906 of the Sarbanes Oxley Act of 2002.
These updated certifications are attached as Exhibits 31.1, 31.2, 32.1 and 32.2
to this 10-K/A.
Renhuang
Pharmaceuticals, Inc.
TABLE OF
CONTENTS
|
PART
I
|
|
|
ITEM
1 – BUSINESS
|
3
|
|
ITEM
1A – RISK FACTORS
|
18
|
|
ITEM
1B – UNRESOLVED STAFF COMMENTS
|
26
|
|
ITEM
2 - PROPERTIES
|
26
|
|
ITEM
3 - LEGAL PROCEEDINGS
|
27
|
|
ITEM
4 – SUBMISSION OF MATTERS TO A VOTE OF SECURITY HOLDERS
|
27
|
|
PART
II
|
|
|
ITEM
5 – MARKET FOR REGISTRANT’S COMMON EQUITY, RELATED STOCKHOLDER MATTERS AND
ISSUER PURCHASES OF EQUITY SECURITIES
|
27
|
|
ITEM
6 – SELECTED FINANCIAL DATA
|
28
|
|
ITEM
7 – MANAGEMENT’S DISCUSSION AND ANALYSIS OF FINANCIAL CONDITION AND
RESULTS OF OPERATION
|
28
|
|
ITEM
7A – QUANTITATIVE AND QUALITATIVE DISCLOSURES ABOUT MARKET
RISK
|
32
|
|
ITEM
8 – FINANCIAL STATEMENTS AND SUPPLEMENTARY DATA
|
32
|
|
ITEM
9 – CHANGES IN AND DISAGREEMENTS WITH ACCOUNTANTS ON ACCOUNTING AND
FINANCIAL DISCLOSURE
|
33
|
|
ITEM
9A(T) – CONTROLS AND PROCEDURES
|
33
|
|
ITEM
9B – OTHER INFORMATION
|
34
|
|
PART
III
|
|
|
ITEM
10 – DIRECTORS, EXECUTIVE OFFICERS AND CORPORATE GOVERNACE
|
34
|
|
ITEM
11 – EXECUTIVE COMPENSATION
|
36
|
|
ITEM
12 – SECURITY OWNERSHIP OF CERTAIN BENEFICIAL OWNERS AND MANAGEMENT AND
RELATED STOCKHOLDER MATTERS
|
39
|
|
ITEM
13 - CERTAIN RELATIONSHIPS AND RELATED TRANSACTIONS, AND DIRECTOR
INDEPENDENCE
|
40
|
|
ITEM
14 – PRINCIPAL ACCOUNTING FEES AND SERVICES
|
40
|
|
PART
IV
|
|
|
ITEM
15 - EXHIBITS, FINANCIAL STATEMENT SCHEDULES
|
41
|
2
PART
I
Cautionary
Note
This
Annual Report includes forward-looking statements within the meaning of the
Securities Exchange Act of 1934 (the “Exchange Act”). These statements are based
on management’s beliefs and assumptions, and on information currently available
to management. Forward-looking statements include the information concerning
possible or assumed future results of operations of the Company set forth under
the heading “Management's Discussion and Analysis of Financial Condition or Plan
of Operation.” Forward-looking statements also include statements in which words
such as “expect,” “anticipate,” “intend,” “plan,” “believe,” “estimate,”
“consider” or similar expressions are used.
Forward-looking
statements are not guarantees of future performance. They involve risks,
uncertainties and assumptions. The Company's future results and shareholder
values may differ materially from those expressed in these forward-looking
statements. Readers are cautioned not to put undue reliance on any
forward-looking statements.
ITEM
1 – BUSINESS
Business
Overview
History
of Renhuang Pharmaceuticals, Inc.
We were
incorporated in the State of Nevada on August 18, 1988 as Solutions,
Incorporated. Since that time, we have undergone a series of name changes as
follows: Suarro Communications, Inc., e-Net Corporation, e-Net Financial Corp.,
e-Net.Com Corporation, e-Net Financial.Com Corporation, Anza Capital, Inc.
(“Anza”) and finally on July 28, 2006, we changed our name to Renhuang
Pharmaceuticals, Inc.
On March
3, 2006, we completed the disposition of substantially all of our assets and
discontinued our operations, including but not limited to, all of our ownership
interest in our subsidiary, American Residential Funding, Inc., a Nevada
corporation (“AMRES”) to AMRES Holding, LLC, a Nevada limited liability company
(“AMRES Holding”) under control of Vince Rinehart, a shareholder and, at that
time, our sole officer and director (“Rinehart”). Effective September 30, 2005,
the disposition was approved by written consent of a majority of our
stockholders.
In
exchange for substantially all of our assets, including but not limited to, all
of our ownership interest in AMRES, (i) Rinehart delivered a majority of his
ownership interest in Anza, consisting of 831,375 shares of common stock and
1,880,000 shares of our common stock acquired upon the conversion of 18,800
shares of Series F Convertible Preferred Stock, to Viking Investments USA, Inc.,
a Delaware corporation (“Viking”). Rinehart kept 156,900 shares of our common
stock; (ii) Rinehart terminated an Employment Agreement dated June 1, 2001, by
and between Rinehart and Anza; (iii) AMRES assumed all obligations under a real
property lease by and between Anza and Fifth Street Properties-DS, LLC; (iv)
AMRES delivered to Viking its ownership interest in Anza, consisting of
4,137,500 shares of our common stock; and (v) AMRES Holding delivered warrants
to acquire 250,000 shares of our common stock to Viking.
On August
11, 2006, our outstanding common stock underwent a thirty-for-one stock split
reversal resulting in a decrease in our outstanding common stock at that time
from 13,355,181 shares to approximately 445,240 shares as further described in
our Current Report filed with the Commission on April 25, 2006. All
share amounts herein have been adjusted to reflect this reverse
split.
3
History
of Harbin Renhuang Pharmaceutical Co. Ltd. and Harbin Renhuang Pharmaceutical
Stock Co. Ltd.
Harbin
Renhuang Pharmaceutical Stock Co. Ltd. (“Old Renhuang”) was incorporated in 1996
in the Peoples Republic of China (“PRC”). Harbin Renhuang Pharmaceutical Co.
Ltd. (“Renhuang China”) was incorporated in February 2006 in the PR C. On
March 3, 2006 Renhuang Medicine for Animals, a company controlled by Mr. Li
Shaoming, invested 25 million Renminbi (or “RMB” then equal to
approximately US $3.3 million) in cash in Renhuang China. On May 1, 2006 Old
Renhuang transferred the majority of its operating assets, except buildings, to
Renhuang China at the carrying amounts of Old Renhuang.
As a
result, as of May 1, 2006, nearly 100% of revenue producing operations in Old
Renhuang were transferred to Renhuang China.
Merger
of Renhuang Pharmaceuticals and Harbin Renhuang
On August
28, 2006, Renhuang Pharmaceuticals, Inc., a Nevada corporation (the “Company”)
and a corporation incorporated under the laws of the British Virgin Island named
Harbin Renhuang Pharmaceutical Company Limited (the “BVI”) entered into a Share
Exchange Agreement (the “Agreement”) pursuant to which the Company acquired all
of the outstanding capital stock of BVI in exchange for issuing 29,750,000
shares of the Company’s common stock, par value $0.001 per share (the ‘‘Common
Stock’’) to BVI’s stockholders, representing 85% of the Company’s capital stock
on a fully diluted basis after taking into account the contemplated
transaction. BVI is a holding company and at the time owned 100% of Renhuang
China. This transaction is referred to throughout this report as the
“Merger.”
Post-Merger
Business
As a
result of the Merger, all of our operations are conducted through Renhuang China
which is a wholly-owned subsidiary of the BVI which is in turn a
wholly-owned subsidiary of the Company. Unless otherwise noted in this Annual
Report on Form 10-K all references to “we,” “us,” “our company,” “our,” or the
“Company” refer to the consolidated entity of Renhuang Pharmaceuticals, Inc.,
and its subsidiaries.
Renhuang
China was incorporated in 2006 and is located in the capital of the province of
Heilongjiang Province, in the northeastern corner of China. We are primarily
engaged in the fields of research, manufacturing and distribution of Chinese
medical products and bio-pharmaceutical products in the PRC. Our niche market is
production and sale of traditional Chinese medical products and
bio-pharmaceutical products, and our goal is to become the dominant manufacturer
and supplier of a few carefully selected groups of products, primarily natural
health care products, such as Acanthopanax and Ban Lan Gen derived from the
roots of the Isatis plant, enzyme engineering series products, including
Lysozyme enzyme, Shark Power health care products, Monoclonal Antibody Reagent
Box Series Products, and traditional medical products, such as cold, flu and
headache medicines.
Renhuang
China has the ability to produce more than 100 types of products. Our product
sales have reached more than 20 provinces and cities in China.
4
In the
beginning of 2003, Old Renhuang purchased the land use rights to 100,000 square
meters (approximately 1 million square feet) of land and built “City Bio-tech
Medicine Park” located in the City of “A” in the Province of Heilongjiang. The
project has been supported by the Chinese government in the form of a zero
percent interest rate three-year loan in the amount of RMB 30 million
(approximately US $3.7 million). The project was finished in 2004, and “City
Bio-tech Medicine Park” received a “Good Manufacturing Practice” (GMP)
certification from the Heilongjiang Food and Drug Administration on December 30,
2004. In the facility, we produce enzyme engineering series products, including
SOD (Super Oxide Dismutase), Lysozyme enzyme, Shark Power health care products
and other traditional medicine. Since May 1, 2006, Old Renhuang is leasing the
buildings to Renhuang China on market terms disclosed in this
report.
The Dongfanghong
Acquisition:
In 2003,
Old Renhuang acquired Dongfanghong Pharmaceutical Co. (DFH), a previously
state-owned pharmaceutical company located in Heilongjiang Province, which then
owned substantial amount of the wild Acanthopanax resources in Heilongjiang
Province. DFH also owned a plant used to manufacture products utilizing
Acanthopanax in the same city. The acquisition came with 73 GMP
approved medicine products which were sold by DFH In 2004, one year after the
acquisition, Old Renhuang generated US $3.75 million in revenue from the sale of
Acanthopanax-based products and gained a 10% market share in China. As of May 1,
2006, Old Renhuang transferred all acquired operations of DFH to Renhuang
China.
In the
year ended October 31, 2008, the plant generated US $36 million in revenue of
which US $23 million in revenue was from Acanthopanax-based
products.
Products
Historically,
our medical products portfolio is divided into three different
categories:
1. Acanthopanax
medical products - 53%*
2. Shark
Power Healthcare products, and - 17%*
3. Traditional
medical products. - 30%*
*
Approximate percentage of the total revenue for the fiscal year ended October
31, 2008.
Acanthopanax (Siberian
Ginseng)
Overview
Acanthopanax,
which is known in the United States as Siberian Ginseng, has been used for
centuries in China and Russia. Although a distant relative of American and Asian
ginsengs ( Panax sp
. ), with some overlap
in its uses, Acanthopanax is a distinct plant with different active chemical
components. Known to restore vigor, increase longevity, enhance overall health,
and stimulate both a healthy appetite and a good memory, it is used in Russia to
help the body adapt to stressful conditions and to enhance
productivity.
5
In
Chinese medicine, it is valued for its beneficial effects on “qi” (the Chinese term for vital energy
or life force, pronounced “chee.”) and its ability to treat
“yang” (known in Chinese
medicine as one of the two fundamental forces, yang represents the male or
active force.), deficiency in the spleen (distinct from the Western medical
concept of spleen, this concept from traditional Chinese medicine is a way of
describing a set of interrelated parts rather than an anatomical organ.) and the kidney. Like
the panax ginsengs, Acanthopanax is considered to be an adaptogen, which means
it helps in stressful circumstances and returns the body to a normal balanced
state. For example, an adaptogen might lower blood pressure in someone who has
high blood pressure, but raise it in another person who has low blood pressure.
The active ingredients in Acanthopanax, eleutherosides (similar to ginsenosides
in the panax species), are thought to increase stamina and to stimulate the
immune system.
Until
recently, most scientific research on Acanthopanax took place in Russia and the
former Soviet Union. This research has largely supported its use to maintain
health and strengthen the body rather than to treat particular disorders.
Acanthopanax may help the body deal with physically and mentally stressful
exposures such as heat, cold, physical exhaustion, viruses, bacteria, chemicals,
extreme working conditions, noise, and pollution. By strengthening the immune
system, it may also help prevent illness. Acanthopanax is especially popular
among athletes or physical workers who require substantial sources of adaptive
energy and endurance, such as long distance runners, rock climbers, bicyclists,
scuba divers, dancers, tennis players and others seeking to enhance physical and
mental performance and endurance.
Research
Siberian
ginseng's active ingredients are a complex group of chemicals called eleutherosides .
Eleutherosides are different than the ginsenocides found in the Panax varieties of ginseng,
which is consistent with Chinese herbalists' claims that Siberian ginseng acts
differently in the body than Korean or American ginseng. There has been some
debate among herbalists whether Siberian ginseng should be considered a true
ginseng at all, due to this difference in active ingredients.
Much of
the research done on Siberian ginseng was performed by scientists in the former
Soviet Union. Many of the study results are still unavailable in English. Those
that have been translated, and more recent studies, have corroborated the
benefits of Siberian ginseng.
Siberian
ginseng has been documented in studies to improve physical endurance, oxygen
uptake, recovery, and overall performance in athletes, ranging from runners to
weightlifters. A 1986 study in Japan showed that Siberian ginseng improves
oxygen uptake in exercising muscle.
Siberian
ginseng has been documented to normalize blood pressure in patients with high
and low blood pressure. Siberian ginseng has been shown to reduce stress
symptoms in general. A 1996 study in Japan concluded that Siberian ginseng can
protect against gastric ulcers.
Animal
studies showed Siberian ginseng helped fight against toxic chemicals and
exposure to harmful levels of radiation. A 1992 Russian study showed that
Siberian ginseng reduced the occurrence of tumors in rats when exposed to
radiation. Another Russian study showed that women undergoing radiation for
breast cancer had a significant reduction of side effects when given
Siberian ginseng.
A 1987
German study, using human subjects in a double-blind test, demonstrated that
eleuthero ginseng boosts immune system response and enhances the body's overall
resistance to infection. Other studies have shown that Siberian ginseng
increases activity of lymphocytes and killer cells in the immune
system.
Another
popular but unproven use of Acanthopanax is to maintain or restore mental
alertness.
6
Physical
Performance
Although
Acanthopanax is frequently used to enhance physical stamina and increase muscle
strength, studies have shown mixed results for these purposes.
Male
Fertility
Acanthopanax
has a long history of folkloric use for male infertility. Animal studies suggest
that Acanthopanax may be helpful in increasing reproductive
capacity.
Viral
Infection
In a
laboratory study, an extract of Acanthopanax slowed the replication of certain
viruses, including influenza A (which causes the flu) as well as human
rhinovirus and respiratory syncytial virus (both of which cause symptoms of the
common cold). A different 6-month study of 93 people with herpes simplex virus
type 2 (which generally causes genital herpes lesions) found that Acanthopanax
reduced frequency, severity, and duration of outbreaks. It had no
effect, however, in test tubes on adenovirus (another cause of the common cold
and other respiratory infections) or herpes simplex virus type 1 (which
generally causes oral herpes lesions).
Market
Analysis on Acanthopanax in China:
The
resources for Acanthopanax medicine are mostly derived from wild Acanthopanax.
Due to favorable conditions and temperature in the Heilongjiang Province, where
Renhuang is located; 90% of the wild Acanthopanax in the PRC suitable for
medicine comes from Heilongjiang Province.
The
purchase price of Acanthopanax has been stable at RMB 2.8 per kilogram in 2007
and RMB 2.00 per kilogram in 2008.
Due to
its increasing popularity in United States, Japan and European countries,
exporting Acanthopanax medicine is expected to generate additional revenue for
us in the near future.
Future
Strategies for our Acanthopanax Products
With our
position in the marketplace, we plan to capitalize on increased brand
recognition. Through a controlled expansion plan, we plan to expand our market
shares in local provinces and eventually throughout China. We hope to eventually
be identified as the leading manufacturer of Acanthopanax products.
Through
increased market awareness, we anticipate entering into strategic foreign
partnerships, which we expect will result in increased international sale of
Acanthopanax medicine in the near future.
7
Acanthopanax
Revenue:
During
the year ended October 31, 2008, Acanthopanax medical products have generated
approximately 53% of our total revenue. Due to the amount of wild Acanthopanax
resources we control, and our technology, we believe that we will control more
than 50% share of the market of Acanthopanax-based medical products in China in
the near future. It is further anticipated that the market for
Acanthopanax-based products will continue to grow at an average annual rate of
up to 30% and thereby remain our primary revenue generating
product.
Shark Power Healthcare
Products
Shark
Power Healthcare products are made from Squalene, the scientific name for “Nose
Oil,” a low density compound stored in the liver of sharks. These medicines
contain extracts of shark liver oil and are used to improve oxygen levels in
human blood. Squalene, when taken into the body, is believed to remove animal
fat and various waste materials whilst circulating in the blood, cleaning blood
vessels and the blood stream. Traditional medicine believes that benefits
include the treatment and prevention of arteriosclerosis, improving the function
of the kidneys and liver.
Our
research and development center has developed natural medicines utilizing
Squalene - the Shark Power Healthcare Series. Our medicine was awarded the
“Special Golden Prize at the Ninth Chinese Patent Technology New Product
Exhibition,” and a gold medal at the London International Patent Technology
Exhibition.
Clinical
research has shown that this medicine can improve the ability to carry and
transport oxygen in blood, enhance the oxygen absorption and utilization factor
of an organism’s organs, dredge the blood vessels, and increase the speed of
blood's oxygen transportation and the supply of oxygen to the heart, brain, lung
and liver. It is also believed to be able to effectively treat a multitude of
symptoms caused by secondary health problems such as dizziness, insomnia, memory
loss, low energy, back pain, fatigue, and the common cold, with stable and safe
effects.
Shark
Power Healthcare Products Revenue
In the
year ended October 31, 2008, the revenue from Shark Power Healthcare products
has accounted for approximately 17% of our total revenue, compared to 13% for
the same period ended October 31, 2007.
Traditional Medical
Products
In
addition to Acanthopanax medical products and Shark Power Healthcare products,
we produce traditional medicine products, such as medicine for flu, headache,
female menstrual irregularities and other ailments. Revenue from these
traditional medical products accounted for 30% of our total revenue for the
fiscal year ended October 31, 2008, 34% of our total revenue for the fiscal
year ended October 31 2007, and 35% of our total revenue for the period from May
1, 2006 to October 31, 2006. We own 40 medical products with GMP certificates,
of which certain popular products are market leaders in their class and most
other products generate a stable stream of revenue. We designate those
products that we believe are among our most promising products as “Star”
products.
8
Three
“Star” products
“Tianma
pills” and “Compound Yang Jiao Tablets” ( also known as
“Tornado pills” ) are our “Star”
traditional medicines for treating headaches. Although western headache
medicines have a larger market shares in China, they have also been shown to
have greater side effects. Research indicates that most other Chinese
traditional medicines have fewer side effects, but cannot reach the same
curative effects as western medicines. We believe that “Tianma” and
“Tornado” not only produce strong visible curative effects, but also causes
little or no side effects.
In the
fiscal year ended October 31, 2008, revenue from the sales of “Tianma pills” and
“Compound Yang Jiao Tablets” was $3.9 million and $5 million, respectively. The
revenue from sales of the two medicines in the fiscal year ended October 31,
2007 was approximately $1.97 million and $5.42 million,
respectively.
Another
“Star” medicine of ours is “Powder For Restoring Pulse Beat” granulate (also
known as “Shengmai Granulate”). In the fiscal year ended October 31, 2008,
revenue from the sales of Shengmai Granulate was $2.5 million. In the year ended
from November 1, 2006 to October 31, 2007, revenue from this product reached
$1.9 million.
We also
produce several additional traditional medical products that each account for
lesser percentages of our total revenue. These products, through brand
recognition, generate stable revenue for us. When we expand our product
offerings, we anticipate that these additional products will be replaced by
higher margin products.
Products
in the Development Stage
We are
currently developing the following products. We began the early stages of our
research and development on these products in 2006 and, previously, these
products were developed by Old Renhuang. In the fiscal year ended October 31,
2008, we spent approximately $2.1 million on R&D.
Lysozyme
Enzyme Products
Studies
have indicated that lysozyme, an enzyme occurring naturally in egg white, human
tears, saliva, and other bodily fluids, is capable of destroying the cell walls
of certain bacteria and thereby acting as a mild antiseptic.
Egg white
has a high content of lysozyme, making egg white (albumen) the preferred raw
material for industrial production of the lysozyme enzyme.
Currently,
we do not believe there are any companies in China with the ability to produce
lysozyme on a large scale, despite the fact that it has a large potential
market. Lysozyme can be used as an antiseptic for food products, which could
compete with chemical antiseptics at a cost lower than similar products produced
outside of China. The major uses of Lysozyme products are as
follows:
1)
Lysozyme compound biological antiseptic (food packing coating and food
bag)
2)
Lysozyme drug preparation (tablets and oral liquid)
9
3)
Lysozyme biotech pesticide
4)
Lysozyme home-use disinfectant products (paper towels, detergent, and other such
home-use cleaning products)
5)
Lysozyme biotech veterinary medicine
6)
Lysozyme biotech preparation
During
the fiscal year ended October 31, 2008, our lysozyme enzyme product is in the
preliminary testing stage. In the future, we hope to launch lysozyme enzyme
products in the food antiseptic area, which we believe is the largest potential
market for lysozyme. Our management estimates that we will achieve significant
revenue growth in this product in the next 5 years.
Monoclonal
Antibody Reagent Box Series Products
Monoclonal
Antibody Reagent Box is an excellent reagent for Immunofluorescence mapping
studies in patients with Epidermolysis Bullosa. The total sales volume of
China’s biotechnology products was approximately RMB 50 billion (US $7.2
billion) in 2008. Of this total, the sales volume of medicine and health-care
products including medicine of gene products, vaccines, diagnosis reagents,
certain antibiotics, amino acids for medical use, vitamins, blood products,
bio-chemical medicines and certain functional food was RMB 30 billion (US $4.3
billion), accounting for approximately 50 percent of the total sales volume of
the industry.
Chinese
companies in the Monoclonal Antibody Reagent Box industry are primarily small to
mid-sized privately-owned enterprises without any government support. The
production scale in China is still relatively small and it is a niche market
when compared with other developed countries. Due to the large population and
potential market in China, this area is already being pursued by certain
pharmaceutical companies.
Sales
and Marketing
We
primarily market our products through four business channels: the
over-the-counter market for non-prescription medicine, direct sales, wholesale,
and raw materials. We have more than 70 sales centers organized in 24 districts
through distributors. Furthermore, we have developed alliances with third-party
distributors who have sales channel relationships but lack manufacturing or
product development capabilities.
Four-Pronged
Approach to Achieve Market Goals
First,
our goal is to build the brand names for our products. Approximately 90% of the
Chinese population lives in the countryside and have relatively lower incomes.
Due to a diverse product mix, adjusted to appeal to lower income consumers, we
believe our traditional drugs will have a relatively high level of penetration
in those non-urban areas. Distribution to end-consumers is obtained through our
own sales personnel without middlemen costs.
10
Second,
we use key cities such as Beijing and Shanghai as our geographical sales centers
to distribute our products to major drug chain stores in urban and suburban
areas nationwide. Our approach is to use selected cities as sample targets,
supported by initial promotion and investments enabling the products to enter
into well-known drug chain stores.
Third, we
focus on top-level hospitals in the country, which have higher quality standards
and more stringent approval procedures for new products and brands.
Traditionally, hospitals in China are divided into different levels based upon
their geographic scope. Junior level hospitals only care for smaller
geographic areas, mid-level hospitals will care for larger geographic areas, and
senior level hospitals will handle even larger regions. By focusing on the top
tier of the hospital industry, our strategy is to work from the top down and
gain access to mid- and low-level hospitals when our brands and products have
been established in the higher ranks.
Fourth,
we promote our products in the domestic media, including television, radio,
newspapers, magazines and trade publications.
Our sales
force consists of independent sales distributors that purchase our product
directly from us to sell to their customers. These independent sales
distributors may receive a rebate for a percentage of the purchase price they
pay us on certain products based on volume of product sold. Our products reach
drug stores, hospitals and end consumers across China through this sales
network.
Locations
of Our Independent Distributors' Sales Offices in China.
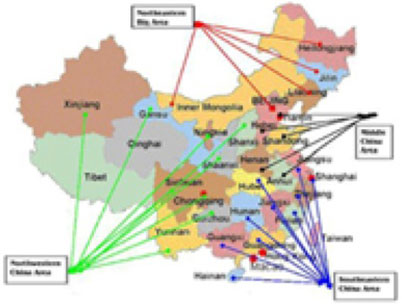
11
Research
and Development
Old
Renhuang established a R&D center in 2002 in Harbin City, China which was
transferred to Renhuang China in 2006. Currently, our center employs
30 researchers, engineers and technicians working in the following
functions:
|
|
—
|
Comprehensive
testing
|
|
|
—
|
New product
development
|
|
|
—
|
Nutraceutical and healthy food
development
|
|
|
—
|
Standard extracts
development
|
|
|
—
|
Biopharmaceutical products
development
|
|
|
—
|
Mid-scale
testing
|
|
|
—
|
Diagnostic reagent
development
|
|
|
—
|
Product approval
submission
|
Through
our research control and relative dominant position related to our Acanthopanax
products, we believe we are on the verge of positioning Acanthopanax as an
independent segment in the Chinese drug industry. In order to achieve this goal,
we plan on building an Acanthopanax base, to become the largest GMP approved
Acanthopanax base in China, including six parts: (1) wild Acanthopanax
protection; (2) research; (3) seeding; (4) cultivating; (5) processing; and (6)
exporting.
In
addition, we plan to continually upgrade our products by using follow-up
research projects. This continued development focuses on the following three
areas: (1) the development of biotech products, with the focus on practical
applications of lysozyme and hyperoxide mutase, and the research and development
of gene engineering drugs; (2) the research and development of Chinese
traditional medicine products, including but not limited to additional use of
Acanthopanax and Shizandra Berry; and (3) research and development of Western
drugs for generic production, where we are able to complete the generational
replacement of traditional drugs in a short period of time.
We
utilize our marketing network system to provide periodic market feedback
information, market demand information, evaluation of new products inside and
outside of China, domestic and foreign authority research topics and product
technology feedback information.
Research
Center and Mid-Testing Base
Formed by
different labs, these research and mid-testing facilities are simulating the
assembly lines.
Renhuang
Bio-Tech Drugs and Healthcare Products Research Center
This
facility is mainly focused on the research and development of bio-tech drugs,and
healthcare products.
Post-doc
Research Workstation
The major
task is to do research and development on Acanthopanax and other North-China
medical products and to develop medicine qualified to international standard.
This unit also performs research and development on gene engineering drugs, like
tumor Chalone.
12
Industry
Analysis
The
Current Chinese Pharmaceutical Market
Traditionally,
the pharmaceutical market is defined based on the different medical usage and is
generally split into the prescription drug market and non-prescription medicine
market (“OTC”).
The
annual revenue of the medicine market in China is estimated to be approximately
1 trillion RMB (US$ 140 billion) in 2008 .
There are
about 2,000 pharmaceutical companies with GMP Certificates in China, Renhuang is
one of the pharmaceutical companies that has obtained the GMP Certificate under
strict control of the Chinese government. As our market grows, we anticipate
increased production volume through acquisitions and/or additional production
facilities.
Our first
and primary target market is China, where we believe a growing middle class with
demands for improved healthcare has created a sustainable need for quality
healthcare products. Our secondary market in the long-term future is the United
States and other regions of the world.
Most of
the recognized brands in China are manufactured by multi-national drug companies
with higher market share than domestic brands. Based on our research, there are
approximately 2,000 drug companies with GMP certificates, producing a variety of
traditional and modern Chinese medical products. Furthermore, Chinese drug
companies produce 300 different types of biotech products including vaccines,
antiserum, blood products, and diagnosing reagents for internal and external
use.

—Market
Shares of various pharmaceutical products
The
Current State of the Biotech Industry in China
The
biotech industry in China has undergone fundamental improvements in recent
years. China’s biological product market, which includes gene engineering drugs,
vaccines, antibodies, and blood products, surpassed 30.3 billion RMB in 2005,
39.1 billion RMB in 2006, 44.6 billion RMB in 2007, and 53 billion RMB in
2008
13
In order
to accelerate the development of the PRC’s domestic biotech industry, the
Chinese government has invested in biotech research and development. Biotech
engineering and bio-drugs are making progress and a series of key technologies
have been built. Tens of gene drugs are fast approaching the area of practical
use and the Chinese biotech R&D industry is rapidly becoming more
mature and competitive.
Competition
We are
subject to intense competition. Some of our competitors have greater
financial resources, larger staff, and better established market recognition
than us. Below are lists of Chinese companies that we view as our
competitors in each of our product series.
Acanthopanax
Product Series Competitors
Hongdoushan
Pharmaceuticals, with main Acanthopanax products of tablets, and with
approximately 7% of the market share of Acanthopanax tablets.
Wangdashang
Pharmaceuticals, with main Acanthopanax products of tablets and syrup, and with
approximately 5% and 2% of the market share of Acanthopanax tablets and syrup,
respectively.
Lianhuahu
Pharmaceuticals, with main Acanthopanax products of ointment and raw product,
and with approximately 15% and 10% of the market share of Acanthopanax ointment
and raw products respectively.
Harbin
Shengyuan Pharmaceuticals, with main Acanthopanax product of Acanthopanax
ointment, and with approximately 10% of the market share of Acanthopanax
ointment.
Shark
Power Healthcare Series Competitors
Beijing
Saishali Company, with approximately 17% market share
Shantou
Xianle Pharmaceuticals, with approximately 8% market share
Shangai
Zhongyang Donghai Pharmaceuticals, with approximately 5% market
share
Traditional
Medical Products Competitors
Compound Yang Jiao
Tablets
Harbin
Sanjing North Pharmaceuticals, with approximately 16% market share
Harbin
Huarui Pharmaceuticals, with approximately 15% market share
Harbin
Mingmu Pharmaceuticals, with approximately 9% market share
14
Tianma
Pills
Sigpore
Xinri Pharmaceuticals, with approximately 20% market share
Guizhou
Yibai Pharmaceuticals, with approximately 18% market share
Sanjiu
Pharmaceuticals, with approximately 20% market share
Powder For Restoring Pulse
Beat
Gansu
Foci Pharmaceuticals, with approximately 12% market share
Hubei
Meibao Pharmaceuticals, with approximately 8% market share
Nanning
Weiwei Pharmaceuticals, with approximately 6% market share
Lysozyme
Products Competitors
We
believe there are few companies with the ability to produce lysozyme products on
a large scale. Thus, the competition is scarce.
Competitive
Strengths
Experienced
Management Team
Our
management team has over 35 years of experience in the pharmaceutical industry
combined, which, when compared to Old Renhuang’s historical numbers, generated
historical annual growth in both sales and profits.
Through
the acquisition of DFH in 2003, Old Renhuang obtained most of the wild resources
of Acanthopanax in Heilongjiang Province. As of May 1, 2006, Old
Renhuang transferred all acquired operations of DFH to Renhuang
China. We believe that we have a relatively dominant position in
terms of resource control. We estimate that our cost of production is 30%
lower than the competition.
In
addition to our advantageous access to wild Acanthopanax sources, we believe
that we have the following competitive strengths related to
Acanthopanax:
Resources
Cultivation
Current
wild Acanthopanax resources may not be able to fulfill the rapidly growing
demand. Therefore, we have started to cultivate Acanthopanax in woodland areas.
Our cultivated Acanthopanax achieves, in all material respects, the same effects
as wild Acanthopanax, mainly due to our use of wild Acanthopanax seeds and
other production methods as well as its extraordinarily favorable climate
conditions in Heilongjiang Province.
15
Lower
Production Costs
We have
successfully developed new extraction technology during the process of
cultivating and producing Acanthopanax. Based on our estimates, we believe that
our new technology will lead to production costs that will be lower than our
competitors.
We
believe that our Shark Power Healthcare products have the following competitive
strengths:
State
Drug Administration Approval
Our Shark
Power Healthcare products have received Good Manufacturing Practice (“GMP”)
certificates from the State Drug Administration (“SDA”). As most healthcare
products produced in China have not obtained GMP certificates, our Shark Power
Healthcare products have a strong competitive advantage. Our Shark Power
Healthcare products are also distributed through hospital channels, which is not
the case for most other similar health care products.
Lower
Production Costs
The
retail price of Shark Power Healthcare products has historically been lower than
the price of similar products from our competitors due to our lower raw material
costs. We purchase raw materials indirectly from Australia at prices
which we believe are as much as 20% lower than the cost of these materials when
obtained from coastal areas in China, where most competitors purchase their
materials.
In
addition, we believe our business possesses the following competitive
strengths:
The
ability to upgrade our products by using our follow-up research projects enables
us to continue our product development.
We have
developed an independent research cooperation system, which can provide support
to our research and development of new products.
We have
been awarded outstanding levels of status by provincial, city and regional
governments.
We employ
an experienced research team of scientists.
Through
efficiency and our production facilities, we believe our production costs are on
average 5% to 10% lower than those of our competitors.
Official
Accomplishments
The
Chinese government has appraised us as “The Best Quality and Credit Company”,
“The Company with The Best Social Image”, and “The Most Trustful Consumer
Products Company”.
Our
Lysozyme and Hyperoxide mutase projects have been included into the most
important national level project in the State Scientific
Administration.
Biotech
drug garden has been included into the national transforming projects of North
Eastern China heavy industry base, and in the projects which may obtain zero
interests loans from the Chinese government.
16
Customers
Our
primary independent sales distributors are listed in the table below. These
sales distributors account for more than 5% of our revenue. The revenue figures
listed below are revenues received from these distributors before any reduction
for any volume rebates we may have paid to these distributors.
|
Customer
|
Revenue
for FYE
October 31,
2008,
Before
Rebate
(RMB)
|
|
Revenue
for FYE
October
31, 2008,
Before
Rebate
(USD)
|
|
% of
Total
Revenue
|
||||
|
Baojin
Yang
|
31,581,025
|
4,511,575
|
10.49
|
%
|
|||||
|
Gang
Hua
|
31,254,600
|
4,464,943
|
10.39
|
%
|
|||||
|
Hui
Zhao
|
27,295,538
|
3,899,363
|
9.07
|
%
|
|||||
|
Jing
Hua
|
16,440,235
|
2,348,605
|
5.46
|
%
|
|||||
|
Hongtao
Zhang
|
16,717,400
|
2,388,200
|
5.56
|
%
|
|||||
|
Xuchang
Li
|
17,565,717
|
2,509,388
|
5.84
|
%
|
|||||
|
Sijiang
Qin
|
16,493,200
|
2,356,171
|
5.48
|
%
|
|||||
|
Jianjun
Wu
|
16,791,873
|
2,398,839
|
5.58
|
%
|
|||||
|
Yong
Hua
|
15,918,671
|
2,274,096
|
5.29
|
%
|
|||||
|
Xue
Qin
|
15,870,769
|
2,267,253
|
5.27
|
%
|
|||||
Employees
We employ
more than 600 full time individuals, including 150 employees in managerial
positions, 60 employees as sales managers, 12 R&D managers among 30
employees in our R&D department, and more than 400 general workers. We also
utilize approximately 22 independent sales distributors in various sales
offices that work as independent contractors.
Government
Regulation
The
State Drug Administration
The SDA
of China has set up a classification administrative system in 1999 for
prescription and OTC drugs. Since then, the SDA has issued a series of
guidelines on the interpretation of the new classification system for labeling,
usage instructions and packaging of OTC products. The SDA currently requires
that pharmaceutical manufacturers clearly label drugs for OTC sales and
distinguish them from those, under SDA regulations, acceptable to be sold in
hospitals. We have instituted policies that we believe
comply with SDA regulations. We successfully passed all GMP investigations by
SDA and received approval certificates.
17
In
September 2005, Old Renhuang received a certification for exporting products by
Entry-Exit Inspection and Quarantine Administration, and received a
self-reporting inspection registration certificate. In May 2006, all
certificates were transferred to Renhuang China.
Environmental
Matters
We have
not been required to perform any investigation or clean-up activities, nor have
we been subject to any environmental claims. There can be no assurance, however,
that this will remain the case in the future.
Trade
Names and Service Marks
We do not
currently own any Trade Names, Trade Marks or Service Marks.
ITEM
1A – RISK FACTORS
Cautionary
Statement Regarding Future Results, Forward-Looking Information And Certain
Important Factors
In this
report we make, and from time to time we otherwise make, written and oral
statements regarding our business and prospects, such as projections of future
performance, statements of management’s plans and objectives, forecasts of
market trends, and other matters that are forward-looking statements within the
meaning of Section 27A of the Securities Act of 1933 and Section 21E
of the Securities Exchange Act of 1934. Statements containing the words or
phrases “will likely result,” “are expected to,” “will continue,” “is
anticipated,” “estimates,” “projects,” “believes,” “expects,” “anticipates,”
“intends,” “target,” “goal,” “plans,” “objective,” “should” or similar
expressions identify forward-looking statements, which may appear in documents,
reports, filings with the Securities and Exchange Commission, news releases,
written or oral presentations made by officers or other representatives made by
us to analysts, stockholders, investors, news organizations and others, and
discussions with management and other of our representatives. For such
statements, we claim the protection of the safe harbor for forward-looking
statements contained in the Private Securities Litigation Reform Act of
1995.
Our
future results, including results related to forward-looking statements, involve
a number of risks and uncertainties. No assurance can be given that the results
reflected in any forward-looking statements will be achieved. Any
forward-looking statement speaks only as of the date on which such statement is
made. Our forward-looking statements are based upon assumptions that are
sometimes based upon estimates, data, communications and other information from
suppliers, government agencies and other sources that may be subject to
revision. Except as required by law, we do not undertake any obligation to
update or keep current either (i) any forward-looking statement to reflect
events or circumstances arising after the date of such statement, or
(ii) the important factors that could cause our future results to differ
materially from historical results or trends, results anticipated or planned by
us, or which are reflected from time to time in any forward-looking
statement.
In
addition to other matters identified or described by us from time to time in
filings with the SEC, there are several important factors that could cause our
future results to differ materially from historical results or trends, results
anticipated or planned by us, or results that are reflected from time to time in
any forward-looking statement. Some of these important factors, but not
necessarily all important factors, include the following:
18
Risks
Related To Our Business, Operations and Industry
Current
economic conditions may adversely impact demand for our products, reduce access
to credit and cause our customers and others with which we do business to suffer
financial hardship, all of which could adversely impact our business, results of
operations, financial condition and cash flows.
Our
business, financial condition and results of operations have and may continue to
be affected by various economic factors. The worldwide economy is undergoing a
period of slowdown and the future economic environment may continue to be less
favorable than that of recent years. This slowdown has, and could further lead
to, reduced consumer and business spending in the foreseeable future, including
by our customers. Reduced access to credit has and may continue to adversely
affect the ability of consumers to purchase our fire safety products and
systems. In addition, economic conditions, including decreased access
to credit, may result in financial difficulties leading to restructurings,
bankruptcies, liquidations and other unfavorable events for our customers,
suppliers and other service providers. If such conditions continue or further
deteriorate, our industry, business and results of operations may be severely
impacted.
We will need to raise additional
capital to expand our business.
For the
foreseeable future, we will fund all of our operations and capital expenditures
from cash on hand and potential future internally generated cash flow.
Currently, we believe we have sufficient cash on hand to fund our operations and
planned expansions. However, changes may occur that would consume our available
capital, including changes in and progress of our development activities,
acquisitions of additional candidates and changes in regulation. We will then
need to seek additional sources of financing, which may not be available on
favorable terms, if at all. If we do not succeed in raising additional funds on
acceptable terms, we may be unable to complete our expansion and future growth.
In addition, we could be forced to discontinue product development, reduce or
forego sales and marketing efforts and forego attractive business opportunities.
Any additional sources of financing will likely involve the issuance of our
equity securities, which will have a dilutive effect on our
stockholders.
Our
profitability is limited.
We will
need to generate significant revenues in order to achieve and maintain
profitability. We may not be able to generate these revenues or achieve
profitability in the future. Our failure to achieve or maintain profitability
could negatively impact our business, operating results and financial
conditions.
We
may be unable to obtain and maintain the necessary Chinese or worldwide
regulatory approvals to commercialize our products.
To
commercialize certain of our current
and future products, we require approvals from SDA and any FDA-equivalent
regulatory authorities in foreign jurisdictions. Currently, we do not sell our
products to the United States, but if we plan to commercialize our products to
the U.S., we will require FDA approval for some of our products. To apply for
approval, we must submit to the FDA a New Drug Application, or NDA,
demonstrating that the product candidate is safe for humans and effective for
its intended use. This demonstration requires significant research and animal
testing, which are referred to as pre-clinical studies, as well as human
testing, which are referred to as clinical trials. Satisfaction of the FDA’s
regulatory requirements typically takes many years, depending upon the type,
complexity and novelty of the product candidate and requires substantial
resources for research, development and testing. We cannot predict whether our
research and clinical approaches will result in drugs that the FDA or
FDA-equivalent in other jurisdictions consider safe for humans and effective for
indicated uses. The FDA has substantial discretion in the drug approval process
and may require us to conduct additional pre-clinical and clinical testing or to
perform post-marketing studies. The approval process may also be delayed by
changes in government regulation, future legislation or administrative action or
changes in FDA policy that occur prior to or during our regulatory review.
Delays in obtaining regulatory approvals may:
19
delay
commercialization of, and our ability to derive product revenues from, our
product candidates;
impose
costly procedures on us; and
diminish
any competitive advantages that we may otherwise enjoy.
In
foreign jurisdictions, we must receive approval from the appropriate regulatory
authorities before we can commercialize any drugs. Foreign regulatory approval
processes generally include all of the risks associated with the FDA approval
procedures described above.
We cannot
guarantee that we will maintain and receive the approvals necessary to
commercialize our current and future products for sale in China, United States
or elsewhere.
Clinical
trials are very expensive, time-consuming and difficult to design and
implement.
Human
clinical trials are very expensive and difficult to design and implement, in
part because they are subject to rigorous regulatory requirements. The clinical
trial process is also time consuming. We estimate that clinical trials of our
product candidate will take at least several years to complete. Furthermore,
failure can occur at any stage of the trials, and we could encounter problems
that cause us to abandon or repeat clinical trials. The commencement and
completion of clinical trials may be delayed by several factors,
including:
unforeseen
safety issues;
determination
of dosing issues;
lack of
effectiveness during clinical trials;
slower
than expected rates of patient recruitment;
inability
to monitor patients adequately during or after treatment; and
inability
or unwillingness of medical investigators to follow our clinical
protocols.
In
addition, we, SDA, FDA or FDA-equivalent institutions in foreign jurisdictions
may suspend our clinical trials at any time if it appears that we are exposing
participants to unacceptable health risks or if the regulatory bodies find
deficiencies in our Investigational New Drug, or IND, submissions or the conduct
of these trials. Therefore, we cannot predict with any certainty the schedule
for future clinical trials.
The results of our clinical trials
may not support our product candidate claims.
Even if
our clinical trials are completed as planned, we cannot be certain that their
results will support our product candidate claims. Success in pre-clinical
testing and early clinical trials does not ensure that later clinical trials
will be successful, and we cannot be sure that the results of later clinical
trials will replicate the results of prior clinical trials and pre-clinical
testing. The clinical trial process may fail to demonstrate that our product
candidates are safe for humans and effective for indicated uses. This failure
would cause us to abandon a product candidate and may delay development of other
product candidates.
20
Physicians, patients and other end
consumer may abandon existing or choose not to accept and use our new drugs.
Physicians
and patients may not accept and use our products. Acceptance and use of our
product will depend upon a number of factors including:
perceptions
by members of the health care community, including physicians, about the safety
and effectiveness of our products;
cost-effectiveness
of our product relative to competing products; and
effectiveness
of marketing and distribution efforts by us and our licensees and distributors,
if any.
Because
we expect sales of our current and future products to generate substantially all
of our product revenues for the foreseeable future, the failure to find market
acceptance would materially harm our business and results of
operations.
Our drug-development program depends
upon third-party research scientists who are not subject to our control.
We depend
upon independent investigators and collaborators, such as universities and
medical institutions, to conduct our pre-clinical and clinical trials under
agreements with us. These collaborators are not our employees and we cannot
control the amount or timing of resources that they devote to our programs.
These investigators may not assign as great a priority to our programs or pursue
them as diligently as we would if we were undertaking such programs ourselves.
If outside collaborators fail to devote sufficient time and resources to our
drug-development programs, or if their performance is substandard, the approval
of our applications, if any, and our introduction of new drugs, if any, will be
delayed. These collaborators may also have relationships with other commercial
entities, some of which may compete with us. If our collaborators assist our
competitors at our expense, our competitive position and business could be
materially and adversely affected.
We
need to increase our selling, marketing and distributing network.
We need
significant capital expenditures, time and management resources to market our
products and to establish and develop an in-house marketing and sales force with
technical expertise. There can be no assurance that we will be able to
establish, maintain or develop in-house sales and distribution capabilities. To
the extent that we depend on third parties for marketing and distribution, any
revenues we receive will depend upon the efforts of such third parties, and
there can be no assurance that such efforts will be successful.
21
If we cannot compete successfully for
market share against
other similar product oriented companies, we may not achieve sufficient product
revenues and our business will suffer.
The
market for our product candidates is characterized by intense competition and
rapid technological advances. We will compete with a number of existing and
future drugs and therapies developed, manufactured and marketed by others.
Existing or future competing products may provide greater therapeutic
convenience or clinical or other benefits for a specific indication than our
products, or may offer comparable performance at a lower cost. If our products
fail to capture and maintain market share, we may not achieve sufficient product
revenues and our business will suffer.
We will
compete against fully integrated pharmaceutical companies and smaller companies
that are collaborating with larger pharmaceutical companies, academic
institutions, government agencies and other public and private research
organizations. Many of these competitors have either alone or together
with their collaborative partners, operate larger research and development
programs or have substantially greater financial resources than we do, as well
as significantly greater experience in:
developing
drugs;
undertaking
pre-clinical testing and human clinical trials;
obtaining
regulatory approvals of drugs;
formulating
and manufacturing drugs; and
launching,
marketing and selling drugs.
Developments
by competitors may render our products or technologies obsolete or
non-competitive.
The
biotechnology and pharmaceutical industries are intensely competitive and
subject to rapid and significant technological change. A large number of
companies are pursuing the development of pharmaceuticals that target the same
diseases and conditions that we are targeting. We face competition from
pharmaceutical and biotechnology companies in China and other countries. In
addition, companies pursuing different but related fields represent substantial
competition. Many of these organizations competing with us have substantially
greater capital resources, larger research and development staffs and
facilities, longer drug development history in obtaining regulatory approvals
and greater manufacturing and marketing capabilities than we do. These
organizations also compete with us to attract qualified personnel and parties
for acquisitions, joint ventures or other collaborations.
If we fail to adequately protect or
enforce our intellectual property, the value of our intellectual property rights
would diminish and our business would be harmed.
Our
success, competitive position and future revenues will depend in part on our
ability and the abilities of our licensors to obtain and maintain patent
protection for our products, methods, processes and other technologies, to
preserve our trade secrets, to prevent third parties from infringing on our
proprietary rights and to operate without infringing the proprietary rights of
third parties.
Our
success is partly dependent upon the skills, knowledge and experience of our
scientific and technical personnel, our consultants and advisors as well as our
licensors and contractors. To help protect our proprietary know-how and our
product developments for which patents may be unobtainable or difficult to
obtain, we rely on trade secret protection and confidentiality agreements. To
this end, it is our policy to require all of our employees, consultants,
advisors and contractors to enter into agreements which prohibit the disclosure
of confidential information and, where applicable, require disclosure and
assignment to us of the ideas, developments, discoveries and inventions
important to our business. These agreements may not provide adequate protection
for our trade secrets, know-how or other proprietary information in the event of
any unauthorized use or disclosure or the lawful development by others of such
information. If any of our trade secrets, know-how or other proprietary
information is disclosed, the value of our trade secrets, know-how and other
proprietary rights would be significantly impaired and our business and
competitive position would suffer.
22
We may not successfully manage our
growth.
Our
success will depend upon the expansion of our operations and the effective
management of our growth, which will place a significant strain on our
management and on our administrative, operational and financial resources. To
manage this growth, we must expand our facilities, augment our operational,
financial and management systems and hire and train additional qualified
personnel. If we are unable to manage our growth effectively, our business would
be harmed.
We
give no assurances that any plans for future expansion will be
implemented.
Under our
current business plan, we intend to expand our production of our current
products. However, we have not made any definitive plans or signed any binding
agreements to implement this expansion strategy. We may decide to use operating
income to finance these expenditures, which would reduce our operating
capital.
We
have a limited operating history and limited historical financial information
upon which you may evaluate our performance.
We began
our operations in 2006 and continue to face risks in a growth industry. We may
not successfully address these risks and uncertainties or successfully implement
our operating strategies. If we fail to do so, it could materially harm our
business to the point of having to cease operations and could impair the value
of our common stock to the point investors may lose their entire investment.
Even if we accomplish these objectives, we may not generate positive cash flows
or the profits we anticipate in the future.
We will face substantial
competition, some of which may be better capitalized and more experienced than
us .
We face
competition in the pharmaceutical and medical product industry. Although we view
ourselves in a favorable position vis—vis our competition, some of the other
pharmaceutical and medical product companies that sell into our markets may be
more successful than us and/or have more experience and financial resources than
we do. This additional experience and financial resources may enable our
competitors to produce more effective pharmaceuticals and sell their product
with more success than we are able to, which would decrease our
sales.
We rely on key executive officers and
scientific advisors, and their knowledge of our business and technical expertise
would be difficult to replace.
We are
highly dependent on our principal scientific, regulatory and medical advisors.
We do not have “key person” life insurance policies for any of our officers. The
loss of the technical knowledge and management and industry expertise of any of
our key personnel could result in delays in product development, loss of
customers and sales and diversion of management resources, which could adversely
affect our operating results.
23
Risks
Related to Doing Business in China
Our
manufacturing plants are located in China and our pharmaceutical and medical
products production, sale and distribution are subject to Chinese
regulation.
Economic
reforms adopted by the Chinese government have had a positive effect on the
economic development of the country, but the government could change these
economic reforms or any of the legal systems at any time. This could either
benefit or damage our operations and profitability. Some changes that could have
this effect are: i) level of government involvement in the economy; ii) control
of foreign exchange; iii) methods of allocating resources; iv) balance of
payment positions; v) international trade restrictions; and vi)
international conflict. Additionally, as a manufacturer of pharmaceutical and
medical products located in China, we are a state-licensed company and facility
and subject to Chinese regulations and laws. The Chinese government has been
active in regulating the pharmaceutical industry. If we were to lose our
state-licensed status we would no longer be able to manufacture pharmaceuticals
in China, which is our sole operation.
We
depend upon governmental laws and regulations that may be changed in ways that
will harm our business.
Our
business and products are subject to government regulations mandating the
manufacturing of pharmaceuticals in China and other countries. Changes in the
laws or regulations in China, or other countries we sell into, that govern or
apply to our operations could have a materially adverse effect on our business.
For example, the law could change so as to prohibit the use of certain
pharmaceuticals. If one of our pharmaceuticals or medical products are
prohibited, this change would reduce our productivity of that
product.
The
Chinese government exerts substantial influence over the manner in which we must
conduct our business activities.
China
only recently has permitted provincial and local economic autonomy and private
economic activities. The Chinese government has exercised and continues to
exercise substantial control over virtually every sector of the Chinese economy
through regulation and state ownership. Our ability to operate in China may be
harmed by changes in its laws and regulations, including those relating to
taxation, import and export tariffs, pharmaceutical regulations, and other
matters. We believe that our operations in China are in material compliance with
all applicable legal and regulatory requirements. However, the central or local
governments of these jurisdictions may impose new, stricter regulations or
interpretations of existing regulations that would require additional
expenditures and efforts on our part to ensure our compliance with such
regulations or interpretations.
Accordingly,
government actions in the future, including any decision not to continue to
support recent economic reforms and to return to a more centrally planned
economy or regional or local variations in the implementation of economic
policies, could have a significant effect on economic conditions in China or
particular regions thereof, and could require us to divest ourselves of any
interest we then hold in Chinese properties or joint ventures.
24
Future
inflation in China may inhibit our activity to conduct business in
China.
In recent
years, the Chinese economy has experienced periods of rapid expansion and high
rates of inflation. During the past ten years, the rate of inflation in China
has been as high as 20.7% and as low as -2.2%. These factors have led to the
adoption by Chinese government, from time to time, of various corrective
measures designed to restrict the availability of credit or regulate growth and
contain inflation. While inflation has been more moderate since 1995, high
inflation may cause Chinese government to impose controls on credit and/or
prices, or to take other action, which could inhibit economic activity in China,
and thereby harm the market for our products.
Restrictions
on currency exchange may limit our ability to receive and use our revenues
effectively.
The
majority of our revenues will be settled in Renminbi and U.S. Dollars, and any
future restrictions on currency exchanges may limit our ability to use revenue
generated in Renminbi to fund any future business activities outside China or to
make dividend or other payments in U.S. dollars. Although the Chinese government
introduced regulations in 1996 to allow greater convertibility of the Renminbi
for current account transactions, significant restrictions still remain,
including primarily the restriction that foreign-invested enterprises may only
buy, sell or remit foreign currencies after providing valid commercial
documents, at those banks in China authorized to conduct foreign exchange
business. In addition, conversion of Renminbi for capital account items,
including direct investment and loans, is subject to governmental approval in
China, and companies are required to open and maintain separate foreign exchange
accounts for capital account items. We cannot be certain that the Chinese
regulatory authorities will not impose more stringent restrictions on the
convertibility of the Renminbi.
The
value of our securities will be affected by the foreign exchange rate between
U.S. dollars and Renminbi.
The value
of our common stock will be affected by the foreign exchange rate between U.S.
dollars and Renminbi, and between those currencies and other currencies in which
our sales may be denominated in the future. For example, to the extent that we
need to convert U.S. dollars into Renminbi for our operational needs and should
the Renminbi appreciate against the U.S. dollar at that time, our financial
position, the business of the Company, and the price of our common stock
may be harmed. Conversely, if we decide to convert our Renminbi into U.S.
dollars for the purpose of declaring dividends on our common stock or for other
business purposes and the U.S. dollar appreciates against the Renminbi, the U.S.
dollar equivalent of our earnings from our subsidiaries in China would be
reduced.
Our business is largely subject to
the uncertain legal environment in China and your legal protection could be
limited .
The
Chinese legal system is a civil law system based on written statutes. Unlike
common law systems, it is a system in which precedents set in earlier legal
cases are not generally used. The overall effect of legislation enacted over the
past 20 years has been to enhance the protections afforded to foreign invested
enterprises in China. However, these laws, regulations and legal requirements
are relatively recent and are evolving rapidly, and their interpretation and
enforcement involve uncertainties. These uncertainties could limit the legal
protections available to foreign investors, such as the right of foreign
invested enterprises to hold licenses and permits such as requisite business
licenses. In addition, some of our executive officers and our directors may be
residents of China and not of the United States, and substantially all the
assets of these persons are located outside the U.S. As a result, it could be
difficult for investors to affect service of process in the United States, or to
enforce a judgment obtained in the United States against us or any of these
persons.
25
Risks
Related to Shares of Our Common Stock
Our
common stock has been thinly traded and we cannot predict the extent to which a
trading market will develop.
Our
common stock is quoted on the Pink Sheet Electronic Over the Counter Market (the
“Pink Sheets”), an electronic quotation service for securities traded
over-the-counter. Our common stock is thinly traded compared to larger, more
widely known companies. Thinly traded common stock can be more volatile than
common stock trading in an active public market. We cannot predict the extent to
which an active public market for our common stock will develop or be
sustained.
Because
we are subject to the “penny stock” rules, the level of trading activity in our
stock may be reduced.
Our
common stock is traded on the Pink Sheets. Broker-dealer
practices in connection with transactions in “penny stocks” are regulated by
certain penny stock rules adopted by the Securities and Exchange Commission.
Penny stocks, like shares of our common stock, generally are equity securities
with a price of less than $5.00, other than securities registered on certain
national securities exchanges or quoted on NASDAQ. The penny stock rules require
a broker-dealer, prior to a transaction in a penny stock not otherwise exempt
from the rules, to deliver a standardized risk disclosure document that provides
information about penny stocks and the nature and level of risks in the penny
stock market. The broker-dealer also must provide the customer with current bid
and offer quotations for the penny stock, the compensation of the broker-dealer
and its salesperson in the transaction, and, if the broker-dealer is the sole
market maker, the broker-dealer must disclose this fact and the broker-dealer's
presumed control over the market, and monthly account statements showing the
market value of each penny stock held in the customer's account. In addition,
broker-dealers who sell these securities to persons other than established
customers and “accredited investors” must make a special written
determination that the penny stock is a suitable investment for the purchaser
and receive the purchaser's written agreement to the transaction. Consequently,
these requirements may have the effect of reducing the level of trading
activity, if any, in the secondary market for a security subject to the penny
stock rules, and investors in our common stock may find it difficult to sell
their shares.
ITEM
1B – UNRESOLVED STAFF COMMENTS
None.
ITEM
2 - PROPERTIES
Our
executive offices in the United States are provided to us at no cost at the
offices of one of our shareholders, Viking Investments USA, Inc., which are
located at 65 Broadway, 7 th Floor,
New York, New York. The fair market value of the office space we utilize is
approximately $2,000 per month.
Our
operations in China are conducted out of our offices located at No. 281 Taiping
Road, Taiping District Harbin, Heilongjiang Province, 150050, P.R. China. These
offices are owned by Old Renhuang and we rent the space pursuant to a one year
lease. We currently lease a total of 105,416 square feet, with approximately
15,000 square feet used for executive offices and approximately 90,000 square
feet used for production and inventory.
26
ITEM
3 - LEGAL PROCEEDINGS
We are
not a party to, or threatened by, any litigation or procedures.
ITEM
4 - SUBMISSION OF MATTERS TO A VOTE OF SECURITY HOLDERS
There
have been no events that are required to be reported under this
Item.
PART
II
ITEM
5 - MARKET FOR REGISTRANT’S COMMON EQUITY, RELATED STOCKHOLDER MATTERS AND
ISSUER PURCHASES OF EQUITY SECURITIES
Market
Information
Our
common stock is currently quoted on the Pink Sheet OTC market of the National
Association of Securities Dealers, Inc., under the symbol “RHGP.” Our common
stock is only traded on a limited or sporadic basis and should not be deemed to
constitute an established public trading market. There is no assurance that
there will be liquidity in the common stock.
The
following table sets forth the high and low bid information for each quarter
within the two most recent fiscal years, as provided by the Over-The-Counter
Bulletin Board. The information reflects prices between dealers, and does not
include retail markup, markdown, or commission, and may not represent actual
transactions.
|
Quarter
Ended
|
High
|
Low
|
||||||
|
January
31, 2007
|
3.95 | 3.90 | ||||||
|
April
30, 2007
|
3.10 | 3.10 | ||||||
|
July
31, 2007
|
2.50 | 2.50 | ||||||
|
October
31, 2007
|
2.28 | 2.25 | ||||||
|
January
31, 2008
|
1.65 | 1.60 | ||||||
|
April
30, 2008
|
0.82 | 0.82 | ||||||
|
July
31, 2008
|
1.06 | 1.06 | ||||||
|
October
31, 2008
|
0.65 | 0.65 | ||||||
|
January
31, 2009
|
0.20 | 0.20 | ||||||
|
April
30, 2009
|
0.20 | 0.20 | ||||||
|
July
31, 2009
|
0.69 | 0.20 | ||||||
|
October
31, 2009
|
1.25 | 0.50 | ||||||
The
Securities Enforcement and Penny Stock Reform Act of 1990 requires additional
disclosure relating to the market for penny stocks in connection with trades in
any stock defined as a penny stock. The Commission has adopted regulations that
generally define a penny stock to be any equity security that has a market price
of less than $5.00 per share, subject to a few exceptions that we do not meet.
Unless an exception is available, the regulations require the delivery, prior to
any transaction involving a penny stock, of a disclosure schedule explaining the
penny stock market and the risks associated therewith.
27
Holders
As of November 23, 2009, there were
37,239,536 shares of our common stock issued and outstanding held by 80
holders of record.
Dividend Policy
We do not expect to pay any dividend in
the foreseeable future. We intend to apply our earnings, if any, in expanding our operations and
related activities. The payment of cash dividends on our common stock in the
future will be at the discretion of the Board of Directors and will depend upon
such factors as earnings levels, capital requirements, our financial condition and other factors
deemed relevant by the Board of Directors.
ITEM 6 – SELECTED FINANCIAL
DATA
Not required.
ITEM 7 - MANAGEMENT’S DISCUSSION AND ANALYSIS OF FINANCIAL
CONDITION AND RESULTS OF OPERATION
Disclaimer Regarding Forward Looking
Statements
Our Management’s Discussion and Analysis or Plan of
Operations contains not only statements that are historical facts, but also
statements that are forward-looking (within the meaning of Section 27A of the
Securities Act of 1933 and
Section 21E of the Securities Exchange Act of 1934). Forward-looking statements
are, by their very nature, uncertain and risky. These risks and uncertainties
include international, national and local general economic and market
conditions; demographic changes; our ability to sustain, manage,
or forecast growth; our ability to successfully make and integrate acquisitions;
raw material costs and availability; new product development and introduction;
existing government regulations and changes in, or the failure to comply with, government
regulations; adverse publicity; competition; the loss of significant customers
or suppliers; fluctuations and difficulty in forecasting operating results;
changes in business strategy or development plans; business disruptions; the ability to attract and retain
qualified personnel; the ability to protect technology; and other risks that
might be detailed from time to time in our filings with the Securities and
Exchange Commission.
Although the forward-looking statements
in this Annual Report on
Form 10-K reflect the good faith judgment of our management, such statements can
only be based on facts and factors currently known by them. Consequently, and
because forward-looking statements are inherently subject to risks and
uncertainties, the actual results and
outcomes may differ materially from the results and outcomes discussed in the
forward-looking statements. You are urged to carefully review and consider the
various disclosures made by us in this report and in our other reports as we attempt to advise
interested parties of the risks and factors that may affect our business,
financial condition, and results of operations and
prospects.
Restatement of Financial
Statements
The following discussion and analysis
gives effect to the
restatement described in Note 20 to the consolidated financial statements for
the fiscal year ended October 31, 2008 contained herein. Accordingly, certain of
the data set forth in this section is not comparable to discussions and data in
our previously filed annual report for
corresponding period. The consolidated balance sheet as of October 31, 2008, the
consolidated statement of operations for the fiscal year ended October 31, 2008
and the consolidated statement of cash flows for the fiscal year ended October 31, 2008 present the
effect of changes in our consolidated financial statements caused by the
restatement.
Overview
As of March 3, 2006, we discontinued our
previous operations as a company specializing in the providing of home
financing through the
brokerage of residential home loans. On September 7, 2006, we acquired 100% of
the issued and outstanding shares of Harbin Renhuang Pharmaceutical Company
Limited, a corporation incorporated under the laws of the British Virgin Island,
(‘‘BVI’’), whose only assets are 100% of the
equity of Harbin Renhuang Pharmaceutical Co. Ltd., incorporated under the laws
of the Peoples Republic of China (“Renhuang China”) mainly focused on the research,
production and sales of traditional Chinese and Western medical and bio-pharmaceutical
products in China.
28
On May 1, 2006, Harbin Renhuang
Pharmaceutical Stock Co. Ltd., (“Old Renhuang”) transferred the majority of its
operating assets to Renhuang China, with the exception of the buildings Old
Renhuang owns (including
where we rent our office space and production facilities), and Old
Renhuang’s account receivables, inventories and
other assets with zero or insignificant value. The principal business activities
of Renhuang remained unchanged. On March 3, 2006 Renhuang Medicine for Animals Co. Ltd.
a company controlled by Mr. Li Shaoming, invested 25 million RMB (about US $3.3
million) in cash in Renhuang China.
Our pharmaceutical products are
distributed through our approximately 22 independent sales distributors. These distributors have more
than 70 sales offices with more than 3,000 sales people. Upon the
effectiveness of the Merger, we adopted the business of Renhuang China, which we
have continued as our sole line of business.
Upon closing of the Merger, BVI and its subsidiary
Renhuang China became our wholly owned subsidiaries. The Former
stockholders of BVI own approximately 85% of our issued and outstanding common
stock.
Reverse Merger
Our acquisition of the BVI company and
its subsidiary Renhuang China was accounted for as a
reverse merger, because, after giving effect to the share exchanges, the
former stockholders of BVI hold a majority of our outstanding common stock on a
voting and fully diluted basis. As a result of the share exchanges, Renhuang was deemed to be the acquirer
for accounting purposes. Accordingly, the financial statements presented are
those of Renhuang China for all periods prior to our acquisition of the BVI
company on September 7, 2006, and the financial statements of the consolidated companies from the
acquisition date forward.
Change in Fiscal
Year
On December 5, 2006, our Board of
Directors approved the change of our fiscal year end from April 30 to
October 31. Our Annual Report on Form 10-K for the period ended
October 31, 2006 was a
transition report, and included information for the six-month transitional
period from May 1, 2006 to October 31, 2006.
Year Ended October 31, 2008 Compared to
Year Ended October 31, 2007
For the fiscal year ended October 31,
2008, we generated
$34,474,490 in revenues and cost of sales of $15,980,638. With these revenues
and cost of sales for the year ended October 31, 2008, we had a net income of
$10,291,099. For the fiscal year ended October 31, 2007, we generated
$28,040,174 in revenues on cost of sales of $13,693,892.
With these revenues and cost of sales for the year ended October 31, 2007, we
had a net income of $9,596,632.
Revenues,
Expenses and Net Income
|
Year Ended
October 31,
2008
|
Year Ended
October 31, 2007
|
|||||||
|
Revenue
|
$
|
$34,474,490
|
$
|
28,040,174
|
||||
|
Cost of
Sales
|
(15,980,638
|
)
|
(13,693,892
|
)
|
||||
|
Selling and Distribution
Expenses
|
(163,355
|
)
|
(166,567
|
)
|
||||
|
Advertising
Expenses
|
(3,155,063
|
)
|
(1,358,900
|
)
|
||||
|
General and Administrative
Expenses
|
(2,620,656
|
)
|
(2,553,541
|
)
|
||||
|
Research and
Development
|
(2,124,511
|
)
|
(282,009
|
)
|
||||
|
Provision for Doubtful
Accounts
|
(243,282
|
)
|
(130,634
|
)
|
||||
|
Depreciation and
Amortization
|
(13,578
|
)
|
(293,637
|
)
|
||||
|
Other Income
(Cost)
|
117,692
|
35,638
|
||||||
|
Net Income
|
$
|
$10,291,099
|
$
|
9,596,632
|
||||
29
Revenues
Our revenues for the year ended October
31, 2008 were 34,474,490 compared to revenues of $28,040,174 for the
year ended October 31, 2007, representing an increase of $6,434,316, or
23%. This increase was primarily due to our success in marketing
expansion, with an adjustment on products. During the year ended October
31, 2008, we increased production of our
products with higher profit margins and decreased production of our products
with lower profit margins. Our revenues for the year ended October 31, 2008
consisted primarily of sales of the following products: Acanthopanax products (approximately 53%), Shark
Power Healthcare products (approximately 17%), and other Chinese traditional
medical products (approximately 30%)
Cost of Sales
Our cost of sales for the fiscal year
ended October 31, 2008, which consisted primarily of raw material, labor and production
costs, were $15,980,638 as compared to cost of sales of $13,693,892 for the
fiscal year ended October 31, 2007, representing an increase of $2,286,746, or
16.7%. The increase in our cost of sales was primarily due
to the increase of
revenue.
Selling and Distribution
Expenses
Our selling and distribution expenses
consist of expenses related to the actual sales of our products and the costs we
incur in distributing those products such as expansion costs, and
salaries of sales
staff. For the fiscal year ended October 31, 2008, our selling and
distribution expenses were $163,355, as compared to $166,567 for the fiscal year
ended October 31, 2007, representing a slight decrease of $3,212, or
1.9%.
Advertising Expenses
For the fiscal year ended October 31,
2008, we had advertising expenses of $3,155,063 as compared to $1,358,900 for
the fiscal year ended October 31, 2007, representing an increase of $1,796,163,
or 132.2%. Our advertising expenses consisted of expenses related to the advertising of
Acanthophanax and our traditional Chinese medicines. Our advertising expenses
for the fiscal year ended October 31, 2008 were substantially higher than our
advertising expenses for the fiscal year ended October 31, 2007
primarily due to our efforts to expand our
market share.
General and Administrative
Expenses
Our general and administrative expenses
were $2,620,656 for the fiscal year ended October 31, 2008, compared to
$2,553,541 for the fiscal year ended October 31, 2007, representing a slight increase of
$67,115, or 2.6%. Our general and administrative expenses for the fiscal year
ended October 31, 2008 primarily consisted of the following: $145,391 for
traveling expenses, $868,402 for payroll, $178,358 for office expenses, $69,384 for vehicle usage expenses,
$44,183 for telephone charge, $22,801 for employee’s welfare and $159,695 for entertainment
expenses
Research and
Development
Our research and development expenses
were $2,124,511 for the fiscal year ended October 31, 2008, compared to research and
development expenses of $282,009 for the year ended October 31, 2007,
representing a significant increase of $1,842,502, or 653.3%. This
increase was primarily due to our development of Acanthopanax cultivation and
extraction of effective parts and the
increased research and development of other medicine.
30
Depreciation and
Amortization
We had depreciation and amortization
expenses of $339,257 for the fiscal year ended October 31, 2008, with $325,679
included in the costs of
good sold, compared to $293,637 for the fiscal year ended October 31, 2007,
representing an increase of $45,620, or 15.5%. For both periods our
depreciation and amortization expenses related to machinery, equipment and
vehicles.
Net Income from Operations
Our net income for the fiscal year ended
October 31, 2008 was $10,291,099, compared to $9,596,632 for the fiscal year
ended October 31, 2007. Our net income increased significantly due to higher
revenue and sales of higher gross margin products for the fiscal year ended October
31, 2008.
Liquidity and Capital
Resources
Our cash, current assets, total assets,
current liabilities, and total liabilities as of October 31, 2008 and 2007,
respectively, are as follows:
|
|
|
October 31,
2008
|
|
|
October 31,
2007
|
|
||
|
Cash and Cash
Equivalents
|
$
|
9,747,693
|
$
|
10,153,603
|
||||
|
Total Current
Assets
|
33,384,894
|
22,283,186
|
||||||
|
Total
Assets
|
36,005,843
|
24,889,471
|
||||||
|
Total Current
Liabilities
|
1,961,087
|
3,495,971
|
||||||
|
Total
Liabilities
|
1,961,087
|
3,495,971
|
||||||
|
Working
Capital
|
31,423,807
|
18,787,215
|
||||||
Sources and
Uses of Cash
Operations
Net cash provided by (used in)
operating activities was
$(1,227,941) for the year ended October 31, 2008, compared to $8,876,363 for the
year ended October 31, 2007. Our cash from operating activities for the year
ended October 31, 2008 was primarily ($11,431,340) in net trade receivables,
($1,513,512) in inventories, $361,427 in
other net receivables, $22,642 in third party accounts payable and accruals, and
$490,903 in other payables.
Investments
Net cash used in investing activities
was $110,760 for the year ended October 31, 2008, compared to $45,741 for the year ended October
31, 2007. For the year ended October 31, 2008 and 2007, all our cash used in
investing activities related to the acquisition of property, plant and
equipment.
Financing
Net cash provided by financing
activities was nil for the
year ended October 31, 2008 and 2007.
Debt
Instruments, Guarantees, and Related Covenants
We do not have any long term debt and no
significant short term debt, and have not entered into any guarantee
arrangements or other related covenants.
31
Critical Accounting
Policies
The preparation of our financial
statements in conformity with accounting principles generally accepted in the
United States of America requires our management to make certain estimates and
assumptions that affect the reported amounts of assets and
liabilities and disclosure of contingent assets and liabilities at the date of
the financial statements and the reported amounts of revenues and expenses
during the reporting period. As such, in accordance with the use of
accounting principles generally accepted in
the United States of America, our actual realized results may differ from
management’s initial estimates as
reported. On an on-going basis, we evaluate our estimates including
the allowance for doubtful accounts and inventories, the salability and
recoverability of our products, income taxes and contingencies and remaining
useful lives of our tangible and certain intangible assets. We base our
estimates on historical experience and on other assumptions that we
believes to be reasonable under the
circumstances, the results of which form our basis for making judgments about
the carrying values of assets and liabilities that are not readily apparent from
other sources. Actual results may differ from these estimates under different assumptions or
conditions.
A summary of our significant accounting
policies are located in the notes to the financial statements which are an
integral component of this filing.
Off-balance Sheet
Arrangements
We do not have any off-balance
sheet
arrangements.
Contractual
Obligations
|
Payments due by
period
|
|||||||||||
|
Obligations
|
Total
|
1 Year
|
2 Years
|
3Years
|
4Years
|
||||||
|
Long-Term Debt
Obligations
|
-0-
|
-0-
|
-0-
|
-0-
|
-0-
|
||||||
|
Capital Lease Obligations
|
-0-
|
-0-
|
-0-
|
-0-
|
-0-
|
||||||
|
Operating Lease Obligations -
Total
|
496,645
|
433,649
|
62,996
|
-0-
|
-0-
|
||||||
|
Operating Lease Obligations -
Related Party
|
307,656
|
307,656
|
-0-
|
-0-
|
-0-
|
||||||
|
Operating Lease Obligations -
Third Party
|
188,989
|
125,993
|
62,996
|
-0-
|
-0-
|
||||||
|
Purchase
Obligations
|
-0-
|
-0-
|
-0-
|
-0-
|
-0-
|
||||||
|
Other Long-Term
Liabilities
|
-0-
|
-0-
|
-0-
|
-0-
|
-0-
|
||||||
|
Total Contractual
Obligations
|
496,645
|
433,649
|
62,996
|
-0-
|
-0-
|
||||||
As noted above, we do lease office space
from Old Renhuang, but we rent the space pursuant to a year to year
lease.
ITEM 7A – QUANTITATIVE AND QUALITATIVE DISCLOSURES ABOUT MARKET
RISK
Not required.
ITEM 8 - FINANCIAL STATEMENTS AND
SUPPLEMENTARY DATA
32
RENHUANG PHARMACEUTICALS, INC AND
SUBSIDIARIES
CONSOLIDATED FINANCIAL
STATEMENTS
OCTOBER 31, 2008 AND
2007
INDEX TO FINANCIAL STATEMENTS
|
Report of Independent Registered
Public Accounting Firms
|
F-2
|
|
|
Consolidated Balance Sheets as of
October 31, 2008 and 2007
|
F-3 – F-4
|
|
|
Consolidated Statements of Income
and Comprehensive Income for the years ended October 31, 2008 and
2007
|
F-5
|
|
|
Consolidated Statements of Changes
in Stockholders’ Equity for the years ended
October, 2008 and 2007
|
F-6
|
|
|
Consolidated Statements of Cash
Flows for the years ended October, 2008 and 2007
|
F-7 – F-8
|
|
|
Notes to Consolidated Financial
Statements
|
F-9 –
F-24
|
REPORT OF INDEPENDENT REGISTERED PUBLIC
ACCOUNTING FIRM
To the Board of Directors and
Stockholders of
Renhuang Pharmaceuticals,
Inc.
We have audited the accompanying
consolidated balance sheet of Renhuang Pharmaceuticals, Inc. (the
"Company"), as of October 31, 2008, and the related consolidated statements
of income and comprehensive income, changes in stockholders' equity, and cash
flows for the year then ended. These consolidated financial statements are the responsibility of the
Company's management. Our responsibility is to express an opinion on these
consolidated financial statements based on our audit.
We conducted our audit in accordance
with the standards of the Public Company Accounting Oversight Board (United States). Those
standards require that we plan and perform the audit to obtain reasonable
assurance about whether the financial statements are free of material
misstatement. The Company is not required to have, nor were we
engaged to perform, an audit of its internal
control over financial reporting. Our audits included consideration of internal
control over financial reporting as a basis for designing audit procedures that
are appropriate in the circumstances, but not for the purpose of expressing an opinion on the
effectiveness of the Company’s internal control over financial
reporting. Accordingly, we express no such opinion. An audit includes
examining, on a test basis, evidence supporting the amounts and disclosures in
the financial statements. An audit
also includes assessing the accounting principles used and significant estimates
made by management, as well as evaluating the overall financial statement
presentation. We believe that our audit provides a reasonable basis
for our opinion.
In our opinion, the consolidated
financial statements referred to above present fairly, in all material respects,
the financial position of the Company as of October 31, 2008, and the
results of their operations and cash flows for the year then ended, in conformity with U.S.
generally accepted accounting principles.
/s/ MSPC
Certified Public Accountants and
Advisors
A Professional
Corporation
New York, New York
August 28,
2009, except as to the restatement discussed in Note 20 to the
consolidated financial statements,
which is as of November 25, 2009
REPORT OF INDEPENDENT REGISTERED PUBLIC
ACCOUNTING FIRM
To the Directors and Stockholders
of
Renhuang Pharmaceuticals,
Inc.
We have audited the accompanying
consolidated balance sheet
of Renhuang Pharmaceuticals, Inc. as at October 31, 2007, and the related
consolidated statement of income, cash flows and changes in
stockholders’ equity for the year ended October 31,
2007. These consolidated financial statements are the responsibility of the Company’s management. Our responsibility is to
express an opinion on these consolidated financial statements based on our
audit.
We conducted our audit in accordance
with the standards of the Public Company Accounting Oversight Board (United
States). Those standards
require that we plan and perform the audit to obtain reasonable assurance about
whether the financial statements are free of material misstatement. An audit
includes examining, on a test basis, evidence supporting the amounts and
disclosures in the financial statements. An
audit also includes assessing the accounting principles used and significant
estimates made by management, as well as evaluating the overall financial
statement presentation. We believe that our audit provides a reasonable basis for our
opinion.
In our opinion, these consolidated
financial statements referred to above present fairly, in all material respects,
the financial position of Renhuang Pharmaceuticals, Inc. as of October 31, 2007,
and the results of its operations and its cash flows for the year
ended October 31, 2007 in conformity with generally accepted accounting
principles in the United States of America.
|
“Schwartz Levitsky Feldman
LLP”
|
|
|
/s/ Schwartz Levitsky Feldman
llp
|
|
|
Toronto, Ontario, Canada
|
Chartered
Accountants
|
|
May 15,
2008
|
Licensed Public
Accountants
|
1167 Caledonia Road
Toronto, Ontario M6A
2X1
Tel: 416 785 5353
Fax: 416 785
5663
F-2
RENHUANG PHARMACEUTICALS, INC. AND
SUBSIDIARIES
CONSOLIDATED BALANCE
SHEETS
AS OF OCTOBER 31, 2008 AND 2007
ASSETS
|
|
|
October 31,
2008
(Restated –
see Note 20)
|
|
|
October 31,
2007
|
|
||
|
CURRENT
ASSETS
|
||||||||
|
Cash and cash equivalents (NOTE
4)
|
$
|
9,747,693
|
$
|
10,153,603
|
||||
|
Accounts receivable, net (NOTE
5)
|
20,844,479
|
10,480,549
|
||||||
|
Inventories (NOTE
7)
|
2,625,385
|
969,672
|
||||||
|
Prepayments
|
33,695
|
9,917
|
||||||
|
Other receivables, net (NOTE
6)
|
133,642
|
669,445
|
||||||
|
TOTAL CURRENT
ASSETS
|
33,384,894
|
22,283,186
|
||||||
|
PROPERTY, PLANT
AND EQUIPMENT, NET (NOTE 8)
|
2,620,949
|
2,606,285
|
||||||
|
TOTAL
ASSETS
|
$
|
36,005,843
|
$
|
24,889,471
|
||||
The accompanying notes are an integral
part of the consolidated financial statements
F-3
RENHUANG PHARMACEUTICALS, INC. AND
SUBSIDIARIES
CONSOLIDATED BALANCE
SHEETS
AS OF OCTOBER 31, 2008 AND
2007
LIABILITIES
AND STOCKHOLDERS' EQUITY
|
|
|
October 31,
2008
(Restated –
see Note 20)
|
|
|
October 31,
2007
|
|
||
|
CURRENT
LIABILITIES
|
||||||||
|
Accounts payables (NOTE
9)
|
$
|
193,934
|
$
|
188,600
|
||||
|
Other payables (NOTE
10)
|
1,767,153
|
3,307,371
|
||||||
|
TOTAL
LIABILITIES
|
1,961,087
|
3,495,971
|
||||||
|
COMMITMENTS AND CONTINGENCIES
(NOTE 16)
|
||||||||
|
STOCKHOLDERS' EQUITY
|
||||||||
|
Preferred stock - Authorized
preferred shares 1,000,000, issued and outstanding number of shares:
nil
|
||||||||
|
Common Stock - Authorized common
shares 100,000,000, issued and outstanding number of shares
35,096,680
(35,096,680 in 2007) at par value of 0.001
|
35,097
|
35,097
|
||||||
|
Additional paid-in
capital
|
6,595,400
|
6,627,099
|
||||||
|
Reserves (NOTE
11)
|
2,867,674
|
1,841,734
|
||||||
|
Retained
earnings
|
21,245,271
|
11,980,112
|
||||||
|
Accumulated other comprehensive
income
|
3,301,314
|
909,458
|
||||||
|
TOTAL STOCKHOLDERS'
EQUITY
|
34,044,756
|
21,393,500
|
||||||
|
TOTAL LIABILITIES AND
STOCKHOLDERS' EQUITY
|
$
|
36,005,843
|
$
|
24,889,471
|
||||
The accompanying notes are an integral
part of the consolidated financial statements
F-4
RENHUANG
PHARMACEUTICALS, INC. AND SUBSIDIARIES
CONSOLIDATED STATEMENTS OF INCOME AND
COMPREHENSIVE INCOME
FOR THE YEARS ENDED OCTOBER 31, 2008 AND 2007
|
|
|
Year Ended
October 31, 2008
(Restated –
see Note 20)
|
|
|
Year Ended
October 31, 2007
|
|
||
|
SALES
|
$
|
34,474,490
|
$
|
28,040,174
|
||||
|
COST OF
SALES
|
(15,980,638
|
)
|
(13,693,892
|
)
|
||||
|
GROSS
PROFIT
|
18,493,852
|
14,346,282
|
||||||
|
SELLING AND DISTRIBUTION
EXPENSES
|
(163,355
|
)
|
(166,567
|
)
|
||||
|
ADVERTISING EXPENSE
|
(3,155,063
|
)
|
(1,358,900
|
)
|
||||
|
GENERAL AND ADMINISTRATIVE
EXPENSES
|
(2,620,656
|
)
|
(2,553,541
|
)
|
||||
|
RESEARCH AND
DEVELOPMENT
|
(2,124,511
|
)
|
(282,009
|
)
|
||||
|
(PROVISION FOR DOUBTFUL
ACCOUNTS)/RECOVERY
|
(243,282
|
)
|
(130,634
|
)
|
||||
|
DEPRECIATION AND
AMORTIZATION
|
(13,578
|
)
|
(293,637
|
)
|
||||
|
INCOME FROM OPERATIONS
|
10,173,407
|
9,560,994
|
||||||
|
OTHER
INCOME
|
117,692
|
35,638
|
||||||
|
INCOME BEFORE INCOME
TAXES
|
10,291,099
|
9,596,632
|
||||||
|
INCOME TAXES (NOTE
12)
|
—
|
—
|
||||||
|
NET INCOME
|
$
|
10,291,099
|
$
|
9,596,632
|
||||
|
OTHER COMPREHENSIVE
INCOME
|
||||||||
|
FOREIGN CURRENCY TRANSLATION
ADJUSTMENT
|
2,391,856
|
855,719
|
||||||
|
COMPREHENSIVE
INCOME
|
$
|
12,682,955
|
$
|
10,452,351
|
||||
|
BASIC EARNINGS PER
SHARE
|
0.29
|
0.27
|
||||||
|
DILUTED EARNING PER
SHARE
|
0.29
|
0.27
|
||||||
|
WEIGHTED AVERAGE NUMBER OF COMMON
SHARES OUTSTANDING –BASIC
|
35,096,681
|
35,039,310
|
||||||
|
WEIGHTED AVERAGE NUMBER OF
COMMON SHARES
OUTSTANDING –DILUTED
|
35,096,681
|
35,039,550
|
||||||
The accompanying notes are an integral
part of the consolidated financial statements
F-5
RENHUANG PHARMACEUTICALS, INC AND
SUBSIDIARIES
CONSOLIDATED STATEMENTS OF CHANGES IN
STOCKHOLDERS’ EQUITY
FOR THE YEARS ENDED OCTOBER 31, 2008
(Restated) AND 2007
|
Accumulated
|
||||||||||||||||||||||||||||
|
Additional
|
Other
|
|||||||||||||||||||||||||||
|
Common Stock
|
Paid-in
|
Retained
|
comprehensive
|
Total
|
||||||||||||||||||||||||
|
Shares
|
Amount
|
capital
|
Reserves
|
Earnings
|
income
|
Equity
|
||||||||||||||||||||||
|
Balance
at November 1, 2006
|
35,000,181
|
$
|
35,000
|
$
|
6,310,822
|
$
|
847,133
|
$
|
3,378,081
|
$
|
53,739
|
$
|
10,624,775
|
|||||||||||||||
|
Issuance
of common stock for service
|
96,500
|
97
|
284,578
|
—
|
—
|
—
|
284,675
|
|||||||||||||||||||||
|
Net
income for the year
|
—
|
—
|
—
|
9,596,632
|
—
|
9,596,632
|
||||||||||||||||||||||
|
Transfer
to reserves
|
—
|
—
|
994,601
|
(994,601
|
)
|
—
|
—
|
|||||||||||||||||||||
|
Warrants
issued to director for service
|
—
|
31,699
|
—
|
—
|
—
|
31,699
|
||||||||||||||||||||||
|
Other
comprehensive income
|
||||||||||||||||||||||||||||
|
-
foreign currency translation
|
—
|
—
|
—
|
—
|
855,719
|
855,719
|
||||||||||||||||||||||
|
Balance
at October 31, 2007
|
35,096,681
|
$
|
35,097
|
$
|
6,627,099
|
$
|
1,841,734
|
$
|
11,980,112
|
$
|
909,458
|
$
|
21,393,500
|
|||||||||||||||
|
Net
income for the year
|
—
|
—
|
—
|
10,291,099
|
—
|
10,291,099
|
||||||||||||||||||||||
|
Transfer
to reserves
|
—
|
—
|
1,025,940
|
(1,025,940
|
)
|
—
|
—
|
|||||||||||||||||||||
|
Cancellation
of Warrants
|
(31,699
|
)
|
(31,699
|
)
|
||||||||||||||||||||||||
|
Other
comprehensive income
|
||||||||||||||||||||||||||||
|
-
foreign currency translation
|
—
|
—
|
—
|
—
|
2,391,856
|
2,391,856
|
||||||||||||||||||||||
|
Balance
at October 31, 2008 (Restated – see
Note 20)
|
35,096,681
|
$
|
35,097
|
$
|
6,595,400
|
$
|
2,867,674
|
$
|
21,245,271
|
$
|
3,301,314
|
$
|
34,044,756
|
|||||||||||||||
The accompanying notes are an integral
part of the consolidated financial statements
F-6
RENHUANG PHARMACEUTICALS, INC AND
SUBSIDIARIES
CONSOLIDATED STATEMENTS OF CASH
FLOWS
FOR THE YEAR ENDED OCTOBER 31, 2008 AND
2007
|
|
|
Year Ended
October 31, 2008
|
|
|
|
|
||
|
(Restated
–
see
Note 20)
|
Year Ended
October 31, 2007
|
|||||||
|
CASH
FLOWS FROM OPERATING ACTIVITIES:
|
||||||||
|
Net
income
|
$
|
10,291,099
|
$
|
9,596,632
|
||||
|
Adjustments
to reconcile net income to net cash from operating activities :
|
||||||||
|
Depreciation
and amortization
|
339,257
|
293,637
|
||||||
|
Provision
for bad debts/(Recovery)
|
243,282
|
130,634
|
||||||
|
Fair
value of warrants issued/(cancelled) for
services
|
(31,699
|
)
|
31,699
|
|||||
|
Fair
value of shares issued for services
|
—
|
284,675
|
||||||
|
Changes
in operating assets and liabilities:
|
||||||||
|
Accounts
receivable
|
(11,431,340
|
)
|
(2,574,916
|
)
|
||||
|
Inventories
|
(1,513,512
|
)
|
(305,926
|
)
|
||||
|
Amount
due from related parties
|
271,198
|
(430,146
|
)
|
|||||
|
Other
receivables
|
112,338
|
520,523
|
||||||
|
Deferred
expenses
|
—
|
118,647
|
||||||
|
Prepayments
|
(22,109
|
)
|
95,325
|
|||||
|
Accounts
payable and
accruals
|
22,642
|
(191,388
|
)
|
|||||
|
Other
Payables
|
490,903
|
1,306,967
|
||||||
|
NET
CASH - OPERATING ACTIVITIES
|
(1,227,941
|
)
|
8,876,363
|
|||||
|
CASH
FLOWS FROM INVESTING ACTIVITIES:
|
||||||||
|
Acquisition
of property, plant and equipment
|
(110,760
|
)
|
(45,741
|
)
|
||||
|
NET
CASH - INVESTING ACTIVITIES
|
(110,760
|
)
|
(45,741
|
)
|
||||
|
CASH
FLOWS FROM FINANCING ACTIVITIES:
|
—
|
—
|
||||||
The accompanying notes are an integral
part of the consolidated financial statements
F-7
RENHUANG PHARMACEUTICALS, INC AND
SUBSIDIARIES
CONSOLIDATED STATEMENTS OF CASH FLOWS
(CONTINUED)
FOR THE YEAR ENDED OCTOBER 31,
2008 AND
2007
|
|
|
Year Ended
October 31, 2008
(Restated –
see Note 20)
|
|
|
Year Ended
October 31, 2007
|
|
||
|
NET CHANGE IN CASH AND CASH
EQUIVALENTS
|
(1,338,701
|
)
|
8,830,622
|
|||||
|
EFFECT OF EXCHANGE RATE CHANGES ON
CASH AND CASH EQUIVALENTS
|
932,791
|
301,714
|
||||||
|
Cash and cash equivalents,
beginning of period
|
10,153,603
|
1,021,267
|
||||||
|
Cash and cash equivalents, end of
period
|
$
|
9,747,693
|
$
|
10,153,603
|
||||
|
SUPPLEMENTAL DISCLOSURE OF CASH
FLOW INFORMATION
|
||||||||
|
Interest
paid
|
—
|
—
|
||||||
|
Income taxes
paid
|
—
|
—
|
||||||
|
SUPPLEMENTARY DISCLOSURE OF
NON-CASH INVESTING AND FINANCING ACTIVITIES
|
||||||||
|
Issuance of common shares for
financing services
|
—
|
284,675
|
||||||
|
Warrants granted to a director for
services
|
—
|
31,699
|
||||||
The accompanying notes are an integral
part of the consolidated financial statements
F-8
RENHUANG PHARMACEUTICALS,
INC AND
SUBSIDIARIES
NOTES TO CONSOLIDATED FINANCIAL
STATEMENTS
OCTOBER 31, 2008 AND
2007
1. ORGANIZATION AND PRINCIPAL
ACTIVITIES
Renhuang Pharmaceuticals, Inc.,
(“Renhuang”) or the (“Company”) was incorporated in the State of
Nevada on August 18, 1988
as Solutions, Incorporated. Since that time, the Company has undergone a series
of name changes as follows: Suarro Communications, Inc., e-Net Corporation,
e-Net Financial Corp., e-Net.Com Corporation, e-Net Financial.Com Corporation,
Anza Capital, Inc. and finally on July 28, 2006 the
Company changed its name to Renhuang Pharmaceuticals, Inc.
Shares of the Company's Common Stock are
trading on the pink sheet under the symbol RHGP.
Unless otherwise provided in this
current report, all references in this current report to “we”, “us”, “our company”, “our”, or the “Company” refer to the consolidated Renhuang
Pharmaceuticals, Inc. entity.
The subsidiary company Harbin Renhuang
Pharmaceuticals Co., Ltd (“Renhuang China”) is incorporated at Harbin
City in the
People’s Republic of China (the “PRC” or “China”) in 1996. The subsidiary is principally
engaged in production and sales of nutraceutical and bio-pharmaceutical products
including tablets, drinks and health food. The subsidiary’s sales network covers various provinces, cities, and
counties throughout China.
The products of the Company are made in
two facilities located at Harbin City with specialized
machinery.
The economy of PRC differs significantly
from the economies of industrialized nations in such respects as structure,
level of development, gross national product, growth rate, capital reinvestment,
resource allocation, self-sufficiency, rate of inflation and balance of payments
position, among others. Only recently has the PRC government encouraged substantial private
economic activities. The Chinese economy has experienced significant growth in
the past several years, but such growth has been uneven among various sectors of
the economy and geographic regions. Actions by the PRC government to control inflation have
significantly restrained economic expansion in the recent past. Similar actions
by the PRC government in the future could have a significant adverse effect on
economic conditions in PRC.
Many laws and regulations dealing
with economic matters in
general and foreign investment in particular have been enacted in the PRC.
However, the PRC still does not have as comprehensive a system of laws as other
nations, and enforcement of existing laws may be uncertain and
sporadic.
The Company’s operating assets and primary sources
of income and cash flows are of interests in the PRC. The PRC economy has been a
centrally-planned economy, operating on the basis of annual, five-year and
ten-year plans adopted by central governmental authorities, which set out national
production and development targets. There is no assurance that the PRC
government will continue to pursue economic reforms or that there will not be
any significant change in its economic or other policies, particularly
in the event of any change in the
political leadership of, or the political, economic or social conditions in, the
PRC. There is no assurance that the Company will not be adversely affected by
any such change in governmental policies or any unfavorable change in the political economic or social
conditions, the laws or regulations, or the rate or method of taxation in the
PRC.
As many of the economic reforms which
have been or are being implemented by the PRC government are unprecedented or
experimental, they may be
subject to adjustment or refinement, which may have adverse effects on the
Company. Further, through state plans and other economic and fiscal measures, it
remains possible for the PRC government to exert significant influence on the
PRC economy.
F-9
2. BASIS OF
PRESENTATION
The consolidated financial statements
include the financial statements of the Company and its wholly-owned
subsidiaries Harbin Renhuang Pharmaceutical Company Limited (the “BVI”) and Harbin Renhuang Pharmaceutical Co.
Ltd. (“Renhuang China”) and are prepared in accordance with
generally accepted accounting principles of the United States of
America.
3. SUMMARY OF PRINCIPAL ACCOUNTING
POLICIES
A. CASH AND CASH
EQUIVALENTS
The Company considers cash and cash
equivalents to include cash
on hand and demand deposits with banks with an original maturity of three months
or less.
B. ACCOUNTS RECEIVABLE,
NET
Accounts receivable are recognized and
carried at the original invoice amount less allowance for any
uncollectible amounts. An
account is considered past due after 180 days and 90 days from
the invoice date as at October 31, 2008 and 2007, respectively. The Company
extended its standard credit terms to 180 days during 2008 in order to increase
its market share. The allowance on the doubtful accounts
was $442,912 as at October 31, 2008 ($134,295 in 2007). The Company does not
accept returns or offer any post-sales marketing supporting to
customers,
C. INVENTORIES
Inventories are stated at the lower of
cost or net realizable
value. Production cost is allocated at FIFO and overhead cost is calculated on
the weighted average basis. The cost includes all costs to acquire,
transport and process inventories to their present location and condition. The
Company evaluates the net realizable value of its
inventories on a regular basis and records a provision for loss, if necessary,
to reduce inventories to their net realizable value. There were $64,147 of
inventory reserve provisions recorded at October 31,
2008.
F-10
3. SUMMARY OF PRINCIPAL ACCOUNTING POLICIES
(CONTINUED)
D. PROPERTY, PLANT AND
EQUIPMENT
Property, plant and equipment are
carried at cost. The cost of repairs and maintenance is expensed as incurred;
major replacements and improvements are capitalized.
When assets are retired or disposed of,
the cost and accumulated depreciation are removed from the accounts, and any
resulting gains or losses are included as components of income in the year of
disposition.
The Company records depreciation of
its property, plant and
equipment on a straight-line basis over the estimated useful lives of the assets
based on their costs. The useful lives for property, plant and equipment are
estimated as follows:
|
Machinery and
equipment
|
10 years
|
|
Office equipment and
furnishings
|
5 to 10
years
|
|
Motor
vehicles
|
5 to 10
years
|
E. FAIR VALUE OF FINANCIAL
INSTRUMENTS
Effective February 3, 2008, the Company adopted Statements
of Financial Accounting Standards (“SFAS”) No. 157, “Fair Value Measurements,” (“SFAS 157”), as it applies to financial assets and
liabilities that are recognized or disclosed at fair value on a recurring basis.
SFAS 157 defines fair value, establishes a framework for measuring fair value in
accordance with generally accepted accounting principles and expands disclosures about
fair value measurements. The SFAS 157 fair value hierarchy consists of three
levels: Level 1 fair values are valuations based on quoted market prices in
active markets for identical assets or liabilities that the Company has the ability to access; Level 2
fair values are those valuations based on quoted prices for similar assets or
liabilities, quoted prices in markets that are not active, or other inputs that
are observable or can be corroborated by observable data for substantially the full term of the
assets or liabilities; and Level 3 fair values are valuations based on inputs
that are supported by little or no market activity and that are significant to
the fair value of the assets or liabilities. The adoption of SFAS 157 as it applies to financial
assets and liabilities that are recognized or disclosed at fair value on a
recurring basis did not have and is not expected to have a significant impact on
the Company’s consolidated financial position,
results of operations or cash flows.
The carrying value of financial
instruments including cash, accounts receivables, other receivables, accounts
payable, other payables and accrued expenses and debts, approximates their fair
value at October 31, 2008 due to the relatively short-term nature of these
instruments. As of October 31, 2008, all financial instruments recorded by the
Company are considered Level 1 as that term is defined in SFAS
157.
F. INCOME TAXES
The Company accounts for income tax
under the provisions of
SFAS No. 109, “Accounting
for Income Taxes,” which
requires recognition of deferred tax assets and liabilities for the expected
future tax consequences of events that have been included in the consolidated
financial statements. Deferred income taxes are provided using the liability
method. Under the liability method, deferred income taxes are recognized for all
significant temporary differences between the tax and financial statement bases
of assets and liabilities. In addition, the Company is required to record all deferred tax assets,
including future tax benefits of capital losses carried forward, and to record a
“valuation
allowance” for any deferred
tax assets where it is more likely than not that the asset will not be
realized.
F-11
3. SUMMARY OF PRINCIPAL ACCOUNTING POLICIES
(CONTINUED)
F. INCOME TAXES
(CONTINUED)
In accordance with the relevant income
tax laws applicable to wholly foreign owned enterprises operating in PRC, the
profits of the Company are fully exempt from income tax for two years (“tax holiday”), commencing from the first profit
making year of operations, followed by a 50% exemption for the immediate next
three years (“tax
preferential period”),
after which the profits of the Company will be taxable at the full rate,
currently 25% (See Note
12).
G. RELATED PARTIES
Parties are considered to be related if
one party has the ability, directly or indirectly, to control the other party or
exercise significant influence over the other party in making financial and
operational decisions.
Parties are also considered to be related if they are subject to common control
or common significant influence. Related parties may be individuals or corporate
entities (See Note 15).
H. IMPAIRMENT OF LONG-TERM
ASSETS
The Company reviews long-lived assets for potential
impairment based on a review of projected undiscounted cash flows associated
with these assets. Long-lived assets are included in impairment evaluations when
events and circumstances exist that indicate the carrying amount of these assets may not be recoverable.
Measurement of impairment losses for long-lived assets that the Company expects
to hold and use is based on the estimated fair value of the assets. Therefore,
future changes in the Company’s strategy and other changes in its operations could impact the
projected future operating results that are inherent in estimates of fair value,
resulting in impairments in the future. Additionally, other changes in the
estimates and assumptions, including the discount rate and expected long-term growth rate, which drive
the valuation techniques employed to estimate the fair value of long-lived
assets could change and, therefore, impact the assessments of impairment in the
future. As of October 31, 2008, management expects its
long-lived assets to be fully
recoverable.
I. FOREIGN CURRENCY
TRANSLATION
The company maintains its books and
accounting records in its functional currency, the Renminbi, (which is the PRC's
currency).
Foreign currency transactions in RMB are
reflected using the
temporal method. Under this method, all monetary items are translated into the
functional currency at the rate of exchange prevailing at the balance sheet
date. Non-monetary items are translated at historical rates. Income and expenses
are translated at the rate in effect on the
transaction dates. Transaction gains and losses, if any, are included in the
determination of net income for the period.
In translating the financial statements
of the Company from its functional currency into its reporting currency in United States dollars,
balance sheet accounts are translated using the closing exchange rate in effect
at the balance sheet date and income and expense accounts are translated using
an average exchange rate prevailing during the reporting period. Adjustments resulting from the
transaction, if any, are included in accumulated other comprehensive income in
stockholders’ equity.
The RMB is not freely convertible into
foreign currencies and all foreign exchange transactions must take place
through authorized
institutions. No representation is made that the RMB amounts could have been, or
can be, converted into United States dollars at the rates used in translation.
The Foreign exchange rate between the RMB and the United States dollar on
October 31, 2008 and 2007 and the average
for the years the ended are:
F-12
3. SUMMARY OF PRINCIPAL ACCOUNTING
POLICIES (CONTINUED)
I. FOREIGN CURRENCY TRANSLATION
(CONTINUED)
|
|
2008
|
2007
|
||
|
Balance Sheet- Year end RMB : US$
exchange rate
|
6.8258:1
|
7.4820:1
|
||
|
Operating Statement: Average
yearly RMB : US$ exchange rate
|
7.0467:1
|
7.6917:1
|
||
J. USE OF ESTIMATES
The preparation of financial statements
in conformity with generally accepted accounting principles in the United States of America requires
management to make estimates and assumptions that affect the reported amounts of
assets and liabilities and disclosure of contingent assets and liabilities at
the date of the financial statements, and the reported amounts of revenue and expenses during the
reporting period. Significant estimates primarily related to the realizable
value of accounts receivable, other receivables, inventories, the useful lives
of plant and equipment and accruals of liabilities. Actual results when ultimately realized could
differ from those estimates.
K. REVENUE
RECOGNITION
The Company recognizes revenue when the
significant risks and rewards of ownership have transferred pursuant to PRC law,
including factors such as when persuasive evidence of an arrangement exists,
delivery has occurred, the sales price is fixed and determinable, and
collectability is reasonably assured; this policy is in accordance with the
provisions of Staff Accounting Bulletin No. 104. Renhuang generally
recognizes products sales when the product
is shipped. Revenue for product sold on consignment is recognized when the sales
agent uses the product.
The Company provides rebates to its
sales agents (which act as wholesalers) as an incentive plan. The
rebate rate is set on a
product-by-product basis. When revenue is recognized, the rebate is accounted
for as an offset to revenues in accordance with EITF Issue No. 01-9, Accounting
for Consideration Given by a Vendor to a Customer (Including a Reseller of
the Vendor’s Products). On average, the rebate rate
is 16% and 17% of gross revenue in 2008 and 2007,
respectively.
L. CERTAIN RISKS AND
CONCENTRATIONS
Financial instruments that potentially
subject the Company to significant concentrations of credit risk consist primarily of trade accounts
receivable. The Company performs ongoing credit evaluations with respect to the
financial condition of its creditors, but does not require collateral. In order
to determine the value of the Company's accounts receivable, the Company records a provision for
doubtful accounts to cover probable credit losses. Management reviews and
adjusts this allowance periodically based on historical experience and its
evaluation of the collectability of outstanding accounts receivable.
The Company’s financial instruments that are exposed
to concentration of credit risk consist primarily of cash and cash equivalents,
accounts receivable from customers and other receivables. Cash and cash
equivalents are maintained with major banks in the PRC.
The Company is subject to the
consideration and risks of operating in the PRC. These include risks associated
with the political and economic environment, foreign currency exchange and the
legal system in the PRC.
F-13
3. SUMMARY OF PRINCIPAL ACCOUNTING POLICIES
(CONTINUED)
M. RESEARCH AND
DEVELOPMENT
Research and development (“R&D”) costs are expensed as incurred.
Engineers and technical staff are involved in the production of our products as
well as on-going research, with no segregation of the portion of their salaries
relating to research and development from the portion of their salaries relating
to production. The total salaries are included in cost of
sales. R&D for the year ended October 31, 2008 and 2007 are
$2,124,511 and $282,009, respectively.
N. ADVERTISING
Advertising costs consist primarily of
promoting the Company and the Company’s products through television and
printed advertisements in trade publications. Advertising costs are expensed as
incurred. They are separately disclosed in the consolidated
statements of income and comprehensive income.
O. STOCK-BASED
COMPENSATION
The Company measures and records the
cost of employee services received in exchange for stock-based compensation at
the grant date fair value
of the award. This method is in accordance with SFAS
No. 123 (revised
2004), “Share-Based
Payment”.
P. CLASSIFICATION OF OPERATING COSTS AND
EXPENSES
The Company records its operating costs
and expenses using the following general classifications:
Cost of
Goods Sold
Cost of goods sold consists primarily of
raw materials, direct labor and manufacturing overhead. Manufacturing overhead
includes an allocation of purchasing and receiving costs, inspection fees,
warehousing utilities, supplies, factory and equipment repairs and
maintenance, safety equipment and supplies, packing materials, depreciation and
loading fees.
Selling
Expenses
Selling expenses includes primarily of
travel and entertainment, maintenance, payroll for sales staff, payroll taxes and benefits, telephone and
utilities, insurance, sales commissions and exports fees.
General and
Administrative Expenses
General and administrative expenses
includes primarily of general office expenses, travel and entertainment,
transportation,
administrative payroll, payroll taxes and benefits, maintenance, telephone,
utilities, printing, professional fees, continuing education, licenses and
fees.
R. EARNINGS PER
SHARE
The Company reports earnings per share
in accordance with SFAS No.
128, “Earnings per
Share.” Basic earnings per
share are computed by dividing income available to common shareholders by the
weighted average number of common shares available. Diluted earnings per share
is computed using the treasury stock method whereby the denominator is increased by the
net dilution on the exercise of the warrants and if the additional common shares
were dilutive.
F-14
3. SUMMARY OF PRINCIPAL ACCOUNTING
POLICIES (CONTINUED)
S. COMPREHENSIVE
INCOME
The Company has adopted the
provisions of SFAS No. 130,
"Reporting Comprehensive Income" ("SFAS No. 130"). SFAS No. 130 establishes
standards for the reporting and display of comprehensive income, its components
and accumulated balances in a full set of general-purpose financial
statements. SFAS No. 130 defines comprehensive
income to include all changes in equity except those resulting from investments
by owners and distributions to owners, including adjustments to minimum pension
liabilities, accumulated foreign currency translation, and unrealized gains or losses on marketable
securities. In the current period, the only component of other comprehensive
income is foreign translation gain of $ 2,391,856 ($855,719 in
2007), which has been recorded as the accumulative other comprehensive
income in the balance sheet. Consequently,
the comprehensive income for the period ended October 31, 2008 and 2007 was
$12,682,955 and $10,452,351, respectively.
T. RECENT
PRONOUNCEMENTS
The Company adopted SFAS 157 effective
January 1, 2008, except for
the nonfinancial assets and liabilities that are subject to a one-year deferral
allowed by FASB Staff Position (FSP) SFAS 157-2 (“ FSP SFAS 157-2”). FSP SFAS 157-2 delays the effective
date of SFAS 157 until fiscal years beginning after November 15, 2008 for nonfinancial assets and
liabilities that are not recognized or disclosed at fair value in the financial
statements on a recurring basis (at least annually). The adoption of SFAS 157
did not have a material effect on our financial statements. The Company does not expect the adoption of
SFAS 157 will have a material effect on our financial statements beginning in
year 2009 as it relates to the items subject to the one-year deferral allowed by
FSP SFAS 157-2.
In February 2007, the Financial
Accounting Standards Board
(“FASB”) issued Statement No. 159 “The Fair Value Option for Financial
Assets and Financial Liabilities” (SFAS 159). This statement permits
companies to choose to measure many financial assets and liabilities at fair
value. Unrealized gains and losses on items for which the fair
value option has been elected are reported in earnings. SFAS 159 is effective
for fiscal years beginning after November 15, 2007. The adoption of SFAS 159,
effective January 1, 2008, did not have a material impact on the Company’s financial
statements.
In December 2007, the FASB issued
SFAS No. 141(R),
“Business
Combinations”
(“SFAS 141(R)”). SFAS 141(R) requires an acquirer
to recognize the assets acquired, the liabilities assumed, and any
noncontrolling interest in
an acquiree at the acquisition date, measured at their fair values as of that
date; the immediate expense recognition of transaction costs and the accounting
for restructuring costs separately from the business combination. This Statement
also requires the acquirer in a business combination
achieved in stages (sometimes referred to as a step acquisition) to recognize
the identifiable assets and liabilities, as well as the noncontrolling interest
in the acquiree, at the full amounts of their fair values. SFAS 141(R) is effective for the
Company’s fiscal year beginning January 1,
2009 on a prospective basis.
F-15
3. SUMMARY OF PRINCIPAL ACCOUNTING
POLICIES (CONTINUED)
T. RECENT PRONOUNCEMENTS
(CONTINUED)
In December 2007, the FASB issued
SFAS No. 160,
“Noncontrolling Interests
in Consolidated Financial Statements — an amendment of ARB No. 51
” (“SFAS 160”). SFAS 160 requires entities to
report noncontrolling (minority) interests of consolidated subsidiaries as a
component of shareholders’ equity on the balance sheet; include all earnings of
a consolidated subsidiary in consolidated results of operations; and treat all
transactions between an entity and the noncontrolling interest as equity
transactions between the parties. SFAS 160 is effective for the Company’s fiscal year beginning January 1,
2009, and adoption is prospective only; however, the presentation and disclosure
requirements must be applied retrospectively. The Company does not
consolidate any partially owned subsidiaries and therefore does not expect the application of this
standard to have a material impact on its consolidated financial position, cash
flows or results of operations.
In March 2008, the FASB issued Statement
No. 161, Disclosures about Derivative Instruments and Hedging Activities an amendment of SFAS 133 ("SFAS 161").
This Statement will require enhanced disclosures about derivative instruments
and hedging activities to enable investors to better understand their effects on
an entity's financial position, financial performance and cash flows. It is effective for
financial statements issued for fiscal years and interim periods beginning after
November 15, 2008, with early application encouraged. The Company does not
expect the adoption of SFAS 161 to have a material impact on its financial position, results of
operations or cash flows.
In May 2008, the FASB issued SFAS No.
162, "The Hierarchy of Generally Accepted Accounting Principles" (SFAS No.162).
SFAS No. 162 identifies the sources of accounting principles and the
framework for selecting the
principles used in the preparation of financial statements. SFAS No. 162 is
effective 60 days following the SEC's approval of the Public Company Accounting
Oversight Board amendments to AU Section 411, "The Meaning of Present
Fairly in Conformity with Generally Accepted
Accounting Principles". The implementation of this standard will not have a
material impact on the Company's financial position and results of
operations.
4. CASH AND CASH
EQUIVALENTS
Cash and cash equivalents as
of October 31, 2008 and
2007 consist of the following:
|
2008
|
2007
|
|||||||
|
Cash on
hand
|
$
|
20,880
|
$
|
28,657
|
||||
|
Cash in
banks
|
9,726,813
|
10,124,946
|
||||||
|
$
|
9,747,693
|
$
|
10,153,603
|
|||||
F-16
5. ACCOUNTS RECEIVABLE,
NET
The Company's accounts receivable as at
October 31, 2008 and 2007 are summarized as follows:
|
2008
|
2007
|
|||||||
|
Accounts
receivable
|
$
|
21,287,391
|
$
|
10,614,844
|
||||
|
Less: Allowance for doubtful
accounts
|
(442,912
|
)
|
(134,295
|
)
|
||||
|
Accounts receivable,
net
|
$
|
20,844,479
|
$
|
10,480,549
|
||||
As at October 31, 2008, there are two
debtors which accounted for $2,566,568 and $2,562,825 of accounts receivable which are
approximately 12% and 12% of the total balance,
respectively.
The customers from whom the sales
amounts are over 10% of the total sales for the year ended October 31, 2008 and
2007 are:
|
2008
|
2007
|
|||||||||||||||
|
Customer A:
|
$ | 3,762,749 | 11 | % | $ | 3,743,234 | 11 | % | ||||||||
|
Customer B:
|
$ | 3,739,129 | 11 | % | $ | 3,563,758 | 10 | % | ||||||||
6. OTHER
RECEIVABLES
Other receivables as of October 31, 2008
and 2007 consist of the following:
|
2008
|
2007
|
|||||||
|
Due from third
parties
|
$
|
493,525
|
$
|
233,268
|
||||
|
Due from related parties (See Note
15)
|
-
|
482,365
|
||||||
|
Less: allowance for doubtful
accounts
|
(359,883
|
)
|
(46,188
|
)
|
||||
|
$
|
133,642
|
$
|
669,445
|
|||||
7. INVENTORIES
The Company's inventories at October 31,
2008 and 2007 are summarized as follows:
|
2008
|
2007
|
|||||||
|
Raw
materials
|
$
|
2,440,429
|
$
|
905,227
|
||||
|
Finished
goods
|
249,103
|
64,445
|
||||||
|
Less: Valuation
allowance
|
(64,147
|
)
|
—
|
|||||
|
$
|
2,625,385
|
$
|
969,672
|
|||||
The finished goods included $139,449 and
$0 consignment goods as at October 31, 2008 and 2007,
respectively.
F-17
8. PROPERTY, PLANT AND EQUIPMENT, NET
|
|
2008
|
2007
|
||||||
|
Cost:
|
||||||||
|
Machinery and
equipment
|
$
|
3,350,762
|
$
|
2,959,892
|
||||
|
Office equipment and
furnishings
|
53,015
|
38,649
|
||||||
|
Motor
vehicles
|
50,388
|
48,364
|
||||||
|
3,454,165
|
3,046,905
|
|||||||
|
Less: Accumulated
depreciation
|
(833,216
|
)
|
(440,620
|
)
|
||||
|
Net book
value
|
$
|
2,620,949
|
$
|
2,606,285
|
||||
For the year ended October 31, 2008,
depreciation expenses
relating to property, plant and equipment were $339,257, consisting of $325,679
recorded as Cost of Sales and $13,578 in general and administrative expenses and
$293,637 for the year ended October 31, 2007.
On March 3, 2007, the Company entered
into an agreement to
purchase certain assets and/or the right to use those assets from ZhangFa ShiYe
Qingyang (“QingYang”). The Company paid a deposit
of approximately $467,000 to QingYang and agreed to assume a bank loan of
approximately $165,000 to secure the rights. The loan
amount is included in other liabilities as of October 31, 2008 and
2007. The assets, which are comprised of property,
equipment and inventory, are pledged as collateral against the bank
loan. Although QingYang transferred operational control of the assets to the
Company it was unable to transfer ownership. Legal title can only
pass upon the agreement of the bank and local government
authorities. After paying the deposit, the Company began negotiating
with the bank and local authorities to settle all outstanding
issues and secure full ownership of the assets. As of October 31,
2007, the Company had not finalized those negotiations. As the
Company did not have legal title to the assets, it determined to record an
impairment reserve against the entire deposit amount
at that date. The $467,000 impairment is included in general and
administrative expenses.
9. ACCOUNTS PAYABLE
Accounts payable of $193,934 and
$188,600 as of October 31, 2008 and 2007 consist of balances payable to third party
suppliers. Amounts owed to three individual suppliers each exceeded
10% of total accounts payable at October 31, 2008; there balances were $57,825,
$46,283 and $39,076, respectively, which accounted for 30%, 24% and 20% of
gross accounts payable,
respectively.
The suppliers from whom the purchased
amounts are over 10% of the total purchases for the year ended October 31, 2008
and 2007 are:
|
2008
|
2007
|
|||||||||||||||
|
Supplier A:
|
$ | 3,571,254 | 25 | % | $ | 2,330,232 | 25 | % | ||||||||
|
Supplier B:
|
$ | 1,776,373 | 12 | % | $ | 1,189,098 | 13 | % | ||||||||
|
Supplier C:
|
$ | 1,379,880 | 10 | % | $ | 992,851 | 11 | % | ||||||||
10. OTHER PAYABLES
The balance as at October 31, 2008
mainly includes due to related party $93,738, VAT and other taxes payable of $693,607, and social insurance
payable of $643,526. The payable to related party is due to Old
Renhuang which has no payment term and is non-interest bearing. Old Renhuang
paid the professional fee on behalf of Renhuang during the reverse
merger.
F-18
As at October 31, 2007, the balance
includes sales professional fee payable $332,500, sales rebates payable of
$1,591,138, VAT payable of $589,410, and social insurance payable of
$343,046.
11. RESERVES
The reserve funds are comprised of the
following:
|
2008
|
2007
|
|||||||
|
Statutory surplus reserve
fund
|
$
|
2,585,297
|
$
|
1,559,357
|
||||
|
Public welfare
fund
|
282,377
|
282,377
|
||||||
|
$
|
2,867,674
|
$
|
1,841,734
|
|||||
Pursuant to the relevant
laws and regulations of the
PRC, the Company is required to annually transfer 10% of its after tax profit as
reported on financial statements prepared under the accounting principles of the
PRC to a statutory surplus reserve fund until the balance reaches
50% of the registered share
capital. This reserve can be used to make up any losses incurred or
to increase share capital. Except for reducing losses incurred, any
other application may not result in this reserve balance falling below 25% of
the registered capital.
Prior to January 1, 2007, the Company
was required each year to transfer 5% of its after tax profit as reported on
financial statements prepared under the accounting principles of the PRC to the
public welfare funds. This reserve was restricted to capital expenditure for
employees’ collective welfare facilities that are
owned by the Company. The public welfare funds are not available for
distribution to the stockholders (except in liquidation). Once
capital expenditures for staff welfare facilities have been made, an equivalent
amount must be transferred from the public welfare funds to the discretionary
common reserve funds. Due to a change in PRC law, appropriation of
profit to the public welfare funds is no longer required.
12. INCOME TAXES
The Company is subject to state and
local income taxes within the PRC at the applicable tax rate as reported in
their PRC statutory financial statements in accordance with the relevant income
tax laws.
For the year of 2007 and 2008, the
Company was granted a tax
holiday and is entitled to full exemption from corporation income taxes through
December 2008. From 2009 onwards, the Company will also be subject to a special
income tax rate of 15% as it is an eligible wholly foreign owned
company.
Had the company not been granted the tax
holiday or been an eligible wholly foreign owned company, the income tax
provision at the general PRC income rate of 25% starting from January 1, 2008
and 33% previously would have been approximately US$2,572,775 and US$3,167,000 for the years ended
October 31, 2008 and 2007 respectively.
13. COMMON STOCK
During the year ended October 31, 2008,
no common stock was issued. During the year ended October 31, 2007
the company issued a total of 96,500 common stock for financing service with fee of $
284,675.
F-19
14.
WARRANTS
The Company entered into a Director appointment agreement with Mr. Magnus
Moliteus dated April 16, 2007, pursuant to which the Company issued Mr. Magnus
Moliteus 15,000 warrants, which expire on April 16, 2010, to purchase 15,000
shares of Renhuang’s common stock at $3.02 per share. On July 31, 2007, 10,000
warrants were issued to Mr. Magnus Moliteus. The warrants were cancelled
during fiscal 2008.
Transactions
involving warrants are summarized as follows:
|
Number of
Shares
|
Weighted
Average Price
Per Share
|
|||||
|
Outstanding
at October 31, 2006
|
—
|
—
|
||||
|
Granted
|
||||||
|
—
April 16, 2007
|
15,000
|
$
|
3.02
|
|||
|
—
July 31, 2007
|
10,000
|
$
|
2.50
|
|||
|
Exercised
|
—
|
—
|
||||
|
Cancelled
or expired
|
—
|
—
|
||||
|
Outstanding
at October 31, 2007
|
25,000
|
$
|
2.81
|
|||
|
Granted
|
—
|
—
|
||||
|
Exercised
|
—
|
—
|
||||
|
Cancelled
or expired
|
(25,000)
|
—
|
||||
|
Outstanding
at October 31, 2008
|
—
|
—
|
||||
15.
RELATED PARTY TRANSACTIONS
The
Company rented property and plant from Harbin Renhuang Pharmaceutical Stock Co.
Ltd., a Company owned by the Company’s major shareholder. The lease
term is from May 1, 2008 to May 1, 2009, with monthly rental payment of
$49,669.
16.
COMMITMENTS AND CONTINGENCIES
A.
CAPITAL AND LEASE COMMITMENTS
The
Company rented an office from Hei Long Jiang Jiu San You Zhi Co., Ltd. The
lease term is from May 1, 2007 to April 30, 2010, with average monthly rental
payment $9,393.
The
minimum payments for the rental leases as followings:
|
October 31, 2008
|
||||
|
2009
|
$
|
433,649
|
||
|
2010
|
62,996
|
|||
|
2011
|
0
|
|||
|
2012
|
0
|
|||
|
2013
|
0
|
|||
|
Total
|
$
|
496,645
|
||
F-20
B.
LEGAL PROCEEDINGS
The
Company is not currently involved in any litigation. There is no action, suit,
proceeding, inquiry or investigation before or by any court, public board,
government agency, self-regulatory organization or body pending or, to the
knowledge of the executive officers of the Company.
17. EMPLOYEE
WELFARE PLAN
Regulations
in the PRC require the Company to contribute to a defined contribution
retirement plan for all permanent employees. Pursuant to the mandatory
requirement from the local authority in the PRC, the retirement pension
insurance, unemployment insurance, health insurance, injury insurance and
pregnancy insurance are established for the employees during the term of
employment. For the year ended October 31, 2008, the level of contribution to
these funds was determined at 22% of the average employee salary determined by
the Social Welfare Bureau. The Company incurred in the amount of $212,047 as of
October 31, 2008 in other payables.
18.
VULNERABILITY DUE TO CERTAIN CONCENTRATIONS
The
Company faces a number of risks and challenges since its operations are in the
PRC. The Company's operations in the PRC are subject to special considerations
and significant risks not typically associated with companies in North America
and Western Europe. The Company's results may be adversely affected by changes
in the political and social conditions in the PRC, and by changes in
governmental policies with respect to laws and regulations, anti-inflationary
measures, currency conversion and remittance abroad, and rates and methods of
taxation, among other things.
19.
SUBSEQUENT EVENT
On May
15, 2009, there is an agreement between Renhuang and Allied Merit International
Investments, Inc. and Griffin Ventures Ltd (the “Investors”). The Investors
agreed to pay Renhuang $ 1.5 million in exchange for an aggregate of 2,142,856
shares of the Company’s Common Stock and 1,071,428 Warrants with an exercise
price of $0.875. The Company issued 2,142,856 shares on May 20, 2009 and
received the $1.5 million on August 7, 2009.
Among the
Investors, Allied Merit International Investments, Inc. will receive 1,785,714
shares of the Company’s Common Stock and Warrants which can purchase 892,857
shares of Company’s Common Stock; Griffin Ventures Ltd. will receive 357,142
shares of the Company’s Common Stock and Warrants which can purchase 178,571
shares of Company’s Common Stock.
20. RESTATEMENTS
After
reviewing the detailed data in the issued audited consolidated financial
statement and certain accounting principles, Company concluded that the
Company’s previously issued audited consolidated financial statements for the
year ended October 31, 2008, contained the errors related to recalculation
of sales rebate. Consequently, management restated its annual consolidated
financial statements as of October 31, 2008 and for the year then ended. . These
restatements, as detailed below, were made in accordance with the provisions of
SFAS 154 for correction of errors. No prior period financial statements have
been restated because 2008 is the first year impacted by the restatements. There
was no tax effect as a result of the restatements.
The
restatement included the adjustments of total assets, total stockholders’
equity, sales, net income and accounts receivable etc. and other relevant
adjustments, which is recalculation of sales rebate only and no other influence
adversely. The adjustments to the consolidated balance sheet, consolidated
statement of incomes, and consolidated statement of cash flows are summarized as
follows:
F-21
CONSOLIDATED
BALANCE SHEETS
AS
OF OCTOBER 31, 2008
|
Initial
Filing
|
Restatement
|
Restated
|
||||||||||
|
ASSETS
|
||||||||||||
|
CURRENT
ASSETS
|
||||||||||||
|
Cash
and cash equivalents
|
$ | 9,747,693 | $ | $ | 9,747,693 | |||||||
|
Accounts
receivable, net
|
22,588,580 | (1,744,101 | ) | 20,844,479 | ||||||||
|
Inventories
|
2,625,385 | 2,625,385 | ||||||||||
|
Prepayments
|
33,695 | 33,695 | ||||||||||
|
Other
receivables, net
|
133,642 | 133,642 | ||||||||||
|
TOTAL
CURRENT ASSETS
|
35,128,995 | (1,744,101 | ) | 33,384,894 | ||||||||
|
PROPERTY, PLANT AND EQUIPMENT,
NET
|
2,620,949 | 2,620,949 | ||||||||||
|
TOTAL
ASSETS
|
$ | 37,749,944 | $ | (1,744,101 | ) | $ | 36,005,843 | |||||
|
CURRENT
LIABILITIES
|
||||||||||||
|
Accounts
payables
|
$ | 193,934 | $ | $ | 193,934 | |||||||
|
Other
payables
|
1,767,153 | 1,767,153 | ||||||||||
|
TOTAL
LIABILITIES
|
1,961,087 | 1,961,087 | ||||||||||
|
COMMITMENTS
AND CONTINGENCIES
|
||||||||||||
|
STOCKHOLDERS'
EQUITY
|
||||||||||||
|
Preferred
stock - Authorized preferred shares 1,000,000, issued and outstanding
number of shares: nil
|
||||||||||||
|
Common
Stock - Authorized common shares 100,000,000, issued and outstanding
number of shares 35,096,680 (35,096,680 in 2007) at par value of
0.001
|
35,097 | 35,097 | ||||||||||
|
Additional
paid-in capital
|
6,595,400 | 6,595,400 | ||||||||||
|
Reserves
|
3,036,617 | (168,943 | ) | 2,867,674 | ||||||||
|
Retained
earnings
|
22,765,757 | (1,520,486 | ) | 21,245,271 | ||||||||
|
Accumulated
other comprehensive income
|
3,355,986 | (54,672 | ) | 3,301,314 | ||||||||
|
TOTAL
STOCKHOLDERS' EQUITY
|
35,788,857 | (1,744,101 | ) | 34,044,756 | ||||||||
|
TOTAL
LIABILITIES AND STOCKHOLDERS' EQUITY
|
$ | 37,749,944 | $ | (1,744,101 | ) | $ | 36,005,843 | |||||
F-22
CONSOLIDATED
STATEMENTS OF INCOME AND COMPREHENSIVE INCOME
FOR
THE YEARS ENDED OCTOBER 31, 2008
|
Initial
Filing
|
Restatement
|
Restated
|
||||||||||
|
SALES
|
$ | 36,163,919 | $ | (1,689,429 | ) | $ | 34,474,490 | |||||
|
COST
OF SALES
|
(15,980,638 | ) | (15,980,638 | ) | ||||||||
|
GROSS
PROFIT
|
20,183,281 | (1,689,429 | ) | 18,493,852 | ||||||||
|
SELLING
AND DISTRIBUTION EXPENSES
|
(163,355 | ) | (163,355 | ) | ||||||||
|
ADVERTISING
EXPENSE
|
(3,155,063 | ) | (3,155,063 | ) | ||||||||
|
GENERAL
AND ADMINISTRATIVE EXPENSES
|
(2,620,656 | ) | (2,620,656 | ) | ||||||||
|
RESEARCH
AND DEVELOPMENT
|
(2,124,511 | ) | (2,124,511 | ) | ||||||||
|
(PROVISION
FOR DOUBTFUL ACCOUNTS)/RECOVERY
|
(243,282 | ) | (243,282 | ) | ||||||||
|
DEPRECIATION
AND AMORTIZATION
|
(13,578 | ) | (13,578 | ) | ||||||||
|
INCOME
FROM OPERATIONS
|
11,862,836 | (1,689,429 | ) | 10,173,407 | ||||||||
|
OTHER
INCOME
|
117,692 | 117,692 | ||||||||||
|
INCOME
BEFORE INCOME TAXES
|
11,980,528 | (1,689,429 | ) | 10,291,099 | ||||||||
|
INCOME
TAXES
|
— | — | ||||||||||
|
NET
INCOME
|
$ | 11,980,528 | $ | (1,689,429 | ) | $ | 10,291,099 | |||||
|
OTHER
COMPREHENSIVE INCOME
|
||||||||||||
|
FOREIGN
CURRENCY TRANSLATION ADJUSTMENT
|
2,446,528 | (54,672 | ) | 2,391,856 | ||||||||
|
COMPREHENSIVE
INCOME
|
$ | 14,427,056 | $ | (1,744,101 | ) | $ | 12,682,955 | |||||
|
BASIC
EARNINGS PER SHARE
|
$ | 0.34 | $ | 0.29 | ||||||||
|
DILUTED
EARNING PER SHARE
|
$ | 0.34 | $ | 0.29 | ||||||||
|
WEIGHTED
AVERAGE NUMBER OF COMMON SHARES OUTSTANDING –BASIC
|
35,096,681 | 35,096,681 | ||||||||||
|
WEIGHTED
AVERAGE NUMBER OF COMMON SHARES OUTSTANDING –DILUTED
|
35,096,681 | 35,096,681 | ||||||||||
F-23
CONSOLIDATED
STATEMENTS OF CASH FLOWS
FOR
THE YEAR ENDED OCTOBER 31, 2008
|
Initial
Filing
|
Restatement
|
Restated
|
||||||||
|
CASH
FLOWS FROM OPERATING ACTIVITIES:
|
||||||||||
|
Net
income
|
$
|
11,980,528
|
$
|
(1,689,429
|
)
|
$
|
10,291,099
|
|||
|
Adjustments
to reconcile net income to net cash from operating activities
:
|
||||||||||
|
Depreciation
and amortization
|
339,257
|
339,257
|
||||||||
|
Provision
for bad debts/(Recovery)
|
243,282
|
243,282
|
||||||||
|
Fair
value of warrants issued/(cancelled) for services
|
31,699
|
(31,699
|
)
|
|||||||
|
Fair
value of shares issued for services
|
—
|
|||||||||
|
Changes
in operating assets and liabilities:
|
||||||||||
|
Accounts
receivable
|
(13,120,769
|
)
|
(1,689,429
|
)
|
(11,431,340
|
)
|
||||
|
Inventories
|
(1,513,512
|
)
|
(1,513,512
|
)
|
||||||
|
Amount
due from related parties
|
271,198
|
271,198
|
||||||||
|
Other
receivables
|
112,338
|
112,338
|
||||||||
|
Prepayments
|
(22,109
|
)
|
(22,109
|
)
|
||||||
|
Accounts
payable and accruals
|
22,642
|
22,642
|
||||||||
|
Other
Payables
|
490,903
|
490,903
|
||||||||
|
NET
CASH - OPERATING ACTIVITIES
|
(1,227,941
|
)
|
(1,227,941
|
)
|
||||||
|
CASH
FLOWS FROM INVESTING ACTIVITIES:
|
||||||||||
|
Acquisition
of property, plant and equipment
|
(110,760
|
)
|
(110,760
|
)
|
||||||
|
NET
CASH - INVESTING ACTIVITIES
|
(110,760
|
)
|
(110,760
|
)
|
||||||
|
CASH
FLOWS FROM FINANCING ACTIVITIES:
|
—
|
—
|
||||||||
|
NET
CHANGE IN CASH AND CASH EQUIVALENTS
|
(1,338,701
|
)
|
(1,338,701
|
)
|
||||||
|
EFFECT
OF EXCHANGE RATE CHANGES ON CASH AND CASH EQUIVALENTS
|
932,791
|
932,791
|
||||||||
|
Cash
and cash equivalents, beginning of period
|
10,153,603
|
10,153,603
|
||||||||
|
Cash
and cash equivalents, end of period
|
$
|
9,747,693
|
$
|
9,747,693
|
||||||
|
SUPPLEMENTAL
DISCLOSURE OF CASH FLOW INFORMATION
|
||||||||||
|
Interest
paid
|
—
|
—
|
||||||||
|
Income
taxes paid
|
—
|
—
|
||||||||
|
SUPPLEMENTARY
DISCLOSURE OF NON-CASH INVESTING AND FINANCING ACTIVITIES
|
||||||||||
|
Issuance
of common shares for financing services
|
—
|
|||||||||
|
Warrants
granted to a director for services
|
—
|
|||||||||
F-24
ITEM
9 - CHANGES IN AND DISAGREEMENTS WITH ACCOUNTANTS ON ACCOUNTING AND FINANCIAL
DISCLOSURE
There are
no reportable events as required by Item 304(b) of Regulation S-K.
ITEM
9A(T) – CONTROLS AND PROCEDURES
Evaluation
of Disclosure Controls and Procedures
We
conducted an evaluation, with the participation of our Chief Executive Officer
and Principal Accounting Officer, of the effectiveness of the design and
operation of our disclosure controls and procedures, as defined in Rules
13a-15(e) and 15d-15(e) under the Securities Exchange Act of 1934, as amended,
or the Exchange Act, as of October 31, 2008, to ensure that information required
to be disclosed by us in the reports filed or submitted by us under the Exchange
Act is recorded, processed, summarized and reported, within the time periods
specified in the Securities Exchange Commission’s rules and
forms, including to ensure that information required to be disclosed by us
in the reports filed or submitted by us under the Exchange Act is accumulated
and communicated to our management, including our Chief Executive Officer and
Principal Accounting Officer, or persons performing similar functions, as
appropriate to allow timely decisions regarding required disclosure. Based on
that evaluation, our Chief Executive Officer and Principal Accounting Officer
have concluded that as of October 31, 2008, our disclosure controls and
procedures were not effective at the reasonable assurance level due to the
weaknesses described below.
Evaluation
of Internal Control over Financial Reporting
As
required by Exchange Act Rules 13a-15(f) and 15d-15(f), our management has
carried out an evaluation, under the supervision of our Chief Executive Officer
and Principal Accounting Officer, of the effectiveness of the design and
operation of our internal control over financial reporting as of October 31,
2008.
Management
is responsible for establishing and maintaining adequate internal control over
financial reporting. The Company's internal control over financial reporting is
a process that is designed to provide reasonable assurance regarding the
reliability of financial reporting and the preparation of financial statements
for external purposes in accordance with generally accepted accounting
principles, and includes those policies and procedures that:
Pertain
to the maintenance of records that, in reasonable detail, accurately and fairly
reflect the transactions and dispositions of assets of the Company,
Provide
reasonable assurance that transactions are recorded as necessary to permit
preparation of financial statements in accordance with generally accepted
accounting principles, and that receipts and expenditures are being made only in
accordance with authorization of management and the board of directors of the
Company, and
Provide reasonable assurance regarding prevention (or
timely detection) of unauthorized acquisition, use, or disposition of the
Company's assets, which could have a material effect on Company consolidated
financial statements.
Because
of certain inherent limitations, internal control over financial reporting may
not prevent or detect misstatements.
33
A
material weakness is a control deficiency (within the meaning of the Public
Company Accounting Oversight Board (PCAOB) Auditing Standard No. 5), such that a
misstatement of the annual or interim financial statements may not be
prevented or detected. Management has identified the following
material weakness that has caused management to conclude that, as of
October 31, 2008, our internal control over financial reporting was
not effective:
We were unable to meet our requirements
to timely file our Annual
Report on Form 10-K for the year ended October 31, 2008. Management evaluated
the impact of our inability to timely file periodic reports with the Securities
and Exchange Commission on our assessment of our disclosure controls and
procedures and has concluded that the control deficiency
that resulted in the inability to timely make these filings represented an
internal control weakness.
Remediation
of Weaknesses
Management
recognizes the importance of this weakness and is committed to remediation and
will institute a comprehensive remediation plan. The plan will
include, but not be limited to, hiring finance management resources and
personnel with knowledge and experience in U.S. GAAP, and where necessary, the
plan will utilize the services of external consulting professionals in the area
of accounting advisory services. Furthermore, the plan will
re-organize the internal audit function and establish communication channels
between the internal audit function and an audit committee.
Management
intends to allocate resources to insure that reports are filed on a timely basis
in the future.
Changes
in Internal Control over Financial Reporting
There
were no changes in our internal control over financial reporting, as defined in
Rules 13a-15(f) and 15d-15(f) under the Exchange Act, during our most recently
completed fiscal year that have materially affected, or are reasonably likely to
materially affect, our internal control over financial reporting.
This
annual report does not include an attestation report of the company’s registered
public accounting firm regarding internal control over financial
reporting. Management’s report was not subject to attestation by the
company’s registered public accounting firm pursuant to temporary rules of the
Securities and Exchange Commission that permit the company to provide only
management’s report in this annual report.
ITEM
9B – OTHER INFORMATION
There
have been no events that are required to be reported under this
Item.
PART
III
ITEM
10 – DIRECTORS, EXECUTIVE OFFICERS AND CORPORATE GOVERNANCE
Directors
and Executive Officers
34
The
following table sets forth the names and ages of our current directors and
executive officers, the principal offices and positions held by each person, and
the date such person became a director or executive officer. Our executive
officers are elected annually by the Board of Directors. The directors serve one
year terms until their successors are elected. The executive officers serve
terms of one year or until their death, resignation or removal by the Board of
Directors. Unless described below, there are no family relationships among any
of the directors and officers.
|
Name
|
Age
|
Position(s)
|
||
|
Shaoming
Li
|
46
|
Chairman
of the Board of Directors,
President
and Chief Executive Officer
|
||
|
Zuoliang
Wang
|
37
|
Interim
Chief Financial Officer
|
||
|
Jiang
He
|
37
|
Secretary
|
Mr. Shaoming Li has served as
the Chairman of the Board of Directors since founding Harbin Renhuang
Pharmaceutical Co. Ltd in 1996. Mr. Li has more than 20 years experience from
the pharmaceutical and finance industry. From 1984 to 1996, Mr. Li served as
Vice Chairman of Shenzhen Health Pharmaceutical Co. Ltd, a company
dedicated to drug research, production, and sales. Mr. Li is a professor at
Harbin Business University and Northeastern Agriculture University. Mr. Li also
served as Vice Chairman of Heilongjiang Provincial Chinese Traditional Medicine
Association and Heilongjiang Provincial Medicine Association. Mr. Li Shaoming
graduated from Central University of Finance and Economics in Beijing, China
with a bachelor degree in finance.
Mr. Zuoliang Wang was hired as
our interim Chief Financial Officer effective on January 25, 2007. Mr. Wang has
served as Chief Accounting Officer of Harbin Renhuang Pharmaceutical Co. Ltd.,
our wholly-owned subsidiary, since 2005. Mr. Wang has more than 10 years
experience in accounting and is familiar with our financial condition and the
internal preparation of our financial statements. From 2004 to 2005, Mr. Wang
served as the Chief Financial Officer of Harbin Huijiabei Food Co. Ltd. From
2001 to 2004, Mr. Wang served as the manager of the accounting department of
China Resource Breweries Limited, Harbin Office. Mr. Wang Zuoliang
graduated from Qiqihaer Mechanic Institute in 1994 with a bachelor degree in
engineering management.
Mr. Jiang He was hired as our
as special assistant to the President in 2004. In this role he is in charge of
asset management, risk and crisis management, and internal audit. From 2001 to
2004, prior to joining our company, he was the vice general manager of
Heilongjiang Tiansheng High Tech Co. Ltd. In this position Mr. Jiang was
primarily responsible for managing projects, such as, but not limited to, Clean
Coal Projects. Mr. Jiang is currently studying for his MBA from Harbin Business
School, and is projected to get his MBA degree in 2007. He received his Masters
degree in Industrial Economics in July, 2004, and his Bachelor degree in
Management from Jilin University in 1992.
To our
knowledge, none of the directors presently serve as directors of public
corporations other than Renhuang Pharmaceuticals, Inc.
Board
Meetings and Committees
During
the fiscal year ended October 31, 2008, we did not hold any formal meeting of
the Board of Directors, for with the exception of Mr. Shaoming Li, the other
members of the Board all resigned during 2008.
35
On April
1, 2006, Mr. Shaoming Li and Mr. Zuoliang Wang of our Board of Directors formed
an Audit Committee. Mr. Wang is no longer on the Board of Directors or Audit
Committee. Mr. Andy Wu was appointed to our Board of Directors and as the
Chairman of the Audit Committee effective January 25, 2007. Mr. Any Wu
resigned in December of 2008. Mr. Shaoming Li is now the sole director and
member of Audit Committee. In accordance with a written charter adopted by the
Company’s Board of Directors, the Audit Committee assists the Board of Directors
in fulfilling its responsibility for oversight of the quality and integrity of
the Company’s financial reporting process, including the system of internal
controls.
Code
of Ethics
We have
not adopted a written code of ethics.
Compensation
Committee
On April
1, 2006, Mr. Shaoming Li and Mr. Zuoliang Wang of our Board of Directors formed
a Compensation Committee.
ITEM
11 - EXECUTIVE COMPENSATION
Executive
Officers and Directors
We do not
have written employment agreements with officers or directors. Our Chairman,
President and CEO, Mr. Shaoming Li receives US $31,250 in annual salary and is
reimbursed for out of pocket expenses. Our interim Chief Financial Officer, Mr.
Wang Zuoliang, and our Secretary, Mr. Jiang He, each receive US $4,500 in annual
salary and are reimbursed for out of pocket expenses.
The
Summary Compensation Table shows certain compensation information for services
rendered in all capacities for the fiscal years ended October 31, 2008 and 2007.
Other than as set forth herein, no executive officer’s salary and bonus exceeded
$100,000 in any of the applicable years. The following information includes the
dollar value of base salaries, bonus awards, the number of stock options granted
and certain other compensation, if any, whether paid or deferred.
|
Name
and
Principal
Position
|
Year
|
Salary
($)
|
Bonus
($)
|
Stock
Awards
($)
|
Option
Awards
($)
|
Nonequity
incentive plan
compensation
($)
|
Nonqualified
deferred
compensation
earnings
($)
|
All other
compensation
($)
|
Total
($)
|
|||||||||||||
|
Shaoming
Li
|
2008
|
31,250
|
-0-
|
-0-
|
-0-
|
-0-
|
-0-
|
-0-
|
31,250
|
|||||||||||||
|
President,
|
2007
|
31,250
|
31,250
|
|||||||||||||||||||
|
Chief
Executive Officer, and Director
|
2006
|
-0-
|
-0-
|
-0-
|
-0-
|
-0-
|
-0-
|
|||||||||||||||
|
Zouliang
Wang
|
2008
|
4,500
|
-0-
|
-0-
|
-0-
|
-0-
|
-0-
|
-0-
|
4,500
|
|||||||||||||
|
Interim
|
2007
|
4,500
|
4,500
|
|||||||||||||||||||
|
Chief
Financial Officer
|
||||||||||||||||||||||
|
Jiang
He
|
2008
|
4,500
|
-0-
|
-0-
|
-0-
|
-0-
|
-0-
|
-0-
|
4,500
|
|||||||||||||
|
Secretary
|
2007
|
4,500
|
4,500
|
|||||||||||||||||||
36
Outstanding Equity Awards at
Fiscal Year-End
The
following table sets forth certain information concerning outstanding stock
awards held by the Named Executive Officers as of October 31, 2008:
|
Option Awards
|
Stock Awards
|
|
|||||||||||||||||||||
|
Name
|
Number of
Securities
Underlying
Unexercised
Options
(#)
Exercisable
|
Number of
Securities
Underlying
Unexercised
Options
(#)
Unexercisable
|
Equity
Incentive
Plan
Awards:
Number of
Securities
Underlying
Unexercised
Unearned
Options
(#)
|
Option
Exercise
Price
($)
|
Option
Expiration
Date
|
Number
of Shares
or Units of
Stock
That Have
Not
Vested
(#)
|
Market
Value
of
Shares
or Units
of Stock That
Have
Not
Vested
($)
|
Equity
Incentive
Plan
Awards:
Number of
Unearned
Shares,
Units or
Other
Rights
That Have
Not
Vested
(#)
|
Equity
Incentive
Plan
Awards:
Market
or Payout
Value of
Unearned
Shares,
Units or
Other
Rights
That
Have Not
Vested
($)
|
|
|||||||||||||
|
Shaoming
Li
|
-0-
|
-0-
|
-0-
|
N/A
|
N/A
|
-0-
|
-0-
|
-0-
|
-0-
|
||||||||||||||
|
Zouliang
Wang
|
-0-
|
-0-
|
-0-
|
N/A
|
N/A
|
-0-
|
-0-
|
-0-
|
-0-
|
||||||||||||||
|
Jiang
He
|
-0-
|
-0-
|
-0-
|
N/A
|
N/A
|
-0-
|
-0-
|
-0-
|
-0-
|
||||||||||||||
|
Magnus
Moliteus
|
25,000
|
-0-
|
-0-
|
(1)
|
(1)
|
-0-
|
-0-
|
-0-
|
-0-
|
||||||||||||||
(1)
We entered into a Director Appointment agreement with Mr. Magnus Moliteus
who resigned in May 2008, dated April 16, 2007, pursuant to which we issued Mr.
Magnus Moliteus 15,000 warrants, which terminates on April 16, 2010, to purchase
15,000 shares of our common stock at $3.02 per share. Pursuant to this same
agreement, on July 31, 2007, 10,000 warrants were issued to Mr. Magnus Moliteus
at the exercise price of $2.50 per share. We valued the warrants using the
Black-Scholes calculation model, and the warrants were deemed to have a value of
$22,442 and $9,257 respectively. See Note 14 to the attached financial
statements.
2003
Omnibus Securities Plan
On
February 28, 2003, our Board of Directors approved the Renhuang Pharmaceuticals,
Inc. 2003 Omnibus Securities Plan, which was approved by our shareholders on
April 11, 2003. The Plan offers selected employees, directors, and consultants
an opportunity to acquire our common stock, and serves to encourage such persons
to remain employed by us and to attract new employees. The plan allowed for the
award of stock and options, up to 25,000 shares (after giving effect to the
1-for-20 reverse stock split effective April 21, 2003, and the 1-for-30 reverse
stock split in 2006) of our common stock. On May 1 of each year, the number
of shares in the 2003 Securities Plan should automatically be adjusted to an
amount equal to ten percent (10%) of our outstanding stock on April 30 of the
immediately preceding year. As of October 31, 2008, there are no options or
other financial instruments outstanding under the 2003 Omnibus Securities
Plan.
37
Board
Compensation
There are
currently no agreement with Mr. Shaoming Li, the sole director, or director
nominees for compensation. Mr. Li is entitled to reimbursement for his travel
expenses. We do not pay additional amounts for committee participation or
special assignments of the Board of Directors.
The
following table sets forth director compensation as of October 31,
2008:
|
Name
|
|
Fees
Earned
or Paid
in
Cash
($)
|
|
Stock
Awards
($) *
|
|
Option
Awards
($) *
|
|
Non-Equity
Incentive Plan
Compensation
($)
|
|
Nonqualified
Deferred
Compensation
Earnings
($)
|
|
All Other
Compensation
($)
|
|
Total
($)
|
|
||||
|
Shaoming
Li
|
-0-
|
-0-
|
-0-
|
-0-
|
-0-
|
-0-
|
-0-
|
||||||||||||
|
Fanrong
Meng
|
-0-
|
-0-
|
-0-
|
-0-
|
-0-
|
-0-
|
-0-
|
||||||||||||
|
Andy
Wu
|
-0-
|
-0-
|
-0-
|
(1)
|
-0-
|
-0-
|
-0-
|
-0-
|
|||||||||||
|
Magnus
Moliteus
|
-0-
|
-0-
|
31,699
|
(2)
|
-0-
|
-0-
|
-0-
|
31,699
|
|||||||||||
|
*
|
Based upon the aggregate grant date
fair value calculated in accordance with the Financial Accounting
Standards Board (“FASB”) Statement of Financial
Accounting Standard (“FAS”) No. 123R, Share Based
Payment.
|
(1)
We entered into a Director appointment agreement with Mr. Andy Wu dated
February 15, 2007, pursuant to which we are obligated to issue Mr. Wu warrants,
exercisable for three (3) years, to purchase 5,000 shares of our common stock at
$3.02 per share; and warrants each July 31, beginning in 2007, exercisable for
three (3) years, to purchase 5,000 shares of our common stock at the then fair
market value of our common stock. All warrants are to be issued pursuant to the
terms of form warrant agreement, with the remaining terms to be agreed to by the
parties. As of October 31, 2008, we had not agreed to a warrant agreement or
issued the warrants to Mr. Wu, and, therefore, we did not include them as
compensation in the above director’s compensation table. Mr. Wu resigned
from the Board of Directors on December 22, 2008.
(2)
We entered into a Director appointment agreement with Mr. Magnus Moliteus
dated April 16, 2007, pursuant to which we issued Mr. Magnus Moliteus 15,000
warrants, which terminates on April 16, 2010, to purchase 15,000 shares of our
common stock at $3.02 per share. Pursuant to this same agreement, on July 31,
2007, 10,000 warrants were issued to Mr. Magnus Moliteus. We valued the warrants
using the Black-Scholes calculation model, and the warrants were deemed to have
a value of $22,442 and $9,257 respectively. See Note 16 to the attached
financial statements.
38
ITEM
12 - SECURITY OWNERSHIP OF CERTAIN BENEFICIAL OWNERS AND MANAGEMENT AND RELATED
STOCKHOLDER MATTERS
The
following table sets forth, as of June 10, 2009, certain information with
respect to the Company’s equity securities owned of record or beneficially by
(i) each Officer and Director of the Company; (ii) each person who owns
beneficially more than 5% of each class of the Company’s outstanding equity
securities; and (iii) all Directors and Executive Officers as a
group.
|
|
|
|
|
|
|
Common Stock
|
|
|||
|
Title of Class
|
Name and Address
of Beneficial Owner
|
|
Amount and
Nature of
Beneficial Ownership
|
|
|
Percent
of Class (1)
|
|
|||
|
Common Stock
|
Shaoming
Li (2)(3)
|
17,850,000
|
(4) |
47.93
|
%(4)
|
|||||
|
Common
Stock
|
Jiang
He (2)
|
0
|
0
|
%
|
||||||
|
Common
Stock
|
Zuoliang
Wang (2)
|
0
|
0
|
%
|
||||||
|
Common
Stock
|
Dianjun
Pi - Total Prosperity Company Ltd.(5)
|
3,159,450
|
8.48
|
%
|
||||||
|
Common
Stock
|
Tuya
Wulan - New BVI Co.(6)
|
2,975,000
|
7.99
|
%
|
||||||
|
Common
Stock
|
Yun
Man Cheung.- China Wealth Source Co.(7)
|
4,278,000
|
11.49
|
%
|
||||||
|
Common
Stock
|
All Directors and Officers
As
a Group (3 persons)
|
17,850,000
|
(4) |
47.93
|
%(4)
|
|||||
|
(1)
|
Unless otherwise indicated, based
on 37,239,537 shares of common stock issued and outstanding. Shares of
common stock subject to options or warrants currently exercisable, or
exercisable within 60 days, are deemed outstanding for purposes of
computing the percentage of the person holding
such options or warrants, but are not deemed outstanding for the purposes
of computing the percentage of any other
person.
|
|
(2)
|
Indicates one of our officers or
directors.
|
|
(3)
|
Unless indicated otherwise, the
address of the shareholder is No. 281, Taiping Road, Taiping District,
Harbin, Heilongjiang Province, 150050, P.R.
China.
|
|
(4)
|
Includes 17,850,000 shares of
Common Stock owned by Celebrate Fortune Company Limited, an
entity controlled by
Mr. Shaoming Li.
|
|
(5)
|
Includes 3,159,450 shares of
Common Stock owned by Total Prosperity Ltd., an entity controlled by Mr.
Dianjun Pi.
|
|
(6)
|
Includes 2,975,000 shares of
Common Stock owned by New BVI Co., an entity controlled by Mr. Tuya
Wulan.
|
|
(7)
|
Includes 4,278,000 shares of
Common Stock owned by China Wealth Source Company Ltd., an entity
controlled by Mr. Yun Man
Cheung.
|
39
ITEM
13 - CERTAIN RELATIONSHIPS AND RELATED TRANSACTIONS, AND DIRECTOR
INDEPENDENCE
The
Company had the following significant related party transactions during the year
2008:
|
n
|
The Company rented property and
plant from its affiliate Harbin Renhuang Pharmaceutical Stock Co. Ltd. The
lease term is from May 1, 2008 to May 1, 2009, with monthly rental
payment of $49,669 and accordingly, the total rent for fiscal year ended
October 31, 2008 is $298,014. Mr. Shaoming Li is a majority shareholder of
Harbin Renhuang Pharmaceutical Stock Co.
Ltd.
|
ITEM
14 – PRINCIPAL ACCOUNTING FEES AND SERVICES
Audit
Fees
During
the year ended October 31, 2008 and 2007, MSPC Certified Public Accountants and
Advisors, a Professional Corporation (“MSPC”) and Schwartz Levitsky Feldman
LLP billed us $ 200,000 and $178,000, respectively, in fees for professional
services for the audit of our financial statements and review of financial
statements included in our Forms 10-K and 10-Q’s, as applicable.
Audit
- Related Fees
During
the year ended October 31, 2008 and 2007, there were no amounts billed related
to any assurance and related services related to the performance of the audit or
review of our financial statements by either MSPC or Schwartz Levitsky Feldman
LLP.
Tax
Fees
During
the year ended October 31, 2008 and 2007, there were no amounts billed us by
either MSPC or Schwartz Levitsky Feldman LLP for professional
services for tax preparation.
All
Other Fees
During
the year ended October 31, 2008 and 2007, MSPC and Schwartz Levitsky Feldman LLP
did not bill us for any other fees.
Of the
fees described above for the year ended October 31, 2008 and 2007, 100% were
approved by either the entire Board of Directors or the Audit Committee. The
Audit Committee’s pre-approval policies and procedures were detailed as to the
particular service and the audit committee was informed of each service and such
policies and procedures did not include the delegation of the audit committee’s
responsibilities.
40
PART
IV
ITEM
15 - EXHIBITS
Exhibit
Index
|
3.1
(1)
|
Restated
Articles of Incorporation, as filed with the Nevada Secretary of State on
April 21, 2003.
|
|
|
3.2
(5)
|
Amendment
to Articles of Incorporation, as filed with the Nevada Secretary of State
on July 28, 2006.
|
|
|
3.3
(1)
|
Second
Restated Bylaws
|
|
|
10.1
(2)
|
Common
Stock Purchase Agreement dated September 19, 2005.
|
|
|
10.2
(2)
|
Securities
Purchase Agreement dated September 16, 2005.
|
|
|
10.3
(3)
|
Reorganization,
Stock and Asset Purchase Agreement dated September 30,
2005.
|
|
|
10.4
(3)
|
Stock
Purchase Agreement dated September 30, 2005.
|
|
|
10.5
(4)
|
Securities
Purchase Agreement dated September 16, 2005.
|
|
|
10.6
(6)
|
Loan
Agreement with Heilongjiang Yuejintiande Building and Installation Project
Co., Ltd.
|
|
|
10.7
(7)
|
Director
Appointment Letter Agreement with Mr. Andy Wu dated February 15,
2007
|
|
|
10.8
(7)
|
Director
Appointment Letter Agreement with Mr. Magnus Moliteus dated April 16,
2007
|
|
|
21.1
(6)
|
Subsidiaries
of the Registrant
|
|
|
23.1
|
Consent
of Schwartz Levitsky Feldman Llp dated December 7, 2009
|
|
|
31.1
|
Rule
13a-14(a)/15d-14(a) Certification of Chief Executive
Officer
|
|
|
31.2
|
Rule
13a-14(a)/15d-14(a) Certification of Chief Financial
Officer
|
|
|
32.1
|
Chief
Executive Officer Certification Pursuant to 18 USC, Section 1350, as
Adopted Pursuant to Section 906 of the Sarbanes-Oxley Act of
2002.
|
|
|
32.2
|
Chief
Financial Officer Certification Pursuant to 18 USC, Section 1350, as
Adopted Pursuant to Section 906 of the Sarbanes-Oxley Act of
2002.
|
|
(1)
|
Incorporated by reference to our
Current Report on Form 8-K dated April 21, 2003, filed with the
Commission on April
22, 2003.
|
|
(2)
|
Incorporated by reference from
our Current Report on Form 8-K filed with the Commission on September 23,
2005.
|
|
(3)
|
Incorporated by reference from
our Current Report on Form 8-K filed with the Commission on October 3,
2005.
|
|
(4)
|
Incorporated by reference from
our Current Report on Form 8-K filed with the Commission on October 14,
2005.
|
|
(5)
|
Incorporated by reference from our Annual Report on
Form 10-K filed with the Commission February 13,
2007.
|
41
|
(6)
|
Incorporated by reference from
our First Amended
Transition Report on Form 10-K/A filed with the Commission on February 22,
2007.
|
|
(7)
|
Incorporated by reference from
our Annual Report on Form 10-K filed with the Commission on May 29,
2008.
|
SIGNATURES
In
accordance with Section 13 or 15(d) of the Exchange Act, the registrant caused
this report to be signed on its behalf by the undersigned, thereunto duly
authorized.
|
Renhuang
Pharmaceuticals, Inc.
|
||
|
Dated:
December 8, 2009
|
/s/
Shaoming Li
|
|
|
By:
|
Shaoming
Li
|
|
|
Chairman,
President and
|
||
|
Chief
Executive Officer
|
||
|
Dated:
December 8, 2009
|
/s/
Zuoliang Wang
|
|
|
By:
|
Zuoliang
Wang
|
|
|
Interim
Chief Financial
Officer
|
||
In
accordance with the Exchange Act, this report has been signed below by the
following persons on behalf of the registrant and in the capacities and on the
dates indicated.
|
Dated: December
8, 2009
|
/s/
Shaoming Li
|
|
|
By:
|
Shaoming
Li, Director
|
42