Attached files
| file | filename |
|---|---|
| 8-K - FORM 8-K - MOSAIC CO | d8k.htm |
 Joseph Fung Senior Market Analyst Tampa, FL December 8, 2009 Exhibit 99.1 Global Fertilizer Outlook and Trends: 2010 and Beyond The Beginning of the Demand Recovery Fluid Fertilizer Marketing and Technology Workshop |
 1 Fluid Fertilizer Technology Workshop December 8, 2009 Safe Harbor Statement This presentation contains forward-looking statements within the meaning of the
Private Securities Litigation Reform Act of 1995. Such statements
include, but are not limited to, statements about future financial and operating results. Such statements are based upon the current
beliefs and expectations of The Mosaic Company’s management and are
subject to significant risks and uncertainties. These risks and uncertainties include but are not limited to the predictability and volatility of, and customer expectations about, agriculture, fertilizer, raw material, energy and
transportation markets that are subject to competitive and other
pressures and the effects of the current economic and financial turmoil; the
build-up of inventories in the distribution channels for crop nutrients; changes in foreign currency and exchange rates; international trade risks; changes in government
policy; changes in environmental and other governmental regulation,
including greenhouse gas regulation; difficulties or delays in receiving, or
increased costs of, necessary governmental permits or approvals; the
effectiveness of our processes for managing our strategic priorities; adverse weather conditions affecting operations in Central Florida or the Gulf Coast of the United
States, including potential hurricanes or excess rainfall; actual costs of
asset retirement, environmental remediation, reclamation or other
environmental regulation differing from management’s current estimates; accidents and other disruptions involving Mosaic’s operations, including brine
inflows at its Esterhazy, Saskatchewan potash mine and other potential
mine fires, floods, explosions, seismic events or releases of hazardous or
volatile chemicals, as well as other risks and uncertainties reported from
time to time in The Mosaic Company’s reports filed with the Securities and Exchange Commission. Actual results may differ from those set forth in the
forward-looking statements. |
 2 Fluid Fertilizer Technology Workshop December 8, 2009 Improving crop nutrient demand drivers and outlook Upturn in the global economic outlook Constructive agricultural fundamentals Tighter phosphate fundamentals begins to take hold Low stocks from producer warehouses to farm field Demand recovery underway Potash shipments remain slow Waiting for a China settlement and price discovery Strong demand recovery expected in 2010 Demand recovery at what price? Unpredictable factors to watch Agricultural commodity prices and farm economics Macroeconomic conditions Government policies Topics |
 3 Fluid Fertilizer Technology Workshop December 8, 2009 Unprecedented drop in global crop nutrient use (particularly P&K) World Nutrient Use 110 120 130 140 150 160 170 95/96 97/98 99/00 01/02 03/04 05/06 07/08 09/10F Source: IFA November 2009 Mil Tonnes 2007/08 2008/09E 2009/10F 2010/11F Nitrogen 3.2% -1.5% 1.6% 2.6% Phosphate 0.1% -10.5% 3.0% 6.2% Potash 6.8% -19.8% -4.5% 13.5% Total 3.1% -6.7% 1.0% 4.9% Source: IFA November 2009 Changes in World Fertilizer Consumption |
 4 Fluid Fertilizer Technology Workshop December 8, 2009 More upbeat global economic outlook World GDP Growth -3.0% -2.0% -1.0% 0.0% 1.0% 2.0% 3.0% 4.0% 5.0% 6.0% 7.0% 70 75 80 85 90 95 00 05 10F GDP Growth 1990-2008 CAGR = 2.9% 2004- 07 CAGR = 3.9% |
 5 Fluid Fertilizer Technology Workshop December 8, 2009 Another large crop is needed in 2010 World Grain and Oilseed Stocks 250 300 350 400 450 500 550 600 650 99/00 00/01 01/02 02/03 03/04 04/05 05/06 06/07 07/08 08/09 09/10 10/11 L 10/11 M 10/11 H Mil Tonnes 40 50 60 70 80 90 100 110 120 Days of Use Stocks Days of Use Source: USDA and Mosaic (for 10/11 scenarios) |
 6 Fluid Fertilizer Technology Workshop December 8, 2009 Yields are key World Grain and Oilseed Harvested Area and Yield 780 800 820 840 860 880 900 920 99/00 00/01 01/02 02/03 03/04 04/05 05/06 06/07 07/08 08/09 09/10 10/11 L 10/11 M 10/11 H Mil Ha 2.4 2.5 2.6 2.7 2.8 2.9 3.0 3.1 MT Ha Harvested Area Yield Trend Source: USDA and Mosaic (for 10/11 scenarios) |
 7 Fluid Fertilizer Technology Workshop December 8, 2009 Grain and oilseed use marches upward World Grain and Oilseed Production and Use 2.0 2.1 2.2 2.3 2.4 2.5 2.6 2.7 2.8 99/00 00/01 01/02 02/03 03/04 04/05 05/06 06/07 07/08 08/09 09/10 10/11 L 10/11 M 10/11 H Bil Tonnes Production Use Source: USDA and Mosaic (for 10/11 scenarios) |
 8 Fluid Fertilizer Technology Workshop December 8, 2009 Futures markets trading this view New Crop Corn Prices Daily Close of New Crop Options June 2, 2009 to December 4, 2009 3.50 3.75 4.00 4.25 4.50 4.75 5.00 Jun Jul Aug Sep Oct Nov Dec $ BU Dec 2010 Dec 2011 Dec 2012 Source: CBOT New Crop Soybean Prices Daily Close of New Crop Options June 2, 2009 to December 4, 2009 8.00 8.50 9.00 9.50 10.00 10.50 11.00 Jun Jul Aug Sep Oct Nov Dec $ BU Nov 2010 Nov 2011 Nov 2012 Source: CBOT |
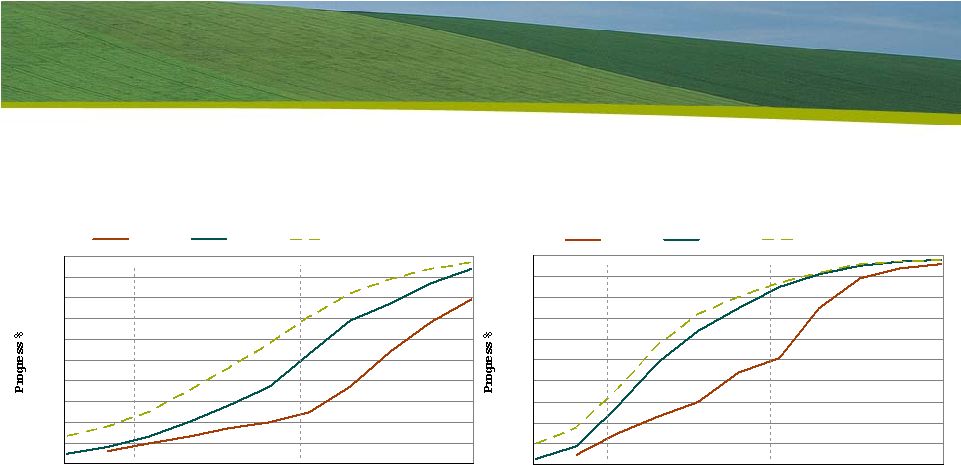 9 Fluid Fertilizer Technology Workshop December 8, 2009 Harvest progress has been significantly behind normal U.S. Corn Harvest Progress 0 10 20 30 40 50 60 70 80 90 100 20 27 04 11 18 25 01 08 15 22 29 Report Week Ending (Sunday) 2009 2008 Ave. 2004-08 Sep Oct Nov U.S. Soybean Harvest Progress 0 10 20 30 40 50 60 70 80 90 100 20 27 04 11 18 25 01 08 15 22 29 Report Week Ending (Sunday) 2009 2008 Ave. 2004-08 Sep Oct Nov Source: USDA |
 10 Fluid Fertilizer Technology Workshop December 8, 2009 Improving crop nutrient demand drivers and outlook Upturn in the global economic outlook Constructive agricultural fundamentals Tighter phosphate fundamentals begins to take hold Low stocks from producer warehouses to farm field Demand recovery underway Potash shipments remain slow Waiting for a China settlement and price discovery Strong demand recovery expected in 2010 Demand recovery at what price? Unpredictable factors to watch Agricultural commodity prices and farm economics Macroeconomic conditions Government policies Topics |
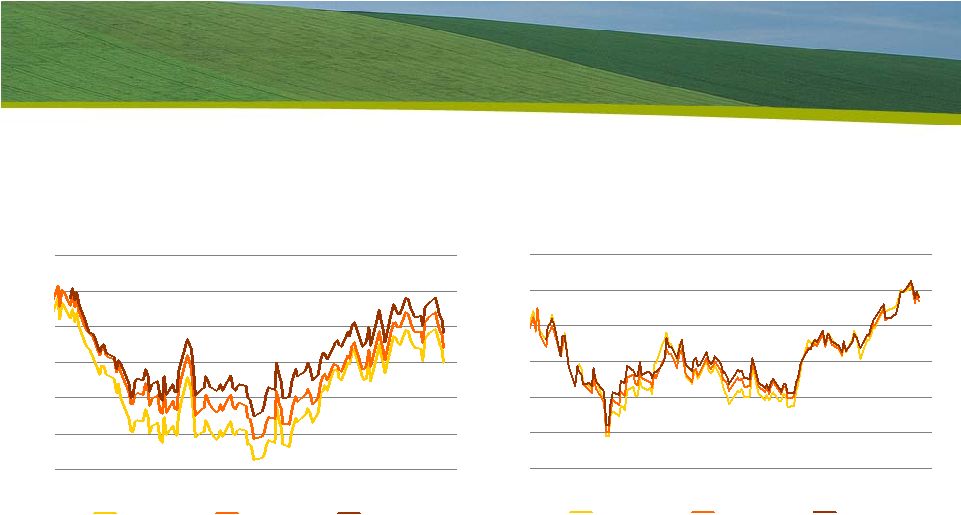
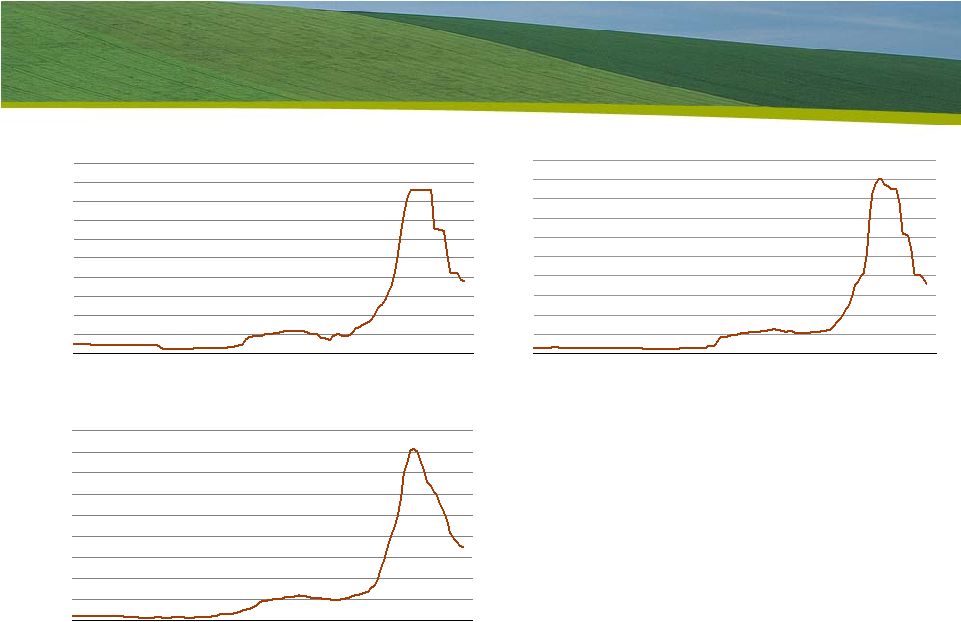
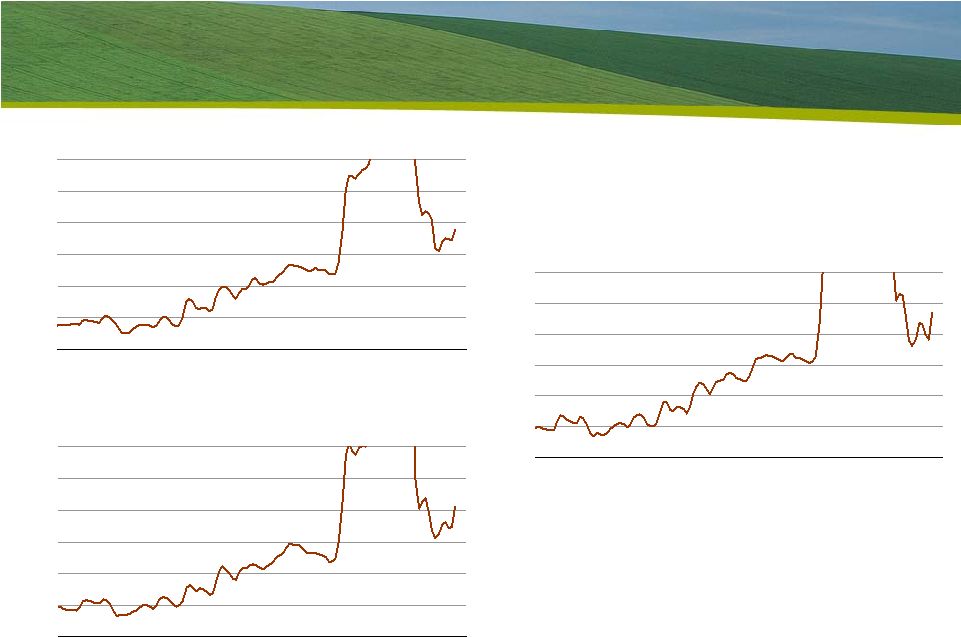 11 Fluid Fertilizer Technology Workshop December 8, 2009 Tighter phosphate fundamentals begin to take hold DAP Prices Central Florida Rail 100 150 200 250 300 350 400 00 01 02 03 04 05 06 07 08 09 10 $ ST Source: Green Markets DAP Prices NOLA Barge 100 150 200 250 300 350 400 00 01 02 03 04 05 06 07 08 09 10 $ ST Source: Green Markets DAP Prices fob Tampa Vessel 100 150 200 250 300 350 400 00 01 02 03 04 05 06 07 08 09 10 $ MT Source: Fertecon |
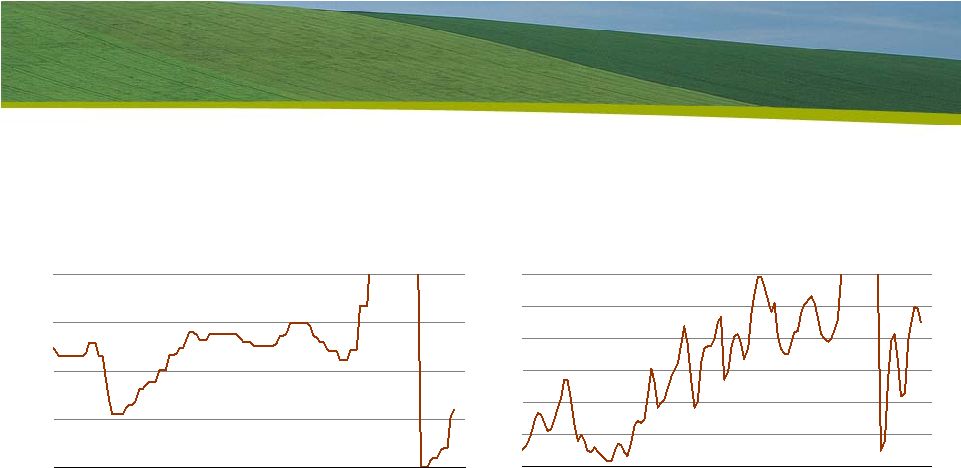 12 Fluid Fertilizer Technology Workshop December 8, 2009 Raw material costs are edging up Sulphur Prices c&f Tampa 0 25 50 75 100 00 01 02 03 04 05 06 07 08 09 10 $ LT Source: Green Markets Ammonia Prices c&f Tampa 100 150 200 250 300 350 400 00 01 02 03 04 05 06 07 08 09 10 $ MT Source: Fertecon |
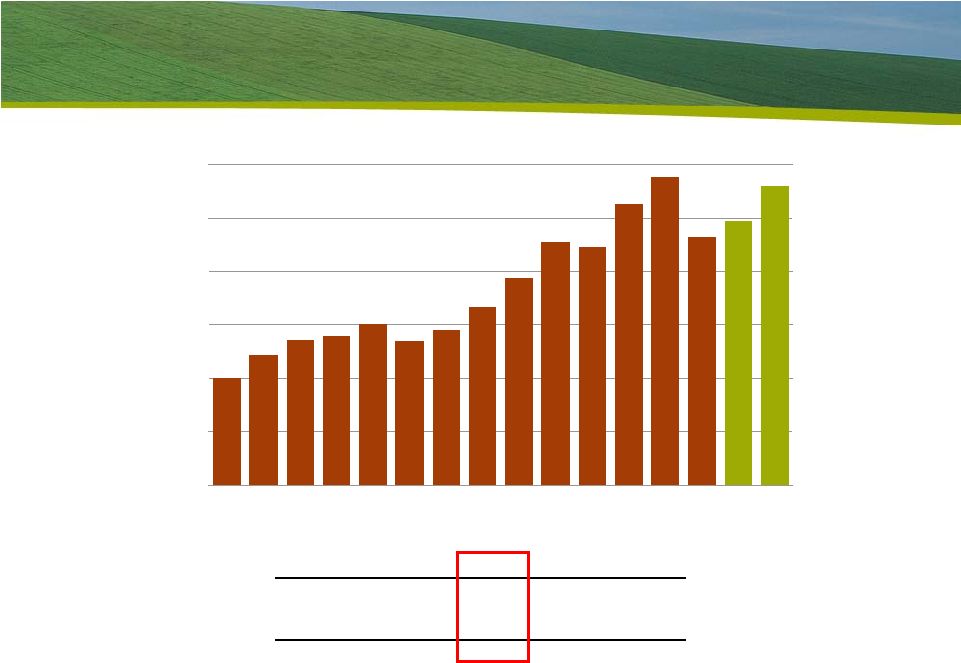
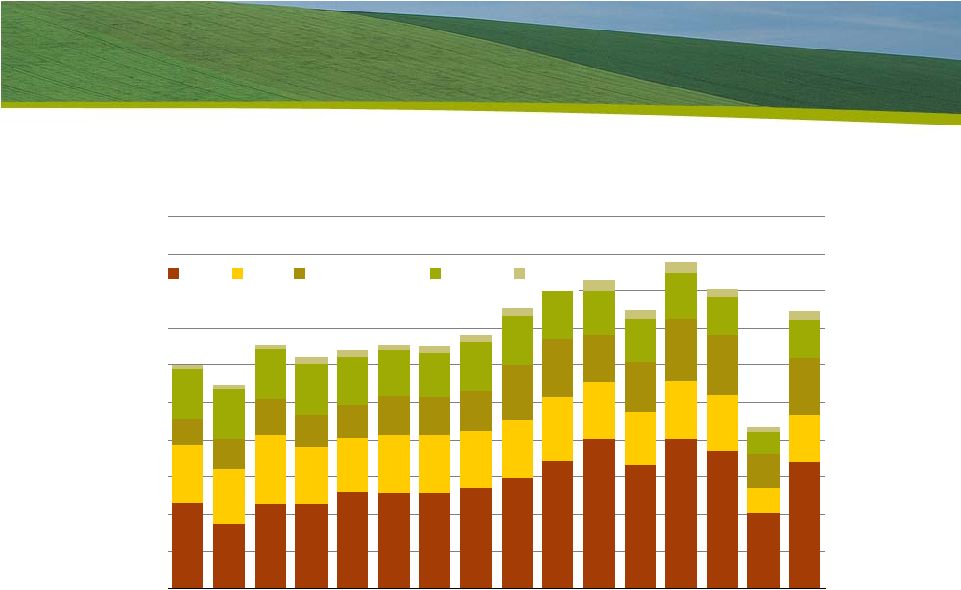
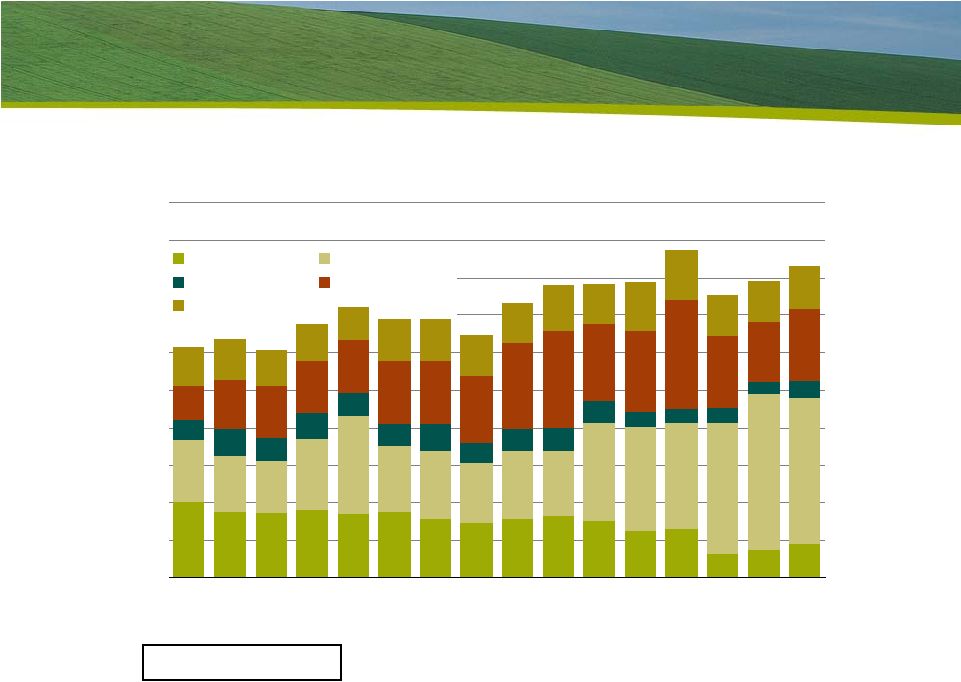 13 Fluid Fertilizer Technology Workshop December 8, 2009 Global import demand projected to increase in 2010 Processed phosphate includes DAP, MAP and TSP World Processed Phosphate Import Demand (Excludes China) 0 3 5 8 10 13 15 18 20 23 25 95 96 97 98 99 00 01 02 03 04 05 06 07 08E 09F 10F Mil Tonnes W Europe Asia Less China Oceania L America Other Source: Fertecon, IFA and Mosaic |
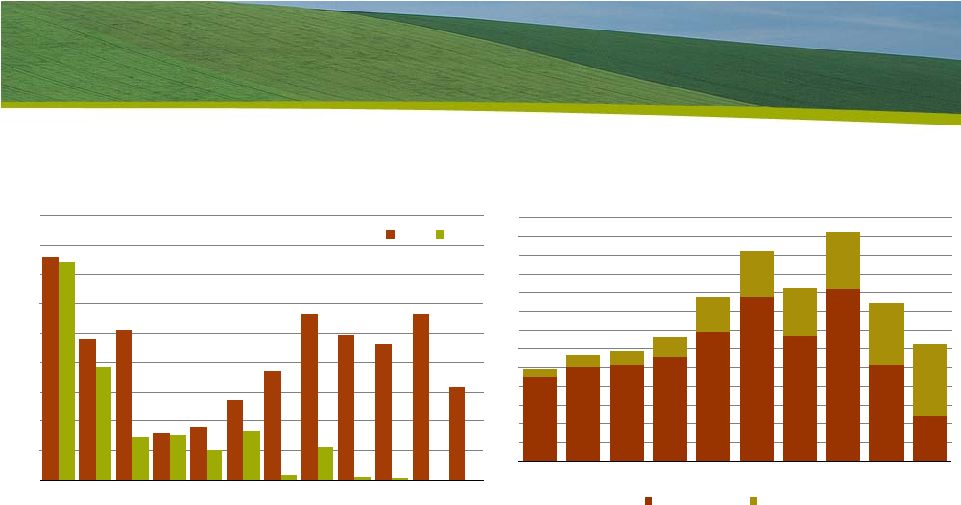
 14 Fluid Fertilizer Technology Workshop December 8, 2009 India: Record import demand India Processed Phosphate Import Demand 0.0 1.0 2.0 3.0 4.0 5.0 6.0 7.0 8.0 95 96 97 98 99 00 01 02 03 04 05 06 07 08E 09F 10F Mil Tonnes DAP MAP Source: Fertecon, IFA and Mosaic |
 15 Fluid Fertilizer Technology Workshop December 8, 2009 Latin America: Imports expected to rebound slightly Latin America Processed Phosphate Import Demand 0.0 1.0 2.0 3.0 4.0 5.0 6.0 7.0 8.0 95 96 97 98 99 00 01 02 03 04 05 06 07 08E 09F 10F Mil Tonnes DAP MAP TSP Source: Fertecon, IFA and Mosaic |
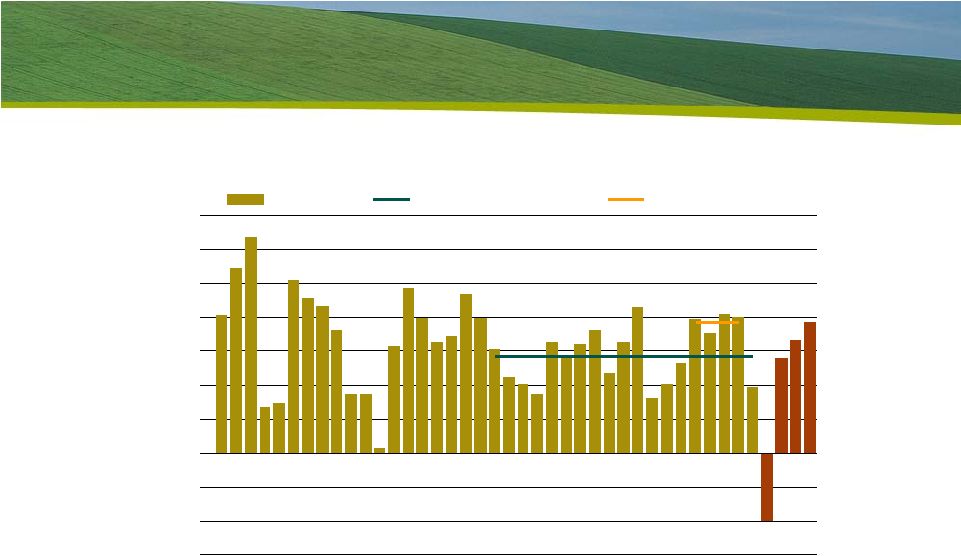
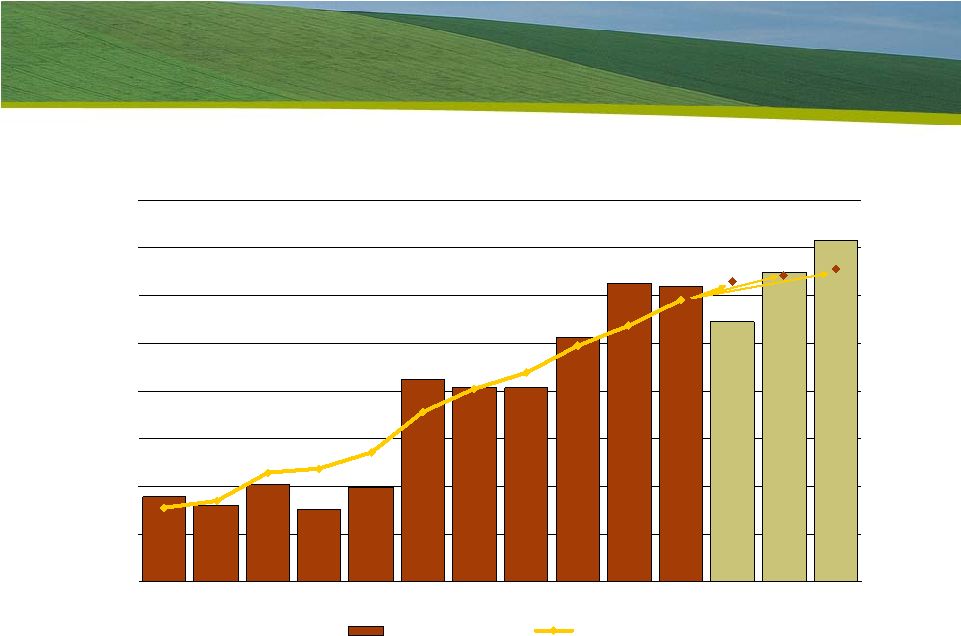
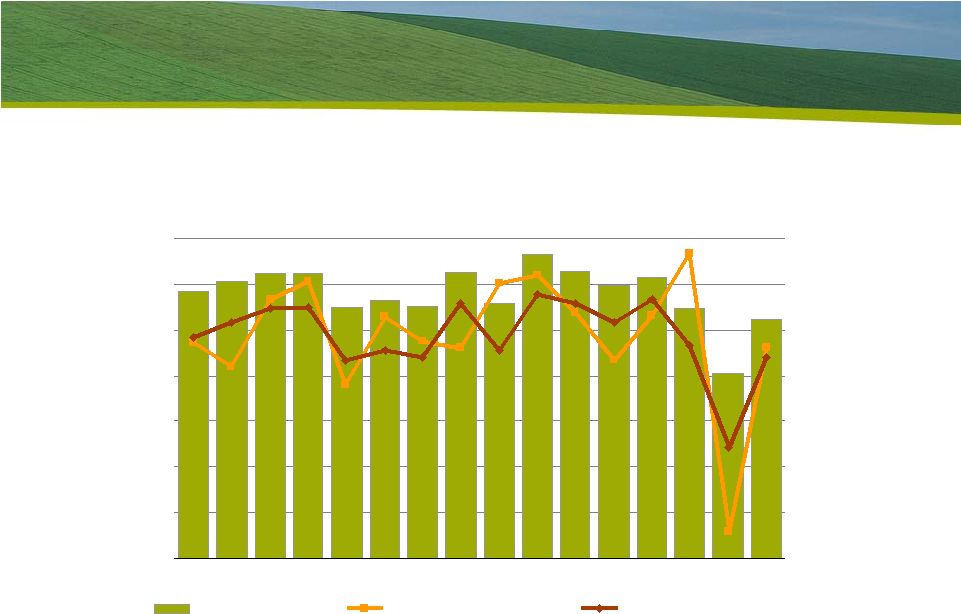
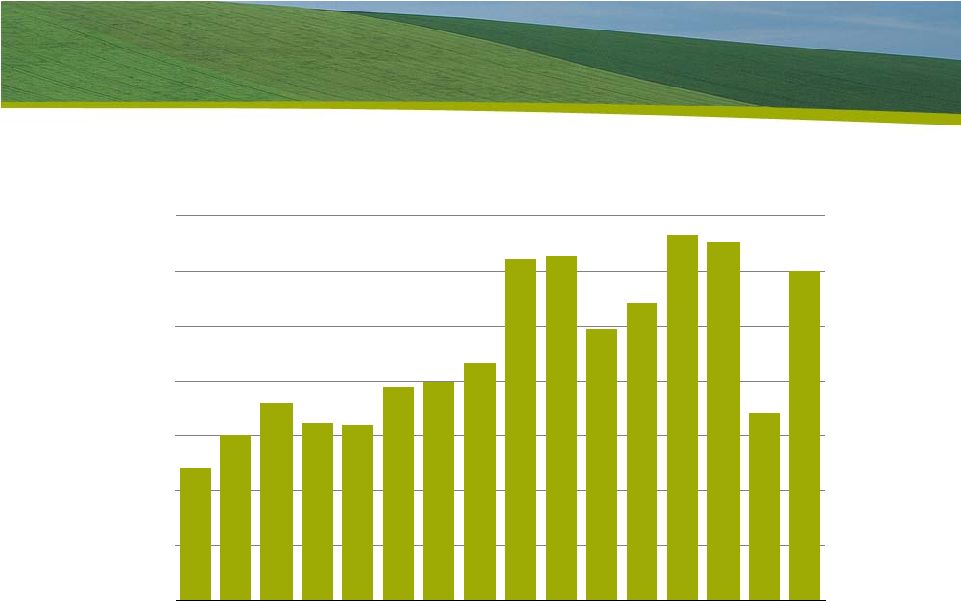
 16 Fluid Fertilizer Technology Workshop December 8, 2009 U.S. exports are projected to increase in 2009/10 U.S. DAP and MAP Exports 0.0 2.0 4.0 6.0 8.0 10.0 12.0 14.0 95 96 97 98 99 00 01 02 03 04 05 06 07 08 09 10F Mil Tons DAP/MAP Source: TFI and Mosaic Fertilizer Year Ending June 30 |
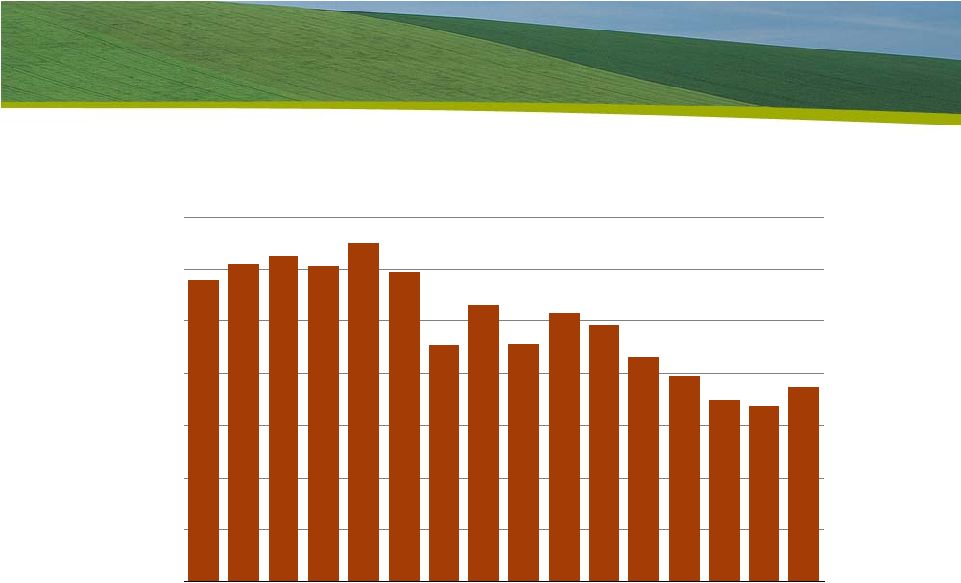
 17 Fluid Fertilizer Technology Workshop December 8, 2009 U.S. phosphate use forecast U.S. Phosphate Use 3.00 3.25 3.50 3.75 4.00 4.25 4.50 4.75 5.00 90 91 92 93 94 95 96 97 98 99 00 01 02 03 04 05 06 07 08 09E 10F Fertilizer Year Ending June 30 Source: AAPFCO and Mosaic |
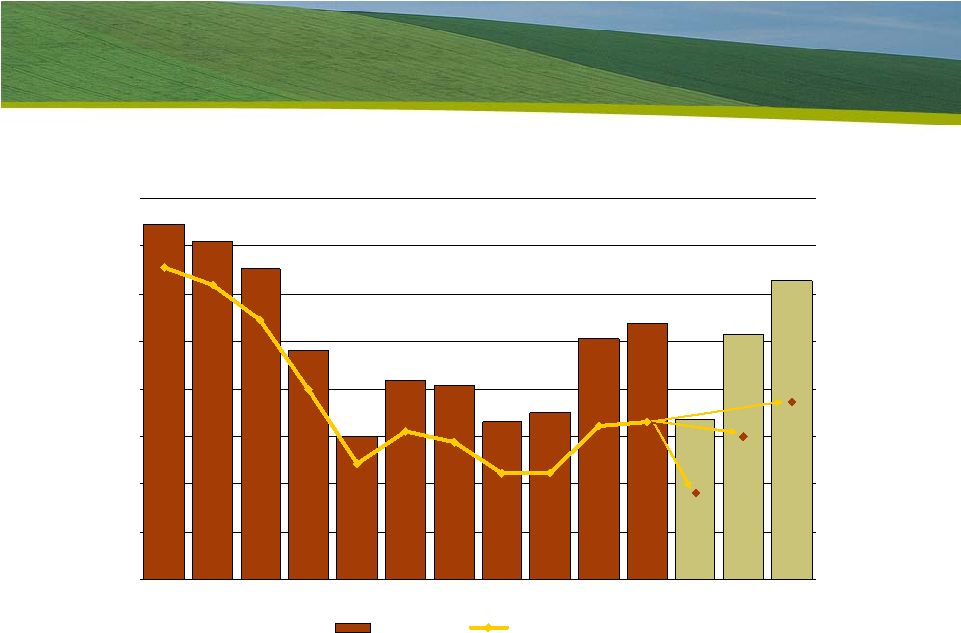
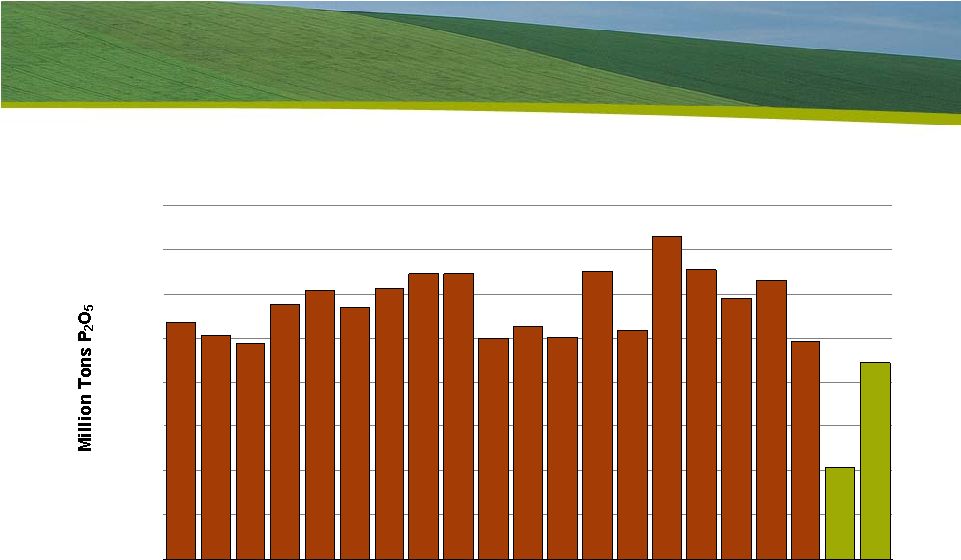
 18 Fluid Fertilizer Technology Workshop December 8, 2009 U.S. shipments are projected to rebound U.S. Phosphate Use and DAP/MAP Shipments 1.5 2.0 2.5 3.0 3.5 4.0 4.5 5.0 95 96 97 98 99 00 01 02 03 04 05 06 07 08 09E 10F Mil Tons P 2 O 5 4.5 5.0 5.5 6.0 6.5 7.0 7.5 8.0 Mil Tons DAP/MAP Phosphate Use DAP/MAP Shipments Estimated DAP/MAP Use Source: AAPFCO, TFI and Mosaic Fertilizer Year Ending June 30 |
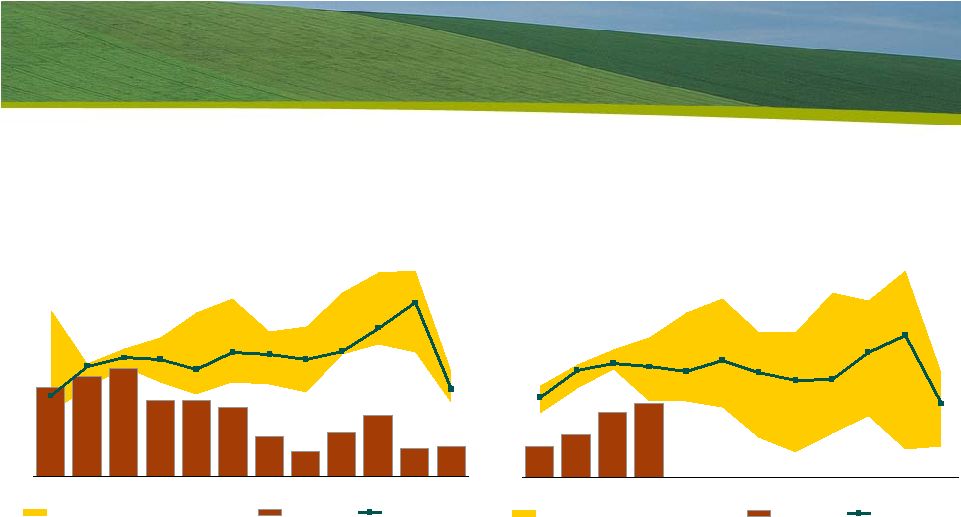
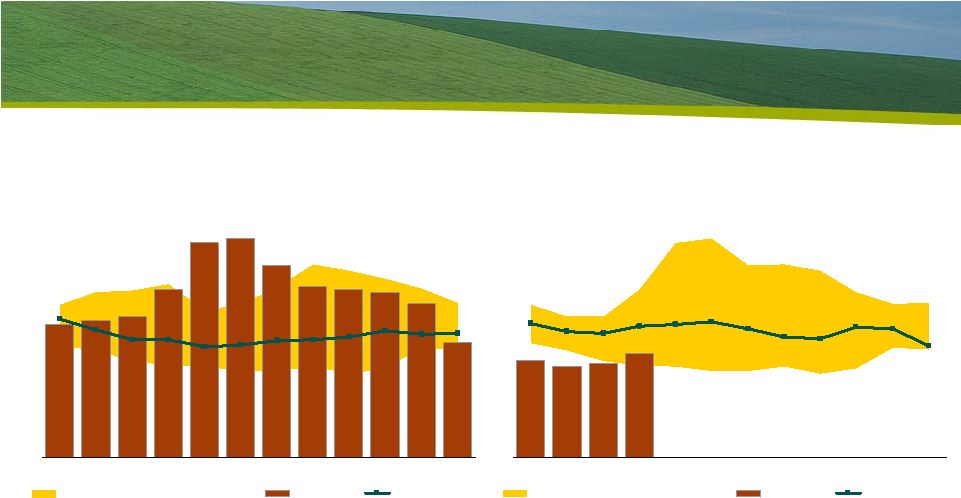 19 Fluid Fertilizer Technology Workshop December 8, 2009 Modest seasonal stock build followed by sharp drop is expected U.S. DAP and MAP Producer Stocks 0.0 0.2 0.4 0.6 0.8 1.0 1.2 1.4 1.6 1.8 2.0 Jul Aug Sep Oct Nov Dec Jan Feb Mar Apr May Jun Mil Tons MIN MAX Range (2004/05-2008/09) 2009/10 3-Yr Average Source: TFI U.S. DAP and MAP Producer Stocks 0.0 0.2 0.4 0.6 0.8 1.0 1.2 1.4 1.6 1.8 2.0 Jul Aug Sep Oct Nov Dec Jan Feb Mar Apr May Jun Mil Tons MIN MAX Range (2003/04-2007/08) 2008/09 3-Yr Average Source: TFI |
 20 Fluid Fertilizer Technology Workshop December 8, 2009 Improving crop nutrient demand drivers and outlook Upturn in the global economic outlook Constructive agricultural fundamentals Tighter phosphate fundamentals begins to take hold Low stocks from producer warehouses to farm field Demand recovery underway Potash shipments remain slow Waiting for a China settlement and price discovery Strong demand recovery expected in 2010 Demand recovery at what price? Unpredictable factors to watch Agricultural commodity prices and farm economics Macroeconomic conditions Government policies Topics |
 21 Fluid Fertilizer Technology Workshop December 8, 2009 Published spot prices remain soft on limited volume Standard MOP Prices c&f SE Asia 100 200 300 400 500 600 700 800 900 1000 1100 99 00 01 02 03 04 05 06 07 08 09 10 $ MT Source: ICIS Potash Prices Blend Grade c&f Brazil 100 200 300 400 500 600 700 800 900 1000 1100 00 01 02 03 04 05 06 07 08 09 10 $ MT Source: ICIS Potash Prices Blend Grade fob U.S. Midwest Warehouse 100 200 300 400 500 600 700 800 900 1000 00 01 02 03 04 05 06 07 08 09 10 $ ST Source: Green Markets |
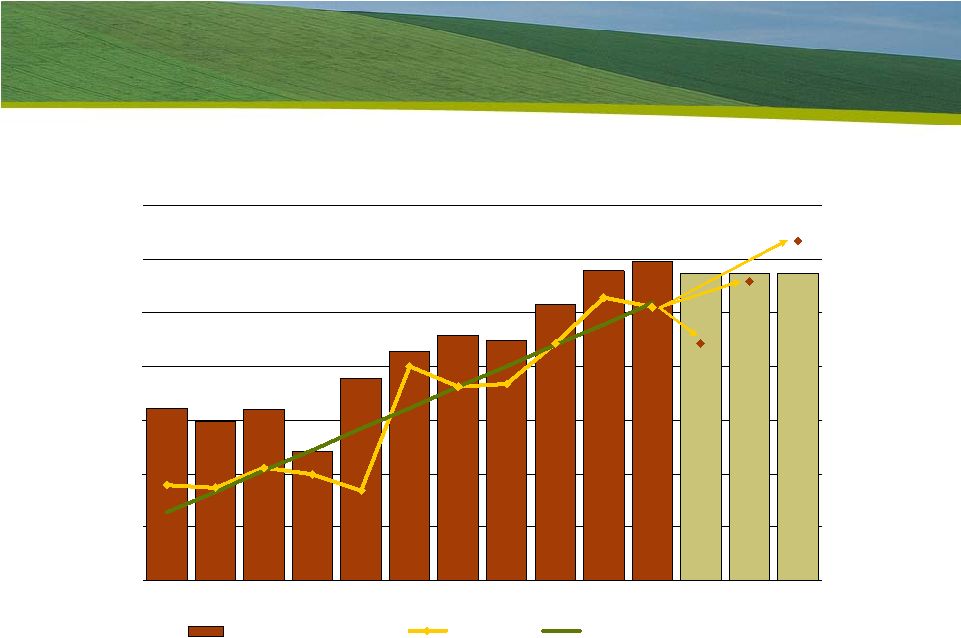
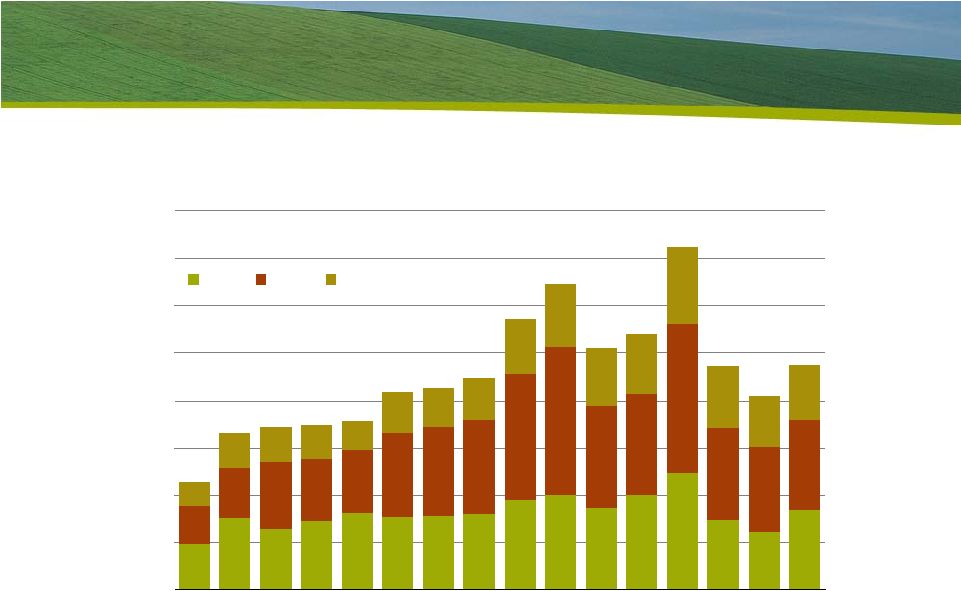
 22 Fluid Fertilizer Technology Workshop December 8, 2009 MOP trade is projected to rebound in 2010 World MOP Import Demand 0 5 10 15 20 25 30 35 40 45 50 95 96 97 98 99 00 01 02 03 04 05 06 07 08E 09F 10F Mil Tonnes Asia USA Latin America Europe Other Source: Fertecon and Mosaic |
 23 Fluid Fertilizer Technology Workshop December 8, 2009 China’s implied MOP use collapsed this year China Monthly MOP Imports 0.0 0.1 0.2 0.3 0.4 0.5 0.6 0.7 0.8 0.9 Jan Feb Mar Apr May Jun Jul Aug Sep Oct Nov Dec Mil Tonnes 2008 2009 Source: China Customs China Implied Potash Use (Production + Imports - Re-exports) 0 1 2 3 4 5 6 7 8 9 10 11 12 13 00 01 02 03 04 05 06 07 08 09 Mil Tonnes Net Imports Production Source: IFA and Mosaic |
 24 Fluid Fertilizer Technology Workshop December 8, 2009 Brazilian imports are projected to rebound in 2010 Brazil MOP Import Demand 0.0 1.0 2.0 3.0 4.0 5.0 6.0 7.0 95 96 97 98 99 00 01 02 03 04 05 06 07 08E 09F 10F Mil Tonnes Source: Fertecon and Mosaic |
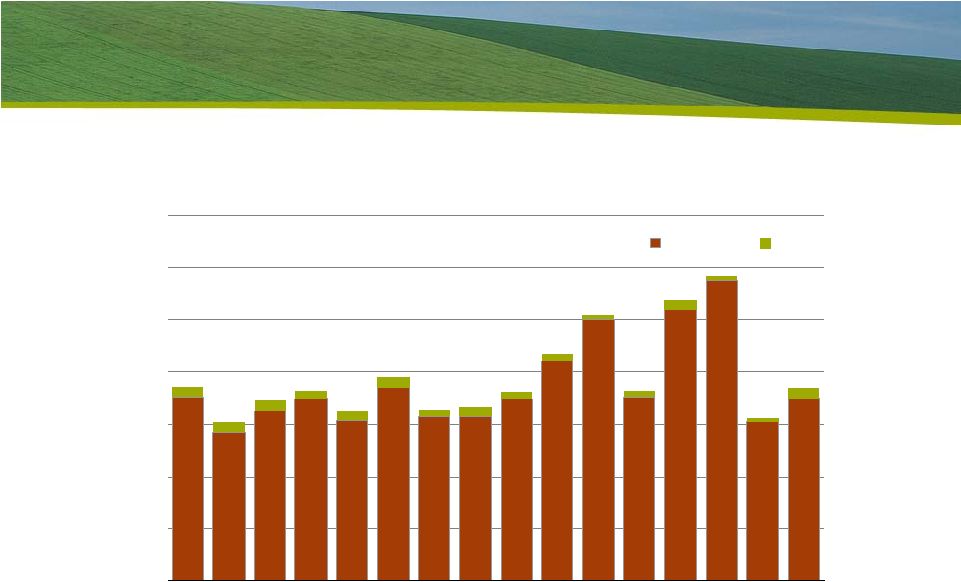 25 Fluid Fertilizer Technology Workshop December 8, 2009 NA exports are expected to increase in 2009/10 North America MOP Exports 0 2 4 6 8 10 12 14 95 96 97 98 99 00 01 02 03 04 05 06 07 08 09 10F Mil Tons KCL Canada U.S. Source: IPNI and Mosaic Fertilizer Year Ending June 30 |
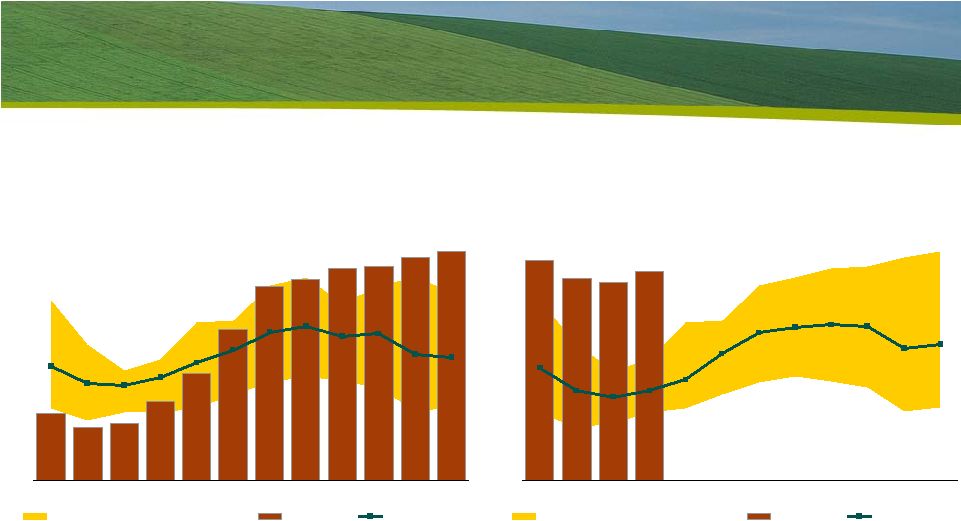
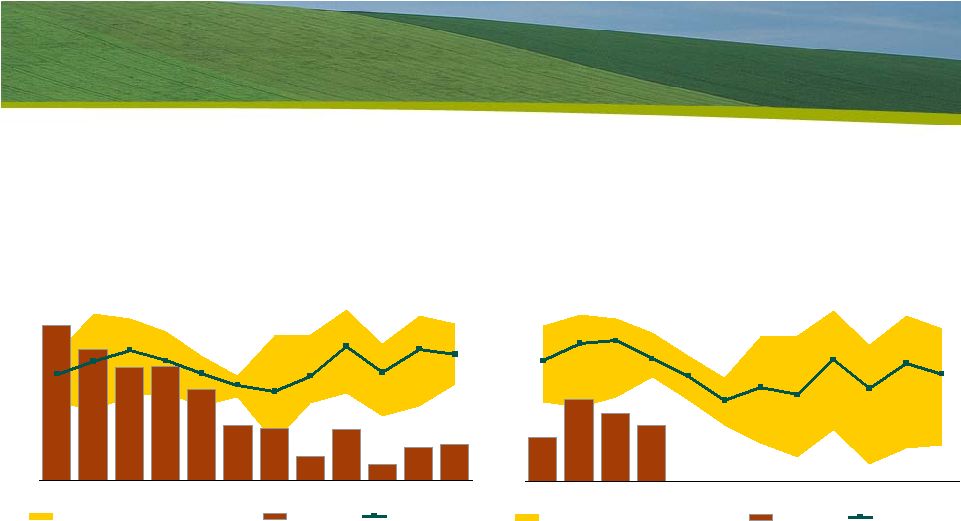 26 Fluid Fertilizer Technology Workshop December 8, 2009 NA exports are expected to ramp up in 1H 2010 North America MOP Exports 0.0 0.1 0.2 0.3 0.4 0.5 0.6 0.7 0.8 0.9 1.0 Jul Aug Sep Oct Nov Dec Jan Feb Mar Apr May Jun Mil Tons K ² O MIN MAX Range (2003/04-2007/08) 2008/09 3-Yr Average Source: IPNI North America MOP Exports 0.0 0.1 0.2 0.3 0.4 0.5 0.6 0.7 0.8 0.9 1.0 Jul Aug Sep Oct Nov Dec Jan Feb Mar Apr May Jun Mil Tons MIN MAX Range (2004/05-2008/09) 2009/10 3-Yr Average Source: IPNI K ² O |
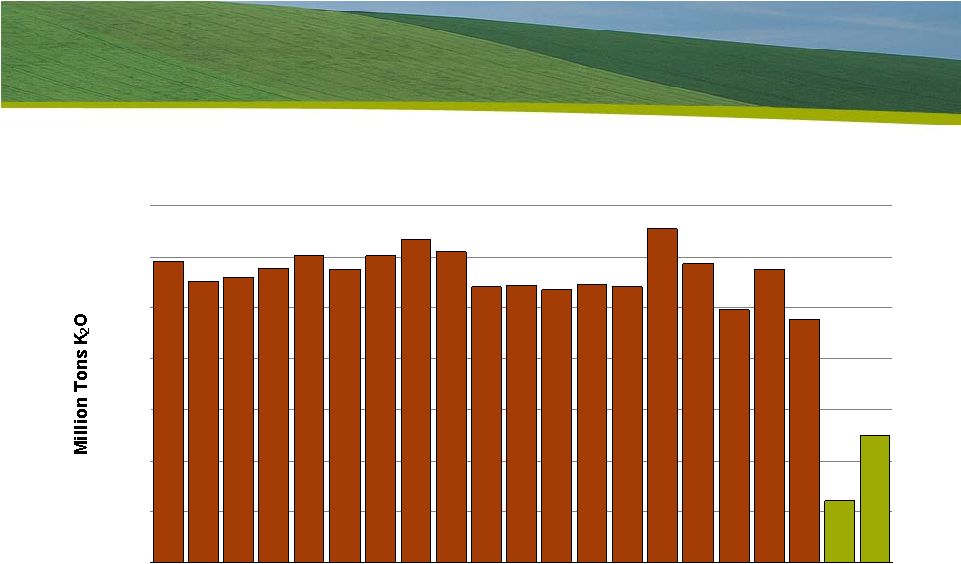 27 Fluid Fertilizer Technology Workshop December 8, 2009 U.S. potash use forecast U.S. Potash Use 2.25 2.75 3.25 3.75 4.25 4.75 5.25 5.75 90 91 92 93 94 95 96 97 98 99 00 01 02 03 04 05 06 07 08 09E 10F Fertilizer Year Ending June 30 Source: AAPFCO and Mosaic |
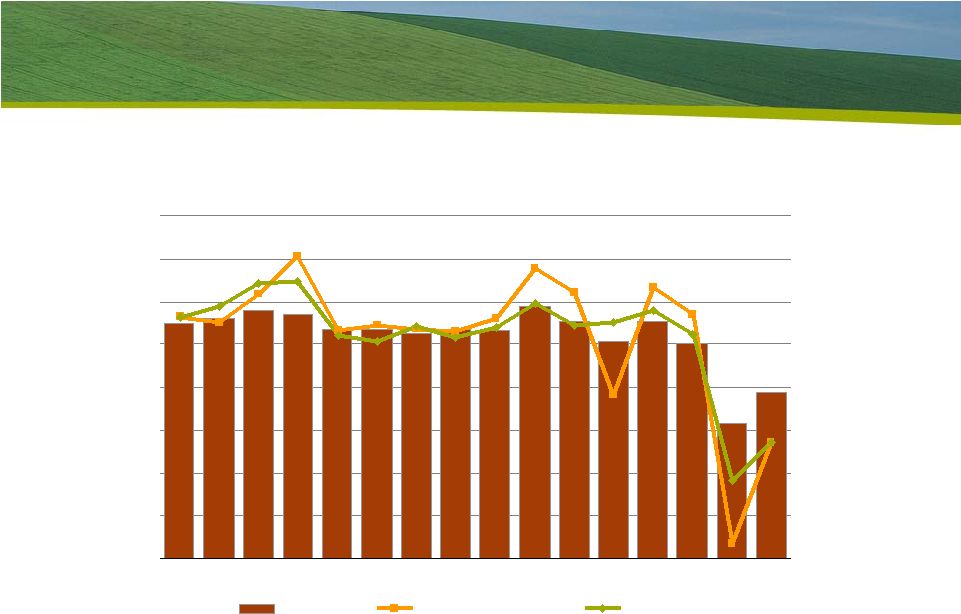 28 Fluid Fertilizer Technology Workshop December 8, 2009 NA Potash Use and Shipments North America Potash Use and MOP Shipments 0 1 2 3 4 5 6 7 8 95 96 97 98 99 00 01 02 03 04 05 06 07 08 09 10F Mil Tons 5 6 7 8 9 10 11 12 13 Mil Tons KCL Ag Use Total Shipments Estimated Use Source: IPNI and Mosaic Fertilizer Year Ending June 30 K ² O |
 29 Fluid Fertilizer Technology Workshop December 8, 2009 MOP shipments remain at low levels North America MOP Domestic Disapperance 0.0 0.1 0.2 0.3 0.4 0.5 0.6 0.7 0.8 0.9 1.0 Jul Aug Sep Oct Nov Dec Jan Feb Mar Apr May Jun Mil Tons MIN MAX Range (2003/04-2007/08) 2008/09 3-Yr Average Source: IPNI and TFI North America MOP Domestic Disapperance 0.0 0.1 0.2 0.3 0.4 0.5 0.6 0.7 0.8 0.9 1.0 Jul Aug Sep Oct Nov Dec Jan Feb Mar Apr May Jun Mil Tons MIN MAX Range (2004/05-2008/09) 2009/10 3-Yr Average Source: IPNI and TFI K ² O K ² O |
 30 Fluid Fertilizer Technology Workshop December 8, 2009 Strong recovery needed to reduce producer stocks North America MOP Producer Stocks 0.0 0.3 0.6 0.9 1.2 1.5 1.8 2.1 2.4 Jul Aug Sep Oct Nov Dec Jan Feb Mar Apr May Jun Mil Tons MIN MAX Range (2003/04-2007/08) 2008/09 3-Yr Average Source: IPNI North America MOP Producer Stocks 0.0 0.3 0.6 0.9 1.2 1.5 1.8 2.1 2.4 Jul Aug Sep Oct Nov Dec Jan Feb Mar Apr May Jun Mil Tons MIN MAX Range (2004/05-2008/09) 2009/10 3-Yr Average Source: IPNI K ² O K ² O |
 31 Fluid Fertilizer Technology Workshop December 8, 2009 Improving crop nutrient demand drivers and outlook Upturn in the global economic outlook Constructive agricultural fundamentals Tighter phosphate fundamentals begins to take hold Low stocks from producer warehouses to farm field Demand recovery underway Potash shipments remain slow Waiting for a China settlement and price discovery Strong demand recovery expected in 2010 Demand recovery at what price? Unpredictable factors to watch Agricultural commodity prices and farm economics Macroeconomic conditions Government policies Topics |
 32 Fluid Fertilizer Technology Workshop December 8, 2009 Factors to Watch – 2009/10 Agricultural commodity prices and farm economics Weather during the next six months Northern Hemisphere: crop size and fertilizer application window Southern Hemisphere: size of 2010 crop -- especially in Brazil Oil prices and the demand for U.S. corn for ethanol production Impacts of stronger economic growth and lower prices on grain demand Behavior of hedge fund managers Macroeconomic environment Exchange rates (impact of weaker dollar on crop nutrient imports and grain exports) Improved credit availability Government policies Chinese phosphate export taxes and potash import policies Indian fertilizer subsidy reform U.S. ethanol maximum blending rate (EPA delayed ruling) The intangibles Price expectations and market sentiment More tightly controlled buying processes |
 33 Fluid Fertilizer Technology Workshop December 8, 2009 Long Term Outlook Strong demand drivers still intact Population and income growth Further increases in grain-based biofuels production Demand growth requires supply increases Strong rebound of nutrient demand Existing facilities required to operate at more “normal” rates Few new projects/expansion in the near term Still high capital and operating costs Long lead times before production Significant economic and political risk in some regions Key factors to watch Stabilization of the global financial system Global economic growth to fuel the food and energy demand story Timing of the startup of new capacity Government policies Commitments to biofuels initiatives Indian fertilizer subsidy Chinese industrial and trade policies Economic development policies elsewhere |
 Global Fertilizer Outlook and Trends: 2010 and Beyond The Beginning of the Demand Recovery Thank You! Joseph Fung Senior Market Analyst Tampa, FL December 8, 2009 Fluid Fertilizer Marketing and Technology Workshop |