Attached files
| file | filename |
|---|---|
| 8-K - FORM 8-K - ZIONS BANCORPORATION, NATIONAL ASSOCIATION /UT/ | form_8k.htm |

Goldman
Sachs
Financial
Services Conference
8
December 2009 ■ New York

Forward-Looking
Statements
This
presentation contains statements that relate to the projected performance
of
Zions Bancorporation and elements of or affecting such performance, including
statements with respect to the beliefs, plans, objectives, goals, guidelines,
expectations, anticipations and estimates of management. These statements
constitute forward-looking information within the meaning of the Private Securities
Litigation Reform Act. Actual facts, determinations, results or achievements may
differ materially from the statements provided in this presentation since such
statements involve significant known and unknown risks and uncertainties. Factors
that might cause such differences include, but are not limited to: competitive
pressures among financial institutions; economic, market and business conditions,
either nationally or locally in areas in which Zions Bancorporation conducts its
operations, being less favorable than expected; changes in the interest rate
environment reducing expected interest margins; changes in debt, equity and
securities markets; adverse legislation or regulatory changes; and other factors
described in Zions Bancorporation’s most recent annual and quarterly reports. In
addition, the statements contained in this presentation are based on facts and
circumstances as understood by management of the company on the date of this
presentation, which may change in the future. Zions Bancorporation disclaims any
obligation to update any statements or to publicly announce the result of any
revisions to any of the forward-looking statements included herein to reflect future
events, developments, determinations or understandings.
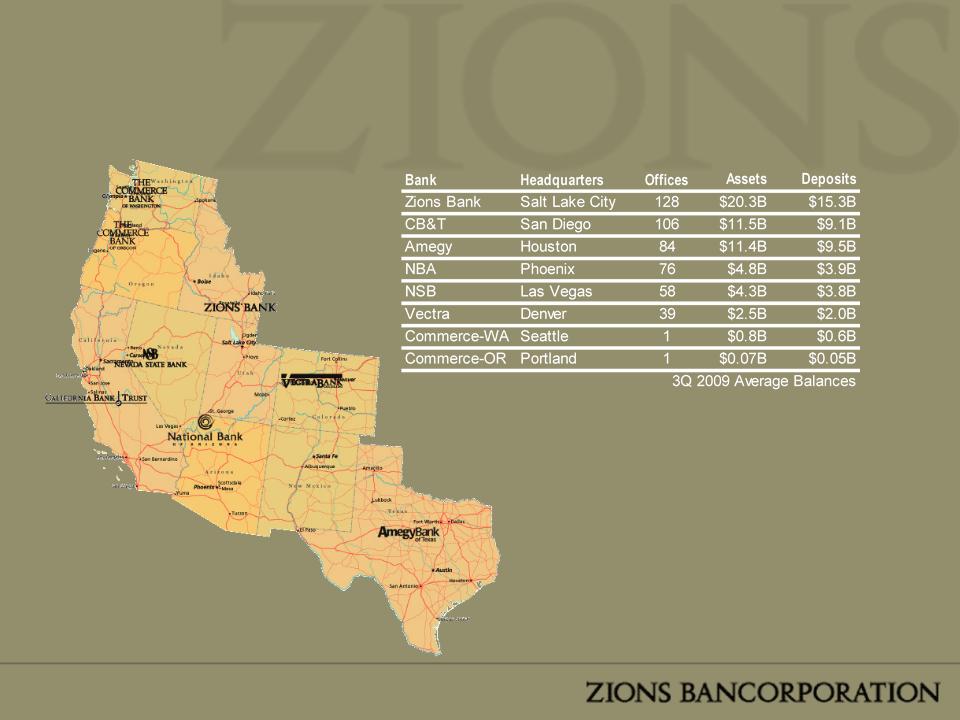
A
Collection of Great Banks

• Annual pretax,
pre-credit earnings of ~$1billion
– NIM: 3.91%, ranked
#2 of regional banks/peers.
– Best among peers for
non-interest bearing deposits as a percent of
earning assets
earning assets
• Strong allowance for
credit loss: 3.9% of loans
• Low LTV ratios on
term commercial real estate loans
• Successful bidder on
four FDIC assisted transactions
• Markets with
nation’s strongest long term growth profile
• Competitive
operating cost structure - Zions continues
to cut costs; on target to reduce costs by $75 million by
end of FY09.
to cut costs; on target to reduce costs by $75 million by
end of FY09.
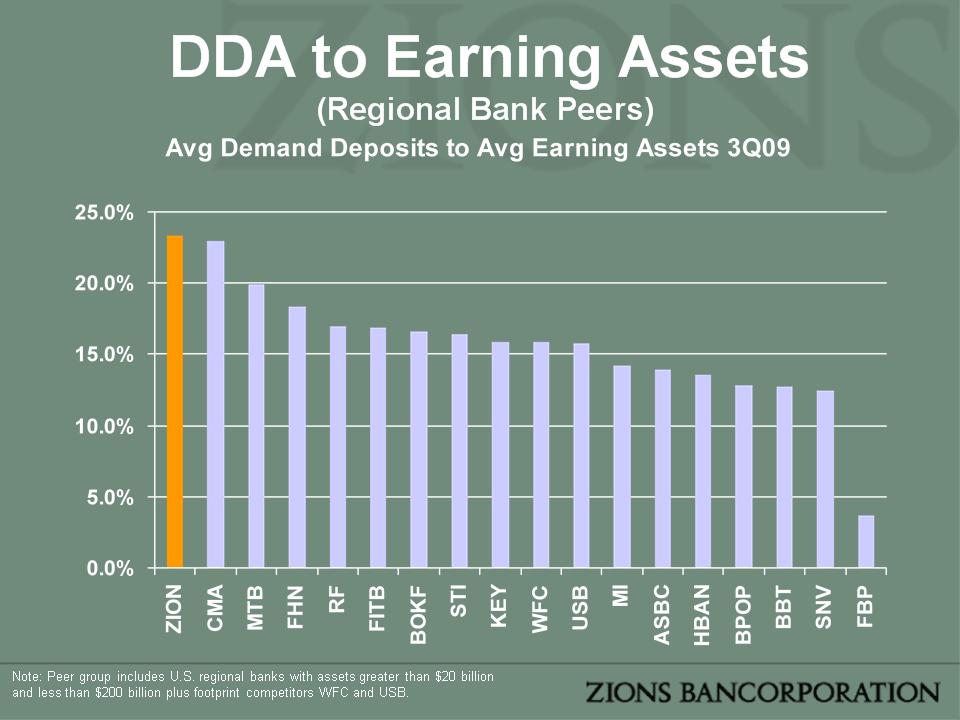
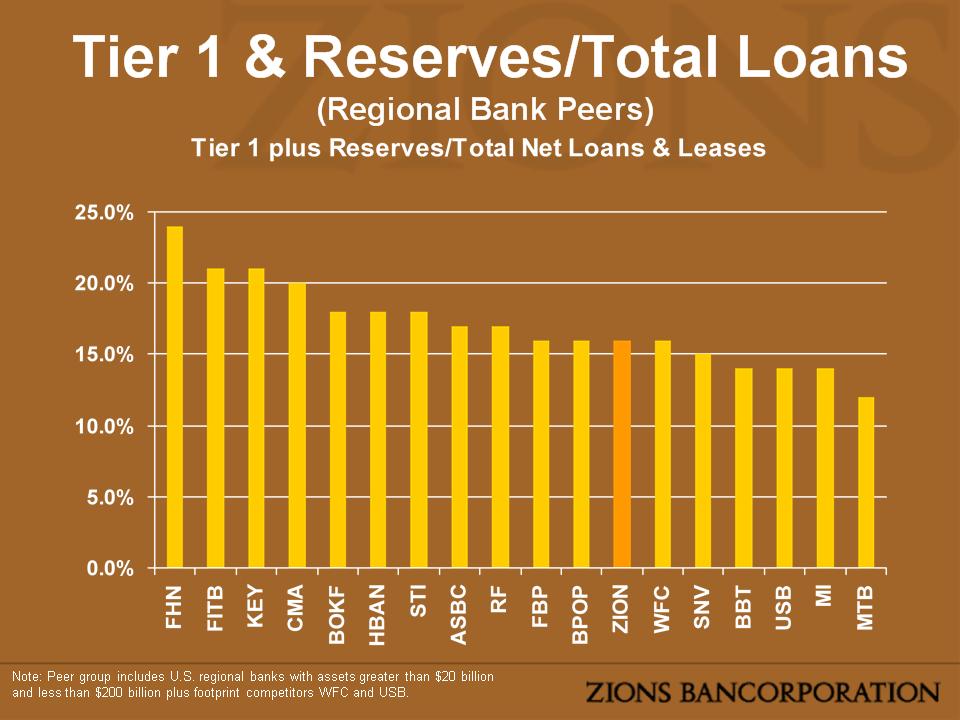
*Peer
group includes U.S. regional banks with assets greater than $20 billion
and
less than $200 billion plus footprint competitors WFC and USB.
less than $200 billion plus footprint competitors WFC and USB.
Zions’
Strengths

• Rising NPAs, to 5.4%
of loans from 4.7% in prior
quarter
quarter
– Total delinquent +
NPA was up 13% in 3Q09 compared to the prior
quarter
quarter
• YTD net charge-off
rate of 2.8%
• Continued securities
impairments (OTTI), primarily on
bank/insurance CDOs - $56.5 million in 3Q
bank/insurance CDOs - $56.5 million in 3Q
Zions’
Challenges
Footprint
Population Growth Estimates from SNL Financial (2009-2014)
Our
Growth Engine

Agenda
|
Key
Issues Going Forward
–Net Interest
Margin
–Credit
Quality
–Term
CRE
–Securities
Portfolio
–Capital &
Deferred Tax Asset
|
|
Outlook
Summary
|
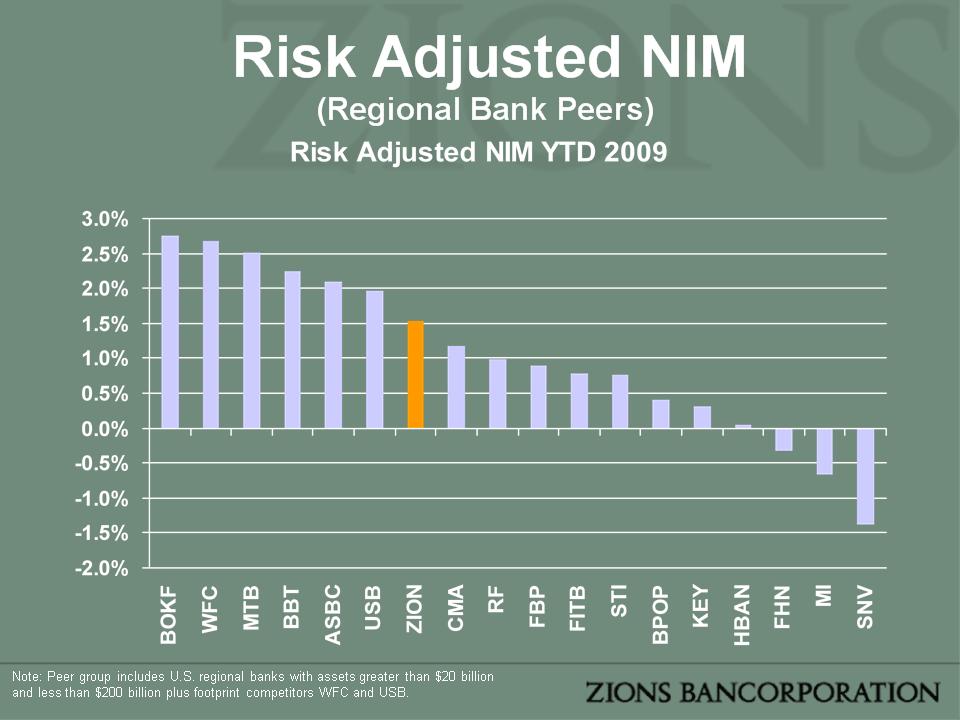
Source:
SNL
Source:
SNL
Note:
Peer group includes U.S. regional banks with assets greater than $20
billion
and less than $200 billion plus footprint competitors WFC and USB.
and less than $200 billion plus footprint competitors WFC and USB.
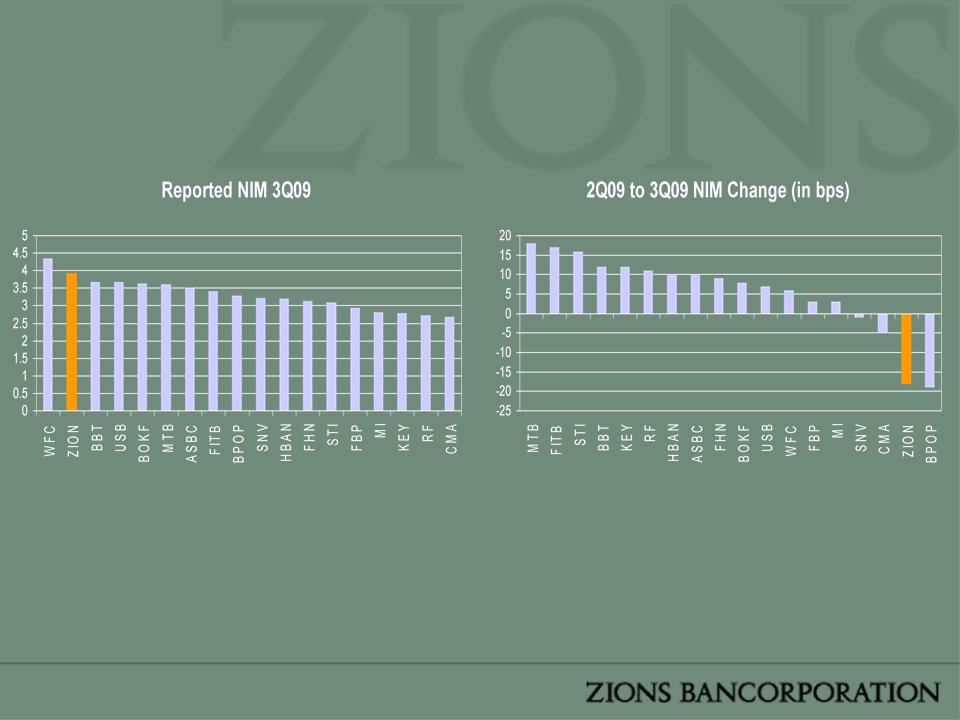
•Excluding
the effects of the 2Q09 sub debt modification, NIM increased 9 basis
points
•A
200 basis point rise in interest rates would increase the NIM by up to 13 basis
points
•See
Appendix for additional asset sensitivity information
Net
Interest Margin
(Regional Bank Peers)
(Regional Bank Peers)
Source:
SNL
Source:
SNL - Estimated where data was unavailable

Agenda
|
Key
Issues Going Forward
–Net Interest
Margin
–Credit
Quality
–Term
CRE
–Securities
Portfolio
–Capital &
Deferred Tax Asset
|
|
Outlook
Summary
|
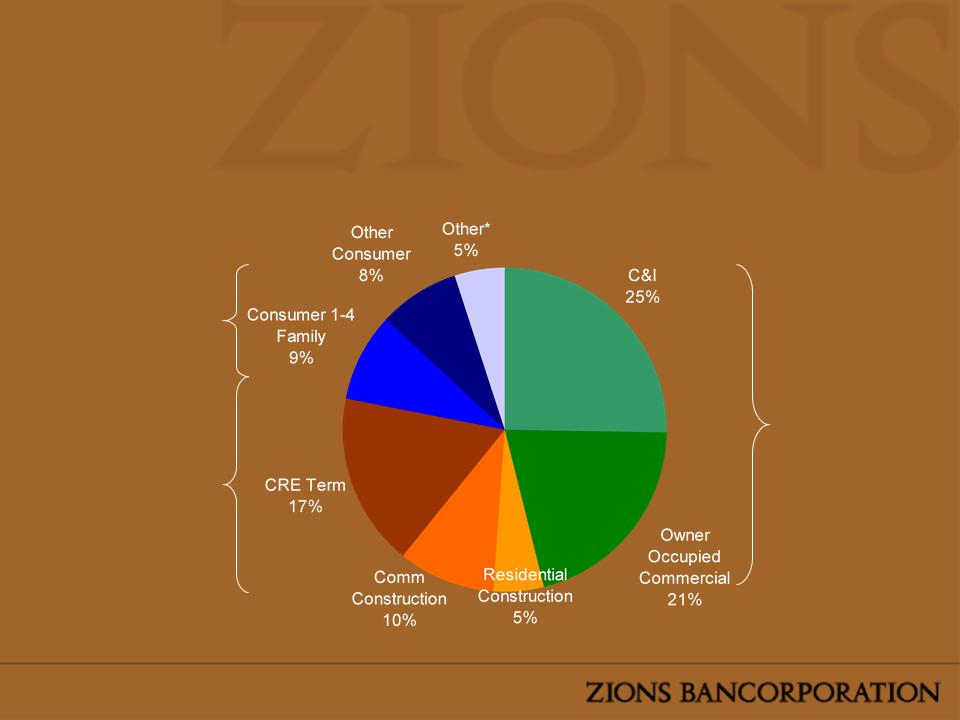
46%
32%
22%
*Includes FDIC
Supported Assets
Loan
Portfolio Composition
(9/30/2009)
(9/30/2009)
Based
on Total Loan Commitments
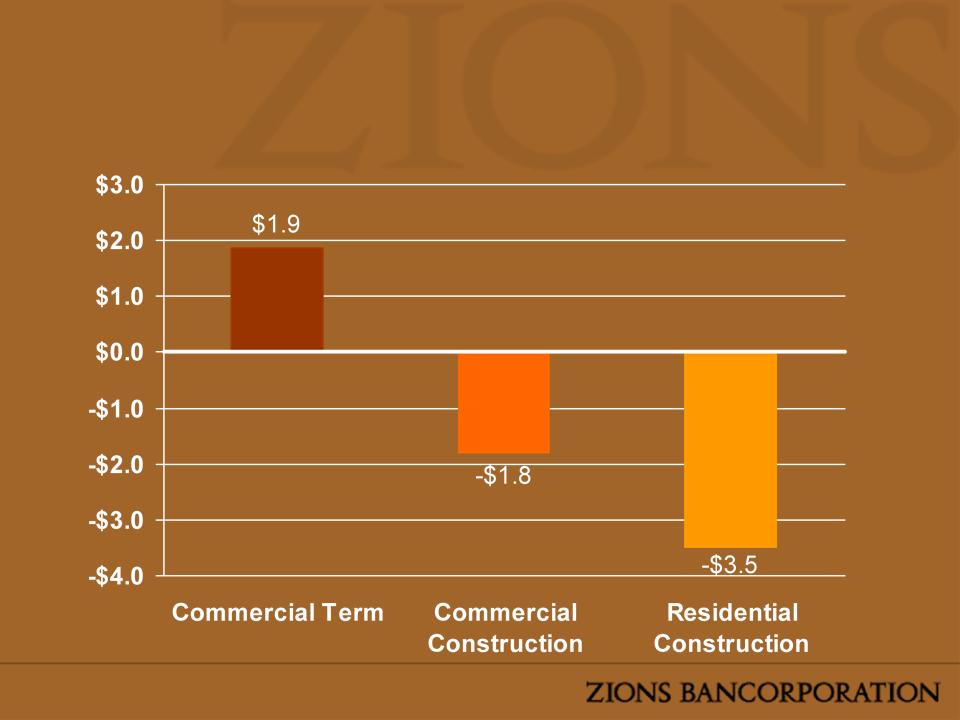
CRE
Portfolio Change Summary
(Dollar Change from 4Q07 to 3Q09 in billions)
(Dollar Change from 4Q07 to 3Q09 in billions)
Loan
Portfolio Performance
(9/30/2009)
(9/30/2009)
NPAs
+ Greater than 90 Days Delinquent / Loans + OREO
Note:
Peer group includes U.S. regional banks with assets greater than $20 billion
and
less than $200 billion plus footprint competitors WFC and USB.
less than $200 billion plus footprint competitors WFC and USB.
Source:
SNL
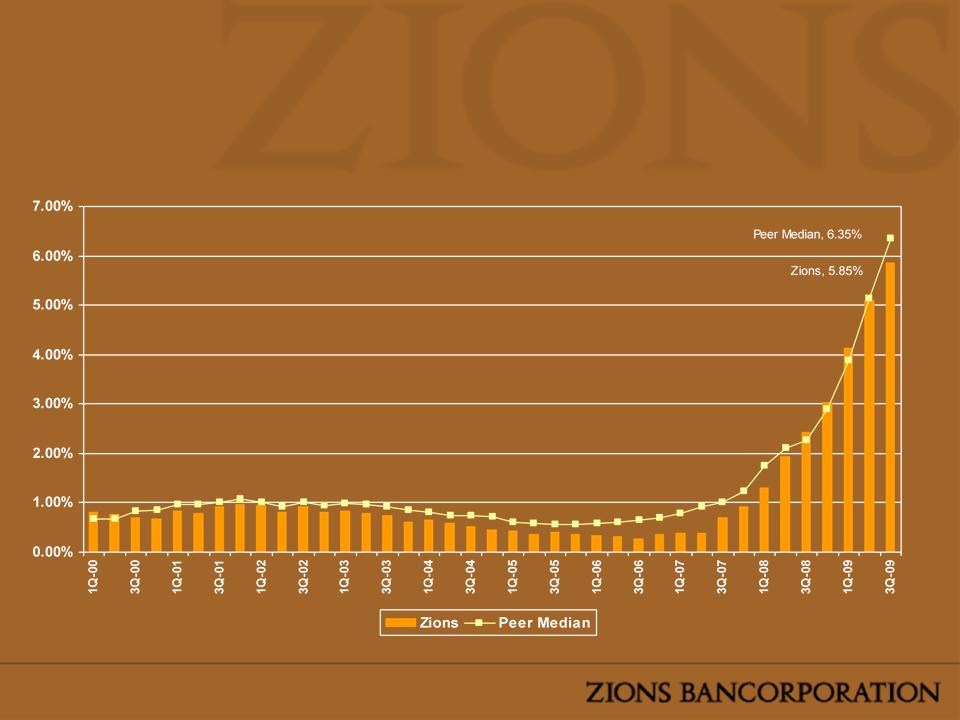
NPAs
& Delinquency Trends
(Regional Bank Peers)
(Regional Bank Peers)
*Annualized
Note:
Peer group includes U.S. regional banks with assets greater than $20 billion
and
less than $200 billion plus footprint competitors WFC and USB.
less than $200 billion plus footprint competitors WFC and USB.
Source:
SNL
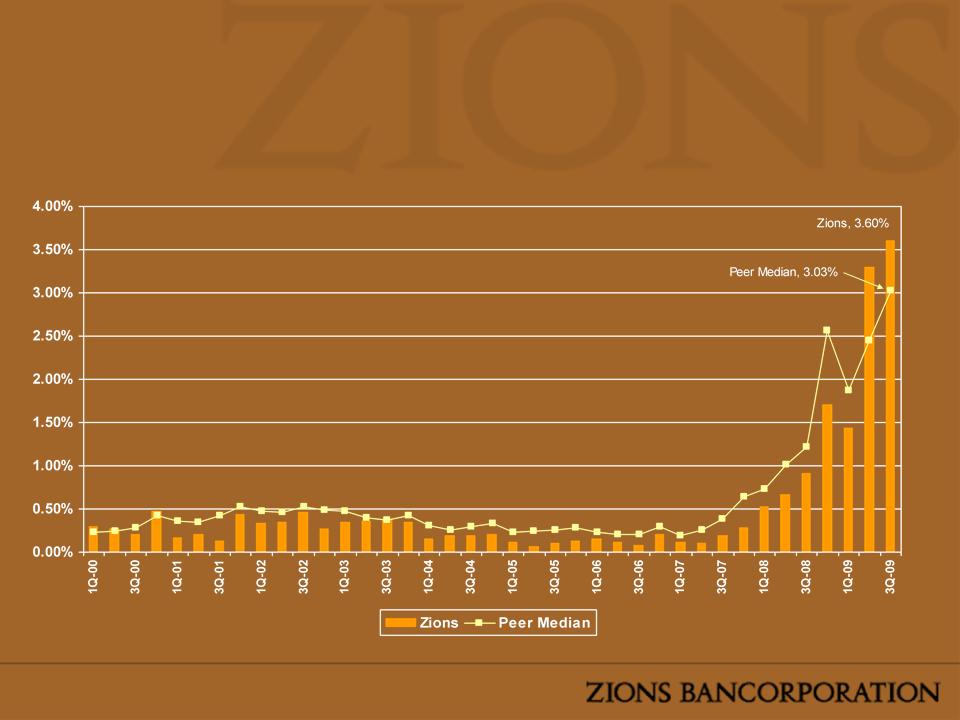
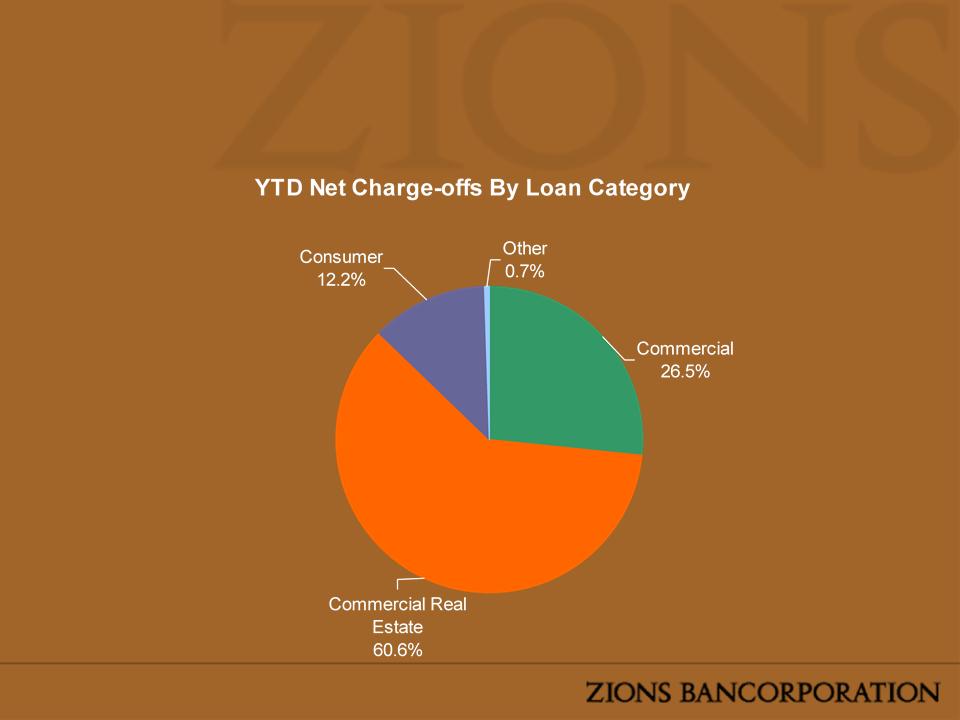
Net
Charge-offs as % of Loans*
(Regional Bank Peers)
(Regional Bank Peers)
Note:
Peer group includes U.S. regional banks with assets greater than $20 billion and
less than $200 billion plus
footprint competitors WFC and USB. Source: SNL
footprint competitors WFC and USB. Source: SNL
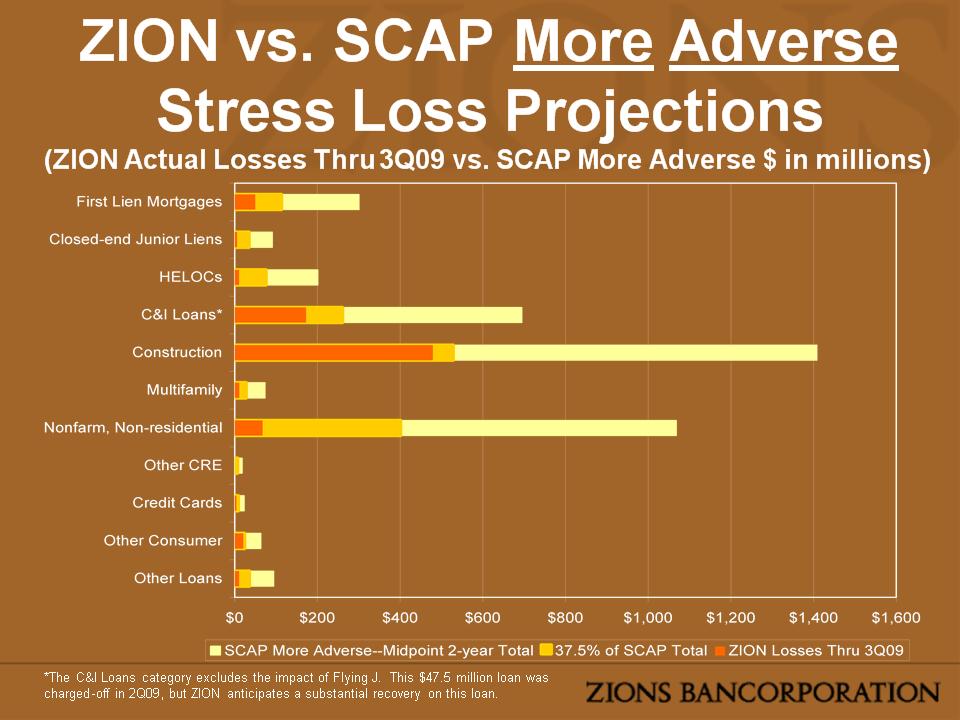
*The
C&I Loans category excludes the impact of Flying J. This
$47.5 million loan was charged-off in 2Q09, but
ZION anticipates a substantial recovery on this loan.
ZION anticipates a substantial recovery on this loan.
Percentage
of Zions
Total Loans
Total Loans
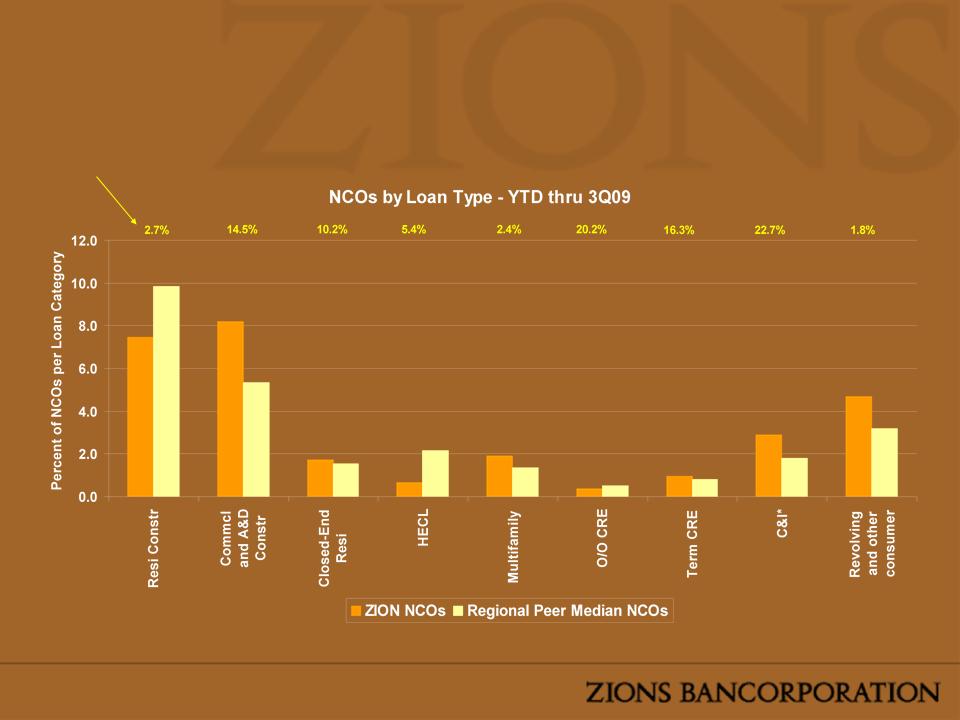
Net
Charge Offs
(Regional Bank Peers)
(Regional Bank Peers)
Source:
SNL
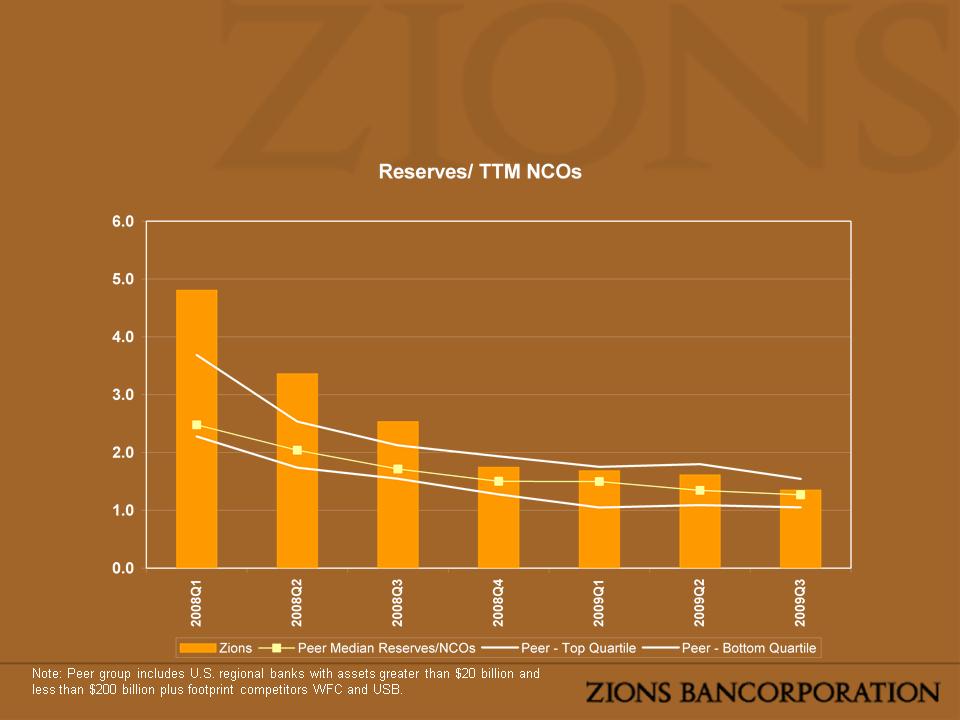
Reserves
& Net Charge Offs
(Regional Bank Peers)
(Regional Bank Peers)

Credit
Quality
Outlook
Outlook
• Residential
construction problem credits
stable to improving
stable to improving
• Commercial
construction problem
credits rising, although at a slower rate
credits rising, although at a slower rate
• Classified loans are
stabilizing
• Continued elevated
levels of NPAs,
provisions and net losses
provisions and net losses
• Continued ALLL build
likely in 4Q09, but
less than 3Q09
less than 3Q09

Agenda
|
Key
Issues Going Forward
–Net Interest
Margin
–Credit
Quality
–Term
CRE
–Securities
Portfolio
–Capital &
Deferred Tax Asset
|
|
Outlook
Summary
|
|
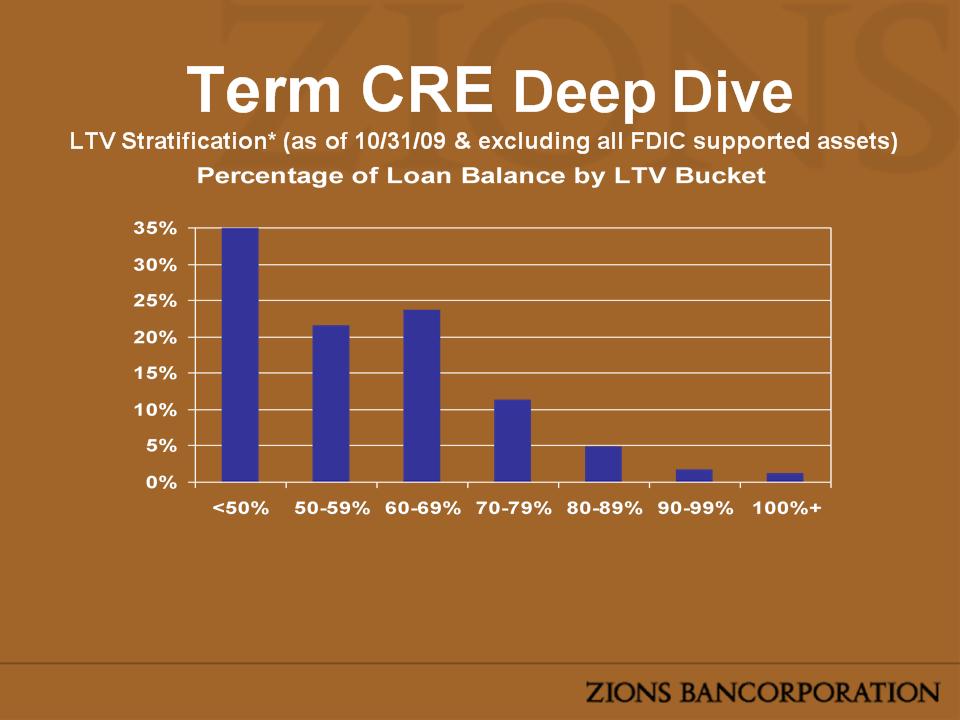
Percentage
of Loans within each bucket that are Non-Accrual
|
|||||||
|
Bucket
|
<50%
|
50-59%
|
60-69%
|
70-79%
|
80-89%
|
90-99%
|
100%+
|
|
NALs
|
0.8%
|
1.4%
|
1.2%
|
4.6%
|
22.0%
|
6.6%
|
19.2%
|
*Based
on most recent LTV; loans are generally reappraised when downgraded to
classified status
Takeaway: Limited
High LTV or “Tail Risk”
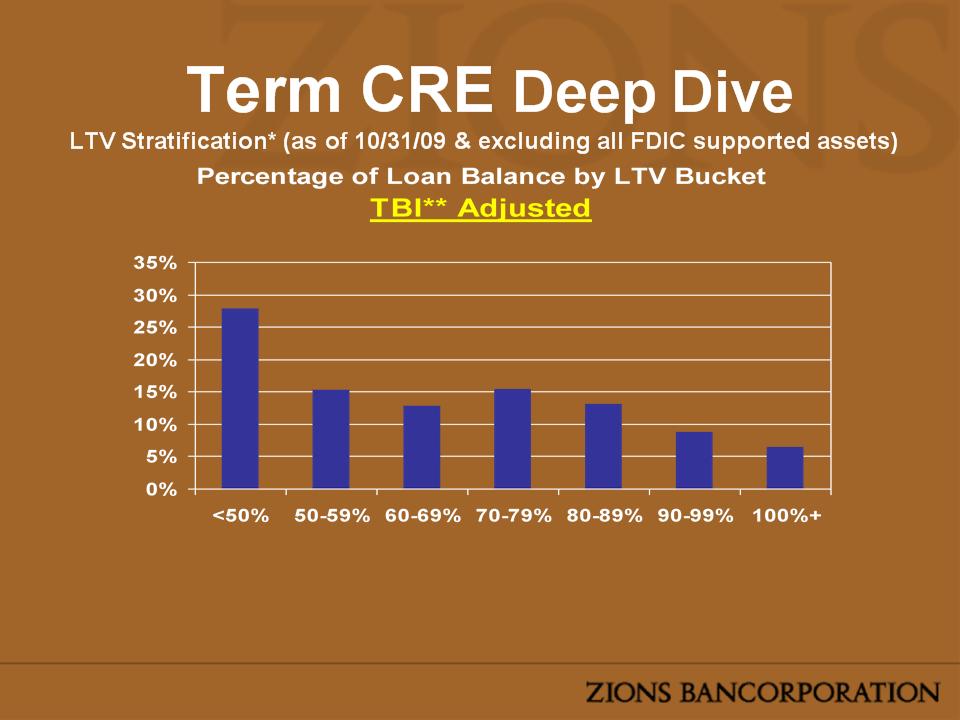
|
Percentage
of Loans within each bucket that are Non-Accrual
|
|||||||
|
Bucket
|
<50%
|
50-59%
|
60-69%
|
70-79%
|
80-89%
|
90-99%
|
100%+
|
|
NALs
|
1.1%
|
1.1%
|
2.5%
|
2.6%
|
7.2%
|
2.4%
|
7.9%
|
*Based
on most recent LTV; loans are generally reappraised when downgraded to
classified status
**The
MIT Transaction Based Index is a national index that has been applied to ZBC's
mostly
regional CRE Portfolio
regional CRE Portfolio
Takeaway: Limited
High LTV or “Tail Risk”
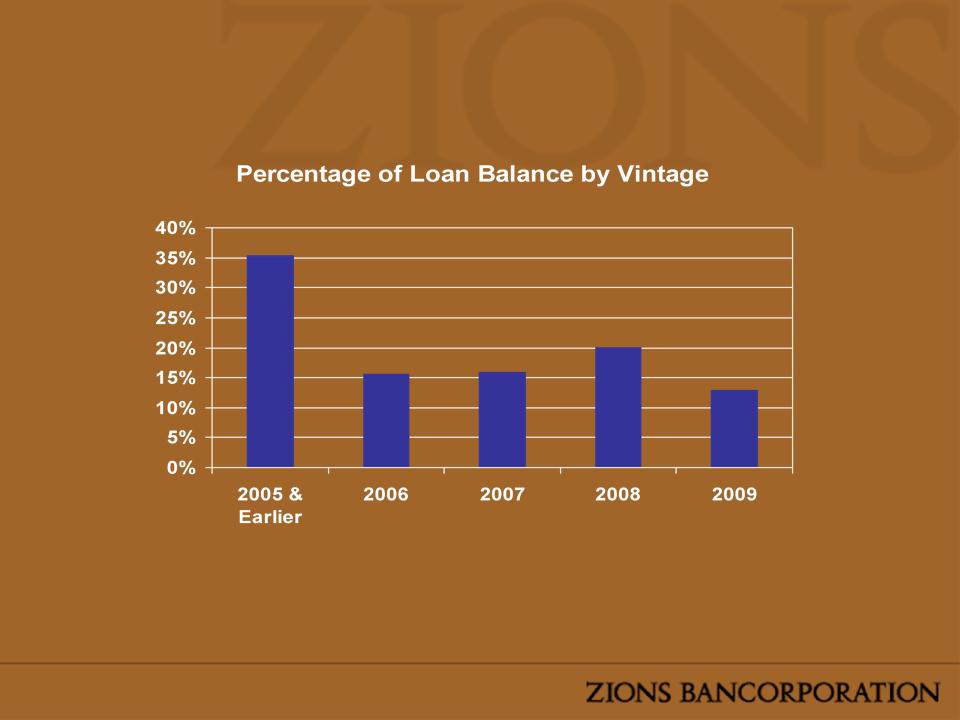
|
Percentage
of Loans within each bucket that are Non-Accrual
|
|||||
|
Bucket
|
<=
2005
|
2006
|
2007
|
2008
|
2009
|
|
NALs
|
1.6%
|
6.7%
|
4.4%
|
2.4%
|
0.4%
|
Term
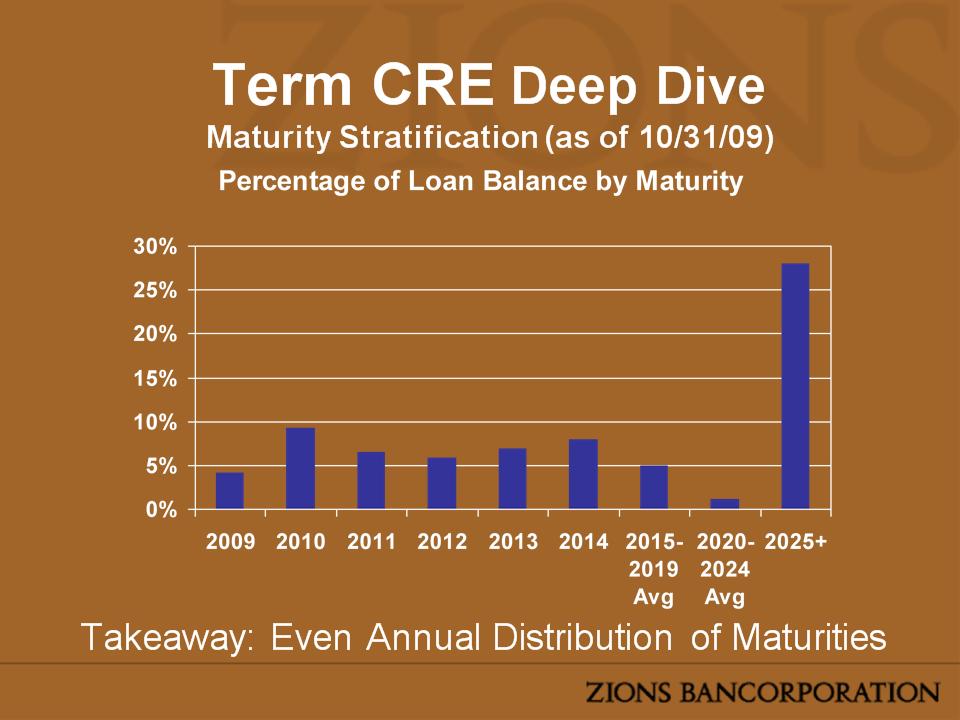
CRE Deep Dive
Vintage Stratification (as of 10/31/09 & excluding all FDIC supported assets)
Vintage Stratification (as of 10/31/09 & excluding all FDIC supported assets)
Takeaway: Limited
Exposure to 2007 Vintage

Agenda
|
Key
Issues Going Forward
–Net Interest
Margin
–Credit
Quality
–Term
CRE
–Securities
Portfolio
–Capital &
Deferred Tax Asset
|
|
Outlook
Summary
|
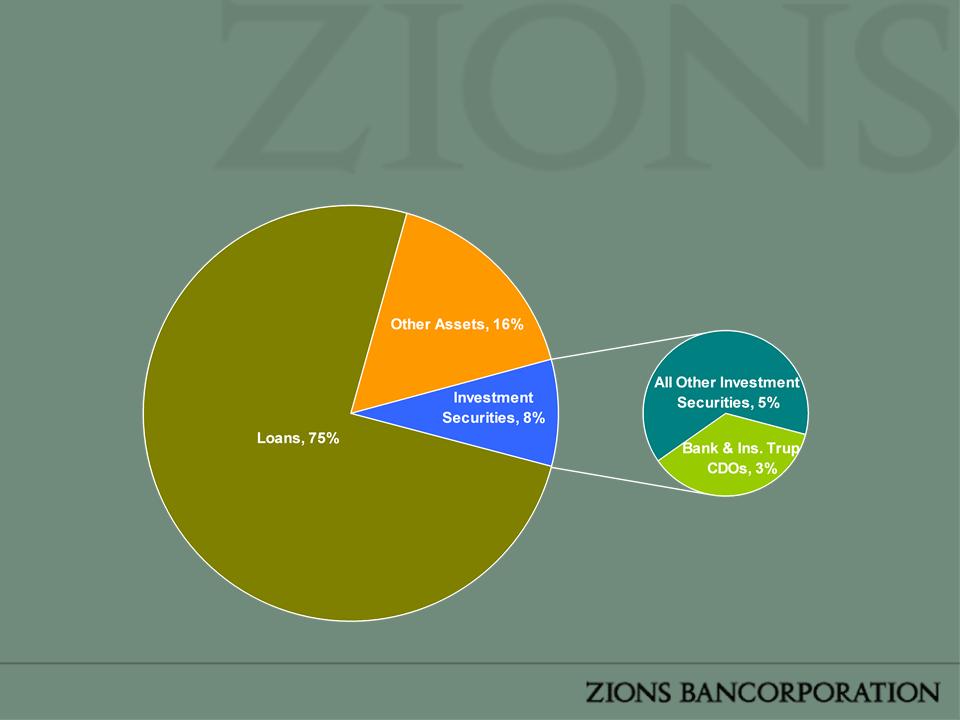
Bank
& Ins. Trup CDOs 3% of Assets
• Credit-related OTTI
losses $56.5 million in 3Q09
• Noncredit-related
OTTI on securities of $141.9 million in
3Q09 recognized in OCI
3Q09 recognized in OCI
Investment
Securities Performance 3Q09

Agenda
|
Key
Issues Going Forward
–Net Interest
Margin
–Credit
Quality
–Term
CRE
–Securities
Portfolio
–Capital
& Deferred Tax Asset
|
|
Outlook
Summary
|

• DTA = $688 million
in 3Q09 vs. $644 million in 2Q09 and
$402 million in 3Q08
$402 million in 3Q08
• Asset/liability
management strategy announced on Monday,
November 23rd reduced net DTA by ~$148 million
November 23rd reduced net DTA by ~$148 million
• No valuation
allowance currently expected
• Sources of Positive
Evidence
– Track record of
earnings through prior difficult cycles
– Stable income
pre-tax, pre-credit
– Decelerating or
declining non-accrual, classified, and special mention loans
– Taxes paid in prior
years
– Tax planning
strategies
Deferred
Tax Asset
Source:
SNL - Estimated where data was unavailable

|
|
3Q08
|
2Q09
|
3Q09
|
|
Tangible
Common Equity
|
6.05%
|
5.66%
|
5.43%
|
|
Tier
1 Leverage
|
7.64%
|
9.89%
|
10.06%
|
|
Tier
1 Risk Based
|
8.07%
|
9.66%
|
10.00%
|
|
Total
Risk Based
|
12.30%
|
12.87%
|
13.24%
|
|
Minimum
Regulatory Requirement for “well capitalized”
|
|
|
Tier 1 Risk
Based
|
6.0%
|
|
Total Risk
Based
|
10.0%
|
Capital
Ratios

Outlook
Summary
• Continued elevated
levels of credit losses, loss
provisions, and some reserve build in a weak economy;
rate of deterioration slowing
provisions, and some reserve build in a weak economy;
rate of deterioration slowing
• Future OTTI losses
likely stable, possibly declining
• Estimated 4Q09 GAAP
NIM ≈ 3.8%
– continued strong
core net interest margin
– impacted by new
senior debt and sub debt-to-preferred
conversion
conversion
• Reduced dividend and
asset levels will help preserve
capital ratios
capital ratios
• No DTA valuation
allowance

Outlook
Summary
Long-term
outlook remains strong when
economy begins to recover
economy begins to recover
– Best long-term
growth markets
– Sustainable
competitive advantage in
operating model
operating model
– Superior
risk-adjusted NIM through the
business cycle
business cycle

Goldman
Sachs
Financial Services
Conference
8
December, 2009
New
York

Appendix

|
|
Million
|
$
Per Share
|
|
Net Income To
Common
|
($179)
|
($1.41)
|
|
OTTI
Impairment on Securities
|
($57)
|
|
|
Provisions For
Credit Losses
|
$566
|
|
|
Net
Charge-offs
|
$381
|
|
|
OREO
Expense
|
$30
|
|
|
Core Pretax
Income (ex
provision,
impairment, OREO exp, & non-recurring items) |
$253
|
|
Q3
2009 Earnings Highlights
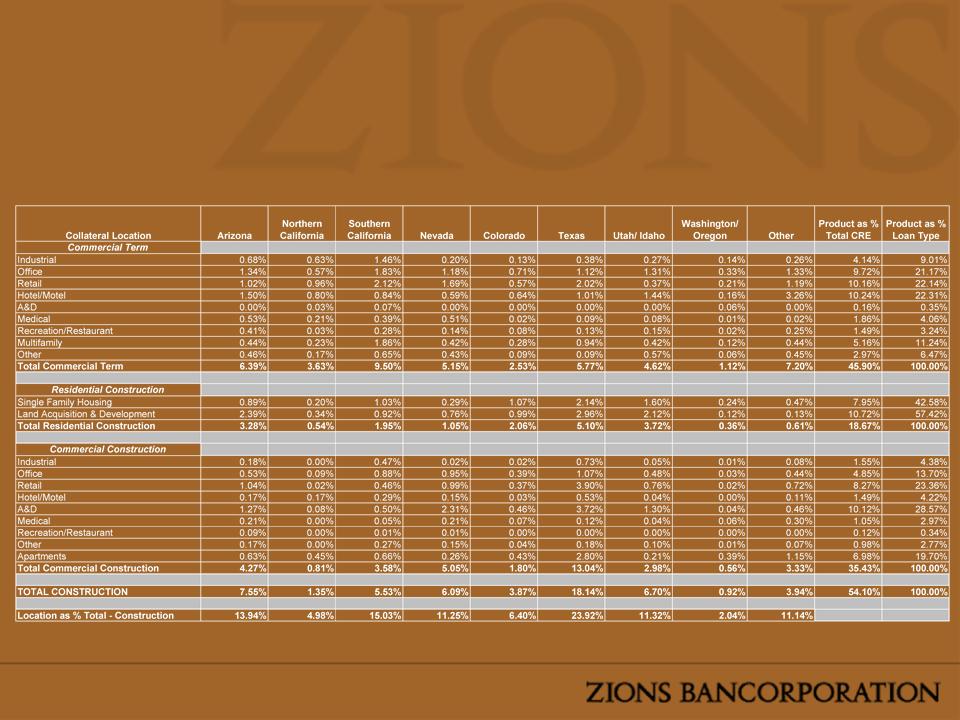
CRE
Portfolio Composition
Loans by Product Type and Location - 9/30/09
Loans by Product Type and Location - 9/30/09
|
Collateral
Location
|
Arizona
|
Northern
California |
Southern
California |
Nevada
|
Colorado
|
Texas
|
Utah/
Idaho
|
Washington
|
Other
|
Total
|
|
Commercial
Term
|
Arizona
|
|
|
|
|
|
|
|
|
|
|
Industrial
|
$30,953
|
$10,796
|
($3,662)
|
$10,679
|
($6,260)
|
$42,705
|
$26,238
|
$3,419
|
$36,357
|
$151,225
|
|
Office
|
$44,352
|
$54,931
|
$84,313
|
($6,233)
|
($52,341)
|
($27,283)
|
$15,951
|
$21,605
|
$70,137
|
$205,434
|
|
Retail
|
$44,788
|
$71,769
|
$136,873
|
$18,048
|
$50,557
|
$167,385
|
$33,161
|
$17,957
|
$179,383
|
$719,922
|
|
Hotel/Motel
|
$43,599
|
$67,521
|
$30,428
|
$25,020
|
$23,690
|
$80,726
|
$63,212
|
$7,004
|
$180,004
|
$521,203
|
|
A&D
|
$0
|
$0
|
($6,523)
|
$80
|
$0
|
$24,956
|
$0
|
($6,818)
|
$1,566
|
$13,261
|
|
Medical
|
$14,190
|
$22,200
|
$22,822
|
$61,957
|
$9,288
|
$10,401
|
$11,448
|
$756
|
($1,088)
|
$151,974
|
|
Recreation/Restaurant
|
$37,105
|
$7,456
|
$40,383
|
$5,858
|
$483
|
$13,420
|
$12,057
|
$2,470
|
$16,236
|
$135,468
|
|
Multifamily
|
$17,072
|
($6,596)
|
$101,810
|
$18,466
|
$9,543
|
$102,258
|
$6,889
|
$7,351
|
$984
|
$257,776
|
|
Other
|
($78,306)
|
($4,930)
|
($24,084)
|
($4,675)
|
($53,168)
|
($19,621)
|
$5,185
|
($258)
|
($121,665)
|
($301,523)
|
|
Total
Commercial Term
|
$153,753
|
$223,147
|
$382,360
|
$129,200
|
($18,208)
|
$394,947
|
$174,141
|
$53,486
|
$361,914
|
$1,854,740
|
|
Location
as % Total - Term
|
-1.7%
|
1.5%
|
0.0%
|
-1.3%
|
-2.1%
|
2.3%
|
-0.2%
|
0.2%
|
1.2%
|
-0.1%
|
|
|
|
|
|
|
|
|
|
|
|
|
|
Residential
Construction
|
|
|
|
|
|
|
|
|
|
|
|
Single Family
Housing
|
($809,719)
|
($168,964)
|
($441,724)
|
($168,347)
|
($93,182)
|
($268,268)
|
($320,242)
|
$16,693
|
($41,115)
|
($2,294,868)
|
|
Land
Acquisition & Development
|
($469,720)
|
($75,039)
|
($176,116)
|
($146,639)
|
($19,509)
|
($152,347)
|
($99,882)
|
($22,358)
|
($40,910)
|
($1,202,521)
|
|
Total
Residential Construction
|
($1,279,439)
|
($244,003)
|
($617,840)
|
($314,986)
|
($112,691)
|
($420,615)
|
($420,124)
|
($5,665)
|
($82,025)
|
($3,497,389)
|
|
|
|
|
|
|
|
|
|
|
|
|
|
Commercial
Construction
|
|
|
|
|
|
|
|
|
|
|
|
Industrial
|
($45,627)
|
$497
|
($7,512)
|
($26,003)
|
($3,515)
|
($4,034)
|
($2,938)
|
$2,000
|
($167)
|
($87,298)
|
|
Office
|
($98,769)
|
$12,253
|
$18,659
|
($64,847)
|
$29,778
|
$91,682
|
($6,804)
|
($8,879)
|
($8,789)
|
($35,714)
|
|
Retail
|
($76,236)
|
$804
|
($16,504)
|
($115,613)
|
$14,346
|
($168,465)
|
($5,739)
|
($5,953)
|
($21,360)
|
($394,719)
|
|
Hotel/Motel
|
($30,455)
|
$21,623
|
$28,397
|
$15,153
|
($8,291)
|
$47,247
|
($36,068)
|
$0
|
($5,373)
|
$32,234
|
|
A&D
|
($103,220)
|
($24,062)
|
$15,248
|
($155,852)
|
$31,217
|
($424,635)
|
$50,052
|
($10,738)
|
($26,034)
|
($648,026)
|
|
Medical
|
($12,649)
|
$0
|
($13,690)
|
($11,098)
|
($2,572)
|
($3,643)
|
($2,643)
|
$8,400
|
($10,448)
|
($48,344)
|
|
Recreation/Restaurant
|
($10,899)
|
$0
|
$748
|
$2,173
|
$0
|
($161)
|
$589
|
$0
|
$0
|
($7,550)
|
|
Other
|
($66,376)
|
($4,150)
|
($39,488)
|
($32,803)
|
($2,863)
|
$32,390
|
$1,246
|
($9,638)
|
($277,446)
|
($399,128)
|
|
Apartments
|
($89,201)
|
($8,900)
|
($51,526)
|
($9,306)
|
$13,434
|
$40,259
|
($9,791)
|
($55,376)
|
($47,039)
|
($217,447)
|
|
Total
Commercial Construction
|
($533,432)
|
($1,935)
|
($65,668)
|
($398,196)
|
$71,534
|
($389,360)
|
($12,096)
|
($80,184)
|
($396,656)
|
($1,805,992)
|
|
TOTAL
CONSTRUCTION
|
($1,812,871)
|
($245,938)
|
($683,508)
|
($713,182)
|
($41,157)
|
($809,975)
|
($432,220)
|
($85,849)
|
($478,681)
|
($5,303,381)
|
|
Location
as % Total -
Construction |
-9.1%
|
-0.8%
|
-0.9%
|
-1.3%
|
2.7%
|
8.1%
|
2.1%
|
0.1%
|
-0.9%
|
0.0%
|
|
|
|
|
|
|
|
|
|
|
|
|
Loan
Portfolio Net Charge Offs
(9/30/2009)
(9/30/2009)

• Fixed-rate
loans:
– 26% of
portfolio
– Duration of about 1
year
• Variable-rate
loans:
– 74% of
portfolio
– Floors on 42% of
variable-rate loans (78% of those loans are at
the floor rate)
the floor rate)
– Continual reduction
of interest rate swaps (increasing asset
sensitivity)
sensitivity)
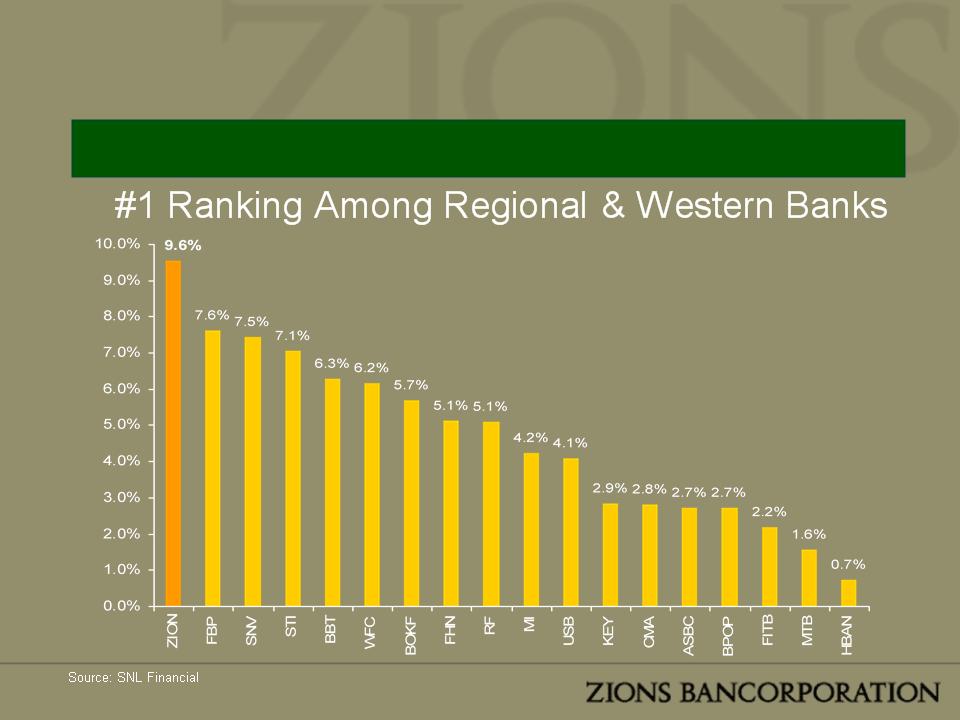
• Non-interest bearing
deposits to average earning assets
is 23% (rank #1 among peers; peer median 16%)
is 23% (rank #1 among peers; peer median 16%)
Peer
data source: SNL
Note:
Peer group includes U.S. regional banks with assets greater than $20
billion
and less than $200 billion plus footprint competitors WFC and USB.
and less than $200 billion plus footprint competitors WFC and USB.
Asset
Sensitivity
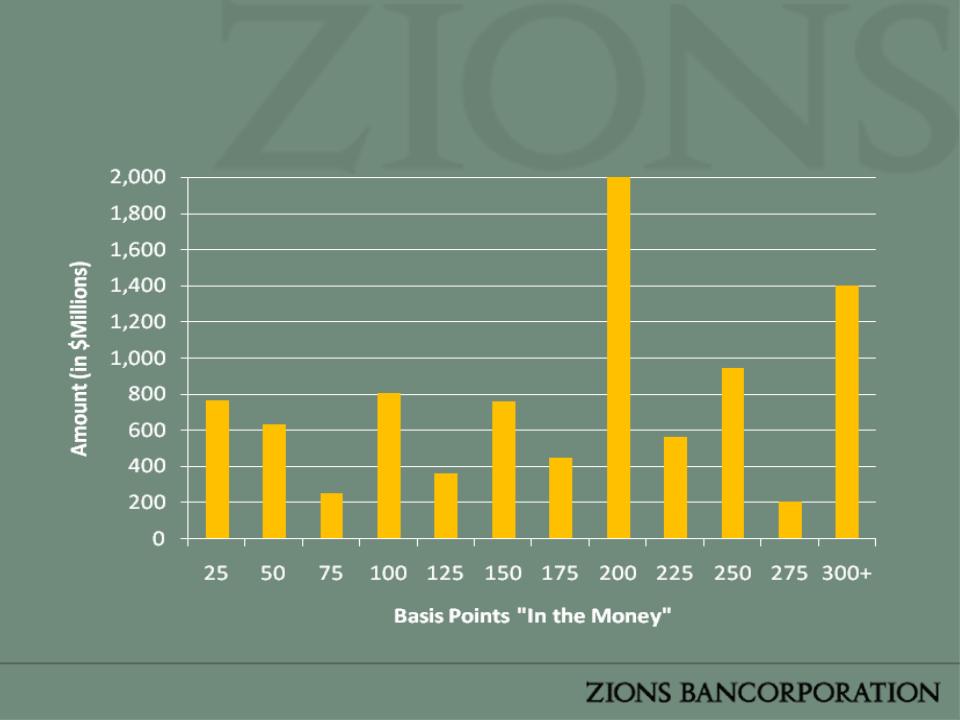
Loans
with Floors