Attached files
| file | filename |
|---|---|
| 8-K - FORM 8-K REG FD MERRILL LYNCH PRESENTATION - Celanese Corp | form8k_regfdmlpres.htm |

Celanese
Corporation
December
2009

2
Forward
Looking Statements
Reconciliation
and Use of Non-GAAP Measures to U.S. GAAP
Forward-Looking
Statements
This
presentation may contain “forward-looking statements,” which include information
concerning the company’s plans, objectives, goals, strategies, future revenues
or performance, capital
expenditures, financing needs and other information that is not historical information. When used in this release, the words “outlook,” “forecast,” “estimates,” “expects,” “anticipates,” “projects,” “plans,” “intends,”
“believes,” and variations of such words or similar expressions are intended to identify forward-looking statements. All forward-looking statements are based upon current expectations and beliefs and various
assumptions. There can be no assurance that the company will realize these expectations or that these beliefs will prove correct. There are a number of risks and uncertainties that could cause actual results to differ
materially from the forward-looking statements contained in this release. Numerous factors, many of which are beyond the company’s control, could cause actual results to differ materially from those expressed as
forward-looking statements. Certain of these risk factors are discussed in the company’s filings with the Securities and Exchange Commission. Any forward-looking statement speaks only as of the date on which it is
made, and the company undertakes no obligation to update any forward-looking statements to reflect events or circumstances after the date on which it is made or to reflect the occurrence of anticipated or
unanticipated events or circumstances.
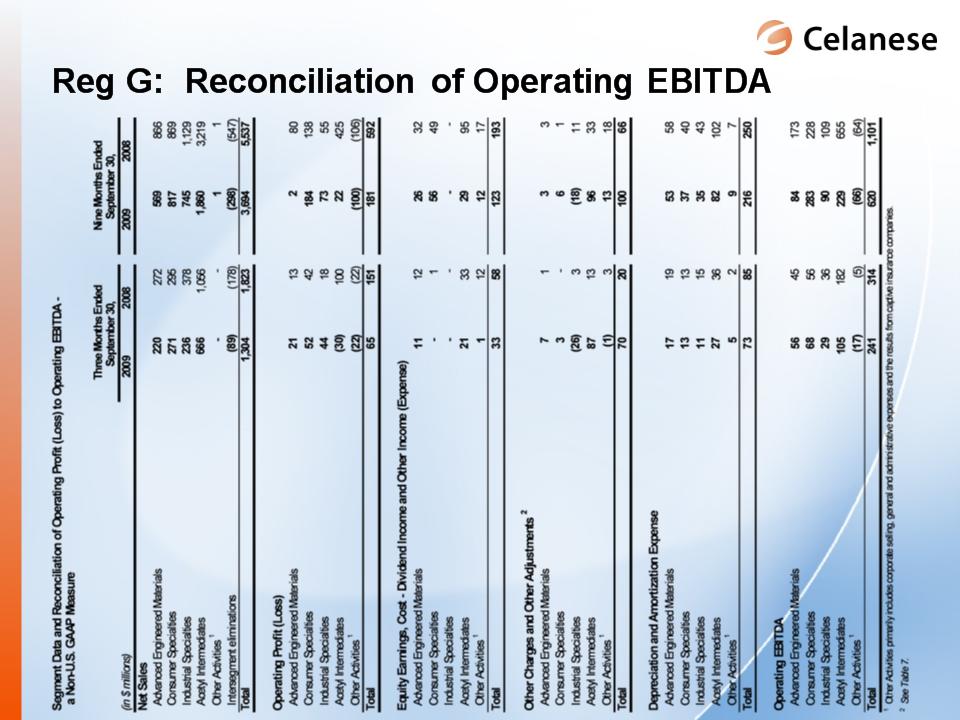
Reconciliation
of Non-U.S. GAAP Measures to U.S. GAAP
This
presentation reflects five performance measures, operating EBITDA, affiliate
EBITDA, adjusted earnings per share, net debt and adjusted free cash flow, as
non-U.S. GAAP measures. The
most directly comparable financial measure presented in accordance with U.S. GAAP in our consolidated financial statements for operating EBITDA is operating profit; for affiliate EBITDA is equity in net earnings of
affiliates; for adjusted earnings per share is earnings per common share-diluted; for net debt is total debt; and for adjusted free cash flow is cash flow from operations.
Use
of Non-U.S. GAAP Financial Information
►Operating
EBITDA, a measure used by management to measure performance, is defined as
operating profit from continuing operations, plus equity in net earnings from
affiliates, other income and depreciation and
amortization, and further adjusted for other charges and adjustments. We may provide guidance on operating EBITDA and are unable to reconcile forecasted operating EBITDA to a U.S.GAAP financial measure
because a forecast of Other Charges and Adjustments is not practical. Our management believes operating EBITDA is useful to investors because it is one of the primary measures our management uses for its
planning and budgeting processes and to monitor and evaluate financial and operating results. Operating EBITDA is not a recognized term under U.S. GAAP and does not purport to be an alternative to operating
profit as a measure of operating performance or to cash flows from operating activities as a measure of liquidity. Because not all companies use identical calculations, this presentation of operating EBITDA may not
be comparable to other similarly titled measures of other companies. Additionally, operating EBITDA is not intended to be a measure of free cash flow for management’s discretionary use, as it does not consider
certain cash requirements such as interest payments, tax payments and debt service requirements nor does it represent the amount used in our debt covenants.
►Affiliate
EBITDA, a measure used by management to measure performance of its equity
investments, is defined as the proportional operating profit plus the
proportional depreciation and amortization of its equity
investments. Affiliate EBITDA, including Celanese Proportional Share of affiliate information on Table 8, is not a recognized term under U.S. GAAP and is not meant to be an alternative to operating cash flow of the
equity investments. The company has determined that it does not have sufficient ownership for operating control of these investments to consider their results on a consolidated basis. The company believes that
investors should consider affiliate EBITDA when determining the equity investments’ overall value in the company.
►Adjusted
earnings per share is a measure used by management to measure performance. It is
defined as net earnings (loss) available to common shareholders plus preferred
dividends, adjusted for other charges
and adjustments, and divided by the number of basic common shares, diluted preferred shares, and options valued using the treasury method. We may provide guidance on an adjusted earnings per share basis and
are unable to reconcile forecasted adjusted earnings per share to a GAAP financial measure without unreasonable effort because a forecast of Other Items is not practical. We believe that the presentation of this
non-U.S. GAAP measure provides useful information to management and investors regarding various financial and business trends relating to our financial condition and results of operations, and that when U.S.
GAAP information is viewed in conjunction with non-U.S. GAAP information, investors are provided with a more meaningful understanding of our ongoing operating performance. This non-U.S. GAAP information is
not intended to be considered in isolation or as a substitute for U.S. GAAP financial information.
►The
tax rate used for adjusted earnings per share approximates the midpoint in a
range of forecasted tax rates for the year, excluding changes in uncertain tax
positions, discrete items and changes in
management’s assessments regarding the ability to realize deferred tax assets. We analyze this rate quarterly and adjust if there is a material change in the range of forecasted tax rates; an updated forecast would
not necessarily result in a change to our tax rate used for adjusted earnings per share. The adjusted tax rate is an estimate and may differ significantly from the tax rate used for U.S. GAAP reporting in any given
reporting period. It is not practical to reconcile our prospective adjusted tax rate to the actual U.S. GAAP tax rate in any future period.
►Net
debt is defined as total debt less cash and cash equivalents. We
believe that the presentation of this non-U.S. GAAP measure provides useful
information to management and investors regarding changes to
the company’s capital structure. Our management and credit analysts use net debt to evaluate the company's capital structure and assess credit quality. This non-U.S. GAAP information is not intended to be
considered in isolation or as a substitute for U.S. GAAP financial information.
the company’s capital structure. Our management and credit analysts use net debt to evaluate the company's capital structure and assess credit quality. This non-U.S. GAAP information is not intended to be
considered in isolation or as a substitute for U.S. GAAP financial information.
►Adjusted
free cash flow is defined as cash flow from operations less capital
expenditures, other productive asset purchases, operating cash from discontinued
operations and certain other charges and adjustments.
We believe that the presentation of this non-U.S. GAAP measure provides useful information to management and investors regarding changes to the company’s cash flow. Our management and credit analysts use
adjusted free cash flow to evaluate the company’s liquidity and assess credit quality. This non-U.S. GAAP information is not intended to be considered in isolation or as a substitute for U.S. GAAP financial
information.
Results
Unaudited
The
results presented in this presentation, together with the adjustments made to
present the results on a comparable basis, have not been audited and are based
on internal financial data furnished to management.
Quarterly results should not be taken as an indication of the results of operations to be reported for any subsequent period or for the full fiscal year.
Quarterly results should not be taken as an indication of the results of operations to be reported for any subsequent period or for the full fiscal year.

3
Celanese
($
million)
2009
3Q YTD Revenue: $3,694
2009
3Q YTD Op. EBITDA: $620
Consumer
Specialties
2009
3Q YTD Revenue: $817
2009
3Q YTD Op. EBITDA: $283
Advanced
Engineered
Materials
Materials
2009
3Q YTD Revenue $569
2009
3Q YTD Op. EBITDA: $84
Industrial
Specialties
2009
3Q YTD Revenue: $745
2009
3Q YTD Op. EBITDA: $90
Acetyl
Intermediates
2009
3Q YTD Revenue: $1,860
2009
3Q YTD Op. EBITDA: $229
Strong
financial performance in a challenging year
Celanese
diversified portfolio delivers
shareholder value through leading franchises
shareholder value through leading franchises

4
|
|
Portfolio
Characteristics
|
Financial
Impact
|
|
Acetyl
Intermediates
(Acetic
Acid, Vinyl Acetate
Monomer, Acetyl Derivatives) |
► A global
leader
► Advantaged
technology
► Superior cost
position
|
► Capital
efficient
► More stable
EBITDA
|
|
Advanced
Engineered
Materials (Engineered
Thermoplastics and
Polymers) |
► Industry-leading
technology
► Strong product
pipeline
|
► Higher
growth
► Margin
expansion
|
|
Industrial
Specialties
(Vinyl
Emulsions and Polymers)
|
► Upstream
integration
► Emerging
economy opportunities
► Growth through
innovation
|
► Asia
growth
► Increased
demand for low VOC
|
|
Consumer
Specialties
(Acetate
Flake and Tow, High
Intensity Food Sweetener) |
► Stable cash
generation
► Industry-leading
partnerships in
Asia |
► Cash
flow
► Stable
|
Balanced
portfolio creates a unique hybrid business model
Portfolio
well-positioned to deliver and
execute
execute

5
Divest
non-core assets and
revitalize underperforming
businesses
revitalize underperforming
businesses
Aggressively
align
with our customers
and their markets to
capture growth
and their markets to
capture growth
Participate
in
businesses
where we have
a
sustainable competitive
advantage
advantage
Leverage
and build on
advantaged positions that
optimize our portfolio
advantaged positions that
optimize our portfolio
FOCUS
GROWTH
REDEPLOYMENT
INVESTMENT
Celanese
Strategic
Pillars
Strategic
Pillars
Celanese’s
strategic DNA remains consistent

6
► Balanced footprint
in key
regions
regions
► Recovering
conditions in key
end-use industries
end-use industries
► Attractive balance
sheet with
strong cash generation
strong cash generation
Geographic
Demand
Capital
Structure
► Sustainable fixed
spending
reductions
reductions
► Efficient and
scalable capital
► Global macro trends
driving
customer growth
customer growth
Operating
Innovation
Celanese
Advantages Celanese
Levers of Value
Increasing
the earnings power of the business through multiple levers
Why
Celanese? Why
Celanese Now?
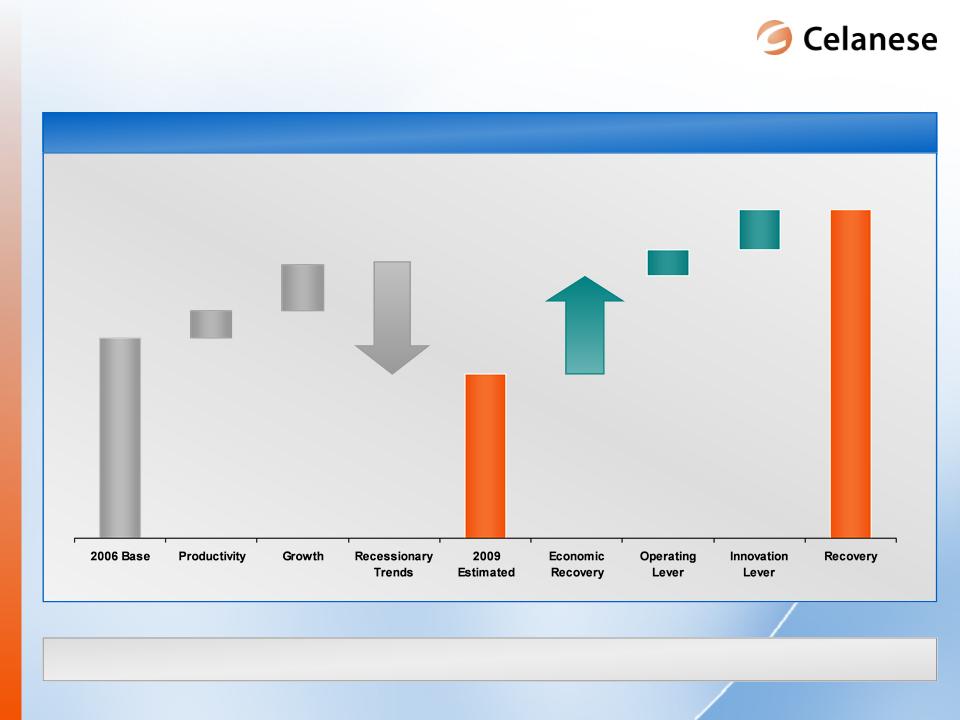
7
Operating
EBITDA
~$1,100
million
$1,600-1,800
million
Second
half 2009 performance provides platform for future growth
Increased
earnings power drives significant
shareholder value
shareholder value

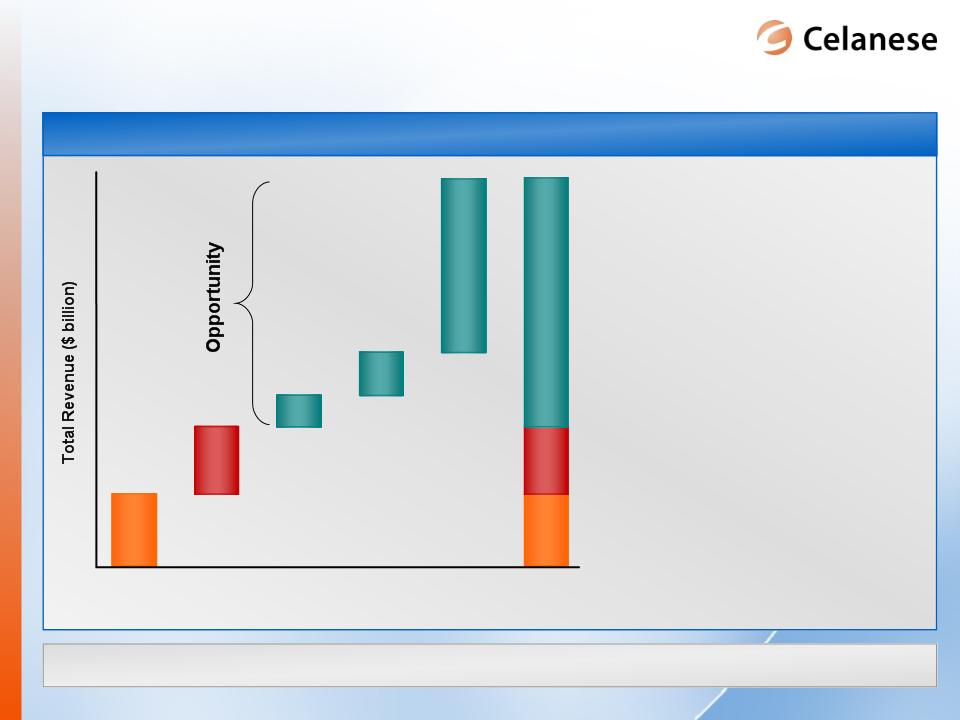
8
Earnings
power of portfolio expected to double from today’s level
|
|
|
|
Expanded
Earnings Power
|
|||||
|
|
Group
|
Capital
Structure Lever |
Demand
Lever |
Geographic
Lever |
|
Operating
Lever |
Innovation
Lever |
2009E
to
Recovery EBITDA Growth* |
|
|
Advanced
Engineered Materials |
|
X
|
X
|
|
X
|
X
|
$275-325MM
|
|
Consumer
Specialties |
|
|
X
|
|
X
|
|
$10-60MM
|
|
|
|
X
|
X
|
|
X
|
X
|
$275-375MM
|
||
|
Industrial
Specialties |
|
X
|
X
|
|
X
|
X
|
$75-125MM
|
|
*
“2009 to Recovery EBITDA Growth” based on Nov. 20, 2009 first call consensus
EBITDA estimate and management’s previous Recovery range of $1.6 - 1.8
billion.
Levers
build significant earnings power of
the portfolio
the portfolio

9
Recent
strategic actions build earnings power of portfolio
► MOU announced for
Acetate
expansion project with current
China partner
expansion project with current
China partner
Consumer
Specialties
Specialties
► 2011+: Increased
earnings
through JV dividends
through JV dividends
► Nanjing VAE /
Emulsion
capacity expansion
capacity expansion
Industrial
Specialties
Specialties
► 2011+: Volume
expansion
supporting
growth in China
Well
defined path forward - delivering
today
today
► Nanjing successfully
expanded
to 1.2 kt/a acid capacity
to 1.2 kt/a acid capacity
► Pardies site closure
project on
schedule for completion end of
2009
schedule for completion end of
2009
► Jiangxi Jiangwei VAM
sourcing
agreement
agreement
Acetyl
Intermediates
Intermediates
► 2010+: $40-50
million
operating
margin
improvement
► Strengthen
derivatives
position
position
► Launch of innovative
impact
modified POM
modified POM
Advanced
Engineered
Materials
Engineered
Materials
► 2010+: $500
million
application opportunity
growth
application opportunity
growth
10
Automotive
Opportunity
► Current
“best-in-class”
translation to all models
yields translation
opportunity
translation to all models
yields translation
opportunity
► Westernization
of current
China production drives
China opportunity
China production drives
China opportunity
► Successful
commercialization of
application R&D creates
pipeline opportunity
commercialization of
application R&D creates
pipeline opportunity
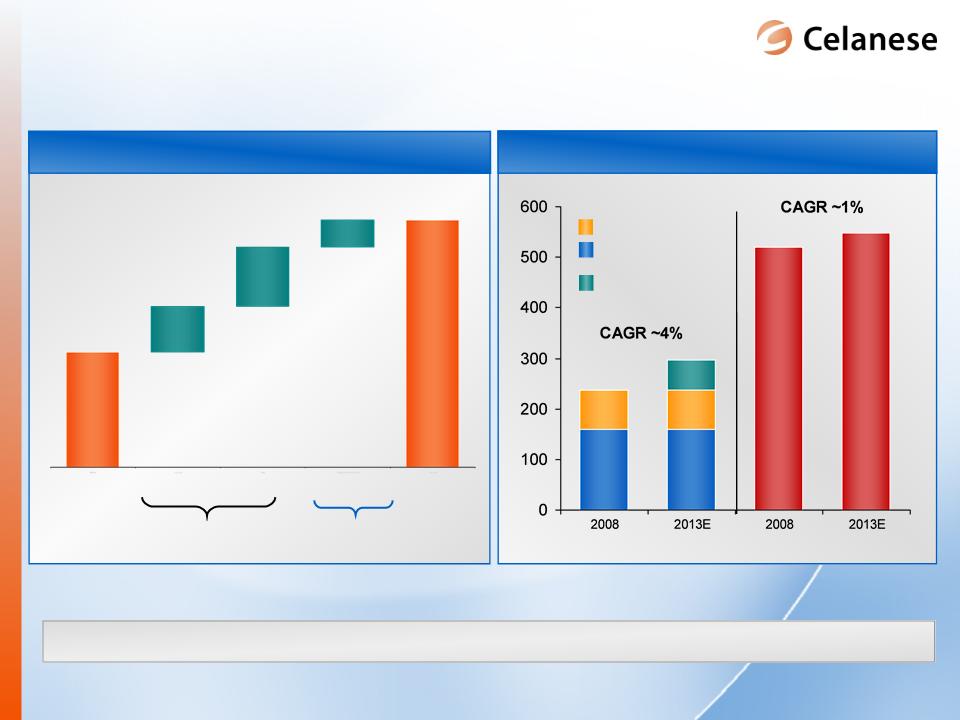
3.0
Total
AEM
Today
Total
Competitors
Today
Translation
China
Pipeline
Total
Opportunity
Opportunity
Significant
opportunities exist in ~$3 billion industry space
AEM: Application
development creates
current - and future - opportunities
current - and future - opportunities

11
Improvement
in POM Technical
Performance
Performance
New
Ticona
POM Space
POM Space
Existing
POM
Space
Increase
weldline strain @ break %
Technology
enables additional $500 million application space
opportunity
opportunity
Automotive
Applications
► Chemical
resistance
► Superior impact
& weldline strength
► Elevated heat
deflection temperature
Industrial
Applications
► Higher stiffness
(Modulus)
► Improved slip &
wear performance
► Less mold
deposit
Consumer
Applications
► Design
freedom
► Superior impact and
weldline strength
Incremental
$500 Million
Application Opportunity
Application Opportunity
Ticona:
Growing application space through
innovation
innovation
12
Source:
Celanese internal estimates
MOU
announced for expansion project with current China partner
kT
China
ROW
Chinese
Imports
Chinese
Domestic
Production
Production
Tow
Demand Growth
Additional
Demand
Growth
Growth
$230
million
Operating
EBITDA
2005
Base
Productivity
Recovery
Growth
Operating
&
Innovation
2006
- 2010
Strategic Objectives
Strategic Objectives
>$50
million
2009
to “Recovery”
Strategic Objectives
Strategic Objectives
$20-30
million
$350-400
million
CS:
Acetate Tow demand in China will drive
worldwide growth
worldwide growth

13
A
Growing
Franchise
Franchise
► Proven execution and
leadership capability
► Significant value
from downstream derivatives
► Build upon
advantages to optimize returns over the
long-term
long-term
► Long-term growth
rates in excess of GDP
► Favorable position
on a steep industry cost curve
► Advantaged raw
material and conversion position
► Flexible
manufacturing and low-cost capacity
An
Advantaged
Business in an
Attractive Industry
Business in an
Attractive Industry
Technology
leadership at the heart of Acetyl competitive position
AI: A
growing franchise in an attractive industry

14
► Manufacturing
realignment and
Nanjing expansion
further improving cost
position
realignment and
Nanjing expansion
further improving cost
position
► Reinvestment
economics challenged
for non-leading
technologies
economics challenged
for non-leading
technologies
2009/2011E
Acetic Acid Cost Curve (kT)
By
Prod
Avg
Other Leading
Technology
Effective
Industry Utilization Rates
Ethylene
Highest
Cost
China MeOH
China MeOH
Ethanol
Average
Celanese
Lower
Cost
China MeOH
China MeOH
Source:
Celanese internal estimates
Pricing
for CE to
earn
>15% EBITDA
AI: New
capacity not expected to impact
Celanese’s advantaged position
on the cost curve
Celanese’s advantaged position
on the cost curve
15
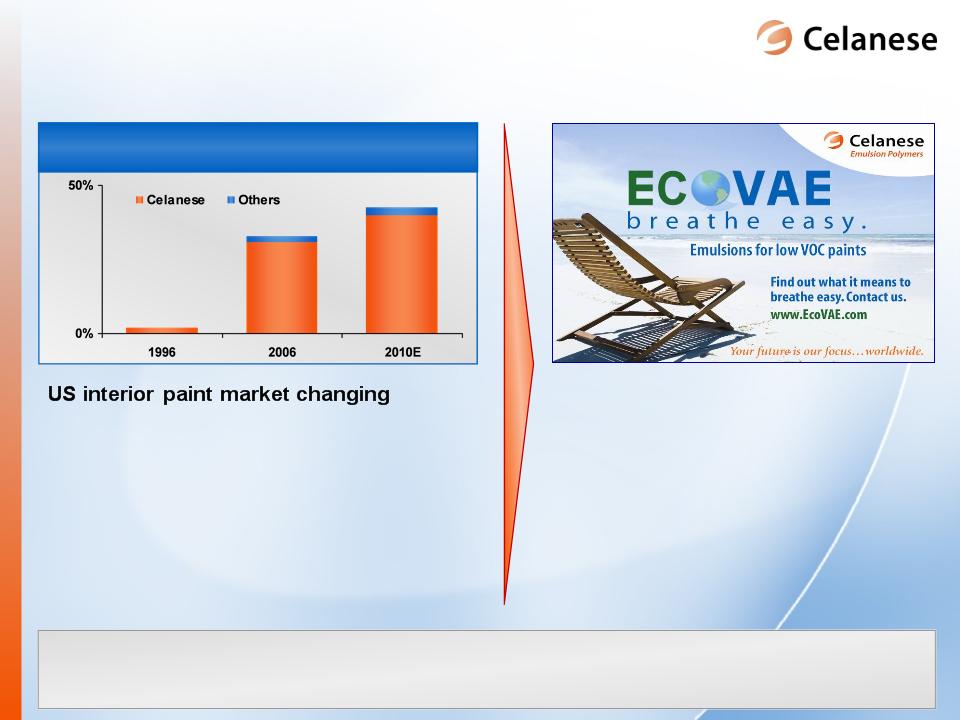
IS: Global
leader in emulsions systems for
environmentally-friendly paints and coatings
environmentally-friendly paints and coatings
► Consumer perception
favoring “greener”
building products
building products
► Regulation shifting
to low-VOC content
► Celanese building
off of a European
leadership position
leadership position
Global
opportunity of $400-500 million - Nanjing expansion
announced to meet growing China demand
announced to meet growing China demand
European
VAE Growth
Celanese
EcoVAE®
Progress
► 14 new customers
utilizing EcoVAE®
► Projects with six
major paint producers
► Launching new
EcoVAE®
products
• Low-VOC exterior
paint
• Acrylic replacement
in Non-Flats
► Expanding
EcoVAE® products
to Asia

16
Productivity
Driven
Tax
Rate
Represents
approximately $1.00 per share in
2010
earnings improvement
2010
Earnings Improvement
► AEM: Destocking
complete
► AI: Technology,
2009 FIFO effect
► IS: Asia
growth focus
► CS: Sustain
performance
► Pardies &
Cangrejera closures
► Other manufacturing
realignment
► SG&A
realignment
► Sustain lower tax
rate
► Benefits of
manufacturing and
administrative
restructuring
► Cash taxes rate
expected
to be
similar
Volume
Driven
$80
- $100
At
least $100
Low
20% range
vs. 29%
vs. 29%
$
in millions

17
Strong
cash generation continues throughout economic cycle
|
2010E
Cash Generation off EBITDA Base
|
||
|
$
in
millions
|
2010E
|
Comments
|
|
Cash
Taxes
|
$140
- $160
|
Consistent
with earnings growth and lower tax rate
|
|
Capital
Expenditures
|
$240
- $260
|
Continued
focus on cost reduction and growth
through Nanjing VAE expansion |
|
Reserve/Other
|
$110
- $130
|
Increase
primarily related to fixed spending
reduction efforts |
|
Net
Interest
|
$200
- $210
|
Unchanged
from 2009
|
|
Pension
|
$40
- $50
|
No
significant increase expected in 2010
|
|
Adjusted
Free Cash
Outflows |
$730
- $810
|
|
Hybrid
portfolio well positioned

18
|
Available
Cash
|
|
|
Cash
(as
of 9/30/2009)
|
$1,293
|
|
Kelsterbach
Spending
|
~($300)
|
|
Operating
Cash
|
~($300)
|
|
Cash
Available for
Strategic Purposes |
~$700
|
► Ticona
Kelsterbach relocation
cash flow neutral through end of
2010
cash flow neutral through end of
2010
► Expect
to continue to generate
positive free cash flow
positive free cash flow
► Productivity
investments
expected to be self-funding
expected to be self-funding
Significant
cash available for strategic purposes after anticipated
cash commitments
cash commitments
$
million
Positive
cash generation and portfolio
improvements enhance our cash position
improvements enhance our cash position

19
Term
Loan - $2.8 billion
Other
Debt Obligations - $775 million
Cash
- $1.3 billion
Net
Debt - $2.3 billion
Revolver
- $600 million
Cost
Stability
Flexibility
Structure
Characteristics
Primary
Components
Solid
liquidity position and covenant-lite term loan create
advantaged capital structure
advantaged capital structure
Credit
Linked Facility - $136 million
Celanese
capital structure

20
Why
Celanese? Why
Celanese Now?
Significant
value upside over current share price
Geographic
Demand
Capital
Structure
Operating
Innovation
Track
record
of execution
of execution
High
return
opportunities
opportunities
► $1.6-1.8 billion
recovery
earnings
earnings
► Rapid earnings
growth of
the current base -
$1.00/share growth in
2010
the current base -
$1.00/share growth in
2010
► Over $2 billion of
cash
generation through 2014
generation through 2014
► Returns continue
to
exceed weighted
average cost of capital
exceed weighted
average cost of capital
► More stable
earnings
profile
profile
Levers
of Value Shareholder
Value

Celanese
Corporation
December
2009

22
Acetyl
Intermediates
Industrial
Specialties
Advanced
Engineered Materials
Consumer
Specialties
JVs
Dividends
PVOH
Divesture
3Q
2009
Segment
Operating EBITDA Recovery
23
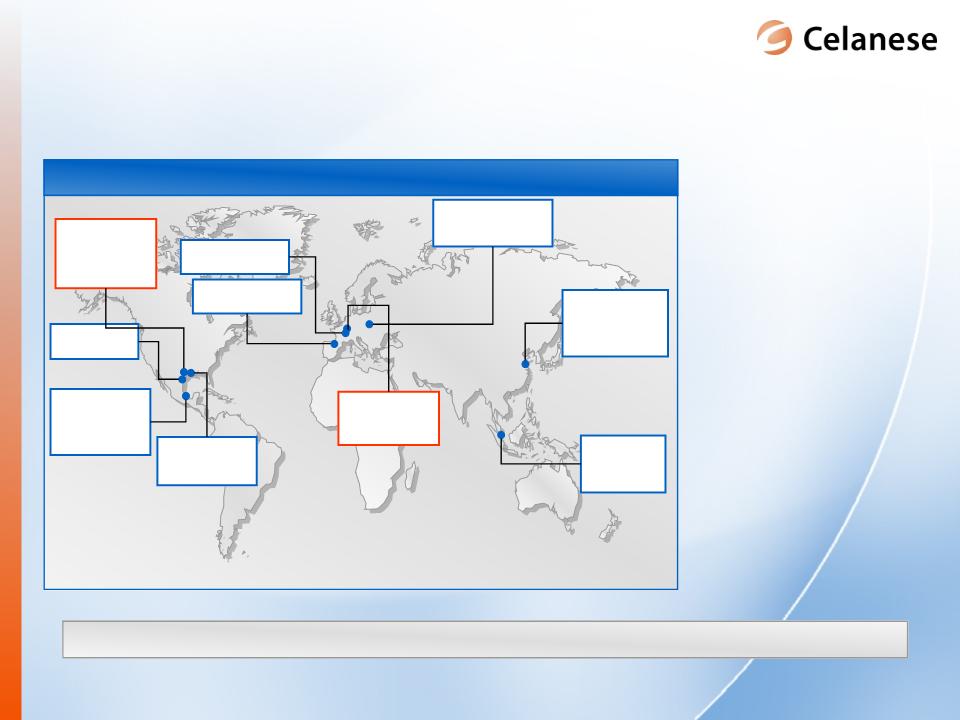
Celanese
Global Manufacturing Locations
All
values shown in kT per year
Singapore
Acid =
600
VAM =
210
Esters =
130
Frankfurt,
Germany
VAM =
285
Esters =
40
Tarragona,
Spain
VAM =
200
Bay
City, TX
VAM =
300
Clear
Lake, TX
Acid =
1,200
VAM = 310
Cangrejera,
Mexico
Mexico
Anhydride = 90
Esters =
105
VAM =
115
Pardies,
France
(announced
closure)
Acid =
440
VAM =
150
Nanjing,
China
Acid =
1,200
(expansion)
VAM = 300
(expansion)
VAM = 300
Anhydride =
100
► Utilization of
all
global Celanese
acetic acid and
downstream sites to
meet global customer
needs
global Celanese
acetic acid and
downstream sites to
meet global customer
needs
► Ensure all
Celanese
sites have a leading
cost structure
sites have a leading
cost structure
► Strategy to
remove
high cost facilities
high cost facilities
Roussillon,
France
Anhydride =
30
Celanese
well-positioned globally to meet changing demand landscape
Pampa,
TX
(site
closed)
Acid =
290
Anhydride =
145
Esters =
60
Leading
global footprint positioned to meet
customer demand
customer demand
24
|
Company
|
Capacity
|
2007
|
2008
|
2009
|
2010
|
2011
|
|
BP
/ Sinopec
|
550
kt
|
|
|
|
|
|
|
Sipchem
|
430
kt
|
|
|
|
|
|
|
Sopo
(expansion)
|
600
kt
|
|
|
|
||
|
Wujing
(expansion)
|
500
kt
|
|
|
|
|
|
|
Yangkuang
Cathay
|
350
kt
|
|
|
|
|
|
|
Henan
Shunda
|
200
kt
|
|
|
|
|
HC
|
|
Tianjin
Bohei
|
200
kt
|
|
|
|
HC
|
|
|
Hualu
Hensheng
|
200
kt
|
|
|
|
|
HC
|
|
Henan
Yima
|
200
kt
|
|
|
|
||
|
Yunan
Yunwei
|
200
kt
|
|
|
|
|
|
|
Kingboard
|
400
kt
|
|
|
|
|
|
A
A
A
A
A
A
A
A
X
X
X
X
X
X
X
X
X
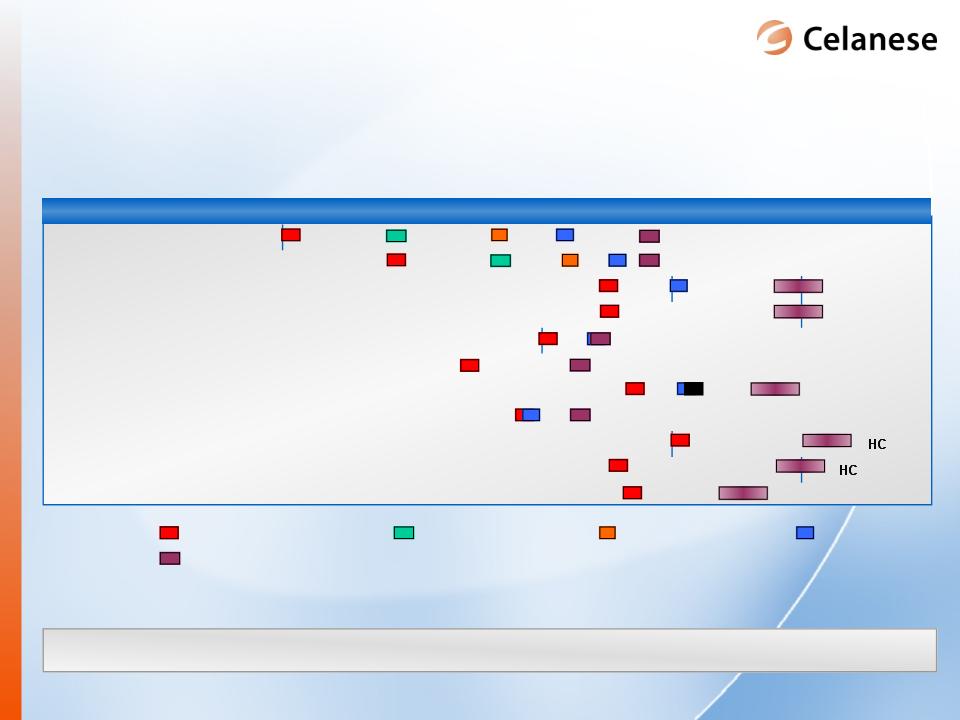
Company
Announced Startup
Current
Update
A
CE 2005
Update
SU
=
Actual plant startup
X
CE 2006
Update
HC
= Highest Cost
X
CE 2007
Update
X
X
X
X
X
X
X
SU
X
SU
Viability
of many higher cost projects is in question
1Celanese internal
analysis and opinion
?
A
SU
X
A
A
?
Timing
in question
Timing
in question
Forecast
Capacity Expansions1
Delays
in project startups likely to continue

25
Majority
of announced capacity additions challenged in today’s
pricing environment
pricing environment
1Source: Celanese
internal estimates, Tecnon 2008. Based on
nameplate capacity
Disadvantaged
technology
Significant
differentiation in technology of
announced expansions
announced expansions

26
Balance
for “high return” productivity and capital efficient growth
Note:
Not including Kelsterbach plant relocation
Maintain
Plant
Other
Growth
Nanjing
Productivity
Capital
Spending by Category
Efficient
use of cash
27