Attached files
| file | filename |
|---|---|
| 8-K - FORM 8-K - Argo Group International Holdings, Ltd. | d8k.htm |
 Investor Presentation December 2009 Exhibit 99.1 |
 2. Forward-Looking Statements This presentation contains “forward-looking statements” which are made pursuant to the safe harbor provisions of the Private Securities Litigation Reform Act of 1995. The
forward-looking statements are based on the Company's current
expectations and beliefs concerning future developments and their potential
effects on the Company. There can be no assurance that actual developments
will be those anticipated by the Company. Actual results may differ materially from those projected as a result of significant risks and uncertainties, including
non-receipt of the expected payments, changes in interest rates, effect
of the performance of financial markets on investment income and fair values of investments, development of claims and the effect on loss reserves, accuracy in projecting loss reserves, the impact of competition and pricing
environments, changes in the demand for the Company's products, the effect
of general economic conditions, adverse state and federal legislation,
regulations and regulatory investigations into industry practices,
developments relating to existing agreements, heightened competition, changes in pricing environments, and changes in asset valuations. The Company
undertakes no obligation to publicly update any forward-looking
statements as a result of events or developments subsequent to the
presentation. |
 Argo
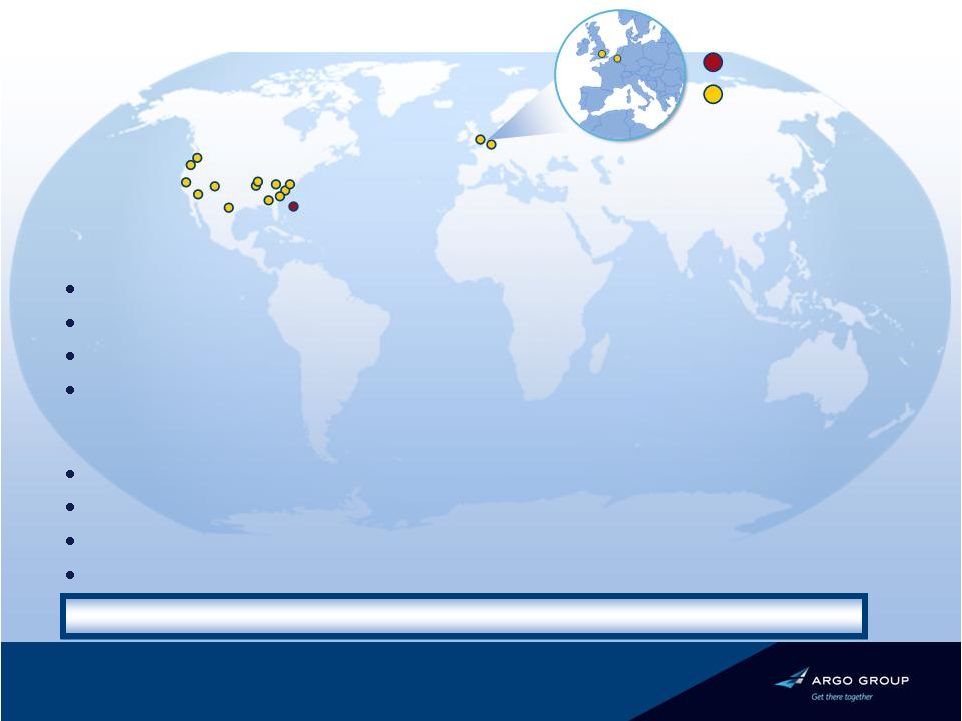
Group Today Major business segment locations Bermuda Headquarters An international specialty underwriter of property/casualty insurance and reinsurance products Headquartered in Bermuda Operations in 50 states and worldwide Total capitalization of $2.0 billion Operations conducted through four business segments Our Strategy Deploy capital in the international specialty market for maximum return Continuous focus on new business development and organic growth Grow strategically through acquisitions Prudent management of our balance sheet and investment portfolio Maximize shareholder value through our focus on Return on Capital Brussels London 3. |
 4. Building a Specialty Platform Goal Execution Status • Expand US Excess and Surplus franchise and broaden US specialty platform • Acquired Colony and Rockwood in 2001 • Acquired the assets of Interstate and Grocers in 2005 and 2003 • Launched Public Entity business in 2001 • Acquired Massamont and Insight in 2008 • Completed 9 acquisitions of companies and asset purchases over eight years • PXRE transaction in 2007 • Launched Argo Re in 2008 • Establish Bermuda Platform • Establish Lloyd’s Platform • Heritage acquisition in 2008 • Enhance Argo’s risk profile • Significantly managed down legacy exposures • Sold PXRE’s legacy casualty exposure in 2008 • Hired CFO in 2008 • Hired Andrew Carrier as Argo Re President and Nigel Mortimer as head of Excess Casualty in 2008 • Recently Added: • International CEO: Julian Enoizi • Chief Actuary: Mike Fusco • Chief Risk Officer: Bernhard Scheifele • Chief Accounting Officer: James Tees • Bolster management ranks |
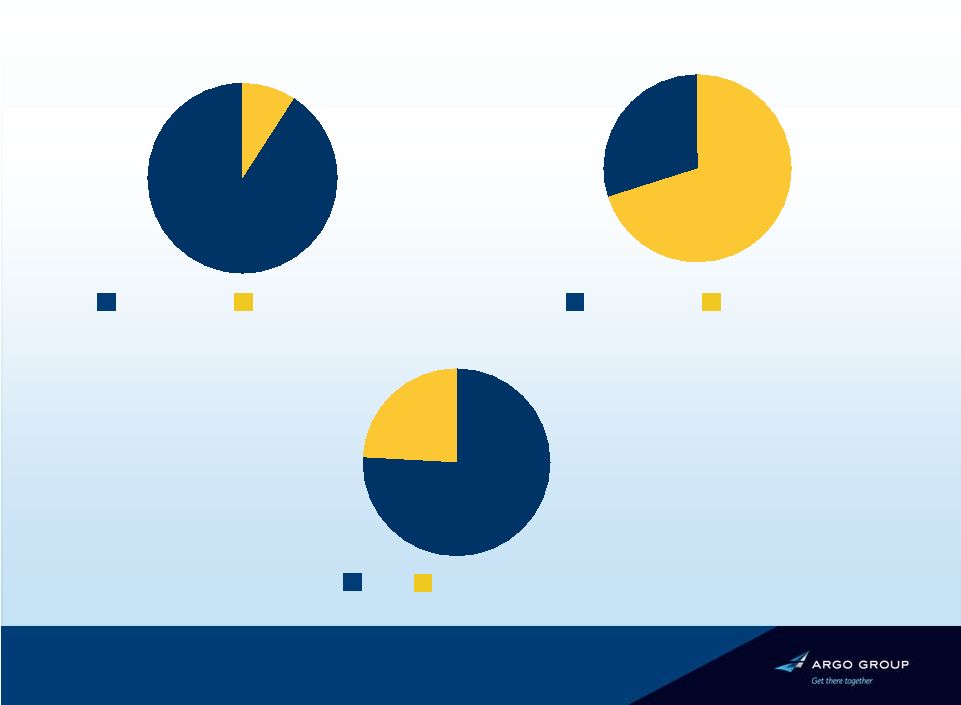 5. Argo Today – A Diversified Business Model US International YTD as of September 30, 2009 Note: Based on gross written premiums (GWP) Insurance Reinsurance Property Casualty ~70% ~30% 9% 91% 76% 24% |
 6. What We Do Combined Ratio* Insureds Segment Profile Excess and Surplus Lines •Commercial Property and Casualty on a non-admitted basis •Distribution through wholesale agents and brokers Commercial Specialty Argo International •Argo Managing Agency plc •Short-tail risks with an emphasis on commercial specialty, and non-US professional indemnity insurance 96% 56% Reinsurance •Insureds include US regional carriers and international multi- line carriers •Casualty clients are predominately US Fortune 1000 companies written on a primary basis •Argo Re (class 4 specialty reinsurance platform) •Provides property CAT reinsurance, excess casualty 98% * GWP and Combined Ratio for YTD 2009 % GWP* 31% 24% 9% 36% 96% •Representative insureds include restaurants, contractors, day care centers, apartment complexes, and others •Commercial Property and Casualty on an admitted basis •Distribution through select independent agents, brokers, wholesalers and program managers •Food and hospitality, specialty retail, grocery stores, mining industry and public entities •Insureds include US and international small/medium commercial businesses, transportation, fine arts and specie, financial institutions and others |
 7. Pre-Tax Operating Income ($mm) Excess & Surplus Lines Largest and Most Profitable Segment Status Combined ratio in low 90% range Colony, Argonaut Specialty & Argo Pro Competitive advantages Excellent infrastructure – broad geography Underwriting expertise Broad product portfolio for small account underwriters Controlled distribution Wholesale agents Benefits from a category XII ‘A’ (Excellent) rating by A.M. Best 89% 89% 93% 96% Combined Ratio $102 $113 $98 $64 2006 2007 2008 YTD 2009 |
 8. Pre-Tax Operating Income ($mm) Commercial Specialty Specialty Niche Segment Status 2008 Gross Written Premium up 21% Primarily admitted, retail-driven Competitive advantages Expertise in niche markets – grocery stores – mining operations – laundry & dry cleaners – small/medium-size public entities Benefits from a category XII ‘A’ (Excellent) rating by A.M. Best 89% 89% 97% 96% Combined Ratio $50 $61 $43 $35 2006 2007 2008 YTD 2009 |
 9. Status • Underwriting on $1.2 billion of capital today • Achieved desired diversification in second year • Appointed Andrew Carrier as Argo Re President and Nigel Mortimer as head of Excess Casualty • New casualty underwriting team in place Competitive advantages • Utilize established infrastructure • Built diversified book of business • Proven record of leadership • Benefits from a category XII ‘A’ (Excellent) rating by A.M. Best Reinsurance Argo Re – Well Established 56% 78% Pre-Tax Operating Income ($mm) Combined Ratio $25 $34 2008 YTD 2009 |
 10. Status • Acquired Heritage in May 2008 • Appointed Julian Enoizi as CEO in June 2009 • Worldwide property • Direct and Facultative • North American and International Binding Authority • Non-U.S. liability • Professional indemnity • General liability Competitive advantages • Specialist knowledge • Access to decision makers • Carries the Lloyd’s market ratings of ‘A’ (Excellent) rating by A.M. Best, and ‘A+’ by S&P Argo International Lloyd’s Underwriting Agency 97% 102% Pre-Tax Operating Income ($mm) Note: 1 Data is for the full year ending Dec. 31, 2008 Combined Ratio $11 $8 2008¹ YTD 2009 |
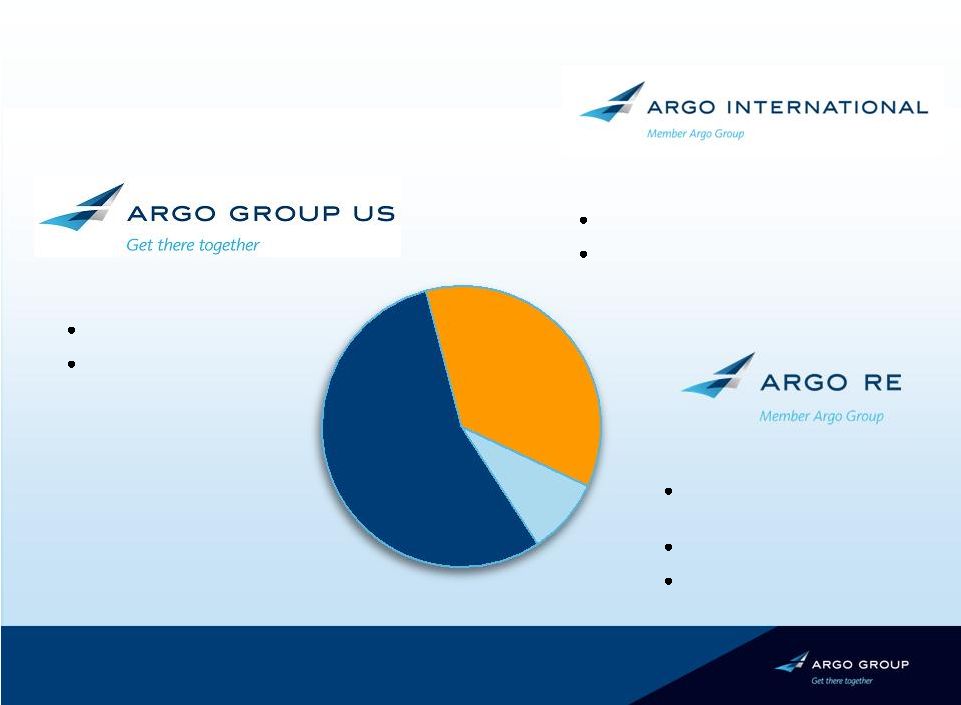 Combined Business Mix Established platform to write business worldwide and penetrate niche markets Specialty Insurance Excess & Surplus Lines Commercial Specialty Reinsurance/Insurance Quota share reinsurance of business partners Property reinsurance Excess casualty and professional liability insurance Argo International (Lloyd’s) Worldwide property insurance Non-U.S. liability 55% 9% 36% As of September 30, 2009 11. |
 12. Growth in Key Profit Drivers Net Premium Earned Gross Written Premium Investment Income $622 $1,602 2002 2008 17% CAGR $378 $1,127 2002 2008 20% CAGR $53 $150 2002 2008 19% CAGR ($mm) |
 13. $39.08 $33.52 $30.36 $27.22 $23.40 $45.15 $44.18 $51.04 2002 2003 2004 2005 2006 2007 2008 2009-Q3 Growth of Book Value BVPS Growth Since 2002 12.2% CAGR * Book value per common share - outstanding, includes the impact of the Series A Mandatory Convertible Preferred Stock on an as if converted basis. Preferred stock had fully converted into common shares
as of Dec. 31, 2007. |
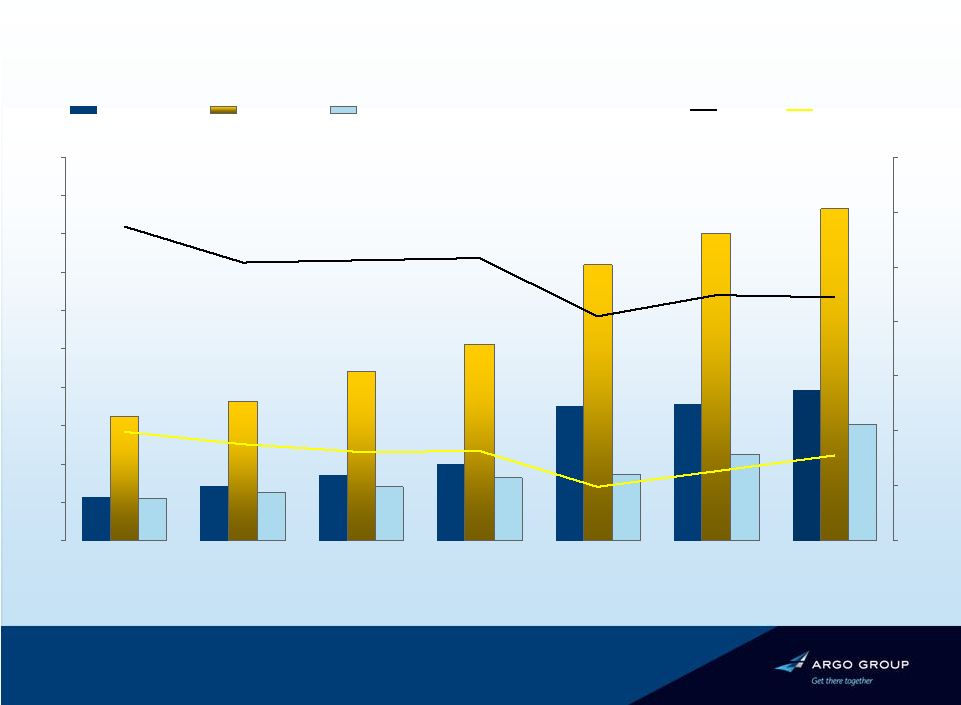 14. Significant Increases in Capital Relative to Operating Metrics $1,954 $1,624 $1,816 $2,203 $2,558 $3,598 $4,001 $4,334 $1,516 $992 $1,782 $1,754 $860 $717 $567 $1,127 $860 $813 $699 $634 $563 2.2x 0.8x 2.6x 2.9x 2.5x 2.2x 2.1x 2.6x 0.6x 0.5x 0.8x 0.8x 0.9x 1.0x 0 500 1,000 1,500 2,000 2,500 3,000 3,500 4,000 4,500 5,000 2003 2004 2005 2006 2007 2008 YTD 2009 0.0x 0.5x 1.0x 1.5x 2.0x 2.5x 3.0x 3.5x Total Capitalization Earning Assets Net Premiums Written EA Multiple NPW Multiple ($mm) Note: 1 Net Premium Written and Multiple are annualized using YTD information as of September
30, 2009 1 |
 Argo Group 2008 Financial Highlights 2007 2008 Change Gross Written Premium $ 1.18B $ 1.60B 36% Net Earned Premium $ 860M $ 1.13B 31% Total Revenue $ 1.0B $ 1.25B 25% Net Investment Income $ 134M $ 150M 12% Net Income Per Share $ 5.58 $ 2.05** 172%** Net Operating Income Per Share $ 3.71 $ 3.97 7% YTD Growth in Book Value Per Share 15.5% (2.1%) ** Impacted by $17.4mm of pre-tax losses from U.S. storms in Q2 and $74.0mm from
hurricanes Gustav and Ike in Q3. 15. |
 Argo Group 2009 Third Quarter Results 2008 Nine Months 2009 Nine Months Change Gross Written Premium $ 1.2B $ 1.6B 29% Net Earned Premium $ 803M $ 1.1B 32% Total Revenue $ 909M $ 1.2B 28% Net Investment Income $ 113M $ 113M 0% Net Income Per Share $ 1.66 $ 2.48 49% Net Operating Income Per Share $ 2.24 $ 3.26 46% YTD Growth in Book Value Per Share (2.3%) 15.5% 16. |
 Strong Balance Sheet and Capital Base In millions, except for book value and leverage data *Includes $311.4 mm of Junior Subordinated Debentures Dec 31, 2008 2,997 24.1% 1,782 1,353 6,382 $4,001 429 $44.18 Dec 31, 2007 2,245 21.0% 1,754 1,385 5,124 $3,598 369 $45.15 Reserves Total Leverage* Total Capital Shareholders’ Equity Total Assets Investment Portfolio Indebtedness* Book Value Per Share September 30, 2009 3,187 19.5% 1,954 1,573 6,821 $4,317 381 $51.04 17. |
 18. Conservative Investment Portfolio Fixed income (94%) Equities (6%) Total: $4.0bn Total: $0.3bn • Average Rating of AA+ • Duration of 3.0 years • Less than 1% subprime • Internally and externally managed • Conservative focus on large cap 32% 14% 19% 15% 15% U.S. Government State / Muni Corporate Structured Short Term Other 5% Financials Industrial & Other 17% 83% |
 19. Focus Areas for the Coming Year • Investments in people • Investment in IT • Expense savings • Controlled expansion in the US and London • Focus on clients • Focus on distribution partners • Focus on the competitive environment Internal External Premiums / Risk Selection Levers to Drive a Profitable Organization Investment Leverage / Yields Financial Leverage / Capital Structure Infrastructure Cost |
 20. Why Argo? • Broadly diversified insurance and reinsurance platform • Deep product expertise in niche focus areas • Proven track record of growth and profitability • Proven ability to manage through insurance cycle • Prudent risk management and controls • Strong leadership • Significant room for future growth • ROE driven focus |
 Thank you Q&A |