Attached files
| file | filename |
|---|---|
| EX-32.2 - EXHIBIT 32.2 CERTIFICATION OF CFO - ICO INC | exhibit32-2.htm |
| EX-31.1 - EXHIBIT 31.1 CERTIFICATION - JOHN KNAPP - ICO INC | exhibit31-1.htm |
| EX-31.2 - EXHIBIT 31.2 CERTIFICATION - BRAD LEUSCHNER - ICO INC | exhibit31-2.htm |
| EX-32.1 - EXHIBIT 32.1 CERTIFICATION OF CEO - ICO INC | exhibit32-1.htm |
| EX-10.30 - EXHIBIT 10.30 BARKMANN CIC PARTICIPATION AGREEMENT - ICO INC | exhibit10-30.htm |
| EX-10.29 - EXHIBIT 10.29 KNAPP CIC PARTICIPATION AGREEMENT - ICO INC | exhibit10-29.htm |
| EX-10.28 - EXHIBIT 10.28 PARSONS CIC PARTICIPATION AGREEMENT - ICO INC | exhibit10-28.htm |
| EX-10.27 - EXHIBIT 10.27 BRISTOW CIC PARTICIPATION AGREEMENT - ICO INC | exhibit10-27.htm |
| EX-10.26 - EXHIBIT 10.26 LEUSCHNER CIC PARTICIPATION AGREEMENT - ICO INC | exhibit10-26.htm |
UNITED STATES
SECURITIES AND EXCHANGE COMMISSION
WASHINGTON, D.C. 20549
FORM 10-K
|
[X] |
ANNUAL REPORT PURSUANT TO SECTION 13 OR 15(d) |
|
OF THE SECURITIES EXCHANGE ACT OF 1934 | |
|
For the fiscal year ended September 30, 2009 | |
|
OR | |
|
[ ] |
TRANSITION REPORT PURSUANT TO SECTION 13 OR 15(d) |
|
OF THE SECURITIES EXCHANGE ACT OF 1934 |
For the transition period from to
Commission file number 0 -10068
ICO, INC.
(Exact name of registrant as specified in its charter)
|
TEXAS |
76-0566682 |
|
(State or other jurisdiction of incorporation or organization) |
(I.R.S. Employer Identification No.) |
|
1811 Bering Drive, Suite 200 |
|
|
Houston, Texas |
77057 |
|
(Address of principal executive offices) |
(Zip Code) |
|
Title of Each Class |
Name of Exchange on Which Registered |
|
Common Stock, no par value |
Nasdaq |
Registrant's telephone number (713) 351-4100
Securities registered pursuant to Section 12(b) of the Act: Common Stock, no par value.
Securities registered pursuant to Section 12(g) of the Act: None.
Indicate by check mark if the registrant is a well-known seasoned issuer, as defined in Rule 405 of the Securities Act. Yes ___ No x
Indicate by check mark if the registrant is not required to file reports pursuant to Section 13 or Section 15(d) of the Exchange Act. Yes ___ No x
Indicate by check mark whether the Registrant (1) has filed all reports required to be filed by Section 13 or 15(d) of the Securities Exchange Act of 1934 during the preceding 12 months and (2) has been subject to such filing requirements for the past 90 days. YesxNo ___
Indicate by check mark whether the registrant has submitted electronically and posted on its corporate Web site, if any, every Interactive Data File required to be submitted and posted pursuant to Rule 405 of Regulation S-T (§232.405 of this chapter) during the preceding 12 months (or for such shorter period that the registrant was
required to submit and post such files).YES o NO o
Indicate by check mark if disclosure of delinquent filers pursuant to Item 405 of Regulation S-K is not contained herein, and will not be contained, to the best of Registrant's knowledge, in definitive proxy or information statements incorporated by reference in Part III of this Form 10-K or any amendment to this Form 10-K. [ ]
Indicate by checkmark whether the registrant is a large accelerated filer, an accelerated filer, a non-accelerated filer, or a smaller reporting company. See definition of “large accelerated filer”, “accelerated filer” and “smaller reporting company” in Rule 12b-2 of the Exchange Act.
Large accelerated filero Accelerated filer x Non-accelerated
filer o Smaller reporting companyo
Indicate by check mark whether the registrant is a shell company (as defined in Rule 12b-2 of the Act). Yes ____ Nox
The aggregate market value of common equity held by non-affiliates of the Registrant as of March 31, 2009 was $52,769,205.
The number of shares outstanding of the registrant's Common Stock as of November 23, 2009: Common Stock, no par value- 27,704,950.
DOCUMENTS INCORPORATED BY REFERENCE
|
Portions of the definitive proxy statement for the Registrant’s 2010 Annual Meeting of Shareholders are incorporated by reference in Part III of this Form 10-K. Such definitive proxy statement or the information to be so incorporated will be filed with the Securities and Exchange Commission not later than 120 days subsequent
to September 30, 2009. |
ICO, INC.
2009 FORM 10-K ANNUAL REPORT
TABLE OF CONTENTS
|
Page | ||
|
PART I |
||
|
Item 1. |
Business |
3 |
|
Item 1A. |
Risk Factors |
7 |
|
Item 1B. |
Unresolved Staff Comments |
13 |
|
Item 2. |
Properties |
13 |
|
Item 3. |
Legal Proceedings |
14 |
|
Item 4. |
Submission of Matters to a Vote of Security Holders |
15 |
|
PART II |
||
|
Item 5.
|
Market for Registrant’s Common Equity, Related Stockholder Matters and Issuer Purchases of Equity Securities |
16 |
|
Item 6. |
Selected Financial Data |
18 |
|
Item 7. |
Management’s Discussion and Analysis of Financial Condition and |
|
|
Results of Operations |
19 | |
|
Item 7A. |
Quantitative and Qualitative Disclosures About Market Risk |
38 |
|
Item 8. |
Financial Statements and Supplementary Data |
39 |
|
Item 9. |
Changes in and Disagreements with Accountants on Accounting and |
|
|
Financial Disclosure |
40 | |
|
Item 9A. |
Controls and Procedures |
40 |
|
Item 9B. |
Other Information |
40 |
|
PART III |
||
|
Item 10. |
Directors, Executive Officers and Corporate Governance |
41 |
|
Item 11. |
Executive Compensation |
41 |
|
Item 12. |
Security Ownership of Certain Beneficial Owners and Management and Related Stockholder Matters |
41 |
|
Item 13. |
Certain Relationships and Related Transactions, and Director Independence |
41 |
|
Item 14. |
Principal Accounting Fees and Services |
41 |
|
PART IV |
||
|
Item 15. |
Exhibits and Financial Statement Schedules |
42 |
P A R T I
Item 1. Business
General
ICO, Inc. (together with its subsidiaries “the Company”) was incorporated in 1978 under the laws of the State of Texas. The Company manufactures specialty resins and concentrates and provides specialized polymer processing services. The specialty resins manufactured by the Company are often produced into a powder
form. Concentrates produced by the Company generally are mixed by customers with base polymer film resins to give plastic films desired characteristics, and to reduce customers’ raw material costs. Concentrates are polymers loaded with high levels of chemical and organic additives that are melt blended into base resins to give plastic films and other finished products desired physical properties. The Company also provides toll processing services including ambient grinding,
jet milling, compounding and ancillary services for resins produced in pellet form as well as other material. These products and services are provided through our 20 operating facilities located in 9 countries in the Americas, Europe and Asia Pacific. The Company’s customers include major chemical companies, polymer production affiliates of major oil exploration and production companies, and manufacturers of plastic products.
Merger Agreement with A. Schulman
On December 2, 2009, the Company signed a definitive merger agreement with A. Schulman, Inc. (“A. Schulman”) in a combined cash and stock transaction pursuant to which 100% of the outstanding stock of the Company will be acquired by A. Schulman. Under the terms of the agreement, the total consideration is comprised
of $105.0 million in cash and 5.1 million shares of A. Schulman common stock. Closing of the transaction is subject to approval at a meeting by at least two-thirds of the votes entitled to be cast by holders of the Company's Common Stock, regulatory approvals and other customary closing conditions. The combined entity blends the companies’ technology, product development efforts, and geographic scope to generate enhanced and complementary product offerings and enhanced focus on better
solutions for customers. After the merger closes, ICO, Inc. shareholders will own approximately 16% of the combined company. The Company expects the transaction to close in the spring of 2010. See Item 1A. – “Risk Factors” and Note 17 – “Subsequent Events” in the Company’s Consolidated Financial Statements for additional discussions related to the merger agreement.
Manufacturing Capabilities
The Company’s manufacturing capabilities include size reduction, compounding and related services. These services are an intermediate step between the production of polymer resins and the manufacture of a wide variety of products such as toys, water tanks, paint, garbage bags, plastic film and other polymer products. The
Company’s manufacturing processes are used to produce powders for sale by the Company, to perform toll processing services and to manufacture concentrates.
Size reduction. Size reduction is a process whereby polymer resins produced by chemical manufacturers in pellet form are reduced to a powder form. The majority of the Company’s size reduction services involve ambient grinding, a mechanical attrition milling
process suitable for products which do not require ultrafine particle size and are not highly heat sensitive. The Company also provides jet milling services used for products requiring very fine particle size such as additives for printing ink, adhesives, waxes and cosmetics. Jet milling uses high velocity compressed air to reduce materials to sizes between 0.5 and 150 microns. For materials with specific thermal characteristics (such as heat sensitive materials), the Company provides cryogenic
milling services, which use liquid nitrogen to chill materials to extremely low temperatures.
The Company primarily processes polyethylene. Other materials processed include polyester, polypropylene, nylon, fluorocarbons, cellulose acetates, vinyls, phenolics, polyurethane, acrylics, epoxies, waxes and polylactic acid.
Compounding. Compounding is an extrusion process whereby plastics and other additives are melt blended together to form an alloy resin. Often times the Company compounds material in conjunction with providing size reduction services (typically using an ambient
grinding process). For example, the Company serves many customers by purchasing natural colored resin (“base resin”), compounding certain additives into the resin, and then grinding the resulting pellet into a powder form. The additives
3
compounded into base resin are determined based on the end products to be manufactured by the customer. Compounding is performed at most of the Company’s facilities.
Manufacturing concentrates is a specialized form of compounding. Bayshore Industrial, the Company’s largest concentrate manufacturing operation, is located in La Porte, Texas. Bayshore produces concentrates primarily for the plastic film industry. The Company also began producing concentrates in Malaysia
in 2007. The Company also has a smaller concentrate manufacturing operation, located in Oyonnax, France, which provides high quality color matching and color compounding services for the injection molding industry. The Company’s concentrate manufacturing operations involve the formulation and production of highly concentrated compounds of additives that are then combined (by the Company or by others) with polymer resins to produce materials having specifically desired characteristics, such as
anti-blocking (to prevent plastic film or sheets from sticking together), flame-retardance, color, ultraviolet stabilization, impact and tear resistance, or adhesion. The Company's concentrates are produced to the detailed specifications of customers. These customers are typically resin producers or companies that produce plastic films. The concentrate manufacturing process requires the combination of up to 25 different additives or fillers in precise proportions. To be approved as the manufacturer
of such concentrates, the Company must satisfy rigorous qualification procedures imposed by customers on a product-by-product basis. The Company works closely with its concentrate customers to research, develop and test the formulations necessary to create the desired characteristics of the concentrates to be produced. Such concentrates are produced in batches which may range from as little as five pounds for a lab sample to as large as 2,000 tons.
Other Manufacturing Services. The Company also offers its customers ancillary polymer processing services in connection with size reduction and compounding services. These ancillary services include dry blending and mixing of plastics and other additives, granulating,
packaging and warehousing.
Facilities. The Company operates seven facilities in the United States, six in Europe (located in The Netherlands, England, Italy, and France), four in Asia Pacific (located in New Zealand, Australia and Malaysia) and three in Brazil. Almost all of the Company’s
operating facilities provide toll processing services, sell products into their respective markets and are able to compound materials.
Products and Services
Product Sales. The powders produced by the Company in its manufacturing operations are most often used to manufacture household items (such as toys, household furniture and trash receptacles), automobile parts, agricultural
products (such as fertilizer and water tanks), paint and metal and fabric coatings. The Company sells primarily in the countries where it produces, but also exports its powders into Africa and Asia. The Company generally procures the raw materials for its own account and adds value using its own formulations and processes to produce powders. The Company typically performs both size reduction and compounding to produce its finished products.
The Company’s concentrate products are primarily used by its customers as additives that are melt blended with resins and then used to produce plastic films. These products are mostly sold throughout North America. The Company’s small operation in Oyonnax, France provides high quality color concentrates to the injection
molding industry in France.
Toll Processing Services. Toll processing services involve both size reduction and compounding whereby these services are performed on customer owned material for a fee. The Company considers its toll processing
services to be completed when it has processed the customer owned material and no further services remain to be performed. Pursuant to the service arrangements with its customers, the Company is entitled to collect its agreed upon toll processing fee upon completion of the toll processing services. Shipping of the product to and from our facilities is determined by and paid by its customer. The revenue the Company recognizes for toll processing services excludes the value of its
customer’s product as the Company does not take ownership of its customer’s material during any stage of the process.
In the Company’s Consolidated Statements of Operations, we have combined revenues for sales and services because service revenues did not exceed 10% of total revenues.
Customers and Pricing
The primary customers of the Company's polymers processing business are large producers of polymers (which include major chemical companies and polymers production affiliates of major oil production companies) and end users such as rotational
4
molders or companies that produce plastic films. No single customer accounted for more than 10% of worldwide sales during fiscal years 2009, 2008 or 2007. The Company has long-term contract arrangements with many polymer processing customers whereby it has agreed to process or manufacture certain polymer products for
a single or multi-year term at an agreed upon fee structure. The terms of these agreements typically do not contain minimum volume requirements or a requirement that the Company is the exclusive supplier. The revenues associated with contracts that contain minimum volume requirements or obligate the customer to purchase the products exclusively from the Company were not material during fiscal years 2009, 2008 and 2007.
The rotational molding industry is one of the Company’s more important target markets. The Company provides a portion of its size reduction toll processing services to customers that are either rotational molders or that supply the rotational molding industry. Additionally, many of the polymer powders manufactured by the
Company are supplied to the rotational molding industry. Rotational molding produces plastic products by melting pre-measured plastic powder in molds which are heated in an oven while being rotated. The melting resin adheres to the hot mold and evenly coats the mold’s surface. This process offers design advantages over other molding processes, such as injection molding, because assembly of multiple parts is unnecessary,
consistent wall thickness in the finished product can be maintained, tooling is less expensive, and molds do not need to be designed to withstand the high pressures inherent in other forms of molding. Examples of end products which are rotationally molded include agricultural tanks, toys and small recreational watercraft.
Other sizable target markets include producers of automotive carpet backing, paint, waxes, and metal and fabric coatings.
The Company is also a major supplier of concentrates to the plastic film industry in North America. These plastic films are predominantly used to produce plastic packaging. The concentrates manufactured by the Company are melt-blended into base resins to produce plastic film having the desired characteristics. The
Company sells concentrates to both resin producers and to businesses that manufacture plastic films.
The Company provides value-added polymer processing services to customers. The Company often purchases and takes into inventory the raw materials necessary to manufacture products sold to customers. The Company seeks to minimize the risk of price fluctuations in raw materials and other supplies by maintaining relatively
short order cycles; however, maintaining raw materials and finished goods inventory exposes the Company to an increased risk of price fluctuations (see "Raw Materials").
Sales and Marketing
The Company markets its products and services through a sales force of employees. These sales people are responsible for in-depth customer contact and are required to be technically knowledgeable and have an understanding of the markets they serve.
Competition
The specialty polymers processing business is highly competitive. Competition is based principally on price, quality of service, manufacturing technology, proximity to markets, timely delivery and customer service and support. The Company's size reduction and toll services competitors are generally smaller than the Company and
have fewer locations and a more regional emphasis. The Company’s competitors in the polymer powder sales business tend to be small to mid-sized. Several companies also maintain significant in-house size reduction facilities for their own use. The Company believes that it has been able to compete effectively in its markets based on competitive pricing, its network of plants, its technical expertise and equipment manufacturing capabilities and its range of services, such as
flexible storage, packaging facilities and product development. The Company also believes that its knowledge of the rotational molding industry, through activities such as participation in the Association of Rotational Molders, enhances its competitive position with this key customer group. The Company's competitors in the concentrates industry include a number of large enterprises, as well as small and mid-sized regional companies. The Company believes its technical expertise,
processing efficiency, high quality product, customer support and pricing have enabled it to compete successfully in the concentrates market.
The ambient size reduction tolling business lacks substantial barriers to entry, whereas cryogenic grinding and jet milling require more significant investment and greater technical expertise. The compounding business, including concentrates manufacturing, requires a substantial investment in equipment, as well as extensive
technical and mechanical expertise. Many of the Company's customers could perform the specialized polymers processing services provided by the Company for themselves if they chose to do so, and new competitors may enter the market from time to time.
5
Business Divestitures
On September 6, 2002, the Company completed the sale of substantially all of its oilfield services (“Oilfield Services”) business to National Oilwell Varco, Inc., formerly Varco International, Inc. (“NOV”). On July 31, 2003, the Company sold its remaining Oilfield Services business to Permian Enterprises,
Ltd. Refer to Note 16 – “Discontinued Operations” in the Company’s Consolidated Financial Statements.
Environmental Regulation
The Company is subject to numerous and changing local, state, federal and foreign laws and regulations concerning the use, storage, treatment, disposal and general handling of materials, some of which may be considered to be hazardous substances and wastes, and restrictions concerning the release of pollutants and contaminants into the
environment. These laws and regulations require the Company to obtain and maintain certain permits and other authorizations mandating procedures under which the Company must operate and restricting emissions and discharges. Many of these laws and regulations provide for strict joint and several liability for the costs of cleaning up contamination resulting from releases of regulated materials, hazardous substances and wastes into the environment. Violation of these laws and regulations
as well as terms and conditions of operating permits issued to the Company may result in the imposition of administrative, civil, and criminal penalties and fines, remedial actions or, in more serious situations, shutdowns or revocation of permits or authorizations.
The Company regularly monitors and reviews its operations, procedures and policies regarding compliance with environmental laws and regulations and the Company's operating permits. There can be no assurance that a review of the Company's past, present or future operations by courts or federal, state, local or foreign regulatory authorities
will not result in determinations that could have a material adverse effect on the Company. In addition, the revocation of any of the Company's material operating permits, the denial of any material permit application or the failure to renew any interim permit could have a material adverse effect on the Company. In addition, compliance with more stringent environmental laws and regulations, more vigorous enforcement policies, or stricter interpretations of current laws and regulations, or
the occurrence of an industrial accident, could have a material adverse effect on the Company. Also, see the discussion concerning the risk of potential environmental liability, including environmental claims relating to the Company’s former Oilfield Services business, in Item 1A. – “Risk Factors.”
Warranties, Insurance and Risk
Except for warranties implied by law, the Company generally makes only limited warranties with regard to the products and services it provides, and attempts to contractually disclaim or limit its liability in the case of breach of warranty or other contractual obligation; however, the Company nevertheless has exposure to claims for breach
of express and implied warranties, and other breach of contract claims, in the event that products are not manufactured to specifications. The Company’s activities as a vendor of specialty or custom products may result in liability for defective or unfit products. In some jurisdictions, certain liability cannot be disclaimed or contractually limited for products that are defective or are found not to be fit for purpose. If the Company were found to have been negligent, or
to have breached its obligations to its customers, or if warranties are implied as a matter-of-law (notwithstanding any disclaimer of warranty), the Company could be exposed to significant liabilities and its reputation could be adversely affected. While the Company has an insurance program in effect to address some of these risks, the insurance coverage is subject to applicable deductibles, exclusions, limitations on coverage and policy limits. The occurrence of a significant adverse event,
the risks of which are not fully covered by insurance, could have a material adverse effect on the Company's financial condition, results of operations or net cash flows. Moreover, no assurance can be given that the Company will be able to maintain adequate insurance in the future at rates it considers reasonable. See Item 1A. – “Risk Factors” and Item 3. – “Legal Proceedings.”
Raw Materials
The Company purchases and takes into inventory the resins, additives and other materials used in its concentrates manufacturing and a portion of its specialty polymers distribution business. These materials are subject to fluctuating availability and prices. The Company believes that these and other materials used in its operations
are available from numerous sources and are able to meet its needs. In addition, the Company believes its relationships with its suppliers are good.
6
Patents, Trademarks and Licenses
The Company holds one United States patent, one United Kingdom patent, one Australian patent, and one New Zealand patent covering proprietary technology utilized in certain of its services. The Company believes that its patents are valid and that the duration of its existing patents is satisfactory; however, the Company does
not believe these patents are essential to the overall successful operation of the Company's business, and the Company's polymers processing operations are not materially dependent upon any patents, trademarks, or licenses. Nevertheless, no assurance can be given that one or more of the Company's competitors may not be able to develop or produce processes or products of comparable or greater quality to those developed or produced by the Company; that the Company’s patents will not be modified,
revoked, or found to be invalid; or that others will not claim that the Company’s products or processes infringe upon or use the intellectual property of others.
Employees
As of September 30, 2009, the Company employed approximately 805 full-time, part-time and temporary employees, approximately 350 of which are located in the United States. Certain employees working in Italy, France, The Netherlands, New Zealand, Australia and Brazil are parties to collective bargaining agreements. None
of the other employees are represented by a union. The Company has experienced no significant strikes or work stoppages during the past fiscal year and considers its relations with its employees to be satisfactory.
Financial Information About Geographic Areas
The Company's management structure is organized into five reportable business segments defined as ICO Polymers North America, ICO Brazil, Bayshore Industrial, ICO Europe, and ICO Asia Pacific. This organization is consistent with the way information is reviewed and decisions are made by executive management. Financial
information about the Company’s segments is found in Note 20 – “Segment Information” to the Company’s Consolidated Financial Statements.
Available Information
As a public company, the Company is required to file periodic reports with the Securities and Exchange Commission (“SEC”) within established deadlines. Any document the Company files with the SEC may be viewed or copied at the SEC’s Public Reference Room at 100 F Street, N.E., Washington, D.C. 20549. Additional
information regarding the Public Reference Room can be obtained by calling the SEC at (800) SEC-0330. The Company’s SEC filings are also available to the public through the SEC’s website located at http://www.sec.gov.
The Company’s Internet website is http://www.icopolymers.com. Information contained on the Company’s website is not part of this report or any other report filed with the SEC. The Company makes available free of charge, through its Internet website,
the Company’s annual reports on Form 10-K, quarterly reports on Form 10-Q, current reports on Form 8-K, as well as its other SEC filings, as soon as reasonably practicable after electronically filing such materials with or furnishing them to the SEC. In addition, the Company makes available through its Internet website the Company’s Code of Business Ethics, Corporate Governance Guidelines and written charters of the Audit, Compensation and Nominating Committees of its Board of Directors,
all of which are available in print to any stockholder who requests them by contacting the Company’s Corporate Secretary at 1811 Bering Drive, Suite 200, Houston, Texas, 77057.
Item 1A. Risk Factors
You should carefully consider the risks described below, in addition to other information contained or incorporated by reference herein. Realization of any of the following risks could have a material adverse effect on our business, financial condition, cash flows and results of operations.
7
Our indebtedness subjects our business to restrictive covenants and may limit our ability to borrow additional funds and efficiently operate the business.
Our credit agreement, as amended (the “Credit Agreement”), with KeyBank National Association and Wells Fargo Bank, National Association contains financial covenants including a minimum tangible net worth, leverage ratio, fixed charge coverage ratio and a required level of profitability. In addition, the Credit Agreement
contains a number of limitations on the ability of the Company and its restricted U.S. subsidiaries to (i) incur additional indebtedness, (ii) pay dividends or redeem any Common Stock, (iii) incur liens or other encumbrances on assets, (iv) enter into transactions with affiliates, (v) merge with or into any other entity or (vi) sell assets.
Additionally, any “material adverse change” of the Company could restrict our ability to borrow under the Credit Agreement and could also be deemed an event of default under the Credit Agreement. A “material adverse change” is defined as a change in our financial or other condition, business, affairs
or prospects or our properties and assets considered as an entirety that could reasonably be expected to have a material adverse effect, as defined in the Credit Agreement, on us.
In addition, any “Change of Control” of the Company or its restricted U.S. subsidiaries will constitute a default under the Credit Agreement. “Change of Control,” as defined in the Credit Agreement, is summarized as follows: (i) the acquisition of, or, if earlier, the shareholder or director approval
of the acquisition of, ownership or voting control, directly or indirectly, beneficially or of record, by any person, entity, or group (within the meaning of Rule 13d-3 of the Securities Exchange Act of 1934, as then in effect), of shares representing more than 50% of the aggregate ordinary voting power represented by the issued and outstanding Common Stock of the Company; (ii) the occupation of a majority of the seats (other than vacant seats) on the board of directors of the Company by individuals who were
neither (A) nominated by the Company’s board of directors nor (B) appointed by directors so nominated; (iii) the occurrence of a change in control, or other similar provision, under or with respect to any “Material Indebtedness Agreement” (as defined in the Credit Agreement); or (iv) the failure of the Company to own directly or indirectly, all of the outstanding equity interests of the Company’s Bayshore Industrial L.P. and ICO Polymers North America, Inc. subsidiaries.
In addition to the “Change of Control” clause under the Keybank agreement, certain of our foreign loan agreements and credit facilities also have “Change of Control” provisions. However, unlike the Keybank agreement, such “Change of Control” provisions are only triggered upon consummation of a
transaction that constitutes a ‘Change of Control”. As of September 30, 2009, we had approximately $11.4 million of borrowings outstanding and $9.6 million of available borrowings under these agreements.
Changes in the cost and availability of polymers could adversely affect the Company.
Polymers (i.e., resins) are a key ingredient of our products, and changes in the cost and availability of resins (generally produced by the major chemical companies) are outside of our control. If resin costs increase, whether because of higher oil and gas prices or because of lower supplies, we may be forced to increase the
prices at which we sell our products to our customers. An increase in our prices may result in lower customer demand for our products, thereby adversely affecting our business. Additionally, higher resin prices will lead to higher working capital requirements which could result in higher debt and associated interest expense. On the other hand, a perception that resin costs will be declining in the near future may, in the short term, result in a decrease in customer demand for
our products as customers wait for lower resin prices to be reflected in the price of our products, which could also have a material adverse effect on the Company’s financial condition, results of operations or cash flows.
Changes in economic activity could adversely affect us.
Our business cycles are affected by changes in the level of economic activity in the various regions in which we operate. Our business cycles are generally volatile and relatively unpredictable. In addition, we are affected by cycles in the petroleum and oil and gas industries. The length of these business
cycles is outside of the Company’s control, and can adversely affect our financial condition, results of operations and cash flows.
The recent global economic crisis has caused, among other things, significant reductions in available capital and liquidity from banks and other providers of credit, substantial reductions and fluctuations in equity and currency values worldwide, and concerns that the worldwide economy may enter into a prolonged recessionary period, each
of which may materially adversely affect our customers’ access to capital. A limit on our customers’ access to capital could inhibit their willingness or ability to purchase our products or affect their ability to pay for products that they have already purchased from us. In addition, downturns in our customers’ industries, even during periods of strong general economic conditions, could adversely affect our sales, profitability, financial condition, results of operations
and cash flows.
8
The Company’s success is partly dependent upon our ability to develop superior proprietary technology, know-how and trade secrets.
Our business operations are dependent to a certain degree upon proprietary technology, know-how and trade secrets developed by the Company. In many cases, the Company’s technology and know-how, or equivalent processes or technology are available to or practiced by our competitors, customers and others. In addition,
there can be no assurance that third parties will not develop substantially equivalent or superior proprietary processes and technologies, or that our trade secrets will not lose their proprietary status. The development or acquisition by others of equivalent or superior information, processes or technologies or our failure to maintain the trade secret status of our proprietary technology know-how and trade secrets could have a material adverse affect on our financial condition, results of operations
or cash flows.
The failure to properly manage inventories could expose the Company to material financial losses.
The Company’s product sales business, including the Company’s concentrate manufacturing operations, requires the Company to buy inventories of supplies and products and to manage the risk of ownership of commodity inventories having fluctuating market values. The maintenance of excessive inventories in our businesses
could expose us to losses from drops in market prices for our products, while maintenance of insufficient inventories may result in lost sales to the Company.
There are risks associated with our presence in international markets, including political or economic instability and currency restrictions.
Approximately 68% of our fiscal year 2009 revenues were derived from operations outside the United States. Our foreign operations include significant operations in our European, Asia Pacific, and Brazilian business segments. We anticipate continuing to seek expansion of our international operations. Our
international operations are subject to certain political, economic and other uncertainties normally associated with international operations, including among others, risks of government policies regarding private property, taxation policies, foreign exchange restrictions and currency fluctuations and other restrictions arising out of foreign governmental sovereignty over areas in which the Company conducts business that may limit or disrupt markets, restrict the movement of funds, result in the deprivation of
contract rights, result in civil disturbance or result in other forms of conflict.
Our international operations are subject to political and economic risks of developing countries, and special risks associated with doing business in corrupt environments.
The majority of our international business is currently in regions such as Western Europe, where the risk level and extent of established legal systems is similar to that in the United States. We also conduct business in developing countries, and we are focusing on increasing our sales and establishing new production facilities
in regions such as South America, Southeast Asia, India and the Middle East, which have less developed legal systems, financial markets, and business and political environments than the United States, and therefore present greater political, economic and operational risks. We emphasize legal compliance and have implemented policies, procedures and certain ongoing training of employees with regard to business ethics and many key legal requirements, such as the U.S. Foreign Corrupt Practices Act ("FCPA"),
which makes it illegal for us to give anything of value to foreign officials in order to obtain or retain any business or other advantages; however, there can be no assurance that our employees will adhere to our code of business ethics, other Company policies, the FCPA or other legal requirements. If we fail to enforce our policies and procedures properly or maintain adequate record-keeping and internal accounting practices to accurately record our transactions, we may be subject to regulatory sanctions. In
the event that we believe or have reason to believe that employees have or may have violated the FCPA or other laws or regulations, we will be required to investigate or have outside counsel investigate the relevant facts and circumstances, and if violations are found or suspected could face civil and criminal penalties, and significant costs for investigations, litigation, fees, settlements and judgments, which in turn could negatively affect our results of operations and cash flow.
The results of our operations are subject to market risk from changes in foreign currency exchange rates.
We earn revenues, pay expenses and incur liabilities in countries using currencies other than the U.S. Dollar, including the Euro, the British Pound, the New Zealand Dollar, Brazilian Real, the Malaysian Ringgit and the Australian Dollar. Approximately 68% of our fiscal year 2009 revenues were derived from sales outside the United States. Because
our consolidated financial statements are presented in U.S. Dollars, we must translate revenues, income and expenses into U.S. Dollars at exchange rates in effect during or at the end of each reporting period. Thus, increases or decreases in the value of the U.S. Dollar against other currencies in which our
9
operations are conducted will affect our revenues and operating income. Because of the geographic diversity of our operations, weaknesses in some currencies might be offset by strengths in others over time. Fluctuations in foreign currency exchange rates affect our financial results, and there can be no assurance that
fluctuation in foreign currency exchanges rates will not have a material adverse effect on our financial condition, results of operations or cash flows.
Due to our lack of asset diversification, adverse developments in our industry could materially adversely impact our operations.
We rely primarily on the revenues generated in the polymer processing industry. Due to our lack of asset diversification, a significant adverse development in this industry could trigger or result in impairment charges and would likely have a significantly greater impact on our financial condition, results of operations or cash
flows than if it maintained more diverse assets.
Our success depends on attracting and maintaining key personnel; the failure to do so could disrupt our business operations.
Our success depends upon our ability to attract and retain experienced and knowledgeable management and other professional staff. Our results of operations depend to a large extent on the efforts, technical expertise and continued employment of key personnel and members of our management team. If we are unable to
attract and retain experienced and knowledgeable personnel or a significant number of our existing key personnel resign or become unable to continue in their present role without adequate replacements, our business operations could be adversely affected.
An impairment of goodwill could reduce our earnings.
In fiscal year 2009, we recognized a goodwill impairment of $3.5 million in our Asia Pacific reporting unit. The goodwill remaining on our balance sheet at September 30, 2009 is $4.5 million, which is entirely recorded in our Bayshore Industrial reporting unit. If our remaining goodwill becomes impaired, we may be
required to record a significant charge to our earnings. Under generally accepted accounting principles, goodwill is required to be tested for impairment at least annually. We may be required to record a significant charge to earnings in our financial statements during a period in which any impairment of our goodwill is determined. Refer to Note 4 – “Goodwill” in the Company’s Consolidated Financial Statements.
Changes in tax laws could have an adverse impact on our earnings.
We are subject to income taxes in the United States and numerous foreign jurisdictions. Changes to tax laws, rules and regulations, including changes in the interpretation or implementation of tax laws, rules and regulations by the Internal Revenue Service or other domestic or foreign governmental bodies, could affect us in
substantial and unpredictable ways. Such changes could subject us to additional compliance costs and tax liabilities which could have an adverse impact on our financial condition, results of operations or cash flows.
Operational risks, and resulting uninsured claims and litigation, could adversely affect the Company’s business.
Our operations involve many operational and contractual risks, which, even through a combination of experience, knowledge and careful evaluation, may not be overcome. Our operational risks include, without limitation, the risk of losses, injuries and damages, caused by equipment failures, work-related accidents, natural disasters
such as fires, floods and hurricanes, unanticipated operational failures, unanticipated environmental pollution or contamination and defects or contamination in our products or services. The occurrence of such operational risks could result in plant shutdowns for extended time periods, serious personal injuries, significant property and environmental damage, uninsured financial losses and damages suffered by the Company, customer claims for breach of contract or warranty, governmental claims and other
third party claims.
Except for warranties implied by law, we generally make only limited warranties with regard to the products and services we provide, and attempts to contractually disclaim or limit its liability in the case of breach of warranty or other contractual obligation; however, we have exposure to claims for breach of express and implied warranties,
and other breach of contract claims, in the event that products are not manufactured to specifications. Our activities as a vendor of specialty or custom products may result in liability for defective or unfit products. In some jurisdictions, certain liability cannot be disclaimed or contractually limited for products that are defective or are found not to be fit for purpose.
10
If we are found to have liability for, or are even simply required to legally defend, claims for breach of warranty, breach of contract, negligence, defective products or damages to third parties resulting from the occurrence of operational risks, our financial exposure could be significant, and our reputation could be adversely affected. We
have insurance coverage against many operational risks and potential liability to customers and third parties, including product liability and personal injury claims related to our products, to the extent insurance is available and reasonably affordable; however, no assurance can be given that the nature and amount of that insurance will be sufficient to fully indemnify us against costs, expenses and liabilities arising out of pending and future claims and litigation. Our insurance has deductibles or self-insured
retentions, and contains certain coverage exclusions. In most cases, our insurance does not cover some or all elements of damages based on allegations that we are liable under legal theories of breach of contract or warranty, fraud or deceptive trade practices. In some cases we obtain agreements from customers acknowledging our disclaimer of warranties and limiting our liability. Nevertheless, insurance and customer agreements do not provide complete protection against losses
and risks, and our results of operations could be adversely affected by uninsured operational risks, contractual risks and customer and third party claims and litigation. See Item 3. – “Legal Proceedings.”
We could be adversely affected if we fail to comply with any of the numerous federal, state and local laws, regulations and policies that govern environmental protection, zoning and other matters applicable to our businesses.
Our business is subject to numerous federal, state and local laws, regulations and policies governing environmental protection, zoning and other matters. These laws and regulations have changed frequently in the past and it is reasonable to expect additional changes in the future. If existing regulatory requirements change, we may be required
to make significant unanticipated capital and operating expenditures. We cannot assure you that our operations will continue to comply with future laws and regulations. Governmental authorities may seek to impose fines and penalties on us or to revoke or deny the issuance or renewal of operating permits for failure to comply with applicable laws and regulations. Under these circumstances, we might be required to reduce or cease operations or conduct site remediation or other corrective action which could adversely
impact our business operations.
Our businesses expose us to potential environmental liability.
Our businesses expose us to the risk that harmful substances may escape into the environment, which could result in personal injury or loss of life, severe damage to or destruction of property, or environmental damage and suspension of operations. Our current and past activities, as well as the activities of our former divisions
and subsidiaries, could result in, but are not limited to, substantial environmental, regulatory and other liabilities. Such liabilities could include the costs of cleanup of contaminated sites and site closure obligations. These liabilities could also be imposed on the basis of theories including negligence, strict liability, breach of contract, or as a result of our contractual agreement or implied-in-law obligation to indemnify customers or others in the ordinary course of business.
We may not have adequate insurance coverage for potential liabilities, including, without limitation, environmental liabilities.
While we maintain liability insurance, this insurance is subject to coverage limits and policy exclusions. In addition, certain policies specifically exclude coverage for damages resulting from environmental contamination. Our results of operations could be adversely affected by the following risks with respect to
our insurance coverage: we may not be able to continue to obtain insurance on commercially reasonable terms; we may be faced with types of liabilities that will not be covered by insurance; our insurance carriers may become insolvent and not be able to meet their obligations under the policies, and the dollar amount of any liabilities may exceed our policy limits. Even a partially uninsured claim, if successful and of significant size, could have a material adverse effect on our financial
condition, results of operations or cash flows.
Future environmental, personal injury, and other claims relating to the Company’s former Oilfield Services business could adversely affect our financial condition, results of operations and/or cash flows.
In 2002, we completed the sale of substantially all of our oilfield services (“Oilfield Services”) business to National Oilwell Varco, Inc., formerly Varco International, Inc. (“NOV”). In 2003, we sold our remaining Oilfield Services business to Permian Enterprises, Ltd. (“Permian”). NOV
and Permian purchased the assets and business of our former Oilfield Services business, but acquired limited responsibility for liabilities of our former Oilfield Services business relating to events occurring prior to the respective closings of the referenced divestitures (collectively the “Closings”). Among the pre-closing liabilities retained by us are potential environmental claims including, without limitation, “Superfund” claims relating to off-site disposal of hazardous
materials prior to the Closings, potential claims by employees, contractors, and others for occupational injuries sustained by such individuals prior to the
11
Closings, as well as other types of claims. There are currently no Superfund claims or other environmental claims pending against us that are expected to have a material adverse effect on our business or results of operations, except as described under the heading “Environmental Remediation” in Item 3. – “Legal
Proceedings.” There are currently no silicosis or other occupational injury claims pending that are expected to have a material adverse effect on our business or results of operations. However, since the late 1990’s we have settled claims of approximately 35 former employees of the Company’s former Oilfield Services business who allegedly sustained personal injuries or died as a result of occupational exposure to silica. In the past we have been a party to and settled material
environmental and occupational injury (silicosis) claims related to our former Oilfield Services business. There can be no assurance that in the future there will not be new environmental claims, occupational injury claims, or other claims, including claims resulting from activities or conditions involving our former Oilfield Services business and occurring prior to the sale of the Oilfield Services business, having a material adverse effect on our financial condition, results of operations and/or
cash flows.
Competition in our industry is intense, and we are smaller and have more limited resources than some of our competitors and potential competitors.
The industry in which we operate is highly competitive. Some of our competitors or potential competitors have substantially greater financial or other resources than we have. Larger competitors may be able to absorb the burden of any changes in federal, state and local laws and regulations or rising costs of raw materials
more easily than we can, which would adversely affect our competitive position. The inability of the Company to effectively compete in its markets would have a material adverse effect on our financial condition, results of operations or cash flows.
We may be required to adopt International Financial Reporting Standards ("IFRS"), or other accounting or financial reporting standards, the ultimate adoption of which could negatively impact our business, financial condition or results of operations.
Although not yet required, we could be required to adopt IFRS or other accounting or financial reporting standards different than accounting principles generally accepted in the United States of America currently applicable to our accounting and financial reporting. The implementation and adoption of new standards could favorably or unfavorably
impact our business, financial condition, results of operations or cash flows.
Potential disruptions in the global capital and credit markets may adversely affect the Company, including by adversely affecting the availability and cost of short-term funds for our liquidity requirements and our ability to meet long-term commitments, which in turn could adversely affect our results
of operations, cash flows and financial condition.
We rely on our current credit facilities to fund short-term liquidity needs if internal funds are not available from our operations. We also use letters of credit issued under its revolving credit facilities to support our insurance policies and supplier purchases in certain business units. Disruptions in the capital and credit markets
could adversely affect our ability to draw on our bank revolving credit facilities. Our access to funds under our credit facilities is dependent on the ability of the banks that are parties to the facilities to meet their funding commitments. Our banks may not be able to meet their funding commitments to us if such banks experience shortages of capital and liquidity or if they experience excessive volumes of borrowing requests from us and other borrowers within a short period of time.
Longer-term disruptions in the capital and credit markets as a result of uncertainty, changing or increased regulation, reduced alternatives or failures of significant financial institutions could adversely affect the Company’s access to liquidity needed in its businesses. Any disruption could require the Company to take measures
to conserve cash until the markets stabilize or until alternative credit arrangements or other funding for business needs can be arranged. Such measures could include deferring capital expenditures, as well as reducing or eliminating future share repurchases, dividend payments or other discretionary uses of cash.
Many of the Company’s customers and suppliers also have exposure to risks that their businesses are adversely affected by the worldwide financial crisis and resulting potential disruptions in the capital and credit markets. In the event that any of the Company’s significant customers or suppliers, or a significant
number of smaller customers and suppliers, are adversely affected by these risks, the Company may face disruptions in supply, significant reductions in demand for its products and services, inability of customers to pay invoices when due, and other adverse effects that could negatively affect the Company’s financial condition, results of operations or cash flows.
12
Failure to complete the merger or delays in completing the merger with A. Schulman, Inc. could negatively impact our stock price, future business and operation, and financial results.
On December 2, 2009, we entered into a definitive merger agreement with A. Schulman, Inc. Completion of the proposed merger is subject to various conditions, including, among others, approval by our shareholders and the termination or expiration of any applicable waiting period under the Hart-Scott-Rodino Antitrust Improvements Act of
1976, as amended. If these or other conditions are not satisfied, we may not be able to complete the merger, and such failure may have adverse consequences. If the merger is not completed, we will be subject to a number of risks, including the following:
|
· |
because the current price of our common stock may reflect a market premium based on the assumption that we will complete the merger, a failure to complete the merger could result in a decline in the price of our common stock; and |
|
· |
the pending merger, its effects and related matters may distract our employees from day-to-day operations and require substantial commitments of time and resources, and may also impair our relations with our employees, customers, suppliers and other constituencies due to uncertainty about the future following the completion of the merger; and |
|
· |
in specified circumstances, if the merger is not completed, we may be required to pay A. Schulman, Inc. either a termination fee of $6.8 million or up to $1.0 million in expense reimbursement instead of the termination fee; and |
|
· |
we will not realize the benefits expected from being part of a larger company; and |
|
· |
some costs related to the merger, such as legal, accounting and financial advisor fees, must be paid even if the merger is not completed. |
While the merger is pending we may be subject to restrictions on the conduct of our business.
The merger agreement restricts us from taking specified actions without A. Schulman, Inc’s. approval. These restrictions could prevent us from pursuing attractive business opportunities that may arise prior to the completion of the merger and could otherwise have a material adverse impact on our Company. In addition, while
the merger agreement is in effect, subject to certain limited exceptions, we are prohibited from soliciting, initiating, encouraging or entering into any extraordinary transactions, such as a merger, sale of assets or other business combination, with any third party. As a result of these limitations, we could lose opportunities to enter into an alternative transaction which could be more favorable.
Item 1B. Unresolved Staff Comments
None.
Item 2. Properties
The location and approximate acreage of the Company's operating facilities at November 30, 2009, together with an indication of the services performed at such facilities, are set forth below. Other than the Company’s corporate headquarters in Houston, Texas, all properties consist of polymers processing facilities with
adjacent offices. The “Services” column below describes the services either performed for customers at the location or performed on Company-owned materials to produce the Company’s products.
The Company’s Bayshore Industrial segment owns and operates the La Porte, Texas location; all other U.S. locations (other than the corporate headquarters) are, as of November 30, 2009, owned or leased by the Company’s ICO Polymers North America segment. The Australia, New Zealand and Malaysia locations are owned
or leased by the Company’s ICO Asia Pacific segment. The six European locations are owned or leased by the Company’s ICO Europe segment, and the three locations in Brazil are leased by the Company’s ICO Brazil segment.
13
|
Properties Owned: |
|||||
|
Location |
Services |
Acres |
Facility Square Footage | ||
|
Batu Pahat, Malaysia |
Size reduction and compounding |
3 |
61,200 | ||
|
China, Texas |
Size reduction and compounding |
13 |
108,500 | ||
|
East Chicago, Indiana |
Size reduction and compounding |
4 |
73,000 | ||
|
Fontana, California |
Size reduction and compounding |
7 |
44,727 | ||
|
Gainsborough, England |
Size reduction and compounding |
8 |
102,500 | ||
|
Grand Junction, Tennessee |
Size reduction |
5 |
127,900 | ||
|
La Porte, Texas |
Compounding |
39 |
224,240 | ||
|
Beaucaire, France |
Size reduction |
5 |
72,088 | ||
|
Montereau, France |
Size reduction and compounding |
4 |
53,259 | ||
|
Oyonnax, France |
Compounding |
1 |
26,898 | ||
|
’s-Gravendeel, The Netherlands |
Size reduction and compounding |
5 |
192,271 | ||
|
Verolanuova, Italy |
Size reduction and compounding |
11 |
140,313 | ||
|
Total Acreage and Square Footage Owned |
105 |
1,226,896 |
|
Properties Leased: |
|||||
|
Location |
Services |
Acres |
Facility Square Footage | ||
|
Houston, Texas |
Corporate headquarters |
N/A |
9,740 | ||
|
Allentown, Pennsylvania |
Size reduction |
14 |
127,500 | ||
|
Auckland, New Zealand |
Size reduction and compounding |
1 |
24,010 | ||
|
Contagem, Belo Horizonte, Brazil |
Size reduction and compounding |
1 |
23,680 | ||
|
Americana, São Paulo, Brazil |
Size reduction |
N/A |
18,300 | ||
|
Simoes Filhos, Bahia, Brazil |
Size reduction |
N/A |
11,850 | ||
|
Braeside, Australia |
Size reduction and compounding |
12 |
183,450 | ||
|
Brisbane, Australia |
Size reduction and compounding |
1 |
18,256 | ||
|
Total Acreage and Square Footage Leased |
29 |
416,786 | |||
|
Total Acreage and Square Footage Owned and Leased |
134 |
1,643,682 | |||
N/A = Not applicable
The leased properties listed above have various expiration dates through 2017, and most of the leases provide for renewal terms beyond the stated expiration dates. The polymers processing facilities above are operating 24 hours per day, at least five days per week.
As of September 30, 2009, the Company also owned real estate in Bloomsbury, New Jersey, where the ICO Polymers North America segment previously conducted operations before relocating to a leased facility in Allentown, Pennsylvania during fiscal year 2008. As of November 30, 2009, the Company has placed the Bloomsbury real estate
on the market for eventual sale.
Item 3. Legal Proceedings
Thibodaux Litigation. Since September 2004, the Company has been a defendant in litigation pending in District Court in the Parish of Orleans, Louisiana (the “Thibodaux Lawsuit”) filed by C.M. Thibodaux Company (“Thibodaux”). Other defendants
in the case include Intracoastal Tubular Services, Inc. (“ITCO”), thirty different oil companies (the “Oil Company Defendants”), several insurance companies and four trucking companies. Thibodaux, the owner of industrial property located in Amelia, Louisiana that has historically been leased to tenants conducting oilfield services businesses, contends that the property has been contaminated with
14
naturally occurring radioactive material (“NORM”). NORM is found naturally occurring in the earth, and when pipe is removed from the ground it is not uncommon for the corroded rust on the pipe to contain very small amounts of NORM. The Company’s former Oilfield Services business leased a portion of
the subject property from Thibodaux. Thibodaux contends that the subject property was contaminated with NORM generated during the servicing of oilfield equipment by the Company and other tenants, and further alleges that the Oil Company Defendants (customers of Thibodaux’s tenants) and trucking companies (which delivered tubular goods and other oilfield equipment to the subject property) allowed or caused the uncontrolled dispersal of NORM on Thibodaux’s property. Thibodaux seeks
recovery from the defendants for clean-up costs, diminution or complete loss of property values, and other damages. Discovery in the Thibodaux Lawsuit is ongoing, and the Company intends to assert a vigorous defense in this litigation. At this time, the Company does not believe it has any liability in this matter. In the event the Company is found to have liability, the Company believes it has sufficient insurance coverage applicable to this claim subject to a $1.0 million self-insured
retention. However, an adverse judgment against the Company, combined with a lack of insurance coverage, could have a material adverse effect on the Company's financial condition, results of operations or cash flows.
Wastewater Discharge Permit. In the second quarter of fiscal year 2009, the Company self-reported to the Texas Commission on Environmental Quality (“TCEQ”) facts surrounding certain events of noncompliance with its Bayshore Industrial facility’s Texas Pollutant
Discharge Elimination System wastewater discharge permit, and subsequently received notification from the TCEQ that it is conducting an investigation into the matter. The Company has cooperated in the investigation. The Company has taken certain corrective action with respect to the operation of its wastewater treatment facility and the requirements of its wastewater discharge permit. In July 2009 the Company received a Notice of Violation (Notice) from the TCEQ stating that an
alleged violation of the permit was noted in the TCEQ’s investigation, and requesting that the Company provide documentation of the corrective action and demonstration that compliance has been achieved for the alleged violation. The Company complied with the TCEQ’s request for information, and subsequently received notification from the TCEQ confirming that the TCEQ was satisfied that appropriate corrective action had been taken. No administrative penalties have been imposed
on the Company as a result of the Notice; however, the investigation is still pending. It is possible that the investigation could result in the Company receiving civil and/or criminal penalties. An adverse finding in the investigation and any resulting penalties imposed on the Company could have a material adverse effect on the Company's financial condition, results of operations or cash flows. However, at this time, the Company does not believe that the outcome will have a material
adverse effect on the Company’s financial condition, results of operations or cash flows.
Environmental Remediation. The Comprehensive Environmental Response, Compensation, and Liability Act, as amended (“CERCLA”), also known as “Superfund,” and comparable state laws impose
liability without regard to fault or the legality of the original conduct on certain classes of persons who are considered to be responsible for the release of a “hazardous substance” into the environment. These persons include the owner or operator of a disposal site or another site where the release occurred, and companies that disposed or arranged for the disposal of the hazardous substances at the site where a release occurred. Under CERCLA, such persons may be subject to
joint and several liability for the costs of cleaning up the hazardous substances that have been released into the environment, for damages to natural resources, and for the costs of certain health studies, and it is not uncommon for neighboring landowners and other third parties to file claims for personal injury and property damage allegedly caused by the release of hazardous substances into the environment.
The Company is identified as one of many potentially responsible parties (“PRPs”) under CERCLA in a pending claim relating to the Combe Fill South Landfill (“CFS”) superfund site in Morris County, New Jersey. The Environmental Protection Agency (“EPA”) has indicated that the Company is responsible
for only de minimus levels of wastes contributed to the site, and there are numerous other PRPs identified that contributed more than 99% of the volume of waste at the site. The Company has executed a consent decree, subject to court and EPA approval, to settle its liability related to the CFS site, for an amount that is immaterial to the Company’s financial condition, results of operations and cash flows.
Other Legal Proceedings. The Company is also named as a defendant in certain other lawsuits arising in the ordinary course of business. The outcome of these lawsuits cannot be predicted with certainty, but the Company does not believe they will have a material adverse
effect on the Company’s financial condition, results of operations or cash flows.
Item 4. Submission of Matters to a Vote of Security Holders
None.
15
P A R T I I
Item 5. Market for the Registrant’s Common Equity and Related Stockholder Matters and Issuer Purchases of Equity Securities
The Company’s Common Stock trades on the Nasdaq Global Select Market under the symbol ICOC. There were 429 shareholders of record of the Company’s Common Stock at November 12, 2009.
The Company has not declared or paid Common Stock dividends during fiscal year 2009, 2008 or 2007. The Company’s Credit Agreement, as amended (the “Credit Agreement”), with KeyBank National Association and Wells Fargo Bank, National Association requires that the Company must not be in default under the Credit
Agreement and must be in compliance with the financial covenants contained in the Credit Agreement in order to pay Common Stock dividends (see Item 7 – “Management’s Discussion and Analysis of Financial Condition and Results of Operations – Liquidity and Capital Resources” and Note 9 – “Credit Arrangements” to the Company’s Consolidated Financial Statements). While the Company is not
in default under the Credit Agreement, the Board did not declare a common stock dividend in fiscal year 2009.
In September 2008, the Company announced that its Board of Directors authorized the repurchase of up to $12.0 million of its outstanding Common Stock through September 2010 (the “Share Repurchase Plan”). Through September 30, 2009, 578,081 shares had been repurchased for total cash consideration of $ 3.0 million
at an average price of $ 5.22 per share. In connection with the A. Schulman merger agreement, on December 2, 2009, the Board of Directors terminated the Share Repurchase Plan.
The following table sets forth the high and low trading prices by quarter for the Company’s Common Stock as reported on the Nasdaq Global Select Market during fiscal years 2009 and 2008, respectively.
|
Common Stock Price Range |
Fiscal 2009
High - Low |
Fiscal 2008
High - Low | ||
|
First Quarter |
$5.95-$2.33 |
$16.50-$9.66 | ||
|
Second Quarter |
$4.16-$1.03 |
$13.73-$6.65 | ||
|
Third Quarter |
$3.28-$1.90 |
$ 8.36-$5.89 | ||
|
Fourth Quarter |
$5.14-$2.29 |
$ 6.72-$4.56 |
Information regarding securities authorized for issuance under equity compensation plans is incorporated by reference to the information under the caption “Equity Compensation Plan Information” of the Company’s definitive Proxy Statement for its 2010 Annual Meeting of Stockholders.
16
The information contained in this ICO, Inc. Stock Comparative Performance Graph section shall not be deemed to be “soliciting material” or “filed” or incorporated by reference in future filings with the SEC, or subject to the liabilities of Section 18 of the Securities Exchange Act of 1934,
except to the extent that we specifically incorporate it by reference into a document filed under the Securities Act of 1933 or the Securities Exchange Act of 1934.
The graph below compares the cumulative total shareholder return on ICO, Inc. Common Stock for the past five fiscal years with the cumulative total shareholder return of the NASDAQ composite index and the S&P 500 Specialty Chemical Index for the same period.
The graph assumes an investment of $100 on September 30, 2004, with all dividends reinvested. The data was supplied by Research Data Group.
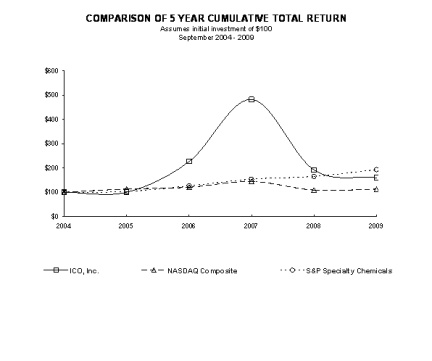
|
FY04 |
FY05 |
FY06 |
FY07 |
FY08 |
FY09 | |
|
ICO, Inc. |
100.00 |
100.34 |
226.71 |
482.19 |
192.12 |
159.93 |
|
NASDAQ Composite |
100.00 |
113.65 |
120.81 |
144.35 |
109.35 |
112.92 |
|
S&P 500 Specialty Chemical Index |
100.00 |
102.84 |
126.58 |
154.19 |
165.37 |
193.58 |
17
Item 6. Selected Financial Data
The following table sets forth selected financial data of the Company that has been derived from audited consolidated financial statements. The selected financial data should be read in conjunction with the Company’s Consolidated Financial Statements and Notes thereto, included elsewhere in this report.
|
Fiscal Years Ended September 30, |
||||||||||||||||||||
|
2009 |
2008 |
2007 |
2006 |
2005 |
||||||||||||||||
|
(in Thousands, except for share and per share data) |
||||||||||||||||||||
|
Statement of Operations Data: |
||||||||||||||||||||
|
Revenues |
$ | 299,965 | $ | 446,701 | $ | 417,917 | $ | 324,331 | $ | 296,606 | ||||||||||
|
Costs of sales and services (exclusive of depreciation and |
||||||||||||||||||||
|
amortization shown separately below) |
250,583 | 373,557 | 344,171 | 261,228 | 243,140 | |||||||||||||||
|
Gross profit (a) |
49,382 | 73,144 | 73,746 | 63,103 | 53,466 | |||||||||||||||
|
Selling, general and administrative expenses |
36,679 | 41,254 | 37,676 | 34,284 | 37,001 | |||||||||||||||
|
Depreciation and amortization |
7,361 | 7,531 | 7,251 | 7,386 | 7,772 | |||||||||||||||
|
Goodwill impairment |
3,450 | - | - | - | - | |||||||||||||||
|
Long-lived asset impairment, restructuring and other costs (income) |
(175 | ) | (1,348 | ) | (997 | ) | 118 | 488 | ||||||||||||
|
Operating income |
2,067 | 25,707 | 29,816 | 21,315 | 8,205 | |||||||||||||||
|
Interest expense, net |
(2,230 | ) | (4,062 | ) | (3,227 | ) | (2,091 | ) | (2,836 | ) | ||||||||||
|
Other income (expense) |
(582 | ) | (431 | ) | (115 | ) | 75 | (149 | ) | |||||||||||
|
Income (loss) from continuing operations before income taxes |
(745 | ) | 21,214 | 26,474 | 19,299 | 5,220 | ||||||||||||||
|
Provision for income taxes |
494 | 5,832 | 6,712 | 5,836 | 218 | |||||||||||||||
|
Income (loss) from continuing operations |
(1,239 | ) | 15,382 | 19,762 | 13,463 | 5,002 | ||||||||||||||
|
Income (loss) from discontinued operations, net of income taxes |
- | (68 | ) | 1,356 | (1,459 | ) | (497 | ) | ||||||||||||
|
Net income (loss) |
$ | (1,239 | ) | $ | 15,314 | $ | 21,118 | $ | 12,004 | $ | 4,505 | |||||||||
|
Preferred Stock dividends |
- | (1 | ) | (554 | ) | (2,176 | ) | (2,176 | ) | |||||||||||
|
Net gain on redemption of Preferred Stock |
- | - | 6,023 | - | - | |||||||||||||||
|
Net income (loss) applicable to Common Stock |
$ | (1,239 | ) | $ | 15,313 | $ | 26,587 | $ | 9,828 | $ | 2,329 | |||||||||
|
Fiscal Years Ended September 30, |
||||||||||||||||||||
| 2009 | 2008 | 2007 | 2006 | 2005 | ||||||||||||||||
|
Earnings (Loss) Per Share: |
||||||||||||||||||||
|
Basic |
||||||||||||||||||||
|
Earnings (loss) from continuing operations |
$ | (0.05 | ) | $ | 0.56 | $ | 0.97 | $ | 0.44 | $ | 0.11 | |||||||||
|
Earnings (loss) from discontinued operations |
- | - | 0.05 | (0.06 | ) | (0.02 | ) | |||||||||||||
|
Earnings (loss) per common share |
$ | (0.05 | ) | $ | 0.56 | $ | 1.02 | $ | 0.38 | $ | 0.09 | |||||||||
|
Earnings (Loss) Per Share: |
||||||||||||||||||||
|
Diluted |
||||||||||||||||||||
|
Earnings (loss) from continuing operations |
$ | (0.05 | ) | $ | 0.55 | $ | 0.71 | $ | 0.43 | $ | 0.11 | |||||||||
|
Earnings (loss) from discontinued operations |
- | - | 0.05 | (0.06 | ) | (0.02 | ) | |||||||||||||
|
Earnings (loss) per common share |
$ | (0.05 | ) | $ | 0.55 | $ | 0.76 | $ | 0.37 | $ | 0.09 | |||||||||
|
Weighted average shares outstanding (basic) |
27,081,000 | 27,271,000 | 26,030,000 | 25,680,000 | 25,442,000 | |||||||||||||||
|
Weighted average shares outstanding (diluted) |
27,081,000 | 27,994,000 | 27,891,000 | 26,255,000 | 25,816,000 | |||||||||||||||
18
|
Fiscal Years Ended September 30, |
||||||||||||||||||||
|
2009 |
2008 |
2007 |
2006 |
2005 |
||||||||||||||||
|
(Dollars in Thousands) |
||||||||||||||||||||
|
Other Financial Data: |
||||||||||||||||||||
|
Capital expenditures |
$ | 3,909 | $ | 13,565 | $ | 11,634 | $ | 8,080 | $ | 5,039 | ||||||||||
|
Cash provided by operating activities by continuing operations |
38,178 | 13,825 | 19,375 | 13,498 | 4,849 | |||||||||||||||
|
Cash used for investing activities by continuing operations |
(3,438 | ) | (11,172 | ) | (10,662 | ) | (8,067 | ) | (4,086 | ) | ||||||||||
|
Cash provided by (used for) financing activities by continuing operations |
$ | (19,410 | ) | $ | (5,266 | ) | $ | (17,736 | ) | $ | 9,013 | $ | 1,473 | |||||||
|
Balance Sheet Data: |
||||||||||||||||||||
|
Cash and equivalents |
$ | 21,880 | $ | 5,589 | $ | 8,561 | $ | 17,427 | $ | 3,234 | ||||||||||
|
Working capital |
64,093 | 67,001 | 57,858 | 57,501 | 41,382 | |||||||||||||||
|
Property, plant and equipment, net |
57,144 | 61,164 | 57,396 | 50,884 | 49,274 | |||||||||||||||
|
Total assets |
192,273 | 221,096 | 246,217 | 197,961 | 164,255 | |||||||||||||||
|
Long-term debt, net of current portion |
18,823 | 25,122 | 29,605 | 21,559 | 18,993 | |||||||||||||||
|
Shareholders’ equity |
$ | 105,155 | $ | 107,835 | $ | 91,042 | $ | 91,717 | $ | 77,090 | ||||||||||
|
(a) |
The Company has presented a measurement, gross profit, that is not calculated in accordance with generally accepted accounting principles in the United States (a “Non-GAAP measurement”), but that is derived from relevant items in the Company’s financial statements prepared in accordance with US GAAP. The Company
presents this measurement because the Company uses this measurement as an indicator of the income the Company generates from its revenues. The material limitation of this Non-GAAP measurement is that it excludes depreciation and amortization expense. The Company mitigates this limitation by the provision of the specific detailed computation of the measurement, and by presenting this Non-GAAP measurement such that it is no more prominent in the Company’s filings than GAAP measures of profitability. |
|
Fiscal Years Ended September 30, |
||||||||||||||||||||
|
2009 |
2008 |
2007 |
2006 |
2005 |
||||||||||||||||
|
(Dollars in Thousands) |
||||||||||||||||||||
|
Net income (loss) |
$ | (1,239 | ) | $ | 15,314 | $ | 21,118 | $ | 12,004 | $ | 4,505 | |||||||||
|
Add to/(deduct from) net income (loss) |
||||||||||||||||||||
|
(Income) loss from discontinued operations |
- | 68 | (1,356 | ) | 1,459 | 497 | ||||||||||||||
|
Provision for income taxes |
494 | 5,832 | 6,712 | 5,836 | 218 | |||||||||||||||
|
Other (income) expense |
582 | 431 | 115 | (75 | ) | 149 | ||||||||||||||
|
Interest expense, net |
2,230 | 4,062 | 3,227 | 2,091 | 2,836 | |||||||||||||||
|
Goodwill impairment |
3,450 | - | - | - | - | |||||||||||||||
|
Long-lived asset impairment, restructuring and other costs (income) |
(175 | ) | (1,348 | ) | (997 | ) | 118 | 488 | ||||||||||||
|
Depreciation and amortization |
7,361 | 7,531 | 7,251 | 7,386 | 7,772 | |||||||||||||||
|
Selling, general and administrative expenses |
36,679 | 41,254 | 37,676 | 34,284 | 37,001 | |||||||||||||||
|
Gross profit |
$ | 49,382 | $ | 73,144 | $ | 73,746 | $ | 63,103 | $ | 53,466 | ||||||||||
Item 7. Management’s Discussion and Analysis of Financial Condition and Results of Operations
Introduction
The Company’s revenues are primarily derived from (1) toll services and (2) product sales in the polymers processing industry. “Toll services” or “tolling” refers to processing customer-owned material for a service fee. Product sales entail the Company purchasing resin (primarily polyethylene) and
other raw materials which are further processed within the Company’s operating facilities. The further processing of raw materials may involve size reduction services, compounding services, and the production of masterbatches. Compounding services involve melt blending various resins and additives to produce a homogeneous material. Compounding services include the manufacture and sale of concentrates. Concentrates are polymers loaded with high levels of chemical and organic
additives that are melt blended into base resins to give plastic films and other finished products desired physical properties. Masterbatches are concentrates that incorporate all additives a customer needs into a single package for a particular product manufacturing process, as opposed to requiring numerous packages. After processing, the Company sells the finished products to customers. Toll services involve both size reduction and compounding services whereby these services
are performed on customer-owned material.
19
The Company’s management structure is organized into five reportable business segments defined as ICO Polymers North America, ICO Brazil, Bayshore Industrial, ICO Europe and ICO Asia Pacific. This organization is consistent with the way information is reviewed and decisions are made by executive management.
The ICO Polymers North America, ICO Brazil, ICO Europe and ICO Asia Pacific segments primarily produce competitively priced polymer powders for the rotational molding industry and other specialty markets, including masterbatch and concentrate producers, users of polymer-based metal coatings, and non-woven textile markets. Additionally,
the above-referenced four segments provide specialty size reduction services on a tolling basis. The Bayshore Industrial segment designs and produces proprietary concentrates, masterbatches and specialty compounds primarily for the plastic film industry in North America and in selected export markets. The Company’s ICO Europe segment includes operations in France, Holland, Italy and the U.K. The Company’s ICO Asia Pacific segment includes operations in Australia, Malaysia and
New Zealand.
Cost of sales and services is primarily comprised of purchased raw materials (resins and various additives), compensation and benefits to non-administrative employees, electricity, repairs and maintenance, and occupancy costs and supplies. Selling, general and administrative (“SG&A”) expenses consist primarily
of compensation and related benefits paid to the sales and marketing, executive management, information technology, accounting, legal, human resources and other administrative employees of the Company, other sales and marketing expenses, communications costs, systems costs, insurance costs, consulting costs and legal and professional accounting fees.
Demand for the Company’s products and services tend to be driven by overall economic factors and, particularly, consumer spending. The current downturn in the U.S. and global economies has had an impact on the demand for our products and services. The trend of applicable resin prices also impacts customer demand. As
resin prices fall, customers tend to reduce their inventories and, therefore, reduce their need for the Company’s products and services as customers choose to purchase resin upon demand rather than building large levels of inventory. Conversely, as resin prices are rising, customers often increase their inventories and accelerate their purchases of products and services from the Company to help control their raw material costs. Historically, resin price changes have generally followed
the trend of oil and natural gas prices, and we believe that this trend will continue in the future.
During fiscal year 2009, the Company recorded a charge to fully impair goodwill in its Australia and New Zealand reporting units. Refer to Note 4 – “Goodwill” in the Company’s Consolidated Financial Statements.
Critical Accounting Policies
The Company’s discussion and analysis of its financial condition and results of operations are based upon our consolidated financial statements, which have been prepared in accordance with accounting principles generally accepted in the United States (“US GAAP”). The consolidated financial statements are impacted
by the accounting policies applied and the estimates and assumptions made by management during their preparation. Management believes the following critical accounting policies affect its more significant judgments and estimates used in the preparation of the Company’s consolidated financial statements.
Use of Estimates - The preparation of financial statements in conformity with US GAAP requires management to make estimates and assumptions that affect the reported amounts of assets and liabilities and disclosure of contingent assets and liabilities, if any, at the date of the financial
statements and the reported amounts of revenues and expenses during the reporting period. The more significant areas requiring use of estimates relate to valuation allowances for deferred tax assets, workers compensation, inventory reserves, and allowance for doubtful accounts related to accounts receivable and commitments and contingencies, including legal and environmental claims.
Valuation of deferred tax assets is based upon estimates of future pretax income in each taxing jurisdiction in determining the ability to realize the deferred tax assets. Estimates for workers’ compensation liabilities are required because the Company is partially self-insured in the United States, with stop loss insurance
coverage limiting the exposure per claim. Estimates are made for ultimate costs associated with workers’ compensation claims. Inventory reserves are estimated based upon the Company’s review of its inventory. This review requires the Company to estimate the fair market value of certain inventory that has become old or obsolete. Determining the amount of the allowance for doubtful accounts involves estimating the collectability of customer accounts receivable
balances. Estimates relating to commitments and contingencies pertain primarily to litigation and claims, for which the Company evaluates relevant facts and circumstances, and applicable laws and regulations, to determine how much expense, if any, the Company should record. Actual results could differ from the estimates discussed above. Management believes that its estimates are reasonable.
20
Revenue and Related Cost Recognition - The Company’s accounting policy regarding revenue recognition is to recognize revenue when all of the following criteria are met:
|
§ |
Persuasive evidence of an arrangement exists: The Company has received an order from a customer. |
|
§ |
Delivery has occurred or services have been rendered: |
|
§ |
For product sales, revenue recognition occurs when title and risk of ownership have passed to the customer. |
|
§ |
For service revenue, revenue recognition occurs upon the completion of service. |
|
§ |
Seller’s price to the buyer is fixed or determinable: Sales prices are agreed upon with the customer before delivery has occurred or the services have been rendered. |
|
§ |
Collectability is reasonably assured: The Company has a customer credit policy to ensure collectability is reasonably assured. |
Impairment of Long-lived Assets - Property, plant and equipment are reviewed for impairment whenever an event or change in circumstances indicates the carrying amount of an asset or group of assets may not be recoverable. The impairment review includes comparison of undiscounted
future cash flows expected to be generated by the asset or group of assets with the associated assets’ carrying value. If the carrying value of the asset or group of assets exceeds the expected future cash flows (undiscounted and without interest charges), an impairment loss is recognized to the extent that the carrying amount of the asset exceeds its fair value.
Goodwill – The Company does not amortize goodwill. However, the Company tests annually for impairment and in interim periods if certain events occur indicating that the carrying value of goodwill and/or indefinite-lived intangible assets may be impaired. We test
for goodwill impairment loss under a two-step approach. The first step of the goodwill impairment test compares the fair value of the reporting unit with its carrying amount, including goodwill. The fair value of the reporting unit is estimated using a combination of the market approach and the income approach. If the carrying amount of a reporting unit exceeds its fair value, the second step of the goodwill impairment test is performed to measure the amount of the impairment
loss. This is determined by comparison of the implied fair value of the reporting units’ goodwill with the carrying amount of that goodwill. If the carrying amount of the reporting units’ goodwill exceeds the implied fair value of that goodwill, we recognize an impairment loss as expense. At September 30, 2009, the Company’s remaining goodwill is recorded in its Bayshore Industrial segment. For fiscal year 2009, the Company performed goodwill impairment
testing twice, once at September 30, 2009 as required, which resulted in no impairment loss being recognized, and also earlier in the fiscal year at March 31, 2009. The impairment testing at March 31, 2009 resulted in a full impairment of all goodwill in the Company’s Asia Pacific segment. Refer to Note 4 – “Goodwill” in the Company’s Consolidated Financial Statements for additional information regarding
our fiscal year 2009 goodwill impairment testing.
Stock-based Compensation - The Company expenses stock-based payment transactions using the grant-date fair value-based method. Outstanding awards under
the Company’s stock-based compensation plans vest over periods ranging from immediate vesting to four years. The Company expenses the fair value of stock option and restricted stock awards over the vesting period, where applicable. In awards with a graded vesting schedule, the Company recognizes the fair value of the stock-based award over the requisite service period for the entire award and ensures that the amount recognized at any date at least equals the portion of the grant-date
value of the stock-based compensation that has vested.
Income Taxes - The provision for income taxes includes federal, state and foreign income taxes currently payable and deferred based on currently enacted tax laws. Deferred income taxes are provided for the tax consequences
of differences between the financial statement and tax basis of assets and liabilities. The Company reduces deferred tax assets by a valuation allowance when, based on its estimates, it is more likely than not that a portion of those assets will not be realized in a future period.
Results of Operations
The following discussion regarding our financial performance during the past three fiscal years should be read in conjunction with the consolidated financial statements and the notes to the consolidated financial statements.
21
Executive Summary
During fiscal year 2009 our business was negatively impacted by two primary factors: lower demand from customers as a result of the global economic downturn and an unprecedented rapid and steep drop in resin prices that occurred in the three month period ended December 31, 2008. Volumes declined 18% in fiscal year 2009 compared to fiscal
year 2008 as demand for our customers’ products declined, and, we believe, because the majority of our customers operated with relatively lean inventory positions due to the uncertainty surrounding resin prices and demand. The unprecedented drop in resin prices in the first quarter of fiscal year 2009 led to reduced margins in that period. Our gross margins improved over the remainder of the fiscal year as resin prices became more stable.
Year Ended September 30, 2009 Compared to the Year Ended September 30, 2008
|
Summary Financial Information |
||||||||||||||||
|
Fiscal Year Ended |
||||||||||||||||
|
September 30, |
||||||||||||||||
|
2009 |
2008 |
Change |
% Change |
|||||||||||||
|
(Dollars in Thousands) |
||||||||||||||||
|
Total revenues |
$ | 299,965 | $ | 446,701 | $ | (146,736 | ) | (33% | ) | |||||||
|
SG&A (1) |
36,679 | 41,254 | (4,575 | ) | (11% | ) | ||||||||||
|
Operating income |
2,067 | 25,707 | (23,640 | ) | (92% | ) | ||||||||||
|
Income (loss) from continuing operations |
(1,239 | ) | 15,382 | (16,621 | ) | (108% | ) | |||||||||
|
Net income (loss) |
$ | (1,239 | ) | $ | 15,314 | $ | (16,553 | ) | (108% | ) | ||||||
| 261,000 | 318,700 | (57,700 | ) | (18% | ) | |||||||||||
|
Gross margin (3) |
16.5% | 16.4% | 0.1% | |||||||||||||
|
SG&A as a percentage of revenue |
12.2% | 9.2% | 3.0% | |||||||||||||
|
Operating income as a percentage of revenue |
0.7% | 5.8% | (5.1% | ) | ||||||||||||
(1) “SG&A” is defined as selling, general and administrative expense.
(2) “Volumes” refers to total metric tons of materials for which the Company’s customers are invoiced, either in connection with product sales or the performance of toll processing services.
(3) The Company has presented a measurement, gross margin (computed as gross profit divided by revenues), that is not calculated in accordance with generally accepted accounting principles in the United States (a “Non-GAAP measurement”), but that is derived from relevant items in the Company’s financial statements
prepared in accordance with US GAAP. The Company presents this measurement because the Company uses this measurement as an indicator of the income the Company generates from its revenues. The material limitation of this Non-GAAP measurement is that it excludes depreciation and amortization expense. The Company mitigates this limitation by the provision of the specific detailed computation of the measurement, and by presenting this Non-GAAP measurement such that it is no more prominent in the Company’s
filings than GAAP measures of profitability.
Revenues. Total revenues decreased $146.7 million or 33% to $300.0 million during fiscal year 2009 compared to fiscal year 2008. The change in revenues is a result of a decline in volumes
sold by us (“volume”), unfavorable changes in selling prices and mix of finished products sold or services performed (“price/product mix”) and, finally, the unfavorable impact from changes in foreign currencies relative to the U.S. Dollar (“translation effect”). Due to the variance in average prices between our product sales revenues and our toll processing revenues due to the raw material component embedded in the product sales average price, we compute the volume
impacts and the price/product mix impacts separately for each of those components and then combine them in the table that follows.
The components of the $146.7 million and 33% decrease in revenues are:
|
Decrease in Revenues |
||||||||
| $ | % | |||||||
|
(Dollars in Thousands) |
||||||||
|
Volume |
$ | (68,628 | ) | (15% | ) | |||
|
Price/product mix |
(44,406 | ) | (10% | ) | ||||
|
Translation effect |
(33,702 | ) | (8% | ) | ||||
|
Total change in revenue |
$ | (146,736 | ) | (33% | ) | |||
22
Our revenues are impacted by product sales mix as well as the change in our raw material prices (“resin prices”). As resin prices increase or decrease, market prices for our products will generally also increase or decrease. Typically, this will lead to higher or lower average selling prices. During
fiscal year 2009, average resin prices were lower than in fiscal year 2008 in all our regions. Although we participate in numerous markets and purchase numerous grades of resin, the graph below illustrates the general trend in the prices of resin typically purchased by the Company.
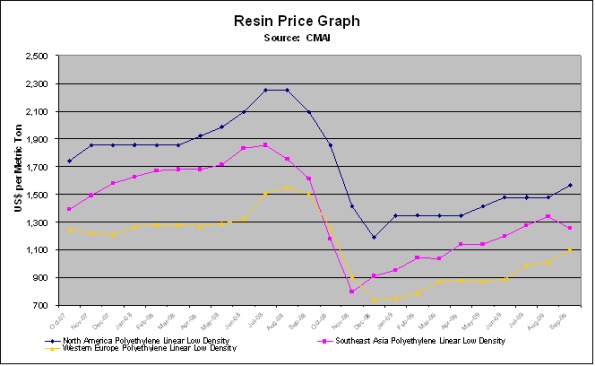
Total volumes sold decreased 57,700 metric tons, or 18%, during fiscal year 2009 to 261,000 metric tons. This decrease in volumes sold led to a decrease in revenues of $68.6 million. The volume decline was primarily as a result of reduced customer demand due to the global economic recession. The translation effect
of changes in foreign currencies relative to the U.S. Dollar caused a decrease in revenues of $33.7 million in fiscal year 2009 compared to fiscal year 2008. This revenue change was primarily due to a stronger U.S. Dollar compared to the European, Australian and Brazilian currencies.
Revenues by segment for the year ended September 30, 2009 compared to the year ended September 30, 2008
|
Fiscal Year Ending September 30, |
||||||||||||||||||||||||
|
2009 |
% of Total |
2008 |
% of Total |
Change |
% |
|||||||||||||||||||
|
(Dollars in Thousands) |
||||||||||||||||||||||||
|
ICO Europe |
$ | 135,006 | 45% | $ | 207,209 | 46% | $ | (72,203 | ) | (35% | ) | |||||||||||||
|
Bayshore Industrial |
65,221 | 22% | 90,736 | 20% | (25,515 | ) | (28% | ) | ||||||||||||||||
|
ICO Asia Pacific |
54,397 | 18% | 82,390 | 19% | (27,993 | ) | (34% | ) | ||||||||||||||||
|
ICO Polymers North America |
32,248 | 11% | 45,090 | 10% | (12,842 | ) | (28% | ) | ||||||||||||||||
|
ICO Brazil |
13,093 | 4% | 21,276 | 5% | (8,183 | ) | (38% | ) | ||||||||||||||||
|
Total |
$ | 299,965 | 100% | $ | 446,701 | 100% | $ | (146,736 | ) | (33% | ) | |||||||||||||
23


ICO Europe’s revenues decreased $72.2 million or 35%, due to a decrease in average selling prices as a result of lower resin prices which decreased revenues by $26.6 million, a decrease in volumes sold of 14% caused by the global economic downturn led to a decrease in revenues of $25.8 million, and the translation effect of weaker
European currencies relative to the U.S. Dollar contributed $19.8 million to the revenue decrease.
Bayshore Industrial’s revenues decreased $25.5 million or 28%, due to a decline in volumes sold of 18% caused by the global economic downturn, which reduced revenues by $16.8 million and an unfavorable change in product mix and lower average selling prices which led to an $8.7 million decrease in revenues.
ICO Asia Pacific’s revenues decreased $28.0 million or 34%. The translation effect of the stronger U.S. Dollar relative to the Australian Dollar, New Zealand Dollar and Malaysian Ringgit decreased revenues by $10.6 million. Lower average selling prices as a result of lower resin prices reduced revenues by $9.5 million. A decline
in volumes sold caused by reduced customer demand and the global economic downturn reduced revenues by $7.9 million.
ICO Polymers North America’s revenues decreased $12.8 million or 28% due to a decrease in volumes sold caused by the global economic downturn, which reduced revenues by $12.9 million.
ICO Brazil’s revenues decreased $8.2 million or 38% due to a decrease in volumes of 16% ($5.2 million revenue impact) caused by the global economic downturn, and the translation effect of a weaker Brazilian Real compared to the U.S. Dollar, which reduced revenues by $3.3 million.
Gross Margins. Consolidated gross margins (calculated as the difference between revenues and cost of sales and services, excluding depreciation, divided by revenues) increased slightly from 16.4% to 16.5%. The decline in resin prices in fiscal year 2009 compared
to fiscal year 2008 led to improved gross margins. This improvement was almost completely offset by the lower volumes sold and due to lower feedstock margins (the difference between product sales revenues and related cost of raw materials sold). The decline in volumes sold was primarily caused by the global economic downturn and the dramatic downward trend in resin prices in the first quarter of fiscal year 2009, both of which led to reduced customer demand. The decline in feedstock
margins was primarily caused by the unfavorable resin price environment in the three months ended December 31, 2008. The unfavorable resin price environment was caused by resin prices reaching historically high levels in the fourth quarter of fiscal year 2008, followed by the rapid and dramatic fall in resin prices in the first quarter of fiscal year 2009. This combination led to a reduction in our feedstock margins.
Selling, General and Administrative. Selling, general and administrative expenses (“SG&A”) decreased $4.6 million or 11% during fiscal year 2009 compared to fiscal year 2008. This decrease was caused primarily by the impact from weaker foreign
currencies of $3.3 million, lower compensation costs of $1.0 million and lower travel cost and other SG&A of $1.0 million. This decrease was partially offset by higher bad debt expense of $0.7 million. As a percentage of revenues, SG&A increased from 9.2% to 12.2% due to lower revenues.
24
Long-lived asset impairment, restructuring and other costs (income). We recorded a net benefit from insurance proceeds of $0.4 million and $1.9 million in fiscal years 2009 and 2008, respectively, associated with fires that occurred in our New Jersey facility in 2007 and
2008.
During the fourth quarter of fiscal year 2008, the Company closed its plant in the United Arab Emirates and recorded a $0.4 million impairment related to property, plant and equipment in fiscal year 2008 and recognized $0.4 million of closure costs in fiscal year 2009.
We recorded a net insurance reimbursement of $0.4 million in fiscal year 2009 related to financial losses resulting from the loss of power experienced at our Bayshore Industrial location as a result of Hurricane Ike.
We also recognized $0.2 million of equipment impairments in our Asia Pacific region in fiscal year 2009.
During fiscal year 2008, the Company incurred costs of $0.1 million as a result of Hurricane Ike, which caused minor damage to our China, Texas plant.
As a result of the above, we recorded a net gain of $0.2 million and $1.3 million for fiscal years 2009 and 2008, respectively in impairment, restructuring and other costs (income) related to long-lived assets.
Goodwill impairment. We recorded an impairment of goodwill in our Asia Pacific segment in the amount of $3.5 million in fiscal year 2009. The goodwill impairments were $2.3 million and $1.2 million, respectively, at our Australia and New Zealand reporting units. Please
refer to Note 4 – “Goodwill” in the Company’s Consolidated Financial Statements, for additional disclosures related to the Company’s non-cash charge for goodwill impairment.
Operating income. Consolidated operating income was $2.1 million in fiscal year 2009, a decrease of $23.6 million or 92% from fiscal year 2008. This decrease was caused primarily by a decline in sales volumes and a decrease in feedstock margins, partially
offset by lower operating costs.
Operating income (loss) by segment and a discussion of significant segment changes for the fiscal year ended September 30, 2009 compared to fiscal year ended September 30, 2008 follows.
|
Operating income (loss) |
Fiscal Year Ended September 30, |
|||||||||||||||
|
2009 |
2008 |
Change |
% |
|||||||||||||
|
(Dollars in Thousands) |
||||||||||||||||
|
ICO Europe |
$ | 5,728 | $ | 13,201 | $ | (7,473 | ) | (57% | ) | |||||||
|
Bayshore Industrial |
6,157 | 10,241 | (4,084 | ) | (40% | ) | ||||||||||
|
ICO Asia Pacific |
(6,125 | ) | 1,822 | (7,947 | ) |
(436% |
) | |||||||||
|
ICO Polymers North America |
2,025 | 5,618 | (3,593 | ) | (64% | ) | ||||||||||
|
ICO Brazil |
178 | 982 | (804 | ) | (82% | ) | ||||||||||
|
Subtotal |
7,963 | 31,864 | (23,901 | ) | (75% | ) | ||||||||||
|
Unallocated General Corporate Expense |
(5,896 | ) | (6,157 | ) | 261 | (4% | ) | |||||||||
|
Consolidated |
$ | 2,067 | $ | 25,707 | $ | (23,640 | ) | (92% | ) | |||||||
25
|
Operating income (loss) as a percentage of revenues |
Fiscal Year Ended September 30, |
|||||||||||
|
2009 |
2008 |
Increase/
(Decrease) |
||||||||||
|
ICO Europe |
4% | 6% | (2% | ) | ||||||||
|
Bayshore Industrial |
9% | 11% | (2% | ) | ||||||||
|
ICO Asia Pacific |
(11% | ) | 2% | (13% | ) | |||||||
|
ICO Polymers North America |
6% | 12% | (6% | ) | ||||||||
|
ICO Brazil |
1% | 5% | (4% | ) | ||||||||
|
Consolidated |
1% | 6% | (5% | ) | ||||||||
ICO Europe’s operating income decreased $7.5 million or 57% due primarily to a decrease in volumes sold ($4.3 million impact) and feedstock margins ($0.7 million impact), as well as a negative impact of $0.7 million from the translation effect of a stronger U.S.
Dollar. In addition, a change in product mix negatively impacted operating income by $1.8 million.
Bayshore Industrial’s operating income fell $4.1 million or 40% primarily as a result of a decrease in volumes sold due to lower customer demand.
ICO Asia Pacific’s operating income decreased $7.9 million primarily as a result of a $3.5 million non-cash goodwill impairment charge and lower feedstock margins which contributed $4.0 million to the decline. Additionally, lower sales volumes negatively impacted operating income by $2.4 million. These items were partially
offset by lower plant operating costs of $2.5 million.
ICO Polymers North America’s operating income decreased $3.6 million or 64% primarily due to a reduction in volumes sold due to lower customer demand which impacted operating income by $1.5 million and as a result of lower net impairment, restructuring and other costs (income) of $1.5 million in fiscal year 2009 compared to fiscal
year 2008.
ICO Brazil’s operating income decreased $0.8 million or 82% primarily caused by the reduction in volumes sold due to lower customer demand, partially offset by improvement in feedstock margins.
Interest expense, net. Interest expense, net of interest income, decreased $1.8 million or 45% in fiscal year 2009 compared to fiscal year 2008. This was primarily a result of reduced borrowings.
Income taxes. Our effective income tax rate was an expense of 66% during fiscal year 2009 compared to an expense of 27% during fiscal year 2008. The higher effective tax rate in the current fiscal year was primarily a result of the goodwill impairment
of $3.5 million, which is not tax deductible.
Net Income (loss). Net income (loss) decreased from income of $15.3 million in fiscal year 2008 to a loss of $1.2 million in fiscal year 2009 due to the factors discussed above.
Foreign Currency Translation. The fluctuations of the U.S Dollar against the Euro, British Pound, New Zealand Dollar, Brazilian Real, Malaysian Ringgit and the Australian Dollar have impacted the translation of revenues and expenses of our international operations. The
table below summarizes the impact of changing exchange rates for the above currencies during fiscal year 2009.
|
Revenues |
$(33.7) million | |
|
Operating income |
0.7 million | |
|
Pre-tax income (loss) |
0.9 million | |
|
Net income (loss) |
0.8 million |
26
Year Ended September 30, 2008 Compared to the Year Ended September 30, 2007
|
Summary Financial Information |
||||||||||||||||
|
Fiscal Year Ended |
||||||||||||||||
|
September 30, |
||||||||||||||||
|
2008 |
2007 |
Change |
% Change |
|||||||||||||
|
(Dollars in Thousands) |
||||||||||||||||
|
Total revenues |
$ | 446,701 | $ | 417,917 | $ | 28,784 | 7% | |||||||||
|
SG&A (1) |
41,254 | 37,676 | 3,578 | 9% | ||||||||||||
|
Operating income |
25,707 | 29,816 | (4,109 | ) | (14% | ) | ||||||||||
|
Income from continuing operations |
15,382 | 19,762 | (4,380 | ) | (22% | ) | ||||||||||
|
Net income |
$ | 15,314 | $ | 21,118 | $ | (5,804 | ) | (27% | ) | |||||||
|
Volumes (2) |
318,700 | 338,500 | (19,800 | ) | (6% | ) | ||||||||||
|
Gross margin (3) |
16.4% | 17.6% | (1.2% | ) | ||||||||||||
|
SG&A as a percentage of revenue |
9.2% | 9.0% | 0.2% | |||||||||||||
|
Operating income as a percentage of revenue |
5.8% | 7.1% | (1.3% | ) | ||||||||||||
(1) “SG&A” is defined as selling, general and administrative expense.
(2) “Volumes” refers to total metric tons of materials for which the Company’s customers are invoiced, either in connection with product sales or the performance of toll processing services.
(3) The Company has presented a measurement, gross margin (computed as gross profit divided by revenues), that is not calculated in accordance with generally accepted accounting principles in the United States (a “Non-GAAP measurement”), but that is derived from relevant items in the Company’s financial statements
prepared in accordance with US GAAP. The Company presents this measurement because the Company uses this measurement as an indicator of the income the Company generates from its revenues. The material limitation of this Non-GAAP measurement is that it excludes depreciation and amortization expense. The Company mitigates this limitation by the provision of the specific detailed computation of the measurement, and by presenting this Non-GAAP measurement such that it is no more prominent in the Company’s
filings than GAAP measures of profitability.
Revenues. Total revenues increased $28.8 million or 7% to $446.7 million during fiscal year 2008 compared to fiscal year 2007. The change in revenues is a result of the changes in volumes
sold by us (“volume”), changes in selling prices and mix of finished products sold or services performed (“price/product mix”) and, finally, the impact from changes in foreign currencies relative to the U.S. Dollar (“translation effect”). Due to the variance in average prices between our product sales revenues and our toll processing revenues due to the raw material component embedded in the product sales average price, we compute the volume impacts and the price/product
mix impacts separately for each of those components and then combine them in the table that follows.
The components of the $28.8 million and 7% increase in revenues are:
|
Increase on Revenues |
||||||||
| $ | % | |||||||
|
(Dollars in Thousands) |
||||||||
|
Volume |
$ | (11,200 | ) | (3% | ) | |||
|
Price/product mix |
10,904 | 3% | ||||||
|
Translation effect |
29,080 | 7% | ||||||
|
Total change in revenue |
$ | 28,784 | 7% | |||||
Our revenues are impacted by product sales mix as well as the change in our raw material prices (“resin prices”). As resin prices increase or decrease, market prices for the Company’s products will generally also increase or decrease. Typically, this will lead to higher or lower average selling prices. During
fiscal year 2008, average resin prices were higher than in fiscal year 2007 in all our regions.
27
Total volumes sold decreased 19,800 metric tons, or 6%, during fiscal year 2008 to 318,700 metric tons. This decrease in volumes sold led to a decrease in revenues of $11.2 million. Bayshore Industrial’s volumes fell 12%, which reduced revenue by $12.5 million, primarily as a result of reduced customer demand
and market conditions. Our Australian division’s volumes declined 28% in fiscal year 2008, which decreased revenues by $17.0 million, due to reduced customer demand in the water tank market. These amounts were partially offset by volume improvements in our Malaysian and Brazilian divisions. The translation effect of changes in foreign currencies relative to the U.S. Dollar caused an increase
in revenues of $29.1 million in fiscal year 2008 compared to fiscal year 2007. This revenue change was primarily due to stronger European, Australian and Brazilian currencies compared to the U.S. Dollar.
Revenues by segment for the year ended September 30, 2008 compared to the year ended September 30, 2007
|
Fiscal Year Ending September 30, |
||||||||||||||||||||||||
|
2008 |
% of Total |
2007 |
% of Total |
Change |
% |
|||||||||||||||||||
|
(Dollars in Thousands) |
||||||||||||||||||||||||
|
ICO Europe |
$ | 207,209 | 46% | $ | 170,135 | 41% | $ | 37,074 | 22% | |||||||||||||||
|
Bayshore Industrial |
90,736 | 20% | 108,360 | 26% | (17,624 | ) | (16% | ) | ||||||||||||||||
|
ICO Asia Pacific |
82,390 | 19% | 84,790 | 20% | (2,400 | ) | (3% | ) | ||||||||||||||||
|
ICO Polymers North America |
45,090 | 10% | 41,377 | 10% | 3,713 | 9% | ||||||||||||||||||
|
ICO Brazil |
21,276 | 5% | 13,255 | 3% | 8,021 | 61% | ||||||||||||||||||
|
Total |
$ | 446,701 | 100% | $ | 417,917 | 100% | $ | 28,784 | 7% | |||||||||||||||

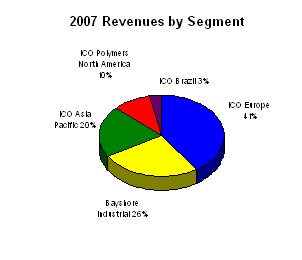
In fiscal year 2008, ICO Europe’s revenues increased $37.1 million or 22%, in part due to the translation effect of stronger European currencies relative to U.S. Dollar, which contributed $18.7 million to the revenue increase. Additionally, an increase in average selling prices in Europe due in part to higher resin costs
resulted in an increase of $17.6 million in our revenues.
Bayshore Industrial’s revenues decreased $17.6 million or 16% due to a decline in volumes sold due to reduced customer demand, general market conditions and, to a lesser extent, the impact of Hurricane Ike. Hurricane Ike hit the Houston area on September 13, 2008, causing the Bayshore Industrial facility to lose power
for several days. An unfavorable change in product mix led to a $5.1 million decrease in our revenues.
ICO Asia Pacific’s fiscal year 2008 revenues decreased $2.4 million or 3%. A decline in volumes sold in this segment caused by reduced customer demand reduced our revenues by $5.3 million. This reduction in customer demand occurred primarily in our Australian locations, where revenues fell $17.0 million as a
result of lower volumes. This was partially offset by an increase in volumes sold by our Malaysian location. Lower average selling prices due to challenging market conditions and changes in product mix negatively impacted revenues by $4.1 million. Partially offsetting these declines was the translation effect of the stronger Australian and New Zealand Dollar and Malaysian Ringgit, which increased revenues by $7.0 million.
28
ICO Polymers North America’s revenues increased $3.7 million or 9% due to an increase in average selling prices as a result of higher resin prices.
ICO Brazil’s revenues increased $8.0 million or 61% due to an increase in volumes of 24% ($5.1 million revenue impact), and the translation effect of a stronger Brazilian Real compared to the U.S. Dollar of $3.4 million.
Gross Margins. Consolidated gross margins (calculated as the difference between revenues and cost of sales and services, excluding depreciation, divided by revenues) decreased from 17.6% to 16.4%. Gross margins declined as a result of several items. First,
our product sales mix changed. Revenues increased at our European segment, which generally has lower gross margins than the rest of the Company. Revenues at our Bayshore Industrial segment, which has higher gross margins than the rest of the Company, declined. Also, the increase in resin prices in fiscal year 2008 compared to the prior year had the effect of increasing our average selling prices and revenue base without a corresponding increase in gross profit by the same percentage,
resulting in a lower gross margin. Additionally, higher operating costs per metric ton, including increased logistics and electricity costs, and lower margins in our Asia Pacific segment, contributed to the reduction in gross margins. These items were partially offset by an increase in our feedstock margins (the difference between product sales revenues and related costs of raw materials sold).
Selling, General and Administrative. Selling, general and administrative expenses increased $3.6 million or 9% during fiscal year 2008 compared to fiscal year 2007. The increase of $3.6 million was caused primarily by the impact from stronger foreign currencies
of $2.2 million, higher external professional fees of $0.6 million and increased bad debt expense of $0.4 million. As a percentage of revenues, SG&A increased from 9.0% to 9.2%.
Long-lived asset impairment, restructuring and other costs (income). On July 2, 2007, our facility in New Jersey suffered a fire that damaged certain equipment and one of the facility’s buildings. We recorded a net gain from insurance proceeds of $2.7
million in fiscal year 2008.
On July 26, 2008, our facility in New Jersey suffered a second fire which caused damage to one of the facility’s buildings. In connection with the 2008 fire, we recorded a net loss of $0.8 million in the fourth quarter of fiscal year 2008 in impairment, restructuring and other costs (income).
During the fourth quarter of fiscal year 2008, we decided to close our plant in the United Arab Emirates. As a result of the closure, we recorded a $0.4 million impairment related to property, plant and equipment.
During the fourth quarter of fiscal year 2008, we incurred costs of $0.1 million as a result of Hurricane Ike, which caused minor damage to our China, Texas plant.
As a result of the 2007 and 2008 fires, the United Arab Emirates plant closure, and the costs incurred as a result of Hurricane Ike, we recorded a net gain of $1.3 million for fiscal year 2008 in impairment, restructuring and other costs (income).
During fiscal year 2007, we recorded a net gain of $1.0 million in impairment, restructuring and other costs. We recorded a net gain of $0.9 million associated with the July 2007 fire. We also impaired property, plant and equipment in two of our locations outside of the United States for $0.6 million, and recorded
a pre-tax gain of $0.6 million related to the sale of real estate previously owned by our Dutch subsidiary.
Operating income. Consolidated operating income was $25.7 million in fiscal year 2008, a decrease of $4.1 million or 14% from fiscal year 2007. This decrease was caused primarily by a decline in sales volumes and an increase in operating and production
costs.
Operating income (loss) by segment and a discussion of significant segment changes for the fiscal year ended September 30, 2008 compared to fiscal year ended September 30, 2007 follows.
29
Operating income (loss) by segment for the year ended September 30, 2008 compared to the year ended September 30, 2007
|
Operating income (loss) |
Fiscal Year Ended September 30, |
|||||||||||||||
|
2008 |
2007 |
Change |
% |
|||||||||||||
|
(Dollars in Thousands) |
||||||||||||||||
|
ICO Europe |
$ | 13,201 | $ | 9,008 | $ | 4,193 | 47% | |||||||||
|
Bayshore Industrial |
10,241 | 15,358 | (5,117 | ) | (33% | ) | ||||||||||
|
ICO Asia Pacific |
1,822 | 5,914 | (4,092 | ) | (69% | ) | ||||||||||
|
ICO Polymers North America |
5,618 | 6,022 | (404 | ) | (7% | ) | ||||||||||
|
ICO Brazil |
982 | 301 | 681 | 226% | ||||||||||||
|
Total reportable segments |
31,864 | 36,603 | (4,739 | ) | (13% | ) | ||||||||||
|
Unallocated General Corporate Expense |
(6,157 | ) | (6,787 | ) | 630 | (9% | ) | |||||||||
|
Consolidated |
$ | 25,707 | $ | 29,816 | $ | (4,109 | ) | (14% | ) | |||||||
|
Operating income (loss) as a percentage of revenues |
Fiscal Year Ended September 30, |
|||||||||||
|
2008 |
2007 |
Increase
(Decrease) |
||||||||||
|
ICO Europe |
6% | 5% | 1% | |||||||||
|
Bayshore Industrial |
11% | 14% | (3% | ) | ||||||||
|
ICO Asia Pacific |
2% | 7% | (5% | ) | ||||||||
|
ICO Polymers North America |
12% | 15% | (3% | ) | ||||||||
|
ICO Brazil |
5% | 2% | 3% | |||||||||
|
Consolidated |
6% | 7% | (1% | ) | ||||||||
In fiscal year 2008, ICO Europe’s operating income increased $4.2 million or 47% due primarily to an improvement in product sales volumes and feedstock margins. Additionally, the effect of the stronger European currencies compared to the U.S. Dollar improved operating income by $1.3 million.
Bayshore Industrial’s operating income decreased $5.1 million or 33% due primarily from a decline in volumes sold and an increase in production costs per metric ton.
ICO Asia Pacific’s operating income decreased $4.1 million or 69% as a result of a decrease in volumes sold, an increase in operating costs and, to a lesser extent, changes in product mix. The higher operating costs were primarily caused by an increase in logistics costs. Additionally, an increase in impairment,
restructuring and other costs of $0.4 million, as a result of the decision to close our facility in the United Arab Emirates, reduced ICO Asia Pacific’s operating income in fiscal year 2008.
ICO Polymers North America’s operating income decreased $0.4 million or 7%. The decrease was primarily a result of reduced volumes sold due in part to our relocation of our New Jersey facility to Pennsylvania which took place over the course of fiscal year 2008. This was partially offset by an increase in impairment,
restructuring and other income of $1.0 million primarily due to an increase in insurance recoveries in current fiscal year 2008.
ICO Brazil’s operating income improved $0.7 million or 226% over fiscal year 2007 due to growth in volumes sold due to an increase in customer demand as well as an improvement in feedstock margins.
General corporate expenses decreased $0.6 million or 9% due primarily to an increase in the allocation of corporate expenses to our business units of $1.4 million, offset partially by increases in external professional fees of $0.6 million and other smaller increases in expenses.
Interest expense, net. Interest expense, net of interest income, increased $0.8 million in fiscal year 2008 compared to the prior year. This increase was a result of an increase in borrowings to finance an increase in working capital throughout most of fiscal year 2008.
Income taxes. Our effective income tax rate was an expense of 27% during fiscal year 2008, compared to an expense of 25% during fiscal year 2007. The increase was primarily due to the reversal of the valuation allowance in our Brazilian subsidiary of $0.7 million
which was less than the prior year reversal of the valuation allowance in our Italian subsidiary of $1.4 million.
30
Income from continuing operations. Income from continuing operations decreased from $19.8 million in fiscal year 2007 to $15.4 million in fiscal year 2008 due to the factors discussed above.
Income (loss) from discontinued operations. The income from discontinued operations during the fiscal year 2007 relates to the settlement we entered into with our insurance carrier related to the indemnity claims asserted by National Oilwell Varco, Inc. for $2.3 million.
Net Income. Net Income decreased from $21.1 million in fiscal year 2007 to $15.3 million in fiscal year 2008 due to the factors discussed above.
Foreign Currency Translation. The fluctuations of the U.S Dollar against the Euro, British Pound, New Zealand Dollar, Brazilian Real, Malaysian Ringgit and the Australian Dollar impacted the translation of revenues and expenses of our international operations. The
table below summarizes the impact of changing exchange rates for the above currencies during fiscal year 2008.
|
Revenues |
$29.1 million | |
|
Operating income |
1.6 million | |
|
Pre-tax income |
1.3 million | |
|
Net income |
1.0 million |
Liquidity and Capital Resources
Executive Summary. In fiscal year 2009, we increased our cash balance by $16.3 million and reduced our debt outstanding by $18.1 million. We were able to achieve these two items as a result of the positive cash flow from operations and by reducing accounts receivable
and inventory. Accounts receivable and inventory decreased due to the lower business volumes we experienced in fiscal year 2009, lower average resin prices and our internal focus on managing accounts receivable and inventory. Our available borrowing capacity as of September 30, 2009 was $50.5 million. The primary uses of cash for other than operations are generally capital expenditures, debt service and share repurchases. Presently, we anticipate that cash flow from operations
and availability under credit facilities will be sufficient to meet our short and long-term operational requirements.
The following are considered by management as our key measures of liquidity:
|
2009 |
2008 | ||
|
Cash and cash equivalents |
$21.9 million |
$5.6 million | |
|
Working capital |
$64.1 million |
$67.0 million | |
|
Total Outstanding Debt |
$31.8 million |
$49.9 million | |
|
Available Borrowing Capacity |
$50.5 million |
$62.8 million |
Cash and cash equivalents increased $16.3 million and working capital decreased $2.9 million during fiscal year 2009 due to the factors described below.
Cash Flows
|
Fiscal Year |
||||||||||||
|
2009 |
2008 |
2007 |
||||||||||
|
(Dollars in Thousands) |
||||||||||||
|
Net cash provided by operating activities by continuing operations |
$ | 38,178 | $ | 13,825 | $ | 19,375 | ||||||
|
Net cash used for operating activities by discontinued operations |
(103 | ) | (31 | ) | (294 | ) | ||||||
|
Net cash used for investing activities |
(3,438 | ) | (11,172 | ) | (10,662 | ) | ||||||
|
Net cash used for financing activities |
(19,410 | ) | (5,266 | ) | (17,736 | ) | ||||||
|
Effect of exchange rate changes |
1,064 | (328 | ) | 451 | ||||||||
|
Net increase/(decrease) in cash and cash equivalents |
$ | 16,291 | $ | (2,972 | ) | $ | (8,866 | ) | ||||
31
Cash Flows From Operating Activities
During fiscal year 2009, we generated $38.2 million of cash provided by operating activities by continuing operations. The $38.2 million cash flow was an increase of $24.4 million compared to fiscal year 2008. Contributing to the increase were changes in inventory and accounts payable. Inventories were
a source of cash in the current year of $15.8 million compared to $4.5 million in the prior year period. This change was primarily due to lower inventory volumes at the end of fiscal year 2009 and lower average raw material costs. The use of cash for accounts payable decreased $21.0 million during fiscal year 2009 due to the timing of inventory purchases and the higher inventory levels at the end of fiscal year 2008. Partially offsetting these inflows was a decrease in the income
from continuing operations of $16.6 million during fiscal year 2009.
Net cash provided by operating activities by continuing operations during the fiscal year ended September 30, 2008 decreased $5.6 million compared to the fiscal year ended September 30, 2007. Contributing to the decrease was a decrease in the income from continuing operations of $4.4 million during fiscal year 2008. Additionally,
during fiscal year 2008, we used $27.2 million of cash for accounts payable compared to generating cash of $25.8 million for accounts payable in the prior year period. This change was due to the timing of inventory purchases and the higher inventory levels at the end of fiscal year 2007. Partially offsetting those declines were changes in inventory and accounts receivable. Inventories were a source
of cash in fiscal year 2008 of $4.5 million compared to a use of cash of $13.5 million in the fiscal year 2007. This change was primarily due to lower inventory volumes at the end of fiscal year 2008. Accounts receivable in fiscal year 2008 generated cash of $17.3 million compared to a use of cash for accounts receivable of $20.7 million in fiscal year 2007. This change is due to a decline in revenues in the three months ended September 30, 2008 compared to the revenues in the
three months ended September 30, 2007.
Cash Flows Used for Investing Activities
During fiscal year 2009, capital expenditures totaled $3.9 million and related primarily to our relocation from our New Jersey facility to Pennsylvania. Approximately 53% of the $3.9 million of capital expenditures was spent in the ICO Polymers North America segment. In fiscal year 2009, we received $0.9 million from
our insurance carrier for reimbursements of costs associated with fires in our New Jersey facility during 2008 and 2007; $0.5 million of this reimbursement related to actual asset losses and is classified in the statement of cash flows as investing activities.
Capital expenditures totaled $13.6 million during fiscal year 2008 and were related primarily to our relocation to Pennsylvania from our New Jersey facility. Approximately 58% of the $13.6 million of capital expenditures was spent in ICO Polymers North America segment. In fiscal year 2008, we received $2.3 million
from our insurance carrier for reimbursements of costs associated with fires in our New Jersey facility during 2008 and 2007; this $2.3 million is classified in the statement of cash flow as investing activities.
Cash Flows Provided (Used For) Financing Activities
Cash used for financing activities increased to $19.4 million during fiscal year 2009 compared to cash used of $5.3 million during fiscal year 2008. The change was primarily due to repayment of short term borrowings in fiscal year 2009 as a result of the cash flow generated by operating activities and due to lower cash from
exercised stock options.
Cash used for financing activities decreased to $5.3 million during fiscal year 2008 compared to cash used of $17.7 million during fiscal year 2007. The main reason for the decrease was the repurchase of our Preferred Stock in fiscal year 2007 for $28.5 million.
Financing Arrangements
We maintain several lines of credit. The credit facilities are collateralized by certain of our assets. The following table presents the borrowing capacity, outstanding borrowings and net availability under the various credit facilities in the Company’s domestic and foreign operations.
32
|
Domestic |
Foreign |
Total |
||||||||||||||||||||||
|
As of |
As of |
As of |
||||||||||||||||||||||
|
September 30, |
September 30, |
September 30, |
September 30, |
September 30, |
September 30, |
|||||||||||||||||||
|
2009 |
2008 |
2009 |
2008 |
2009 |
2008 |
|||||||||||||||||||
|
(Dollars in Millions) |
||||||||||||||||||||||||
|
Borrowing Capacity (a) |
$ | 10.6 | $ | 19.9 | $ | 39.9 | $ | 52.5 | $ | 50.5 | $ | 72.4 | ||||||||||||
|
Outstanding Borrowings |
- | - | - | 9.6 | - | 9.6 | ||||||||||||||||||
|
Net availability |
$ | 10.6 | $ | 19.9 | $ | 39.9 | $ | 42.9 | $ | 50.5 | $ | 62.8 | ||||||||||||
|
(a) Based on the credit facility limits less outstanding letters of credit. |
||||||||||||||||||||||||
We maintain a Credit Agreement (the “Credit Agreement”) with KeyBank National Association and Wells Fargo Bank National Association (collectively referred to herein as “KeyBank”), with a maturity date of October 2012. The KeyBank Credit Agreement was amended in March 2009 to modify, among other things,
certain definitions related to the financial covenants within the Credit Agreement. The capacity of our revolving credit facility was also reduced from $30.0 million to $20.0 million. Under the Credit Agreement, there is a total of $10.0 million outstanding in the form of term loans as of September 30, 2009.
The borrowing capacity of the $20.0 million revolving credit facility is based on our levels of domestic receivables and inventory. As of September 30, 2009, the borrowing capacity was $10.6 million. There were $1.7 million of letters of credit outstanding under the credit facility, but no borrowings were outstanding
under the revolving credit facility as of September 30, 2008 and September 30, 2009.
The Credit Agreement contains a variable interest rate and contains certain financial and nonfinancial covenants. During fiscal year 2008, we entered into interest rate swaps on our $6.7 million and $3.3 million term loans. The swaps lock in our interest rate on (i) the $6.7 million term loan at 2.82% plus the credit
spread on the corresponding debt, and (ii) on the $3.3 million term loan at 3.69% plus the credit spread on the corresponding debt. The interest rates as of September 30, 2009 were 6.6% and 7.9%, respectively.
The Credit Agreement establishing the credit facility contains financial covenants, including:
|
· |
A minimum tangible net worth requirement, as defined under the Credit Agreement, of $50.0 million plus 50% of each fiscal quarter’s net income. As of September 30, 2009 and September 30, 2008, our required minimum tangible net worth was $69.7 million and $68.2 million, respectively. Our actual tangible net worth was $100.5 million
and $95.9 million, respectively, as of September 30, 2009 and September 30, 2008. |
|
· |
A leverage ratio, as defined under the Credit Agreement, not to exceed 3.0 to 1.0. As of September 30, 2009 and September 30, 2008, our leverage ratios were 2.48 to 1.0 and 1.63 to 1.0, respectively. |
|
· |
A fixed charge coverage ratio of at least 1.0 to 1.0, defined as “Adjusted EBITDA” (as defined under the Credit Agreement), plus rent expense divided by fixed charges (defined as the sum of interest expense, income tax expense paid, scheduled principal debt repayments in the prior four quarters, capital distributions, capital expenditures for
the purpose of maintaining existing fixed assets and rent expense); and as of September 30, 2009 and September 30, 2008, our fixed charge coverage ratios were 1.1 to 1.0 and 1.5 to 1.0, respectively. |
|
· |
A required level of profitability, as defined under the Credit Agreement, to not be less than zero for two consecutive fiscal quarters. As of September 30, 2009 and September 30, 2008, we have maintained the required level of profitability above zero. |
In addition, the Credit Agreement contains a number of limitations on our ability and our restricted U.S. subsidiaries’ ability to (i) incur additional indebtedness, (ii) pay dividends or redeem any Common Stock, (iii) incur liens or other encumbrances on their assets, (iv) enter into transactions with affiliates, (v) merge with
or into any other entity or (vi) sell any of their assets. Additionally, any “material adverse change” of the Company could restrict our ability to borrow under the Credit Agreement and could also be deemed an event of default under the Credit Agreement. A “material adverse change” is defined as a change in our financial or other condition, business, affairs or prospects or our properties and assets considered as an entirety that could reasonably be expected to have
a material adverse effect, as defined in the Credit Agreement, on us.
33
In addition, any “Change of Control” of the Company or our restricted U.S. subsidiaries will constitute a default under the Credit Agreement. “Change of Control,” as defined in the Credit Agreement, means: (i) the acquisition of, or, if earlier, the shareholder or director approval of the acquisition
of, ownership or voting control, directly or indirectly, beneficially or of record, by any person, entity, or group (within the meaning of Rule 13d-3 of the Securities Exchange Act of 1934, as then in effect), of shares representing more than 50% of the aggregate ordinary voting power represented by the issued and outstanding Common Stock; (ii) the occupation of a majority of the seats (other than vacant seats) on our board of directors by individuals who were neither (A) nominated by the Company’s board
of directors nor (B) appointed by directors so nominated; (iii) the occurrence of a change in control, or other similar provision, under or with respect to any “Material Indebtedness Agreement” (as defined in the Credit Agreement); or (iv) failure to own directly or indirectly, all of the outstanding equity interests of Bayshore Industrial L.P. and ICO Polymers North America, Inc. As further discussed in Note 17 – “Subsequent Events” in the Company’s Consolidated
Financial Statements, the Company obtained a consent from KeyBank regarding shareholders and/or director approval related to the A. Schulman, Inc. merger.
We have various foreign credit facilities in eight foreign countries. The available credit under these facilities varies based on the levels of accounts receivable within the foreign subsidiary, or is a fixed amount. The foreign credit facilities are collateralized by assets owned by the foreign subsidiaries. These facilities
either have a remaining maturity of less than twelve months or do not have a stated maturity date, or can be cancelled at the option of the lender. The aggregate amounts of available borrowings under the foreign credit facilities, based on the credit facility limits, current levels of accounts receivables, and outstanding letters of credit and borrowings, were $39.9 million as of September 30, 2009 and $42.9 million as of September 30, 2008.
In addition to the “Change of Control” clause under the Keybank agreement, certain of our foreign loan agreements and credit facilities also have “Change of Control” provisions. However, unlike the Keybank agreement, such “Change of Control” provisions are only triggered upon consummation of a
transaction that constitutes a ‘Change of Control”. As of September 30, 2009, we had approximately $11.4 million of borrowings outstanding and $9.6 million of available borrowings under these agreements.
The following table contains the financial covenants within our foreign loan agreements. The financial covenant computations are specific to the subsidiary of the country listed.
|
As of September 30, 2009 |
||||||||||
|
Country |
Outstanding Borrowings |
Available Borrowing Capacity |
Financial Covenant Requirement |
September 30, 2009 |
September 30, 2008 | |||||
|
Australia |
$2.8 million |
$0.9 million |
Equity exceeds 29.9% of total assets |
43% |
53% | |||||
|
Earnings more than 2x interest expense |
(a) |
(a) | ||||||||
|
Holland |
1.6 million |
5.8 million |
Equity exceeds 34.9% of total assets |
56% |
56% | |||||
|
Malaysia |
0.4 million |
1.4 million |
Total debt less than 2x equity |
.4x |
1.0x | |||||
|
Malaysia |
2.1 million |
2.0 million |
Equity greater than US $1.6 million |
$5.6 million |
$4.6 million | |||||
(a) At September 30, 2009, our Australian subsidiary was in violation of a financial debt covenant related to $2.8 million of term debt and $0 of short term borrowings under its credit facility with its lender in Australia. Of the $39.9 million of total foreign credit availability as of September 30, 2009, $0.9 million related
to our Australian subsidiary. The Australian covenant not met related to a metric of profitability compared to interest expense. The testing of this covenant was waived as of September 30, 2009 and the Company entered into a new agreement with covenant levels we expect to achieve in fiscal year 2010. The covenant that was changed is the interest coverage ratio, which will increase gradually each quarter of fiscal year 2010. We have classified all of the Australian
term debt as current as of September 30, 2009.
We are currently in compliance with all of our credit facilities except in Australia as discussed above.
The weighted average interest rates charged on short-term borrowings under our various credit facilities at September 30, 2009 and 2008 were 0% (as a result of no borrowings being outstanding) and 7.8%, respectively.
Future Cash Requirements
Capital expenditures for fiscal year 2010 are currently estimated to be approximately $8.0 million.
34
The following summarizes our contractual obligations as of September 30, 2009. Interest on variable rate indebtedness was computed using the interest rate in effect for each loan at September 30, 2009.
|
Less than |
After |
|||||||||||||||||||
|
Total |
1 year |
1-3 years |
3-5 years |
5 years |
||||||||||||||||
|
(Dollars in Thousands) |
||||||||||||||||||||
|
Term debt |
$ | 31,803 | $ | 12,980 | $ | 8,633 | 3,145 | $ | 7,045 | |||||||||||
|
Operating leases |
10,765 | 2,015 | 3,344 | 2,218 | 3,188 | |||||||||||||||
|
Short-term borrowings under credit facilities |
- | - | - | - | - | |||||||||||||||
|
Other long-term liabilities |
2,907 | - | 610 | 942 | 1,355 | |||||||||||||||
|
Purchase obligations (a) |
12,838 | 12,838 | - | - | - | |||||||||||||||
|
Interest expense on total debt |
5,302 | 1,786 | 1,918 | 1,110 | 488 | |||||||||||||||
| $ | 63,615 | $ | 29,619 | $ | 14,505 | $ | 7,415 | $ | 12,076 | |||||||||||
(a) Includes purchase obligations related to inventory.
We anticipate that the existing cash balance as of September 30, 2009 of $21.9 million, additional borrowing capacity of $50.5 million under various foreign and domestic credit arrangements and cash flow from
operations will provide adequate liquidity for fiscal year 2010 to pay for all current obligations, including capital expenditures, debt service, lease obligations and working capital requirements. There can be no assurance, however, that we will be successful in obtaining sources of capital that will be sufficient to support our requirements over the long-term.
Potential disruptions in the capital and credit markets may adversely affect us, including by adversely affecting the availability and cost of short-term funds for our liquidity requirements and our ability to meet long-term commitments, which in turn could adversely affect our results of operations, cash flows and financial condition.
We rely on our current credit facilities to fund short-term liquidity needs if internal funds are not available from our operations. We also use letters of credit issued under our revolving credit facilities to support our insurance policies and supplier purchases in certain business units.
Disruptions in the capital and credit markets could adversely affect our ability to draw on our bank revolving credit facilities. Our access to funds under our credit facilities is dependent on the ability of the banks that are parties to the facilities to meet their funding commitments. Our banks may not be able to meet their funding commitments to us if such banks experience shortages of capital and liquidity or if they experience excessive volumes of borrowing requests from us and other borrowers
within a short period of time.
Additionally, we are subject to certain covenants and restrictions and we must meet certain financial covenants as defined in the KeyBank Credit Agreement. We were in compliance with these covenants at September 30, 2009. In the event that we are unable to remain in compliance with the Credit Agreement’s covenants in the
future, our lenders would have the right to declare us in default with respect to such obligations, and consequently, certain of our debt obligations, would be deemed to also be in default. All debt obligations in default would be required to be reclassified as a current liability. In the event that we were unable to obtain a waiver from our lenders or renegotiate or refinance these obligations, a material adverse effect on our ability to conduct our operations in the ordinary course would likely result.
Longer-term disruptions in the capital and credit markets as a result of uncertainty, changing or increased regulation, reduced alternatives or failures of significant financial institutions could adversely affect our access to liquidity needed in our businesses. Any disruption could require us to take measures to conserve cash until the
markets stabilize or until alternative credit arrangements or other funding for business needs can be arranged. Such measures could include deferring capital expenditures, as well as reducing or eliminating future share repurchases, dividend payments or other discretionary uses of cash.
Many of our customers and suppliers also have exposure to risks that their businesses are adversely affected by the worldwide financial crisis and resulting potential disruptions in the capital and credit markets. In the event that any of our significant customers or suppliers, or a significant number of smaller customers and
suppliers, are adversely affected by these risks, we may face disruptions in supply, significant reductions in demand for our products and services, inability of customers to pay invoices when due, and other adverse effects that could negatively affect our financial condition, results of operations or cash flows.
35
Off-Balance Sheet Arrangements
Other than operating leases, we do not have any financial instruments classified as off-balance sheet as of September 30, 2009 and 2008.
Forward-Looking Statements
Certain matters discussed and statements made in this document which are not historical facts are “forward-looking statements” involving certain risks, uncertainties and assumptions and are intended to qualify for the safe harbors from liability established by the Private Securities Litigation Reform Act of 1995. When
words such as “anticipate,” “believe,” “estimate,” “intend,” “expect,” “plan” and similar expressions are used, they are intended to identify the statements as forward-looking. The Company’s statements regarding trends in the marketplace, potential future results, and statements regarding the merger (including the valuation, benefits, results, effects and timing thereof), the combined company and attributes thereof, and whether
and when the transactions contemplated by the merger agreement will be consummated are examples of such forward-looking statements. The following is a non-exclusive list of risks and uncertainties, and circumstances that present risks, that could cause actual results to differ materially from the forward-looking statements: the failure to receive the approval of the Company's shareholders; satisfaction of the conditions to the closing of the merger; costs and difficulties related to integration of businesses
and operations; delays, costs and difficulties relating to the merger and related transactions; results of cash/stock elections of shareholders; restrictions imposed by the Company's outstanding indebtedness; changes in the cost and availability of resins (polymers) and other raw materials; changes in demand for the Company's services and products; business cycles and other industry conditions; general economic conditions; international risks; operational risks; currency translation risks; the Company's lack
of asset diversification; the Company's ability to manage global inventory, develop technology and proprietary know-how, and attract and retain key personnel; failure of closing conditions in any transaction to be satisfied; integration of acquired businesses; as well as the risk factors referenced below and elsewhere in this document and those described in the Company's other filings with the SEC.
You should carefully consider the factors in Item 1A. – “Risk Factors” and other information contained in this document. If any of the risks and uncertainties actually occurs, our business, financial condition, results of operations and cash flows could be materially and adversely affected. In such
case, the trading price of the Common Stock could decline, and you may lose all or part of your investment.
Recently Issued Accounting Pronouncements
Accounting Standards Codification – In June 2009, the FASB established the FASB Accounting Standards Codification
(Codification), which officially commenced July 1, 2009, to become the source of authoritative US GAAP recognized by the FASB to be applied by nongovernmental entities. Rules and interpretive releases of the SEC under authority of federal securities laws are also sources of authoritative US GAAP for SEC registrants. Generally, the Codification is not expected to change US GAAP. All other accounting literature excluded from the Codification will be considered non-authoritative. The
Codification is effective for financial statements issued for interim and annual periods ending after September 15, 2009. We adopted the new guidance for fiscal year 2009. All references to authoritative accounting literature are now referenced in accordance with the Codification.
Business Combinations and Noncontrolling Interests in Consolidated Financial Statements –In
December 2007, the FASB issued authoritative guidance that establishes the principles and requirements for how an acquirer (i) recognizes and measures in its financial statements the identifiable assets acquired, the liabilities assumed, and any noncontrolling interest in the acquiree; (ii) recognizes and measures the goodwill acquired in the business combination or a gain from a bargain purchase; and (iii) determines what information to disclose to enable users of the financial statements to evaluate the nature
and financial effects of the business combination. This guidance makes significant changes to existing accounting practices for acquisitions, including the requirement to expense transaction costs and to reflect the fair value of contingent purchase price adjustments at the date of acquisition. In April 2009, the FASB issued an amendment to amend and clarify the guidance on business combinations to require that an acquirer recognize at fair value, at the acquisition date, an asset acquired or a liability assumed
in a business combination that arises from a contingency if the acquisition-date fair value of that asset or liability can be determined during the measurement period. If the acquisition-date fair value of such an asset acquired or liability assumed cannot be determined, the acquirer should apply the provisions of the guidance on business combinations to determine whether the contingency should be recognized at the acquisition date or after it. The guidance
36
clarifies that a noncontrolling interest in a subsidiary is an ownership interest in the consolidated entity that should be reported as equity in the consolidated financial statements.The guidance is effective for business combinations for which the acquisition date is after
the beginning of the first annual reporting period beginning after December 15, 2008, which was effective for us on October 1, 2009. For any acquisitions completed after fiscal year 2009, we expect the adoption of the guidance will have an impact on our consolidated financial statements; however, the magnitude of the impact will depend upon the nature, terms and size of the acquisitions we consummate.
Derivative Instruments and Hedging Activities - In March 2008, the FASB issued new standards which amended and expanded previous disclosure requirements related to derivative instruments and
hedging activities. The new standards require qualitative disclosures about objectives and strategies for using derivative instruments, quantitative disclosures about fair value amounts of derivative instruments and related gains and losses, and disclosures about credit risk-related contingent features in derivative agreements. We adopted the new standards as of January 1, 2009. They provide only for enhanced disclosures, and adoption had no impact on our financial position, results of operations or
cash flows.
Useful life of intangible assets – In April 2008, the FASB issued authoritative guidance that revises the factors that should be considered in developing renewal or extension assumptions in determining
useful life of a recognized intangible asset under the guidance. This guidance will be effective for fiscal years beginning after December 15, 2008. We will implement the guidance October 1, 2009. We do not expect the provisions of this guidance to have a material effect on our consolidated financial position, results of operations or cash flows.
Postretirement Benefit Plan Asset Disclosures - In December 2008, the FASB issued new standards which require employers to make additional disclosures about plan assets for defined benefit pension
and other postretirement benefit plans beginning with annual periods ending after December 15, 2009. Disclosures must provide an understanding of how investment allocation decisions are made, the major categories of plan assets, the inputs and valuation techniques used to measure the fair value of plan assets, the effect of fair-value measurements using significant unobservable inputs on changes in plan assets for the period, and significant concentrations of risk within plan assets. Enhanced disclosures
are required for annual periods only. We will adopt the new guidance on October 1, 2009.
Subsequent Events – In May 2009, the FASB issued new standards which establish the accounting for and disclosure
of events that occur after the balance sheet date but before financial statements are issued. In particular, the new standards set forth:
|
· |
the period after the balance sheet date during which management of a reporting entity should evaluate events or transactions that may occur for potential recognition or disclosure in the financial statements (through the date that the financial statements are issued or are available to be issued); |
|
· |
the circumstances under which an entity should recognize events or transactions occurring after the balance sheet date in its financial statements; and |
|
· |
the disclosures that an entity should make about events or transactions that occurred after the balance sheet date. |
We adopted the new standards during the period ended June 30, 2009. We have evaluated subsequent events after the balance sheet date of September 30, 2009 through the time of filing with the SEC on December 4, 2009 which is the date the financial statements were issued. Refer to Note 17 –
“Subsequent Events” in the Company’s Consolidated Financial Statements.
Variable Interest Entities - In June 2009, the FASB issued guidance that amends the consolidation guidance applicable to variable interest entities. The provisions of this guidance significantly affect the overall consolidation analysis under previous guidance.
It is effective as of the beginning of the first fiscal year that begins after November 15, 2009; specifically it will be effective for the Company beginning in October 1, 2010. The Company does not expect the provisions of this guidance to have a material effect on our consolidated financial condition, results of operations or cash flows.
Share-based payment transactions and participating securities – In June 2008, the FASB issued authoritative guidance governing whether instruments granted in share-based payment transactions
are participating securities. This guidance addresses whether these instruments are participating securities prior to vesting and therefore need to be included in computing earnings per share under the two-class method. This guidance will be effective for the Company beginning with the first quarter of fiscal year 2010 and will be applied retrospectively. The Company does not expect the provisions of this guidance to have a material effect on its consolidated financial position,
results of operations or cash flows.
37
Item 7A. Quantitative and Qualitative Disclosures About Market Risk
The Company is exposed to certain market risks as part of its ongoing business operations, including debt obligations that carry variable interest rates, foreign currency exchange risk, and resin price risk that could impact the Company’s financial condition, results of operations or cash flows. The Company manages its exposure to
these and other market risks through regular operating and financing activities, including the use of derivative financial instruments. The Company’s intention is to use these derivative financial instruments as risk management tools and not for trading purposes or speculation.
As mentioned above, the Company’s revenues and profitability are impacted by changes in resin prices. The Company uses various resins (primarily polyethylene) to manufacture its products. As the price of resin increases or decreases, market prices for the Company’s products will also generally increase
or decrease. This will typically lead to higher or lower average selling prices and will impact the Company’s operating income and operating margin. The impact on operating income is due to a lag in matching the change in raw material cost of goods sold and the change in product sales prices. As of September 30, 2009 and September 30, 2008, the Company had $18.4 million and $26.2 million of raw material inventory
and $17.9 million and $25.9 million of finished goods inventory, respectively. The Company attempts to minimize its exposure to resin price changes by monitoring and carefully managing the quantity of its inventory on hand and product sales prices.
As of September 30, 2009, the Company had $72.2 million of net investment in foreign wholly-owned subsidiaries. The Company does not hedge the foreign exchange rate risk inherent with this non-U.S. Dollar denominated investment.
The Company does, however, enter into forward currency exchange contracts related to both future purchase obligations and other forecasted transactions denominated in non-functional currencies, primarily repayments of foreign currency intercompany transactions. Certain of these forward currency exchange contracts qualify as cash flow hedging
instruments and are highly effective. In accordance with authoritative guidance over accounting for derivative instruments and hedging activities, the Company recognizes the amount of hedge ineffectiveness for these hedging instruments in the Consolidated Statement of Operations. The hedge ineffectiveness on the Company’s designated cash flow hedging instruments was not a significant amount for the twelve months ended September 30, 2009 and 2008. The Company’s principal
foreign currency exposures relate to the Euro, British Pound, Australian Dollar, New Zealand Dollar, Malaysian Ringgit and Brazilian Real. The Company’s forward contracts have original maturities of one year or less. The following table includes the total value of foreign exchange contracts outstanding for which hedge accounting is being applied as of September 30, 2009 and September 30, 2008:
|
As of | ||||
|
September 30, |
September 30, | |||
|
2009 |
2008 | |||
|
Notional value |
$5.5 million |
$8.3 million | ||
|
Fair market value |
$(0.3) million |
$0.5 million | ||
|
Maturity Dates |
October 2009 |
October 2008 | ||
|
through January 2010 |
through February 2009 | |||
When it is determined that a derivative has ceased to be a highly effective hedge, or that forecasted transactions are not expected to occur as specified in the hedge documentation, hedge accounting is discontinued prospectively. As a result, these derivatives are marked to market, with the resulting gains and losses recognized
in the Consolidated Statements of Operations.
Foreign Currency Intercompany Accounts and Notes Receivable. As mentioned above, from time-to-time, the Company’s U.S. subsidiaries provide capital to the Company’s foreign subsidiaries through U.S. Dollar denominated interest bearing promissory notes. In
addition, certain of the Company’s foreign subsidiaries also provide other foreign subsidiaries with access to capital through foreign currency denominated interest bearing promissory notes. Such funds are generally used by the Company’s foreign subsidiaries to purchase capital assets and for general working capital needs. The Company’s U.S. subsidiaries also sell products to the Company’s foreign subsidiaries in U.S. Dollars on trade credit terms. In addition,
the Company’s foreign subsidiaries sell products to other foreign subsidiaries denominated in foreign currencies that may not be the functional currency of one or more of the foreign subsidiaries that are parties to such intercompany agreements. These intercompany debts are accounted for in the local functional currency of the contracting foreign subsidiary, and are eliminated in the Company’s Consolidated Balance Sheet. At September 30, 2009, the Company had the following significant
outstanding intercompany amounts as described above:
38
|
Country of subsidiary with |
Country of subsidiary with |
Amount in US$ as of |
Currency denomination | |||
|
intercompany receivable |
intercompany payable |
September 30, 2009 |
of receivable | |||
|
United States |
Australia |
$4.2 million |
United States Dollar | |||
|
Holland |
United Kingdom |
$3.3 million |
Great Britain Pound | |||
|
Holland |
Australia |
$2.6 million |
Australian Dollar | |||
|
United States |
Malaysia |
$1.4 million |
United States Dollar |
Because these intercompany lending transactions are denominated in various foreign currencies and are subject to financial exposure from foreign exchange rate movement from the date a loan is recorded to the date it is settled or revalued, any appreciation or depreciation of the foreign currencies in which the transactions are denominated
could result in a gain or loss, respectively, to the Consolidated Statement of Operations, subject to forward currency exchange contracts that may be entered into. To mitigate this risk, the Company sometimes enters into foreign currency exchange contracts.
The following table includes the total value of foreign exchange contracts outstanding for which hedge accounting is not being applied as of September 30, 2009 and September 30, 2008.
|
As of | ||||
|
September 30, |
September 30, | |||
|
2009 |
2008 | |||
|
Notional value |
$9.0 million |
$5.4 million | ||
|
Fair market value |
$0.0 million |
$0.8 million | ||
|
Maturity Dates |
October 2009 |
October 2008 | ||
|
through January 2010 |
through February 2009 | |||
The Company also marks to market the underlying transactions related to these foreign exchange contracts which offsets the fluctuation in the fair market value of the derivative instruments. As of September 30, 2009, the net unrealized gain or loss on these derivative
instruments and their underlyings was insignificant.
Interest Rate Risk. The Company’s interest rate risk management objective is to limit the impact of future interest rate changes on earnings and cash flows. To achieve this objective, we attempt to borrow primarily on a fixed rate basis for longer-term debt issuances. The
Companyalso tries to manage risk associated with changes in interest rates by monitoring interest rates and future cash requirements, and evaluating opportunities to refinance borrowings at various maturities and interest rates.
At September 30, 2009, $0.7 million of our borrowings carried interest rates that were variable, and the remaining borrowings carried interest at fixed rates, including $11.3 million of variable rate debt converted
to fixed rate debt by interest rate swap agreements.
These swaps have been designated as hedges of our exposure to fluctuations in interest rates on outstanding variable rate borrowings (a cash flow hedge). As of September 30, 2009, the estimated fair value of the $11.3 million in notional interest rate swaps was
a liability of $0.4 million. The fair value is an estimate of the net amount that the Company would pay on September 30, 2009 if the agreements were transferred to another party or cancelled by the Company.
For the twelve month periods ended September 30, 2009 and September 30, 2008, the Company recorded in other comprehensive income (loss) an unrealized loss on these interest rate swaps of $0.5 million and an unrealized gain of $0.1 million, respectively. For the twelve month period
ended September 30, 2009, the amount of hedge ineffectiveness associated with the interest rate swaps was not significant.
At September 30, 2009, based on our current level of borrowings, a 1% increase in interest rates would increase interest expense annually by an insignificant amount.
Item 8. Financial Statements and Supplementary Data
The response to this Item is submitted as a separate section of this report. See index to this information on Page F-1 of this Annual Report on Form 10-K.
39
Item 9. Changes in and Disagreements with Accountants on Accounting and Financial Disclosure
None.
Item 9A. Controls and Procedures
Disclosure Controls and Procedures
The Company maintains disclosure controls and procedures, as defined under Rules 13a-15(e) and 15d-15(e) of the Exchange Act that are designed to ensure that information required to be disclosed in the Company’s reports under the Exchange Act is recorded, processed, summarized and reported within the time periods specified in
the SEC’s rules and forms and that such information is accumulated and communicated to the Company’s management, including its Chief Executive Officer and Chief Financial Officer, as appropriate, to allow for timely decisions regarding required disclosure. In designing and evaluating the disclosure controls and procedures, management recognizes that any controls and procedures, no matter how well designed and operated, can provide only reasonable assurance of achieving the desired control objectives,
and management is required to apply its judgment in evaluating the cost-benefit relationship of possible controls and procedures.
The Company carried out an assessment, under the supervision and with the participation of the Company’s management, including the Company’s Chief Executive Officer and Chief Financial Officer, to evaluate the effectiveness of the design and operation of the Company’s disclosure controls and procedures, as of September
30, 2009. The Company’s Chief Executive Officer and Chief Financial Officer concluded that the Company’s disclosure controls and procedures were effective as of September 30, 2009.
Management’s Annual Report on Internal Control Over Financial Reporting
Management is responsible for establishing and maintaining adequate internal control over financial reporting, as defined in Exchange Act Rule 13a-15(f). The Company’s internal control over financial reporting is a process designed to provide reasonable assurance regarding the reliability of financial reporting and the preparation
of financial statements for external purposes in accordance with accounting principles generally accepted in the United States of America.
Because of its inherent limitations, internal control over financial reporting may not prevent or detect misstatements. Also, projections of any evaluation of effectiveness to future periods are subject to the risk that controls may become inadequate because of changes in conditions, or that the degree of compliance with the policies or
procedures may deteriorate.
Under the supervision and with the participation of management, including the Chief Executive Officer and Chief Financial Officer, the Company conducted an evaluation of the effectiveness of the Company’s internal control over financial reporting based on the framework in “Internal
Control - Integrated Framework” issued by the Committee of Sponsoring Organizations of the Treadway Commission ("COSO"). Based on this assessment, management has concluded that the internal control over financial reporting was effective as of September 30, 2009. PricewaterhouseCoopers LLP, an independent registered public accounting firm, has issued a report on our internal control over financial reporting.
Changes In Internal Control and Financial Reporting
There were no changes in the Company’s internal control over financial reporting during the fourth quarter of fiscal year 2009 that materially affected, or were reasonably likely to materially affect, the Company’s internal control over financial reporting.
Item 9B. Other Information
None.
40
P A R T I I I
Item 10. Directors, Executive Officers and Corporate Governance
The information required by this item is incorporated by reference to information under the captions “Proposal 1 – Election of Directors” and to the information under the caption “Section 16(a)” in the Company’s definitive Proxy Statement (the “Proxy Statement”) for its 2010 Annual Meeting
of Shareholders. The Proxy Statement or the information to be so incorporated will be filed with the SEC not later than 120 days subsequent to September 30, 2009.
The Company has adopted a Code of Business Ethics that applies to, among others, its Chief Executive Officer and Chief Financial Officer. The Company’s Code of Business Ethics is available upon request by contacting the Company’s General Counsel at (713) 351-4100 or on our website at www.icopolymers.com. If
we make any substantive amendments to the Code of Business Ethics or grant any waiver, including any implicit waiver, from a provision of the Code of Business Ethics applicable to our Chief Executive Officer or Chief Financial Officer, we will make a public disclosure of the nature of such amendment or waiver on our website at www.icopolymers.com or in a current report on Form 8-K.
Item 11. Executive Compensation
The information required by this item is incorporated herein by reference to the Proxy Statement for the Company’s 2010 Annual Meeting of Shareholders.
Item 12. Security Ownership of Certain Beneficial Owners and Management and Related Stockholder Matters
The information required by this item is incorporated herein by reference to the Proxy Statement for the Company’s 2010 Annual Meeting of Shareholders.
Item 13. Certain Relationships and Related Transactions, and Director Independence
The information required by this item is incorporated herein by reference to the Proxy Statement for the Company’s 2010 Annual Meeting of Shareholders.
Item 14. Principal Accounting Fees and Services
The information required by this item is incorporated herein by reference to the Proxy Statement for the Company’s 2010 Annual Meeting of Shareholders.
41
P A R T I V
Item 15. Exhibits and Financial Statement Schedules
|
|
(a)(1) and (a)(2) The response to this portion of Item 15 is submitted as a separate section of this report on page F-1.
(b) Exhibits required by Item 601 of S-K:
The following instruments and documents are included as Exhibits to this Form 10-K. Exhibits incorporated by reference are so indicated by parenthetical information. The references to dates of filing refer to the dates when the Company filed the respective forms and other documents with the SEC as currently indicated
on the SEC’s EDGAR reporting system, regardless of the date indicated on the referenced form or other filing.
|
Exhibit No. |
Exhibit | ||
|
3.1 |
- |
Amended and Restated Articles of Incorporation of the Company dated November 27, 2007 (Exhibit 3.1 to Form 8-K dated December 3, 2007) | |
|
3.2 |
- |
Amended and Restated By-Laws of the Company dated November 27, 2007 (Exhibit 3.2 to Form 8-K dated December 3, 2007) | |
|
10.1 |
- |
Amendment and Ratification Agreement dated September 15, 2006 between Computershare Shareholder Services, Inc., Computershare Trust Company, N.A., and ICO, Inc. (Exhibit 10.1 to Form 8-K filed on September 21, 2006) | |
|
10.2 |
- |
Credit Agreement dated October 27, 2006 among: ICO, Inc., Bayshore Industrial, L.P. (“Bayshore”) and ICO Polymers North America, Inc. (“IPNA”), as Borrowers; and KeyBank, National Association (“KeyBank”) and Wells Fargo Bank, National Association (“Wells Fargo”), and other lending institutions
(“Other Lenders”) as Lenders (and in other specified capacities) (Exhibit 10.1 to Form 8-K filed on October 30, 2006) | |
|
10.3 |
- |
Amendment No. 1 and Waiver to Credit Agreement, dated April 25, 2007, among: ICO, Inc., Bayshore, and IPNA, as Borrowers; and KeyBank, Wells Fargo, and Other Lenders (Exhibit 10.1 to Form 8-K filed on April 26, 2007) | |
|
10.4 |
- |
Amendment No. 2 to Credit Agreement, dated June 25, 2007, among: ICO, Inc., Bayshore, and IPNA, as Borrowers; and KeyBank, Wells Fargo, and Other Lenders (Exhibit 10.1 to Form 8-K filed on June 29, 2007) | |
|
10.5 |
- |
Amendment No. 3 and Waiver to Credit Agreement, dated October 1, 2007, by and among ICO, Inc., Bayshore Industrial L.P. and ICO Polymers North America, Inc. (as “Borrowers”); KeyBank National Association, Wells Fargo Bank, National Association and the Other Lending Institutions Named Herein (as “Lenders”);
and KeyBank National Association (as “an LC Issuer, Lead Arranger, Bookrunner and Administrative Agent”); and Wells Fargo Bank, National Association (as “Swing Line Lender”) (Exhibit 10.2 to Form 8-K filed on May 8, 2008) | |
|
10.6 |
- |
Amendment No. 4 to Credit Agreement, dated May 2, 2008, by and among ICO, Inc., Bayshore Industrial L.P. and ICO Polymers North America, Inc. (as “Borrowers”); KeyBank National Association, Wells Fargo Bank, National Association and the Other Lending Institutions Named Herein (as “Lenders”); and KeyBank
National Association (as “an LC Issuer, Lead Arranger, Bookrunner and Administrative Agent”); and Wells Fargo Bank, National Association (as “Swing Line Lender”) (Exhibit 10.1 to Form 8-K filed on May 8, 2008) | |
|
10.7 |
- |
Amendment No. 5 to Credit Agreement, dated March 24, 2009, by and among ICO, Inc., Bayshore Industrial L.P. and ICO Polymers North America, Inc. (as “Borrowers”); KeyBank National Association, Wells Fargo Bank, National Association and the Other Lending Institutions Named Herein (as “Lenders”); and KeyBank National
Association (as “an LC Issuer, Lead Arranger, Bookrunner and Administrative Agent”); and Wells Fargo Bank, National Association (as “Swing Line Lender”) (Exhibit 10.2 to Form 8-K filed on March 25, 2009). | |
|
10.8 |
- |
Purchase Agreement dated July 2, 2002, by and among Varco International, Inc. (n/k/a National Oilwell Varco, Inc.), et al., as Buyers, and ICO, Inc., et al., as Sellers (Exhibit 10.1 to Form 8-K filed on July 3, 2002) | |
|
10.9 |
- |
Agreement of Settlement and Release in Full dated November 21, 2006, by and among National Oilwell Varco, Inc., et al., and ICO, Inc., et al. (among other things, amending the term of the Purchase Agreement referenced above) (Exhibit 10.1 to Form 8-K filed on November 22, 2006) | |
|
10.10 |
- |
1994 Stock Option Plan of ICO, Inc. (Exhibit A to the Definitive Proxy Statement filed on June 24, 1994) | |
|
10.11 |
- |
First Amended and Restated ICO, Inc. 1995 Stock Option Plan (Exhibit 10.11 to the Form 10-K filed on December 8, 2005) | |
|
10.12 |
- |
First Amended and Restated ICO, Inc. 1996 Stock Option Plan (Exhibit 10.11 to Form 10-K filed on December 8, 2005) | |
|
10.13 |
- |
Third Amended and Restated ICO, Inc. 2007 Equity Incentive Plan (formerly known as the “ICO, Inc. 1998 Stock Option Plan”) (Exhibit 10.1 to Schedule 14A filed on January 23, 2009) | |
|
10.14 |
- |
First Amended and Restated 2008 Equity Incentive Plan for Non-Employee Directors of ICO, Inc. (formerly known as the “1993 Stock Option Plan for Non-Employee Directors of ICO, Inc.”) (Exhibit 10.2 to Schedule 14A filed on January 23, 2009) | |
|
10.15 |
- |
Restricted Stock Agreement (the Company’s standard form for grants of restricted shares to non-employee directors) (Exhibit 10.1 to Form 8-K filed on March 28, 2008) | |
|
10.16 |
- |
Restricted Stock Agreement (the Company’s standard form for grants of restricted shares to employees) (Exhibit 10.1 to Form 8-K filed on December 11, 2008) | |
|
10.17 |
- |
Employment Agreement between ICO, Inc. and A. John Knapp, Jr., effective as of October 1, 2005 (Exhibit 10.2 to Form 8-K filed on October 7, 2005) | |
42
|
10.18 |
- |
Second Amendment to Employment Agreement between ICO, Inc. and A. John Knapp, Jr., dated January 23, 2008 (Exhibit 10.1 to Form 8-K filed on January 29, 2008) | |
|
10.19 |
- |
Employment Agreement between ICO, Inc. and Bradley T. Leuschner, dated February 15, 2001 (Exhibit 10.18 to Form 10-K filed on December 20, 2002) | |
|
10.20 |
- |
First Amendment to Employment Agreement between ICO, Inc. and Bradley T. Leuschner, dated July 31, 2002 (Exhibit 10.19 to Form 10-K filed on December 20, 2002) | |
|
10.21 |
- |
Second Amendment to Employment Agreement between ICO, Inc. and Bradley T. Leuschner, dated October 31, 2002 (Exhibit 10.20 to Form 10-K filed on December 20, 2002) | |
|
10.22 |
- |
Fourth Amendment to Employment Agreement by and between ICO, Inc. and Bradley T. Leuschner, dated December 20, 2007 (Exhibit 10.1 to form 8-K filed on December 21, 2007) | |
|
10.23 |
- |
Employment Agreement between ICO Technology, Inc. and Derek R. Bristow, dated December 20, 2007 (Exhibit 10.2 to Form 10-Q filed on December 21, 2007) | |
|
10.24 |
- |
First Amendment to Employment Agreement between ICO Technology, Inc. and Derek R. Bristow, Dated January 20, 2009 (Exhibit 10.3 to Form 8-K filed on January 22, 2009) | |
|
10.25 |
- |
ICO, Inc. Change in Control Severance Plan (Exhibit 10.2 to Form 8-K filed on August 12, 2009). | |
|
10.26* |
|
- |
ICO, Inc. Change in Control Severance Plan Participation Agreement between ICO, Inc. and Bradley T. Leuschner dated October 7, 2009. |
|
10.27* |
|
- |
ICO, Inc. Change in Control Severance Plan Participation Agreement between ICO, Inc. and Derek R. Bristow dated October 7, 2009. |
|
10.28* |
|
- |
ICO, Inc. Change in Control Severance Plan Participation Agreement between ICO, Inc. and Donald Eric Parsons dated October 7, 2009. |
|
10.29* |
|
- |
ICO, Inc. Change in Control Severance Plan Participation Agreement between ICO, Inc. and A. John Knapp, Jr. dated October 7, 2009. |
|
10.30* |
|
ICO, Inc. Change in Control Severance Plan Participation Agreement between ICO, Inc. and Stephen E. Barkmann dated December 3, 2009. | |
|
21.1 |
* |
- |
Subsidiaries of the Company |
|
23.1 |
* |
- |
Consent of independent registered public accounting firm |
|
31.1 |
* |
- |
Certification of Chief Executive Officer of ICO, Inc. pursuant to 15 U.S.C. Section 7241 |
|
31.2 |
* |
- |
Certification of Chief Financial Officer of ICO, Inc. pursuant to 15 U.S.C. Section 7241 |
|
32.1 |
** |
- |
Certification of Chief Executive Officer of ICO, Inc. pursuant to 18 U.S.C. Section 1350 |
|
32.2 |
** |
- |
Certification of Chief Financial Officer of ICO, Inc. pursuant to 18 U.S.C. Section 1350 |
______________________
*Filed herewith
**Furnished herewith
+ Management contracts or compensating plans or arrangements
43
SIGNATURES
Pursuant to the requirements of Section 13 or 15(d) of the Securities Exchange Act of 1934, the Registrant has duly caused this report to be signed on its behalf by the undersigned, thereunto duly authorized.
|
ICO, Inc. | |
|
By: |
/s/ A. John Knapp, Jr. |
|
A. John Knapp, Jr. | |
|
President, Chief Executive Officer, and | |
|
Director (Principal Executive Officer) | |
|
Date: |
December 4, 2009 |
|
By: |
/s/ Brad Leuschner |
|
Brad Leuschner | |
|
Chief Financial Officer and Treasurer (Principal Financial Officer) | |
|
Date: |
December 4, 2009 |
Pursuant to the requirements of the Securities Exchange Act of 1934, this report has been signed below by the following persons on behalf of the registrant and in the capacities and on the dates indicated.
|
Name |
Title |
Date | |
|
/s/ Gregory T. Barmore |
Chairman of the Board |
December 4, 2009 | |
|
Gregory T. Barmore |
|||
|
/s/ A. John Knapp, Jr. |
President, Chief Executive Officer, and |
December 4, 2009 | |
|
A. John Knapp, Jr. |
Director (Principal Executive Officer) |
||
|
/s/ Eugene R. Allspach |
Director |
December 4, 2009 | |
|
Eugene R. Allspach |
|||
|
/s/ Eric O. English |
Director |
December 4, 2009 | |
|
Eric O. English |
|||
|
/s/ David E.K. Frischkorn, Jr. |
Director |
December 4, 2009 | |
|
David E.K. Frischkorn, Jr. |
|||
|
/s/ Daniel R. Gaubert |
Director |
December 4, 2009 | |
|
Daniel R. Gaubert |
|||
|
/s/ Max W. Kloesel |
Senior Vice President, Bayshore Industrial and |
December 4, 2009 | |
|
Max W. Kloesel |
Director |
||
|
/s/ Kumar Shah |
Director |
December 4, 2009 | |
|
Kumar Shah |
|||
|
/s/ Warren W. Wilder |
Director |
December 4, 2009 | |
|
Warren W. Wilder |
44
ICO, INC. AND SUBSIDIARIES
FORM 10-K
INDEX OF FINANCIAL STATEMENTS
The following financial statements of ICO, Inc. and subsidiaries are required to be included by Item 15:
|
Financial Statements: |
Page |
|
Report of Independent Registered Public Accounting Firm |
F-2 |
|
Consolidated Balance Sheet at September 30, 2009 and 2008 |
F-3 |
|
Consolidated Statement of Operations for the three years ended September 30, 2009 |
F-4 |
|
Consolidated Statement of Cash Flows for the three years ended September 30, 2009 |
F-5 |
|
Consolidated Statement of Stockholders’ Equity for the three years ended September 30, 2009 |
F-6 |
|
Notes to Consolidated Financial Statements |
F-7 |
|
Financial Statement Schedules: |
|
|
Schedule I – Condensed Financial Information of ICO, Inc. (Parent Company Only) |
F-32 |
|
Schedule II – Valuation and Qualifying Accounts |
F-36 |
All other schedules for which provision is made in the applicable accounting regulations of the Securities and Exchange Commission (“SEC”) are not required under the related instructions or are inapplicable and therefore have been omitted or the information is presented in the consolidated financial statements or related notes.
F-1
REPORT OF INDEPENDENT REGISTERED PUBLIC ACCOUNTING FIRM
To the Board of Directors and Stockholders of ICO, Inc.:
In our opinion, the consolidated financial statements listed in the accompanying index present fairly, in all material respects, the financial position of ICO, Inc. and its subsidiaries at September 30, 2009 and 2008, and the results of their operations and their cash flows for each of the three years in the period ended September
30, 2009 in conformity with accounting principles generally accepted in the United States of America. In addition, in our opinion, the financial statement schedules listed in the accompanying index present fairly, in all material respects, the information set forth therein when read in conjunction with the related consolidated financial
statements. Also in our opinion, the Company maintained, in all material respects, effective internal control over financial reporting as of September 30, 2009, based on criteria established in Internal Control - Integrated Framework issued by the Committee of Sponsoring Organizations of the Treadway Commission (COSO). The Company's management is responsible for these financial statements and financial statement schedules, for maintaining
effective internal control over financial reporting and for its assessment of the effectiveness of internal control over financial reporting, included in Management's Report on Internal Control Over Financial Reporting appearing under Item 9A. Our responsibility is to express opinions on these financial statements, on the financial statement schedules, and on the Company's internal control over financial reporting based on our integrated audits. We conducted our audits in accordance with
the standards of the Public Company Accounting Oversight Board (United States). Those standards require that we plan and perform the audits to obtain reasonable assurance about whether the financial statements are free of material misstatement and whether effective internal control over financial reporting was maintained in all material respects. Our audits of the financial statements included examining, on a test basis, evidence supporting the amounts and disclosures in the financial statements,
assessing the accounting principles used and significant estimates made by management, and evaluating the overall financial statement presentation. Our audit of internal control over financial reporting included obtaining an understanding of internal control over financial reporting, assessing the risk that a material weakness exists, and testing and evaluating the design and operating effectiveness of internal control based on the assessed risk. Our audits also included performing such
other procedures as we considered necessary in the circumstances. We believe that our audits provide a reasonable basis for our opinions.
A company’s internal control over financial reporting is a process designed to provide reasonable assurance regarding the reliability of financial reporting and the preparation of financial statements for external purposes in accordance with generally accepted accounting principles. A company’s internal control over
financial reporting includes those policies and procedures that (i) pertain to the maintenance of records that, in reasonable detail, accurately and fairly reflect the transactions and dispositions of the assets of the company; (ii) provide reasonable assurance that transactions are recorded as necessary to permit preparation of financial statements in accordance with generally accepted accounting principles, and that receipts and expenditures of the company are being made only in accordance with authorizations
of management and directors of the company; and (iii) provide reasonable assurance regarding prevention or timely detection of unauthorized acquisition, use, or disposition of the company’s assets that could have a material effect on the financial statements.
Because of its inherent limitations, internal control over financial reporting may not prevent or detect misstatements. Also, projections of any evaluation of effectiveness to future periods are subject to the risk that controls may become inadequate because of changes in conditions, or that the degree of compliance with the
policies or procedures may deteriorate.
/s/ PricewaterhouseCoopers LLP
Houston, Texas
December 4, 2009
F-2
ICO, INC.
CONSOLIDATED BALANCE SHEET
|
September 30, |
||||||||
|
ASSETS |
2009 |
2008 |
||||||
|
(In Thousands, except share data) |
||||||||
|
Current Assets: |
||||||||
|
Cash and cash equivalents |
$ | 21,880 | $ | 5,589 | ||||
|
Trade receivables (less allowance for doubtful accounts |
||||||||
|
of $3,746 and $2,973, respectively) |
57,124 | 75,756 | ||||||
|
Inventories |
37,397 | 53,458 | ||||||
|
Deferred income taxes |
1,848 | 2,056 | ||||||
|
Prepaid and other current assets |
6,446 | 10,514 | ||||||
|
Total current assets |
124,695 | 147,373 | ||||||
|
Property, plant and equipment, net |
57,144 | 61,164 | ||||||
|
Goodwill |
4,549 | 8,689 | ||||||
|
Deferred income taxes |
4,128 | 2,709 | ||||||
|
Other assets |
1,757 | 1,161 | ||||||
|
Total assets |
$ | 192,273 | $ | 221,096 | ||||
|
LIABILITIES AND STOCKHOLDERS' EQUITY |
||||||||
|
Current Liabilities: |
||||||||
|
Short-term borrowings under credit facilities |
$ | - | $ | 9,607 | ||||
|
Current portion of long-term debt |
12,980 | 15,201 | ||||||
|
Accounts payable |
33,281 | 37,674 | ||||||
|
Accrued salaries and wages |
4,997 | 5,978 | ||||||
|
Other current liabilities |
9,344 | 11,912 | ||||||
|
Total current liabilities |
60,602 | 80,372 | ||||||
|
Long-term debt, net of current portion |
18,823 | 25,122 | ||||||
|
Deferred income taxes |
4,786 | 5,039 | ||||||
|
Other long-term liabilities |
2,907 | 2,728 | ||||||
|
Total liabilities |
87,118 | 113,261 | ||||||
|
Commitments and contingencies |
- | - | ||||||
|
Stockholders' equity: |
||||||||
|
Undesignated preferred stock, without par value - |
||||||||
|
500,000 shares authorized, no shares issued and outstanding |
- | - | ||||||
|
Common stock, without par value - 50,500,000 shares authorized; |
||||||||
|
28,205,173 and 27,817,673 shares issued, respectively |
55,248 | 54,756 | ||||||
|
Additional paid-in capital |
73,081 | 72,241 | ||||||
|
Accumulated other comprehensive income |
2,723 | 3,022 | ||||||
|
Accumulated deficit |
(22,880 | ) | (21,641 | ) | ||||
|
Treasury stock, at cost, 578,081 and 90,329 shares, respectively |
(3,017 | ) | (543 | ) | ||||
|
Total stockholders' equity |
105,155 | 107,835 | ||||||
|
Total liabilities and stockholders' equity |
$ | 192,273 | $ | 221,096 | ||||
The accompanying notes are an integral part of these consolidated financial statements.
F-3
ICO, INC.
CONSOLIDATED STATEMENT OF OPERATIONS
|
Years Ended September 30, |
||||||||||||
|
2009 |
2008 |
2007 |
||||||||||
|
(In Thousands, except share and per share data) |
||||||||||||
|
Revenues |
$ | 299,965 | $ | 446,701 | $ | 417,917 | ||||||
|
Cost and expenses: |
||||||||||||
|
Cost of revenues (exclusive of depreciation and amortization |
||||||||||||
|
shown separately below) |
250,583 | 373,557 | 344,171 | |||||||||
|
Selling, general and administrative |
36,679 | 41,254 | 37,676 | |||||||||
|
Depreciation and amortization |
7,361 | 7,531 | 7,251 | |||||||||
|
Goodwill impairment |
3,450 | - | - | |||||||||
|
Long-lived asset impairment, restructuring and other costs (income) |
(175 | ) | (1,348 | ) | (997 | ) | ||||||
|
Operating income |
2,067 | 25,707 | 29,816 | |||||||||
|
Other expense: |
||||||||||||
|
Interest expense, net |
(2,230 | ) | (4,062 | ) | (3,227 | ) | ||||||
|
Other expense |
(582 | ) | (431 | ) | (115 | ) | ||||||
|
Income (loss) from continuing operations before income taxes |
(745 | ) | 21,214 | 26,474 | ||||||||
|
Provision for income taxes |
494 | 5,832 | 6,712 | |||||||||
|
Income (loss) from continuing operations |
(1,239 | ) | 15,382 | 19,762 | ||||||||
|
Income (loss) from discontinued operations, net of |
||||||||||||
|
provision (benefit) for income taxes of $0, $(36) |
||||||||||||
|
and $(730), respectively |
- | (68 | ) | 1,356 | ||||||||
|
Net income (loss) |
$ | (1,239 | ) | $ | 15,314 | $ | 21,118 | |||||
|
Preferred Stock dividends |
- | (1 | ) | (554 | ) | |||||||
|
Net gain on redemption of Preferred Stock |
- | - | 6,023 | |||||||||
|
Net income (loss) applicable to Common Stock |
$ | (1,239 | ) | $ | 15,313 | $ | 26,587 | |||||
|
Basic income (loss) per share: |
||||||||||||
|
Income (loss) from continuing operations |
$ | (.05 | ) | $ | .56 | $ | .97 | |||||
|
Income (loss) from discontinued operations |
- | - | .05 | |||||||||
|
Net income (loss) per common share |
$ | (.05 | ) | $ | .56 | $ | 1.02 | |||||
|
Diluted income (loss) per share: |
||||||||||||
|
Income (loss) from continuing operations |
$ | (.05 | ) | $ | .55 | $ | .71 | |||||
|
Income (loss) from discontinued operations |
- | - | .05 | |||||||||
|
Net income (loss) per common share |
$ | (.05 | ) | $ | .55 | $ | .76 | |||||
|
Basic weighted average shares outstanding |
27,081,000 | 27,271,000 | 26,030,000 | |||||||||
|
Diluted weighted average shares outstanding |
27,081,000 | 27,994,000 | 27,891,000 | |||||||||
The accompanying notes are an integral part of these consolidated financial statements.
F-4
ICO, INC.
CONSOLIDATED STATEMENT OF CASH FLOWS
|
Years Ended September 30, |
||||||||||||
|
2009 |
2008 |
2007 |
||||||||||
|
Cash flows from operating activities: |
(Dollars in Thousands) |
|||||||||||
|
Net income (loss) |
$ | (1,239 | ) | $ | 15,314 | $ | 21,118 | |||||
|
(Income) loss from discontinued operations |
- | 68 | (1,356 | ) | ||||||||
|
Depreciation and amortization |
7,361 | 7,531 | 7,251 | |||||||||
|
Gain on involuntary conversion of fixed assets |
(37 | ) | (575 | ) | (918 | ) | ||||||
|
Stock-based compensation expense |
817 | 938 | 670 | |||||||||
|
Goodwill Impairment |
3,450 | - | - | |||||||||
|
Changes in assets and liabilities providing/(requiring) cash: |
||||||||||||
|
Receivables |
18,593 | 17,346 | (20,741 | ) | ||||||||
|
Inventories |
15,831 | 4,512 | (13,458 | ) | ||||||||
|
Other assets |
2,748 | 93 | (1,498 | ) | ||||||||
|
Income taxes payable |
(730 | ) | (1,741 | ) | (2,050 | ) | ||||||
|
Deferred taxes |
(1,392 | ) | (87 | ) | (551 | ) | ||||||
|
Accounts payable |
(6,169 | ) | (27,199 | ) | 25,802 | |||||||
|
Other liabilities |
(1,055 | ) | (2,375 | ) | 5,106 | |||||||
|
Net cash provided by operating activities by continuing operations |
38,178 | 13,825 | 19,375 | |||||||||
|
Net cash used for operating activities by discontinued operations |
(103 | ) | (31 | ) | (294 | ) | ||||||
|
Net cash provided by operating activities |
38,075 | 13,794 | 19,081 | |||||||||
|
Cash flows provided by (used for) investing activities: |
||||||||||||
|
Capital expenditures |
(3,909 | ) | (13,565 | ) | (11,634 | ) | ||||||
|
Proceeds from involuntary conversion of long-lived assets |
471 | 2,337 | - | |||||||||
|
Proceeds from disposition of property, plant and equipment |
- | 56 | 972 | |||||||||
|
Net cash used for investing activities for continuing operations |
(3,438 | ) | (11,172 | ) | (10,662 | ) | ||||||
|
Cash flows provided by (used for) financing activities: |
||||||||||||
|
Common Stock issued |
45 | 3,200 | 1,599 | |||||||||
|
Decrease in short-term borrowings under credit facilities, net |
(8,742 | ) | (5,904 | ) | (3,201 | ) | ||||||
|
Proceeds from long-term debt |
402 | 8,239 | 20,395 | |||||||||
|
Repayments of long-term debt |
(9,125 | ) | (8,262 | ) | (7,488 | ) | ||||||
|
Redemption of Preferred Stock |
- | (200 | ) | (28,531 | ) | |||||||
|
Purchases of Treasury Stock |
(1,990 | ) | (1,027 | ) | – | |||||||
|
Payment of dividend on Preferred Stock |
- | (1,312 | ) | (246 | ) | |||||||
|
Debt financing costs |
- | – | (264 | ) | ||||||||
|
Net cash used for financing activities for continuing operations |
(19,410 | ) | (5,266 | ) | (17,736 | ) | ||||||
|
Effect of exchange rates on cash |
1,064 | (328 | ) | 451 | ||||||||
|
Net increase (decrease) in cash and equivalents |
16,291 | (2,972 | ) | (8,866 | ) | |||||||
|
Cash and cash equivalents at beginning of period |
5,589 | 8,561 | 17,427 | |||||||||
|
Cash and cash equivalents at end of period |
$ | 21,880 | $ | 5,589 | $ | 8,561 | ||||||
|
Supplemental disclosures of cash flow information: |
||||||||||||
|
Cash paid during the period for: |
||||||||||||
|
Interest |
$ | 2,492 | $ | 4,315 | $ | 3,517 | ||||||
|
Income taxes |
2,375 | 4,850 | 9,000 | |||||||||
The accompanying notes are an integral part of these consolidated financial statements.
F-5
|
ICO, INC. |
||||||||||||||||||||||||||||||||||||||||||
|
CONSOLIDATED STATEMENT OF STOCKHOLDERS' EQUITY |
||||||||||||||||||||||||||||||||||||||||||
|
Accumulated |
||||||||||||||||||||||||||||||||||||||||||
|
Treasury |
Common |
Common |
Additional |
Other |
||||||||||||||||||||||||||||||||||||||
|
Treasury |
Stock |
Preferred |
Stock |
Stock |
Paid-In |
Comprehensive |
Comprehensive |
Accumulated |
||||||||||||||||||||||||||||||||||
|
Shares |
Amount |
Stock |
Shares |
Amount |
Capital |
Income (Loss) |
Income (Loss) |
Deficit |
Total |
|||||||||||||||||||||||||||||||||
|
(In Thousands, except share data) |
||||||||||||||||||||||||||||||||||||||||||
|
Balance at September 30, 2006 |
- | - | $ | 13 | 25,792,168 | $ | 45,087 | $ | 104,844 | - | $ | (154 | ) | $ | (58,073 | ) | $ | 91,717 | ||||||||||||||||||||||||
|
Issuance of shares in connection with employee benefit plans |
- | - | - | 68,854 | 456 | - | - | - | - | 456 | ||||||||||||||||||||||||||||||||
|
Issuance of stock options |
- | - | - | - | - | 592 | - | - | - | 592 | ||||||||||||||||||||||||||||||||
|
Adjustment to initially apply SFAS 158 (net of tax of $0.1 million) |
- | - | - | - | - | - | - | (364 | ) | - | (364 | ) | ||||||||||||||||||||||||||||||
|
Exercise of stock options |
- | - | - | 617,346 | 1,900 | (301 | ) | - | - | - | 1,599 | |||||||||||||||||||||||||||||||
|
Convertible Exchangeable Preferred Stock redemption (See Note 11) |
- | - | (11 | ) | - | - | (28,520 | ) | - | - | - | (28,531 | ) | |||||||||||||||||||||||||||||
|
Convertible Exchangeable Preferred Stock dividend (See Note 11) |
- | - | - | - | - | (1,557 | ) | - | - | - | (1,557 | ) | ||||||||||||||||||||||||||||||
|
Convertible Exchangeable Preferred Stock conversion (See Note 11) |
- | - | - | 23,622 | 216 | (216 | ) | - | - | - | - | |||||||||||||||||||||||||||||||
|
Issuance of restricted stock to employees, net of forfeitures |
- | - | - | 207,380 | - | 78 | - | - | - | 78 | ||||||||||||||||||||||||||||||||
|
Translation adjustment |
- | - | - | - | - | - | 6,625 | 6,625 | - | 6,625 | ||||||||||||||||||||||||||||||||
|
Unrealized net loss on foreign currency hedges |
- | - | - | - | - | - | (691 | ) | (691 | ) | - | (691 | ) | |||||||||||||||||||||||||||||
|
Net income |
- | - | - | - | - | - | 21,118 | - | 21,118 | 21,118 | ||||||||||||||||||||||||||||||||
|
Comprehensive income |
- | - | - | - | - | - | $ | 27,052 | ||||||||||||||||||||||||||||||||||
|
Balance at September 30, 2007 |
- | - | 2 | 26,709,370 | 47,659 | 74,920 | - | 5,416 | (36,955 | ) | 91,042 | |||||||||||||||||||||||||||||||
|
Issuance of shares in connection with employee benefit plans |
- | - | - | 34,047 | 479 | - | - | - | - | 479 | ||||||||||||||||||||||||||||||||
|
Issuance of stock options |
- | - | - | - | - | 270 | - | - | - | 270 | ||||||||||||||||||||||||||||||||
|
Exercise of stock options |
- | - | - | 534,440 | 2,180 | 1,020 | - | - | - | 3,200 | ||||||||||||||||||||||||||||||||
|
Convertible Exchangeable Preferred Stock redemption (See Note 11) |
- | - | - | - | - | (200 | ) | - | - | - | (200 | ) | ||||||||||||||||||||||||||||||
|
Convertible Exchangeable Preferred Stock dividend (See Note 11) |
- | - | - | - | - | (1 | ) | - | - | - | (1 | ) | ||||||||||||||||||||||||||||||
|
Convertible Exchangeable Preferred Stock conversion (See Note 11) |
- | - | (2 | ) | 486,321 | 4,438 | (4,436 | ) | - | - | - | - | ||||||||||||||||||||||||||||||
|
Issuance of restricted stock to employees, net of forfeitures |
- | - | - | 53,495 | - | 668 | - | - | - | 668 | ||||||||||||||||||||||||||||||||
|
Treasury Stock |
90,329 | (543 | ) | - | (90,329 | ) | - | - | - | - | - | (543 | ) | |||||||||||||||||||||||||||||
|
Translation adjustment |
- | - | - | - | - | - | (3,881 | ) | (3,881 | ) | - | (3,881 | ) | |||||||||||||||||||||||||||||
|
Pension liability adjustment including effect of SFAS No. 158, net of taxes of $0.1 million |
- | - | - | - | - | - | 175 | 175 | - | 175 | ||||||||||||||||||||||||||||||||
|
Unrealized net gain on foreign currency hedges |
- | - | - | - | - | - | 525 | 525 | - | 525 | ||||||||||||||||||||||||||||||||
|
Realized net gain on foreign currency hedges |
- | - | - | - | - | - | 691 | 691 | - | 691 | ||||||||||||||||||||||||||||||||
|
Unrealized net gain on interest rate swaps |
- | - | - | - | - | - | 96 | 96 | - | 96 | ||||||||||||||||||||||||||||||||
|
Net income |
- | - | - | - | - | - | 15,314 | - | 15,314 | 15,314 | ||||||||||||||||||||||||||||||||
|
Comprehensive income |
- | - | - | - | - | - | $ | 12,920 | ||||||||||||||||||||||||||||||||||
|
Balance at September 30, 2008 |
90,329 | (543 | ) | - | 27,727,344 | 54,756 | 72,241 | - | 3,022 | (21,641 | ) | 107,835 | ||||||||||||||||||||||||||||||
|
Issuance of shares in connection with employee benefit plans |
- | - | - | 87,614 | 492 | - | - | - | - | 492 | ||||||||||||||||||||||||||||||||
|
Issuance of stock options |
- | - | - | - | - | 159 | - | - | - | 159 | ||||||||||||||||||||||||||||||||
|
Exercise of stock options |
- | - | - | 1,500 | - | 45 | - | - | - | 45 | ||||||||||||||||||||||||||||||||
|
Issuance of restricted stock to employees, net of forfeitures |
- | - | - | 293,386 | - | 636 | - | - | - | 636 | ||||||||||||||||||||||||||||||||
|
Treasury Stock |
487,752 | (2,474 | ) | - | (487,752 | ) | - | - |
- |
- |
- |
- | - | (2,474 | ) | |||||||||||||||||||||||||||
|
Translation adjustment |
- | - | - | - | - | - | 1,401 | 1,401 | - | 1,401 | ||||||||||||||||||||||||||||||||
|
Pension liability adjustment including effect of SFAS No. 158, net of taxes of $(0.1) million |
- | - | - | - | - | - | (374 | ) | (374 | ) | - | (374 | ) | |||||||||||||||||||||||||||||
|
Unrealized net loss on foreign currency hedges |
- | - | - | - | - | - | (337 | ) | (337 | ) | - | (337 | ) | |||||||||||||||||||||||||||||
|
Realized net loss on foreign currency hedges |
- | - | - | - | - | - | (525 | ) | (525 | ) | - | (525 | ) | |||||||||||||||||||||||||||||
|
Unrealized net loss on interest rate swaps |
- | - | - | - | - | - | (464 | ) | (464 | ) | - | (464 | ) | |||||||||||||||||||||||||||||
|
Net income (loss) |
- | - | - | - | - | - | (1,239 | ) | - | (1,239 | ) | (1,239 | ) | |||||||||||||||||||||||||||||
|
Comprehensive income (loss) |
- | - | - | - | - | - | $ | (1,538 | ) | - | - | |||||||||||||||||||||||||||||||
|
Balance at September 30, 2009 |
578,081 | $ | (3,017 | ) | - | 27,622,092 | $ | 55,248 | $ | 73,081 | $ | 2,723 | $ | (22,880 | ) | $ | 105,155 | |||||||||||||||||||||||||
The accompanying notes are an integral part of these consolidated financial statements.
F-6
NOTES TO CONSOLIDATED FINANCIAL STATEMENTS
Note 1 - Summary of Significant Accounting Policies
ICO, Inc. and its subsidiaries (“the Company”) manufacture specialty resins and concentrates and provide specialized polymers processing services. The specialty resins manufactured by the Company are typically produced into a powder form. Concentrates produced by the Company generally are mixed by customers
with polymer filler resins to give plastic films desired characteristics and to reduce customer’s raw material costs. Concentrates are polymers loaded with high levels of chemical and organic additives that are melt-blended into base resins to give plastic films and other finished products desired physical properties. The Company also provides toll processing services including ambient grinding, jet milling, compounding and ancillary services for polymer resins produced in pellet form
as well as other material. These products and services are provided through the Company’s 20 operating facilities located in 9 countries in the Americas, Europe and Asia Pacific. The Company’s customers include major chemical companies, polymer production affiliates of major oil exploration and production companies, and manufacturers of plastic products.
The Company was incorporated in 1978 under the laws of the State of Texas. During fiscal years 2003 and 2002, the Company completed the sale of its oilfield services (“Oilfield Services”) business. References to the “Company” include ICO, Inc., its subsidiaries and predecessors unless the context
indicates otherwise.
Principles of Consolidation - The accompanying consolidated financial statements include the accounts of ICO, Inc., its wholly-owned subsidiaries and subsidiaries in which a controlling interest is maintained. All significant intercompany accounts and transactions have
been eliminated in consolidation.
Use of Estimates - The preparation of financial statements in conformity with generally accepted accounting principles in the United States requires management to
make estimates and assumptions that affect the reported amounts of assets and liabilities, disclosure of contingent assets and liabilities, if any, at the date of the financial statements and the reported amounts of revenues and expenses during the reporting period. The more significant areas requiring use of estimates relate to valuation allowances for deferred tax assets, workers compensation, inventory reserves, allowance for doubtful accounts related to accounts receivable and commitments and contingencies,
including legal and environmental claims.
The valuation of deferred tax assets is based upon estimates of future pretax income in determining the ability to realize the deferred tax assets in each taxing jurisdiction. Estimates for workers’ compensation liabilities are due to the Company being partially self-insured in the United States with stop loss insurance
coverage limiting the Company’s exposure per claim. Estimates are made for ultimate costs associated with workers’ compensation claims. Inventory reserves are estimated based upon the Company’s review of its inventory. This review requires the Company to estimate the fair market value of certain inventory that has become old or obsolete. Determining the amount of the allowance for doubtful accounts involves estimating the collectability of customer
accounts receivable balances. Estimates surrounding commitments and contingencies are related primarily to litigation claims for which the Company evaluates the circumstances surrounding the claims to determine how much expense, if any, the Company should record. Actual results could differ from the estimates discussed above. Management believes that its estimates are reasonable.
Revenue and Related Cost Recognition - The Company’s accounting policy regarding revenue recognition is to recognize revenue when all of the following criteria are met:
|
§ |
Persuasive evidence of an arrangement exists: The Company has received an order from a customer. |
|
§ |
Delivery has occurred or services have been rendered: |
|
§ |
For product sales, revenue recognition occurs when title and risk of ownership have passed to the customer. |
|
§ |
For service revenue, revenue recognition occurs upon the completion of service. |
|
§ |
Seller’s price to the buyer is fixed or determinable: Sales prices are agreed with the customer before delivery has occurred or the services have been rendered. |
|
§ |
Collectability is reasonably assured: The Company has a customer credit policy to ensure collectability is reasonably assured. |
F-7
NOTES TO CONSOLIDATED FINANCIAL STATEMENTS
Included in our service revenues are processing services performed on customer-owned material for a fee. We consider our toll processing services to be completed when we have processed the customer-owned material and no further services remain to be performed. Pursuant to the service arrangements with our customers,
we are entitled to collect our agreed upon toll processing fee upon completion of our toll processing services. Shipping of the product to and from our facilities is determined by and paid for by the customer. The revenue we recognize for toll processing services is net of the value of our customer’s product as we do not take ownership of our customer’s material during any stage of the process.
Amounts billed to customers related to shipping and handling are included in revenues while the associated shipping and handling costs to the Company are included in cost of revenues.
Cash and Cash Equivalents - The Company considers all highly-liquid debt securities with a maturity of three months or less when purchased to be cash equivalents. Those securities are readily convertible to known amounts of cash and bear insignificant risk of changes in
value due to their short maturity period.
Trade Receivables – Trade receivables are recorded at the invoiced amount and typically do not bear interest. The allowance for doubtful accounts is the Company’s best estimate of the amount of probable credit losses in the Company’s existing accounts receivable.
The allowance for doubtful accounts is reviewed quarterly. Past due balances are reviewed individually for collectability. Account balances are charged off against the allowance when it is probable the receivable will not be recovered. The Company does not have any off -balance sheet credit exposure related to its customers.
Inventories - Inventories are stated at the lower of cost or market, cost being determined by the first-in, first-out method.
Property, Plant and Equipment - The costs of property, plant and equipment, including renewals and improvements which extend the life of existing properties, are capitalized and depreciated using the straight-line method over the estimated useful lives of the various classes of assets
as follows:
|
Classification |
Years | |
|
Machinery and equipment |
1-20 | |
|
Buildings |
15-25 | |
|
Improvements |
2-25 | |
Leasehold improvements are amortized on a straight-line basis over the lesser of the economic life of the asset or the lease term. Expenditures for maintenance and repairs are expensed as incurred. The cost of property, plant and equipment sold or otherwise retired and the related accumulated depreciation are removed
from the accounts and any resultant gain or loss is included in other income (expense).
Impairment of Property, Plant and Equipment – Property, plant and equipment are reviewed for impairment whenever an event or change in circumstances indicates the carrying amount of an asset or group of assets may not be recoverable. The impairment review includes
comparison of undiscounted future cash flows expected to be generated by the asset or group of assets with the associated assets’ carrying value. If the carrying value of the asset or group of assets exceeds the expected future cash flows (undiscounted and without interest charges), an impairment loss is recognized to the extent that the carrying amount of the asset exceeds its fair value. Refer to Note 5 – “Long-lived asset impairment, restructuring and other costs (income)”
in the Company’s Consolidated Financial Statements.
Goodwill – The Company does not amortize goodwill. However, the Company tests annually for impairment and in interim periods if certain events occur indicating that the carrying value of goodwill and/or indefinite-lived intangible assets may be impaired. We test for
goodwill impairment loss under a two-step approach. The first step of the goodwill impairment test compares the fair value of the reporting unit with its carrying amount, including goodwill. The fair value of the reporting unit is estimated using a combination of the market approach and the income approach. If the carrying amount of a reporting unit exceeds its fair value, the second step of the goodwill impairment test is performed to measure the amount of the impairment loss. This
is determined by comparison of the implied fair value of the reporting units’ goodwill with the carrying amount of that goodwill. If the carrying amount of the reporting units’ goodwill exceeds the implied fair value of that
F-8
NOTES TO CONSOLIDATED FINANCIAL STATEMENTS
goodwill, we recognize an impairment loss as expense. At September 30, 2009, the Company’s remaining goodwill is recorded in its Bayshore Industrial segment. For fiscal year 2009, the Company performed goodwill impairment testing twice, once in connection with our annual test on September 30, 2009, which resulted
in no impairment loss being recognized, and also earlier in the fiscal year at March 31, 2009. The impairment testing at March 31, 2009 resulted in a full impairment of all goodwill in the Company’s Asia Pacific segment. Refer to Note 4 – “Goodwill” for additional information regarding our fiscal year 2009 goodwill impairment testing.
Currency Translation - Amounts in foreign currencies are translated into U.S. Dollars. When local functional currency is translated to U.S. Dollars, the effects are recorded as a separate component of Other Comprehensive Income (Loss). Exchange gains and losses resulting from foreign
currency transactions are recognized in earnings. Net foreign currency transaction gains (losses) were not significant in fiscal years 2009, 2008 and 2007.
The fluctuations of the U.S Dollar against the Euro, British Pound, New Zealand Dollar, Brazilian Real, Malaysian Ringgit and the Australian Dollar have impacted the translation of revenues and expenses of the Company’s international operations. The table below summarizes the impact of changing exchange rates for the above
currencies for fiscal years 2009, 2008 and 2007.
|
Years Ended | ||||||
|
September 30, | ||||||
|
2009 |
2008 |
2007 | ||||
|
Revenues |
$(33.7) million |
$29.1 million |
$20.4 million | |||
|
Operating income |
0.7 million |
1.6 million |
1.2 million | |||
|
Pre-tax income (loss) |
0.9 million |
1.3 million |
1.0 million | |||
|
Net income (loss) |
0.8 million |
1.0 million |
0.9 million | |||
Stock-based Compensation – The Company expenses stock-based payment transactions using the grant-date fair value-based method. Outstanding awards under the Company’s plans vest over periods ranging from
immediate vesting to four years. The Company expenses the fair value of stock option and restricted stock awards over the vesting period, where applicable. In stock-based awards with a graded vesting schedule, the Company recognizes the fair value of the stock-based award over the requisite service period applicable to the entire award and ensures that the amount recognized at any date at least equals the portion of the grant-date value of the stock-based compensation that has vested.
Environmental - Environmental expenditures that relate to current operations are expensed as incurred. Expenditures that relate to an existing condition caused by past operations and which do not contribute to generating current or future revenue are also expensed. Liabilities
are recorded when environmental assessments and/or remedial efforts are probable and the costs can be reasonably estimated. Generally, the timing of these accruals coincides with the earlier of completion of a feasibility study or the Company's commitment to a formal plan of action. Refer to Note 15 – “Commitments and Contingencies.”
Income taxes - The provision for income taxes includes federal, state, and foreign income taxes currently payable and deferred based on currently enacted tax laws. Deferred income taxes are provided for the tax consequences of differences between the financial statement
and tax basis of assets and liabilities. The Company reduces deferred tax assets by a valuation allowance when, based on its estimates, it is more likely than not that a portion of those assets will not be realized in a future period.
Derivative Instruments - All derivative and interest rate swap financial instruments are recognized in the financial statements and measured at fair value. Changes in the fair value of these financial instruments that qualify for cash flow hedge accounting are recognized
in stockholders’ equity (as a component of comprehensive income (loss)). The Company recognizes the amount of hedge ineffectiveness in the Consolidated Statement of Operations. The hedge ineffectiveness was not a significant amount for the fiscal years ended September 30, 2009, 2008 and 2007. Cash flows from the derivative and interest rate swap financial instruments which are classified as cash flow hedges have been classified in the Consolidated Statement of Cash Flows
in the same category as the item being hedged.
F-9
NOTES TO CONSOLIDATED FINANCIAL STATEMENTS
Sales Taxes – The Company presents its revenues in the Statement of Operations net of any sales taxes (excluded from revenues).
Reclassifications – Certain items previously reported in specific financial statement captions have been reclassified to conform to fiscal year 2009 presentation.
As a result of service revenues not comprising more than 10% of total revenues in fiscal year 2009, the Company has presented sales and service revenues in a combined line item on the Consolidated Statement of Operations, and the prior periods have been reclassified to conform to the current period presentation. Additionally,
in prior periods, “Cost of sales” and “Cost of services” were segregated into separate line items; in the current period these separate items have been combined into one line item called “Cost of revenues”, with prior periods being reclassified to conform to current period presentation.
Recently Issued Accounting Pronouncements – In June
2009, the FASB established the FASB Accounting Standards Codification (Codification), which officially commenced July 1, 2009, to become the source of authoritative US GAAP recognized by the FASB to be applied by nongovernmental entities. Rules and interpretive releases of the SEC under authority of federal securities laws are also sources of authoritative US GAAP for SEC registrants. Generally, the Codification is not expected to change US GAAP. All other accounting literature
excluded from the Codification will be considered non-authoritative. The Codification is effective for financial statements issued for interim and annual periods ending after September 15, 2009. We adopted the new guidance for fiscal year 2009. All references to authoritative accounting literature are now referenced in accordance with the Codification.
In December 2007, the FASB issued authoritative guidance that establishes the principles and requirements for how an acquirer (i) recognizes and measures in its financial statements the identifiable assets acquired, the liabilities assumed, and any noncontrolling interest in the acquiree; (ii) recognizes and measures the goodwill acquired
in the business combination or a gain from a bargain purchase; and (iii) determines what information to disclose to enable users of the financial statements to evaluate the nature and financial effects of the business combination. This guidance makes significant changes to existing accounting practices for acquisitions, including the requirement to expense transaction costs and to reflect the fair value of contingent purchase price adjustments at the date of acquisition. In April 2009, the FASB issued an amendment
to amend and clarify the guidance on business combinations to require that an acquirer recognize at fair value, at the acquisition date, an asset acquired or a liability assumed in a business combination that arises from a contingency if the acquisition-date fair value of that asset or liability can be determined during the measurement period. If the acquisition-date fair value of such an asset acquired or liability assumed cannot be determined, the acquirer should apply the provisions of the guidance on business
combinations to determine whether the contingency should be recognized at the acquisition date or after it. The guidance clarifies that a noncontrolling interest in a subsidiary is an ownership interest in the consolidated entity that should be reported as equity in the consolidated financial statements.The guidance is effective for business combinations for which the acquisition date is after the beginning of the first annual reporting period
beginning after December 15, 2008, which was effective for us on October 1, 2009. For any acquisitions completed after fiscal year 2009, we expect the adoption of the guidance will have an impact on our consolidated financial statements; however, the magnitude of the impact will depend upon the nature, terms and size of the acquisitions we consummate.
In March 2008, the FASB issued new standards which amended and expanded previous disclosure requirements related to derivative instruments and hedging activities. The new standards require qualitative disclosures about objectives and strategies for using derivative instruments, quantitative disclosures about fair value amounts of derivative
instruments and related gains and losses, and disclosures about credit risk-related contingent features in derivative agreements. We adopted the new standards as of January 1, 2009. They provide only for enhanced disclosures, and adoption had no impact on our financial position, results of operations or cash flows.
In April 2008, the FASB issued authoritative guidance that revises the factors that should be considered in developing renewal or extension assumptions in determining useful life of a recognized intangible asset under the guidance. This guidance will be effective for fiscal years beginning after December 15, 2008. We
will implement the guidance October 1, 2009. We do not expect the provisions of this guidance to have a material effect on our consolidated financial position, results of operations or cash flows.
F-10
NOTES TO CONSOLIDATED FINANCIAL STATEMENTS
In December 2008, the FASB issued new standards which require employers to make additional disclosures about plan assets for defined benefit pension and other postretirement benefit plans beginning with annual periods ending after December 15, 2009. Disclosures must provide an understanding of how investment allocation decisions are made,
the major categories of plan assets, the inputs and valuation techniques used to measure the fair value of plan assets, the effect of fair-value measurements using significant unobservable inputs on changes in plan assets for the period, and significant concentrations of risk within plan assets. Enhanced disclosures are required for annual periods only. We
will adopt the new guidance on October 1, 2009.
In May 2009, the FASB issued new standards which establish the accounting for and disclosure of events that occur after the balance sheet date but before financial statements are issued. In particular, the new standards set forth:
|
· |
the period after the balance sheet date during which management of a reporting entity should evaluate events or transactions that may occur for potential recognition or disclosure in the financial statements (through the date that the financial statements are issued or are available to be issued); |
|
· |
the circumstances under which an entity should recognize events or transactions occurring after the balance sheet date in its financial statements; and |
|
· |
the disclosures that an entity should make about events or transactions that occurred after the balance sheet date. |
We adopted the new standards during the period ended June 30, 2009. We have evaluated subsequent events after the balance sheet date of September 30, 2009 through the time of filing with the SEC on December 4, 2009 which is the date the financial statements were issued. See Note 17 –
“Subsequent Events.”
In June 2009, the FASB issued guidance that amends the consolidation guidance applicable to variable interest entities. The provisions of this guidance significantly affect the overall consolidation analysis under previous guidance. It is effective as of the beginning of the first fiscal year that begins after November 15, 2009; specifically
it will be effective for the Company beginning October 1, 2010. The Company does not expect the provisions of this guidance to have a material effect on our consolidated financial condition, results of operations or cash flows.
In June 2008, the FASB issued authoritative guidance governing whether instruments granted in share-based payment transactions are participating securities. This guidance addresses whether these instruments are participating securities prior to vesting and therefore need to be included in computing earnings per share under the
two-class method. This guidance will be effective for the Company beginning with the first quarter of fiscal year 2010 and will be applied retrospectively. The Company does not expect the provisions of this guidance to have a material effect on its consolidated financial position, results of operations or cash flows.
Note 2 - Concentration of Credit Risk
The primary customers of the Company's polymers processing business segment are large producers of polymers (which include major chemical companies and polymers production affiliates of major oil production companies), and end users such as rotational molders. No single customer accounted for more than 10% of revenues during
fiscal year 2009, 2008 or 2007. The Company has long-term contract arrangements with many polymers processing customers whereby it has agreed to process or manufacture certain polymers products for a single or multi-year term at an agreed-upon fee structure.
Financial instruments, which potentially subject the Company to concentrations of credit risk, consist primarily of trade receivables. The Company provides allowances for potential credit losses when collection becomes doubtful. Accordingly, management considers such credit risk to be limited.
Note 3 - Fair Value of Financial Instruments
The Company’s financial instruments consist of cash and cash equivalents, trade receivables, accounts payable, short-term and long-term debt, interest rate swaps and foreign currency derivative contracts. The carrying amounts of cash and cash equivalents, trade receivables, accounts payable and short term debt approximate
fair value due to the highly liquid nature of these short-term instruments. Based on borrowing rates currently available to the Company for loans with similar terms, the carrying value of long-term debt approximates fair value.
F-11
NOTES TO CONSOLIDATED FINANCIAL STATEMENTS
The Company enters into forward currency exchange contracts related to both future purchase obligations and other forecasted transactions denominated in non-functional currencies, primarily repayments of foreign currency intercompany transactions. Certain of these forward currency exchange contracts qualify as cash flow hedging instruments
and are highly effective. In accordance with authoritative guidance over accounting for derivative instruments and hedging activities, the Company recognizes the amount of hedge ineffectiveness for these hedging instruments in the Consolidated Statement of Operations. The hedge ineffectiveness on the Company’s designated cash flow hedging instruments was not a significant amount for the twelve months ended September 30, 2009, 2008 and 2007. The Company’s principal
foreign currency exposures relate to the Euro, British Pound, Australian Dollar, New Zealand Dollar, Malaysian Ringgit and Brazilian Real. The Company’s forward contracts have original maturities of one year or less.
The following table includes the total value of foreign exchange contracts outstanding for which hedge accounting is being applied as of September 30, 2009 and September 30, 2008:
|
As of | ||||
|
September 30, |
September 30, | |||
|
2009 |
2008 | |||
|
Notional value |
$5.5 million |
$8.3 million | ||
|
Fair market value |
$(0.3) million |
$0.5 million | ||
|
Maturity Dates |
October 2009 |
October 2008 | ||
|
through January 2010 |
through February 2009 | |||
The following table includes the total value of foreign exchange contracts outstanding for which hedge accounting is not being applied as of September 30, 2009 and September 30, 2008.
|
As of | ||||
|
September 30, |
September 30, | |||
|
2009 |
2008 | |||
|
Notional value |
$9.0 million |
$5.4 million | ||
|
Fair market value |
$0.0 million |
$0.8 million | ||
|
Maturity Dates |
October 2009 |
October 2008 | ||
|
through January 2010 |
through February 2009 | |||
The Company also marks to market the underlying transactions related to these foreign exchange contracts which offsets the fluctuation in the fair market value of the derivative instruments. As of September 30, 2009, the net unrealized gain or loss on these derivative instruments and their underlying transactions was insignificant.
The Company’s interest rate risk management objective is to limit the impact of future interest rate changes on earnings and cash flows. To achieve this objective, we attempt to borrow primarily on a fixed rate basis for longer-term debt issuances. The Company also tries to manage risk associated with changes
in interest rates by monitoring interest rates and future cash requirements, and evaluating opportunities to refinance borrowings at various maturities and interest rates.
At September 30, 2009, $0.7 million of the Company’s borrowings carried interest rates that were variable, and the remaining borrowings carried interest at fixed rates, including $11.3 million
of variable rate debt converted to fixed rate debt by interest rate swap agreements. These swaps have been designated as hedges of our exposure to fluctuations in interest rates on outstanding variable rate borrowings (a cash flow hedge). As of September 30, 2009, the estimated fair value of the $11.3 million in notional interest rate swaps was a liability of $0.4 million. The
fair value is an estimate of the net amount that the Company would pay on September 30, 2009 if the agreements were transferred to another party or cancelled by the Company.
As of September 30, 2008, the Company calculated the estimated fair value of the $14.4 million notional swaps identified above to be an asset of $0.1 million. The fair value is an estimate of the net amount that the Company would receive on September 30, 2008 if the agreements were transferred to another party or cancelled by
the Company.
F-12
NOTES TO CONSOLIDATED FINANCIAL STATEMENTS
For the twelve month periods ended September 30, 2009 and September 30, 2008, the Company recorded in other comprehensive income (loss) an unrealized loss on these interest rate swaps of $0.5 million and an unrealized gain of $0.1 million, respectively. For the twelve month period ended September 30, 2009, the amount of hedge ineffectiveness
associated with the interest rate swaps was not significant.
In September 2006, FASB issued authoritative guidance on fair value measurements of assets and liabilities which clarified the definition of fair value, established a framework and a hierarchy based on the level of observability and judgment associated with inputs used in measuring
fair value, and expanded disclosures about fair value measurements. The accounting literature applies whenever other accounting pronouncements require or permit assets or liabilities to be measured at fair value but
does not require any new fair value measurements.
This guidance established a three-level valuation hierarchy for disclosure of fair value measurements. The valuation hierarchy is based upon the transparency of inputs to the valuation of an asset or liability as of the measurement date. The three levels are defined as follows:
|
· |
Level 1 – Fair value based on quoted prices in active markets for identical assets or liabilities. |
|
· |
Level 2 – Fair value based on significant directly observable data (other than Level 1 quoted prices) or significant indirectly observable data through corroboration with observable market data. Inputs would normally be (i) quoted prices in active markets for similar assets or liabilities, (ii) quoted prices in inactive markets for identical or similar
assets or liabilities or (iii) information derived from or corroborated by observable market data. |
|
· |
Level 3 – Fair value based on prices or valuation techniques that require significant unobservable data inputs. Inputs would normally be a reporting entity’s own data and judgments about assumptions that market participants would use in pricing the asset or liability. |
An asset’s or liability’s categorization within the valuation hierarchy is based upon the lowest level of input that is significant to the fair value measurement.
At this time, the Company has adopted only the provisions of this accounting guidance that applies to financial assets and liabilities measured at fair value on a recurring basis. The Company will apply the remaining provisions of this accounting guidance to its nonfinancial assets and liabilities, which the Company discloses or recognizes
at fair value on a nonrecurring basis, such as goodwill impairment and other assets and liabilities, in the first quarter of fiscal year 2010. The Company does not expect this application will have a significant impact on its consolidated financial position, results of operations or cash flows.
The following table summarizes financial assets and financial liabilities measured at fair value on a recurring basis at September 30, 2009:
|
Fair Value Measurement Using: | |||||||
|
Total |
Quoted Price in active |
Significant Other |
Significant | ||||
|
Fair |
markets for Identical Assets |
Observable Inputs |
Unobservable Inputs | ||||
|
Value |
(Level 1) |
(Level 2) |
(Level 3) | ||||
|
(Dollars in Thousands) | |||||||
|
Financial Assets: |
|||||||
|
Forward Exchange Contracts |
$45 |
$- |
$45 |
$- |
|||
|
Financial Liabilities: |
|||||||
|
Forward Exchange Contracts |
383 |
- |
383 |
- |
|||
|
Interest Rate Swaps |
368 |
- |
368 |
- |
|||
“Forward exchange contracts” represent net unrealized gains or losses on foreign currency hedges, which are the net differences between (i) the amount in U.S. Dollars, or local currency translated into U.S. Dollars, to be received or paid at the contracts’ settlement date and (ii) the U.S. Dollar value of the foreign
currency to be sold or purchased at the current forward exchange rate. “Interest rate swaps” represent the net unrealized gains or losses on interest rate swaps related to the Company’s term loans in the United States and the United Kingdom. For additional disclosures required by this accounting guidance for financial assets and liabilities, see Item 7A. – “Quantitative and Qualitative Disclosures About Market Risk”.
F-13
NOTES TO CONSOLIDATED FINANCIAL STATEMENTS
Note 4 – Goodwill
Goodwill is tested for impairment on an annual basis and between annual tests when events occur or circumstances change that would more likely than not reduce the fair value of a reporting unit below its carrying value. Our annual goodwill impairment testing date is September 30. In assessing whether or not goodwill
should be tested for impairment on an interim basis at each of our reporting units, we consider the collective weight of a number of data points including, but not limited to the recent operating performances of our reporting units including factors that contributed to those performances (i.e. whether operating performances were reflective of the core operations or whether they were impacted positively or negatively by significant
or unusual items of a non-recurring nature), the future prospects for the Company’s reporting units, the competitive landscape in the markets within which our reporting units operate, the legal and regulatory environment in the markets within which our reporting units operate, and the market performance of our common stock and the stocks of our peer companies within our industry. We do not consider any single data point on its own to be an indicator that goodwill should be tested on an interim
basis. During the quarter ended March 31, 2009, the operating performance declined and the outlook for our Australia and New Zealand reporting units weakened in part due to the global economic downturn and the competitive landscape became more challenging, and the market value for our stock declined. As a consequence we concluded that it was necessary to test goodwill for impairment on an interim basis during the quarter ended March 31, 2009.
The impairment test was performed through the application of a two-step fair value test. The first step compares the book value of our reporting units to their estimated fair values at the respective test dates. The estimated fair values of the reporting units were determined by utilizing a combination of the income approach derived from
a discounted cash flow methodology and the market approach derived from comparable public companies. Significant assumptions used in this analysis include: expected future revenue growth rates, operating unit profit margins, and working capital levels; a discount rate; and a terminal value multiple. The fair value of the reporting unit is then compared to its carrying value. If the reporting unit’s fair value is less than its carrying value, a second step must be performed to quantify the amount of the
impairment, if any.
In the second step, the Company calculated the implied fair value of goodwill by allocating the fair value of the reporting unit to all of the assets and liabilities of the reporting unit, including any unrecognized intangible assets. The estimated implied fair value of goodwill is then compared to its respective carrying value
and any excess carrying value of the goodwill is recorded as an impairment charge.
The interim test resulted in an impairment of goodwill and accordingly, the Company recorded a non-cash charge of $3.5 million in the quarter ended March 31, 2009. The goodwill impairments were $2.3 million and $1.2 million, respectively, at the Company’s Australia and New Zealand reporting units. No tax benefit
was recognized on these goodwill impairments.
After the recognition of these impairment losses, the remaining goodwill in the Company’s reporting units is $4.5 million, all of which is related to the Company’s Bayshore Industrial segment.
The changes in the carrying amount of goodwill for the years ended September 30, 2009 and 2008 are as follows:
|
(Dollars in Thousands) | ||||||
|
ICO Asia Pacific |
Bayshore Industrial |
Total | ||||
|
Balance at September 30, 2007 |
$4.7 million |
$4.5 million |
$9.2 million | |||
|
Foreign currency impact |
(0.5) million |
- |
(0.5) million | |||
|
Balance at September 30, 2008 |
4.2 million |
4.5 million |
8.7 million | |||
|
Foreign currency impact |
(0.7) million |
- |
(0.7) million | |||
|
Impairment |
(3.5) million |
- |
(3.5) million | |||
|
Balance at September 30, 2009 |
$ - |
$4.5 million |
$4.5 million | |||
F-14
NOTES TO CONSOLIDATED FINANCIAL STATEMENTS
Note 5 – Long-lived asset impairment, restructuring and other costs (income)
On July 2, 2007 and July 26, 2008, the Company’s facility in New Jersey suffered two separate fires which caused damage to certain equipment and the building. The Company received insurance proceeds and incurred costs associated with both. The Company recorded a net benefit of $0.4 million, $1.9 million and $0.9 million
during fiscal year 2009, 2008 and 2007, respectively.
During the fourth quarter of fiscal year 2008, the Company closed its plant in the United Arab Emirates and recorded a $0.4 million impairment related to property, plant and equipment in fiscal year 2008 and recognized $0.4 million of closure costs in fiscal year 2009.
The Company recorded a net insurance reimbursement of $0.4 million in fiscal year 2009 related to financial losses resulting from the loss of power experienced at its Bayshore Industrial location as a result of Hurricane Ike.
The Company also recognized $0.2 million of equipment impairments in its Asia Pacific region in fiscal year 2009.
During fiscal year 2008, the Company incurred costs of $0.1 million as a result of Hurricane Ike, which caused minor damage to the Company’s China, Texas plant.
During fiscal year 2007, we also impaired property, plant and equipment in two of our locations outside of the United States for $0.6 million, and recorded a pre-tax gain of $0.6 million related to the sale of real estate previously owned by our Dutch subsidiary.
As a result of the above, the Company recorded a net gain of $0.2 million, $1.3 million and $1.0 million for fiscal year 2009, 2008 and 2007, respectively in impairment, restructuring and other costs (income) related to long-lived assets.
Note 6 – Inventories
Inventories at September 30 consisted of the following:
|
2009 |
2008 |
|||||||
|
(Dollars in Thousands) |
||||||||
|
Raw Materials |
$ | 18,407 | $ | 26,166 | ||||
|
Finished Goods |
17,879 | 25,868 | ||||||
|
Supplies |
1,111 | 1,424 | ||||||
|
Total Inventories |
$ | 37,397 | $ | 53,458 | ||||
Note 7 – Property, Plant and Equipment
Property, plant and equipment, at cost, consisted of the following at September 30:
|
Total |
||||||||
|
2009 |
2008 |
|||||||
|
(Dollars in Thousands) |
||||||||
|
Machinery and equipment |
$ | 104,889 | $ | 99,700 | ||||
|
Buildings |
26,133 | 26,046 | ||||||
|
Improvements |
7,172 | 6,049 | ||||||
|
Land |
6,009 | 5,925 | ||||||
|
Construction in progress |
1,537 | 4,527 | ||||||
| 145,740 | 142,247 | |||||||
|
Accumulated depreciation |
(88,596 | ) | (81,083 | ) | ||||
|
Property, plant and equipment, net |
$ | 57,144 | $ | 61,164 | ||||
F-15
NOTES TO CONSOLIDATED FINANCIAL STATEMENTS
Note 8 - Long-term Debt
Long-term debt at September 30, 2009 and 2008 consisted of the following:
|
September 30, |
September 30, | |||
|
2009 |
2008 | |||
|
(Dollars in Thousands) | ||||
|
Term loan of ICO, Inc. under the terms of the KeyBank Credit Agreement. Principal and interest paid quarterly through September 2011. Interest rates as of September 30, 2009 and September 30, 2008 were 6.6% and 4.1%, respectively. |
$6,667 |
$10,000 | ||
|
Term loan of ICO, Inc. under the terms of the KeyBank Credit Agreement. Principal and interest paid quarterly through September 2012. Interest rate as of September 30, 2009 and September 30, 2008 were 7.9% and 5.2%, respectively. |
3,333 |
4,444 | ||
|
Term loan of the Company’s Italian subsidiary, collateralized by a mortgage over the subsidiary’s real estate. Principal and interest paid quarterly with a fixed interest rate of 5.2% through June 2016. |
5,324 |
5,758 | ||
|
Various other U.S. loans of the Company’s U.S. subsidiaries collateralized by mortgages on land and buildings and other assets of the subsidiaries. As of September 30, 2009, these loans had a weighted average interest rate of 6.1% with maturity dates between November 2009 and May 2021. The interest and principal
payments are made monthly. |
7,545 |
8,064 | ||
|
Various other loans provided by foreign banks to the Company’s foreign subsidiaries collateralized by mortgages on land and buildings and other assets of the subsidiaries. As of September 30, 2009, these loans had a weighted average interest rate of 7.0% with maturity dates between January 2010 and March 2015. The
interest and principal payments are made monthly or quarterly. |
8,934 |
12,057 | ||
|
Total long-term debt |
31,803 |
40,323 | ||
|
Less current maturities of long-term debt |
12,980 |
15,201 | ||
|
Long-term debt less current maturities |
$18,823 |
$25,122 | ||
The Company’s total carrying amount of assets pledged as collateral on its long-term loans and credit arrangements is approximately $109.6 million at September 30, 2009, comprised mainly of certain property, plant and equipment, accounts receivable and inventory.
At September 30, 2009, the Company’s Australian subsidiary was in violation of a financial debt covenant related to $2.8 million of term debt and $0 of short term borrowings under its credit facility with its lender in Australia. Of the $39.9 million of total foreign credit availability as of September 30, 2009, $0.9 million
related to the Company’s Australian subsidiary. The Australian covenant not met related to a metric of profitability compared to interest expense. The testing of this covenant was waived as of September 30, 2009 and the Company entered into a new agreement with covenant levels we expect to achieve in fiscal year 2010. The covenant that was changed is the interest coverage ratio, which will increase gradually each quarter of fiscal year 2010. The Company has classified all
of the Australian term debt as current as of September 30, 2009.
Aggregate maturities of the Company’s debt including capital lease obligations are as follows:
|
Years Ended |
||||||
|
September 30, |
Amounts | |||||
|
(Dollars in Thousands) | ||||||
|
2010 |
$12,980 |
|||||
|
2011 |
5,970 |
|||||
|
2012 |
2,663 |
|||||
|
2013 |
1,533 |
|||||
|
2014 |
1,612 |
|||||
|
Thereafter |
7,045 |
|||||
Note 9 - Credit Arrangements
The Company maintains several lines of credit. The facilities are collateralized by certain assets of the Company. The following table presents the borrowing capacity, outstanding borrowings and net availability under the various credit facilities in the Company’s domestic and foreign operations:
F-16
NOTES TO CONSOLIDATED FINANCIAL STATEMENTS
|
Domestic |
Foreign |
Total |
||||||||||||||||||||||
|
As of |
As of |
As of |
||||||||||||||||||||||
|
September 30, |
September 30, |
September 30, |
September 30, |
September 30, |
September 30, |
|||||||||||||||||||
|
2009 |
2008 |
2009 |
2008 |
2009 |
2008 |
|||||||||||||||||||
|
(Dollars in Millions) |
||||||||||||||||||||||||
|
Borrowing Capacity (a) |
$ | 10.6 | $ | 19.9 | $ | 39.9 | $ | 52.5 | $ | 50.5 | $ | 72.4 | ||||||||||||
|
Outstanding Borrowings |
- | - | - | 9.6 | - | 9.6 | ||||||||||||||||||
|
Net availability |
$ | 10.6 | $ | 19.9 | $ | 39.9 | $ | 42.9 | $ | 50.5 | $ | 62.8 | ||||||||||||
|
(a) Based on the credit facility limits less outstanding letters of credit. |
||||||||||||||||||||||||
The Company maintains a Credit Agreement (the “Credit Agreement”) with KeyBank National Association and Wells Fargo Bank National Association (collectively referred to herein as “KeyBank”), with a maturity date of October 2012. The KeyBank Credit Agreement was amended in March 2009 to modify, among other
things, certain definitions related to the financial covenants within the Credit Agreement. The capacity of the Company’s revolving credit facility was also reduced from $30.0 million to $20.0 million. Under the Credit Agreement, there is a total of $10.0 million outstanding in the form of term loans as of September 30, 2009. The borrowing capacity of the $20.0 million revolving credit facility is based on the Company’s levels of domestic receivables and inventory. As
of September 30, 2009, the borrowing capacity was $10.6 million. There were $1.7 million of letters of credit outstanding under the credit facility, but no borrowings were outstanding under the revolving credit facility as of September 30, 2008 and September 30, 2009.
The Credit Agreement contains a variable interest rate and contains certain financial and nonfinancial covenants. During fiscal year 2008, the Company entered into interest rate swaps on its $6.7 million and $3.3 million term loans. The swaps lock in the Company’s interest rate on (i) the $6.7 million term loan
at 2.82% plus the credit spread on the corresponding debt, and (ii) on the $3.3 million term loan at 3.69% plus the credit spread on the corresponding debt. The variable interest rates on these term loans as of September 30, 2009 were 6.6% and 7.9%, respectively.
The Credit Agreement establishing the credit facility contains financial covenants, including:
|
· |
A minimum tangible net worth requirement, as defined under the Credit Agreement, of $50.0 million plus 50% of each fiscal quarter’s net income. As of September 30, 2009 and September 30, 2008, our required minimum tangible net worth was $69.7 million and $68.2 million, respectively. Our actual tangible net worth was $100.5 million
and $95.9 million, respectively, as of September 30, 2009 and September 30, 2008. |
|
· |
A leverage ratio, as defined under the Credit Agreement, not to exceed 3.0 to 1.0. As of September 30, 2009 and September 30, 2008, our leverage ratios were 2.48 to 1.0 and 1.63 to 1.0, respectively. |
|
· |
A fixed charge coverage ratio of at least 1.0 to 1.0, defined as “Adjusted EBITDA” (as defined under the Credit Agreement), plus rent expense divided by fixed charges (defined as the sum of interest expense, income tax expense paid, scheduled principal debt repayments in the prior four quarters, capital distributions, capital expenditures for
the purpose of maintaining existing fixed assets and rent expense); for the periods ending September 30, 2009 and September 30, 2008, our fixed charge coverage ratios were 1.1 to 1.0 and 1.5 to 1.0, respectively. |
|
· |
A required level of profitability, as defined under the Credit Agreement, to not be less than zero for two consecutive fiscal quarters. We have maintained the required level of profitability above zero. |
In addition, the Credit Agreement contains a number of limitations on the ability of the Company and its restricted U.S. subsidiaries to (i) incur additional indebtedness, (ii) pay dividends or redeem any Common Stock, (iii) incur liens or other encumbrances on their assets, (iv) enter into transactions with affiliates, (v) merge with
or into any other entity or (vi) sell any of their assets. Additionally, any “material adverse change” of the Company could restrict the Company’s ability to borrow under its Credit Agreement and could also be deemed an event of default under the Credit Agreement. A “material adverse change” is defined as a change in the financial or other condition, business, affairs or prospects of the Company, or its properties and assets considered as an entirety that could
reasonably be expected to have a material adverse effect, as defined in the Credit Agreement, on the Company.
F-17
NOTES TO CONSOLIDATED FINANCIAL STATEMENTS
In addition, any “Change of Control” of the Company or its restricted U.S. subsidiaries will constitute a default under the Credit Agreement. “Change of Control,” as defined in the Credit Agreement, means: (i) the acquisition of, or, if earlier, the shareholder or director approval of the acquisition
of, ownership or voting control, directly or indirectly, beneficially or of record, by any person, entity, or group (within the meaning of Rule 13d-3 of the Securities Exchange Act of 1934, as then in effect), of shares representing more than 50% of the aggregate ordinary voting power represented by the issued and outstanding Common Stock of the Company; (ii) the occupation of a majority of the seats (other than vacant seats) on the board of directors of the Company by individuals who were neither (A) nominated
by the Company’s board of directors nor (B) appointed by directors so nominated; (iii) the occurrence of a change in control, or other similar provision, under or with respect to any “Material Indebtedness Agreement” (as defined in the Credit Agreement); or (iv) the failure of the Company to own directly or indirectly, all of the outstanding equity interests of the Company’s Bayshore Industrial L.P. and ICO Polymers North America, Inc. subsidiaries. As further discussed in Note 17 –
“Subsequent Events”, the Company obtained a consent from KeyBank regarding shareholders and/or director approval related to the A. Schulman, Inc. merger.
The Company has various foreign credit facilities in eight foreign countries. The available credit under these facilities varies based on the levels of accounts receivable within the foreign subsidiary, or is a fixed amount. The foreign credit facilities are collateralized by assets owned by the foreign subsidiaries. These facilities
either have a remaining maturity of less than twelve months or do not have a stated maturity date, or can be cancelled at the option of the lender. The aggregate amounts of available borrowings under the foreign credit facilities, based on the credit facility limits, current levels of accounts receivables, and outstanding letters of credit and borrowings, were $39.9 million as of September 30, 2009 and $42.9 million as of September 30, 2008.
In addition to the “Change of Control” clause under the Keybank agreement, certain of the Company’s foreign loan agreements and credit facilities also have “Change of Control” provisions. However, unlike the Keybank agreement, such “Change of Control” provisions are only triggered upon consummation
of a transaction that constitutes a ‘Change of Control”. As of September 30, 2009, the Company had approximately $11.4 million of borrowings outstanding and $9.6 million of available borrowings under these agreements.
The following table contains the financial covenants within the Company’s foreign loan agreements. The financial covenant computations are specific to the subsidiary of the country listed.
|
As of September 30, 2009 |
||||||||||
|
Country |
Outstanding Borrowings |
Available Borrowing Capacity |
Financial Covenant Requirement |
September 30, 2009 |
September 30, 2008 | |||||
|
Australia |
$2.8 million |
$0.9 million |
Equity exceeds 29.9% of total assets |
43% |
53% | |||||
|
Earnings more than 2x interest expense |
(a) |
(a) | ||||||||
|
Holland |
1.6 million |
5.8 million |
Equity exceeds 34.9% of total assets |
56% |
56% | |||||
|
Malaysia |
0.4 million |
1.4 million |
Total debt less than 2x equity |
.4x |
1.0x | |||||
|
Malaysia |
2.1 million |
2.0 million |
Equity greater than US $1.6 million |
$5.6 million |
$4.6 million | |||||
(a) At September 30, 2009, the Company’s Australian subsidiary was in violation of a financial debt covenant related to $2.8 million of term debt and $0 of short term borrowings under its credit facility with its lender in Australia. Of the $39.9 million of total foreign credit availability as of September 30, 2009,
$0.9 million related to the Company’s Australian subsidiary. The Australian covenant not met related to a metric of profitability compared to interest expense. The testing of this covenant was waived as of September 30, 2009 and the Company entered into a new agreement with covenant levels we expect to achieve in fiscal year 2010. The covenant that was changed is the interest coverage ratio, which will increase gradually each quarter of fiscal year 2010. The Company
has classified all of the Australian term debt as current as of September 30, 2009.
The Company is currently in compliance with all of its credit facilities except in Australia as discussed above.
Approximately 45% of the Company’s net assets are restricted from being distributed to the parent company without approval from certain foreign lenders or as a result of other restrictions.
The weighted average interest rates charged on short-term borrowings under the Company’s various credit facilities at September 30, 2009 and 2008 were 0% (as a result of no borrowings being outstanding) and 7.8%, respectively.
F-18
NOTES TO CONSOLIDATED FINANCIAL STATEMENTS
Note 10 – Earnings (Loss) Per Share (“EPS”)
Basic EPS is computed by dividing income applicable to Common Stock by the weighted-average number of common shares outstanding for the period. Diluted EPS assumes the conversion of all dilutive securities using the treasury stock method. There were no potentially dilutive securities for the fiscal year ended September
30, 2009 due to the Company reporting a loss from continuing operations.
Basic and diluted earnings per share for the years ended September 30, 2009, 2008 and 2007 are presented below:
|
Years Ended |
||||||||||||
|
September 30, |
||||||||||||
|
2009 |
2008 |
2007 |
||||||||||
|
Basic income (loss) per share: |
||||||||||||
|
Income (loss) from continuing operations |
$ | (0.05 | ) | $ | 0.56 | $ | 0.97 | |||||
|
Income from discontinued operations |
- | - | 0.05 | |||||||||
|
Basic net income (loss)per common share |
$ | (0.05 | ) | $ | 0.56 | $ | 1.02 | |||||
|
Diluted income (loss) per share: |
||||||||||||
|
Income (loss) from continuing operations |
$ | (0.05 | ) | $ | 0.55 | $ | 0.71 | |||||
|
Income from discontinued operations |
- | - | 0.05 | |||||||||
|
Diluted net income (loss) per common share |
$ | (0.05 | ) | $ | 0.55 | $ | 0.76 | |||||
For fiscal year 2007, the Company includes the net gain on the repurchase of 84.9% of the Company’s outstanding $6.75 Convertible Exchangeable Preferred Stock (the “Preferred Stock”) of $6.0 million in computing EPS, but the gain is excluded in the computation of diluted EPS. Refer to the following tables for
a reconciliation of the amounts used in computing basic and diluted EPS.
The following presents the reconciliation from net income (loss) to net income (loss) applicable to Common Stock used in computing basic earnings per share:
|
Years Ended |
||||||||||||
|
September 30, |
||||||||||||
|
2009 |
2008 |
2007 |
||||||||||
|
(Dollars in Thousands) |
||||||||||||
|
Net income (loss) |
$ | (1,239 | ) | $ | 15,314 | $ | 21,118 | |||||
|
Preferred Stock dividends |
- | (1 | ) | (554 | ) | |||||||
|
Net gain on redemption of Preferred Stock |
- | - | 6,023 | |||||||||
|
Net income (loss) applicable to Common Stock |
$ | (1,239 | ) | $ | 15,313 | $ | 26,587 | |||||
In computing diluted EPS, the Company follows the if-converted method, which assumes the conversion of dilutive convertible securities. For fiscal year 2007, the Preferred Stock repurchased was treated as being converted at the beginning of fiscal year 2007. Consequently, the net gain on the repurchase of the Preferred
Stock and the undeclared and unpaid Preferred Stock dividends were not included in computing net income applicable to Common Stock. The following presents the reconciliation from net income (loss) to net income (loss) applicable to Common Stock used in computing diluted EPS:
|
Years Ended |
||||||||||||
|
September 30, |
||||||||||||
|
2009 |
2008 |
2007 |
||||||||||
|
(Dollars in Thousands) |
||||||||||||
|
Net Income (loss) |
$ | (1,239 | ) | $ | 15,314 | $ | 21,118 | |||||
|
Preferred Stock dividends |
- | (1 | ) | - | ||||||||
|
Net income (loss) applicable to Common Stock |
$ | (1,239 | ) | $ | 15,313 | $ | 21,118 | |||||
F-19
NOTES TO CONSOLIDATED FINANCIAL STATEMENTS
The difference between basic and diluted weighted-average common shares results from the assumed exercise of outstanding stock options calculated using the treasury stock method, impact from outstanding restricted stock awards using the treasury stock method, assumed conversion of the outstanding Preferred Stock during the year ended September
30, 2008 and 2007 and assumed conversion of the Preferred Stock redeemed during the year ended September 30, 2008 and 2007. The following presents the number of incremental weighted-average shares used in computing diluted per share amounts for the years ended September 30, 2009, 2008 and 2007:
|
Years Ended |
||||||||||||
|
September 30, |
||||||||||||
|
2009 |
2008 |
2007 |
||||||||||
|
Basic |
27,081,000 | 27,271,000 | 26,030,000 | |||||||||
|
Incremental shares from Preferred Stock |
- | 33,000 | 892,000 | |||||||||
|
Incremental shares from stock based compensation |
- | 690,000 | 969,000 | |||||||||
|
Diluted |
27,081,000 | 27,994,000 | 27,891,000 | |||||||||
The total amount of anti-dilutive securities excluded from the determination of weighted average diluted shares for the years ended September 30, 2009, 2008 and 2007 were 1,309,000, 584,000 and 786,000, respectively.
Note – 11 Stockholders’ Equity
In September 2008, the Company announced that its Board of Directors authorized the repurchase of up to $12.0 million of its outstanding Common Stock through September 2010 (the “Share Repurchase Plan”). Through September 30, 2009, 578,081 shares had been repurchased for total cash consideration of $3.0 million at
an average price of $ 5.22 per share. In connection with the A. Schulman merger agreement, on December 2, 2009, the Board of Directors terminated the Share Repurchase Plan.
During the quarter ended December 31, 2006, the Company purchased 1,095,853 Depositary Shares of Preferred Stock for $26.00 per Depositary Share, for total consideration of $28.5 million. The dividends that were in arrears on these 1,095,853 Depositary Shares of $7.2 million were extinguished by the repurchase. In
September 2007, 8,624 Depositary Shares were converted into 23,622 shares of Common Stock. During fiscal year 2008, 177,518 Depositary Shares of Preferred Stock were converted into 486,321 shares of Common Stock and 8,005 Depositary Shares were redeemed by the Company at $25 per Depositary Share for a total consideration of $0.2 million. As all of the outstanding Depositary Shares representing the Preferred Stock were canceled by the Company at the time of redemption, no shares of Preferred
Stock or Depositary Shares remain outstanding.
There were no dividends paid on the Company’s Common Stock during the fiscal years ended September 30, 2009, 2008 and 2007. Cumulative liquidating dividends on the Company’s Common Stock paid out of Additional Paid-in Capital through September 30, 2009 totaled $5.7 million. Cumulative dividends on the
Company’s Common Stock paid out of Accumulated Deficit totaled $7.8 million through September 30, 2009.
Note 12 – Stock-Based Compensation
Stock Options
Options issued under the Company’s plan providing for the issuance of stock options to non-employee directors (“Director Plan”) are non-qualified stock options. Prior to fiscal year 2008, the non-employee directors received an annual stock option award. Pursuant to the terms of the Director Plan
and stock option award agreements entered into pursuant to the Director Plan, all outstanding director stock options, which were awarded in or prior to fiscal year 2007, have vested and are exercisable by the non-employee directors.
F-20
NOTES TO CONSOLIDATED FINANCIAL STATEMENTS
In fiscal year 2009, the Company’s Board of Directors approved registering an additional 350,000 shares of Common Stock of the Registrant to be reserved for issuance under the 2007 Equity Incentive Plan (the “Employee Plan”) and 150,000 shares of Common Stock of the Registrant to be reserved for issuance under the 2008
Equity Incentive Plan for Non-Employee Directors of ICO, Inc. (the “Director Plan”).
In fiscal year 2008, the Company’s shareholders approved an amendment to the Director Plan, to allow for restricted share awards to non-employee directors. In fiscal year 2008, non-employee directors did not receive any stock option awards, and instead received awards of restricted shares. The Company’s
current policy is to award stock-based compensation in the form of restricted stock, rather than stock options, to non-employee directors. As of September 30, 2009, options to purchase 80,000 shares with a weighted average price of $3.20 per share had been granted and were outstanding under the terms of the Director Plan. All of these options have vested and are exercisable by non-employee directors.
The Company’s plans providing for the issuance of stock options to officers and other key employees (“Employee Plans”) provide for the issuance of both incentive and non-qualified stock options. Employee stock options may vest immediately, or may vest over a specified employment period after the date of grant,
and may have a term of up to 10 years after the grant date during which they can be exercised, as set forth in the applicable award agreement. In the event that the Company merges into, consolidates with, or sells or transfers substantially all of its assets to another corporation and provision is not made pursuant to the terms of such transaction for the assumption by the surviving, resulting, or acquiring corporation of outstanding options under the Employee Plans, or for the substitution of new
options therefore, all outstanding options that have not yet vested shall become fully vested prior to the effective date of such transaction unless the award agreement expressly provides otherwise. As of September 30, 2009, options to purchase 908,000 shares, with a weighted average exercise price of $3.23 per share, had been granted and were outstanding under the terms of the Employee Plans, of which 814,000 shares, with a weighted average
exercise price of $2.98 per share, had vested and were exercisable by employees.
The Company uses the Black-Scholes pricing model to calculate the grant date fair value of its options for accounting purposes. The following table presents the assumptions used in valuing options granted during fiscal years 2009, 2008 and 2007. There were no stock options granted during fiscal year 2008.
|
Fiscal Year Ended | ||||||
|
September 30, | ||||||
|
2009 |
2008 |
2007 | ||||
|
Weighted average fair value |
$1.43 |
$- |
$3.25 | |||
|
Assumptions used: |
||||||
|
Expected life of stock options |
4.85 |
0 years |
5.0 years | |||
|
Expected dividend yield over life of stock options |
0% |
0% |
0% | |||
|
Expected stock price volatility |
61% |
0% |
51% | |||
|
Risk-free interest rate |
1.10% |
0.00% |
4.23% | |||
The following is a summary of stock option activity for the twelve months ended September 30, 2009:
|
Weighted |
Weighted |
|||||||||
|
Option |
Average |
Average |
Aggregate | |||||||
|
Shares |
Exercise |
Remaining |
Intrinsic | |||||||
|
(000's) |
Price |
Contractual Term |
Value | |||||||
|
Outstanding at October 1, 2008 |
1,013 | $ | 3.27 | |||||||
|
Granted |
15 | 2.80 | ||||||||
|
Exercised |
(2 | ) | 2.00 | |||||||
|
Forfeited/cancelled |
(38 | ) | 4.07 | |||||||
|
Outstanding at September 30, 2009 |
988 | $ | 3.23 |
4 years |
$1.6 million | |||||
|
Options exercisable at September 30, 2009 |
894 | $ | 3.00 |
3 years |
$1.6 million | |||||
F-21
NOTES TO CONSOLIDATED FINANCIAL STATEMENTS
Total stock option compensation expense included in selling, general and administrative (“SG&A”) expense in the Company’s Consolidated Statement of Operations was $0.2 million, $0.3 million, and $0.6 million for the fiscal years ended September 30, 2009,
2008 and 2007, respectively. All of our stock option compensation expense relates solely to employees and members of the Company’s Board of Directors whose cash compensation is classified as SG&A expense. The total income tax benefit (provision) recognized related to stock option activity in the Consolidated Statement of Operations was $0, $0.2 million, and $0.2 million for the fiscal years ended September 30, 2009,
2008 and 2007, respectively.
The total intrinsic value of stock options exercised during the fiscal years ended September 30, 2009, 2008 and 2007 was $0, $2.5 million, and $4.4 million, respectively, and the total cash received was $0, $1.4 million, and $1.3 million, respectively.
A summary of the status of the Company’s outstanding option awards that have not yet vested as of September 30, 2009, as well as other changes in the status of outstanding options during the twelve months ended September 30, 2009, is presented below:
|
Nonvested Stock Options |
Shares (000’s) |
Weighted-Average
Grant-Date
Fair Value |
Weighted-Average Exercise Price |
|||||||||
|
Nonvested at October 1, 2008 |
191 | $ | 2.61 | $ | 5.10 | |||||||
|
Granted |
15 | $ | 1.43 | $ | 2.80 | |||||||
|
Vested |
(74 | ) | $ | 2.43 | $ | 4.73 | ||||||
|
Forfeited |
(38 | ) | $ | 2.15 | $ | 4.07 | ||||||
|
Nonvested at September 30, 2009 |
94 | $ | 2.72 | $ | 5.38 | |||||||
As of September 30, 2009, the total stock option compensation expense not yet recognized in the Consolidated Statement of Operations relating to the 94,000 non-vested stock options was $0.1 million, which will be recognized over a weighted-average period of approximately 1.0 years.
Restricted Stock Awards
In addition to stock options, non-employee directors, officers and other key employees may be granted restricted stock awards, which are awards of Common Stock with no exercise price. Pursuant to the terms of the Company’s plans providing for restricted stock awards (the Director Plan and Employee Plans), referenced above,
restricted stock awards may be subject to cliff or graded (time-based) vesting or performance-based vesting, with a minimum one-year vesting period.
We determine the grant date fair value of restricted stock awards for accounting purposes based on the closing market price of our Common Stock on the date of grant. Compensation costs for restricted stock awards with time-based vesting are recognized on a straight-line basis over the vesting or service period and are net of
forfeitures.
The following table summarizes information about restricted stock awards made to employees and non-employee directors during the fiscal year ended September 30, 2009.
|
Restricted stock |
Shares
(000's) |
Weighted Average
Grant-Date Fair
Value Per Share |
||||||
|
Issued and unvested at October 1, 2008 |
261 | $ | 9.31 | |||||
|
Issued |
402 | 2.88 | ||||||
|
Vested |
(9 | ) | 6.77 | |||||
|
Forfeited |
(109 | ) | 7.01 | |||||
|
Issued and unvested at September 30, 2009 |
545 | $ | 5.12 | |||||
F-22
NOTES TO CONSOLIDATED FINANCIAL STATEMENTS
As of September 30, 2009, there was $1.2 million of unrecognized compensation cost related to the non-vested restricted stock awards. This cost is expected to be recognized over a weighted-average period of 1.5 years. The compensation cost charged against income for restricted stock was $0.6 million, $0.7 million,
and $0.1 million for the years ended September 30, 2009, 2008 and 2007, respectively. The income tax benefit recognized in income related to this compensation expense was $0.2 million, $0.2 million and $0, respectively, for the same periods.
There were 652,000, 445,000, and 498,000 shares available for awards under all of the Company’s stock-based incentive plans at September 30, 2009, 2008 and 2007, respectively.
Note 13 - Income Taxes
The amounts of income (loss) before income taxes attributable to domestic and foreign continuing operations are as follows:
|
Years Ended September 30, |
||||||||||||
|
2009 |
2008 |
2007 |
||||||||||
|
(Dollars in Thousands) |
||||||||||||
|
Domestic |
$ | (75 | ) | $ | 7,699 | $ | 15,668 | |||||
|
Foreign |
(670 | ) | 13,515 | 10,806 | ||||||||
| $ | (745 | ) | $ | 21,214 | $ | 26,474 | ||||||
The expense (benefit) for income taxes consists of the following:
|
Years Ended September 30, |
||||||||||||
|
2009 |
2008 |
2007 |
||||||||||
|
(Dollars in Thousands) |
||||||||||||
|
Current: |
||||||||||||
|
Domestic |
$ | (443 | ) | $ | 2,352 | $ | 4,066 | |||||
|
Foreign |
1,739 | 3,858 | 2,912 | |||||||||
| 1,296 | 6,210 | 6,978 | ||||||||||
|
Deferred: |
||||||||||||
|
Domestic |
220 | 126 | 554 | |||||||||
|
Foreign |
(1,022 | ) | (504 | ) | (820 | ) | ||||||
| (802 | ) | (378 | ) | (266 | ) | |||||||
|
Total: |
||||||||||||
|
Domestic |
(223 | ) | 2,478 | 4,620 | ||||||||
|
Foreign |
717 | 3,354 | 2,092 | |||||||||
| $ | 494 | $ | 5,832 | $ | 6,712 | |||||||
A reconciliation of the income tax provision, for continuing operations at the federal statutory tax rate of 35% to the Company’s effective tax rate is as follows:
F-23
NOTES TO CONSOLIDATED FINANCIAL STATEMENTS
|
Years Ended September 30, |
||||||||||||
|
2009 |
2008 |
2007 |
||||||||||
|
(Dollars in Thousands) |
||||||||||||
|
Tax expense (benefit) at statutory rate |
$ | (260 | ) | $ | 7,425 | $ | 9,266 | |||||
|
Chargeback Reimbursement |
(61 | ) | (163 | ) | (422 | ) | ||||||
|
Foreign tax rate differential |
(202 | ) | (298 | ) | (77 | ) | ||||||
|
Change in the deferred tax assets valuation allowance |
- | (699 | ) | (1,574 | ) | |||||||
|
Adjustment to tax contingency |
- | - | (350 | ) | ||||||||
|
Non-deductilble goodwill impairment |
1,283 | - | - | |||||||||
|
Tax credits |
(292 | ) | (379 | ) | (36 | ) | ||||||
|
Non-deductilble expenses and other, net |
26 | (54 | ) | (95 | ) | |||||||
|
Income tax provision |
$ | 494 | $ | 5,832 | $ | 6,712 | ||||||
|
Effective income tax rate |
(66.3% | ) | 27.5% | 25.4% | ||||||||
Deferred tax assets (liabilities) result from the cumulative effect of temporary differences in the recognition of expenses (revenues) between tax returns and financial statements. The significant components of the balances are as follows:
|
September 30, |
||||||||
|
2009 |
2008 |
|||||||
|
(Dollars in Thousands) |
||||||||
|
Deferred tax assets: |
||||||||
|
Net operating loss carry-forwards |
$ | 2,405 | $ | 1,151 | ||||
|
Depreciation |
1,620 | 1,590 | ||||||
|
Compensation accruals |
1,645 | 1,379 | ||||||
|
Other accruals |
309 | 299 | ||||||
|
Other intangibles |
339 | 250 | ||||||
|
Goodwill (foreign) |
30 | 159 | ||||||
|
Inventory |
347 | 371 | ||||||
|
Bad debt allowance |
728 | 380 | ||||||
|
Insurance accruals |
191 | 357 | ||||||
|
Other |
57 | 129 | ||||||
| 7,671 | 6,065 | |||||||
|
Deferred tax liabilities: |
||||||||
|
Depreciation and land |
(6,109 | ) | (5,997 | ) | ||||
|
Other |
(372 | ) | (342 | ) | ||||
| (6,481 | ) | (6,339 | ) | |||||
|
Net deferred tax asset (liability) |
$ | 1,190 | $ | (274 | ) | |||
The total net deferred tax asset at September 30, 2009 is comprised of $1.8 million of net current deferred tax assets and $0.6 million of net non-current deferred tax liabilities. The Company has net operating losses in the amount of $4.3 million in its Australian subsidiary, $1.5 million in its Brazilian subsidiary, $0.8 million
in its Italian subsidiary and $1.0 in its New Zealand subsidiary. All net operating losses can be carried forward indefinitely except for the Italian subsidiary which has a five year limitation on carry forwards. This five-year period currently has an expiration date of September 30, 2014.
The Company does not provide for U.S. income taxes on foreign subsidiaries’ undistributed earnings as they will be permanently reinvested in foreign operations exclusive of those repatriated under the American Jobs Creation Act. Due to the timing and circumstances of repatriation of such earnings, if any, it is not practicable to
determine the unrecognized deferred tax liability relating to such amounts. As of September 30, 2009, the Company has unremitted earnings from foreign subsidiaries of approximately $25.2 million.
F-24
NOTES TO CONSOLIDATED FINANCIAL STATEMENTS
Uncertain Tax Positions
On October 1, 2007, the Company adopted the provisions of accounting guidance related to uncertainty in income taxes, and the adoption did not have a material impact on our financial position or results of operations. The Company also adopted the accounting policy to classify any interest and penalties on unrecognized tax positions
as income tax expense in the event any arise in the future. The Company does not anticipate a material change to the total amount of unrecognized tax benefits within the next twelve months. As of September 30, 2009, the Company has no material uncertain tax positions.
The tax years that remain subject to examination for the Company's major tax jurisdictions are shown below:
|
Taxing Jurisdiction |
Years Open | |
|
Australia |
2005-2008 | |
|
Brazil |
2002-2008 | |
|
France |
2007-2008 | |
|
Italy |
2004-2008 | |
|
Malaysia |
2003-2008 | |
|
New Zealand |
2004-2008 | |
|
Netherlands |
2003-2008 | |
|
United Kingdom |
2008 | |
|
United States |
Federal |
2006-2008 |
Note 14 - Employee Benefit Plans
The Company maintains several defined contribution plans that cover domestic and foreign employees who meet certain eligibility requirements related to age and period of service with the Company. The plan in which each employee is eligible to participate depends upon the subsidiary for which the employee works. All
plans have a salary deferral feature that enables participating employees to contribute up to a certain percentage of their earnings, subject to governmental regulations. Many of the foreign plans require the Company to match employees’ contributions in cash. Employee contributions to the Company’s domestic 401(k) plan have historically been voluntarily matched by the Company with shares of ICO Common Stock. Both foreign and domestic employees’ interests in Company
matching contributions are generally vested immediately upon contribution.
The Company maintains a defined benefit plan for employees of the Company’s Dutch operating subsidiary. Participants contribute a portion of the cost associated with the benefit plan. The plan provides retirement benefits at the normal retirement age of 65. This plan is insured by an insurance contract with Aegon Levensverzekering
N.V. ("Aegon"), located in The Hague, The Netherlands. The insurance contract guarantees the funding of the Company’s future pension obligations for its defined benefit pension plan. In accordance with the contract, Aegon will pay all future obligations under the provisions of this plan, while the Company pays annual insurance premiums. Payment of the insurance premiums by the Company constitutes an unconditional and irrevocable transfer of the related pension obligation from the Company to Aegon. Aegon
has a Standard and Poor’s financial strength rating of AA-. The premiums paid for the insurance contracts of $0.4 million, $0.4 million and $0.6 million for fiscal years ended September 30, 2009, 2008 and 2007, respectively, are included in pension expense.
The Company also maintains several termination plans, usually mandated by law, within certain of its foreign subsidiaries that provide a one time payment if a covered employee is terminated.
The defined contribution plan expense for the years ended September 30, 2009, 2008 and 2007 was $1.1 million, $1.4 million and $1.2 million, respectively. The defined benefit plan pension expense for the years ended September 30, 2009, 2008 and 2007 was $0.4 million, $0.5 million and $1.0 million, respectively.
F-25
NOTES TO CONSOLIDATED FINANCIAL STATEMENTS
Note 15 - Commitments and Contingencies
The Company has entered into operating leases related to buildings, office space, machinery and equipment and office equipment that expire at various dates. Rental expense was approximately $2.5 million in 2009, $2.8 million in 2008, and $2.4 million in 2007. Future
minimum rental payments as of September 30, 2009 are due as follows:
|
2010 |
$2.0 million |
|
2011 |
$1.8 million |
|
2012 |
$1.5 million |
|
2013 |
$1.1 million |
|
2014 |
$1.1 million |
|
Thereafter |
$3.2 million |
The Company has letters of credit outstanding in the United States of $1.7 million and $1.6 million as of September 30, 2009 and September 30, 2008, respectively, and foreign letters of credit outstanding of $0.7 million and $5.1 million as of September 30, 2009 and September 30,
2008, respectively.
Thibodaux Litigation. Since September 2004, the Company has been a defendant in litigation pending in District Court in the Parish of Orleans, Louisiana (the “Thibodaux Lawsuit”) filed by C.M. Thibodaux Company (“Thibodaux”). Other defendants
in the case include Intracoastal Tubular Services, Inc. (“ITCO”), thirty different oil companies (the “Oil Company Defendants”), several insurance companies and four trucking companies. Thibodaux, the owner of industrial property located in Amelia, Louisiana that has historically been leased to tenants conducting oilfield services businesses, contends that the property has been contaminated with naturally occurring radioactive material (“NORM”). NORM is
found naturally occurring in the earth, and when pipe is removed from the ground it is not uncommon for the corroded rust on the pipe to contain very small amounts of NORM. The Company’s former Oilfield Services business leased a portion of the subject property from Thibodaux. Thibodaux contends that the subject property was contaminated with NORM generated during the servicing of oilfield equipment by the Company and other tenants, and further alleges that the Oil Company Defendants
(customers of Thibodaux’s tenants) and trucking companies (which delivered tubular goods and other oilfield equipment to the subject property) allowed or caused the uncontrolled dispersal of NORM on Thibodaux’s property. Thibodaux seeks recovery from the defendants for clean-up costs, diminution or complete loss of property values, and other damages. Discovery in the Thibodaux Lawsuit is ongoing, and the Company intends to assert a vigorous defense in this litigation. At
this time, the Company does not believe it has any liability in this matter. In the event the Company is found to have liability, the Company believes it has sufficient insurance coverage applicable to this claim subject to a $1.0 million self-insured retention. However, an adverse judgment against the Company, combined with a lack of insurance coverage, could have a material adverse effect on the Company's financial condition, results of operations or cash flows.
Wastewater Discharge Permit. In the second quarter of fiscal year 2009, the Company self-reported to the Texas Commission on Environmental Quality (“TCEQ”) facts surrounding certain events of noncompliance with its Bayshore Industrial facility’s Texas Pollutant
Discharge Elimination System wastewater discharge permit, and subsequently received notification from the TCEQ that it is conducting an investigation into the matter. The Company has cooperated in the investigation. The Company has taken certain corrective action with respect to the operation of its wastewater treatment facility and the requirements of its wastewater discharge permit. In July 2009 the Company received a Notice of Violation (Notice) from the TCEQ stating that an
alleged violation of the permit was noted in the TCEQ’s investigation, and requesting that the Company provide documentation of the corrective action and demonstration that compliance has been achieved for the alleged violation. The Company complied with the TCEQ’s request for information, and subsequently received notification from the TCEQ confirming that the TCEQ was satisfied that appropriate corrective action had been taken. No administrative penalties have been imposed
on the Company as a result of the Notice; however, the investigation is still pending. It is possible that the investigation could result in the Company receiving civil and/or criminal penalties. An adverse finding in the investigation and any resulting penalties imposed on the Company could have a material adverse effect on the Company's financial condition, results of operations or cash flows. However, at this time, the Company does not believe that the outcome will have a material
adverse effect on the Company’s financial condition, results of operations or cash flows.
F-26
NOTES TO CONSOLIDATED FINANCIAL STATEMENTS
Environmental Remediation. The Comprehensive Environmental Response, Compensation, and Liability Act, as amended (“CERCLA”), also known as “Superfund,” and comparable state laws impose
liability without regard to fault or the legality of the original conduct on certain classes of persons who are considered to be responsible for the release of a “hazardous substance” into the environment. These persons include the owner or operator of a disposal site or another site where the release occurred, and companies that disposed or arranged for the disposal of the hazardous substances at the site where a release occurred. Under CERCLA, such persons may be subject to
joint and several liability for the costs of cleaning up the hazardous substances that have been released into the environment, for damages to natural resources, and for the costs of certain health studies, and it is not uncommon for neighboring landowners and other third parties to file claims for personal injury and property damage allegedly caused by the release of hazardous substances into the environment.
The Company is identified as one of many potentially responsible parties (“PRPs”) under CERCLA in a pending claim relating to the Combe Fill South Landfill (“CFS”) superfund site in Morris County, New Jersey. The Environmental Protection Agency (“EPA”) has indicated that the Company is responsible
for only de minimus levels of wastes contributed to the site, and there are numerous other PRPs identified that contributed more than 99% of the volume of waste at the site. The Company has executed a consent decree, subject to court and EPA approval, to settle its liability related to the CFS site, for an amount that is immaterial to the Company’s financial condition, results of operations and cash flows.
Other Legal Proceedings. The Company is also named as a defendant in certain other lawsuits arising in the ordinary course of business. The outcome of these lawsuits cannot be predicted with certainty, but the Company does not believe they will have a material adverse
effect on the Company’s financial condition, results of operations or cash flows.
Note 16 - Discontinued Operations
On September 6, 2002, the Company completed the sale of substantially all of its Oilfield Services business to National Oilwell Varco, Inc., formerly Varco International, Inc. (“NOV”). On July 31, 2003, the Company sold its remaining Oilfield Services business to Permian Enterprises, Ltd. The Oilfield
Services results of operations are presented as discontinued operations, net of income taxes, in the Consolidated Statement of Operations. Legal fees or other expenses incurred related to discontinued operations are expensed as incurred to discontinued operations.
During fiscal year 2007, the Company recognized income from a settlement agreement with its insurance carrier related to indemnity claims asserted by NOV for $2.3 million in discontinued operations.
Note 17 – Subsequent Events
The Company evaluated all events and transactions that occurred after September 30, 2009 and through December 4, 2009, the date the Company issued these financial statements. During this period, the Company did not have any material recognizable subsequent events; however, the Company did have an unrecognizable subsequent event
as discussed further below.
Merger Agreement with A. Schulman, Inc.
On December 2, 2009, the Company signed a definitive merger agreement with A. Schulman, Inc. (“A. Schulman”) in a combined cash and stock transaction pursuant to which 100% of the outstanding stock of the Company will be acquired by A. Schulman. Under the terms of the agreement, the total consideration is comprised
of $105.0 million in cash and 5.1 million shares of A. Schulman common stock. Closing of the transaction is subject to approval at a meeting by at least two-thirds of the votes entitled to be cast by holders of the Company's Common Stock, regulatory approvals and other customary closing conditions.
The merger with A. Schulman, if consummated, will result in a change in control. As discussed in Note 9 – “Credit Arrangements”, any change of control of the Company or its restricted U.S. subsidiaries, as defined, will constitute a default under
our credit agreement with KeyBank. Prior to signing the definitive merger agreement, KeyBank agreed to consent, subject to certain terms and conditions, to the approval by our board of directors and/or shareholders of the proposed merger. Additionally, among other things, this change in control will trigger the acceleration of the vesting of certain outstanding stock-based
awards of the Company and defaults under certain of the Company’s foreign credit agreements at the time the change in control occurs. The merger agreement requires the Company to conduct its business in the ordinary course prior to the completion of the merger; however, the agreement restricts the Company from taking specified actions without A. Schulman, Inc.’s approval.
F-27
NOTES TO CONSOLIDATED FINANCIAL STATEMENTS
If the merger agreement is terminated before we complete the merger, under certain circumstances, we may be required to pay either a termination fee to A. Schulman in the amount of $6.8 million or up to $1.0 million in expense reimbursement instead of the termination fee.
Note 18 - Supplemental Cash Flow Information
During fiscal years 2009, 2008 and 2007, the Company issued to employees $0.5 million, $0.5 million and $0.5 million worth of Common Stock, respectively, in connection with the Company’s domestic 401(k) defined contribution plan. At September 30, 2009, 2008 and 2007, the Company had accrued $0.4 million, $0.5 million and
$0.5 million, respectively, in connection with the Company’s domestic 401(k) defined contribution plan. See Note 14 – “Employee Benefit Plans.”
Note 19 - Operations Information
The following table provides revenue by point of origin and long-lived assets by location as of and for years ended September 30:
|
2009 |
2008 |
2007 |
||||||||||
|
(Dollars in Thousands) |
||||||||||||
|
Revenues: |
||||||||||||
|
Australia |
$ | 31,472 | $ | 48,334 | $ | 59,030 | ||||||
|
France |
35,878 | 45,900 | 33,418 | |||||||||
|
Holland |
44,252 | 72,429 | 56,329 | |||||||||
|
Italy |
26,497 | 48,568 | 44,012 | |||||||||
|
United Kingdom |
31,031 | 45,914 | 37,859 | |||||||||
|
Other Foreign |
33,367 | 49,731 | 37,532 | |||||||||
|
Total Foreign |
202,497 | 310,876 | 268,180 | |||||||||
|
United States |
97,468 | 135,825 | 149,737 | |||||||||
| $ | 299,965 | $ | 446,701 | $ | 417,917 | |||||||
| 2009 | 2008 | 2007 | ||||||||||
|
(Dollars in Thousands) |
||||||||||||
|
Long-Lived Assets |
||||||||||||
|
Holland |
$ | 6,705 | $ | 6,822 | $ | 7,515 | ||||||
|
Other Foreign |
20,756 | 23,053 | 24,059 | |||||||||
|
Total Foreign |
27,461 | 29,875 | 31,574 | |||||||||
|
United States |
31,490 | 32,455 | 26,827 | |||||||||
| $ | 58,951 | $ | 62,330 | $ | 58,401 | |||||||
Foreign revenue is based on the country in which the legal subsidiary is domiciled. Long-lived assets include net property, plant and equipment, and other long-term assets (excluding long-term deferred tax assets and goodwill).
F-28
NOTES TO CONSOLIDATED FINANCIAL STATEMENTS
Note 20 – Segment Information
The Company's management structure is organized into five reportable business segments defined as ICO Polymers North America, ICO Brazil, Bayshore Industrial, ICO Europe and ICO Asia Pacific. This organization is consistent with the way information is reviewed and decisions are made by executive management.
ICO Polymers North America, ICO Brazil, ICO Europe and ICO Asia Pacific primarily produce competitively priced engineered polymer powders for the rotational molding industry as well as other specialty markets for powdered polymers, including masterbatch and concentrate producers, users of polymer-based metal coatings, and non-woven textile
markets.
Additionally, these segments provide specialty size reduction services on a tolling basis (“tolling” refers to processing customer-owned material for a service fee). The Bayshore Industrial segment designs and produces proprietary concentrates, masterbatches and specialty compounds, primarily for the plastic film
industry, in North America and in selected export markets.
The Company’s European segment includes operations in France, Holland, Italy, and the UK. The Company’s Asia Pacific segment includes operations in Australia, Malaysia and New Zealand. The accounting policies of each business segment are consistent with those described in Note 1 – “Summary
of Significant Policies.”
|
Fiscal year Ended
September 30, 2009 |
Revenue
From
External
Customers |
Inter-
Segment
Revenues |
Operating
Income
(Loss) |
Depreciation
and
Amortization |
Impairment,
Restructuring
and Other
Costs
(Income)(a) |
Expenditures
for Additions
to Long-Lived
Assets |
||||||||||||||||||
|
(Dollars in Thousands) |
||||||||||||||||||||||||
|
ICO Europe |
$ | 135,006 | $ | 258 | $ | 5,728 | $ | 1,876 | $ | - | $ | 608 | ||||||||||||
|
Bayshore Industrial |
65,221 | 169 | 6,157 | 1,646 | (382 | ) | 489 | |||||||||||||||||
|
ICO Asia Pacific |
54,397 | - | (6,125 | ) | 1,422 | 3,983 | 603 | |||||||||||||||||
|
ICO Polymers North America |
32,248 | 2,240 | 2,025 | 1,977 | (396 | ) | 2,065 | |||||||||||||||||
|
ICO Brazil |
13,093 | - | 178 | 233 | - | 113 | ||||||||||||||||||
|
Total from Reportable Segments |
299,965 | 2,667 | 7,963 | 7,154 | 3,205 | 3,878 | ||||||||||||||||||
|
Unallocated General Corporate |
- | - | (5,896 | ) | 207 | 70 | 31 | |||||||||||||||||
|
Expense | ||||||||||||||||||||||||
|
Total |
$ | 299,965 | $ | 2,667 | $ | 2,067 | $ | 7,361 | $ | 3,275 | $ | 3,909 | ||||||||||||
|
Fiscal year Ended
September 30, 2008 |
Revenue
From
External
Customers |
Inter-
Segment
Revenues |
Operating
Income
(Loss) |
Depreciation
and
Amortization |
Impairment,
Restructuring
and Other
Costs
(Income)(a) |
Expenditures
for Additions
to Long-Lived
Assets |
||||||||||||||||||
|
(Dollars in Thousands) |
||||||||||||||||||||||||
|
ICO Europe |
$ | 207,209 | $ | 244 | $ | 13,201 | $ | 2,365 | $ | 60 | $ | 1,197 | ||||||||||||
|
Bayshore Industrial |
90,736 | 1,016 | 10,241 | 1,598 | - | 1,204 | ||||||||||||||||||
|
ICO Asia Pacific |
82,390 | 346 | 1,822 | 1,526 | 476 | 2,705 | ||||||||||||||||||
|
ICO Polymers North America |
45,090 | 4,131 | 5,618 | 1,623 | (1,884 | ) | 7,920 | |||||||||||||||||
|
ICO Brazil |
21,276 | - | 982 | 263 | - | 460 | ||||||||||||||||||
|
Total from Reportable Segments |
446,701 | 5,737 | 31,864 | 7,375 | (1,348 | ) | 13,486 | |||||||||||||||||
|
Unallocated General Corporate |
- | - | (6,157 | ) | 156 | - | 79 | |||||||||||||||||
|
Expense | ||||||||||||||||||||||||
|
Total |
$ | 446,701 | $ | 5,737 | $ | 25,707 | $ | 7,531 | $ | (1,348 | ) | $ | 13,565 | |||||||||||
F-29
NOTES TO CONSOLIDATED FINANCIAL STATEMENTS
|
Fiscal year Ended
September 30, 2007 |
Revenue
From
External
Customers |
Inter-
Segment
Revenues |
Operating
Income
(Loss) |
Depreciation
and
Amortization |
Impairment,
Restructuring
and Other
Costs
(Income)(a) |
Expenditures
for Additions
to Long-Lived
Assets |
||||||||||||||||||
|
(Dollars in Thousands) |
||||||||||||||||||||||||
|
ICO Europe |
$ | 170,135 | $ | 466 | $ | 9,008 | $ | 2,674 | $ | (566 | ) | $ | 927 | |||||||||||
|
Bayshore Industrial |
108,360 | 151 | 15,358 | 1,497 | - | 1,791 | ||||||||||||||||||
|
ICO Asia Pacific |
84,790 | 16 | 5,914 | 1,099 | 412 | 6,310 | ||||||||||||||||||
|
ICO Polymers North America |
41,377 | 4,035 | 6,022 | 1,535 | (843 | ) | 2,346 | |||||||||||||||||
|
ICO Brazil |
13,255 | - | 301 | 254 | - | 145 | ||||||||||||||||||
|
Total from Reportable Segments |
417,917 | 4,668 | 36,603 | 7,059 | (997 | ) | 11,519 | |||||||||||||||||
|
Unallocated General Corporate |
- | - | (6,787 | ) | 192 | - | 115 | |||||||||||||||||
|
Expense | ||||||||||||||||||||||||
|
Total |
$ | 417,917 | $ | 4,668 | $ | 29,816 | $ | 7,251 | $ | (997 | ) | $ | 11,634 | |||||||||||
|
Total Assets |
As of |
As of | ||
|
September 30, |
September 30, | |||
|
2009 (c) |
2008 (c) | |||
|
(Dollars in Thousands) | ||||
|
ICO Europe |
$76,578 |
$89,910 | ||
|
Bayshore Industrial |
29,725 |
33,840 | ||
|
ICO Asia Pacific |
42,570 |
55,593 | ||
|
ICO Polymers North America |
27,509 |
30,050 | ||
|
ICO Brazil |
7,593 |
8,624 | ||
|
Total from Reportable Segments |
183,975 |
218,017 | ||
|
Other (b) |
8,298 |
3,079 | ||
|
Total |
$192,273 |
$221,096 | ||
(a) Impairment, restructuring and other costs (income) are included in operating income (loss).
(b) Consists of unallocated Corporate assets.
(c) Includes goodwill of $0 and $4.2 million for ICO Asia Pacific as of September 30, 2009 and 2008, respectively, and $4.5 million for Bayshore Industrial at both September 30, 2009 and 2008.
A reconciliation of total reportable segment operating income to income from continuing operations before income taxes is as follows:
|
Fiscal Year Ended |
||||||||||||
|
September 30, |
||||||||||||
|
2009 |
2008 |
2007 |
||||||||||
|
(Dollars in Thousands) |
||||||||||||
|
Reportable segments operating income |
$ | 7,963 | $ | 31,864 | $ | 36,603 | ||||||
|
Unallocated general corporate expense |
(5,896 | ) | (6,157 | ) | (6,787 | ) | ||||||
|
Consolidated operating income (loss) |
2,067 | 25,707 | 29,816 | |||||||||
|
Other income (expense): |
||||||||||||
|
Interest expense, net |
(2,230 | ) | (4,062 | ) | (3,227 | ) | ||||||
|
Other |
(582 | ) | (431 | ) | (115 | ) | ||||||
|
Income (loss) from continuing operations before income taxes |
$ | (745 | ) | $ | 21,214 | $ | 26,474 | |||||
Note 21 – Selected Quarterly Financial Information (Unaudited)
The following table presents selected financial information for each quarter in the fiscal years ended September 30, 2009 and September 30, 2008, respectively.
F-30
NOTES TO CONSOLIDATED FINANCIAL STATEMENTS
|
Three Months Ended |
||||||||||||||||
|
December 31, |
March 31, |
June 30, |
September 30, |
|||||||||||||
|
2008 |
2009 |
2009 |
2009 |
|||||||||||||
|
(Dollars in Thousands, except share and per share data) |
||||||||||||||||
|
Revenues |
$ | 79,358 | $ | 70,130 | $ | 69,997 | $ | 80,480 | ||||||||
|
Gross profit |
10,110 | 11,883 | 12,614 | 14,775 | ||||||||||||
|
Goodwill impairment |
- | 3,450 | - | - | ||||||||||||
|
Long-lived asset impairment, restructuring and other costs (income) |
(293 | ) | 20 | (87 | ) | 185 | ||||||||||
|
Operating income (loss) |
(448 | ) | (2,316 | ) | 2,189 | 2,642 | ||||||||||
|
Income (loss) from continuing operations |
(1,076 | ) | (3,018 | ) | 1,259 | 1,596 | ||||||||||
|
Net income (loss) |
$ | (1,076 | ) | $ | (3,018 | ) | $ | 1,259 | $ | 1,596 | ||||||
|
Basic income per share |
||||||||||||||||
|
Basic net income (loss) per common share |
$ | (0.04 | ) | $ | (0.11 | ) | $ | 0.05 | $ | 0.06 | ||||||
|
Basic net income (loss) per common share |
$ | (0.04 | ) | $ | (0.11 | ) | $ | 0.05 | $ | 0.06 | ||||||
|
Diluted income per share |
||||||||||||||||
|
Diluted net income (loss) per common share |
$ | (0.04 | ) | $ | (0.11 | ) | $ | 0.05 | $ | 0.06 | ||||||
|
Diluted net income (loss) per common share |
$ | (0.04 | ) | $ | (0.11 | ) | $ | 0.05 | $ | 0.06 | ||||||
|
Basic weighted average shares outstanding |
27,099,000 | 27,072,000 | 27,077,000 | 27,077,000 | ||||||||||||
|
Diluted weighted average shares outstanding |
27,099,000 | 27,072,000 | 27,221,000 | 27,593,000 | ||||||||||||
|
Three Months Ended |
||||||||||||||||
|
December 31, |
March 31, |
June 30, |
September 30, |
|||||||||||||
|
2007 |
2008 |
2008 |
2008 |
|||||||||||||
|
(Dollars in Thousands, except share and per share data) |
||||||||||||||||
|
Revenues |
$ | 110,865 | $ | 112,126 | $ | 115,718 | $ | 107,992 | ||||||||
|
Gross profit |
19,092 | 19,288 | 18,484 | 16,280 | ||||||||||||
|
Impairment, restructuring and other costs (income) |
198 | (1,598 | ) | (356 | ) | 408 | ||||||||||
|
Operating income |
6,496 | 8,646 | 6,467 | 4,098 | ||||||||||||
|
Income from continuing operations |
3,526 | 4,993 | 4,633 | 2,230 | ||||||||||||
|
Loss from discontinued operations |
(16 | ) | - | - | (52 | ) | ||||||||||
|
Net income |
$ | 3,510 | $ | 4,993 | $ | 4,633 | $ | 2,178 | ||||||||
|
Basic income per share |
||||||||||||||||
|
Income from continuing operations |
$ | 0.13 | $ | 0.18 | $ | 0.17 | $ | 0.08 | ||||||||
|
Loss from discontinued operations |
- | - | - | - | ||||||||||||
|
Basic net income per common share |
$ | 0.13 | $ | 0.18 | $ | 0.17 | $ | 0.08 | ||||||||
|
Diluted income per share |
||||||||||||||||
|
Income from continuing operations |
$ | 0.13 | $ | 0.18 | $ | 0.17 | $ | 0.08 | ||||||||
|
Loss from discontinued operations |
- | - | - | - | ||||||||||||
|
Diluted net income per common share |
$ | 0.13 | $ | 0.18 | $ | 0.17 | $ | 0.08 | ||||||||
|
Basic weighted average shares outstanding |
26,914,000 | 27,263,000 | 27,433,000 | 27,474,000 | ||||||||||||
|
Diluted weighted average shares outstanding |
27,873,000 | 27,949,000 | 27,975,000 | 27,864,000 | ||||||||||||
The sum of the quarterly earnings per share may not equal the annual earnings per share because each quarter’s earnings per share is individually calculated using a different number of weighted average shares outstanding.
F-31
SCHEDULE I—CONDENSED FINANCIAL INFORMATION
ICO, Inc. (Parent Company Only)
Condensed Balance Sheets
|
September 30, |
||||||||
|
2009 |
2008 |
|||||||
|
ASSETS |
(Dollars in Thousands) |
|||||||
|
Cash and cash equivalents |
$ | 5,695 | $ | 609 | ||||
|
Current deferred tax asset |
882 | 1,135 | ||||||
|
Other current assets |
274 | 1,699 | ||||||
|
Total current assets |
6,851 | 3,443 | ||||||
|
Other assets |
227 | 214 | ||||||
|
Investment in subsidiaries |
110,751 | 121,465 | ||||||
|
Total assets |
$ | 117,829 | $ | 125,122 | ||||
|
LIABILITIES AND STOCKHOLDERS’ EQUITY |
||||||||
|
Current portion of long-term debt |
$ | 4,463 | $ | 4,450 | ||||
|
Income taxes payable |
(125 | ) | - | |||||
|
Total current liabilities |
4,338 | 4,450 | ||||||
|
Long-term debt, net of current portion |
5,555 | 9,999 | ||||||
|
Deferred income taxes |
2,781 | 2,838 | ||||||
|
Total liabilities |
12,674 | 17,287 | ||||||
|
Stockholders’ equity: |
||||||||
|
Preferred Stock |
- | - | ||||||
|
Common Stock |
55,248 | 54,756 | ||||||
|
Additional paid-in capital |
73,081 | 72,241 | ||||||
|
Accumulated other comprehensive income |
2,723 | 3,022 | ||||||
|
Accumulated deficit |
(22,880 | ) | (21,641 | ) | ||||
|
Treasury Stock |
(3,017 | ) | (543 | ) | ||||
|
Total stockholders’ equity |
105,155 | 107,835 | ||||||
|
Total liabilities and stockholders’ equity |
$ | 117,829 | $ | 125,122 | ||||
See accompanying note to condensed financial statements.
F-32
ICO, Inc. (Parent Company Only)
Condensed Statement of Operations
|
Years Ended September 30, |
||||||||||||
|
2009 |
2008 |
2007 |
||||||||||
|
(Dollars in Thousands) |
||||||||||||
|
Revenues |
$ | - | $ | - | $ | - | ||||||
|
Cost of revenues |
- | - | - | |||||||||
|
Selling, general and administrative |
661 | 1,103 | 853 | |||||||||
|
Operating loss |
(661 | ) | (1,103 | ) | (853 | ) | ||||||
|
Equity in subsidiary earnings |
(1,449 | ) | 19,713 | 28,010 | ||||||||
|
Interest expense |
(664 | ) | (855 | ) | (700 | ) | ||||||
|
Income (loss) before income taxes |
(2,774 | ) | 17,755 | 26,457 | ||||||||
|
Provision (benefit) for income taxes |
(1,535 | ) | 2,441 | 5,339 | ||||||||
|
Net income (loss) |
$ | (1,239 | ) | $ | 15,314 | $ | 21,118 | |||||
See accompanying note to condensed financial statements.
F-33
ICO, Inc. (Parent Company Only)
Condensed Statement of Cash Flows
|
Years Ended September 30, |
||||||||||||
|
2009 |
2008 |
2007 |
||||||||||
|
Cash flows provided by (used for) operating activities: |
(Dollars in Thousands) |
|||||||||||
|
Net income (loss) |
$ | (1,239 | ) | $ | 15,314 | $ | 21,118 | |||||
|
Stock-based compensation expense |
817 | 938 | 670 | |||||||||
|
Equity in subsidiary earnings |
1,449 | (19,713 | ) | (28,010 | ) | |||||||
|
Changes in assets and liabilities providing (requiring) cash: |
||||||||||||
|
Income taxes receivable (payable) |
587 | (2,140 | ) | (2,809 | ) | |||||||
|
Deferred taxes |
202 | 126 | 1,264 | |||||||||
|
Other |
680 | (2,022 | ) | (208 | ) | |||||||
|
Net cash provided by (used for) operating activities |
2,496 | (7,497 | ) | (7,975 | ) | |||||||
|
Cash flows provided by investing activities: |
||||||||||||
|
Investment in subsidiary, net of dividends received |
8,967 | 2,090 | 26,470 | |||||||||
|
Net cash provided by investing activities |
8,967 | 2,090 | 26,470 | |||||||||
|
Cash flows provided by (used for) financing activities: |
||||||||||||
|
Common Stock transactions |
(1,945 | ) | 2,173 | 1,599 | ||||||||
|
Preferred Stock transactions |
- | (1,512 | ) | (28,777 | ) | |||||||
|
Net debt borrowings (repayments) |
(4,432 | ) | 1,077 | 12,955 | ||||||||
|
Net cash (used for) financing activities |
(6,377 | ) | 1,738 | (14,223 | ) | |||||||
|
Net increase (decrease) in cash and equivalents |
5,086 | (3,669 | ) | 4,272 | ||||||||
|
Cash and cash equivalents at beginning of period |
609 | 4,278 | 6 | |||||||||
|
Cash and cash equivalents at end of period |
$ | 5,695 | $ | 609 | $ | 4,278 | ||||||
See accompanying note to condensed financial statements.
F-34
ICO, Inc. (Parent Company Only)
Note to Condensed Financial Statements
|
|
(1) Basis of Presentation |
ICO, Inc. (the “Company”) is a holding company that conducts substantially all of its business operations through its subsidiaries. Under the terms of agreements governing indebtedness of certain subsidiaries of the Company, such subsidiaries are restricted from making dividend payments, loans or advances to the
Company. These restrictions resulted in restricted net assets (as defined in Rule 4-08(e)(3) of Regulation S-X) of the Company’s subsidiaries exceeding 25% of the consolidated net assets of the Company and its subsidiaries. Accordingly, these condensed financial statements have been presented on a “parent company only” basis. Under a parent company only presentation, the Company’s investment in its consolidated subsidiaries are presented under the equity method of
accounting.
The financial statements of ICO, Inc. (Parent Company Only) summarize the results of operations for the years ended September 30, 2009, 2008 and 2007. The ICO, Inc. (Parent Company Only) financial statements should be read in conjunction with the ICO, Inc. consolidated financial statements.
F-35
ICO, Inc.
Schedule II – Valuation and Qualifying Accounts
(in Thousands)
|
Balance at Beginning |
Charged (credited) to |
Additions/ |
Balance at | |||||||
|
Classifications |
of Year |
Expenses |
(Deductions) |
End of Year | ||||||
|
Year ended September 30, 2009: |
||||||||||
|
Allowance for doubtful accounts - |
$2,973 |
$1,274 |
$(501) |
$3,746 | ||||||
| trade receivables |
|
|||||||||
|
Year ended September 30, 2008: |
||||||||||
|
Allowance for doubtful accounts - |
$2,714 |
$594 |
$(335) |
$2,973 | ||||||
|
trade receivables |
||||||||||
|
Deferred tax valuation allowance |
699 |
(699) |
- |
- | ||||||
|
Year ended September 30, 2007: |
||||||||||
|
Allowance for doubtful accounts - |
$2,509 |
$184 |
$21 |
$2,714 | ||||||
|
trade receivables |
||||||||||
|
Deferred tax valuation allowance |
2,273 |
(1,574) |
– |
699 | ||||||
|
|
||||||||||
F-36