Attached files
Table of Contents
UNITED STATES
SECURITIES AND EXCHANGE COMMISSION
WASHINGTON, D.C. 20549
FORM 10-K
| x | ANNUAL REPORT PURSUANT TO SECTION 13 OR 15(d) OF THE SECURITIES EXCHANGE ACT OF 1934 |
For the Fiscal Year Ended September 30, 2009
or
| ¨ | TRANSITION REPORT PURSUANT TO SECTION 13 OR 15(d) OF THE SECURITIES EXCHANGE ACT OF 1934 |
For the Transition Period From to
Commission File Number 000-49872
HENNESSY ADVISORS, INC.
(Exact name of registrant as specified in its charter)
| California | 68-0176227 | |
| (State or other jurisdiction of incorporation or organization) |
(IRS Employer Identification No.) |
| 7250 Redwood Blvd., Suite 200 Novato, California |
94945 | |
| (Address of principal executive office) | (Zip Code) |
(415) 899-1555
(Issuer’s telephone number)
Securities registered pursuant to Section 12(b) of the Act:
None.
Securities registered pursuant to Section 12(g) of the Act:
Common Stock, no par value
(Title of class)
Indicate by check mark if the registrant is a well-known seasoned issuer, as defined in Rule 405 of the Securities Act. Yes ¨ No x
Indicate by check mark if the registrant is not required to file reports pursuant to Section 13 or Section 15(d) of the Act. Yes ¨ No x
Indicate by check mark whether the registrant (1) has filed all reports required to be filed by Section 13 or 15(d) of the Securities Exchange Act of 1934 during the preceding 12 months (or for such shorter period that the registrant was required to file such reports), and (2) has been subject to such filing requirements for the past 90 days. Yes x No ¨
Indicate by check mark whether the registrant has submitted electronically and posted on its corporate Web site, if any, every Interactive Data File required to be submitted and posted pursuant to Rule 405 of Regulation S-T during the preceding 12 months (or for such shorter period that the registrant was required to submit and post such files). Yes ¨ No ¨
Indicate by check mark if disclosure of delinquent filers pursuant to Item 405 of Regulation S-K is not contained herein, and will not be contained, to the best of registrant’s knowledge, in definitive proxy or information statements incorporated by reference in Part III of this Form 10-K or any amendment to this Form 10-K. x
Indicate by check mark whether the registrant is a large accelerated filer, an accelerated filer, a non-accelerated filer, or a smaller reporting company. See definition of “large accelerated filer,” “accelerated filer” and “smaller reporting company” in Rule 12b-2 of the Exchange Act:
| Large accelerated filer | ¨ | Accelerated filer | ¨ | |||
| Non-accelerated filer | ¨ | Smaller reporting company | x | |||
Indicate by check mark whether the registrant is a shell company (as defined in Rule 12b-2 of the Exchange Act). Yes ¨ No x
The aggregate market value of Common Stock held by non-affiliates (as affiliates are defined in Rule 12b-2 of the Exchange Act) of the Registrant, based on the closing price of $2.50 on March 31, 2009, was $7,283,720.
APPLICABLE ONLY TO CORPORATE REGISTRANTS
Indicate the number of shares outstanding of each of the registrant’s classes of common stock, as of the latest practicable date:
As of October 31, 2009 there were 5,754,844 shares of Common Stock (no par value) issued and outstanding.
DOCUMENTS INCORPORATED BY REFERENCE:
Portions of the registrant’s definitive proxy statement for its 2010 annual meeting of stockholders are incorporated by reference in Parts II and III.
Table of Contents
FORM 10-K
For the Fiscal Year Ended September 30, 2009
Table of Contents:
PART I
2
Table of Contents
PART I
| ITEM 1. | DESCRIPTION OF BUSINESS |
Overview
We are a publicly traded investment management firm. Our principal business activity is managing, servicing and marketing our ten open-end mutual funds. All of our mutual funds are no-load, meaning investors do not pay any upfront or deferred sales charges. We have a “Cornerstone Series” of mutual funds: the Hennessy Cornerstone Growth Fund, the Hennessy Cornerstone Growth Fund, Series II, the Hennessy Focus 30 Fund, the Hennessy Cornerstone Large Growth Fund, the Hennessy Cornerstone Value Fund, the Hennessy Total Return Fund and the Hennessy Balanced Fund (the “Cornerstone Funds”). The Cornerstone Funds use quantitative stock selection strategies to manage their portfolios. We also have a “Select Series” of mutual funds: the Hennessy Select Large Value Fund, the Hennessy Select SPARX Japan Fund and the Hennessy Select SPARX Japan Smaller Companies Fund (the “Select Funds”). The Select Funds are actively managed and each employs a seasoned sub-advisor. In total, the net assets of the mutual funds we manage have increased by 376% from $194 million on September 30, 2001 to $923 million as of September 30, 2009. Collectively, we refer to the Cornerstone Funds and the Select Funds as the “Hennessy Funds.”
Each of the Hennessy Funds pays fees to us for our management services. Management services include investment research, supervision of investments, conducting investment programs (including evaluation, sale and reinvestment of assets), the placement of orders for purchase and sale of securities, solicitation of brokers to execute transactions, sub-advisor oversight and the preparation and distribution of reports and statistical information. The original class shares of eight of our mutual funds also pay fees to us for shareholder services. Shareholder services consist primarily of providing a call center to respond to shareholder inquiries, including inquiries regarding specific mutual fund account and investment information. The fees that we receive for management and shareholder services are based on a percentage of the average daily net asset values of our mutual funds.
Company History
We were founded in 1989 as a California corporation under the name Edward J. Hennessy Incorporated. We initially registered with the appropriate federal, state and self-regulatory organizations as a broker-dealer with a retail business. In addition, we were a member of the National Association of Securities Dealers, serving mainly individual investors, but we terminated this registration in July 2000 and are no longer engaged in the broker-dealer business. In 1990, we registered as an investment advisor. From 1990 to 1996, we provided management services to private clients and limited partnerships utilizing strategies similar to those we use in advising our mutual funds today. In 1996, we launched our first mutual fund, the Hennessy Balanced Fund. We initially managed the Hennessy Balanced Fund through The Hennessy Management Co., L.P., a California limited partnership for which we served as the general partner. As general partner, we performed all of the management functions on behalf of The Hennessy Management Co., L.P. for the Hennessy Balanced Fund.
In 1998, we launched our second mutual fund, the Hennessy Total Return Fund. We initially managed the Hennessy Total Return Fund through The Hennessy Management Co. 2, L.P., another California limited partnership for which we served as the general partner and as such, performed all of the management functions on behalf of The Hennessy Management Co. 2, L.P. for the Hennessy Total Return Fund.
In 2000, we began acquiring the rights to manage the assets of additional mutual funds by entering into agreements with the funds’ investment advisors to acquire management contracts related to such funds. When we acquire the rights to manage the assets of a mutual fund, we generally either enter into a management agreement covering the mutual fund or reorganize the assets of the mutual fund into one of our existing mutual funds.
3
Table of Contents
In June 2000, we completed our first acquisition by entering into a management agreement covering the O’Shaughnessy Cornerstone Growth Fund and the O’Shaughnessy Cornerstone Value Fund and changed the names of these funds to the Hennessy Cornerstone Growth Fund and the Hennessy Cornerstone Value Fund. In connection with this acquisition, we obtained an exclusive, perpetual license to use the names and investment strategies of the Cornerstone Growth Fund and the Cornerstone Value Fund from Netfolio, Inc. These two mutual funds had approximately $197 million in combined net assets at the time we began managing them.
In May 2002, we completed our initial public offering, raising $5.7 million in a non-underwritten offering at a split-adjusted price of $2.97 and became a public reporting company as a small-business issuer. At the time of our initial public offering, assets under management were approximately $348 million. In connection with our initial public offering, the limited partners of The Hennessy Management Co., L.P. and The Hennessy Management Co. 2, L.P. agreed to merge their partnerships into our new public company, thereby allowing the consolidation of all our management activities directly into Hennessy Advisors, Inc.
In September 2003, we acquired the management agreement for the SYM Select Growth Fund. In connection with that acquisition, we launched our fifth mutual fund, the Hennessy Focus 30 Fund, into which we reorganized the assets of the SYM Select Growth Fund. At the time of this acquisition, the SYM Fund had approximately $35 million in net assets.
In March 2004, we acquired the management agreements for five funds managed by Lindner Asset Management, Inc., which we refer to as the Lindner Funds. In connection with this acquisition, the assets of the Lindner Funds were reorganized into four of our existing mutual funds. At the time of this acquisition, the Lindner Funds had approximately $301 million in combined net assets.
In July 2005, we acquired the management agreement for The Henlopen Fund and changed the name to the Hennessy Cornerstone Growth Fund, Series II. At the time of this acquisition, The Henlopen Fund had approximately $299 million in net assets.
In November 2007, we opened the Hennessy Micro Cap Growth Fund, LLC, a non-registered private pooled investment fund. Hennessy Advisors, Inc. is the managing member and invested approximately $0.5 million in the Micro Cap Growth Fund at inception.
In March 2008, we established an institutional share class for four of our mutual funds: the Hennessy Cornerstone Growth Fund, the Hennessy Cornerstone Growth Fund, Series II, the Hennessy Focus 30 Fund and the Hennessy Cornerstone Value Fund. The institutional shares require a minimum investment of $0.25 million per fund, and net expenses do not exceed 0.98% of the average daily net assets of the Funds.
In March 2009, we acquired the management agreements for two funds managed by Royal Bank of Canada’s Voyageur Asset Management Inc.: the Tamarack Large Cap Growth Fund and the Tamarack Value Fund (which we refer to as the Tamarack Funds). In connection with this acquisition, shares of the Tamarack Large Cap Growth Fund were exchanged for shares of the Hennessy Cornerstone Large Growth Fund (original class shares), and shares of the Tamarack Value Fund were exchanged for shares of the Hennessy Select Large Value Fund (original class shares). Both funds also offer institutional class shares. Additionally, we retained Voyageur Asset Management as sub-advisor to manage the portfolio of the Hennessy Select Large Value Fund. This Fund was the first of the new Select Funds launched for the purpose of employing seasoned, yet undiscovered asset managers.
In September 2009, we acquired the management agreements for two funds managed by SPARX Investment & Research, USA, Inc., and sub-advised by SPARX Asset Management Co., Ltd.: the SPARX Japan Fund and the SPARX Japan Smaller Companies Fund (which we refer to as the “SPARX Funds”). Once the acquisition was approved, we changed the names to the Hennessy Select SPARX Japan Fund and the Hennessy Select SPARX Japan Smaller Companies Fund, respectively. However, we retained SPARX Asset Management Co., Ltd. as sub-advisor to continue to handle the day to day portfolio management of the SPARX Funds and the investment objectives and strategies remain the same. The SPARX Funds are additions to our Select Funds.
4
Table of Contents
BUSINESS OPERATIONS, PRODUCTS and STRATEGIES
Management Agreements and Fees
We have entered into management agreements covering all of our mutual funds with the registered investment companies or trusts under which our mutual funds are organized. Our registered investment companies or trusts are currently Hennessy Funds, Inc., Hennessy Mutual Funds, Inc., Hennessy Funds Trust, and Hennessy SPARX Funds Trust. Our management agreement: with Hennessy Funds, Inc. covers the Hennessy Total Return Fund and the Hennessy Balanced Fund; with Hennessy Mutual Funds, Inc. covers the Hennessy Cornerstone Growth Fund, the Hennessy Cornerstone Value Fund and the Hennessy Focus 30 Fund; with Hennessy Funds Trust covers the Hennessy Cornerstone Growth Fund, Series II, the Hennessy Cornerstone Large Growth Fund and the Hennessy Select Large Value Fund; and with Hennessy SPARX Funds Trust covers the Hennessy Select SPARX Japan Fund and the Hennessy Select SPARX Japan Smaller Companies Fund. Under these agreements, we are responsible for overall investment and management services, subject to the oversight of the applicable board of directors or trustees and according to each mutual fund’s particular fundamental investment objectives and policies. The boards of each of Hennessy Funds, Inc., Hennessy Mutual Funds, Inc., Hennessy Funds Trust, and Hennessy SPARX Funds Trust consist of four individuals, including our chairman of the board and chief executive officer, Neil J. Hennessy, and three disinterested directors or trustees. Under the Investment Company Act of 1940, a majority of the disinterested directors or trustees must approve the entry into and continuation of our management agreements. The disinterested directors also have sole responsibility for selecting and nominating other disinterested directors or trustees.
We also provide any ordinary clerical and bookkeeping services needed by our mutual funds that are not provided by the funds’ custodian, administrator or transfer agent. We fulfill requests for information about our mutual funds or pay the fulfillment expenses that our mutual funds would otherwise incur.
In exchange for all of these services, we receive a management fee from each of our mutual funds, which is based on the amount of each fund’s average daily net assets. The annual management fees payable to us by our mutual funds are as follows:
| Fund |
Management Fee (as a percentage of fund assets) |
||
| Hennessy Cornerstone Growth Fund (all classes) |
0.74 | % | |
| Hennessy Cornerstone Growth Fund, Series II (all classes) |
0.74 | % | |
| Hennessy Focus 30 Fund (all classes) |
0.74 | % | |
| Hennessy Cornerstone Value Fund (all classes) |
0.74 | % | |
| Hennessy Cornerstone Large Growth Fund (all classes) |
0.74 | % | |
| Hennessy Total Return Fund |
0.60 | % | |
| Hennessy Balanced Fund |
0.60 | % | |
| Hennessy Select Large Value Fund (all classes) |
0.85 | % | |
| Hennessy Select SPARX Japan Fund (all classes) |
1.00 | % | |
| Hennessy Select SPARX Japan Smaller Companies Fund |
1.20 | % | |
5
Table of Contents
For the institutional share classes of the funds, we have a contractual obligation to waive the advisory fee or reimburse fund expenses to the extent necessary to ensure that net expenses do not exceed 0.98% of the average daily net assets of the funds, except for the institutional share class of the Hennessy Select SPARX Japan Fund, which has an expense ratio capped at 1.25%.
After an initial two year term, our management agreements must be renewed annually by (1) the board of directors or trustees of the applicable investment company or by the vote of a majority of the outstanding shares of the applicable fund and (2) by the vote of a majority of the directors or trustees of the applicable investment company who are not parties to the management agreement and are disinterested directors or trustees. Two other circumstances might lead to termination of the management agreements: the assignment of a management agreement to another advisor automatically terminates the agreement (assignment includes “indirect assignment,” which is the transfer of our common stock in sufficient quantities deemed to constitute a controlling block), and the termination of the agreement, via written notice, by our firm or by one of the funds’ investment companies which causes termination after 60 days of the notice. The current management agreements were renewed by the Board of Directors of the Hennessy Funds, Inc. and Hennessy Mutual Funds, Inc. and by the trustees of the Hennessy Funds Trust on March 3, 2009 for a period of one year.
The management agreements for the Hennessy Cornerstone Large Growth Fund and the Hennessy Select Large Value Fund were approved by the Board of Trustees of Hennessy Funds Trust on March 3, 2009 for an initial period of two years, to be renewed annually thereafter; and the management agreements for the Hennessy Select SPARX Japan Fund and the Hennessy Select SPARX Japan Smaller Companies Fund were approved by the Board of Trustees of Hennessy SPARX Funds Trust on July 13, 2009 and by the shareholders of the SPARX Funds on September 17, 2009 for an initial period of two years, to be renewed annually thereafter.
As of October 1, 2007, Hennessy Advisors, Inc. was also appointed the Managing Member of the Hennessy Micro Cap Growth Fund, LLC. Hennessy Advisors, Inc. will serve as the Managing Member until its resignation or removal. The Managing Member may voluntarily resign with 30 days’ prior written notice to the other members or 60 days’ prior written notice if there is not then a remaining Managing Member. At any time, the Managing Member may designate an additional Managing Member or designate a successor Managing Member with no further consent or approval required from the other members. The Managing Member may be removed at any time, with or without cause, by the vote of the other members owning a majority-in-interest of the capital accounts of the “Disinterested Members,” defined as members other than members who are the Managing Member or affiliates of the Managing Member.
In the Hennessy Micro Cap Growth Fund, LLC, the annual advisory fee is 2.0% of the aggregate capital accounts of the members, but no management fee is charged to the capital account of the Managing Member. Additionally, an “incentive allocation” can potentially be earned on any member’s balance, other than the Managing Member. The allocation is determined at the end of each calendar quarter as 20% of the amount by which net profits (defined as the amount by which the net asset value on the last day of a period exceeds the net asset value on the commencement of the same period), if any, exceed the positive balance, if any, of a member’s loss carryforward (defined as a memorandum account kept for each member having an initial balance of zero that is increased by the net loss, if any, allocated to each member for each calendar period).
Shareholder Services
In addition to our management agreements, we also have shareholder servicing agreements covering the original share classes of the Hennessy Cornerstone Growth Fund, the Hennessy Cornerstone Growth Fund, Series II, the Hennessy Focus 30 Fund, the
6
Table of Contents
Hennessy Cornerstone Value Fund, the Hennessy Cornerstone Large Growth Fund, the Hennessy Select Large Value Fund, the Hennessy Total Return Fund and the Hennessy Balanced Fund. We have provided shareholder services under a shareholder servicing agreement to the Hennessy Cornerstone Growth Fund and Hennessy Cornerstone Value Fund since October 2003, to the Hennessy Focus 30 Fund since June 30, 2005, to the Hennessy Cornerstone Growth Fund, Series II since July 1, 2005, to the Hennessy Total Return Fund and the Hennessy Balanced Fund since July 1, 2007, and to the Hennessy Cornerstone Large Growth Fund and the Hennessy Select Large Value Fund since March 23, 2009. Under these agreements, we provide administrative support services to these funds, including, among other things, the following:
| • | maintaining an “800” number that current fund shareholders may call to ask questions about the funds or their accounts with the funds; |
| • | assisting shareholders in processing exchange and redemption requests; |
| • | assisting shareholders in changing dividend options, account designations and addresses; |
| • | responding generally to shareholder questions; and |
| • | providing other similar services that the funds may request. |
In exchange for these services, we receive an annual shareholder servicing fee from each of the above-named funds of 0.10% of the fund’s average daily net assets.
Sub-Advisor Agreements and Fees
We have entered into sub-advisor agreements covering our Select Funds with the same asset management companies that previously managed the Funds. The management companies are currently Voyageur Asset Management Inc. and SPARX Asset Management Co., Ltd. Our sub-advisor agreement: with Voyageur Asset Management Inc. covers the Hennessy Select Large Value Fund and with SPARX Asset Management Co., Ltd. covers the Hennessy Select SPARX Japan Fund and the Hennessy Select SPARX Japan Smaller Companies Fund. Under these agreements, the sub-advisor is responsible for the investment and reinvestment of the assets of the fund, in accordance with the terms of the sub-advisory agreement, the fund’s Prospectus and the fund’s Statement of Additional Information and subject to the direction, supervision and control of Hennessy Advisors, the manager of the Select Funds, and the Trustees of the Hennessy Funds Trust and Hennessy SPARX Funds Trust.
In exchange for the sub-advisory services, we (not the funds) pay a sub-advisor fee to the sub-advisors, which is based on the amount of each fund’s average daily net assets. The annual sub-advisor fees payable by us to our sub-advisors are as follows:
| Fund |
Sub-Advisor Fee (as a percentage of fund assets) |
||
| Hennessy Select Large Value Fund (all classes) |
0.35 | % | |
| Hennessy Select SPARX Japan Fund (all classes) |
0.35 | % | |
| Hennessy Select SPARX Japan Smaller Companies Fund |
0.20 | % | |
The sub-advisor agreement for the Hennessy Select Large Value Fund was approved by the Board of Trustees of Hennessy Funds Trust on March 3, 2009 for an initial period of two years, to be renewed annually thereafter, and the sub-advisor agreement for the Hennessy Select SPARX Japan Fund and the Hennessy Select SPARX Japan Smaller Companies Fund were approved by the Board of Trustees of Hennessy SPARX Funds Trust on July 13, 2009 and by the shareholders of the SPARX Funds on September 17, 2009 for an initial period of two years, to be renewed annually thereafter. After the initial period of two years, the agreements may be renewed from year to year, as long as continuance is specifically approved at least annually in accordance with the requirements of
7
Table of Contents
the Investment Company Act of 1940. Each sub-advisor agreement will terminate in the event of its assignment, or it may be terminated by Hennessy Funds Trust or Hennessy SPARX Funds Trust (either by the Board of Trustees or by vote of a majority of the outstanding voting securities of a Fund), respectively, or by Hennessy Advisors, upon 60 days’ prior written notice.
Furthermore, we entered into an arrangement with each sub-advisor that relates to the sub-advisory relationship. This arrangement requires Hennessy Advisors to make payments to the applicable sub-advisor in certain instances in which the sub-advisor is terminated.
12b-1 Plan
The Hennessy Total Return Fund and the Hennessy Balanced Fund have each adopted a 12b-1 plan. Under Rule 12b-1 of the Investment Company Act of 1940, mutual funds can adopt a plan that allows them to make payments to third parties in connection with the distribution of their fund shares. Such distribution activities might include: advertising; compensation paid to financial institutions, broker-dealers, and others for sales and marketing; shareholder accounting services; the printing and mailing of prospectuses to possible new shareholders; and the printing and mailing of sales literature. Mutual funds can also employ a distributor to distribute and market mutual fund shares. 12b-1 fees can be used to pay the distributor for expenses incurred for telephone costs, overhead costs, costs of employees who engage in or support the distribution of the fund shares, the printing of prospectuses and other reports for possible new shareholders, advertising and the preparation and distribution of sales literature. The 12b-1 plan adopted by the Hennessy Total Return Fund and the Hennessy Balanced Fund authorizes each fund to make payments at an annual rate not to exceed 0.15% of each Fund’s average daily net assets. The Securities and Exchange Commission (“SEC”) has considered changes to Rule 12b-1 of the Investment Company Act of 1940 and although no specific proposals are currently pending, changes to Rule 12b-1 could restrict our current practices.
Custodial and Brokerage Arrangements
All shareholder funds are held by third party custodians. Independent brokerage firms execute all trades for our funds, at our direction.
Currently, we participate in four “soft dollar” arrangements. This means that we receive research reports and real-time electronic research to assist us in trading and managing our mutual funds. Under these soft dollar arrangements, we pay brokerage commissions for securities trades on behalf of a mutual fund that may be higher than the commissions that we would pay through a different brokerage firm, but in exchange we receive research or other services that benefit our mutual funds. Our soft dollar arrangements comply with SEC guidance regarding soft dollars.
License Agreement
Our ability to use the names and formulaic investment strategies of the funds now known as the Hennessy Cornerstone Growth Fund and the Hennessy Cornerstone Value Fund are governed by the terms and conditions of a license agreement, dated as of April 10, 2000, with Netfolio, Inc. Under the license agreement, Netfolio, Inc. granted us a perpetual, paid-up, royalty-free, exclusive license to use certain trademarks, such as “Strategy Indexing,” “Cornerstone Growth” and “Cornerstone Value,” as well as the formula investment strategies used by the Hennessy Cornerstone Growth Fund and the Hennessy Cornerstone Value Fund. All of our advertising, marketing, promotional and other materials incorporating or referring to the trademarks are subject to the prior written approval of Netfolio, Inc., except that we do not need Netfolio Inc.’s prior written approval to use the trademarks in a manner that is not substantially unchanged from any prior use by Netfolio, Inc. in its own business or from any prior use by us previously approved by Netfolio, Inc. We can assign the license to another person or entity if the assignee agrees in writing to be bound by the terms of the license agreement. There are no ongoing licensing fees associated with this license agreement and Netfolio, Inc. does not have any contractual rights to terminate the license agreement.
8
Table of Contents
Business Strategy
From 1996, when we started our first mutual fund, until September 30, 2009, we have grown our assets under management to $923 million, with fluctuations during that time. Recent market conditions have created significant volatility in the equities markets, causing increased redemptions and negative performance. However, we strive to increase our profitability and assets under management by implementing the following key strategies:
-Utilizing our branding and marketing campaign for growth.
We believe that we can attract investors to our Cornerstone Funds by effectively marketing our unique quantitative investment style. We believe that our investment philosophy appeals to investors who want to understand exactly how their investments are managed and who favor statistical analysis and empirical evidence as the basis for investment decisions. Additionally, we believe the talents of the seasoned sub-advisors managing our Select Funds will attract investors who appreciate fundamental, hands-on investment management.
We will continue our efforts to make Hennessy a name readily recognizable by investors through frequent print media, radio and television appearances. We use our media appearances to convey to investors that we manage our Cornerstone Funds with the discipline and consistency of an index fund by never straying from our strategies. We believe that a straightforward, quantitative approach is easily understood by investors and makes them more likely to recommend us to others by word of mouth. As our brand recognition broadens, we believe that our investment philosophy will generate organic growth through new investments in our mutual funds. We will also team up with our sub-advisors for media coverage in order to promote our Select Funds when co-branding opportunities arise.
-Expanding our distribution network to additional mutual fund supermarkets.
One of the ways that investors can buy shares of our mutual funds is through mutual fund supermarkets, principally Schwab, Fidelity, TD Ameritrade and Pershing. Mutual fund supermarkets can offer funds of many different investment companies to investors, often without a transaction fee or sales charge to the investor. Instead of charging a fee to investors, mutual fund supermarkets are reimbursed for their services by the applicable fund or that fund’s investment advisor. This ability to purchase various mutual funds at no cost in a single location is very attractive to investors. Mutual fund supermarkets have been a significant source of our asset growth. Of the $923 million of assets under management in our mutual funds as of September 30, 2009, approximately 52% of those assets came from mutual fund supermarkets. We see continued opportunities to form new relationships with mutual fund supermarkets, thereby enhancing the accessibility of our no-load mutual funds to investors.
-Increasing our current base of investment professionals who utilize no-load mutual funds for their clients.
Investment professionals generally have a wide variety of investment products that they can recommend to their clients. A recommendation by an investment professional to a client to buy one of our mutual funds can be very influential to that client. Thus, we believe that expanding our current base of investment professionals who utilize no-load funds for their clients will help us increase the amount of assets that we manage, which will in turn increase our revenues.
-Securing participation in the platforms of national full-service firms that permit their investment professionals to utilize no-load funds for their clients.
We will strive to continue developing relationships with national full-service firms that permit their investment professionals to offer no-load funds to their clients as a way to increase the amount of assets that we manage, which will in turn increase our revenues.
-Pursuing selective acquisitions.
9
Table of Contents
We selectively consider strategic acquisitions of management agreements of additional mutual funds. Through our acquisition strategy, we have added over $1.06 billion of net assets to our family of mutual funds over a period of approximately nine years. We believe there are a number of attractive acquisition opportunities from smaller mutual fund managers who are reaching retirement age or whose investment strategy does not lend itself to the economies of scale inherent in our strictly quantitative approach. We have been able to offer lower overall expense ratios to the shareholders of acquired funds. We have also been able to improve performance in some instances. The addition of our Select Funds has expanded the pool of possible acquisition candidates to now include actively managed funds wishing to retain their manager in a ‘sub-advisory’ role.
-Delivering strong, high quality financial results.
We seek to manage our investment management business to the highest regulatory, ethical and business standards while strenuously controlling costs, maintaining a relatively small staff, and creating high margins for the Hennessy shareholders.
-Increasing our distribution to new and existing clients.
We hired Kevin Rowell, who also serves as President of the Hennessy Funds, to build a distribution plan to generate organic growth in our funds. The core of the distribution team centers around: internal wholesaling, relationship management and investment research analysis. The distribution effort is supported by the marketing department by providing institutional quality advisor materials and heightened brand awareness. The distribution team is working on building and maintaining a database covering key platforms, delivering content to the analyst community and developing a “research center” website for our funds.
Marketing
We generate all of our operating revenues by providing management and shareholder services to our mutual funds. The revenues that we receive from the mutual funds are based on the amount of average daily net assets in the funds and thus, we can increase our revenues by growing the amount of net assets in the funds. One of the best ways we can grow the assets of the mutual funds is by delivering strong investment performance, which we believe should:
| • | result in an increase in the value of existing assets in the funds; |
| • | encourage more investors to buy shares of our mutual funds and decrease the number of investors who redeem their shares and leave our mutual funds; and |
| • | motivate current investors to invest additional money in our mutual funds. |
We have developed an aggressive public relations outreach program to target audiences we would otherwise be unable to address. Our public relations outreach program has resulted in the Hennessy Funds being mentioned in national print and broadcast media an average of once every two to three days in such vehicles as CNBC, Fox News, The Wall Street Journal, The New York Times, Smart Money, Barron’s, and Investors Business Daily. To facilitate our presence in the media, we installed LiveStudio, an in-house studio providing our portfolio manager, Neil J. Hennessy, with a direct link to the media broadcasts he frequents. The LiveStudio was completed and placed in service as of March 2008.
We also send quarterly information mailings, fund performance updates, news articles pertaining to the funds and commentaries from Neil J. Hennessy to clients and prospective clients, and we exhibit at select investment advisor trade shows throughout the year. Additionally, we attend strategic industry-related conferences.
Acquisition Strategy and Market Opportunity
We believe that we are well positioned to experience organic growth, and possibly growth by acquisition, in the future. Our scalable business model allows us to increase our profit margins as assets under management grow, since we do not necessarily need to add personnel proportional to the increase in assets under management.
10
Table of Contents
Together with organic growth, our growth strategy revolves around the acquisition of management agreements. We believe the regulatory burden imposed upon the mutual fund industry has compressed the margins of smaller mutual fund managers, making those managers more receptive to an acquisition. We believe that we are well positioned to benefit from these attractive acquisition trends and from the increasing supply of potential targets.
Investment Strategy
Each of the Cornerstone Funds employs a consistent and repeatable investment process, combining time-tested, purely quantitative stock selection formulas with a highly disciplined, team-managed approach. Our stock selection formulas have been tested over historical periods for hypothetical performance results, and we adhere to our proven formulas in all types of market conditions. A brief description of each of the Cornerstone Fund’s objective and investment formula follows:
-Hennessy Cornerstone Growth Fund (HFCGX and HICGX). The Hennessy Cornerstone Growth Fund seeks long-term growth of capital. While it has historically selected small cap companies, the formula may select mid and large cap companies. This fund screens a universe of stocks with a market capitalization of more than $175 million, a price-to-sales ratio of less than 1.5, higher annual earnings than in the previous year and stock price appreciation, or positive relative strength, over the prior three- and six-month periods. The fund then invests in the 50 stocks with the highest one-year price appreciation.
-Hennessy Cornerstone Growth Fund, Series II (HENLX and HINLX). The Hennessy Cornerstone Growth Fund, Series II seeks long-term capital appreciation. This fund utilizes the same investment formula as the Hennessy Cornerstone Growth Fund but rebalances its portfolio at a different time of the year, in an effort to create as different a portfolio of stocks as possible.
-Hennessy Focus 30 Fund (HFTFX and HIFTX). The Hennessy Focus 30 Fund seeks long-term growth of capital by investing in mid-cap, growth-oriented companies. This fund screens a universe of stocks with a market capitalization of between $1 to $10 billion, excluding American Depository Receipts, a price-to-sales ratio of less than 1.5, higher annual earnings than in the previous year and positive stock price appreciation over a three- and six-month periods. The fund then invests in the 30 stocks with the highest one-year price appreciation.
-Hennessy Cornerstone Large Growth Fund (HFGLX and HIGLX). The Hennessy Cornerstone Large Growth Fund invests in growth-oriented common stocks of larger companies by utilizing a highly disciplined, purely quantitative formula. This formula selects the 50 common stocks that meet the following criteria, in order: (1) Market capitalization that exceeds the average of the database; (2) Price-to-cash flow ratio less than the median of the database (this value criterion helps to uncover relative bargains among large companies); (3) Positive total capital; and (4) Highest one-year return on total capital.
-Hennessy Cornerstone Value Fund (HFCVX and HICVX). The Hennessy Cornerstone Value Fund seeks total return, consisting of capital appreciation and current income, by investing in large, dividend-paying companies. This fund screens a universe of stocks with above average market capitalization, shares outstanding and cash flow, and 12-month sales that are at least 50% higher than average. The fund then invests in the 50 stocks with the highest dividend yield, which is calculated as the annual dividends paid by a company divided by the per share price of its stock.
-Hennessy Total Return Fund (HDOGX). The Hennessy Total Return Fund seeks total return, consisting of capital appreciation and current income, by investing approximately 75% of its assets in the 10 highest dividend-yielding common stocks of the Dow Jones Industrial Average (commonly referred to as the “Dogs of the Dow”) and the remaining 25% in U.S. Treasury securities with a maturity of less than one year.
11
Table of Contents
-Hennessy Balanced Fund (HBFBX). The Hennessy Balanced Fund seeks a combination of capital appreciation and current income by investing approximately fifty percent of its assets in the Dogs of the Dow stocks and approximately fifty percent in U.S. Treasury securities with a maturity of less than one year.
The Select Funds, launched with the acquisition of the Hennessy Select Large Value Fund in March 2009, are actively managed and each employs a seasoned sub-advisor. This newer series of funds allows us to expand our product offering and to showcase the talents of what we believe are excellent, yet undiscovered asset managers. We have sought out highly qualified category experts to oversee the day to day portfolio management of each of the Select Funds. A brief description of the objective and investment strategy of each Select Fund is set forth below:
-Hennessy Select Large Value Fund (HSVFX and HSVIX). The Hennessy Select Large Value Fund seeks long-term growth of capital and current income by purchasing larger capitalization companies that are out of favor and undervalued. The fund invests in stocks which its portfolio managers consider to be undervalued based on earnings, dividends and/or assets, or on other widely recognized stock value measurements. Further, the portfolio managers believe that these companies have sound businesses with good future potential based on their fundamental characteristics.
-Hennessy Select SPARX Japan Fund (SPXJX and SPARX). The Hennessy Select SPARX Japan Fund seeks long-term capital appreciation by investing at least 80% of its net assets in equity securities of Japanese companies. The Fund invests in companies regardless of market capitalization, and portfolio construction is unconfined to benchmarks or tracking error. The fund invests in stocks which its portfolio managers believe to be good businesses with exceptional management and which are trading at an attractive price. Individual stock selection is based on rigorous, on-site research and focuses on factors such as market growth potential, management quality, earnings quality and balance sheet strength. The Fund seeks arbitrage opportunities between a company’s fundamental value and its market price. The portfolio selects just the managers’ best ideas and has a concentrated number of holdings.
-Hennessy Select SPARX Japan Smaller Companies Fund (SPJSX). The Hennessy Select SPARX Japan Smaller Companies Fund seeks long-term capital appreciation. The Fund normally invests at least 80% of its net assets in equity securities of smaller Japanese companies, defined as those with market capitalization of approximately $200 million to $1.5 billion at time of purchase. The Fund’s portfolio construction is unconfined to benchmarks or tracking error. The investment strategy mirrors the Hennessy Select SPARX Japan Fund, but it operates within the market capitalizations discussed above.
Historical Fund Investment Performance
The following table presents the average annualized returns for each of our mutual funds and the relevant benchmark indices for the one-year, three-year, five-year, ten-year and since inception periods ended September 30, 2009.
Although we did not begin managing the Hennessy Cornerstone Growth Fund and the Hennessy Cornerstone Value Fund until June 2000, we have included historical performance information for these funds from their inception date of November 1, 1996 because the previous investment manager to these funds managed the funds using the same strategies that we still use today.
Although we did not begin managing the Hennessy Select Large Value Fund until March 2009, and we did not begin managing the Hennessy Select SPARX Japan Fund and the Hennessy Select SPARX Japan Smaller Companies Fund until September 2009, we have included historical performance information for these funds from their inception dates because the previous investment managers have remained in a ‘sub-advisory’ role and continue to adhere to the same investment strategies.
12
Table of Contents
Furthermore, the performance shown for the period 4/20/04 to 3/20/09 for the Hennessy Select Large Value Fund reflects performance for the Tamarack Value Fund, the predecessor to the Hennessy Select Large Value Fund, and the performance shown for the period 9/30/84 to 4/19/04 reflects performance for the Babson Value Fund, the predecessor to the Tamarack Value Fund.
Returns are presented net of all expenses borne by mutual fund shareholders, but are not net of fees waived or expenses borne by us. The past investment performance of our mutual funds is no guarantee of future performance and all of these mutual funds have experienced negative performance over various time periods in the past and may do so again in the future:
| Hennessy Cornerstone Growth Fund |
1 Year | 3 Years | 5 Years | 10 Years | Since Inception (11/01/96) |
||||||||||
| Institutional Class Share - HICGX |
-20.55 | % | -14.41 | % | -3.76 | % | 5.84 | % | 7.43 | % | |||||
| Original Class Share - HFCGX |
-20.76 | % | -14.54 | % | -3.84 | % | 5.79 | % | 7.40 | % | |||||
| Russell 2000 Index (2)(3) |
-9.55 | % | -4.57 | % | 2.41 | % | 4.88 | % | 5.94 | % | |||||
| S&P 500 Index (1)(2) |
-6.91 | % | -5.43 | % | 1.02 | % | -0.15 | % | 5.01 | % | |||||
| Hennessy Cornerstone Growth Fund, Series II |
1 Year | 3 Years | 5 Years | 10 Years | Since Inception (07/01/05) |
||||||||||
| Institutional Class Share - HINLX |
-13.44 | % | -18.07 | % | N/A | N/A | -12.00 | % | |||||||
| Original Class Share - HENLX |
-14.07 | % | -18.34 | % | N/A | N/A | -12.21 | % | |||||||
| Russell 2000 Growth (2)(3) |
-6.32 | % | -2.60 | % | N/A | N/A | 0.82 | % | |||||||
| S&P 500 Index (1)(2) |
-6.91 | % | -5.43 | % | N/A | N/A | -0.76 | % | |||||||
| Hennessy Focus 30 Fund |
1 Year | 3 Years | 5 Years | 10 Years | Since Inception (09/17/03) |
||||||||||
| Institutional Class Share - HIFTX |
-6.42 | % | -4.10 | % | 6.98 | % | N/A | 7.21 | % | ||||||
| Original Class Share - HFTFX |
-6.75 | % | -4.28 | % | 6.86 | % | N/A | 7.11 | % | ||||||
| S&P 400 Mid cap Index (2)(6) |
-3.11 | % | -1.40 | % | 4.53 | % | N/A | 6.06 | % | ||||||
| S&P 500 Index (1)(2) |
-6.91 | % | -5.43 | % | 1.02 | % | N/A | 2.54 | % | ||||||
| Hennessy Cornerstone Value Fund |
1 Year | 3 Years | 5 Years | 10 Years | Since Inception (11/01/96) |
||||||||||
| Institutional Class Share - HICVX |
6.99 | % | -6.01 | % | 0.81 | % | 3.17 | % | 4.49 | % | |||||
| Original Class Share - HFCVX |
6.56 | % | -6.14 | % | 0.73 | % | 3.12 | % | 4.46 | % | |||||
| Russell 1000 Value (2)(4) |
-10.62 | % | -7.87 | % | 0.90 | % | 2.59 | % | 6.21 | % | |||||
| S&P 500 Index (1)(2) |
-6.91 | % | -5.43 | % | 1.02 | % | -0.15 | % | 5.01 | % | |||||
13
Table of Contents
| Hennessy Cornerstone Large Growth Fund |
1 Year | 3 Years | 5 Years | 10 Years | Since Inception (3/20/09) |
||||||||||
| Institutional Class Share - HILGX |
N/A | N/A | N/A | N/A | 42.79 | % | |||||||||
| Original Class Share - HFLGX |
N/A | N/A | N/A | N/A | 42.64 | % | |||||||||
| Russell 1000 Index (2)(4) |
N/A | N/A | N/A | N/A | 40.52 | % | |||||||||
| S&P 500 Index (1)(2) |
N/A | N/A | N/A | N/A | 39.20 | % | |||||||||
| Hennessy Select Large Value Fund |
1 Year | 3 Years | 5 Years | 10 Years | Since Inception (9/30/84) |
||||||||||
| Institutional Class Share - HSVIX |
-8.29 | % | -6.69 | % | -0.25 | % | 1.75 | % | 9.57 | % | |||||
| Original Class Share - HSVFX |
-8.43 | % | -6.74 | % | -0.28 | % | 1.73 | % | 9.57 | % | |||||
| Russell 1000 Value (2)(4) |
-10.62 | % | -7.87 | % | 0.90 | % | 2.59 | % | 10.83 | % | |||||
| S&P 500 Index (1)(2) |
-6.91 | % | -5.43 | % | 1.02 | % | -0.15 | % | 10.36 | % | |||||
| Hennessy Select SPARX Japan Fund |
1 Year | 3 Years | 5 Years | 10 Years | Since Inception (10/31/03) |
||||||||||
| Institutional Class Share - SPARX |
2.04 | % | -10.81 | % | -0.26 | % | N/A | 4.80 | % | ||||||
| Original Class Share - SPXJX |
2.14 | % | -10.85 | % | -0.36 | % | N/A | 4.69 | % | ||||||
| MSCI Japan Index |
-0.43 | % | -7.92 | % | 2.35 | % | N/A | 3.03 | % | ||||||
| TOPIX |
0.95 | % | -7.96 | % | 1.56 | % | N/A | 2.44 | % | ||||||
| Hennessy Select SPARX Japan Smaller Companies Fund |
1 Year | 3 Years | 5 Years | 10 Years | Since Inception (8/31/07) |
||||||||||
| Original Class Share - SPJSX |
18.77 | % | N/A | N/A | N/A | 0.62 | % | ||||||||
| MSCI Japan Small Cap Index |
15.86 | % | N/A | N/A | N/A | -7.72 | % | ||||||||
| TOPIX |
0.95 | % | N/A | N/A | N/A | -12.23 | % | ||||||||
| Hennessy Total Return Fund |
1 Year | 3 Years | 5 Years | 10 Years | Since Inception (07/29/98) |
||||||||||
| Original Class Share - HDOGX |
-9.88 | % | -7.17 | % | -0.04 | % | 1.04 | % | 1.38 | % | |||||
| Dow Jones Industrial Average (2)(5) |
-7.38 | % | -3.33 | % | 1.85 | % | 1.62 | % | 3.00 | % | |||||
| S&P 500 Index (1)(2) |
-6.91 | % | -5.43 | % | 1.02 | % | -0.15 | % | 1.19 | % | |||||
| Hennessy Balanced Fund |
1 Year | 3 Years | 5 Years | 10 Years | Since Inception (03/08/96) |
||||||||||
| Original Class Share - HBFBX |
-1.03 | % | -2.45 | % | 1.13 | % | 1.25 | % | 3.39 | % | |||||
| Dow Jones Industrial Average (2)(5) |
-7.38 | % | -3.33 | % | 1.85 | % | 1.62 | % | 6.56 | % | |||||
| S&P 500 Index (1)(2) |
-6.91 | % | -5.43 | % | 1.02 | % | -0.15 | % | 5.69 | % | |||||
| (1) | The S&P 500 is the Standard & Poor’s Composite Index of 500 stocks, a widely recognized index of U.S. stocks. |
| (2) | Reflects no deduction for fees or expenses. |
| (3) | The Russell 2000 Index is a recognized small-cap index of the 2,000 smallest stocks of the Russell 3000 Index, which is comprised of the 3,000 largest U.S. stocks as determined by total market capitalization. |
| (4) | The Russell 1000 Value Index is a recognized large-cap index of U.S. stocks. |
| (5) | The Dow Jones Industrial Average is an index of common stocks comprised of major industrial companies and assumes reinvestment of dividends. |
| (6) | The S&P Mid-cap 400 Index is a recognized mid-cap index of U.S. stocks. |
14
Table of Contents
| (7) | The MSCI Japan Index is a market capitalization-weighted index of Japanese equities. |
| (8) | The Tokyo Stock Price Index (TOPIX) is a market capitalization-weighted index of all companies listed on the First Section of the Tokyo Stock Exchange. |
| (9) | The MSCI Japan Small Cap Index represents the universe of small capitalization companies in the Japanese equity markets. |
Development of New Investment Strategies and Expanding Our Product Offerings
We begin developing new investment strategies or expanding our product offerings by identifying client needs and reviewing asset allocation tables to determine where we can augment our family of mutual funds. Once we identify an attractive market segment, we select one of the following methods to gain the new strategy: (a) by screening the appropriate universe of stocks with a set of parameters that we believe identify stocks that will produce higher long-term returns with lower associated risk than their relative indices and introducing the new investment strategies into the marketplace by opening and directly marketing a new mutual fund, (b) by acquiring the management agreement for an existing mutual fund and implementing our new strategy, or (c) by acquiring the management agreement for an existing fund and utilizing strategic sub-advisors to expand our product offering.
Competition
We face substantial competition in the investment management industry. The investment management industry is characterized by a relatively low cost of entry and by the formation of new investment management entities that may compete directly with us. We compete directly with a large number of global and U.S. investment advisors, commercial banks, brokerage firms, broker-dealers, insurance companies and other financial institutions. These institutions range from small boutique firms to large financial services complexes. We compete on a wide variety of factors, including:
| • | investment performance of our mutual funds; |
| • | expense ratio of our mutual funds; |
| • | product offerings; |
| • | quality of service; |
| • | brand recognition; and |
| • | business reputation. |
We are considered a small investment management firm. Many competing firms are part of larger financial services companies and have greater marketing, financial, technical, research and other capabilities. Most larger firms offer a broader range of financial services than we do and compete with us for retail and institutional clients. Nonetheless, we have learned to compete successfully with these firms by creating unique investment strategies and by branding our investment style through public relations and outstanding customer service.
Our mutual funds also face competition, primarily from nationally and regionally distributed funds that offer equivalent financial products with returns equal to or greater than those we offer. The competition for new investors is intense, but we feel that by increasing our mutual funds’ distribution channels and continuing to brand our investment style and the competency of our sub-advisors, we can capture portions of the available investment business.
Regulation
Virtually all aspects of our business are subject to federal and state laws and regulations. These laws and regulations are intended to protect shareholders of registered investment companies and clients of registered investment advisors. We believe that we are in compliance in all material respects with all laws and regulations.
15
Table of Contents
We are registered as an investment advisor with the SEC. As a registered investment advisor, we must comply with the requirements of the Investment Advisors Act of 1940 and related SEC regulations. Such requirements relate to, among other things, fiduciary duties to clients, engaging in transactions with clients, maintaining an effective compliance program, solicitation arrangements, conflicts of interest, advertising, limitations on agency cross and principal transactions between an advisor and advisory clients, recordkeeping and reporting requirements, disclosure requirements and general anti-fraud provisions. Our mutual funds are registered with the SEC under the Investment Company Act of 1940. The Investment Company Act of 1940 imposes additional obligations on both the funds and the advisor, including detailed operational requirements. The SEC is authorized to institute proceedings and impose sanctions for violations of the Investment Advisors Act and Investment Company Act, ranging from fines and censures to termination of an investment advisor’s registration. Our failure to comply with the SEC requirements could have a material adverse effect on us. We believe we are in compliance with SEC requirements.
In response to the 2001 to 2004 scandals in the financial services industry regarding late trading, market timing and the selective disclosure of portfolio information, the U.S. Congress and the various regulatory agencies that supervise our operations adopted various legislative and regulatory proposals. The SEC, other regulators and Congress continue to investigate certain practices in our industry. In addition, we are subject to periodic examination by the SEC under SEC rules and regulations. The most recent SEC examination occurred in August, 2007 for the period of January 1, 2005 to June 30, 2007. The findings of the examination were minor in nature and had no effect on our financial statements.
At the end of 2003, the SEC adopted rules requiring investment advisors and investment companies to adopt written compliance programs designed to prevent violations of the federal securities laws. These compliance programs must be reviewed annually for adequacy and effectiveness. Investment advisors and investment companies must also designate a chief compliance officer to implement the compliance policies and procedures and to report directly to the fund’s board of directors or trustees.
Over the past several years, Congress has occasionally advanced the ideas of eliminating asset-based distribution fees or Rule 12b-1 fees for open-end mutual funds. The changes could prohibit revenue sharing, which allows a mutual fund company to pay for “shelf space” at brokerage firms or other intermediaries selling mutual fund shares. Although such reforms have been advanced, they have not been adopted. Should adoption occur, it may become more expensive for us to distribute and manage our mutual funds.
Because many regulations are subject to varying interpretations, our firm’s compliance with these regulations subjects it to a number of risks. Regulators make periodic examinations and review annual, monthly and other reports on our operations, track record and financial condition. In the event that we violate or fail to comply with an applicable law or regulation, governmental regulators may institute administrative or judicial proceedings against us that could result in censures, fines, compensation orders, civil penalties, criminal penalties, the issuance of cease-and-desist orders, the deregistration or suspension of our firm, the suspension or disqualification of our officers or employees and other adverse consequences. We have not experienced any such penalties to date. Such violations or non-compliance could also subject us and/or our employees to civil actions by private persons.
As of September 30, 2009, Hennessy Advisors, Inc. employed fourteen full-time employees.
Neil J. Hennessy is the Chairman of the Board, Chief Executive Officer, Chief Investment Officer and a Portfolio Manager, as well as President of Hennessy Advisors. Teresa M. Nilsen is an Executive Vice President, Chief Financial Officer, Secretary and a Director of Hennessy Advisors. Daniel B. Steadman is an Executive Vice President in charge of expansion and a Director of Hennessy Advisors. Frank Ingarra is responsible for stock trading and is a Portfolio Manager of Hennessy Advisors. Other employees
16
Table of Contents
of Hennessy Advisors include Kevin Rowell, President of the Hennessy Funds; Tania Kelley, Marketing Director; Harry Thomas, Chief Compliance Officer; Brian Peery, Director of Research; Adam Pennacchio, Research Analyst; Kathryn Walwyn, Controller; Ana Miner, Operations Specialist; Joseph Fahy, Relationship Manager; Michelle Hennessy, Sales Associate; and Lauren Puliafico, Receptionist.
| ITEM 1A. | RISK FACTORS |
Risks relating to our business
-Our revenues decline when the value of the securities held by the mutual funds we manage declines.
We derive all of our operating revenues from management and shareholder servicing fees paid to us by the mutual funds we manage. These fees are calculated as a percentage of the average daily net assets of our mutual funds and vary from fund to fund. The securities markets are inherently volatile and may be affected by factors beyond our control, including global economic conditions, interest rate fluctuations, inflation rate increases and other factors, such as the sub-prime lending crisis, that are difficult to predict. Volatility in the securities markets, and the equity markets in particular, has reduced the net assets of our mutual funds and consequently reduced our revenues, and could continue to do so in the future. In addition to declines in the equity markets, failure of these markets to sustain prior levels of growth or continued short-term volatility in these markets has resulted in investors withdrawing their investments from our mutual funds and decreasing their rate of investment, both of which have adversely affected our revenues. This risk is further discussed and quantified in Item 7A in this Annual Report on Form 10-K.
-Investors in our mutual funds can redeem their investments in our funds at any time and for any reason, including poor investment performance. This adversely affects our revenues.
Fund investors may redeem their investments in any of our mutual funds at any time and for any reason without prior notice. Investors may also reduce the total amount of assets that they have invested with us for a number of reasons, including our investment performance, changes in prevailing interest rates and financial market performance. Success in the investment management and mutual fund business is dependent on investment performance, as well as distribution and client servicing. If our mutual funds perform poorly compared to the mutual funds of other investment management firms, we may experience a decrease in purchases of shares of our mutual funds and an increase in redemptions of shares of our mutual funds. A decrease in the net assets of our mutual funds adversely affects our revenues.
-Adverse opinions of our mutual funds by third party rating agencies or industry analysts could decrease new investments in or accelerate redemptions from our mutual funds, which adversely affects our revenues.
Many investors rely heavily on the opinions of third party rating agencies and industry analysts when making decisions to purchase or redeem shares of mutual funds. Adverse opinions regarding our mutual funds could erode investor confidence, potentially leading to a decrease in new investments and an increase in redemptions, thereby reducing the net assets of our mutual funds. A decrease in the net assets of our mutual funds adversely affects our revenues.
-Investor behavior is influenced by short-term investment performance of mutual funds. Poor short-term performance of our mutual funds could cause a decrease in new investments in or accelerate redemptions from our mutual funds, which adversely affects our revenues.
Investor behavior may be based on many factors, including short-term investment performance. Poor short-term performance of our mutual funds, irrespective of longer-term success, could potentially lead to a decrease in new investments and an increase in redemptions, thereby reducing the net assets of our mutual funds. A decrease in the net assets of our mutual funds adversely affects our revenues.
17
Table of Contents
-For our Cornerstone Funds, we utilize quantitative investment strategies that require us to invest in specific portfolios of securities and hold these positions for approximately one year. Entering into, maintaining or liquidating one or more of these positions in accordance with our investment strategies could have a material adverse effect on the performance of our mutual funds.
Our Cornerstone Funds adhere to the investment strategies for each of our mutual funds during the annual rebalancing period and throughout the course of the year. Adhering to our investment strategies during the annual rebalancing of our mutual funds may result in the elimination of better performing assets from our funds’ portfolios and an increase in investments with relatively lower total return. Additionally, we will maintain a position in a relatively poorly performing security throughout the course of the portfolio holding period. Either of these actions could result in relatively lower performance of our mutual funds and adversely affect the net assets of our mutual funds. A decrease in the net assets of our mutual funds adversely affects our revenues.
-We manage the SPARX Funds that invest in the Japanese stock market in Yen. Since our assets are held in U.S. dollars, there is currency risk.
The SPARX Funds are invested in Japanese securities and are sub-advised by the Tokyo-based (but U.S. registered) SPARX Asset Management Co., Ltd. The value of the SPARX Funds fluctuates with changes in the value of the Japanese Yen versus the U.S. dollar. Furthermore, any changes in the political climate of Japan may have an effect on the value of the stocks in the SPARX Funds.
-We depend upon Neil J. Hennessy to manage our business. The loss of Mr. Hennessy may adversely affect our business and financial condition.
Our success is largely dependent on the skills, experience and performance of key personnel, particularly Neil J. Hennessy, our chairman of the board, chief executive officer and president. Mr. Hennessy is primarily responsible for the marketing and management of the portfolio of each of our mutual funds, developing new investment strategies and executing each existing fund’s investment program. The loss of Mr. Hennessy could have an adverse effect on our business, financial condition and results of operations.
-Our business is extensively regulated and our failure to comply with regulatory requirements may harm our financial condition.
Our business is subject to extensive regulation in the United States, particularly by the SEC. Our failure to comply with applicable laws or regulations could result in fines, suspensions of personnel or other sanctions, including revocation of our registration as an investment advisor. The mutual fund industry has undergone increased scrutiny by the SEC and state regulators for the past several years, resulting in numerous enforcement actions, “sweep” examinations, and new rules and rule proposals. These actions have increased our costs in managing our mutual funds, and we could continue to experience higher costs if new rules and other regulatory actions or legislation require us to spend more time, hire additional personnel or buy new technology to comply with these rules and laws. Additional changes in laws or regulations, the interpretation or enforcement of existing laws and rules or governmental policies could also have a material adverse effect on us by limiting the sources of our revenues and increasing our costs. Our business may be materially affected not only by securities regulations, but also by regulations of general application. For example, the amount of net assets in our mutual funds in a given time period could be affected by, among other things, existing and proposed tax legislation and other governmental regulations and policies, including the interest rate policies of the Federal Reserve Board.
Our management activities are also subject to contractual commitments and our mutual fund business involves compliance with numerous investment, asset valuation, distribution and tax requirements. Failure to adhere to these requirements could result in losses that a client could recover from us. We have installed procedures and utilize the services of experienced administrators, accountants and lawyers to assist in satisfying these requirements. However, there can be no assurance that these precautions will protect us from potential liabilities.
18
Table of Contents
-The costs of full compliance with new securities regulations may increase expenses and reduce earnings.
In order to comply with securities regulations, we may have additional expenses beyond our control, which may have a substantial impact on earnings per share. In October 2004, we hired a chief compliance officer as required by Rule 206(4)-7 of the Investment Advisors Act of 1940. Under Rule 38a-1 of the Investment Company Act of 1940, which pertains to mutual fund companies, our mutual funds were also required to hire a chief compliance officer. The individual serving as our chief compliance officer was also hired by our mutual funds to serve as their chief compliance officer. The mutual fund directors or trustees set the compensation for their chief compliance officer, but we have agreed to bear all of the related compensation expense.
In addition to requiring the hiring of a chief compliance officer, Rule 206(4)-7 of the Investment Advisors Act of 1940 required that we adopt written compliance policies and procedures. Under Rule 38a-1 of the Investment Company Act of 1940, our mutual funds were also required to adopt written compliance policies and procedures, including policies and procedures that provide for oversight of the funds’ key service providers, including us. We may experience increases in audit, legal, internal technology and other expenses associated with the regulations of the Sarbanes-Oxley Act of 2002, especially as they relate to internal controls and compliance with financial reporting.
-Management contracts acquired by the Company are currently classified as an indefinite life asset subject to impairment analysis. The impairment analysis is based on subjective criteria, and an impairment loss could be recorded.
The management contracts acquired by the Company, currently a $22.2 million asset on the balance sheet, are considered an intangible asset with an indefinite useful life. Management reviews the classification of the asset as ‘indefinite life’ each reporting period. If the contracts become an asset with a definite life, the Company should begin amortizing the contracts over the remaining useful life of the contracts. If the contracts are determined to remain an indefinite life asset, the Company reviews the carrying value of management contracts acquired to determine if any impairment has occurred. The analysis is based on anticipated future cash flows, which are calculated based on assets under management. Although the contracts are not currently impaired, there is always a possibility of impairment in the future, which could require the Company to write-off all or a portion of the contracts. A write-off, depending on the amount, could have a significant impact on earnings per share.
-Acquisitions involve inherent risks that could adversely affect our operating results and financial condition as well as dilute the holdings of current shareholders.
As part of our business strategy, we intend to pursue additional acquisitions of management agreements for other mutual funds. Future acquisitions of management agreements would be accompanied by risks including, among others:
| • | inability to secure enough affirmative votes to gain approval from the target fund’s shareholders of a proposed acquisition; |
| • | the loss of mutual fund assets through redemptions by shareholders of newly acquired mutual funds; |
| • | higher than anticipated acquisition expenses; |
| • | the potential diversion of our management’s time and attention; and |
| • | dilution to our shareholders if the acquisition is made with our common stock. |
If one or more of these risks occur, we may be unable to successfully complete an acquisition of a management agreement, we may experience an impairment of management agreement valuations and we may not achieve the expected return on investment. Any of these results could have an adverse effect on our business, financial condition and results of operations.
19
Table of Contents
-Our management and shareholder servicing agreements can be terminated on short notice and are subject to annual renewals.
We generate all of our operating revenues from our management and shareholder servicing agreements covering our mutual funds. Management and shareholder servicing agreements covering our mutual funds are terminable without penalty on 60 days notice and must be approved at least annually by a majority of each fund’s board of directors or trustees and a majority of the disinterested members of each fund’s board of directors or trustees. If any of these management or shareholder servicing agreements are terminated or not renewed, our revenues would substantially decline.
-We face intense competition in attracting investors and retaining net assets in our mutual funds.
The investment management business is intensely competitive. We are considered a small investment management company, but must compete with a large number of global and U.S. investment advisors, commercial banks, brokerage firms, broker-dealers, insurance companies and other financial institutions for investors in our mutual funds. Many organizations are attempting to market to and service the same investors as we do, not only with mutual fund products and services, but also with a wide range of other financial products and services. Many of our competitors have greater marketing, financial, technical, research, distribution and other capabilities than we do and offer more product lines and services. These competitors would tend to have a substantial advantage over us during periods when our investment performance is not strong enough to counter these competitors’ greater resources or due to a wide variety of other factors, such as the expense ratios of our mutual funds or our small number of mutual funds. If we are not able to attract investors and retain net assets in our mutual funds, our revenues could decline and our business, financial condition and results of operations would suffer.
-Assets invested through mutual fund supermarkets have a higher risk of redemption due to more accessibility to alternative investment options.
The mutual fund assets held through mutual fund supermarkets, as opposed to assets directly invested in our mutual funds, can be more easily moved to investments in funds outside of our fund family. Mutual fund supermarkets are attractive to investors because of the ease of accessibility to a variety of funds, but this causes the investments to be more sensitive to fluctuations in performance, especially in the short-term. If we are not able to retain the investor assets held through mutual fund supermarkets, it will cause decreased net assets in our mutual funds; as a result, our revenues could decline and our business, financial condition and results of operations would suffer.
-Market pressure to lower our management fees could reduce our profit margin.
To the extent we are forced to compete on the basis of the management fees we charge our mutual funds, we may not be able to maintain our current fee structure. Historically, we have competed primarily on the performance of our mutual funds and not on the level of our management fees relative to those of our competitors. In recent years, however, there has been a trend toward lower fees in some segments of the investment management industry. In order for us to maintain our fee structure in a competitive environment, we must be able to provide our mutual fund shareholders with investment returns and service that will encourage them to invest in the mutual funds that pay our fees. We cannot be assured that we will succeed in providing investment returns that will allow us to maintain our current fee structure. Fee reductions on existing or future business could have a material adverse effect on our results of operations.
-We may be required to forego all or a portion of our fees under our management agreements covering our mutual funds.
20
Table of Contents
The board of directors or trustees of each of our mutual funds must make certain findings regarding the reasonableness of our fees. We monitor ratios of expenses to average daily net assets and waive management fees that we would otherwise receive from, or reimburse expenses incurred by, our mutual funds if we believe that our expense ratios might lead fund investors to redeem their shares in our mutual funds in order to seek lower expense ratios with other fund managers.
We currently waive our advisor fees or reimburse fund expenses to the extent necessary to maintain expense ratio limitations on the institutional share class of our funds as well the original class shares of the newly acquired Tamarack Funds and SPARX Funds. The expense limitation for the Tamarack Funds expires at the end of March 2010, and the expense limitation for the SPARX Funds expires at the end of February 2010.
-Changes in mutual fund supermarkets’ fee structures could reduce our revenues, increase our expenses and slow our growth.
We derive a significant portion of our sales through individual investors and investment advisors who utilize mutual fund supermarkets. Mutual fund supermarkets provide services to their customers, but instead of charging their customers for these services, they charge us and our mutual funds. Fees paid to mutual fund supermarkets may increase in the future. Higher payments to mutual fund supermarkets by us or our mutual funds could increase our expenses or reduce our revenues by decreasing our assets under management, either of which could slow our growth.
-We depend on third party investment professionals and the distribution channels they utilize to market our mutual funds.
Our ability to distribute our mutual funds is highly dependent on access to the retail distribution systems and client bases of third party investment professionals that also offer competing investment products. These investment professionals who recommend our mutual funds may reduce or eliminate their involvement in marketing our funds at any time, or may elect to emphasize the investment products of competing sponsors or the proprietary products of their own firms. In addition, an investment professional may only distribute our mutual funds for so long as we continue to participate in the platforms of national full-service firms that permit their investment professionals to utilize no-load funds for their clients. These firms can terminate their relationships with us on short notice, limiting our participation in these platforms. Either of these events could cause the net assets of our mutual funds to decline, which would decrease our revenues and have a material adverse effect on our results of operations.
| ITEM 1B. | UNRESOLVED STAFF COMMENTS |
None.
| ITEM 2. | DESCRIPTION OF PROPERTY. |
Our principal executive offices are located at 7250 Redwood Boulevard, Suite 200, Novato, California 94945, where we occupy approximately 13,728 square feet and have the right to use all common areas. The term of our lease expires on October 31, 2010, with one five-year extension available.
Additionally, we have an office for our Co-Portfolio Manager and a Portfolio Analyst located at One Landmark Square, Suite 424, Stamford, Connecticut 06901, where we occupy approximately 1,400 square feet. The term of our lease expires on September 30, 2011.
| ITEM 3. | LEGAL PROCEEDINGS. |
None.
21
Table of Contents
| ITEM 4. | SUBMISSION OF MATTERS TO A VOTE OF SECURITY HOLDERS. |
None.
PART II
| ITEM 5. | MARKET FOR COMMON EQUITY, RELATED STOCKHOLDER MATTERS AND ISSUER PURCHASES OF EQUITY SECURITIES |
Our common stock is traded on the OTC Bulletin Board under the trading symbol HNNA.OB. Our stock began trading on July 15, 2002.
The following table sets forth the high and low sales prices for our common stock on the OTC Bulletin Board for the periods indicated:
| Fiscal Year Ended September 30, 2009 |
Price Range | Dividends Paid per Share |
||||||||
|
High |
Low | |||||||||
| First Quarter |
$ | 5.00 | $ | 1.50 | — | |||||
| Second Quarter |
3.00 | 2.00 | $ | 0.09 | (1) | |||||
| Third Quarter |
3.75 | 2.10 | — | |||||||
| Fourth Quarter |
3.50 | 3.00 | — | |||||||
| Fiscal Year Ended September 30, 2008 |
Price Range | Dividends Paid per Share |
||||||||
|
High |
Low | |||||||||
| First Quarter |
$ | 13.00 | $ | 8.56 | — | |||||
| Second Quarter |
12.00 | 5.25 | $ | 0.09 | (2) | |||||
| Third Quarter |
8.50 | 5.00 | — | |||||||
| Fourth Quarter |
6.20 | 3.60 | — | |||||||
| (1) | We paid a cash dividend on March 5, 2009 of $0.09 per share. |
| (2) | We paid a cash dividend on March 7, 2008 of $0.09 per share. |
On October 27, 2009, the last reported sale price of our common stock on the OTC Bulletin Board was $3.00 per share.
The following graph compares total stockholder returns of Hennessy Advisors, Inc. for the five-year period ended September 30, 2009, with the total returns of the Dow Jones Select MicroCap Index and an index of our identified peer group. The graph assumes that $100 was invested on September 30, 2004 in Hennessy Advisors, Inc. stock and equally across all stocks included in the indices, and covers the period through September 30, 2009. Total return includes reinvestment of all dividends.
22
Table of Contents
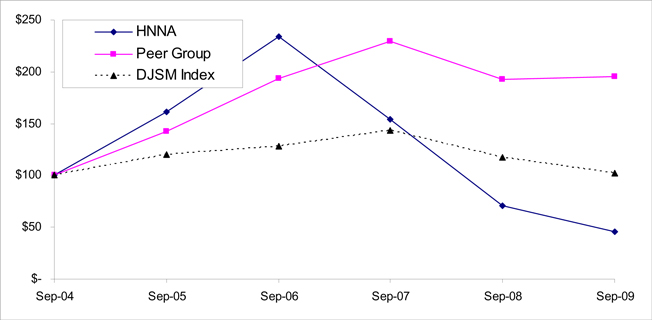
The Dow Jones Select MircoCap (“DJSM”) Index is a composite of 250 publicly traded stocks whose market capitalizations fall within a range defined by the bottom two deciles of NYSE stocks. The stocks are screened by trading volume and financial indicators such as P/E ratio, trailing price/sales ratio, operations profit margins, per-share profit change for the previous quarter, and six-month total return to represent micro-cap stocks trading on the New York Stock Exchange. The DJSM Index was first published in June 2005, but includes results prior to this date based on back-tested information. The DJSM Index represents the closest available index to the Hennessy Advisors, Inc. stock based on the relatively low market capitalization and trading volume of the included stocks.
The peer group index includes other publicly traded asset management firms similar in nature to Hennessy Advisors, Inc. The following companies are included in the peer group: Eaton Vance, Janus Capital, T. Rowe Price, Blackrock, Franklin Resources, Gamco Investors, Federated Investors, Legg Mason, Calamos Asset Management, and Cohen & Steers. Calamos Asset Management began trading on October 27, 2004, and is therefore excluded from the year ended September 30, 2005. The returns of the peers are weighted based on their respective market capitalizations.
As of October 1, 2009, there were 197 holders of record of Common Stock of the Company. The 197 holders of record include several brokerage firm accounts which represent about 500 additional individual shareholders for approximately 697 total shareholders as of October 1, 2009.
We paid a cash dividend of $0.09 per share on March 5, 2009.
The declaration and payment of dividends to holders of our common stock by us, if any, are subject to the discretion of our board of directors. Our board of directors will take into account such matters as general economic and business conditions, our strategic plans, our financial results and condition, contractual, legal and regulatory restrictions on the payment of dividends by us, and such other factors as our board of directors may consider relevant.
23
Table of Contents
PURCHASES OF EQUITY SECURITIES BY THE ISSUER AND AFFILIATED PURCHASERS
We purchased shares underlying vested restricted stock units (“RSUs”) throughout the year from employees to provide withholding and tax payments on behalf of our employees. The stock repurchases are presented in the following table for the quarter ended September 30, 2009:
| Period |
Total number of shares purchased |
Average price paid per share |
Total number of shares purchased as part of publicly announced plans or programs (4) |
Maximum number of shares that may yet be purchased under the plans or programs (4) | |||||
| (a) | (b) | (c) | (d) | ||||||
| On the vesting dates of June 1-30, 2009 |
0 | $ | 0.00 | 0 | 0 | ||||
| On the vesting dates of July 1-31, 2009 |
0 | $ | 0.00 | 0 | 0 | ||||
| On the vesting dates of August 1-31, 2009 (1)(2) |
173 | $ | 3.03 | 0 | 0 | ||||
| Total (3) |
173 | $ | 3.03 | 0 | 0 | ||||
| (1) | The shares repurchased on August 2, 2009 were repurchased, according to the employee’s instructions, to pay for tax expense and withholding on the compensation recognized for vested RSU’s, granted on August 2, 2006. |
| (2) | The shares repurchased on August 15, 2009 were repurchased, according to the employee’s instructions, to pay for tax expense and withholding on the compensation recognized for vested RSU’s, granted on August 15, 2008. |
| (3) | The total shares repurchased were purchased at a weighted average price of $3.03 per share. |
| (4) | The share repurchases were not completed pursuant to a plan or program, and are therefore not subject to maximums per a plan or program. The share repurchases were done at the request of an employee to pay for tax expense and withholding on behalf of the employee. |
24
Table of Contents
| ITEM 6. | SELECTED FINANCIAL DATA |
The following financial information is derived from the Company’s audited consolidated financial statements, included in the Company’s annual reports, and should be read in conjunction therewith.
| Hennessy Advisors, Inc. Financial Highlights (In thousands, except per share amounts) | ||||||||||||||||
| Years Ended September 30, | ||||||||||||||||
| 2009 | 2008 | 2007 | 2006 | 2005 | ||||||||||||
| Income Statement Data: |
||||||||||||||||
| Revenue |
$ | 5,813 | $ | 10,275 | $ | 16,072 | $ | 16,934 | $ | 11,997 | ||||||
| Net income (loss) |
$ | (195 | ) | $ | 1,611 | $ | 4,133 | $ | 4,403 | $ | 3,139 | |||||
| Balance Sheet Data: |
||||||||||||||||
| Total assets |
$ | 30,099 | $ | 34,335 | $ | 35,704 | $ | 33,107 | $ | 29,107 | ||||||
| Cash and cash equivalents |
$ | 5,747 | $ | 12,788 | $ | 13,760 | $ | 10,360 | $ | 6,291 | ||||||
| Long-term debt |
$ | — | $ | 4,417 | $ | 6,508 | $ | 8,599 | $ | 10,690 | ||||||
| Per Share Data: |
||||||||||||||||
| Earnings per share: |
||||||||||||||||
| Basic |
$ | (0.03 | ) | $ | 0.29 | $ | 0.73 | $ | 0.79 | $ | 0.57 | |||||
| Diluted |
$ | (0.03 | ) | $ | 0.28 | $ | 0.70 | $ | 0.73 | $ | 0.53 | |||||
| Cash dividends declared |
$ | 0.09 | $ | 0.09 | $ | 0.08 | $ | 0.06 | $ | 0.04 | ||||||
| ITEM 7. | MANAGEMENT’S DISCUSSION AND ANALYSIS |
Forward Looking Statements
This report contains “forward-looking statements” within the meaning of the securities laws, for which we claim the protection of the safe harbors for forward-looking statements contained in the Private Securities Litigation Reform Act of 1995. These forward-looking statements include statements about, among other things, assets under management, our anticipated financial performance, business prospects, new developments and similar matters, and statements preceded by, followed by or including the words “expect,” “anticipate,” “intend,” “may,” “plan,” “will,” “should,” “would,” “believe,” “estimate,” “predict,” “project,” “continue,” “seek” or similar expressions. We have based these forward-looking statements on our current expectations and projections about future events, based on information currently available to us. Forward-looking statements should not be read as a guarantee of future performance or results, and will not necessarily be accurate indications of the times at, or means by, which such performance or results will be achieved. These forward-looking statements are subject to risks, uncertainties and assumptions, including those described in the section entitled “Risks Relating to Our Business” and elsewhere in this report that could cause actual performance or results to differ substantially from those expressed in or suggested by the forward-looking statements.
Factors that may affect the Company’s actual results include those described in Item 1A under “Risks Relating to Our Business.” There is no regulation requiring an update of any of the forward-looking statements after the date of this report and prior to our next Form 10-Q to conform these statements to actual results or to changes in our expectations.
25
Table of Contents
Overview
We derive our operating revenues from management fees and shareholder servicing fees paid to us by the Hennessy Funds. These fees are calculated as a percentage of the average daily net assets in each of our mutual funds and vary from fund to fund. The fees we receive fluctuate with changes in the total net asset value of the assets in our mutual funds, which are affected by our investment performance, our completed acquisitions of management agreements, market conditions and the success of our marketing and distribution efforts. Total assets under management were $923 million as of September 30, 2009.
The assets we manage have decreased as a result of net fund outflows and market depreciation. The following tables illustrate the change by quarter in assets under management since the beginning of fiscal year 2008:
| Assets Under Management At Each Quarter End in Fiscal Year 2009 |
||||||||||||||||
| 12/31/2008 | 3/31/2009 | 6/30/2009 | 9/30/2009 | |||||||||||||
| (In Thousands) | ||||||||||||||||
| Beginning assets under management |
$ | 876,069 | $ | 641,344 | $ | 699,176 | $ | 774,518 | ||||||||
| Acquisition inflows |
— | 158,293 | — | 74,256 | ||||||||||||
| Organic inflows |
27,178 | 14,029 | 16,696 | 22,506 | ||||||||||||
| Redemptions |
(81,761 | ) | (46,416 | ) | (47,371 | ) | (55,506 | ) | ||||||||
| Market appreciation (depreciation) |
(180,142 | ) | (68,074 | ) | 106,017 | 107,630 | ||||||||||
| Ending assets under management |
$ | 641,344 | $ | 699,176 | $ | 774,518 | $ | 923,404 | ||||||||
| Assets Under Management At Each Quarter End in Fiscal Year 2008 |
||||||||||||||||
| 12/31/2007 | 3/31/2008 | 6/30/2008 | 9/30/2008 | |||||||||||||
| (In Thousands) | ||||||||||||||||
| Beginning assets under management |
$ | 1,720,763 | $ | 1,425,531 | $ | 1,098,695 | $ | 1,094,791 | ||||||||
| Organic inflows |
32,911 | 76,398 | 63,237 | 92,452 | ||||||||||||
| Redemptions |
(242,867 | ) | (199,018 | ) | (105,092 | ) | (85,497 | ) | ||||||||
| Market appreciation (depreciation) |
(85,276 | ) | (204,216 | ) | 37,951 | (225,677 | ) | |||||||||
| Ending assets under management |
$ | 1,425,531 | $ | 1,098,695 | $ | 1,094,791 | $ | 876,069 | ||||||||
A significant portion of our expenses, including employee compensation, are fixed and have historically demonstrated minimal variation. To implement our business strategy, we have increased our staffing. As a result, our fixed expenses have increased in the
26
Table of Contents
current year. Additionally, we have had decreasing revenues, causing our fixed costs to become a larger percent of revenues and therefore further decreasing our profitability.
The principal asset on our balance sheet, management contracts – net of accumulated amortization, represents the capitalized costs incurred in connection with the acquisition of management agreements. This asset had a net balance of $22.2 million as of September 30, 2009 compared to $19.4 million at the end of the prior comparable period.
The principal liability on our balance sheet is the bank debt incurred in connection with the acquisition of management agreements for the Lindner Funds and the Henlopen Fund. As of September 30, 2009, this liability had a balance of $1.9 million, compared to $6.5 million at the end of the prior comparable period.
RESULTS OF OPERATIONS
The following table sets forth information about components of our revenue and expense for the periods shown:
| Fiscal Years Ended September 30, | ||||||||||||||
| 2009 | 2008 | |||||||||||||
| (In thousands, except percentages) | ||||||||||||||
| Amounts | Percent of Total Revenue |
Amounts | Percent of Total Revenue |
|||||||||||
| Revenue: |
||||||||||||||
| Investment advisory fees |
$ | 5,114 | 88.0 | % | $ | 9,025 | 87.8 | % | ||||||
| Shareholder service fees |
680 | 11.7 | 1,211 | 11.8 | ||||||||||
| Other |
19 | 0.3 | 39 | 0.4 | ||||||||||
| Total revenue |
5,813 | 100.0 | 10,275 | 100.0 | ||||||||||
| Operating expenses: |
||||||||||||||
| Compensation and benefits |
3,044 | 52.4 | 3,032 | 29.5 | ||||||||||
| General and administrative |
1,980 | 34.1 | 2,181 | 21.2 | ||||||||||
| Mutual fund distribution |
620 | 10.7 | 1,799 | 17.5 | ||||||||||
| Sub-advisor fees |
239 | 4.1 | — | — | ||||||||||
| Amortization and depreciation |
120 | 2.0 | 527 | 5.2 | ||||||||||
| Total operating expenses |
6,003 | 103.3 | 7,539 | 73.4 | ||||||||||
| Operating income (loss) |
(190 | ) | (3.3 | ) | 2,736 | 26.6 | ||||||||
| Interest expense |
87 | 1.5 | 388 | 3.8 | ||||||||||
| Other income |
(38 | ) | (0.7 | ) | (407 | ) | (4.0 | ) | ||||||
| Income (loss) before income tax expense |
(239 | ) | (4.1 | ) | 2,755 | 26.8 | ||||||||
| Income tax expense (benefit) |
(44 | ) | (0.7 | ) | 1,144 | 11.1 | ||||||||
| Net income (loss) |
$ | (195 | ) | (3.4 | )% | $ | 1,611 | 15.7 | % | |||||
27
Table of Contents
Revenues: Total revenue decreased 43.4% to $5.8 million in the year ended September 30, 2009, due to decreased average assets under management. Investment advisory fees decreased 43.3% to $5.1 million year ended September 30, 2009, and shareholder service fees decreased 43.8% to $0.7 million in the year ended September 30, 2009. These decreases resulted from decreases in the average daily net assets of our mutual funds, which can differ considerably from total net assets of our mutual funds at the end of an accounting period. Total net assets in our mutual funds increased by $47.3 million, or 5.4%, as of September 30, 2009, from $876 million as of the end of the prior comparable period. Although total assets increased year over year, the average daily net assets of our funds hit a low of $475 million during March 2009. The decline in average assets during the year caused the decrease in revenue.
The $47.3 million increase in net mutual funds assets is attributable to asset acquisitions of $232.5 million and organic inflows of $80.4 million, partly offset by redemptions of $231.1 million and market depreciation of $34.5 million. Redemptions as a percentage of assets under management decreased from an average of 4.0% per month to 2.5% per month during the same period.
Operating Expenses: Total operating expenses decreased 20.4% to $6.0 million in the fiscal year ended September 30, 2009, from $7.5 million in the prior comparable period. The decrease is due to declines in assets held on no transaction fee platforms and reduced amortization expense. As a percentage of total revenue, total operating expenses increased by 29.9% to 103.3% in the fiscal year ended September 30, 2009, as compared to 73.4% in the prior comparable period.
Compensation and Benefits Expense: Compensation and benefits increased 0.4% to $3.0 million in the fiscal year ended September 30, 2009, from $3.0 million in the prior comparable period. The increase resulted primarily from the creation of a new position in June, 2008 of the President of the Hennessy Funds, who is also the head of our distribution and sales efforts. Additionally, there have been no layoffs of existing employees in the current period despite the economic turmoil. The expense of the new position is mostly offset by decreased bonus expense in the current year. As a percentage of total revenue, compensation and benefits increased by 22.9% to 52.4% for the fiscal year ended September 30, 2009, compared to 29.5% in the prior comparable period.
General and Administrative Expenses: General and administrative expense decreased 9.2% to $2.0 million in the fiscal year ended September 30, 2009, from $2.2 million in the prior comparable period, primarily due to decreased professional service expense. As a percentage of total revenue, general and administrative expense increased by 12.9% to 34.1% in the fiscal year ended September 30, 2009, from 21.2% in the prior fiscal year.
Mutual Fund Distribution Expense: Distribution expenses decreased 65.5% to $0.6 million in the fiscal year ended September 30, 2009, from $1.8 million in the prior fiscal year. As a percentage of total revenue, distribution expenses decreased by 6.8% to 10.7% in the fiscal year ended September 30, 2009, from 17.5% in the prior fiscal year. The proportion of assets held through mutual fund supermarkets decreased in relation to assets held at other financial institutions primarily as a result of a higher rate of redemptions through mutual fund supermarkets than through mutual funds held directly or at other financial institutions.
Sub-Advisor Fee Expense: Sub-advisor fee expense of $0.2 million is a new expense in the fiscal year ended September 30, 2009. The fees are paid on assets in our new Select Funds. The Select Funds are actively managed by outside asset managers retained by Hennessy Advisors, Inc. As a percentage of total revenue, sub-advisor fee expense is 4.1% in the fiscal year ended September 30, 2009.
Amortization and Depreciation Expense: Amortization and depreciation expense decreased 77.2% to $0.1 million in the fiscal year ended September 30, 2009, from $0.5 million in the prior fiscal year, resulting from the non-compete agreement being fully amortized as of the end of the third quarter in the prior fiscal year.
28
Table of Contents
Interest Expense: Interest expense decreased 77.6% to $0.1 million in the fiscal year ended September 30, 2009 from $0.4 million in the prior fiscal year. The decrease is a result of the decreased interest rates (prime rate was reduced to 3.25% in December 2008) as well as principal payments of $4.6 million during the current year. As a percentage of total revenue, interest expense decreased by 2.3% to 1.5% in the fiscal year ended September 30, 2009, from 3.8% in the prior fiscal year.
Other Income: Other income decreased 90.7% to $0.04 million in the fiscal year ended September 30, 2009 from $0.4 million in the prior fiscal year. Other income in the current fiscal year is mainly due to interest income earned on our cash balance, which has decreased by $7.0 million from the prior year.
Income Taxes: The provision for income taxes decreased by 103.8% to a tax benefit of $0.04 million in the year ended September 30, 2009, from a tax expense of $1.1 million in the prior fiscal year.
Net Income: Net income decreased 112.1% to a net loss of $0.2 million in the fiscal year ended September 30, 2009, from net income of $1.6 million in the prior fiscal year, as a result of the factors discussed above.
Off-Balance Sheet Arrangements
We do not have and have not had any off-balance sheet arrangements.
Liquidity and Capital Resources
We continually review our capital requirements to ensure that we have sufficient funding available to support our growth strategies. Management anticipates that cash and other liquid assets on hand as of September 30, 2009 will be sufficient to meet our short-term capital requirements. To the extent that liquid resources and cash provided by operations are not adequate to meet long-term capital requirements, management plans to raise additional capital through debt or equity markets. There can be no assurance that we will be able to borrow funds or raise additional equity.
Total assets as of September 30, 2009 were $30.1 million, which was a decrease of $4.2 million, or 12.3%, from September 30, 2008. Property and equipment and management agreements acquired totaled $22.4 million as of September 30, 2009. Our remaining assets are very liquid, consisting primarily of cash and receivables derived from mutual fund asset management activities. As of September 30, 2009, we had cash and cash equivalents of $5.7 million.
Dividend Payments. On March 5, 2009, we paid a cash dividend of $0.09 per common share. The total payment from cash on hand was $0.5 million.
Our Bank Loan. We have an outstanding bank loan with U.S. Bank National Association. We incurred $7.9 million of indebtedness in connection with acquiring the management agreements for the Lindner Funds and an additional $6.7 million of indebtedness in connection with acquiring the management agreement for The Henlopen Fund (now known as the Hennessy Cornerstone Growth Fund, Series II). The indebtedness we incurred to acquire the management agreement of The Henlopen Fund was rolled into a single loan with the indebtedness we incurred to acquire the management agreements of the Lindner Funds. As of September 30, 2009, we had $1.95 million of principal outstanding under our bank loan, which bears interest at U.S. Bank National Association’s prime rate, as set by U.S. Bank National Association from time to time, less one percent (2.25% as of December 17, 2008). An additional installment of $3.5 million was paid on December 29, 2008, and the loan was amended to require 20 monthly payments in the amount of $68,750 plus interest, with the final installment of the then outstanding principal and interest due on September 30, 2010.
29
Table of Contents
Contractual Obligations
The following table sets forth our contractual obligations as of September 30, 2009, consisting of loan payments, including the related interest payments due, and operating leases:
| Payments due by period (in thousands) | |||||||||||||||
| Total | Less Than 1 Year |
1 - 3 Years | 3 - 5 Years | More Than 5 Years | |||||||||||
| Principal on bank loan |
1,950 | 756 | 1,194 | — | — | ||||||||||
| Interest on bank loan (1) |
63 | 59 | 4 | — | — | ||||||||||
| Operating lease (2) |
107 | 48 | 59 | — | — | ||||||||||
| Operating lease (3) |
451 | 381 | 70 | — | — | ||||||||||
| Total |
$ | 2,571 | $ | 1,244 | $ | 1,327 | $ | — | $ | — | |||||
| (1) | The interest payable on the bank loan is calculated at the current effective rate of prime less one percent, or 2.25%, based on the prime rate of 3.25% set as of December 17, 2008. |
| (2) | This lease is for office space located at One Landmark Square, Suite 424, Stamford, Connecticut 06901. |
| (3) | This lease is for our principal executive office located at 7250 Redwood Boulevard, Suite 200, Novato, California 94945. |
Critical Accounting Policies
Accounting policies, methods, and estimates are an integral part of the financial statements prepared by management and are based upon management’s current judgments. Those judgments are normally based on knowledge and experience with regard to past and current events and assumptions about future events. Certain accounting policies, methods, and estimates are particularly sensitive because of their significance to the financial statements and because of the possibility that future events affecting them may differ markedly from management’s current judgment.
The management agreements acquired by the Company are considered intangible assets with an indefinite life. In June 2001, the Financial Accounting Standards Board issued the FASB guidance “Intangibles—Goodwill and Other.” It states that goodwill and intangible assets with indefinite useful lives are not amortized, but are tested at least annually for impairment. We fully implemented the provisions of the FASB guidance on October 1, 2002, at which time we ceased amortization of these intangible assets. Impairment analysis is conducted quarterly and coincides with our quarterly and annual financial reporting. Based on our detailed assessment of current fair market value, the value of the management agreements acquired has not been impaired. If future valuations in the marketplace decline, the valuation of management agreements acquired may become impaired and net earnings would be negatively impacted by the resulting impairment adjustment.
Effective October 1, 2005, the Company adopted the fair value recognition provisions of the revised FASB guidance on Stock Compensation under the “Modified Perspective” method in accordance with the transition and disclosure provisions of the
30
Table of Contents
guidance. The Company measures the stock-based compensation expense at the grant date, based on the estimated fair value of the awards, and recognizes the compensation costs for those awards over the vesting periods. All compensation costs related to restricted stock units vested during the years ended September 30, 2009 and 2008 have been recognized in our financial statements.
Effective October 1, 2007, the Company adopted the FASB guidance on “Accounting for Uncertainty in Income Tax.” It prescribes a recognition threshold and measurement attribute for the financial statement recognition and measurement of uncertain tax positions taken or expected to be taken in a company’s income tax return, and also provides guidance on derecognition, classification, interest and penalties, accounting in interim periods, disclosure, and transition. The FASB guidance utilizes a two-step approach for evaluating uncertain tax positions accounted for in accordance with the FASB guidance. Step one, recognition, requires a company to determine if the weight of available evidence indicates that a tax position is more likely than not to be sustained upon audit, including resolution of related appeals or litigation processes, if any. Step two, measurement, is based on the largest amount of benefit, which is more likely than not to be realized on ultimate settlement. The cumulative effect of adopting the FASB guidance on October 1, 2007 is recognized as a change in accounting principle, recorded as an adjustment to the opening balance of retained earnings on the adoption date. As a result of the implementation of FASB guidance, the Company did not recognize any increase or decrease in the liability for unrecognized tax benefits related to tax positions taken in prior periods, therefore, there was no corresponding adjustment in retained earnings.
The costs related to the Company’s acquisition of management contracts are capitalized as incurred. The costs are defined as an ‘intangible asset’ per FASB standard “Intangibles – Goodwill and Other.” The acquisition costs include legal fees, shareholder vote fees and percent of asset costs to acquire the management contracts. The amounts are included in the management contract asset totaling $22.2 million as of September 30, 2009.
Recent Accounting Pronouncements
In September, 2006, the FASB issued new standard “Fair Value Measurements,” which is effective for our fiscal year 2009. In February, 2008, the FASB issued a new standard which delayed the effective date for all non-financial assets and liabilities, except those that are recognized or disclosed at fair value in the financial statements on a recurring basis, to the fiscal year beginning after November 15, 2008 (our fiscal year 2010). The Company adopted the fair value measurement for all financial assets and liabilities as of October 1, 2008, as discussed in Footnote 3. We do not expect the full adoption of the new standard to have an effect on our financial statements or results of operations.
In August, 2009, the FASB issued amended standards for the fair value measurement of liabilities. These amended standards clarify that in circumstances in which a quoted price in an active market for the identical liability is not available, we are required to use the quoted price of the identical liability when traded as an asset, quoted prices for similar liabilities, or quoted prices for similar liabilities when traded as assets. If these quoted prices are not available, we are required to use another valuation technique, such as an income approach or a market approach. These amended standards are effective for our first quarter of fiscal year 2010. We do not anticipate the adoption of these amendments to have any effect on our financial statements or results of operations.
In June, 2009, the FASB issued amended standards for determining whether to consolidate a variable entity. These amended standards eliminate a mandatory quantitative approach to determine whether a variable interest gives the entity a controlling financial interest in a variable interest entity in favor of a qualitatively focused analysis, and require an ongoing reassessment of whether an entity is the primary beneficiary. These amended standards are effective for the annual period beginning after November 15, 2009 (the Company’s fiscal year 2011). We do not anticipate the adoption of these amendments to have any effect on our financial statements or results of operations.
31
Table of Contents
| ITEM 7A. | QUANTITATIVE AND QUALITATIVE DISCLOSURES ABOUT MARKET RISK |
The Company is subjected to different types of risk, including market risk. Market risk is the risk that the Company will be adversely affected by changes in the securities market, specifically changes in equity prices.
As discussed in Item 1A under “Risks Relating to Our Business,” the Company’s revenue is calculated on the market value of assets under management. Declines in the value of the securities held by the mutual funds we manage will negatively impact the Company’s revenue and net income. The following is a summary of the effect that a ten percent increase or decrease in equity prices of the stocks within our mutual funds would have on the Company’s assets under management, and therefore the Company’s revenue. The changes are compared to total asset values as of September 30, 2009, and values are based on an assumption that asset values are consistent throughout the year:
| Effects of Market Risk on Revenue (In thousands) | |||||||||
| Values Based on Average Net Assets at September 30, 2009 |
Values Based on a 10% Increase in Average Assets |
Values Based on a 10% Decrease in Average Assets | |||||||
| Average Assets |
|||||||||
| Under Management |
$ | 916,004 | $ | 1,007,605 | $ | 824,404 | |||
| Investment Advisor Fees |
$ | 7,065 | $ | 7,771 | $ | 6,358 | |||
| Shareholder Service Fees |
796 | 876 | 717 | ||||||
| Total Revenue: |
$ | 7,861 | $ | 8,647 | $ | 7,075 | |||
32
Table of Contents
| ITEM 8. | FINANCIAL STATEMENTS AND SUPPLEMENTARY DATA |
Index to Financial Statements:
| Management Report on Internal Control over Financial Reporting |
34 | |
| Report of Stonefield Josephson, Inc., Independent Registered Public Accounting Firm |
35 | |
| 36 | ||
| 37 | ||
| 38 | ||
| 39 | ||
| 40 | ||
33
Table of Contents
Management Report on Internal Control over Financial Reporting
The Company’s management is responsible for establishing and maintaining adequate internal control over financial reporting. The Company’s control systems were designed to provide reasonable assurance to its management and Board of Directors regarding the preparation and fair presentation of published financial statements.
All internal control systems, no matter how well designed, have inherent limitations. Therefore, even those systems determined to be effective can provide only reasonable assurance with respect to financial statement preparation and presentation.
The Company’s management assessed the effectiveness of its internal control over financial reporting as of September 30, 2009. In making this assessment, it used the criteria set forth by the Committee of Sponsoring Organizations of the Treadway Commission (COSO) in Internal Control—Integrated Framework. Based on this assessment, management believes that, as of September 30, 2009, the Company’s internal control over financial reporting is effective based on those criteria.
This annual report does not include an attestation report of the Company’s registered public accounting firm regarding internal control over financial reporting. Management’s report was not subject to attestation by the Company’s registered public accounting firm pursuant to temporary rules of the Securities and Exchange Commission that permit the company to provide only management’s report in this annual report.
34
Table of Contents
Report of Independent Registered Public Accounting Firm
To The Board of Directors and Shareholders of Hennessy Advisors, Inc.:
We have audited the accompanying balance sheets of Hennessy Advisors, Inc. (the “Company”) as of September 30, 2009 and 2008, and the related statements of operations, stockholders’ equity, and cash flows for each of the years in the two-year period ended September 30, 2009. These financial statements are the responsibility of the Company’s management. Our responsibility is to express an opinion on these financial statements based on our audits.
We conducted our audits in accordance with the standards of the Public Company Accounting Oversight Board (United States). Those standards require that we plan and perform the audit to obtain reasonable assurance about whether the financial statements are free of material misstatement. An audit includes examining, on a test basis, evidence supporting the amounts and disclosures in the financial statements. An audit also includes assessing the accounting principles used and significant estimates made by management, as well as evaluating the overall financial statement presentation. We believe that our audits provide a reasonable basis for our opinion.
In our opinion, the financial statements referred to above present fairly, in all material respects, the financial position of Hennessy Advisors, Inc. as of September 30, 2009 and 2008, and the results of its operations and its cash flows for each of the years in the two-year period ended September 30, 2009, in conformity with accounting principles generally accepted in the United States of America.
| /s/ Stonefield Josephson, Inc. |
| San Francisco, California |
| December 3, 2009 |
35
Table of Contents
Balance Sheets
(In thousands, except share and per share amounts)
| September 30, 2009 |
September 30, 2008 |
|||||||
| Assets |
||||||||
| Current assets: |
||||||||
| Cash and cash equivalents |
$ | 5,747 | $ | 12,788 | ||||
| Investments in marketable securities, at fair value |
5 | 5 | ||||||
| Investment fee income receivable |
560 | 670 | ||||||
| Prepaid expenses |
665 | 435 | ||||||
| Deferred income tax asset |
241 | 225 | ||||||
| Other current assets |
20 | 17 | ||||||
| Total current assets |
7,238 | 14,140 | ||||||
| Property and equipment, net of accumulated depreciation of $349 and $274, respectively |
222 | 301 | ||||||
| Management contracts, net of accumulated amortization of $629 and $629, respectively |
22,220 | 19,406 | ||||||
| Investment in the Hennessy Micro Cap Growth Fund, LLC, at fair value |
366 | 417 | ||||||
| Other assets, net of accumulated amortization of $84 and $68, respectively |
53 | 71 | ||||||
| Total assets |
$ | 30,099 | $ | 34,335 | ||||
| Liabilities and Stockholders’ Equity |
||||||||
| Current liabilities: |
||||||||
| Accrued liabilities and accounts payable |
$ | 1,394 | $ | 1,238 | ||||
| Current portion of deferred rent |
23 | 11 | ||||||
| Current portion of long-term debt |
1,950 | 2,091 | ||||||
| Total current liabilities |
3,367 | 3,340 | ||||||
| Long-term debt |
— | 4,417 | ||||||
| Long-term portion of deferred rent |
4 | 26 | ||||||
| Deferred income tax liability |
2,607 | 2,029 | ||||||
| Total liabilities |
5,978 | 9,812 | ||||||
| Commitments and Contingencies (Note 11) |
||||||||
| Stockholders’ equity: |
||||||||
| Adjustable rate preferred stock, $25 stated value, 5,000,000 shares authorized: zero shares issued and outstanding |
— | — | ||||||
| Common stock, no par value, 15,000,000 shares authorized: 5,754,419 shares issued and outstanding at September 30, 2009 and 5,718,850 at September 30, 2008 |
9,466 | 9,105 | ||||||
| Accumulated other comprehensive loss |
(146 | ) | (95 | ) | ||||
| Retained earnings |
14,801 | 15,513 | ||||||
| Total stockholders’ equity |
24,121 | 24,523 | ||||||
| Total liabilities and stockholders’ equity |
$ | 30,099 | $ | 34,335 | ||||
See accompanying notes to financial statements
36
Table of Contents
Statement of Operations
(In thousands, except per share data)
| Years Ended September 30, | ||||||||
| 2009 | 2008 | |||||||
| Revenue |
||||||||
| Investment advisory fees |
$ | 5,114 | $ | 9,025 | ||||
| Shareholder service fees |
680 | 1,211 | ||||||
| Other |
19 | 39 | ||||||
| Total revenue |
5,813 | 10,275 | ||||||
| Operating expenses |
||||||||
| Compensation and benefits |
3,044 | 3,032 | ||||||
| General and administrative |
1,980 | 2,181 | ||||||
| Mutual fund distribution |
620 | 1,799 | ||||||
| Sub-advisor fees |
239 | — | ||||||
| Amortization and depreciation |
120 | 527 | ||||||
| Total operating expenses |
6,003 | 7,539 | ||||||
| Operating income (loss) |
(190 | ) | 2,736 | |||||
| Interest expense |
87 | 388 | ||||||
| Other income, net |
(38 | ) | (407 | ) | ||||
| Income (loss) before income tax expense |
(239 | ) | 2,755 | |||||
| Income tax expense (benefit) |
(44 | ) | 1,144 | |||||
| Net income (loss) |
$ | (195 | ) | $ | 1,611 | |||
| Earnings (loss) per share: |
||||||||
| Basic |
$ | (0.03 | ) | $ | 0.29 | |||
| Diluted |
$ | (0.03 | ) | $ | 0.28 | |||
| Weighted average shares outstanding: |
||||||||
| Basic |
5,673,628 | 5,648,584 | ||||||
| Diluted |
5,673,628 | 5,748,279 | ||||||
See accompanying notes to financial statements
37
Table of Contents
Statements of Changes in Stockholders’ Equity
Years Ended September 30, 2009 and 2008
(In thousands, except share data)
| Common Shares |
Common Stock |
Retained Earnings |
Other Comprehensive Loss |
Total Stockholders’ Equity |
|||||||||||||||
| Balance at September 30, 2007 |
5,702,493 | $ | 8,938 | $ | 14,417 | $ | — | $ | 23,355 | ||||||||||
| Net income |
— | — | 1,611 | — | 1,611 | ||||||||||||||
| Dividends paid |
— | — | (515 | ) | — | (515 | ) | ||||||||||||
| Unrealized loss on investment in Hennessy Micro Cap Growth Fund, LLC |
— | — | — | (95 | ) | (95 | ) | ||||||||||||
| Employee and director restricted stock vested |
26,981 | — | — | — | — | ||||||||||||||
| Repurchase of vested employee restricted stock for tax withholding |
(10,624 | ) | (98 | ) | — | — | (98 | ) | |||||||||||
| Employee restricted stock forfeited |
— | (11 | ) | — | — | (11 | ) | ||||||||||||
| Deferred restricted stock unit compensation |
— | 479 | — | — | 479 | ||||||||||||||
| Tax effect of RSU vesting |
— | (203 | ) | — | — | (203 | ) | ||||||||||||
| Balance at September 30, 2008 |
5,718,850 | $ | 9,105 | $ | 15,513 | $ | (95 | ) | $ | 24,523 | |||||||||
| Net loss |
— | — | (195 | ) | — | (195 | ) | ||||||||||||
| Dividends paid |
— | — | (517 | ) | — | (517 | ) | ||||||||||||
| Unrealized loss on investment in Hennessy Micro Cap Growth Fund, LLC |
— | — | — | (51 | ) | (51 | ) | ||||||||||||
| Employee and director restricted stock vested |
39,356 | — | — | — | — | ||||||||||||||
| Repurchase of vested employee restricted stock for tax withholding |
(3,787 | ) | (11 | ) | — | — | (11 | ) | |||||||||||
| Deferred restricted stock unit compensation |
— | 536 | — | — | 536 | ||||||||||||||
| Tax effect of RSU vesting |
— | (164 | ) | — | — | (164 | ) | ||||||||||||
| Balance at September 30, 2009 |
5,754,419 | $ | 9,466 | $ | 14,801 | $ | (146 | ) | $ | 24,121 | |||||||||
See accompanying notes to financial statements
38
Table of Contents
Statements of Cash Flows
(In thousands)
| Fiscal Years Ended September 30, | ||||||||
| 2009 | 2008 | |||||||
| Cash flows from operating activities: |
||||||||
| Net income (loss) |
$ | (195 | ) | $ | 1,611 | |||
| Adjustments to reconcile net income to net cash (used in) provided by operating activities: |
||||||||
| Depreciation and amortization |
120 | 527 | ||||||
| Deferred income taxes |
562 | 480 | ||||||
| Tax benefit from options exercised and restricted stock unit vesting |
(164 | ) | (203 | ) | ||||
| Restricted stock units vested |
(11 | ) | (98 | ) | ||||
| Deferred restricted stock unit compensation |
536 | 479 | ||||||
| Restricted stock units forfeited |
— | (11 | ) | |||||
| Unrealized (gain)/loss on marketable securities |
— | 1 | ||||||
| (Increase) decrease in operating assets: |
||||||||
| Investment fee income receivable |
110 | 495 | ||||||
| Prepaid expenses |
(230 | ) | (270 | ) | ||||
| Other current assets |
(3 | ) | (2 | ) | ||||
| Other assets |
2 | 55 | ||||||
| Increase (decrease) in operating liabilities: |
||||||||
| Accrued liabilities and accounts payable |
156 | (781 | ) | |||||
| Income taxes payable |
— | (68 | ) | |||||
| Current portion of deferred rent |
12 | 10 | ||||||
| Long-term portion of deferred rent |
(22 | ) | (9 | ) | ||||
| Net cash provided by operating activities |
873 | 2,216 | ||||||
| Cash flows used in investing activities: |
||||||||
| Purchases of property and equipment |
(25 | ) | (70 | ) | ||||
| Payments related to acquisition of management contracts |
(2,814 | ) | — | |||||
| Purchases of the Hennessy Micro Cap Growth Fund, LLC |
— | (512 | ) | |||||
| Net cash used in investing activities |
(2,839 | ) | (582 | ) | ||||
| Cash flows used in financing activities: |
||||||||
| Principal payments on long-term debt |
(4,558 | ) | (2,091 | ) | ||||
| Dividend payment |
(517 | ) | (515 | ) | ||||
| Net cash used in financing activities |
(5,075 | ) | (2,606 | ) | ||||
| Net decrease in cash and cash equivalents |
(7,041 | ) | (972 | ) | ||||
| Cash and cash equivalents at the beginning of the year |
12,788 | 13,760 | ||||||
| Cash and cash equivalents at the end of the year |
$ | 5,747 | $ | 12,788 | ||||
| Supplemental disclosures of cash flow information: |
||||||||
| Unrealized loss on investment |
$ | (51 | ) | $ | (95 | ) | ||
| Cash paid for: |
||||||||
| Income taxes |
$ | — | $ | 1,186 | ||||
| Interest |
$ | 99 | $ | 405 | ||||
See accompanying notes to financial statements
39
Table of Contents
Notes to Financial Statements – Fiscal Years Ended September 30, 2009 and 2008
| (1) | Summary of the Organization, Description of Business and Significant Accounting Policies |
| (a) | Organization and Description of Business |
Hennessy Advisors, Inc. (the “Company”) was founded on February 1, 1989, as a California corporation under the name Edward J. Hennessy, Incorporated. In 1990, the Company became a registered investment advisor and on April 15, 2001, the Company changed its name to Hennessy Advisors, Inc.
The operating activities of the Company consist primarily of providing investment management services to ten open-end mutual funds (the Hennessy Funds) and one non-registered private pooled investment fund (the Hennessy Micro Cap Growth Fund). The Company serves as the investment advisor to all classes of the Hennessy Cornerstone Growth Fund, the Hennessy Cornerstone Growth Fund, Series II, the Hennessy Cornerstone Large Growth Fund, the Hennessy Focus 30 Fund, the Hennessy Cornerstone Value Fund, the Hennessy Select Large Value Fund, the Hennessy Select SPARX Japan Fund, the Hennessy Select SPARX Japan Smaller Companies Fund, the Hennessy Total Return Fund, and the Hennessy Balanced Fund; and the Managing Member to the Hennessy Micro Cap Growth Fund, LLC.
| (b) | Cash and Cash Equivalents |
Cash and cash equivalents include all cash balances and highly liquid investments which are readily convertible into cash.
| (c) | Investments |
Investments in highly liquid financial instruments with remaining maturities less than one year are classified as short-term investments. Financial instruments with remaining maturities greater than one year are classified as long-term investments. A table of investments is included in Footnote 14.
Marketable securities classified as available-for-sale are reported at market value, with net unrealized gains or losses recorded in accumulated other comprehensive income (loss), a separate component of stockholders’ equity, until realized. Realized gains and losses on investments are computed based upon specific identification and are included in interest and other income (expense), net. Investments designated as trading securities are stated at fair value, with gains or losses resulting from changes in fair value recognized currently in earnings.
The Company holds investments in publicly traded mutual funds which are accounted for as trading securities. Accordingly, any unrealized gains and losses on the investments are recognized currently in operations.
Dividend income is recorded on the ex-dividend date. Purchases and sales of marketable securities are recorded on a trade date basis, and realized gains and losses recognized on sale are determined on a specific identification/average cost basis.
The Company also holds an investment in the Hennessy Micro Cap Growth Fund, LLC (the “Fund”). The investment is classified as an available-for-sale security, and is included on the balance sheet at market value.
The investment in the Fund represents approximately 18.7% of the total subscriptions in the Fund. The Fund is a limited liability company for which the Company is the Managing Member. The value of the investment at September 30, 2009 was $0.4 million.
40
Table of Contents
| (d) | Management Contracts Acquired |
The Company was appointed as investment advisor to the Hennessy Cornerstone Growth Fund and the Hennessy Cornerstone Value Fund concurrent with its licensing of patented automated investment strategies from Netfolio, Inc. in June 2000.
The initial management contracts acquired were capitalized at $4,190,840. In February of 2002, the Company recorded $918,675 as the incremental value of management contracts acquired in connection with its mergers with Hennessy Management Co. L.P. and Hennessy Management Co. 2 L.P. Until February 28, 2002, the Hennessy Balanced Fund and the Hennessy Total Return Fund were managed by Hennessy Management Co., L.P. and Hennessy Management Co. 2, L.P., respectively, each of which was a California limited partnership. Hennessy Advisors was the general partner of each limited partnership and as general partner, performed all advisory functions on behalf of the partnerships for the funds. In order to consolidate all investment advisory activities directly into Hennessy Advisors, the limited partners of these limited partnerships agreed to merge the partnerships into Hennessy Advisors, subject to the closing of an initial minimum public offering of common stock, which occurred on February 28, 2002. Limited partners received an aggregate of 306,248 shares of common stock and cash of $11,275, in exchange for their partnership interests in the merger, and the Company was appointed advisor to the Hennessy Balanced Fund and the Total Return Fund.
In accordance with the FASB guidance on “Intangibles – Goodwill and Other,” effective June 30, 2001, intangible assets with an indefinite life are not subject to amortization. Accordingly, the Company ceased amortization of the contracts acquired in connection with the mergers of the partnerships as of the effective date.
On September 18, 2003, the Company was appointed investment advisor to the Hennessy Focus 30 Fund, concurrent with the acquisition of all the assets of the SYM Select Growth Fund, which were immediately merged into the Hennessy Focus 30 Fund.
On March 11, 2004, Hennessy Advisors, Inc. completed the acquisition of the management contract for the majority of the mutual fund assets managed by Lindner Asset Management, Inc. (“Lindner”), based in Deerfield, Illinois. In conjunction with the Asset Purchase Agreement, the assets of five of Lindner’s mutual funds were merged into four of the five Hennessy Funds. The purchase price was $7.95 million which equaled 2.625% of the $300 million in assets under management on the closing date. The transaction was funded through a credit facility provided by US Bank, St. Louis, Missouri. The loan agreement required fifty-nine (59) monthly payments in the amount of $94,060 plus interest at the bank’s prime rate which may change from time to time. The final installment of the then outstanding principal and interest was due March 10, 2009, but was extended as described below.
On July 1, 2005, we completed the acquisition of the management contract for The Henlopen Fund from Landis Associates LLC and Michael L. Hershey. We paid $6.7 million, which equaled 2.25% of the $299 million in assets under management at the close of business on June 30, 2005. The purchase price was allocated $5.1 million to the management contract and $1.6 million to a three year non-compete agreement with Michael L. Hershey. The non-compete agreement was amortized on a straight-line basis over three years. The transaction was financed by U.S. Bank National Association. Following completion of the acquisition, we changed the name of The Henlopen Fund to the Hennessy Cornerstone Growth Fund, Series II (symbol HENLX), and began to implement our investment strategy for Series II. The indebtedness we incurred to acquire the management agreement of The Henlopen Fund was rolled into a single loan with the indebtedness we incurred to acquire the management agreements of the Lindner Funds. As of September 30, 2009, we had $1.95 million of principal outstanding under our bank loan, which bears interest at U.S. Bank National Association’s prime rate, as set by U.S. Bank National Association from time to time, less one percent, per a loan amendment dated February 1, 2007. The bank’s prime rate, which may change from time to time, is currently 3.25% (last changed on December 17, 2008), making the current effective interest rate 2.25%. An additional installment of $3.5 million was paid on December 29, 2008, and the loan was amended to require 20 monthly payments in the amount of $68,750 plus interest, with the final installment of the then outstanding principal and interest due on September 30, 2010.
41
Table of Contents
In March and September 2009, respectively, we acquired the management agreements for two funds managed by Royal Bank of Canada’s Voyageur Asset Management Inc. (the Tamarack Large Cap Growth Fund and the Tamarack Value Fund), and we acquired the management agreements for two funds managed by SPARX Investment & Research, USA, Inc. and sub-advised by SPARX Asset Management Co., Ltd. (the SPARX Japan Fund and the SPARX Japan Smaller Companies Fund). We were able to fund these acquisitions from existing cash and did not have to incur any additional debt.
The Company periodically reviews the carrying value of management contracts acquired to determine if any impairment has occurred. The fair value of management contracts are based on management estimates and assumptions, including third-party valuations that utilize appropriate valuation techniques. The fair value of the management contracts was estimated by applying the income approach. It is the opinion of the Company’s management that there was no impairment as of September 30, 2009.
Under the FASB guidance on “Intangibles – Goodwill and Other,” intangible assets that have indefinite useful lives are not amortized but tested at least annually for impairment. The Company reviews the life of the management contracts each reporting period to determine if they continue to have an indefinite useful life. The Company considers the mutual fund management contracts to be intangible assets with an indefinite useful life as of September 30, 2009.
| (e) | Property and Equipment |
Property and equipment are stated at cost less accumulated depreciation. Depreciation is computed using the straight-line method over the estimated useful lives of the assets, generally one to ten years.
| (f) | Fair Value of Financial Instruments |
The FASB guidance on “Disclosures about Fair Value of Financial Instruments” requires disclosures regarding the fair value of all financial instruments for financial statement purposes. The estimates presented in these statements are based on information available to management as of September 30, 2009. Accordingly, the fair value presented in financial statements for the year then ended may not be indicative of amounts that could be realized on disposition of the financial instruments. The fair value of receivables, accounts payable and notes payable has been estimated at carrying value due to the short maturity of these instruments. The fair value of management contracts acquired is estimated at the cost of acquisition. The fair value of marketable securities and money market accounts is based on closing net asset values as reported by securities exchanges registered with the Securities and Exchange Commission.
| (g) | Income Taxes |
Effective October 1, 2007, the Company adopted the FASB guidance on “Accounting for Uncertainty in Income Tax.” It prescribes a recognition threshold and measurement attribute for the financial statement recognition and measurement of uncertain tax positions taken or expected to be taken in a company’s income tax return, and also provides guidance on derecognition, classification, interest and penalties, accounting in interim periods, disclosure, and transition. The FASB guidance utilizes a two-step approach for evaluating uncertain tax positions accounted for in accordance with the FASB guidance. Step one, recognition, requires a company to determine if the weight of available evidence indicates that a tax position is more likely than not to be sustained upon audit, including resolution of related appeals or litigation processes, if any. Step two, measurement, is based on the largest amount of benefit, which is more likely than not to be realized on ultimate settlement. The cumulative effect of adopting the FASB guidance on October 1, 2007 is recognized as a change in accounting principle, recorded as an adjustment to the opening balance of retained earnings on the adoption date. As a result of the implementation of FASB guidance, the Company did not recognize any increase or decrease in the liability for unrecognized tax benefits related to tax positions taken in prior periods, therefore, there was no corresponding adjustment in retained earnings.
42
Table of Contents
Upon adoption of the FASB guidance on “Accounting for Uncertainty in Income Tax,” the Company’s policy to include interest and penalties related to unrecognized tax benefits within the Company’s provision for (benefit from) income taxes, did not change. As of September 30, 2009, the Company did not have any accrual for payment of interest and penalties related to unrecognized tax benefits.
The Company did not have any amounts of unrecognized tax benefits as of October 1, 2007 (adoption date) and September 30, 2009. Also, the Company did not have any amounts of unrecognized tax benefits that, if recognized, would affect its effective tax rate.
The Company files U.S. federal and state tax returns and has determined that its major tax jurisdictions are the United States and California. The tax years ended in 2005 through 2008 remain open and subject to examination by the appropriate governmental agencies in the U.S., and the 2004 through 2008 tax years remain open in California.
The Company’s effective tax rate of 18.2% and 41.5% for the fiscal years ended September 30, 2009 and 2008, respectively, differ from the federal statutory rate of 34% primarily due to the effects of state income taxes.
| (h) | Earnings Per Share |
Basic earnings per share is determined by dividing net earnings by the weighted average number of shares of common stock outstanding, while diluted earnings per share is determined by dividing net earnings by the weighted average number of shares of common stock outstanding adjusted for the dilutive effect of common stock equivalents.
The common stock equivalents were excluded from the loss per share calculation for the fiscal year ended September 30, 2009 as they were anti-dilutive.
| (i) | Authorized Common and Preferred Shares |
Authorized common and preferred shares are 15.0 million and 5.0 million shares, respectively.
| (j) | Stock-Based Compensation |
On May 2, 2001, the Company established an incentive plan (the Plan) providing for the issuance of options, stock appreciation rights, restricted stock, performance awards, and stock loans for the purpose of attracting and retaining executive officers and key employees. The maximum number of shares which may be issued under the Plan is 25% of the outstanding common stock of the Company, subject to adjustment by the compensation committee of the Board of Directors. The 25% limitation does not invalidate any awards made prior to a decrease in the number of outstanding shares, even though such awards have resulted or may result in shares constituting more than 25% of the outstanding shares being available for issuance under the Plan. Shares available under the Plan which are not awarded in one particular year may be awarded in subsequent years. The compensation committee of the Board of Directors has the authority to determine the awards granted under the Plan, including among other things, the individuals who receive the awards, the times when they receive them, vesting schedules, performance goals, whether an option is an incentive or nonqualified option and the number of shares to be subject to each award. However, no participant may receive options or stock appreciation rights under the Plan for an aggregate of more than 75,000 shares in any calendar year. The exercise price and term of each option or stock appreciation right will be fixed by the compensation committee except that the exercise price for each stock option which is intended to qualify as an incentive stock option must be at least equal to the fair market value of the stock on the date of grant and the term of the option cannot exceed 10 years. In the case of an incentive stock option granted to a 10% shareholder, the exercise price must be at least 110%
43
Table of Contents
of the fair market value on the date of grant and cannot exceed five years. Incentive stock options may be granted only within ten years from the date of adoption of the Plan. The aggregate fair market value (determined at the time the option is granted) of shares with respect to which incentive stock options may be granted to any one individual, which stock options are exercisable for the first time during any calendar year, may not exceed $100,000. An optionee may, with the consent of the compensation committee, elect to pay for the shares to be received upon exercise of their options in cash or shares of common stock or any combination thereof.
As the exercise price of all options granted under the Plan was equal to the market price of the underlying common stock on the grant date and all options were granted and fully vested prior to the adoption of the revised FASB guidance on Stock Compensation, no stock-based employee compensation cost related to options granted was recognized in net income. There were no options granted during the fiscal years ended September 30, 2009 and 2008.
Effective October 1, 2005, the Company adopted the fair value recognition provisions of the revised FASB guidance on Stock Compensation under the “Modified Perspective” method in accordance with the transition and disclosure provisions of the codification. All compensation costs related to restricted stock units vested during the years ended September 30, 2009 and 2008 have been recognized in our financial statements.
The Company has reserved up to 1,438,604 options for shares of the Company’s common stock, in accordance with terms of the Plan. An aggregate of 669,050 options have been granted to certain employees, executive officers, and directors of the Company as of September 30, 2009. These options were fully vested at the date of grant, and have a weighted average exercise price of $4.46 per share. Through September 30, 2009, there was no activity, leaving 669,050 options fully vested and exercisable as of that date.
A summary of the status of stock options granted is presented in the following table for the fiscal years ended September 30, 2009 and 2008:
| Number Of Options |
Weighted Avg. Exercise Price |
Weighted Avg. Remaining Contractual Term |
Aggregate Intrinsic Value |
|||||||||
| Outstanding at 9/30/2007 |
676,925 | $ | 4.53 | 5.84 years | $ | 4,419,573 | ||||||
| Granted |
— | — | ||||||||||
| Exercised |
— | — | ||||||||||
| Forfeited |
(7,875 | ) | $ | 10.78 | ||||||||
| Expired |
— | — | ||||||||||
| Outstanding at 9/30/2008 |
669,050 | $ | 4.46 | 4.82 years | $ | 355,511 | ||||||
| Granted |
— | — | ||||||||||
| Exercised |
— | — | ||||||||||
| Forfeited |
— | — | ||||||||||
| Expired |
— | — | ||||||||||
| Outstanding at 9/30/2009 |
669,050 | $ | 4.46 | 3.82 years | $ | (936,352 | ) | |||||
| Exercisable at 9/30/2009 |
669,050 | $ | 4.46 | 3.82 years | $ | (936,352 | ) | |||||
44
Table of Contents
During the years ended September 30, 2009 and 2008, the Company issued restricted stock units (“RSU”) under its 2001 Omnibus Plan. Under the Company’s 2001 Omnibus Plan, participants may be granted RSU’s, representing an unfunded, unsecured right to receive a Company common share on the date specified in the recipient’s award. The Company issues new shares for shares delivered for RSU recipients. The RSU granted under this plan vests over four years at the rate of 25 percent per year. The Company recognizes compensation expense on a straight-line basis over the four-year vesting term of each award. RSU activity for the years ended September 30, 2009 and 2008 was as follows:
| Restricted Stock Unit Activity Years Ended September 30, 2009 and 2008 | ||||||
| Number of Restricted Share Units |
Weighted Avg. Fair Value at Each Date | |||||
| Non-vested Balance at September 30, 2007 |
72,508 | $ | 14.80 | |||
| Granted |
56,500 | $ | 9.48 | |||
| Vested (1) |
(35,099 | ) | $ | 13.06 | ||
| Forfeited |
(5,313 | ) | $ | 12.74 | ||
| Non-vested Balance at September 30, 2008 |
88,596 | $ | 12.26 | |||
| Granted |
61,000 | $ | 2.66 | |||
| Vested (1) |
(53,335 | ) | $ | 9.88 | ||
| Forfeited |
— | — | ||||
| Non-vested Balance at September 30, 2009 |
96,261 | $ | 7.40 | |||
| (1) | The restricted share units vested includes partially vested shares. Shares of common stock have not been issued for the partially vested shares, but the related compensation costs have been expensed. There were 39,356 and 26,891 shares of common stock issued for restricted stock units vested in the fiscal years ended September 30, 2009 and 2008, respectively. |
45
Table of Contents
Restricted Stock Unit Compensation
Year Ended September 30, 2009
| (In Thousands) | ||||
| Total expected compensation expense related to Restricted Stock Units |
$ | 2,242 | ||
| Compensation Expense recognized as of September 30, 2009 |
(1,530 | ) | ||
| Unrecognized compensation expense related to RSU’s at September 30, 2009 |
$ | 712 | ||
As of September 30, 2009, there was $0.7 million of total RSU compensation expense related to non-vested awards not yet recognized which is expected to be recognized over a weighted-average vesting period of 2.5 years.
| (k) | Use of Estimates |
The preparation of financial statements in conformity with accounting principles generally accepted in the United States of America requires management to make estimates and assumptions that affect the reported amounts of assets and liabilities and disclosure of contingent assets and liabilities at the date of the financial statements and the reported amounts of revenues and expenses during the reporting periods. Actual results could differ from those estimates.
| (2) | Investment Advisory Agreements |
Pursuant to investment management agreements (the “Agreements”), the Company provides investment advisory services to all classes of the ten Hennessy Funds. The Agreements are renewable annually based upon approval by a majority of the Funds’ disinterested directors. Additionally, each agreement may be terminated prior to its expiration upon 60 days notice by either the Company or the Fund.
As provided in the Agreements with the ten Hennessy Funds, the Company receives investment advisory fees monthly based on a percentage of the respective Fund’s average daily net assets.
The Company has entered into sub-advisor agreements covering the Select Funds with the same asset management companies that previously managed the Funds. Under these agreements, the sub-advisor is responsible for the investment and re-investment of the assets of the fund, in accordance with the terms of the sub-advisory agreement, the fund’s Prospectus and the fund’s Statement of Additional Information and subject to the direction, supervision and control of Hennessy Advisors, the manager of the Select Funds, and the Trustees of the Select Funds.
In exchange for the sub-advisory services, the Company (not the funds) pays a sub-advisor fee to the sub-advisors, which is based on the amount of each fund’s average daily net assets.
The Company was also appointed the Managing Member of the Hennessy Micro Cap Growth Fund, LLC (the “Fund”). The annual advisory fee for the Hennessy Micro Cap Growth Fund, LLC is 2.0% of the aggregate capital accounts of the members, but no management fee is charged to the capital account of the Managing Member. An additional “incentive allocation” can potentially be earned on any member’s balance, other than the Managing Member, as discussed in Item 1 under “Management Agreements and Fees.”
46
Table of Contents
| (3) | Fair Value Measurement |
As of October 1, 2008, the Company adopted FASB standard “Fair Value Measurements” for all financial assets and liabilities, which establishes a framework for measuring fair value in generally accepted accounting principles, and expands disclosures about fair value measurements. The standard defines fair value as “the price that would be received to sell an asset or paid to transfer a liability in an orderly transaction between market participants at the measurement date.” It also establishes a fair value hierarchy consisting of the following three “levels” that prioritize the inputs to the valuation techniques used to measure fair value:
| • | Level 1 – quoted market prices in active markets for identical assets or liabilities that are accessible at the measurement date. |
| • | Level 2 – from other than quoted market prices that are observable for the asset or liability, either directly or indirectly (namely, similar assets or from markets that are not active). |
| • | Level 3 – unobservable and shall be used to measure fair value to the extent that observable inputs are not available (namely, reflecting an entity’s own assumptions). |
Based on the standard’s definitions, the following table represents the Company’s financial assets categorized in the level 1 to 3 hierarchy as of September 30, 2009:
| Fair Value Measurements at Reporting Date Using (amounts in thousands) | ||||||||||||
| Level 1 | Level 2 | Level 3 | Total | |||||||||
| Money market fund deposits |
$ | 4,815 | $ | — | $ | — | $ | 4,815 | ||||
| Mutual fund investments |
5 | — | — | 5 | ||||||||
| Investment in domestic equities |
366 | — | — | 366 | ||||||||
| Total |
$ | 5,186 | $ | — | $ | — | $ | 5,186 | ||||
| Amounts included in: |
||||||||||||
| Cash and cash equivalents |
$ | 4,815 | $ | — | $ | — | $ | 4,815 | ||||
| Investments in marketable securities |
5 | — | — | 5 | ||||||||
| Investment in the Hennessy Micro Cap Fund |
366 | — | — | 366 | ||||||||
| Total |
$ | 5,186 | $ | — | $ | — | $ | 5,186 | ||||
47
Table of Contents
| (4) | Investments |
The cost, gross unrealized gains, gross unrealized losses, and fair market value of our trading investment at the years ended September 30 are as follows:
| Cost | Gross Unrealized Gains |
Gross Unrealized Losses |
Total | ||||||||||
| (in thousands) | |||||||||||||
| 2009 |
|||||||||||||
| Mutual fund investments |
$ | 5 | $ | 1 | $ | (1 | ) | $ | 5 | ||||
| Total |
$ | 5 | $ | 1 | $ | (1 | ) | $ | 5 | ||||
| 2008 |
|||||||||||||
| Mutual fund investments |
$ | 6 | $ | 1 | $ | (2 | ) | $ | 5 | ||||
| Total |
$ | 6 | $ | 1 | $ | (2 | ) | $ | 5 | ||||
The mutual fund investments are included as a separate line item in current assets on the balance sheets.
The cost, gross unrealized gains, gross unrealized losses, and fair market value of our available-for-sale investment at the years ended September 30 are as follows:
| Cost | Gross Unrealized Gains |
Gross Unrealized Losses |
Total | ||||||||||
| (in thousands) | |||||||||||||
| 2009 |
|||||||||||||
| Investment in the Hennessy Micro Cap Fund |
$ | 417 | $ | 104 | $ | (155 | ) | $ | 366 | ||||
| Total |
$ | 417 | $ | 104 | $ | (155 | ) | $ | 366 | ||||
| 2008 |
|||||||||||||
| Investment in the Hennessy Micro Cap Fund |
$ | 512 | $ | 5 | $ | (100 | ) | $ | 417 | ||||
| Total |
$ | 512 | $ | 5 | $ | (100 | ) | $ | 417 | ||||
The investment in the Hennessy Micro Cap Fund is included as a separate line item in non-current assets on the balance sheets.
| (5) | Property and Equipment |
Property and equipment were comprised of the following at the fiscal years ended:
| September 30, | ||||||
| 2009 | 2008 | |||||
| Leasehold improvements |
$ | 128,207 | $ | 128,207 | ||
| Furniture and fixtures |
145,394 | 145,394 | ||||
| Equipment |
251,832 | 243,049 | ||||
| IT Infrastructure |
46,538 | 46,538 | ||||
| Software |
16,312 | 12,010 | ||||
| 588,283 | 575,198 | |||||
| Less: accumulated depreciation |
366,577 | 273,977 | ||||
| $ | 221,706 | $ | 301,221 | |||
48
Table of Contents
| (6) | Acquisition Cost |
The organization costs related to the Company’s acquisition of management contracts are capitalized as incurred. The management contract asset was $22.2 million as of September 30, 2009 compared to $19.4 million at the end of the prior comparable period. The costs are defined as an ‘intangible asset’ per FASB standard “Intangibles – Goodwill and Other.” The organization costs include legal fees, shareholder vote fees and percent of asset costs to acquire the management contracts. In March and September 2009, respectively, we acquired the management agreements for two funds managed by Royal Bank of Canada’s Voyageur Asset Management Inc. (the Tamarack Large Cap Growth Fund and the Tamarack Value Fund), and we acquired the management agreements for two funds managed by SPARX Investment & Research, USA, Inc. and sub-advised by SPARX Asset Management Co., Ltd. (the SPARX Japan Fund and the SPARX Japan Smaller Companies Fund). The acquisition costs related to these transactions were included in the management contract asset as of September 30, 2009.
| (7) | Bank Loan |
On March 11, 2004, Hennessy Advisors, Inc. secured financing from US Bank National Association to acquire the management contracts for certain Lindner funds. The loan agreement required fifty-nine (59) monthly payments in the amount of $94,060 plus interest at the bank’s prime rate as it may change from time to time and was secured by the Company’s assets. On July 1, 2005, the loan was amended to provide an additional $6.7 million to fund acquisition of the management contract for the Henlopen Fund. An additional installment of $3.5 million was paid on December 29, 2008, and the loan was amended to require 20 monthly payments in the amount of $68,750 plus interest at the bank’s prime rate (currently 3.25%, in effect since December 17, 2008) less one percent (effective interest rate of 2.25%) and is secured by the Company’s assets. The final installment of the then outstanding principal and its interest are due September 30, 2010. The loan balance is $1.95 million as of September 30, 2009 compared to $6.51 million at the end of the prior comparable period.
The loan agreement includes certain reporting requirements and loan covenants requiring the maintenance of certain financial ratios. The bank waived the Event of Default caused by the Company’s noncompliance with Sections 5.01(o)(ii) (Minimum Consolidated Fixed Charge Coverage Ratio) and 5.01(o)(iii) (Maximum Consolidated Debt to Consolidated EBITDA Ratio) of the loan agreement for the quarterly reporting period ended September 30, 2009. Therefore, we are in compliance with our loan covenants as of September 30, 2009.
In connection with securing the financing discussed above, Hennessy Advisors, Inc. incurred loan costs in the amount of $101,110. These costs are included in other assets and the unamortized balance of $85,289 (as of the loan amendment date of July 1, 2005) is being amortized on a straight-line basis over 64 months. Amortization expense during the fiscal year ended September 30, 2009 was $15,992 compared to $15,992 for the prior comparable period.
49
Table of Contents
| (8) | Income Taxes |
The provision for income taxes is comprised of the following for the years ended September 30, 2009 and 2008:
| 2009 | 2008 | ||||||
| Current: |
|||||||
| Federal |
$ | (445,700 | ) | $ | 533,700 | ||
| State |
3,200 | 185,800 | |||||
| (442,500 | ) | 719,500 | |||||
| Deferred: |
|||||||
| Federal |
407,900 | 380,100 | |||||
| State |
(9,000 | ) | 44,300 | ||||
| 398,900 | 424,400 | ||||||
| $ | (43,600 | ) | $ | 1,143,900 | |||
The principal reasons for the differences from the federal statutory rate of 34% are as follows:
| 2009 | 2008 | |||||
| Federal tax at statutory rate |
34.00 | % | 34.00 | % | ||
| State tax at statutory rate |
5.83 | 5.83 | ||||
| Permanent differences |
(18.83 | ) | 1.53 | |||
| Other |
(2.76 | ) | 0.15 | |||
| Income tax provision |
18.24 | % | 41.52 | % | ||
The tax effects of temporary differences that give rise to significant portions of deferred tax assets and liabilities as of September 30, 2009 and 2008 are presented below:
| 2009 | 2008 | |||||||
| Current deferred tax assets: |
||||||||
| Accrued compensation |
$ | 160,200 | $ | 151,500 | ||||
| Accrued rent |
1,500 | 10,300 | ||||||
| State taxes |
— | 63,200 | ||||||
| Net operating loss |
71,700 | — | ||||||
| Other |
7,200 | — | ||||||
| Total deferred tax assets |
240,600 | 225,000 | ||||||
| Noncurrent deferred tax liabilities: |
||||||||
| Property and equipment |
(21,800 | ) | (58,600 | ) | ||||
| Management contracts |
(2,585,100 | ) | (1,969,900 | ) | ||||
| Total deferred tax liabilities |
(2,606,900 | ) | (2,028,500 | ) | ||||
| Net deferred tax liabilities |
$ | (2,366,300 | ) | $ | (1,803,500 | ) | ||
50
Table of Contents
The components giving rise to the net deferred tax liabilities described above have been included in the accompanying balance sheets as of September 30, 2009 and 2008, as follows:
| 2009 | 2008 | |||||||
| Current assets |
$ | 240,600 | $ | 225,000 | ||||
| Noncurrent assets |
— | — | ||||||
| Current liabilities |
— | — | ||||||
| Noncurrent liabilities |
(2,606,900 | ) | (2,028,500 | ) | ||||
| Net deferred tax liabilities |
$ | (2,366,300 | ) | $ | (1,803,500 | ) | ||
| (9) | Earnings Per Share |
The weighted average common shares outstanding used in the calculation of basic earnings per share and weighted average common shares outstanding, adjusted for common stock equivalents, used in the computation of diluted earnings per share were as follows for the years ended:
| September 30, | ||||
| 2009 | 2008 | |||
| Weighted average common stock outstanding |
5,673,628 | 5,648,584 | ||
| Common stock equivalents - stock options and RSU’s |
— | 99,695 | ||
| 5,673,628 | 5,748,279 | |||
There were common stock equivalents excluded from the earnings per share calculation for the year ended September 30, 2009 as they were anti-dilutive.
| (10) | Reclassification of Prior Period’s Statements |
Certain items previously reported have been reclassified to conform with the current year’s presentation. These reclassifications have no material impact on previously reported results of operations or cash flows.
| (11) | Commitments and Contingencies |
The Company’s headquarters is located in leased office space under a single non-cancelable operating lease at 7250 Redwood Blvd., Suite 200, in Novato, California. The initial lease expires October 31, 2010 with one five-year extension available thereafter. The minimum future rental commitment under this lease as of September 30, 2009 is $370,656 per year in the base year of 2006 with a three percent increase each year until October 31, 2015, the end of the available extension.
The Company’s portfolio trading operation is located in leased office space under a non-cancelable operating lease at One Landmark Square, Suite 424, in Stamford Connecticut. The lease expires September 30, 2011. The minimum future rental commitment under this lease as of September 30, 2009 is $102,200 for the remaining two years of the lease.
51
Table of Contents
The annual minimum future rental commitments under these leases as of September 30, 2009 and for future fiscal years ending September 30, 2014 are as follows:
| Fiscal Year |
Amount | |||||
| Novato Lease | Stamford Lease | |||||
| 2010 |
428,649 | 50,400 | ||||
| 2011 |
35,808 | 51,800 | ||||
| 2012 |
— | — | ||||
| 2013 |
— | — | ||||
| 2014 |
— | — | ||||
| Total |
$ | 464,457 | $ | 102,200 | ||
| (12) | Concentration of Credit Risk |
The Company maintains its cash accounts with three commercial banks which, at times, may exceed federally insured limits. The amount on deposit at September 30, 2009 exceeded the insurance limits of the Federal Deposit Insurance Corporation by approximately $748,000. In addition, total cash and cash equivalents include $4,705,002 held in the First American Prime Obligations Fund which is not federally insured. The Company believes it is not exposed to any significant credit risk on cash and cash equivalents.
| (13) | New Accounting Pronouncements |
In September, 2006, the FASB issued new standard “Fair Value Measurements,” which is effective for our fiscal year 2009. In February, 2008, the FASB issued a new standard which delayed the effective date for all non-financial assets and liabilities, except those that are recognized or disclosed at fair value in the financial statements on a recurring basis, to the fiscal year beginning after November 15, 2008 (our fiscal year 2010). The Company adopted the fair value measurement for all financial assets and liabilities as of October 1, 2008, as discussed in Footnote 3. We do not expect the full adoption of the new standard to have an effect on our financial statements or results of operations.
In August, 2009, the FASB issued amended standards for the fair value measurement of liabilities. These amended standards clarify that in circumstances in which a quoted price in an active market for the identical liability is not available, we are required to use the quoted price of the identical liability when traded as an asset, quoted prices for similar liabilities, or quoted prices for similar liabilities when traded as assets. If these quoted prices are not available, we are required to use another valuation technique, such as an income approach or a market approach. These amended standards are effective for our first quarter of fiscal year 2010. We do not anticipate the adoption of these amendments to have any effect on our financial statements or results of operations.
In June, 2009, the FASB issued amended standards for determining whether to consolidate a variable entity. These amended standards eliminate a mandatory quantitative approach to determine whether a variable interest gives the entity a controlling financial interest in a variable interest entity in favor of a qualitatively focused analysis, and require an ongoing reassessment of whether an entity is the primary beneficiary. These amended standards are effective for the annual period beginning after November 15, 2009 (the Company’s fiscal year 2011). We do not anticipate the adoption of these amendments to have any effect on our financial statements or results of operations.
52
Table of Contents
| (14) | Quarterly Financial Data Schedule (Unaudited) |
| Hennessy Advisors. Inc. Quarterly Financial Data (In thousands, except per share amounts) |
||||||||||||||||||||
| Year Ended September 30, 2009 | ||||||||||||||||||||
| 12/31/08 | 3/31/09 | 6/30/09 | 9/30/09 | Fiscal Year | ||||||||||||||||
| Revenue |
$ | 1,398 | $ | 1,194 | $ | 1,568 | $ | 1,653 | $ | 5,813 | ||||||||||
| Operating expense |
1,471 | 1,389 | 1,495 | 1,648 | 6,003 | |||||||||||||||
| Operating income (loss) |
(73 | ) | (195 | ) | 73 | 5 | (190 | ) | ||||||||||||
| Interest expense |
49 | 13 | 13 | 12 | 87 | |||||||||||||||
| Other (income) expense, net |
(22 | ) | (2 | ) | (7 | ) | (7 | ) | (38 | ) | ||||||||||
| Income (loss) before income tax expense |
(100 | ) | (206 | ) | 67 | — | (239 | ) | ||||||||||||
| Income tax expense (benefit) |
(26 | ) | (73 | ) | 44 | 11 | (44 | ) | ||||||||||||
| Net income (loss) |
(74 | ) | (133 | ) | 23 | (11 | ) | (195 | ) | |||||||||||
| Earnings (loss) per share: |
||||||||||||||||||||
| Basic |
$ | (0.01 | ) | $ | (0.02 | ) | $ | — | $ | — | $ | (0.03 | ) | |||||||
| Diluted |
(0.01 | ) | (0.02 | ) | — | — | (0.03 | ) | ||||||||||||
| Year Ended September 30, 2008 | ||||||||||||||||||||
| 12/31/07 | 3/31/08 | 6/30/08 | 9/30/08 | Fiscal Year | ||||||||||||||||
| Revenue |
$ | 3,341 | $ | 2,455 | $ | 2,318 | $ | 2,161 | $ | 10,275 | ||||||||||
| Operating expense |
2,171 | 1,747 | 1,722 | 1,899 | 7,539 | |||||||||||||||
| Operating income |
1,170 | 708 | 596 | 262 | 2,736 | |||||||||||||||
| Interest expense |
140 | 102 | 77 | 69 | 388 | |||||||||||||||
| Other (income) expense, net |
(144 | ) | (108 | ) | (84 | ) | (71 | ) | (407 | ) | ||||||||||
| Income before income tax expense |
1,174 | 714 | 603 | 264 | 2,755 | |||||||||||||||
| Income tax expense |
478 | 294 | 263 | 109 | 1,144 | |||||||||||||||
| Net income |
696 | 420 | 340 | 155 | 1,611 | |||||||||||||||
| Earnings per share: |
||||||||||||||||||||
| Basic |
$ | 0.12 | $ | 0.08 | $ | 0.06 | $ | 0.03 | $ | 0.29 | ||||||||||
| Diluted |
0.12 | 0.07 | 0.06 | 0.03 | 0.28 | |||||||||||||||
| (15) | Subsequent Event |
The Company has evaluated all events or transactions that occurred after September 30, 2009 up through December 4, 2009, the date we issued these financial statements. During this period, the Company did not have any material recognizable and nonrecognizable subsequent events.
| ITEM 9. | CHANGES IN AND DISAGREEMENTS WITH ACCOUNTANTS ON ACCOUNTING AND FINANCIAL DISCLOSURE |
None.
53
Table of Contents
| ITEM 9A. | CONTROLS AND PROCEDURES |
Evaluation of Disclosure Controls and Procedures
Under the supervision and with the participation of the Company’s management, including the Company’s principal executive officer and principal financial officer, the Company conducted an evaluation of its disclosure controls and procedures, as such term is defined under Rule 13a-15(e) promulgated under the Securities Exchange Act of 1934, as amended, as of the end of the period covered by this report. Based on such evaluation, the Company’s principal executive officer and principal financial officer have concluded that the Company’s disclosure controls and procedures are effective.
Changes in Internal Controls
There have been no changes in internal control over financial reporting that occurred during the fourth quarter of fiscal year 2009 that have materially affected, or are reasonably likely to materially affect, our internal control over financial reporting.
Management Report on Internal Control over Financial Reporting
For the Company’s Management Report on Internal Control over Financial Reporting, see Item 8 of this Annual Report on Form 10-K.
| ITEM 9B. | OTHER INFORMATION |
None
PART III
| ITEM 10. | DIRECTORS, EXECUTIVE OFFICERS AND CORPORATE GOVERNANCE |
Information required by the Item regarding the executive officers and directors of the Company, Section 16 compliance and the members of the Audit Committee and the Audit Committee financial expert can be found in the Company’s Proxy Statement for its 2010 Annual Meeting (“Proxy Statement”), under the captions “Election of Directors” and “Executive Officers,” respectively. Such information is incorporated by reference as if fully set forth herein.
On July 1, 2005, Hennessy Advisors, Inc. adopted an expanded code of ethics that applies to the principal executive officer, principal financial officer, executive vice presidents and all other employees. The code has been designed in accordance with expanded provisions of the Sarbanes-Oxley Act of 2002, to promote honest and ethical conduct. The code also applies to Hennessy Mutual Funds, Inc. and Hennessy Funds, and was amended in July, 2005 to include the Hennessy Funds Trust. The revised code is posted on our website at www.hennessyadvisors.com and all future amendments to and waivers from the code will be posted there.
Any person may obtain a copy of the Hennessy Advisors, Inc. Code of Ethics, at no cost, by forwarding a written request to:
Hennessy Advisors, Inc.
7250 Redwood Blvd., Suite #200
Novato, CA 94945
Attention: Teresa Nilsen
54
Table of Contents
| ITEM 11. | EXECUTIVE COMPENSATION |
Information required by the Item regarding compensation paid by the Company to its directors and its “named executive officers” in 2009 can be found in the Proxy Statement under the caption “Executive Compensation.” Such information is incorporated by reference as if fully set forth herein.
| ITEM 12. | SECURITY OWNERSHIP OF CERTAIN BENEFICIAL OWNERS AND MANAGEMENT AND RELATED STOCKHOLDER MATTERS. |
Information required by the Item regarding the principal securities holders of the Company and the security holdings of its directors and executive officers can be found in the Proxy Statement under the caption “Voting Securities.” Such information is incorporated by reference as if fully set forth herein.
SECURITIES AUTHORIZED FOR ISSUANCE UNDER EQUITY COMPENSATION PLANS
The Company has adopted an Option Plan (the “Plan”) providing for the issuance of up to 1,438,604 options for shares of the Company’s common stock. An aggregate of 865,689 options for the Company’s common stock and 224,050 RSU’s have been granted as of September 30, 2009, to certain employees, executive officers, and directors of the Company. The options were fully vested when granted, and have a weighted average exercise price of $4.50 per share, and RSU’s vest 25% per year over four-years, and have a weighted average exercise price of zero per share. As of the fiscal year ended September 30, 2009, employees had exercised 196,639 options, 19,688 options were forfeited, 5,313 RSU’s were forfeited and 64,137 net shares of common stock were issued for the vesting of 99,258 RSU’s (net of shares repurchased for tax withholding). There were 669,050 options fully vested and exercisable and 138,588 RSU’s for stock not yet issued at year-end.
The following table sets forth information regarding our equity incentive plan. All information presented is as of September 30, 2009. We do not have any equity compensation plans that have not been approved by our shareholders:
| Plan Category |
Number of securities to be issued upon exercise of outstanding options, warrants and rights (2) |
Weighted-average exercise price of outstanding options, warrants and rights (2) |
Number of securities remaining for issuance under compensation plans (excluding securities reflected in column (a)) (1) | ||||
| (a) | (b) | (c) | |||||
| Equity compensation plans approved by security holders |
807,638 | $ | 3.69 | 348,865 | |||
| Equity compensation plans not approved by security holders |
0 | 0 | 0 | ||||
| Total |
807,638 | $ | 3.69 | 348,865 | |||
| (1) | The maximum number of shares of common stock that may be issued under our equity incentive plan is 25% of our outstanding common stock, or 1,438,604 shares, as of the fiscal year ended September 30, 2009. |
55
Table of Contents
| (2) | The number of securities to be issued includes 138,588 shares relating to RSU’s to be issued according to the vesting schedule of 25% per year. The exercise price for RSU’s is zero, which is included in the weighted average exercise price of outstanding securities. |
| ITEM 13. | CERTAIN RELATIONSHIPS, RELATED TRANSACTIONS AND DIRECTOR INDEPENDENCE |
Information required by the Item regarding the Company’s related person transactions and director independence can be found in the Proxy Statement under the caption “Election of Directors.” Such information is incorporated by reference as if fully set forth herein.
| ITEM 14. | PRINCIPAL ACCOUNTANT FEES AND SERVICES |
For a summary of the fees billed to the Company by Stonefield Josephson, Inc. for professional services performed for 2009 and 2008, please see the Proxy Statement under the caption “Independent Certified Public Accountants.” Such information is incorporated by reference as if fully set forth herein.
PART IV
| ITEM 15. | EXHIBITS AND FINANCIAL STATEMENT SCHEDULES |
The financial statements and financial statement schedules for Hennessy Advisors, Inc. are included under Item 8 of this Annual Report on Form 10-K.
| Exhibits |
||
| 2.1 |
Form of Agreement of Merger of Hennessy Advisors, Inc., Hennessy Management Co., L.P. and Hennessy Management Co. 2, L.P. (1) | |
| 2.2 |
Asset Purchase Agreement, dated September 10, 2003, between registrant and Linder Asset Management, Inc., as amended by First Amendment, dated January 19, 2004 (4) | |
| 2.3 |
Asset Purchase Agreement, dated March 15, 2005, between registrant and Landis Associates LLC (5) | |
| 2.4 |
Asset Purchase Agreement, dated March 15, 2005, between registrant and Michael L. Hershey (5) | |
| 2.5 |
Asset Purchase Agreement, dated December 9, 2008, between registrant and Voyageur Asset Management Inc. (6)* | |
| 2.6 |
Asset Purchase Agreement, dated December 9, 2008, between registrant and Voyageur Asset Management Inc. (6)* | |
| 3.1 |
Amended and Restated Articles of Incorporation (1) | |
| 3.2 |
Second Amended and Restated Bylaws (3) | |
| 10.1 |
Restated Management Agreement, dated June 30, 2000, between registrant and Hennessy Mutual Funds, Inc. (on behalf of the Hennessy Cornerstone Growth Fund, the Hennessy Cornerstone Value Fund and the Hennessy Focus 30 Fund)(1) | |
56
Table of Contents
| 10.2 |
License Agreement, dated April 10, 2000, between Edward J. Hennessy, Inc. And Netfolio, Inc. (1) | |
| 10.3 |
Hennessy Advisors, Inc. 2001 Omnibus Plan (1) (2) | |
| 10.4 |
Form of Option Award Agreement (1) (2) | |
| 10.5 |
Employment Agreement of Neil J. Hennessy (1) (2) | |
| 10.6 |
Amended and Restated Loan Agreement between the registrant and U.S. Bank National Association, dated July 1, 2005 (7) | |
| 10.7 |
Restated Investment Advisory Agreement, dated February 28, 2002, between the registrant and The Hennessy Funds, Inc. (on behalf of the Hennessy Total Return Fund) (7) | |
| 10.8 |
Restated Investment Advisory Agreement, dated February 28, 2002, between the registrant and The Hennessy Funds, Inc. (on behalf of the Hennessy Balanced Fund) (7) | |
| 10.9 |
Investment Advisory Agreement, dated July 1, 2005, between the registrant and Hennessy Funds Trust (on behalf of the Hennessy Cornerstone Growth Fund, Series II) (7) | |
| 10.10 |
Servicing Agreement, dated October 1, 2002, between the registrant and The Hennessy Mutual Funds, Inc. (on behalf of the Hennessy Cornerstone Growth Fund, the Hennessy Cornerstone Value Fund and the Hennessy Focus 30 Fund)(7) | |
| 10.10(a) |
Amendment to Servicing Agreement, dated June 30, 2005, between the registrant and The Hennessy Mutual Funds, Inc. with respect to the Hennessy Focus 30 Fund (7) | |
| 10.11 |
Servicing Agreement, dated July 1, 2005 between the registrant and Hennessy Funds Trust (on behalf of the Hennessy Cornerstone Growth Fund, the Hennessy Cornerstone Value Fund, the Hennessy Focus 30 Fund, the Hennessy Cornerstone Large Growth Fund and the Hennessy Select Large Value Fund) (7) | |
| 10.12 |
Non-Competition Agreement, dated March 15, 2005, between the registrant and Michael L. Hershey (5) | |
| 10.13 |
Amendment No. 1, dated August 28, 2006, to Employment Agreement between Hennessy Advisors, Inc. and Neil J. Hennessy (2) (9) | |
| 10.14 |
Restricted Stock Unit Award Agreement for officers (2) (8) | |
| 10.15 |
Restricted Stock Unit Agreement for Directors (2) (8) | |
| 10.16 |
Bonus Agreement, dated August 28, 2006, between Hennessy Advisors, Inc. and Teresa M. Nilsen (2) (9) | |
| 10.17 |
Bonus Agreement, dated August 28, 2006, between Hennessy Advisors, Inc. and Daniel B. Steadman (2) (9) | |
| 10.18 |
Amendment No. 2, dated December 18, 2008, to Employment Agreement between Hennessy Advisors, Inc. and Neil J. Hennessy (2) (10) | |
| 10.19 |
Amendment No. 3, dated September 3, 2009, to Employment Agreement between Hennessy Advisors, Inc. and Neil J. Hennessy (2) (11) | |
| 10.20 |
First Amendment to Amended and Restated Loan Agreement between the registrant and U.S. Bank National Association (10) | |
| 10.21 |
Second Amendment to Amended and Restated Loan Agreement between the registrant and U.S. Bank National Association (10) | |
57
Table of Contents
| 10.22 |
Third Amendment to Amended and Restated Loan Agreement between the registrant and U.S. Bank National Association (10) | |
| 10.23 |
Fourth Amendment to Amended and Restated Loan Agreement between the registrant and U.S. Bank National Association (10) | |
| 10.24 |
Fifth Amendment to Amended and Restated Loan Agreement between the registrant and U.S. Bank National Association (10) | |
| 10.25 |
Investment Advisory Agreement, dated March 23, 2009, between the registrant and Hennessy Funds Trust (on behalf of the Hennessy Cornerstone Large Growth Fund) | |
| 10.26 |
Investment Advisory Agreement, dated March 23, 2009, between the registrant and Hennessy Funds Trust (on behalf of the Hennessy Select Large Value Fund) | |
| 10.27 |
Sub-Advisory Agreement, dated March 23, 2009, between the registrant and Voyageur Asset Management, Inc. (on behalf of the Hennessy Select Large Value Fund) | |
| 10.28 |
Investment Advisory Agreement, dated September 18, 2009, between the registrant and Hennessy SPARX Funds Trust (on behalf of the Hennessy Select SPARX Japan Fund and the Hennessy Select SPARX Japan Smaller Companies Fund) | |
| 10.29 |
Sub-Advisory Agreement, dated September 18, 2009, between the registrant and SPARX Management Co., Ltd. (on behalf of the Hennessy Select SPARX Japan Fund and the Hennessy Select SPARX Japan Smaller Companies Fund) | |
| 23.1 |
Consent of Stonefield Josephson, Inc., Independent Registered Public Accounting Firm | |
| 31.1 |
Rule 13a – 14a Certification of the Chief Executive Officer | |
| 31.2 |
Rule 13a – 14a Certification of the Chief Financial Officer | |
| 32.1 |
Written Statement of the Chief Executive Officer, Pursuant to 18 U.S.C. § 1350 | |
| 32.2 |
Written Statement of the Chief Financial Officer, Pursuant to 18 U.S.C. § 1350 | |
Notes:
| * | The related schedules to the agreement are not being filed herewith. The registrant agrees to furnish supplementally a copy of any such schedules to the Securities and Exchange Commission upon request. |
| (1) | Incorporated by reference from the Company’s Form SB-2 registration statement (SEC File No. 333-66970). |
| (2) | Management contract or compensatory plan or arrangement. |
| (3) | Incorporated by reference from the Company’s Form 8-K (SEC File No. 000-49872) filed July 29, 2005. |
| (4) | Incorporated by reference from the Company’s Form 10-KSB for the fiscal year ended September 30, 2004. |
| (5) | Incorporated by reference from the Company’s Form 10-QSB for the quarter ended March 31, 2005. |
| (6) | Incorporated by reference from the Company’s Form 8-K (SEC File No. 000-49872) filed December 12, 2008. |
| (7) | Incorporated by reference from the Company’s Form S-1 registration statement filed July 26, 2005 (SEC File No. 333-126896). |
58
Table of Contents
| (8) | Incorporated by reference from the Company’s Form 10-QSB for the quarter ended March 31, 2006. |
| (9) | Incorporated by reference from the Company’s Form 8-K (SEC File No. 000-49872) filed August 28, 2006. |
| (10) | Incorporated by reference from the Company’s Form 10-Q for the quarter ended December 31, 2008. |
| (11) | Incorporated by reference from the Company’s Form 8-K (SEC File No. 000-49872) filed September 9, 2009. |
59
Table of Contents
Pursuant to the requirements of Section 13 or 15(d) of the Securities Exchange Act of 1934, the Registrant has duly caused this report to be signed on its behalf by the undersigned, as duly authorized:
Hennessy Advisors, Inc.
(Registrant)
| By: | /S/ NEIL J. HENNESSY |
Dated: December 4, 2009 | ||||
| Neil J. Hennessy | ||||||
| Chief Executive Officer and President | ||||||
| (As a duly authorized Officer on behalf of the Registrant and as Principal Executive Officer and Chairman of the Board of Directors) |
Pursuant to the requirements of the Securities Exchange Act of 1934, this report has been signed below by the following persons on behalf of the registrant and in the capacities and on the dates indicated:
| By: | /S/ TERESA M. NILSEN |
Dated: December 4, 2009 | ||||
| Teresa M. Nilsen | ||||||
| Chief Financial Officer, Secretary and Director | ||||||
| By: | /S/ DANIEL B. STEADMAN |
Dated: December 4, 2009 | ||||
| Daniel B. Steadman | ||||||
| Executive Vice President and Director | ||||||
| By: | /S/ KATHRYN R. WALWYN |
Dated: December 4, 2009 | ||||
| Kathryn R. Walwyn | ||||||
| Controller | ||||||
| By: | /S/ CHARLES W. BENNETT |
Dated: December 4, 2009 | ||||
| Charles W. Bennett | ||||||
| Director | ||||||
| By: | /S/ DANIEL G. LIBARLE |
Dated: December 4, 2009 | ||||
| Daniel G. Libarle | ||||||
| Director | ||||||
| By: | /S/ THOMAS L. SEAVEY |
Dated: December 4, 2009 | ||||
| Thomas L. Seavey | ||||||
| Director | ||||||
| By: | /S/ HENRY HANSEL |
Dated: December 4, 2009 | ||||
| Henry Hansel | ||||||
| Director | ||||||
| By: | /S/ BRIAN A. HENNESSY |
Dated: December 4, 2009 | ||||
| Brian A. Hennessy | ||||||
| Director | ||||||
| By: | /S/ RODGER OFFENBACH |
Dated: December 4, 2009 | ||||
| Rodger Offenbach | ||||||
| Director | ||||||
60
Table of Contents
Exhibit Index
Set forth below is a listing of all exhibits to this Annual Report on Form 10-K, including those incorporated by reference.
Exhibits
| 2.1 | Form of Agreement of Merger of Hennessy Advisors, Inc., Hennessy Management Co., L.P. and Hennessy Management Co. 2, L.P. (1) | |
| 2.2 | Asset Purchase Agreement, dated September 10, 2003, between registrant and Linder Asset Management, Inc., as amended by First Amendment, dated January 19, 2004 (4) | |
| 2.3 | Asset Purchase Agreement, dated March 15, 2005, between registrant and Landis Associates LLC (5) | |
| 2.4 | Asset Purchase Agreement, dated March 15, 2005, between registrant and Michael L. Hershey (5) | |
| 2.5 | Asset Purchase Agreement, dated December 9, 2008, between registrant and Voyageur Asset Management Inc. (6) | |
| 2.6 | Asset Purchase Agreement, dated December 9, 2008, between registrant and Voyageur Asset Management Inc. (6) | |
| 3.1 | Amended and Restated Articles of Incorporation (1) | |
| 3.2 | Second Amended and Restated Bylaws (3) | |
| 10.1 | Restated Management Agreement, dated June 30, 2000, between registrant and Hennessy Mutual Funds, Inc. (on behalf of the Hennessy Cornerstone Growth Fund, the Hennessy Cornerstone Value Fund and the Hennessy Focus 30 Fund) (1) | |
| 10.2 | License Agreement, dated April 10, 2000, between Edward J. Hennessy, Inc. And Netfolio, Inc. (1) | |
| 10.3 | Hennessy Advisors, Inc. 2001 Omnibus Plan (1) (2) | |
| 10.4 | Form of Option Award Agreement (1) (2) | |
| 10.5 | Employment Agreement of Neil J. Hennessy (1) (2) | |
| 10.6 | Amended and Restated Loan Agreement between the registrant and U.S. Bank National Association, dated July 1, 2005 (7) | |
| 10.7 | Restated Investment Advisory Agreement, dated February 28, 2002, between the registrant and The Hennessy Funds, Inc. (on behalf of the Hennessy Total Return Fund) (7) | |
| 10.8 | Restated Investment Advisory Agreement, dated February 28, 2002, between the registrant and The Hennessy Funds, Inc. (on behalf of the Hennessy Balanced Fund) (7) | |
| 10.9 | Investment Advisory Agreement, dated July 1, 2005, between the registrant and Hennessy Funds Trust (on behalf of the Hennessy Cornerstone Growth Fund, Series II) (7) | |
| 10.10 | Servicing Agreement, dated October 1, 2002, between the registrant and The Hennessy Mutual Funds, Inc. (on behalf of the Hennessy Cornerstone Growth Fund, the Hennessy Cornerstone Value Fund and the Hennessy Focus 30 Fund) (7) | |
61
Table of Contents
| 10.10 (a) | Amendment to Servicing Agreement, dated June 30, 2005, between the registrant and The Hennessy Mutual Funds, Inc. with respect to the Hennessy Focus 30 Fund (7) | |
| 10.11 | Servicing Agreement, dated July 1, 2005 between the registrant and Hennessy Funds Trust (on behalf of the Hennessy Cornerstone Growth Fund, the Hennessy Cornerstone Value Fund, the Hennessy Focus 30 Fund, the Hennessy Cornerstone Large Growth Fund and the Hennessy Select Large Value Fund) (7) | |
| 10.12 | Non-Competition Agreement, dated March 15, 2005, between the registrant and Michael L. Hershey (5) | |
| 10.13 | Amendment No. 1, dated August 28, 2006, to Employment Agreement between Hennessy Advisors, Inc. and Neil J. Hennessy (2) (9) | |
| 10.14 | Restricted Stock Unit Award Agreement for officers (2) (8) | |
| 10.15 | Restricted Stock Unit Agreement for Directors (2) (8) | |
| 10.16 | Bonus Agreement, dated August 28, 2006, between Hennessy Advisors, Inc. and Teresa M. Nilsen (2) (9) | |
| 10.17 | Bonus Agreement, dated August 28, 2006, between Hennessy Advisors, Inc. and Daniel B. Steadman (2) (9) | |
| 10.18 | Amendment No. 2, dated December 18, 2008, to Employment Agreement between Hennessy Advisors, Inc. and Neil J. Hennessy (2) (10) | |
| 10.19 | Amendment No. 3, dated September 3, 2009, to Employment Agreement between Hennessy Advisors, Inc. and Neil J. Hennessy (2) (11) | |
| 10.20 | First Amendment to Amended and Restated Loan Agreement between the registrant and U.S. Bank National Association (10) | |
| 10.21 | Second Amendment to Amended and Restated Loan Agreement between the registrant and U.S. Bank National Association (10) | |
| 10.22 | Third Amendment to Amended and Restated Loan Agreement between the registrant and U.S. Bank National Association (10) | |
| 10.23 | Fourth Amendment to Amended and Restated Loan Agreement between the registrant and U.S. Bank National Association (10) | |
| 10.24 | Fifth Amendment to Amended and Restated Loan Agreement between the registrant and U.S. Bank National Association (10) | |
| 10.25 | Investment Advisory Agreement, dated March 23, 2009, between the registrant and Hennessy Funds Trust (on behalf of the Hennessy Cornerstone Large Growth Fund) – Filed Herewith | |
| 10.26 | Investment Advisory Agreement, dated March 23, 2009, between the registrant and Hennessy Funds Trust (on behalf of the Hennessy Select Large Value Fund) – Filed Herewith | |
| 10.27 | Sub-Advisory Agreement, dated March 23, 2009, between the registrant and Voyageur Asset Management Inc. (on behalf of the Hennessy Select Large Value Fund) – Filed Herewith | |
| 10.28 | Investment Advisory Agreement, dated September 18, 2009, between the registrant and Hennessy SPARX Funds Trust (on behalf of the Hennessy Select SPARX Japan Fund and the Hennessy Select SPARX Japan Smaller Companies Fund) – Filed Herewith | |
| 10.29 | Sub-Advisory Agreement, dated September 18, 2009, between the registrant and SPARX Asset Management Co., Ltd. (on behalf of the Hennessy Select SPARX Japan Fund and the Hennessy Select SPARX Japan Smaller Companies Fund) – Filed Herewith | |
62
Table of Contents
| 23.1 | Consent of Stonefield Josephson, Inc., Independent Registered Public Accounting Firm – Filed Herewith | |
| 31.1 | Rule 13a – 14a Certification of the Chief Executive Officer – Filed Herewith | |
| 31.2 | Rule 13a – 14a Certification of the Chief Financial Officer – Filed Herewith | |
| 32.1 | Written Statement of the Chief Executive Officer, Pursuant to 18 U.S.C. § 1350 – Filed Herewith | |
| 32.2 | Written Statement of the Chief Financial Officer, Pursuant to 18 U.S.C. § 1350 – Filed Herewith | |
Notes:
| * | The related schedules to the agreement are not being filed herewith. The registrant agrees to furnish supplementally a copy of any such schedules to the Securities and Exchange Commission upon request. |
| (1) | Incorporated by reference from the Company’s Form SB-2 registration statement (SEC File No. 333-66970). |
| (2) | Management contract or compensatory plan or arrangement. |
| (3) | Incorporated by reference from the Company’s Form 8-K (SEC File No. 000-49872) filed July 29, 2005. |
| (4) | Incorporated by reference from the Company’s Form 10-KSB for the fiscal year ended September 30, 2004. |
| (5) | Incorporated by reference from the Company’s Form 10-QSB for the quarter ended March 31, 2005. |
| (6) | Incorporated by reference from the Company’s Form 8-K (SEC File No. 000-49872) filed December 12, 2008. |
| (7) | Incorporated by reference from the Company’s Form S-1 registration statement filed July 26, 2005 (SEC File No. 333-126896). |
| (8) | Incorporated by reference from the Company’s Form 10-QSB for the quarter ended March 31, 2006. |
| (9) | Incorporated by reference from the Company’s Form 8-K (SEC File No. 000-49872) filed August 28, 2006. |
| (10) | Incorporated by reference from the Company’s Form 10-Q for the quarter ended December 31, 2008. |
| (11) | Incorporated by reference from the Company’s Form 8-K (SEC File No. 000-49872) filed September 9, 2009. |
63