Attached files
| file | filename |
|---|---|
| 8-K - AIRTRAN AIRWAYS FORM 8-K 12.03.09 - AIRTRAN HOLDINGS INC | form8-k.htm |
EXHIBIT
99.1
December
2009
December
2009
Investor
Update
Investor
Update

2
Certain
of the statements contained herein should be considered “forward-looking
statements,” including
within the meaning of the
Private Securities Litigation Reform Act of 1995. These forward-looking statements may be identified by words such as “may”, “will”,
“expect,” “intend,” “indicate,” “anticipate,” “believe,” “forecast,” “estimate,” “plan, “ “guidance,” “outlook,” “could, “ “should,” “continue”
and similar terms used in connection with statements regarding the outlook of AirTran Holdings, Inc., (the “Company” or “AirTran”). Such
statements include, but are not limited to, statements about the Company’s: expected financial performance and operations, expected fuel
costs, the revenue and pricing environment, future financing plans and needs, overall economic condition and its business plans, objectives,
expectations and intentions. Other forward-looking statements that do not relate solely to historical facts include, without limitation,
statements that discuss the possible future effects of current known trends or uncertainties or which indicate that the future effects of known
trends or uncertainties cannot be predicted, guaranteed or assured. Such statements are based upon the current beliefs and expectations of
the Company’s management and are subject to significant risks and uncertainties that could cause the Company’s actual results and financial
position to differ materially from the Company’s expectations. Such risks and uncertainties include, but are not limited to, the following: the
Company’s ability to grow new and existing markets, the Company’s ability to maintain or expand cost advantages in comparison to various
competitors, the impact of high fuel costs; significant disruptions in the supply of aircraft fuel and further significant increases to fuel prices;
the Company’s ability to attract and retain qualified personnel; labor costs and relations with unionized employees generally and the impact
and outcome of labor negotiations; the impact of global instability, including the current instability in the Middle East, the continuing impact of
the U.S. military presence in Iraq and Afghanistan and the terrorist attacks of September 11, 2001 and the potential impact of future hostilities,
terrorist attacks, infectious disease outbreaks or other global events that affect travel behavior; adequacy of insurance coverage; reliance on
automated systems and the potential impact of any failure or disruption of these systems; the potential impact of future significant operating
losses; the Company’s ability to obtain and maintain commercially reasonable terms with vendors and service providers and its reliance on
those vendors and service providers; security-related and insurance costs; changes in government legislation and regulation; competitive
practices in the industry, including significant fare restructuring activities, capacity reductions and in-court or out-of-court restructuring by
major airlines and industry consolidation; interruptions or disruptions in service at one or more of the Company’s hub or focus airports;
weather conditions; the impact of fleet concentration and changes in fleet mix; the impact of increased maintenance costs as aircraft age
and/or utilization increases; the Company’s ability to maintain adequate liquidity; the Company’s ability to maintain contracts that are critical to
its operations; the Company’s fixed obligations and its ability to obtain and maintain financing for operations, aircraft financing and other
purposes; changes in prevailing interest rates; the Company’s ability to operate pursuant to the terms of any financing facilities (particularly
the financial covenants) and to maintain compliance with credit card agreements; the Company’s ability to attract and retain customers; the
cyclical nature of the airline industry; economic conditions; risks associated with actual or potential acquisitions or other business
transactions including the Company’s ability to achieve any synergies anticipated as a result of such transactions and to achieve any such
synergies in a timely manner, and other risks and uncertainties listed from time to time in the Company’s reports to the Securities and
Exchange Commission. There may be other factors not identified above of which the Company is not currently aware that may affect matters
discussed in the forward-looking statements, and may also cause actual results to differ materially from those discussed. All forward-looking
statements are based on information currently available to the Company. Except as may be required by applicable law, AirTran assumes no
obligation to publicly update or revise any forward-looking statement to reflect actual results, changes in assumptions or changes in other
factors affecting such estimates. Additional factors that may affect the future results of the Company are set forth in the section entitled “Risk
Factors” in the Company’s Annual Report on Form 10-K for the period ended December 31, 2008, or as supplemented in the Company’s
subsequently filed periodic reports, which are available at www.sec.gov and at www.AirTran.com.
Safe
Harbor

3
AirTran
Airways Profile
n Lowest cost major
airline in U.S.
― 138 aircraft
(Youngest all-Boeing fleet in U.S.)
n More than 700 daily
flights to over 60 destinations
― Over 24 million
enplanements annually
n Ranked #1 in the
Airline Quality Ranking
n Stable and
experienced management team
n Acted quickly in
2008 to mitigate record high oil, and now
better positioned to weather current economic uncertainty
better positioned to weather current economic uncertainty
― Record net income in
2009

n Business Class on
every flight
n Assigned
seating
n Wi-Fi on every
flight
n Over 100 channels of
free XM Satellite Radio
n Oversized luggage
bins
n Friendly Crew
Members
n Broad distribution
network
n New aircraft -
average age is 6 years
4
AirTran
Product: Low Fares and Major Airline Amenities

5
n Industry leading low
costs
n Conservative fleet
plan and modest growth
n Strong ancillary
revenues
― Less dependent on
initial sale to passenger
n Better diversified
network
― Fewer price
sensitive connections, less exposure to any single competitor
n Improved fuel hedge
portfolio
n Better
capitalized
― $172.5MM capital
raise and extension of $175MM credit facility
n Industry backdrop
remains favorable
AirTran
is Well Prepared for Economic Uncertainty
6
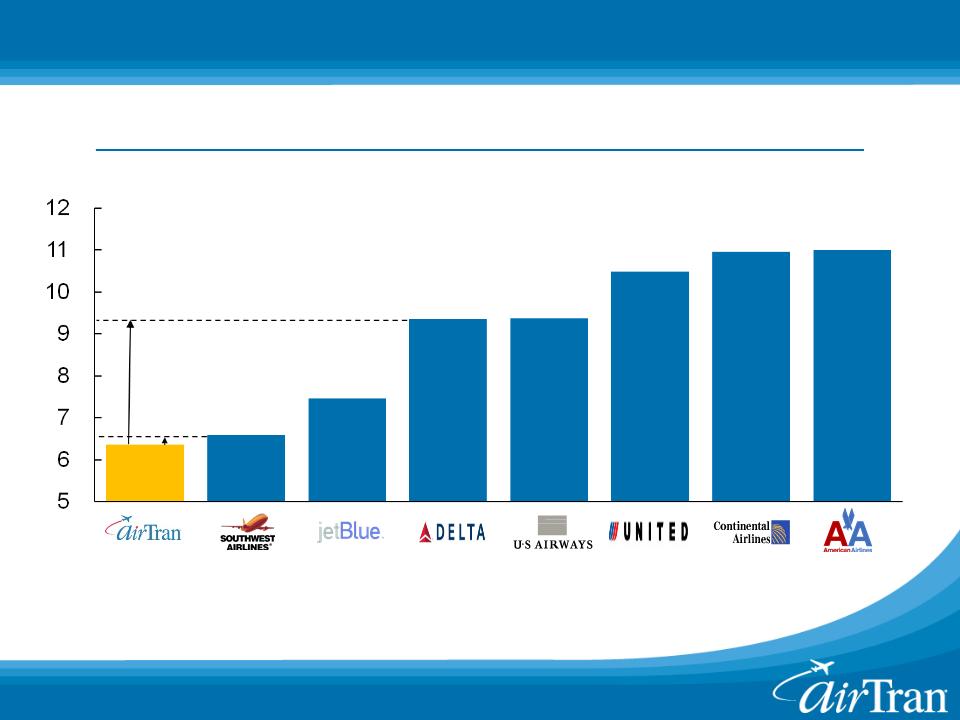
(Cents)
Note:
Excludes fuel and special items
Industry Cost
Comparison
Non-Fuel Unit Costs
at 740 Miles for First Nine Months 2009
AirTran’s
Cost Advantage Remains Strong
47%
Higher
4%
Higher

7
n Productive workforce
at all levels
n Young, simplified
fleet
― Fuel
efficient
― Attractive ownership
costs
n Efficient use of
facilities
n Competition for
heavy maintenance contracts
n Low cost
distribution
― Over 70% of sales
are directly with AirTran (1-800-AirTran and airtran.com)
What
Creates AirTran’s Low Cost Advantage?

JetBlue
AirTran
Independence
Southwest
United
America
West
Northwest
Continental
Alaska
American
JetBlue
AirTran
Southwest
United
Alaska
America
West
Northwest
American
Continental
ATA
AirTran
JetBlue
Northwest
Alaska
Southwest
Frontier
Continental
American
US
Airways
United
AirTran
JetBlue
Southwest
Northwest
Frontier
Continental
Alaska
United
American
Delta
JetBlue
AirTran
Frontier
Northwest
Southwest
Continental
United
Alaska
American
ATA
8
Notes:
(1) AQR
Rating compiled by Wichita State University / University of Nebraska,
Omaha.
(2) Based on
DOT reports for on-time performance, denied boardings, mishandled baggage, and
customer complaints
1.
2.
3.
4.
5.
6.
7.
8.
9.
10.
Airline
Quality Rating for Major Continental U.S. Airlines
2007
2006
2005
2008
2009
AirTran
Has High Quality & Industry Leading Low Costs
9
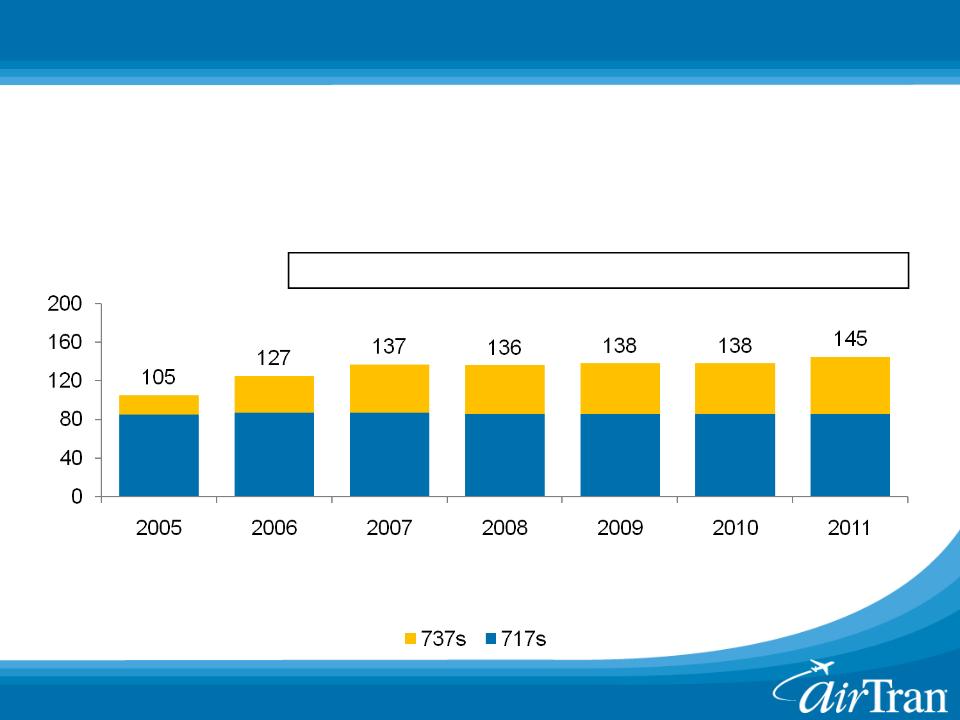
(Aircraft)
Previous
Plan:
Fleet
Plan Well-Suited for Economic Uncertainty
n Currently 138
aircraft: 86 717s
/ 52 737-700s
― Deferred / sold 47
aircraft from 2008-2011 fleet plan
― Reduced capital
requirements by nearly $1 billion through 2010
― No permanent
aircraft financing requirements until Q2 2011
|
28%
|
24%
|
20%
|
5%
|
(2-3)%
|
3-4%
|
2-3%
|
ASM
Growth
Growth
147
161
175
188
10
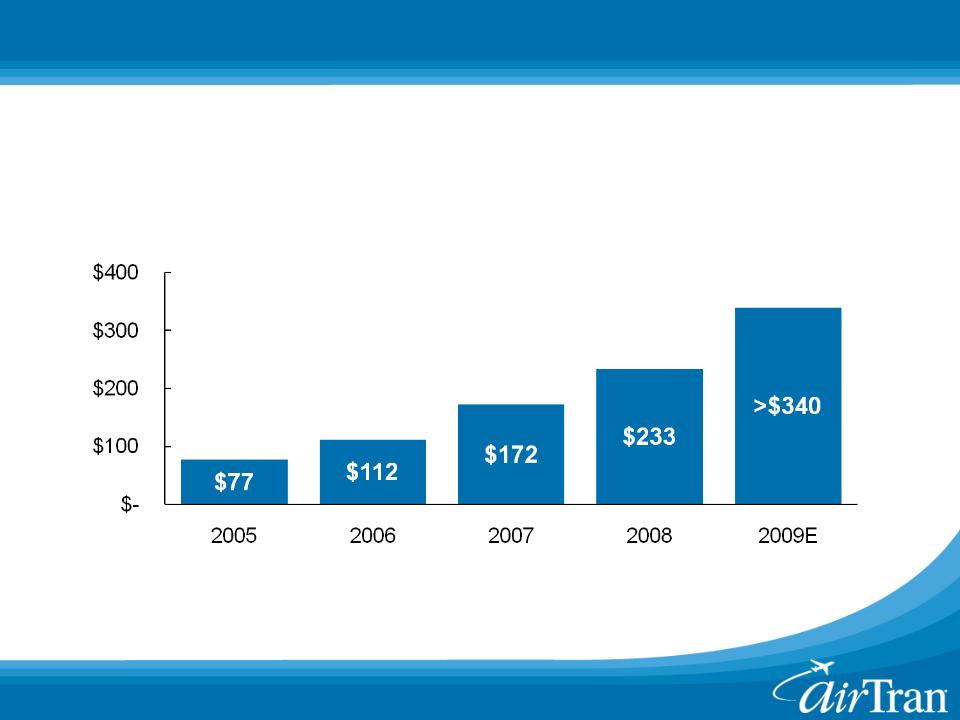
(Millions)
Strong
Ancillary Revenue Growth
43%
45%
54%
36%
>45%
Yr/Yr Growth
*
Select ancillary revenues are recorded in passenger revenues
|
28%
|
24%
|
20%
|
5%
|
(2-3)%
|
ASM
Growth
Growth
AirTran
Ancillary Revenue
n Well-suited for low
cost carriers
n High net
margins

11
AirTran
Has Successfully Diversified Its Network
|
%
ASMs
|
2000
|
2002
|
2004
|
2006
|
2008
|
2010E
|
|
Atlanta
|
91%
|
76%
|
67%
|
64%
|
58%
|
48%
|
|
Florida
|
29%
|
35%
|
34%
|
38%
|
45%
|
43%
|
|
Baltimore
|
0%
|
13%
|
13%
|
9%
|
11%
|
14%
|
|
Milwaukee
|
0%
|
3%
|
3%
|
2%
|
7%
|
13%
|
|
Caribbean
|
0%
|
1%
|
1%
|
0%
|
3%
|
7%
|
|
|
|
|
|
|
|
|
|
Daily
Flights
|
278
|
362
|
492
|
650
|
713
|
713
|
Note:
Totals >100% as percentage of ASMs represents capacity from a city/region to
the entire AirTran network at year-
end
end
Source:
2010E based on March 2010 schedule
12
Boston
Flint
Moline
Buffalo
Dayton
Dallas/Ft.
Worth
Houston
New
Orleans
Memphis
Bloomington
Minneapolis
Akron/
Canton
Newport
News
New
York (LGA)
Ft.
Lauderdale
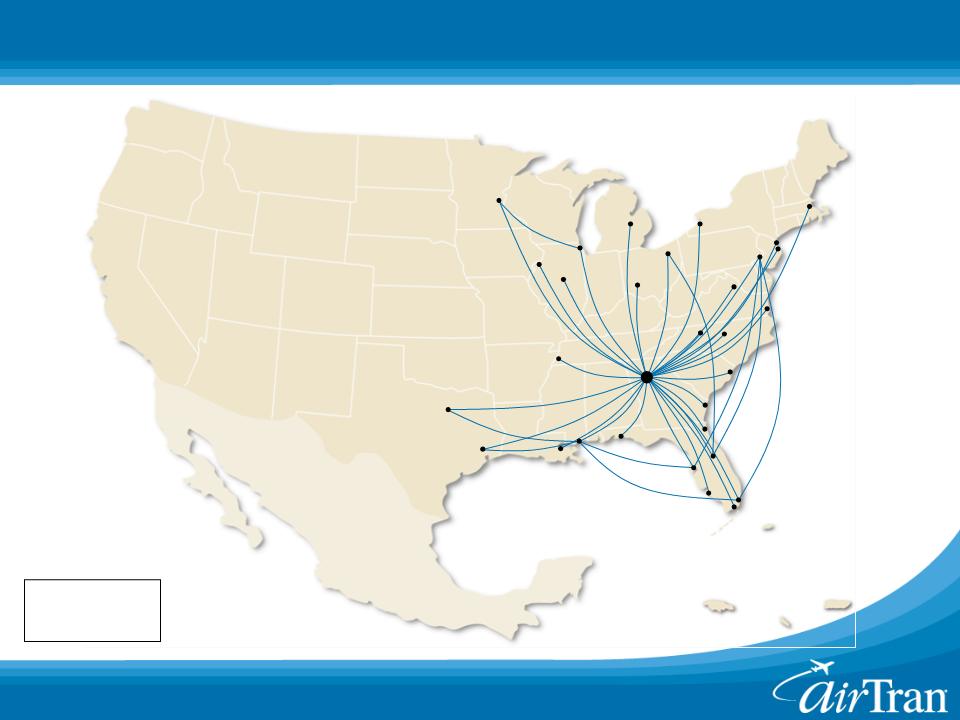
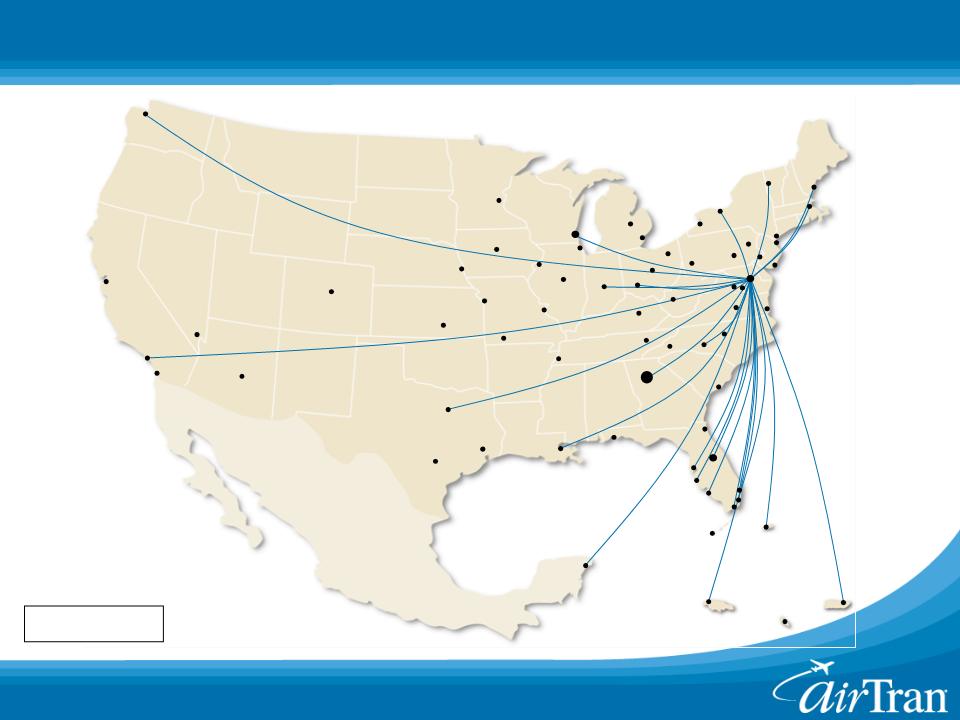
AirTran
Had a Regional Route Network in 2000
Gulfport/Biloxi
Fort
Walton Beach
Miami
Ft.
Myers
Orlando
Jacksonville
Savannah
Myrtle
Beach
Atlanta
Raleigh/Durham
Greensboro
Washington,
D.C. (IAD)
Philadelphia
Newark
Chicago
Tampa
Cities:
31
Routes:
40
13
Portland
Boston
Las
Vegas
Burlington
Flint
San
Juan
Cancun
Montego
Bay
Aruba
Moline
Pittsburgh
Buffalo
Rochester
Dayton
San
Diego
Los
Angeles
Phoenix
Seattle
San
Francisco
Dallas/Ft.
Worth
Houston
San
Antonio
New
Orleans
Atlanta
Pensacola
Memphis
Branson
Wichita
Kansas
City
St.
Louis
Bloomington
Knoxville
Indianapolis
Charleston
Columbus
Milwaukee
Minneapolis
Chicago
Detroit
Akron/
Canton
Richmond
Washington,
D.C. (IAD)
Washington,
D.C. (DCA)
Newport
News
Asheville
Raleigh/Durham
Charlotte
Harrisburg
Allentown
New
York (LGA)
Philadelphia
Atlantic
City
Baltimore
White
Plains
Charleston
Jacksonville
Tampa
Sarasota
Ft.
Myers
Miami
Nassau
Ft.
Lauderdale
West
Palm Beach
Orlando
Key
West
Denver
Lexington
Routes:
59
AirTran’s
2009 Atlanta Network Has Grown to 59 Cities
Omaha
Des
Moines
14
Portland
Boston
Las
Vegas
Burlington
Flint
San
Juan
Cancun
Montego
Bay
Aruba
Pittsburgh
Buffalo
Rochester
Dayton
San
Diego
Los
Angeles
Phoenix
Seattle
San
Francisco
Dallas/Ft.
Worth
Houston
San
Antonio
New
Orleans
Branson
Wichita
Kansas
City
St.
Louis
Knoxville
Indianapolis
Charleston
Columbus
Milwaukee
Minneapolis
Chicago
Detroit
Akron/
Canton
Richmond
Washington,
D.C. (IAD)
Washington,
D.C. (DCA)
Newport
News
Raleigh/Durham
Charlotte
Harrisburg
Allentown
New
York (LGA)
Philadelphia
Atlantic
City
Baltimore
White
Plains
Charleston
Jacksonville
Tampa
Sarasota
Ft.
Myers
Miami
Nassau
Ft.
Lauderdale
West
Palm Beach
Orlando
Key
West
Denver
Lexington
Asheville
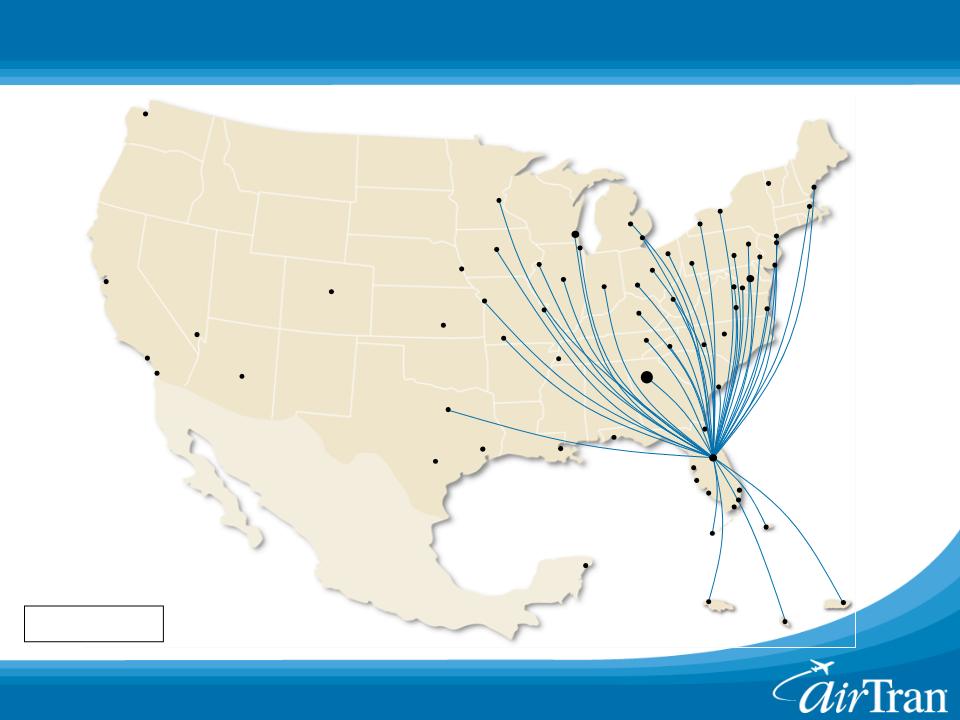
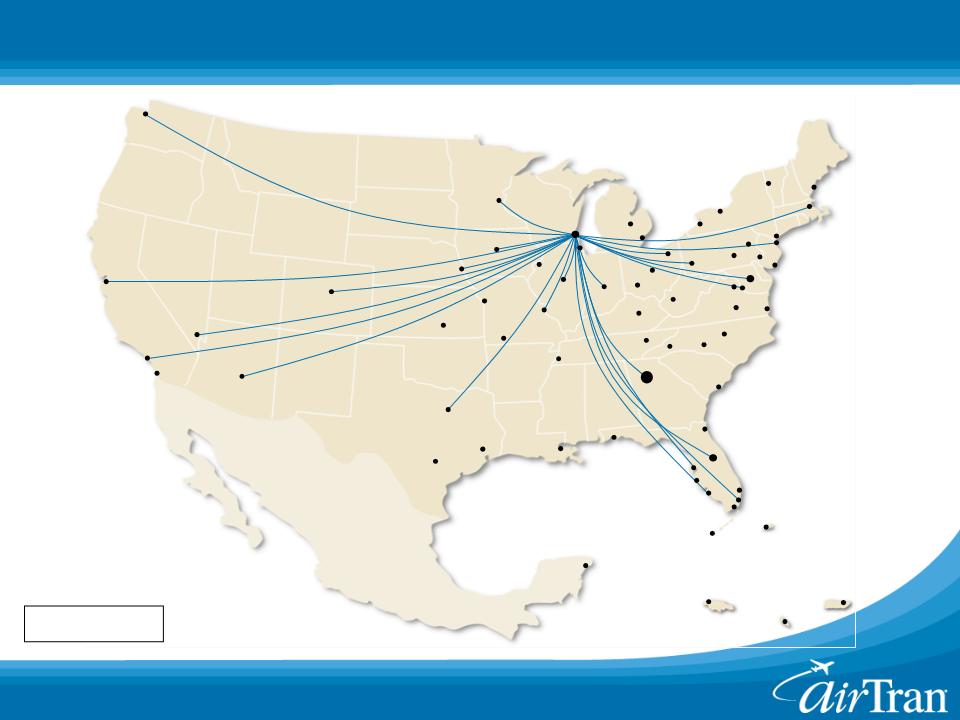
AirTran
Now Serves the Most Destinations from Orlando
Routes:
43
Memphis
Omaha
Des
Moines
Atlanta
Bloomington
Moline
Pensacola
15
Portland
Boston
Las
Vegas
Burlington
Flint
San
Juan
Cancun
Montego
Bay
Aruba
Moline
Pittsburgh
Buffalo
Rochester
Dayton
San
Diego
Los
Angeles
Phoenix
Seattle
San
Francisco
Dallas/Ft.
Worth
Houston
San
Antonio
New
Orleans
Atlanta
Pensacola
Memphis
Branson
Wichita
Kansas
City
St.
Louis
Bloomington
Knoxville
Indianapolis
Charleston
Milwaukee
Minneapolis
Chicago
Detroit
Akron/
Canton
Washington,
D.C. (DCA)
Newport
News
Asheville
Raleigh/Durham
Charlotte
Harrisburg
Allentown
New
York (LGA)
Philadelphia
Atlantic
City
Baltimore
White
Plains
Charleston
Jacksonville
Tampa
Sarasota
Ft.
Myers
Miami
Nassau
Ft.
Lauderdale
West
Palm Beach
Orlando
Key
West
Denver
Lexington
Routes:
24
AirTran
Has Replaced US Airways’ Baltimore Network
Omaha
Des
Moines
Columbus
Washington,
D.C. (IAD)
Richmond
16
Portland
Boston
Las
Vegas
Burlington
Flint
San
Juan
Cancun
Montego
Bay
Aruba
Moline
Pittsburgh
Buffalo
Rochester
Dayton
San
Diego
Los
Angeles
Phoenix
Seattle
San
Francisco
Dallas/Ft.
Worth
Houston
San
Antonio
New
Orleans
Atlanta
Pensacola
Memphis
Branson
Wichita
Kansas
City
Knoxville
Charleston
Columbus
Minneapolis
Detroit
Akron/
Canton
Richmond
Washington,
D.C. (IAD)
Washington,
D.C. (DCA)
Newport
News
Asheville
Raleigh/Durham
Charlotte
Harrisburg
Allentown
New
York (LGA)
Philadelphia
Atlantic
City
Baltimore
White
Plains
Charleston
Jacksonville
Tampa
Sarasota
Ft.
Myers
Miami
Nassau
Ft.
Lauderdale
West
Palm Beach
Orlando
Key
West
Denver
Lexington
Routes:
24
AirTran
is Now Milwaukee’s Largest Mainline Carrier
Omaha
Des
Moines
Milwaukee
St.
Louis
Indianapolis
Bloomington
Chicago
17
Portland
Boston
Dallas/Ft.
Worth
Las
Vegas
Denver
Minneapolis
Burlington
San
Antonio
Flint
Houston
San
Juan
Cancun
Montego
Bay
Aruba
Ft.
Myers
Tampa
Charleston
Knoxville
Charlotte
Raleigh/Durham
Detroit
Allentown
Pittsburgh
Newport
News
Washington,
D.C. (DCA)
Baltimore
Atlantic
City
Philadelphia
New
York (LGA)
White
Plains
Buffalo
Rochester
West
Palm Beach
Ft.
Lauderdale
Miami
Nassau
Key
West
Sarasota
New
Orleans
Kansas
City
Branson
Wichita
Columbus
Dayton
Charleston
Akron/
Canton
San
Diego
Los
Angeles
Phoenix
Seattle
San
Francisco
Lexington
Asheville
Jacksonville
Orlando
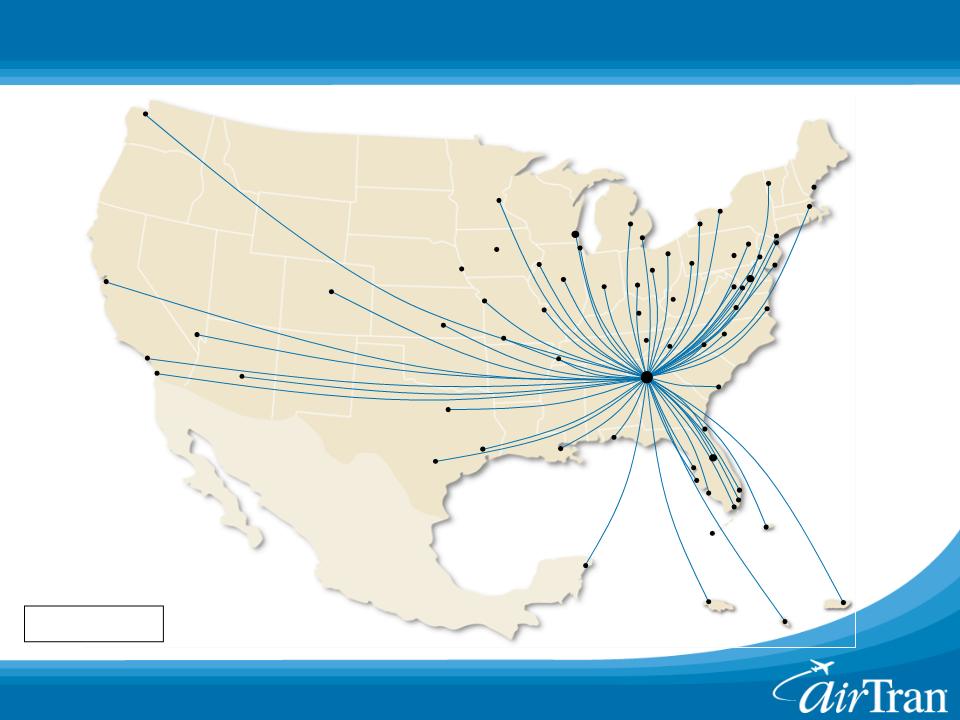
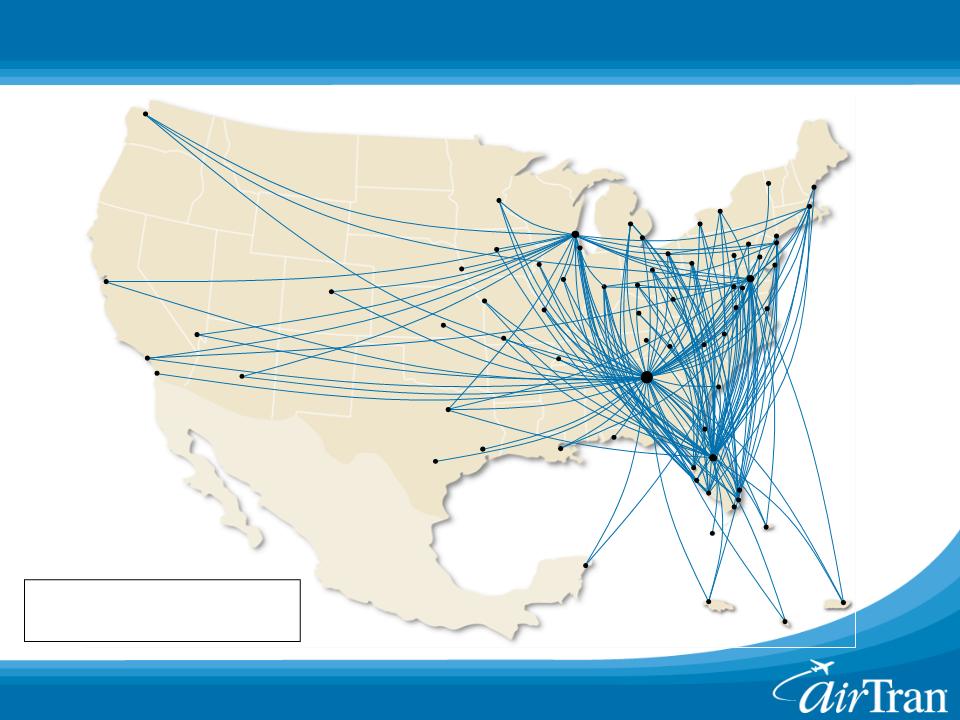
AirTran’s
2009 Network is Nationwide and Diversified
Cities:
From 31 to 69
Routes:
From 40 to 173
Memphis
Omaha
Des
Moines
Milwaukee
Pensacola
Atlanta
Moline
Harrisburg
Chicago
Bloomington
St.
Louis
Indianapolis
Washington,
D.C. (IAD)
Richmond
18
18
|
|
|
Crude
Price
|
||
|
Period
|
Hedge
%
|
$50
|
$70
|
$90
|
|
Q409
|
54%
|
$62
|
$69
|
$70
|
|
Q110
|
46%
|
$61
|
$73
|
$79
|
|
Q210
|
41%
|
$62
|
$75
|
$81
|
|
Q310
|
33%
|
$63
|
$77
|
$85
|
|
Q410
|
35%
|
$63
|
$77
|
$85
|
|
2010
|
38%
|
$62
|
$75
|
$82
|
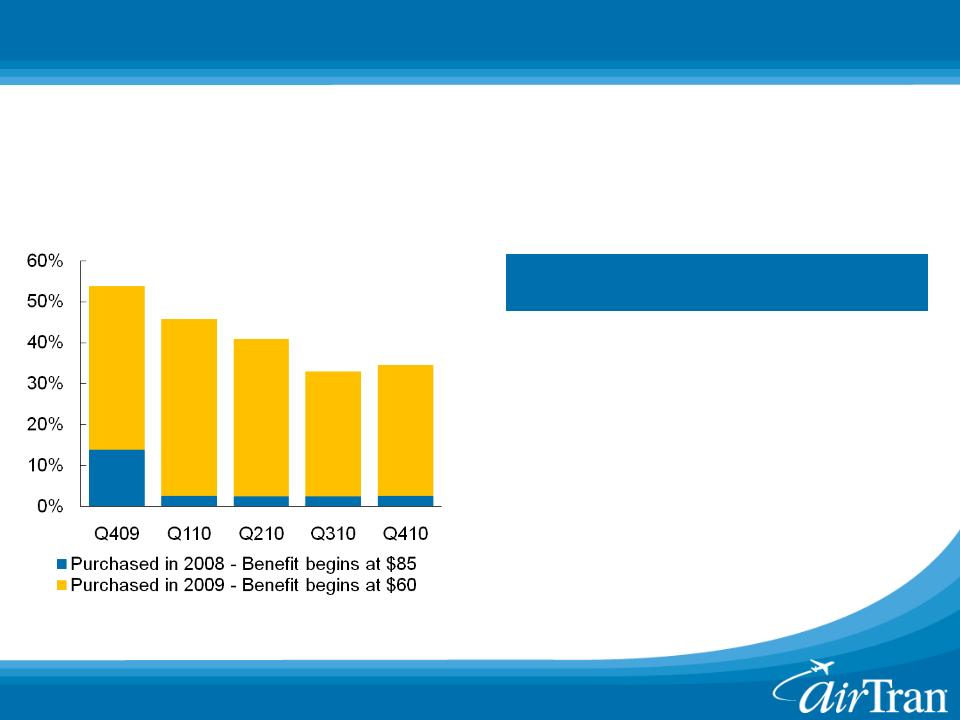
AirTran
is Committed to Reducing Fuel Cost Volatility
n Hedge portfolio was
restructured in 2008
n One of few airlines
to actively hedge in 2009
Example: If
crude was $90 in 2010, our cost would
be the equivalent of $82/bbl on 38% of our fuel
be the equivalent of $82/bbl on 38% of our fuel
54%
46%
41%
35%
33%
Note: Assumes
crack spread at 15% of crude price
19
(Billions)
(Billions)
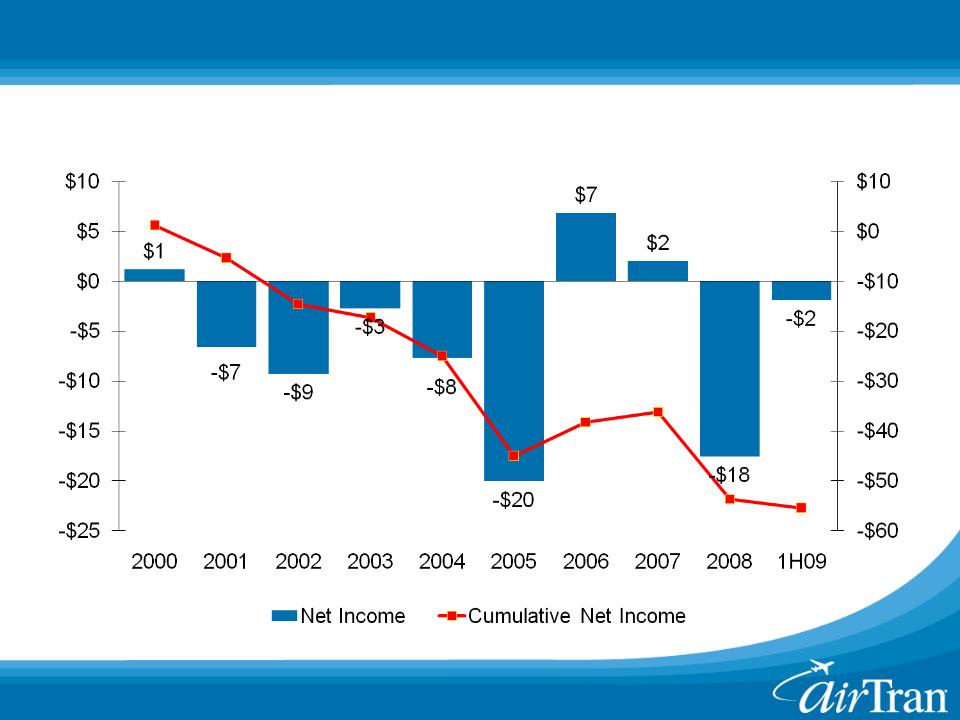
Legacy
Airline Domestic Net Income
Legacy
Airline’s Domestic Networks Remain Unprofitable
Source:
DOT Form 41 Filings
Annual
Cumulative
20
AirTran:
Delta:
Southwest:
-2%
to -3%
-7% to
-9%
-5% to
-6%
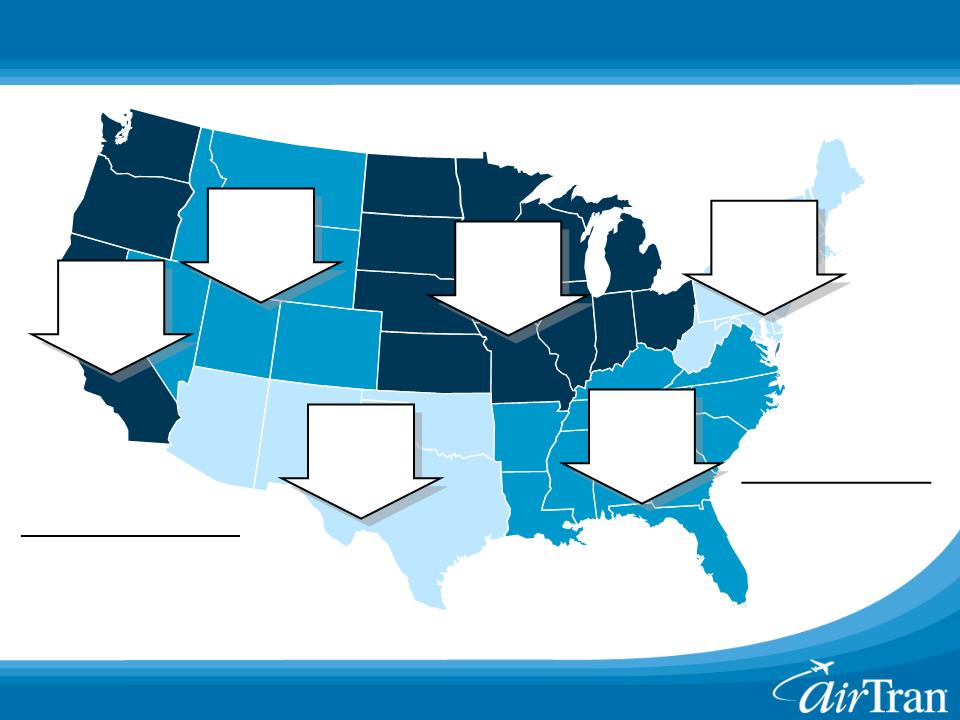
2009
Planned
Domestic Capacity
Domestic Capacity
Note:
Domestic capacity change for 2009
Northeast
-6%
Midwest
-8%
Southwest
-5%
Mountain
-6%
West
-8%
South
-8%
Industry
Losses Results in Disciplined Domestic Capacity
Las
Vegas:
St.
Louis:
Cincinnati:
Major
Capacity Reductions
US
Airways
American
Delta
21
21
Source:
DOT Form 41 Filings
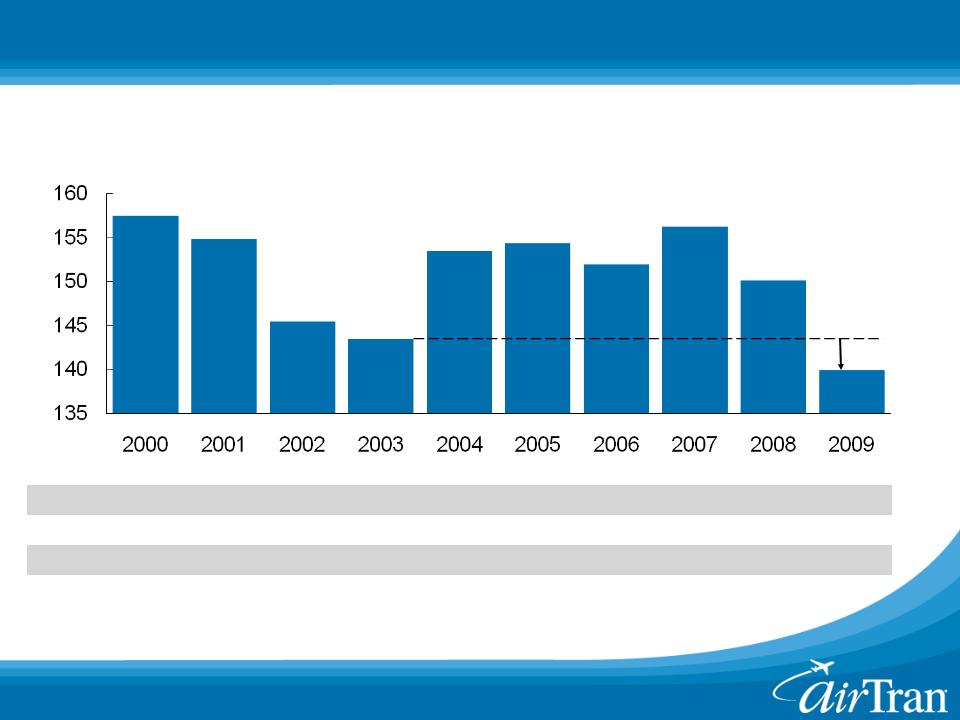
(Trillions)
Continental U.S.
Available Seat Miles
|
|
82%
|
79%
|
76%
|
72%
|
69%
|
64%
|
61%
|
59%
|
57%
|
56%
|
|
|
6%
|
7%
|
8%
|
10%
|
12%
|
14%
|
14%
|
14%
|
14%
|
15%
|
|
|
12%
|
14%
|
16%
|
18%
|
19%
|
22%
|
25%
|
27%
|
29%
|
29%
|
Legacy
Regional
LCC
Domestic
Capacity Now at Lowest Level In Over a Decade
(2-3%)
22
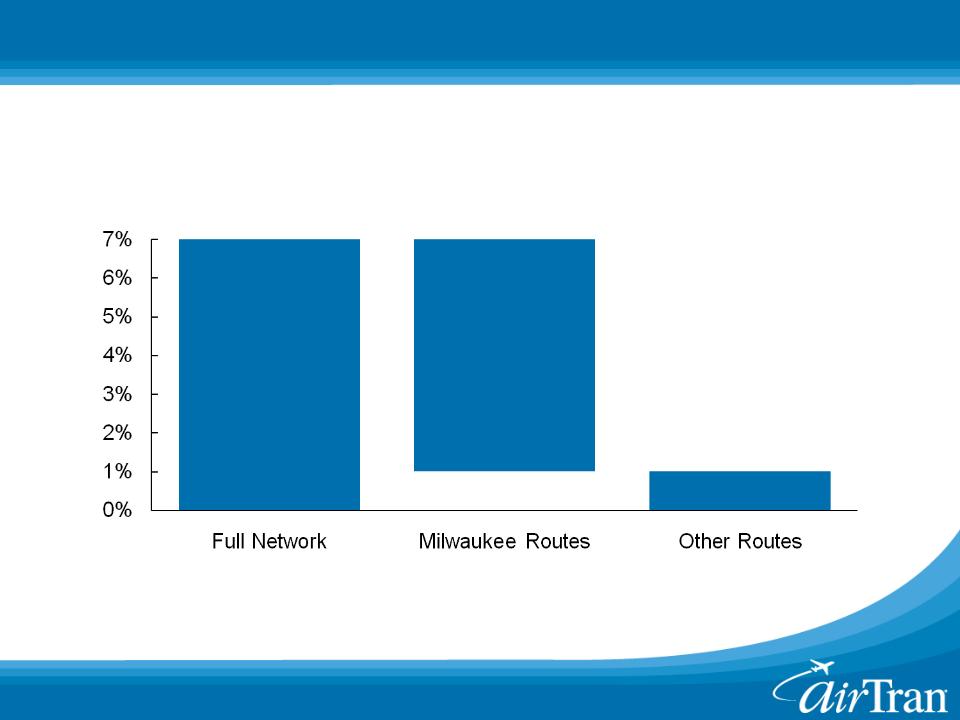
(ASM
Growth)
AirTran
Yr/Yr Growth Largely Focused in Milwaukee
7%
6%
1%
AirTran
Q409 Available Seat Mile Growth
23
(ASMs
in
Millions)
Millions)
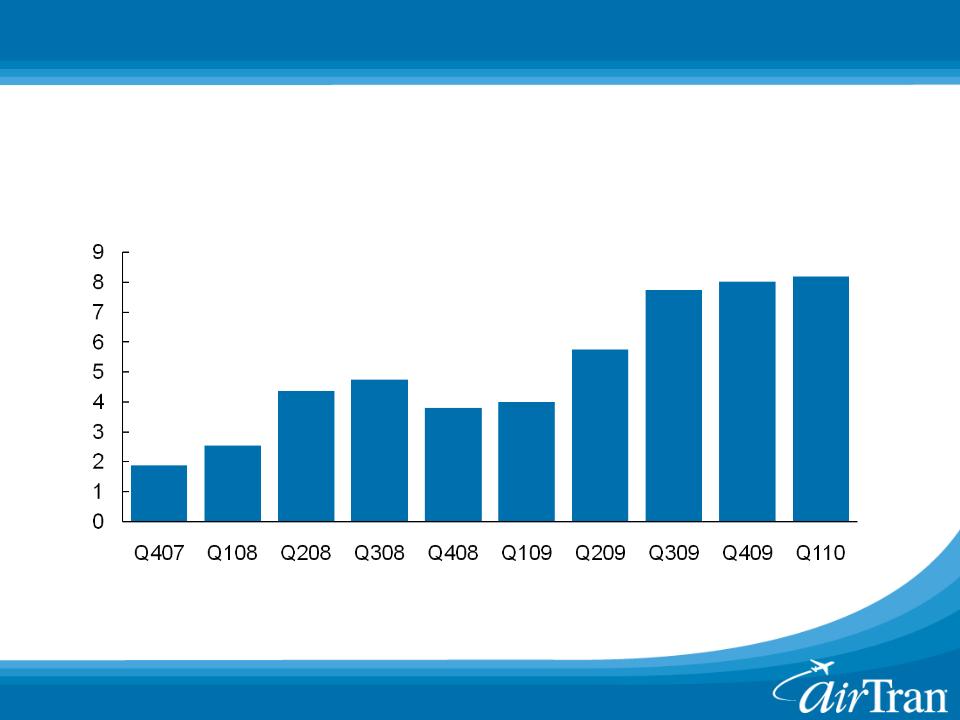
AirTran’s
Milwaukee Network Has Matured
Milwaukee Daily
ASMs
n AirTran now serves
18 of the top 20 markets

24
n Track record of
profitability was restored in 2009
― Record net income in
2009
― Consumers are
increasingly value-oriented
― Softening consumer
demand has been offset by lower fuel, capacity reductions,
and strong growth in ancillary revenues
and strong growth in ancillary revenues
n Significant non-fuel
cost advantage versus competitors will
remain intact
remain intact
n Balance sheet has
been strengthened
― $172.5MM capital
raise and extension of $175MM credit facility
n Q4 2009
outlook
― Capacity up
7%
― Total unit revenue
down -7% to -8%
― All-in fuel price
net of hedges $2.08 to $2.12
― Non-fuel unit costs
up 1% to 2%
Outlook
for AirTran Remains Positive

25
n AirTran’s industry
leading low-costs and a high quality
product drives profitability across multiple market segments
product drives profitability across multiple market segments
― Business /
leisure
― Hub /
point-to-point
n Significant cost
advantage in leisure markets
― Share shift to low
cost carriers to continue in leisure markets
n Record 2009
profitability paves path for manageable growth
― Disciplined fleet
plan
― Diversified
network
― Effective hedge
portfolio
n Opportunities to
capitalize in a weak or strong economy
― Business Class /
Wi-Fi / Assigned Seats appeal to high-yielding travelers
― Low-cost reputation
attracts value-minded consumers
n Remain poised to
capitalize on opportunities
AirTran
Investment Summary