Attached files
| file | filename |
|---|---|
| 8-K - FORM 8-K - EXCO RESOURCES INC | d8k.htm |
 PPT-122-NovInvestor.a-11.09 Investor Presentation December 2009 Exhibit 99.1 |
 2 PPT-125-DecInvestor.12.09 Company Overview (1) Significant shale upside with a solid base of conventional assets • 1.2 Tcfe of Proved Reserves – 235 Mmcfe/d of current net production, reserve life of 14.3 years and 68% Proved Developed – 120 Bcfe of shale assets booked as proved with potential for significant reserve adds in year-end reserve report • Significant Unproved Upside – 1.8 Tcfe of probable and possible reserves – 8.6 – 14.2 Tcfe of potential reserves – 4,800 – 7,900 shale locations – 5,300 low-risk development locations – ~1.0 million net acres • ~ 52,500 net acres in the Haynesville play and pursuing additional acquisition and leasing opportunities (2) • ~ 348,000 net acres in the Marcellus play • Successfully shifted focus from acquisitions to developing shale acreage – Haynesville operated production reached a high of 185 Mmcf/d gross in less than a year (1) The reserve estimates provided throughout this document are effective as of 10/1/09, and reflect all
divestitures announced year-to-date, and reflect a strip price adjusted for differentials and excluding hedge effects. Strip pricing ($ per Mcf / $ per Bbl): $3.75/ $70.00,
$5.50/$75.00, $6.50/$80.00 for Q4 2009, 2010, 2011 respectively and $7.00/$80.00 thereafter
(2) Haynesville acreage throughout this document is net to EXCO’s interest in the JV; assumes BG Group
exercises their option to purchase 50% of recently acquired acreage |
 EXCO
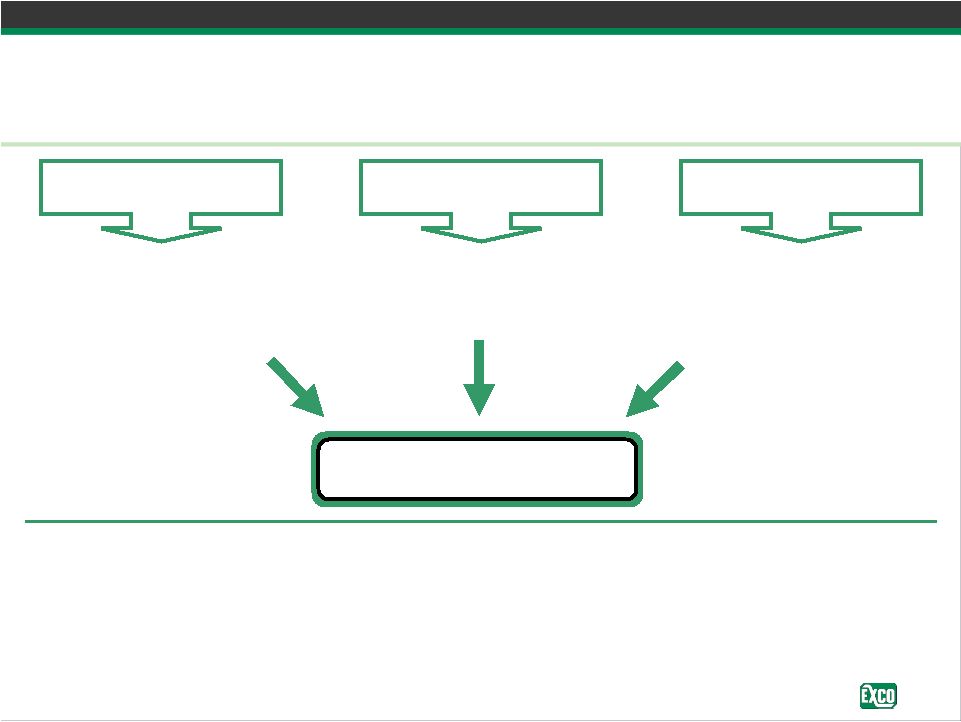
Resources, Inc. 3 PPT-125-DecInvestor.12.09 Keys to EXCO’s Strategy • Capital discipline – Continue to spend within cash flow – Maintain liquidity • Held-by-production acreage – Enables the most efficient execution of field development • Appropriate development pace – Focus on efficiency and effectiveness to achieve maximum returns • Focus on midstream and takeaway – Must control infrastructure to maximize value Right Assets Right People Right Strategy We have a significant position in two of the most prolific resource plays in North America along with a focused core of non-shale assets We have a dedicated, industry leading technical staff and a management team with a track record of delivering results We are financially and operationally positioned to effectively grow and develop our assets, even in the current industry cycle Equity Value Growth |
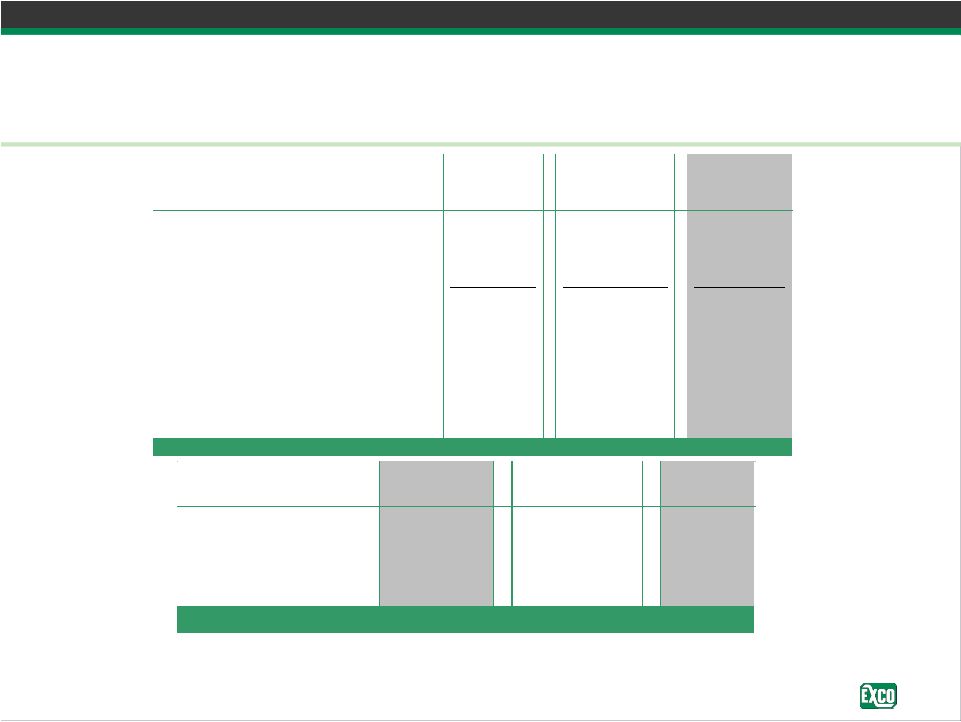
 4 PPT-125-DecInvestor.12.09 Shifting Our Strategy Execution of our strategy provided the assets for tremendous future growth • Acquisition driven historically – Sought long-life assets with low risk drilling, strong basis, and proximity to
markets – Focused on areas with follow-up acquisition opportunities – Entered East Texas / North Louisiana in 1998 pursuing Cotton Valley production
– Entered Appalachia in 2004 pursuing shallow production and consolidation opportunities • Discovery of Haynesville and Marcellus shales in East Texas / North Louisiana and Appalachia, respectively – Evaluated opportunities and drilled test wells – Began to expand technical staff – Sold non-strategic assets in all divisions – predominately high-cost with low upside Organic production growth rate: 5 – 10% 30 – 40% |
 5 PPT-125-DecInvestor.12.09 Delivering What We Promise Executing on our 2009 strategic plans Joint venture partner – Joint venture with BG Group positions EXCO for dramatic upstream and midstream growth – Received $1.0 billion of cash and $400 million carry on future deep drilling Asset sales – Closed ~$1.0 billion in divestitures year-to-date – Non-strategic assets with limited upside, Debt reduction (2) – Reduced debt by approximately $2.0 billion or ~67% – Increased liquidity to nearly $850 million Shale focus – Through Q3 2009, ~60% of our drilling capital has been spent on shale projects
– Built up technical staff while moving towards Haynesville development and Marcellus
evaluation – Examining possible Appalachia joint venture (1) Prior to customary purchase price adjustments (2) Pro forma for shallow Appalachia and Mid-Continent divestitures
|
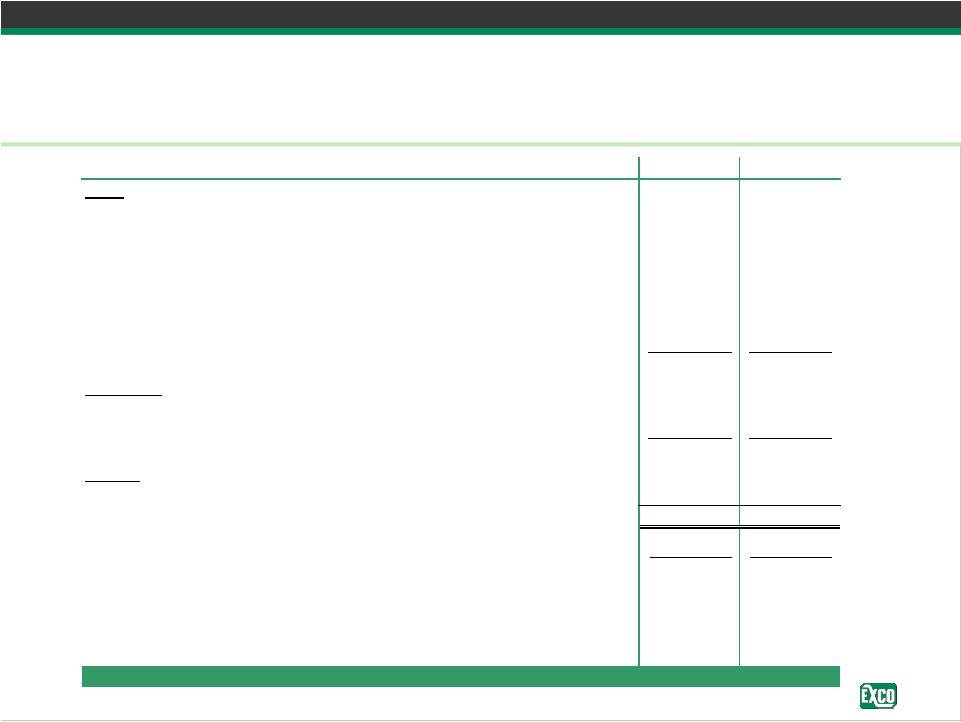
 6 PPT-125-DecInvestor.12.09 Financial Snapshot Significant liquidity with tremendous organic growth (1) September 30, 2009 cash includes $14.5 million of deposits related to Q4
divestitures (2) Subject to normal pre and post closing purchase price adjustments (3) Includes $69.9 million of restricted cash (4) Excludes unamortized bond premium (5) Net of $15.2 million in letters of credit (6) Pro forma for shallow Appalachia and Mid-Continent divestitures Remaining 2009 As of September 30, 2009 ($ in thousands) Actual (1) Divestitures (2) Pro Forma Cash (3) 125,664 $ (14,500) $ 111,164 $ Bank debt (L + 175 - 250bps) 1,239,645 (685,000) 554,645 Senior notes (7 1/4%) (4) 444,720 - 444,720 Total debt 1,684,365 $ (685,000) $ 999,365 $ Net debt 1,558,701 $ 888,201 $ Borrowing base 1,700,000 $ 1,300,000 $ Unused borrowing base (5) 445,153 $ 730,153 $ Unused borrowing base plus cash (5) 570,817 $ 841,317 $ (dollars in millions) September 30, 2009 2010E 2014E Production (Mmcfe/d) 235 290 - 340 1,100+ Proved reserves (Tcfe) 1.2 1.5 - 1.6 5.5 - 6.0 Capital expenditures (6) $445 - $495 $1,100+ EBITDA (6) $700 - $750 $2,200+ |
 7 PPT-125-DecInvestor.12.09 Joint Venture With BG Group Strategic partner with shared vision • Sold 50% interest in Area of Mutual Interest (AMI) – 580 Bcfe of proved reserves and 155 Mmcfe/d within AMI • Cash flow implications – Haynesville development will be accelerated, but capital expenditures will be
reduced – In addition to the $727 million (1) in cash at closing for the upstream assets, BG Group has committed $400 million to pay 75% of EXCO’s deep drilling and completion costs • BG Group will pay 87.5% of first $1.1 billion of capital investment for its 50%
ownership • EXCO will pay 12.5% of the first $1.1 billion of capital investment for its 50%
ownership – As a result, EXCO will generate significant free cash flow for many years – Resulting F&D on “carried” wells could be $0.25 - $0.50 per Mcf • Midstream structure – East Texas/North Louisiana Midstream assets were contributed to a newly formed
LLC – BG Group purchased 50% of new LLC for $269 million (1) – Planning is underway for expansions from 2010 to 2012 • Vernon upstream and midstream assets are not included in BG Group transaction (1) Subject to normal post closing purchase price adjustments
|
 8 PPT-125-DecInvestor.12.09 Our People Key driver of our future growth • Outstanding growth in technical and support staff – Focus on people has resulted in a tremendous technical staff buildup in the last two
years – Technical headcount has increased 70% since January 2008 • Relentless focus on Environmental, Health and Safety (EHS) efforts and results
• BG Group Secondees – Plans for 7 or more upstream and 5 or more midstream secondees – Provide business and technical capabilities to complement our existing personnel
– Highly skilled with extensive experience throughout the world • Our technical staff is supplemented with world-class consultants – Geoscience, drilling, completion, and midstream |
 9 PPT-125-DecInvestor.12.09 Industry Outlook Industry, economic and political conditions support a strong rebound in commodity prices • Advent of shale gas in the US provides more certainty of future supply – Provides visibility of supply in the medium term, promoting more consumption • Government deficits and related borrowings will cause a sharp rise in interest
rates – Debt service requirements will impact industry’s ability to reinvest • Political climate – Relatively low carbon emissions of natural gas would be highlighted by potential
climate change bill – Increased use of wind will need to be supplemented by natural gas to alleviate
volatility in wind production – Potential tax changes directed at industry will cause an increase in cost of
supply • Industry’s response – Formation of lobby groups focused on natural gas – Congress has begun to realize potential for natural gas as transportation fuel
|
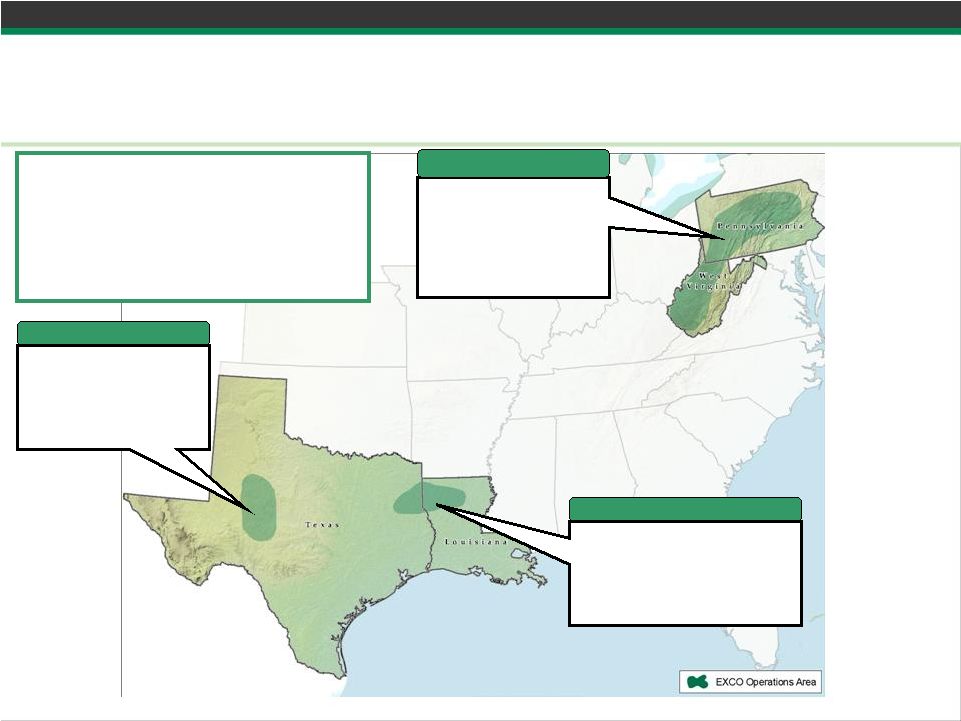 10 PPT-125-DecInvestor.12.09 Reserve Base Pro forma for BG transaction and 2009 divestiture program (1) Proved Reserves = 1.2 Tcfe 3P Reserves = 3.0 Tcfe 3P+ Reserves = 11.6 – 17.2 Tcfe Current Production = 235 Mmcfe/d Gross acreage: ~1,130,000 Net acreage: ~918,500 Proved: 0.3 Tcfe 3P: 0.5 Tcfe 3P+: 7.5 – 13.1 Tcfe Production: 37 Mmcfe/d Gross acreage: ~714,000 Net acreage: ~640,000 Permian Proved: 0.1 Tcfe 3P: 0.1 Tcfe 3P+: 0.3 Tcfe Production: 20 Mmcfe Gross acreage: ~143,000 Net acreage: ~102,000 East Texas / North Louisiana Proved: 0.8 Tcfe 3P: 2.4 Tcfe 3P+: 3.8 Tcfe Production: 178 Mmcfe Gross acreage: ~283,000 Net acreage: ~176,500 Appalachia (1) Pro forma for shallow Appalachia and Mid-Continent divestitures
|
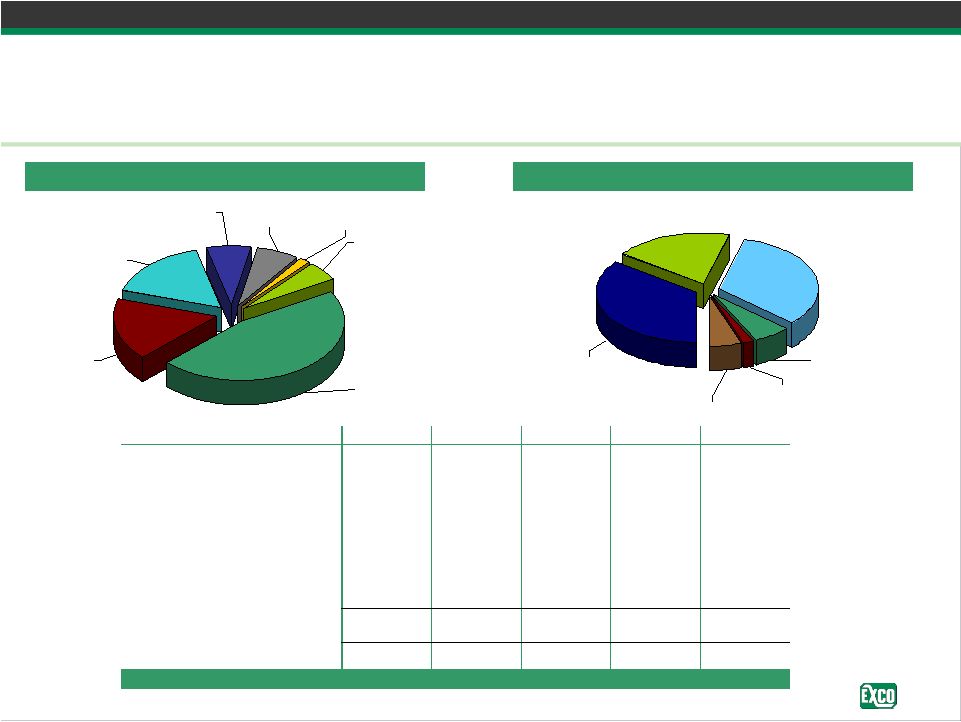 11 PPT-125-DecInvestor.12.09 2010 Capital Program Total capital program of $471 million is net of $205 million of EXCO drilling and
completion capital carried by BG Group TGGT Holdings cash call 2% Corporate 5% Seismic 7% Midstream 7% Operations 17% Land 17% Drilling / Completion 45% 2010 Capital Program by Category Vernon 19% Appalachia 33% TGGT Holdings cash call 2% Permian 6% Corporate 5% ETX / NLA JV 35% 2010 Capital Program by Area (1) Represents EXCO’s share of 2010 projected TGGT Holdings cash call based on estimated base budget capital ($ in millions) ETX / NLA JV Vernon Appalachia Permian Total Drilling and completion 63.7 $ 47.2 $ 65.0 $ 26.3 $ 202.2 $ Recompletion / exploitation 5.2 1.6 2.9 0.7 10.4 Operations 26.4 20.3 17.9 1.9 66.5 Land 50.0 5.3 22.6 0.3 78.2 Seismic 4.6 10.5 17.2 - 32.3 Exploration 15.2 - - - 15.2 Midstream - 2.7 28.6 - 31.3 Other 0.2 2.3 - - 2.5 Corporate - - - - 25.0 2010 Capital Program Request 165.3 89.9 154.2 29.2 463.6 TGGT cash call (1) 7.8 - - - 7.8 Total 2010 Commitments 173.1 $ 89.9 $ 154.2 $ 29.2 $ 471.4 $ |
 PPT-122-NovInvestor.a-11.09 Financial Overview Investor Presentation December 2009 |
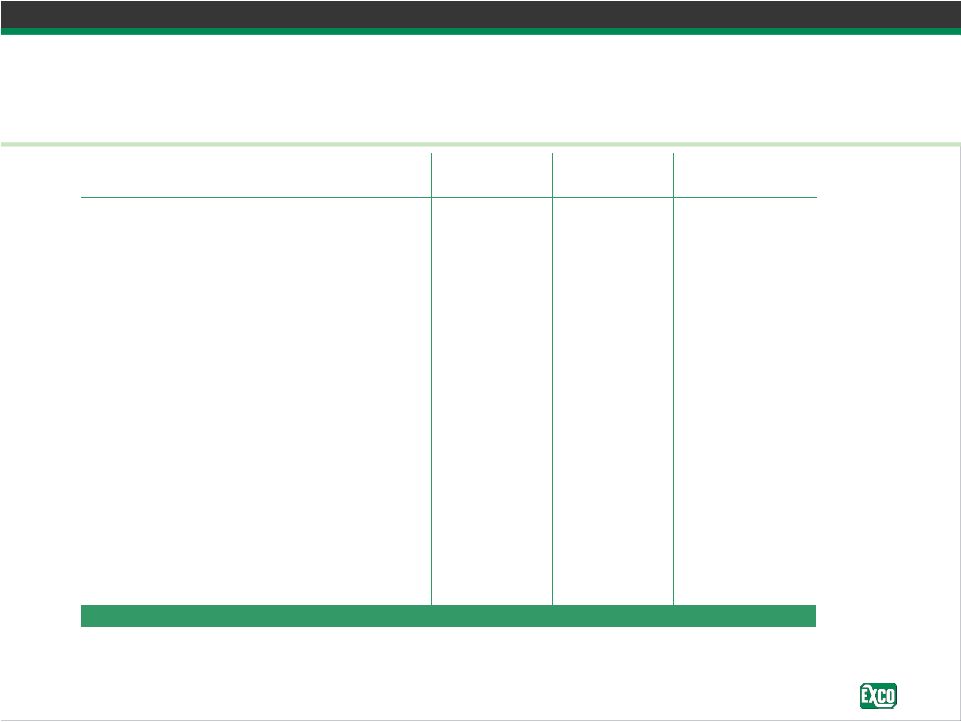
  13 PPT-125-DecInvestor.12.09 Remaining 2009 As of September 30, 2009 ($ in thousands) Actual (1) Divestitures (2) Pro Forma Cash (3) 125,664 $ (14,500) $ 111,164 $ Bank debt (L + 175 - 250bps) 1,239,645 (685,000) 554,645 Senior notes (7 1/4%) (4) 444,720 - 444,720 Total debt 1,684,365 $ (685,000) $ 999,365 $ Net debt 1,558,701 $ 888,201 $ Borrowing base 1,700,000 $ 1,300,000 $ Unused borrowing base (5) 445,153 $ 730,153 $ Unused borrowing base plus cash (5) 570,817 $ 841,317 $ Liquidity and Financial Position Pro forma for Q4 2009 divestitures (1) September 30, 2009 cash includes $14.5 million of deposits related to Q4
divestitures (2) Subject to normal pre and post closing purchase price adjustments (3) Includes $69.9 million of restricted cash (4) Excludes unamortized bond premium (5) Net of $15.2 million in letters of credit |
 14 PPT-125-DecInvestor.12.09 Derivatives Position • Pro forma production currently 235 Mmcfe/d • Total of 132 Bcfe hedged at $8.95 per Mcfe • PEPL basis swaps for the remainder of 2009; 10 Mmcf/d swapped at NYMEX minus $1.10 • Expect to monetize a portion of our derivative portfolio in light of recent
divestitures (1) Based on production guidance NYMEX Contract Contract Equivalent Contract natural gas price per NYMEX oil price per Per day price per Percent (in thousands, except price) Mmbtu Mmbtu Bbls Bbl Hedged Equivalent hedged (1) Q4 2009 23,450 8.08 398 80.66 280.9 8.58 112% 2010 66,298 7.62 1,568 104.64 207.4 8.84 64% 2011 12,775 7.48 1,095 113.10 53.0 11.34 10% 2012 5,490 5.91 92 109.30 16.5 7.03 2% 2013 5,475 5.99 - - 15.0 5.99 1% Total 113,488 7.54 $ 3,152 104.68 $ 8.95 $ |
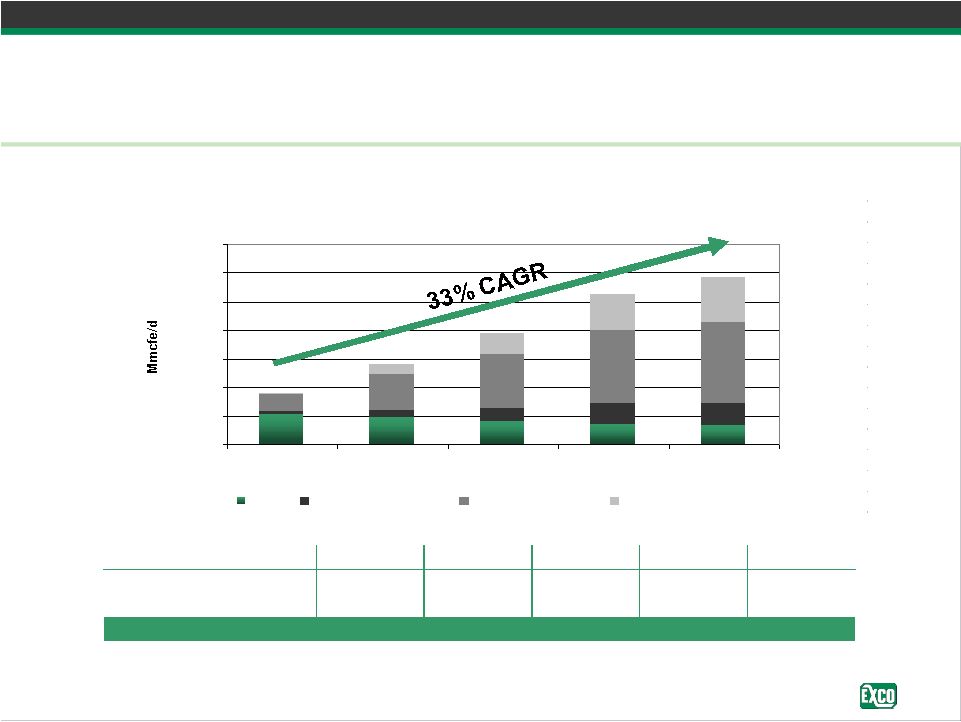 15 PPT-125-DecInvestor.12.09 Projected Average Production Midpoint - 200 400 600 800 1,000 1,200 1,400 2010E 2011E 2012E 2013E 2014E Base Conventional Wedge Haynesville Wedge Marcellus Wedge Production Profile and Proved Reserve Growth Proved Reserves (Tcfe) 2010E 2011E 2012E 2013E 2014E Low 1.7 3.0 4.3 5.0 5.5 High 1.8 3.2 4.8 5.5 6.0 |
  16 PPT-125-DecInvestor.12.09 Net Asset Value Summary In millions, except per share and per unit Low Case High Case E&P Proved Reserves - 1.2 Tcfe at $2.00 & $2.50 per Mcfe 2,448 $ 3,060 $ Unproved Reserves (1) (Conventional) - 1.3 Tcfe at $.20 & $.40 per Mcfe 266 532 Unproved Reserves (Haynesville) - 2.2 Tcfe at $.30 & $.50 per Mcfe 654 1,090 Unproved Reserves (Bossier) - 17 Tcfe GIP (Unknown recovery factors) - - BG Group Carry 400 400 Marcellus Core Acreage - 226K acres at $4,000 & $6,000 per acre 904 1,356 Marcellus Non-Core Acreage - 140K acres at $1,000 & $1,500 per acre 140 210 E&P Assets 4,812 $ 6,648 $ Midstream TGGT 270 270 Vernon Gathering 60 60 Midstream Assets 330 $ 330 $ Hedges Hedge Value 400 $ 400 $ Total Asset Value 5,542 $ 7,378 $ Less: Net Long-term Debt 888 $ 888 $ Equity Value 4,654 $ 6,490 $ Fully Diluted Shares 215 215 NAV per Share 21.65 $ 30.19 $ (1) Unproved Reserves is exclusive of Marcellus Shale assets |
 17 PPT-125-DecInvestor.12.09 (1) Peer analysis from Thomson First Call as of November 2, 2009 for 2010 & 2011 EBITDA and 2010 Cash Flow per Share. Enterprise value as of November 2, 2009. EXCO’s estimates are based on midpoint of projections. (2) EBITDA and Cash Flow includes 50% of the EBITDA or Cash Flow from TGGT for the
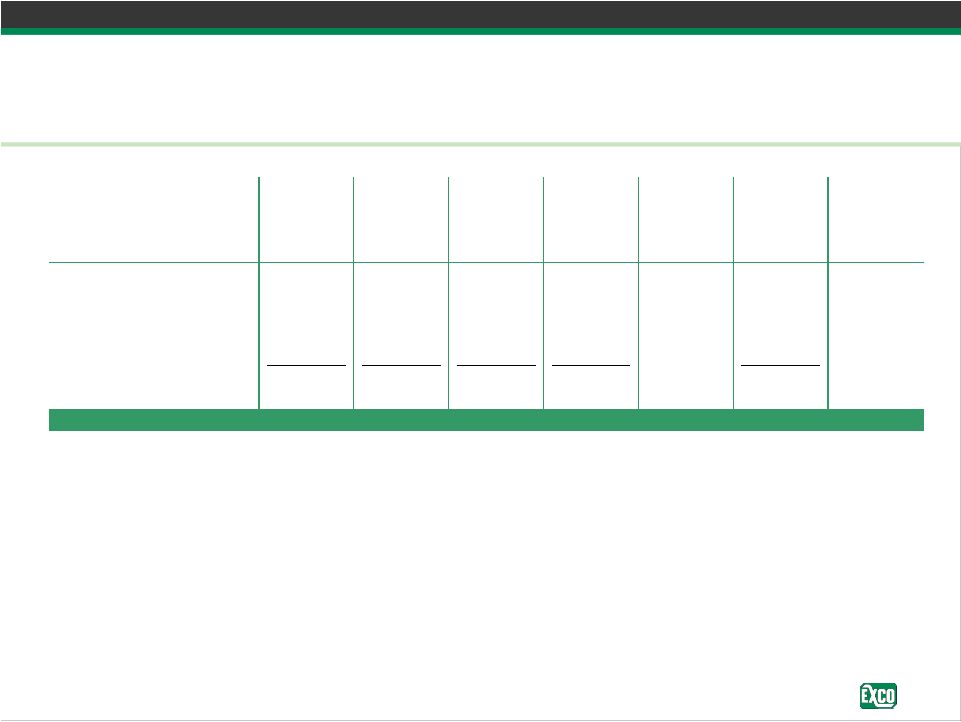
respective year. EXCO Trading Multiples (1) Valuation Analysis XCO Share $ XCO Peer Average at Peer Average Share Price (11-2-09) 15.35 $ Market Cap (11-2-09) 3,249 $ Enterprise Value (11-2-09) 4,137 $ Current Proved Reserves (Bcfe) 1,224 Current Production (Mmcfe/d) 235 EBITDA (2) 2010 668 $ Cash Flow (2) 2010 608 $ Cash Flow per Share (2) 2010 2.87 $ EBITDA (2) 2011 1,036 $ Share Price / Cash Flow per Share 2010 5.3 8.8 24.05 $
Enterprise Value / EBITDA 2010 6.2 9.2 24.84 $
Enterprise Value / Current Proved Reserves 3.38 $ 5.31 $ 30.70 $
Enterprise Value / Current Production 17,605 $ 20,116 $ 22.33 $
Enterprise Value / EBITDA 2011 4.0 6.8 29.09 $
|
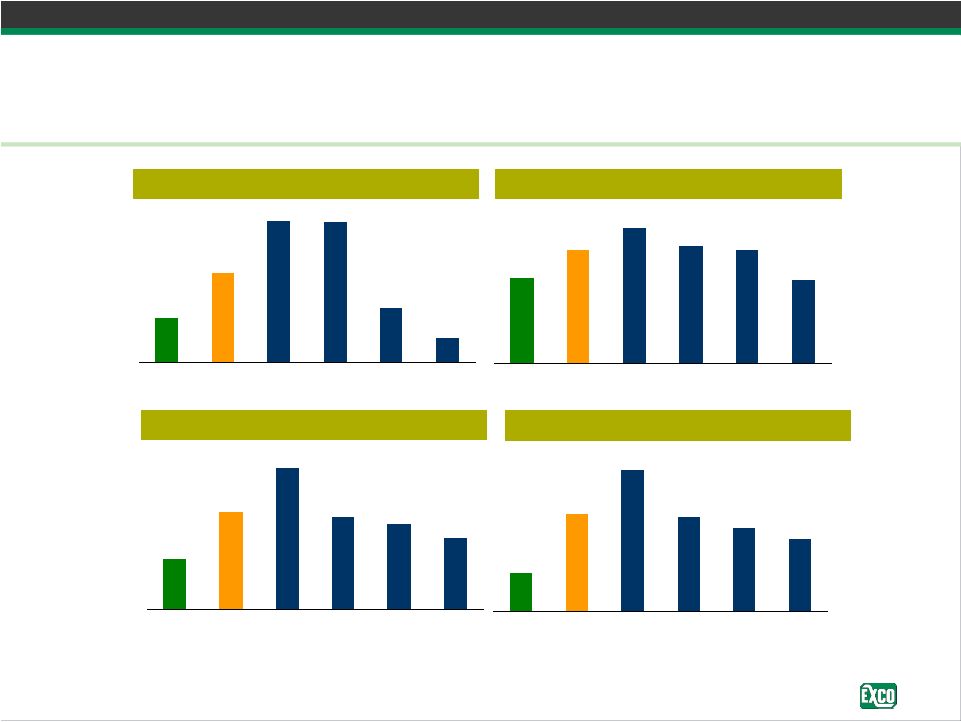 18 PPT-125-DecInvestor.12.09 $20,116 $22,192 $20,540 $17,606 $17,466 $20,269 XCO Avg RRC SWN HK COG $3.38 $7.48 $7.40 $3.80 $2.55 $5.31 XCO Avg SWN HK RRC COG Enterprise Value / Daily Production Q3 Actuals ¹ Enterprise Value / Current Proved Reserves ¹ 6.2 12.0 8.9 8.4 7.5 9.2 XCO Avg RRC SWN HK COG Enterprise Value / EBITDA ¹ , ² 5.3 11.4 8.6 8.0 7.3 8.8 XCO Avg RRC SWN HK COG Share Price / CF per Share ³ Peer Valuation Comparison Valuation Analysis 1) Enterprise value based on stock price as of close on November 2, 2009 and proved reserves updated
for any announced acquisition or divestitures year to date. XCO’s production based
on pro forma for expected shallow Appalachia and Mid-Continent divestitures and peer production adjusted for any announced dispositions since Q2. HK’s Q3 production and debt is based on Q2 as HK has not yet released Q3
earnings. 2) EBITDA is from Thomson First Call projections for full year 2010 as of
November 2, 2009 except for XCO, which is based on XCO’s midpoint of projections. 3)
Share price is as of market close on November 2, 2009, and CF per share for 2010 is from Thomson First Call as November 2, 2009 except for XCO, which is based on XCO’s midpoint of projections. |
 PPT-122-NovInvestor.a-11.09 Asset Overview Investor Presentation December 2009 |
 20 PPT-125-DecInvestor.12.09 Asset Overview Strong asset base with outstanding growth potential • Haynesville and Marcellus shales – Primary driver of our growth and future potential – Focus of our capital and technical resources • Non-shale assets with significant price-contingent upside – Vernon field is a Lower Cotton Valley play with significant upside potential – Vertical Cotton Valley fields provide much of our Haynesville HBP position – Horizontal Cotton Valley plays will be tested in 2010 – Shallow Appalachia provides our Marcellus HBP position; significant cash flow
– Permian – Sugg Ranch is an oily Canyon Sand play; one rig drilling program underway • Potential: Bossier and Huron shales • Midstream – Increasingly important asset within our portfolio – Allows us to efficiently turn wells to sales – Provides access to multiple markets – Capacity allows revenue capture from 3 party throughput rd |
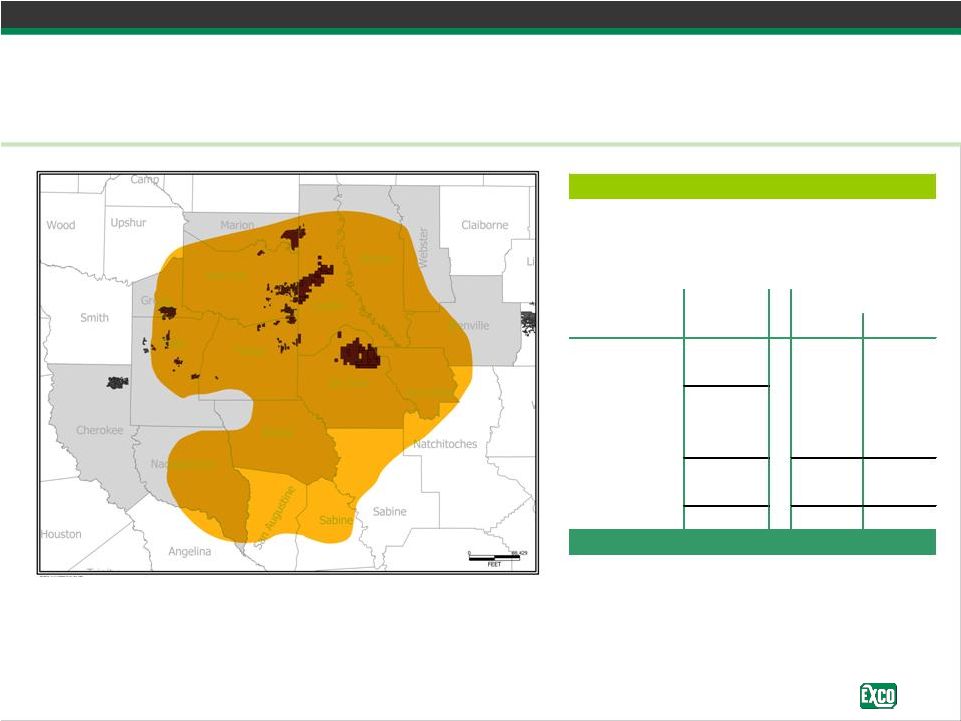
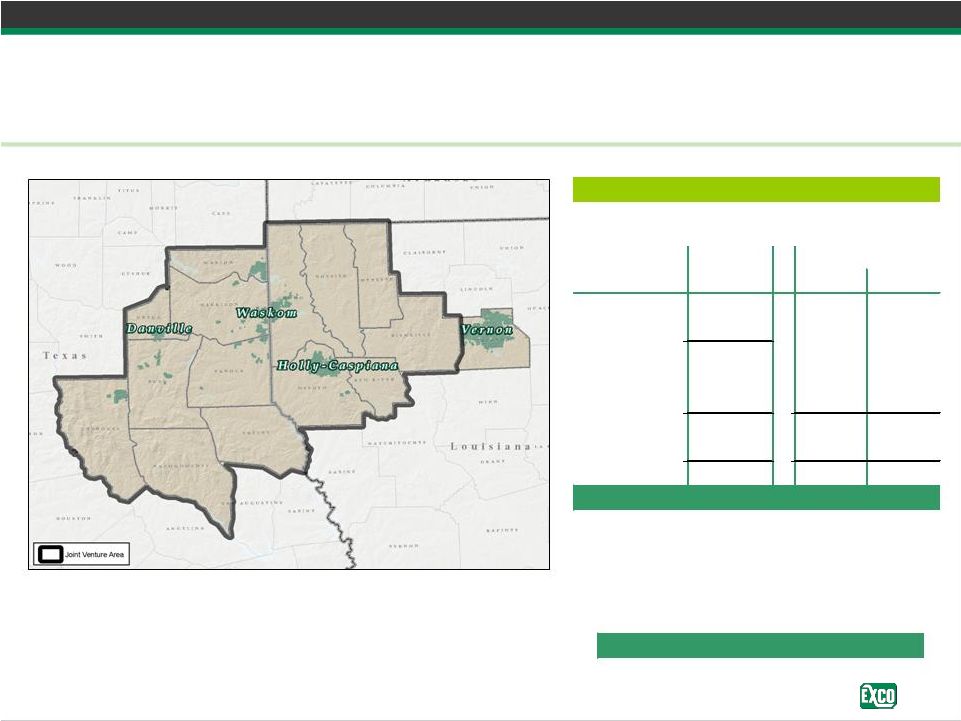 21 PPT-125-DecInvestor.12.09 East Texas / North Louisiana Division Overview Producing wells: 1,380 gross / 769 net Reserves Bcfe Gross Net PD 551 PUD 266 378 166 Total Proved 817 Probable 309 296 158 Possible 1,261 915 255 3P 2,387 1,589 579 Potential 1,403 1,468 541 Total 3,790 3,057 1,120 Locations Portfolio Highlights Current production (Mmcfe/d): 178 Reserve life (years): 12.6 Gross acreage (thousands): ~283 Net acreage (thousands): ~177 21 PPT-125-DecInvestor.12.09 |
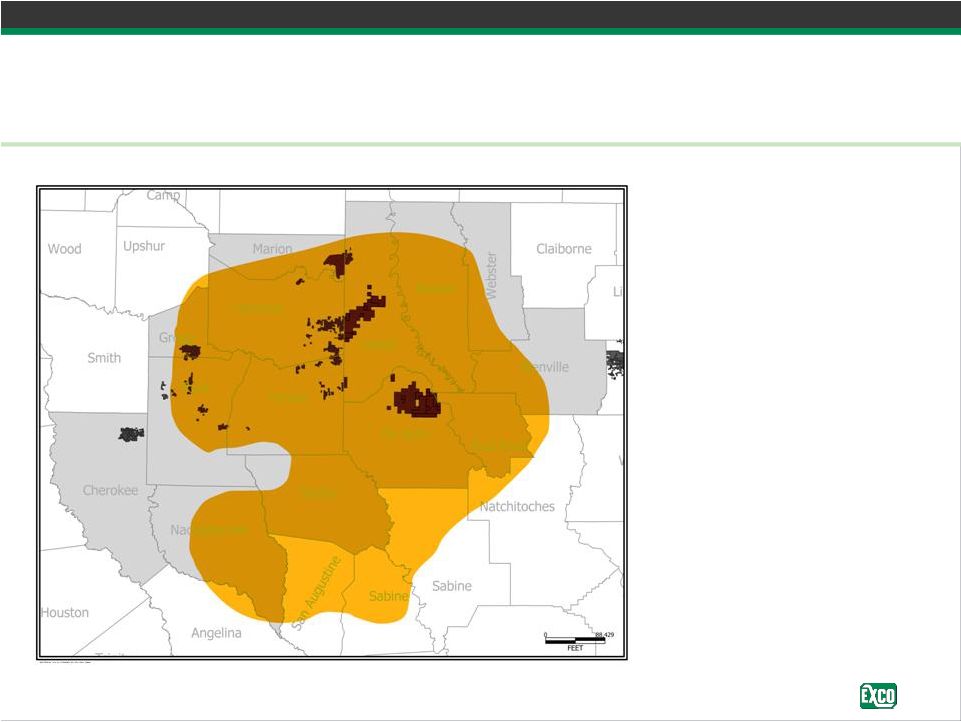
 22 PPT-125-DecInvestor.12.09 Haynesville Shale Asset Overview Producing horizontal wells: 23 gross / 6 net Average WI: ~30% Average NRI: ~23% Reserves Bcfe Gross Net PD 39 PUD 81 39 11 Total Proved 120 Probable 71 43 10 Possible 1,016 677 137 3P 1,207 759 158 Potential 1,092 853 240 Total 2,299 1,612 398 Locations Field Highlights 22 |
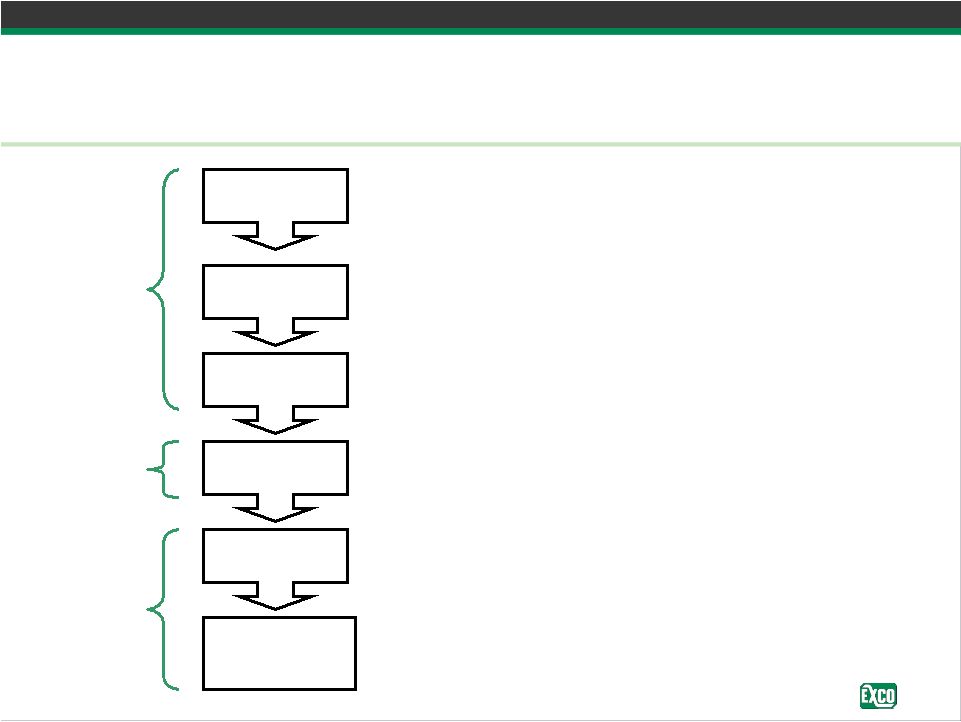
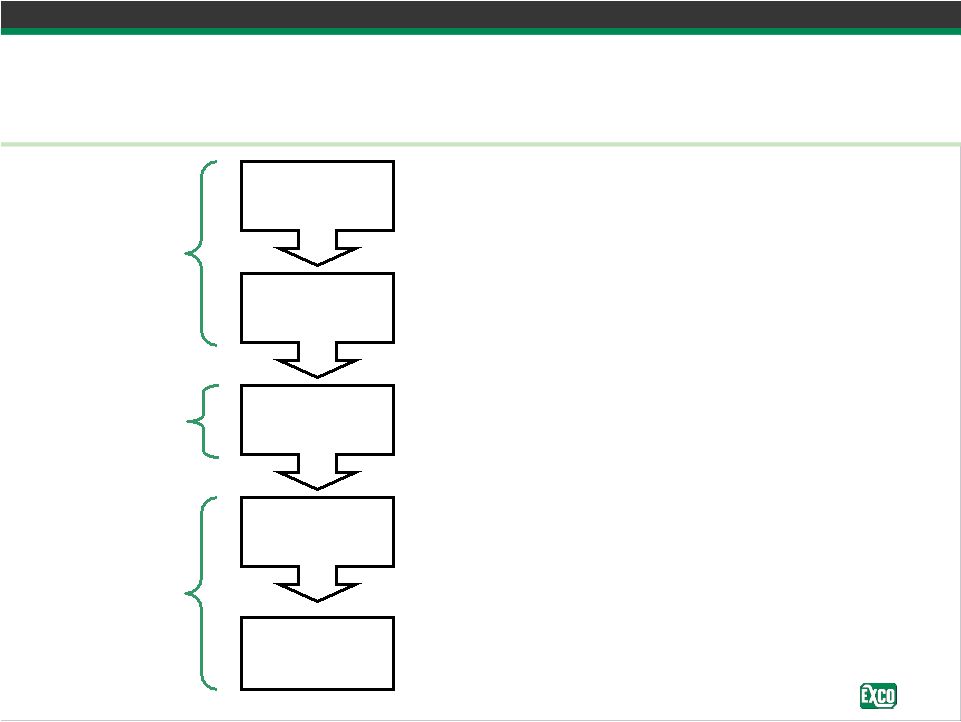 23 PPT-125-DecInvestor.12.09 Haynesville Development History Measured ramp up to achieve excellence Vertical Program Core Analysis Horizontal Testing Development Drilling Manufacturing – Test and hold acreage – Determine best landing zone – Determine best completion technique – Evaluate rock properties – Determine gas in place and reserve recovery – Optimize stimulation – Evaluate and hold acreage – Refine drilling, stimulation, and production techniques – Drill unit wells and HBP term acreage – Focus on cost reduction and well optimization – Test spacing and prepare for multi-well pad drilling – Shoot seismic to optimize horizontal layout – Plan to be in “Manufacturing” phase in 2011 – Multi-pad, multi-well drilling and simultaneous completions Explore Test Develop |
 24 PPT-125-DecInvestor.12.09 Haynesville Assets and Efforts • ~52,500 net Haynesville acres – Actively working to acquire 14,000 – 15,000 net acres to the joint venture – Significant additional opportunities continue to be identified • 2009 Haynesville activity – Initiate drilling of 42 operated horizontal wells – Have 11 operated rigs – Drilled 11 of the top 25 highest IP wells – Average IP exceeds 22 Mmcf/d • 2010 Haynesville/Bossier plans – Plan to run 14 operated rigs through 2010 – Plan to drill 125 horizontal wells (102 operated) |
 25 PPT-125-DecInvestor.12.09 Haynesville Operations Snapshot • Production: 213 Mmcf/d gross, 40.7 Mmcf/d net on 10/16/2009 – Operated: 160.2 Mmcf/d gross, 37 Mmcf/d net – OBO: 52.6 Mmcf/d gross, 3.7 Mmcf/d net – Cumulative gross Haynesville production: 24.3 Bcfe • Drilling: 11 operated horizontal rigs now drilling – 3 additional operated rigs will arrive during January 2010 – Total of 14 operated rigs throughout 2010 – Spud to rig release has dropped from 70 – 75 days initially to as low as 39 days recently • Completion: – In Q3 achieved average operated IP rate of 24.8 Mmcf/d in DeSoto Parish with IP rates from 20.5 to 30.1 Mmcf/d; one Caddo Parish completion IP’d at 10.4 Mmcf/d – Plan to complete 9 operated wells during Q4 2009 – Expect to average 25 operated completions quarterly during 2010 • Total Program: 56 spud, 45 TD’d, 37 flowing to sales – 46 horizontal wells spud (33 operated / 13 non-operated) – 27 horizontal wells flowing to sales (18 operated / 9 non-operated) – 10 vertical wells flowing to sales (10 operated / 0 non-operated)
|
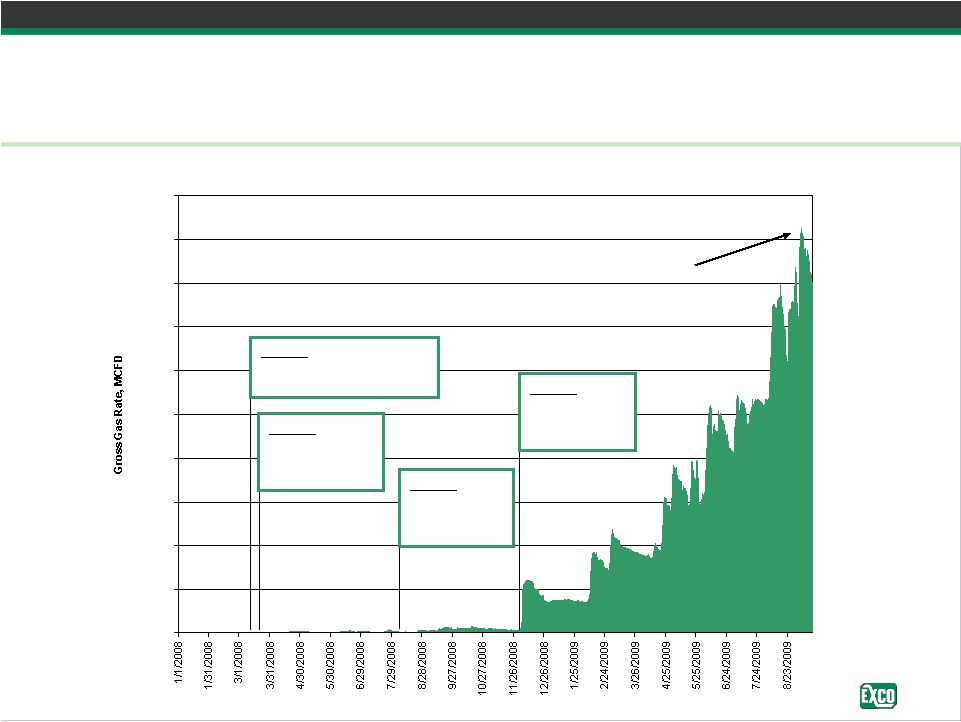 26 PPT-125-DecInvestor.12.09 EXCO Haynesville Production East Texas / North Louisiana 0 20,000 40,000 60,000 80,000 100,000 120,000 140,000 160,000 180,000 200,000 EXCO Operated Horizontal Haynesville Shale Production Currently 18 wells producing; nine completions expected in Q4 2009 with an additional 24 completions in Q1 2010 185 Mmcf/d Gross Production 3/24/08: CHK announces Haynesville as significant play 12/4/08: XCO turns first horizontal well to sales 3/14/08: XCO TD’s first Haynesville vertical well 8/16/08: XCO spuds first horizontal well |
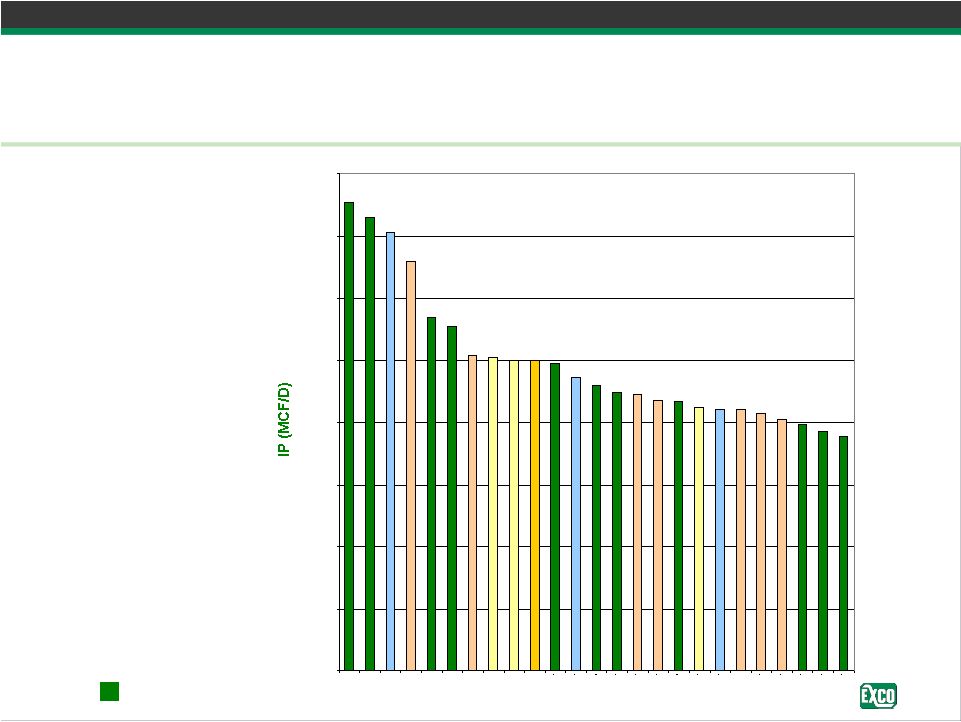 27 PPT-125-DecInvestor.12.09 Industry Best IP Rates Through September 2009 • Initial production rates reported on 165 wells across the Haynesville shale play • EXCO’s track record – 4 of the top 6 – 11 of the top 25 – 15 of the top 39 • Last 2 EXCO wells are the 2 best wells – IP’s of 30.1 and 29.6 Mmcf/d EXCO operated wells Top 25 Haynesville Shale IP’s 15,000 17,000 19,000 21,000 23,000 25,000 27,000 29,000 31,000 |
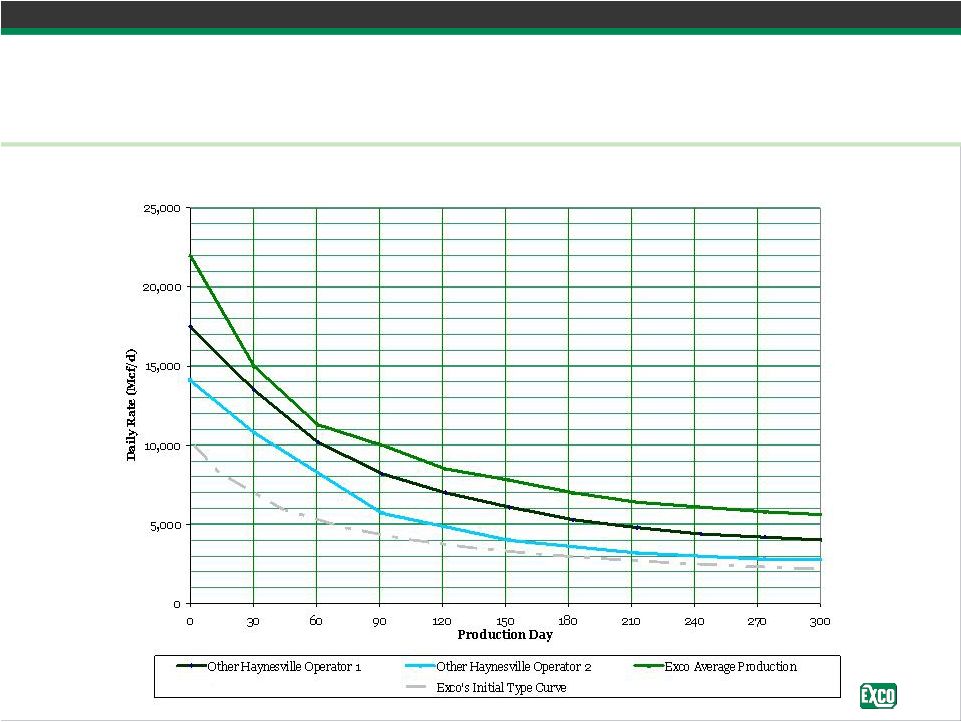 28 PPT-125-DecInvestor.12.09 Haynesville Horizontal Production Curves Consistent results outperforming original estimate and peers
|
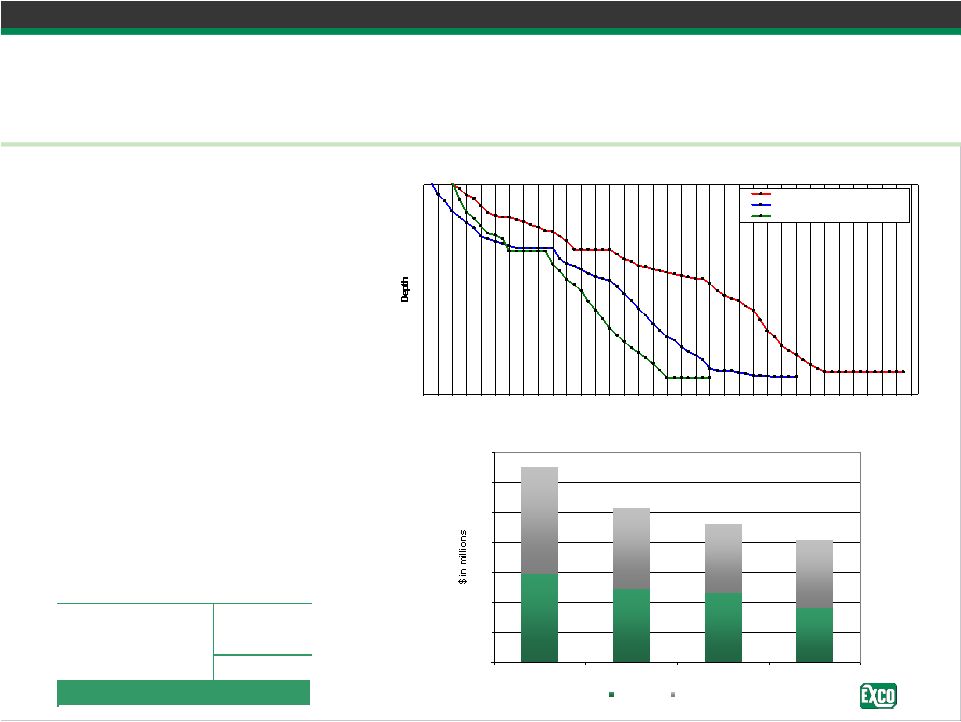 29 PPT-125-DecInvestor.12.09 Drilling and Completion Costs Realizing significant improvements in well costs with more to come • Cost reductions primarily due to decreased drilling days, improved drilling and completion processes, service cost reductions, and reduced site construction • Future cost reductions account for new rig contracts and continued improvements in drilling efficiency Haynesville Drilling & Completion Costs $0 $2 $4 $6 $8 $10 $12 $14 Q1 2009 Q2 2009 Q3 2009 Future Drilling Costs Completion Costs Drilling 22% Completion 36% Total 29% Q1 - Q3 Reduction Haynesville Horizontals - Days vs Depth 6 8 10 12 14 16 18 20 22 24 26 28 30 32 34 36 38 40 42 44 46 48 50 52 54 56 58 60 62 64 66 68 70 72 74 Days from Spud 1st Three Haynesville Wells Mid Three Haynesville Wells Last Three Haynesville Wells $13 $10 $9 $8 |
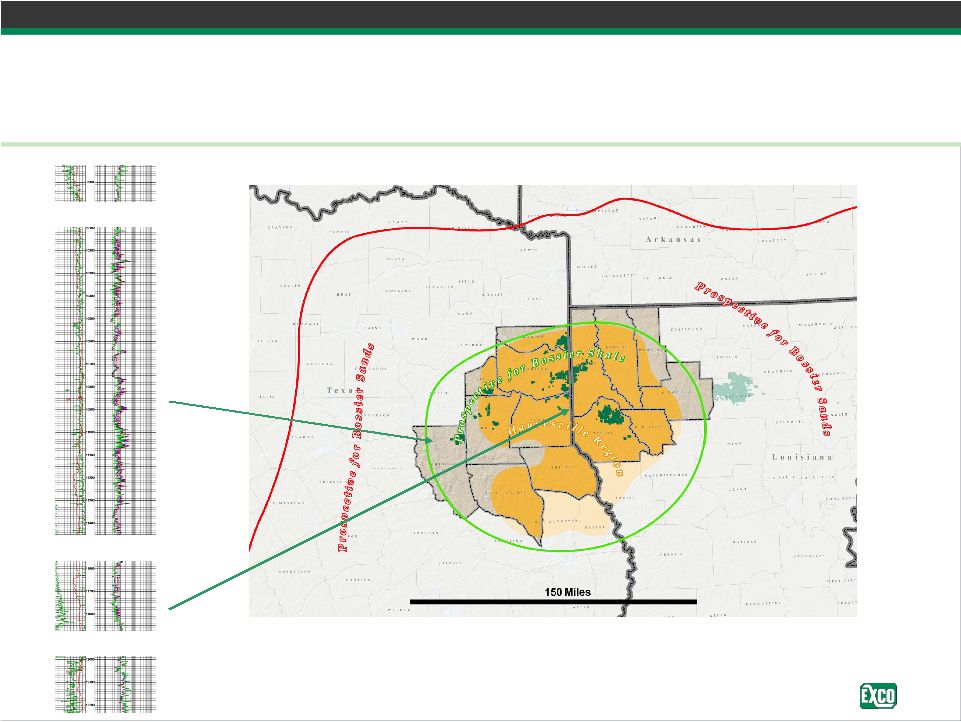 30 PPT-125-DecInvestor.12.09 Bossier The next frontier Top Bossier Top Haynesville Top Limestone +/- 10,000’ +/- 11,500’ +/- 11,900’ • Potential net gas in place on the JV acreage is ~17 Tcf • Recovery factor to be determined |
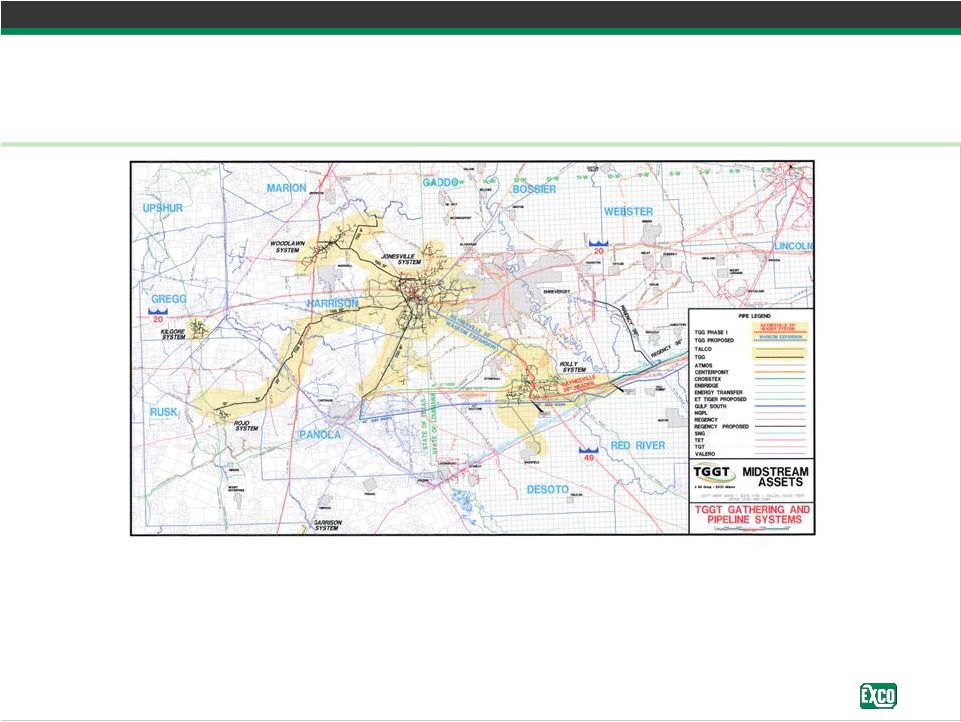 31 PPT-125-DecInvestor.12.09 EXCO Midstream Operations East Texas / North Louisiana – Positioned for growth • Finalized first stage of 36 inch diameter Haynesville header system • Adding high pressure flow lines to gather production; all of our operated wells continue to flow to sales during initial testing phase • Will have amine and glycol facilities with capacity to treat 1 Bcf/d of natural gas to meet pipeline quality requirements during 2010 |
 32 PPT-125-DecInvestor.12.09 Appalachia Division Overview Devonian Sands & Shale OH KY WV VA PA Producing wells: 6,189 gross / 5,620 net Reserves Bcfe Gross Net PD 237 PUD 96 771 762 Total Proved 333 Probable 88 641 604 Possible 76 713 602 3P 497 2,125 1,968 Potential 6,992 - 12,620 3,865 - 7,004 3,691-6,754 Total 7,489 - 13,117 5,990 - 9,129 5,659 - 8,722 Locations Portfolio Highlights Current production (Mmcfe/d): 37 Reserve life (years): 24.7 Gross acreage (thousands): 714 Net acreage (thousands): 640 |
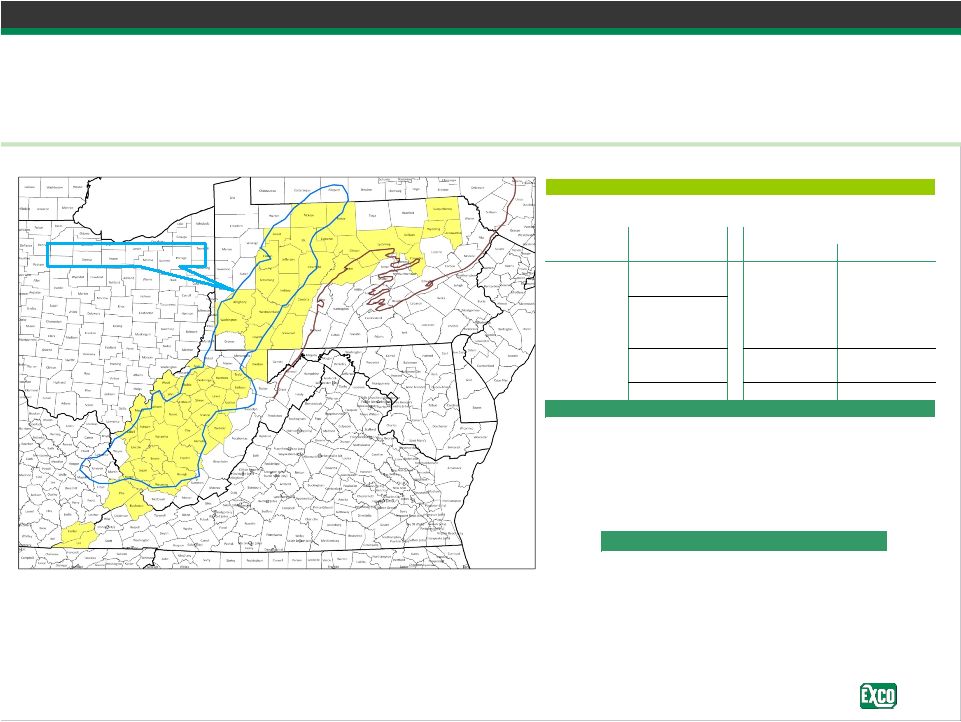
 33 PPT-125-DecInvestor.12.09 Marcellus Opportunity • Largest areal extent of the major shale plays – EXCO has 348,000 net acres in the play • Approximately 223,000 net acres in the over-pressured fairway • 70% of acreage is HBP • Key PA average WI 100%, average NRI 84% • Massive reserve potential – ~7 – 12 Tcf potential on EXCO acreage • Drilling activity and acreage value increasing in the play – Increased service company presence • Proximity to Northeast markets • Attractive returns Marcellus Fairway OH KY WV VA PA Marcellus Fairway |
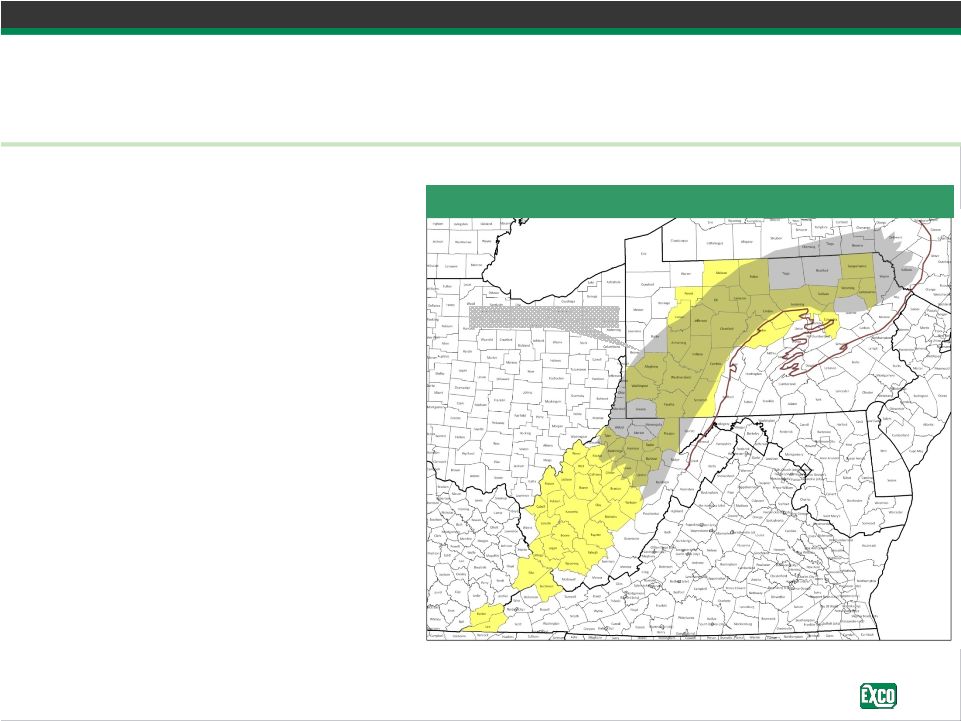
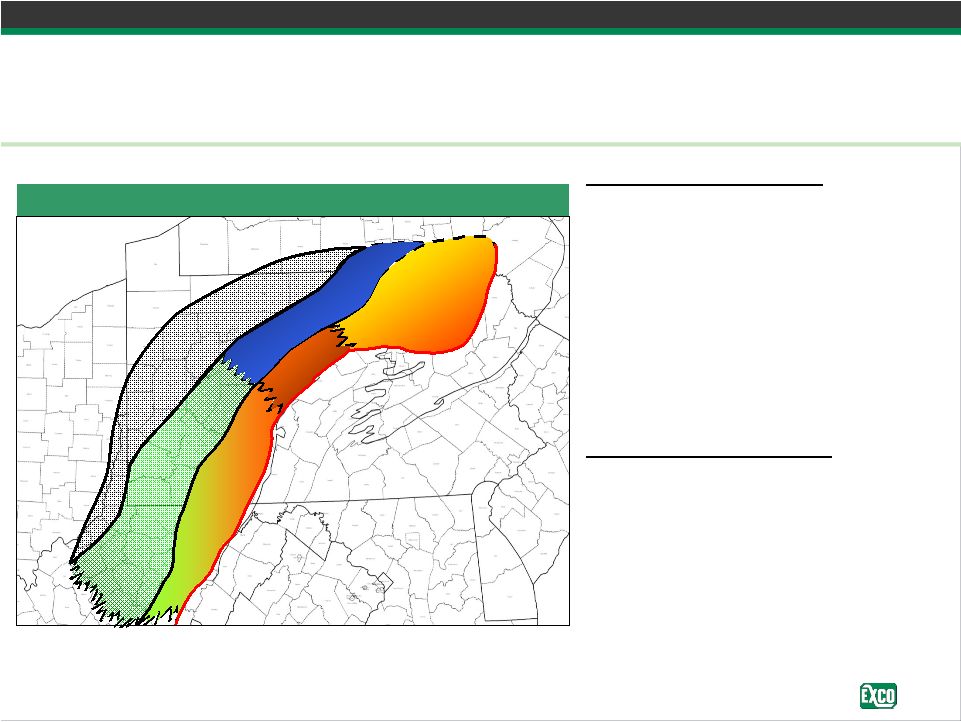   34 PPT-125-DecInvestor.12.09 Marcellus Development Strategy Identified six distinct geologic regions • Southwest – 53,000 net acres • Southeast – 18,000 net acres • Central – 69,000 net acres • North – 41,000 net acres • Northeast – 42,000 net acres • Northwest – minimal acreage • Shale thickness • Reservoir properties • Pressure • Maturity • Gas analysis • Faulting and fracturing Marcellus Leasehold Regional Distinctions NE C SE SW NW N Geologic Regions of the Marcellus |
 35 PPT-125-DecInvestor.12.09 Marcellus Development Strategy Measured ramp up to achieve excellence Vertical Program Core Analysis Horizontal Testing Development Drilling Manufacturing – Test and hold acreage – Determine best landing zone – Determine best drilling and completion practices for each area – Evaluate rock properties – Determine gas in place and reserve recovery – Optimize drilling and stimulation – Understand geo-hazards in regions – Optimize horizontal layouts – Focus on cost reduction and well optimization – Test optimal well spacing and prepare for multi-well pad drilling – Multi-well pad “Manufacturing” phase Explore Test Develop Seismic – Prioritize areas and consolidate land position – Refine drilling, stimulation, and production techniques – Drill unit and lease wells and HBP term acreage |
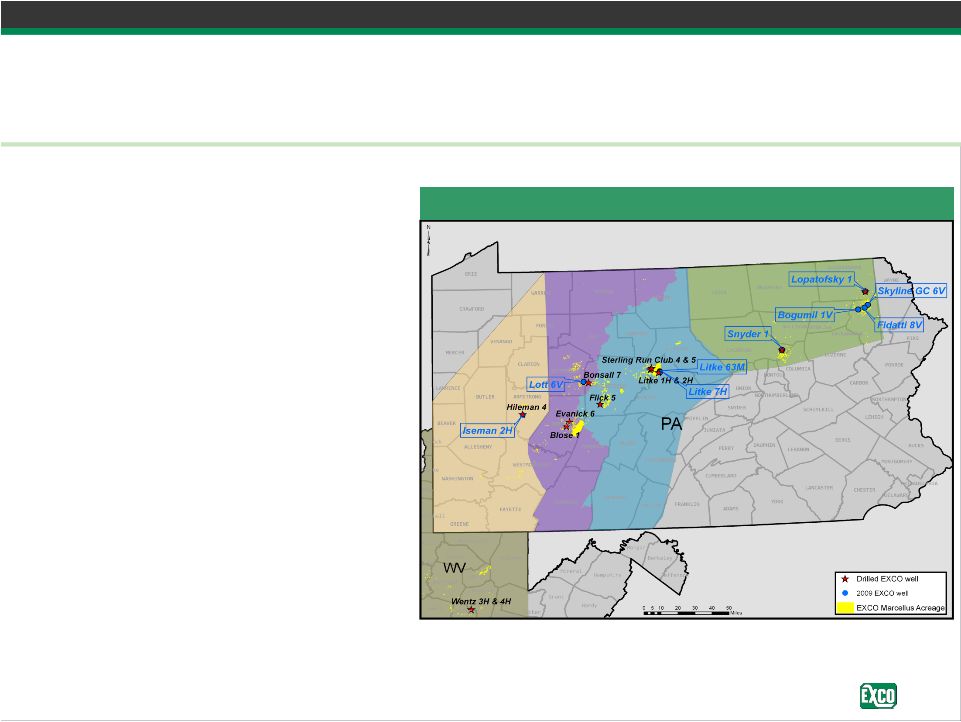 36 PPT-125-DecInvestor.12.09 • Drill to test the play: – Obtain additional reservoir data (core, pressure data, etc.) – Test drilling, completion, and production techniques – Identify horizontal drilling targets – Spud horizontal well in central PA in Q4 2009 • Acquire seismic – Identify geologic hazards – Identify favorable, naturally fractured areas to target • Solidify land position – HBP / Term – Continue to fill in existing acreage positions • Identify and develop access to gas markets • Increase permit inventory for large scale development • Plan to drill 11 horizontal operated wells during 2010 • Identify and capture growth opportunities Current Marcellus Activity Preparing to implement horizontal program 2009 Drilling Program |
 37 PPT-125-DecInvestor.12.09 Development Issues Identifying solutions to potential development issues • Land – 70% HBP allows us to dictate pace of development – Holding our limited term acreage through timely drilling • Size of play – “Plays within the Play” requires regional delineation efforts – Focused on best reservoir / economic areas for development • Water regulation and disposal requirements – Six designated staff working on water solutions – Currently operate 2 disposal wells with 1 additional planned for 2010 – Testing new frac technology that will minimize water usage – Evaluating recycle initiatives for development phase • Takeaway capacity and access to markets – Taps in place and additional in process on existing major pipelines – Adequate takeaway available for term acreage in NE Pennsylvania – Delaying some HBP acreage due to timing of new pipeline construction
|
 38 PPT-125-DecInvestor.12.09 Forward Looking Statements This presentation contains forward-looking statements, as defined in Section 27A of the Securities Act
and Section 21E of the Securities Exchange Act of 1934, or the Exchange Act. These forward-looking statements relate to, among other things, the following: • our future financial and operating performance and results; • our business strategy; • market prices; • our future use of derivative financial instruments; and • our plans and forecasts. We have based these forward-looking statements on our current assumptions, expectations and projections
about future events. We use the words "may," "expect," "anticipate," "estimate,"
"believe," "continue," "intend," "plan," "budget" and other similar words to identify forward-looking statements. You should read statements that contain these words carefully because they discuss future expectations, contain projections
of results of operations or of our financial condition and/or state other "forward- looking" information. We do not undertake any obligation to update or revise publicly any
forward-looking statements, except as required by law. These statements also involve risks and uncertainties that could cause our actual results or financial condition to materially differ from our
expectations in this presentation, including, but not limited to: • fluctuations in prices of oil and natural gas; • imports of foreign oil and natural gas, including liquefied natural gas; • future capital requirements and availability of financing; • continued disruption of credit and capital markets and the ability of financial institutions to honor
their commitments, such as the events which occurred during the third quarter of 2008
and thereafter, for an extended period of time; • estimates of reserves and economic assumptions; • geological concentration of our reserves; • risks associated with drilling and operating wells; • exploratory risks, including our Marcellus and Huron shale plays in Appalachia and our Haynesville/Bossier
shale play in East Texas/North Louisiana; • risks associated with operation of natural gas pipelines and gathering systems; • discovery, acquisition, development and replacement of oil and natural gas reserves; • cash flow and liquidity; • timing and amount of future production of oil and natural gas; • availability of drilling and production equipment; • marketing of oil and natural gas; • developments in oil-producing and natural gas-producing countries; • title to our properties; • competition; • litigation; • general economic conditions, including costs associated with drilling and operation of our properties;
• environmental or other governmental regulations, including legislation to reduce emissions of greenhouse
gases; • receipt and collectibility of amounts owed to us by purchasers of our production and counterparties to our
derivative financial instruments; • decisions whether or not to enter into derivative financial instruments; • events similar to those of September 11, 2001; • actions of third party co-owners of interests in properties in which we also own an interest;
• fluctuations in interest rates; and • our ability to effectively integrate companies and properties that we acquire.. |
 39 PPT-125-DecInvestor.12.09 Forward Looking Statements (continued) We believe that it is important to communicate our expectations of future performance to our
investors. However, events may occur in the future that we are unable to accurately predict, or over which we have no control. You are cautioned not to place undue reliance on a
forward-looking statement. When considering our forward-looking statements, keep in mind the risk factors and other cautionary statements in this presentation, and the risk factors included
in the Annual Reports on Form 10-K and our Quarterly Reports on Form 10-Q. Our revenues, operating results, financial condition and ability to borrow funds or obtain additional
capital depend substantially on prevailing prices for oil and natural gas, the availability of
capital from our revolving credit facilities and liquidity from capital markets. Declines in oil or natural gas prices may materially adversely affect our financial condition, liquidity, ability to obtain financing and operating results. Lower oil or natural gas prices also
may reduce the amount of oil or natural gas that we can produce economically. A decline in oil and/or natural gas prices could have a material adverse effect on the estimated value and estimated
quantities of our oil and natural gas reserves, our ability to fund our operations and our
financial condition, cash flow, results of operations and access to capital. Historically, oil and natural gas prices and markets have been volatile, with prices fluctuating widely, and they are likely to continue to be volatile. The SEC has generally permitted oil and natural gas companies, in filings made with the SEC, to disclose
only proved reserves that a company has demonstrated by actual production or conclusive
formation tests to be economically and legally producible under existing economic and operating conditions. We use the terms “probable”, “possible”, “potential” or “unproved” to describe volumes of reserves potentially recoverable through additional drilling or
recovery techniques that the SEC’s guidelines prohibit us from including in filings with the SEC. These estimates are by their nature more speculative than estimates of proved reserves and
accordingly are subject to substantially greater risk of being actually realized by the
company. While we believe our calculations of unproved drillsites and estimation of unproved reserves have been appropriately risked and are reasonable, such calculations and estimates have not been reviewed by third party engineers or appraisers. Investors are urged to consider
closely the disclosure in our Annual Report on Form 10-K for the year ended December 31,
2008 which is available on our website at www.excoresources.com under the Investor Relations tab or by calling us at 214-368-2084. |