Attached files
| file | filename |
|---|---|
| 8-K - FORM 8-K - Bancorp, Inc. | d8k.htm |
 NASDAQ: TBBK December 2009 Exhibit 99.1 |
 1 Forward Looking Statements Safe Harbor Statement under the Private Securities Litigation Reform Act of 1995:
Statements in this presentation regarding The Bancorp, Inc.’s business
which are not historical facts are "forward-looking statements" that involve risks and uncertainties. These statements may be identified by the use of forward-looking terminology, including the words “may,” “believe,” “will,” “expect,” “anticipate,” “estimate,” “continue,” or similar words. For further discussion of these risks and uncertainties, see
The Bancorp, Inc.’s filings with the SEC, including the “risk factors” section of The Bancorp Inc.’s prospectus supplement. These risks and uncertainties could cause actual results to differ materially from those projected in the
forward-looking statements. The forward looking statements speak only as
of the date of this presentation. The Bancorp, Inc. does not undertake to publicly revise or update forward-looking statements in this presentation to reflect events or circumstances that arise after the date of this presentation, except as may be required under applicable law. |
 2 TBBK – Planning for Safety, Soundness and Growth Capital: capacity to grow and safety net for economic conditions Strong Senior Management: knowledgeable and experienced Disciplined Growth: driven by TBBK’s business strategy Assets: simple and local Deposits: low cost and scalable |
 Capital
Ratios and Selected Financial Data 3 As of or for the As of and for three months ended the year ended September 30, 2009 December 31, 2008 Selected Capital and Asset Quality Ratios: Equity/assets 12.08% 10.07% Tier I capital to average assets 13.11% 10.10% Tier 1 capital to total risk-weighted assets 15.61% 11.72% Total Capital to total risk-weighted assets 16.80% 12.87% Allowance for loan and lease losses to total loans 1.22% 1.20% Balance Sheet Data: (dollars in thousands) Total Assets $
2,041,034 $
1,792,375 Total loans, net of unearned costs (fees) 1,513,131 1,449,349 Allowance for loan and lease losses 18,436 17,361 Total cash and cash equivalents 344,992 179,506 Deposits 1,775,475 1,525,362 Short term borrowings - 61,000 Shareholders' equity 246,544 180,403 Selected Ratios: Return on average assets 0.38% nm Return on average common equity 3.32% nm Net interest margin 3.74% 3.44% Book value per share (1) $
7.69 $
9.21 (1)
Excludes Series B Preferred Shares issued to the US Treasury and the associated book value nm - not meaningful |
 4 Strong Senior Management Team with a Wealth of Experience Highly experienced senior management team with an aggregate of over 140 years of
experience providing middle market banking services – Management has a significant history together as most are former executives of a prior bank which was sold in November 1999 Executive Title Banking Experience Betsy Z. Cohen Chief Executive Officer, Chairman of the Bancorp Bank 35 years Frank M. Mastrangelo President & Chief Operating Officer 17 years Paul Frenkiel Executive Vice President & Chief Financial Officer 25 years Donald F. McGraw, Jr. Executive Vice President & Chief Credit Officer 32 years Arthur M. Birenbaum Executive Vice President & Commercial Lending 29 years Scott R. Megargee Executive Vice President & Chief Lending Officer 25 years Peter Chiccino Executive Vice President & Chief Information Officer 15 years Jeremy Kuiper Managing Director (Stored Value Solutions) 15 years |
 5 Business Model: A Distinct Business Strategy
DEPOSITS Private Label Banking: Capture stable, low-cost core deposits – Health Care – HSA / FSA / HRA – Merchant Processing – Prepaid Card Issuing – Asset Managers – DTC Eligible / ERISA Qualified account (MDA) – Safeharbor IRA Rollovers – 1031 Exchange Generate low-cost core deposits through personal and business checking and savings accounts through the community bank – Check 21 / Remote Deposit Capture Net Interest Margin INCOME Non-Interest Income: Merchant Processing & Debit Issuing Fees LOANS Originates high-credit quality, well collateralized loans to local businesses and individuals – Commercial lending, commercial & residential real estate, construction lending Automobile Fleet Leasing Private Label Banking (National) – Asset Managers – generate consumer loans, HELOC’s, installment loans and securities backed loans A commercial bank founded in 2000 headquartered in Wilmington, Delaware with
approximately $2.0 billion in assets, $1.5 billion in outstanding loan
balances and $1.8 billion of deposits Employs a primarily branchless deposit
strategy that delivers a full array of commercial and consumer banking services both locally and nationally through private label banking products |
 Well-Positioned in Attractive, Stable Markets Target market for commercial lending is the greater Philadelphia-Wilmington
metropolitan area – Consists of the 12 counties surrounding Philadelphia and Wilmington including Philadelphia, Delaware, Chester, Montgomery, Bucks and Lehigh Counties in Pennsylvania, New Castle County in Delaware and Mercer, Burlington, Camden, Ocean and
Cape May Counties in New Jersey Philadelphia and the surrounding markets
represent a large base of population and economic activity, with sustainable
growth and attractive demographic characteristics in the suburban
communities. Unemployment in the Bancorp’s lending geography compares
favorably to the national level of 10.2% 6 County 2009 Population 2009 Households Population Change ‘00-’09 Act. ‘08-’14 Est. 2009 Median HH Income Household Income Growth ‘00-’09 Act. ‘08-’14 Est. Unemployment New Castle, DE 533,216 6.6% 2.5% 200,894 $70,026 33.0% 5.8% 7.9% Burlington, NJ Camden, NJ Cape May, NJ Mercer, NJ Ocean, NJ 452,426 519,742 100,834 370,793 575.822 6.9% 2.1% (1.5%) 5.7% 12.7% 2.3% 0.7% (0.9%) 2.0% 4.9% 167,511 192,004 42,787 132,354 226,519 $77,113 $61,128 $54,354 $75,668 $60,787 31.4% 27.1% 30.5% 33.0% 31.0% 5.7% 8.9% 7.3% 4.7% 11.6% 7.9% 9.5% 9.7% 7.4% 8.9% Bucks, PA Chester, PA Delaware, PA Lehigh, PA Montgomery, PA Philadelphia, PA Delaware New Jersey Pennsylvania US Source: SNL Financial 634,223 499,763 558,969 342,012 786,653 1,452,449 6.1% 15.3% 1.5% 9.6% 4.9% (4.3%) 2.2% 6.6% 0.1% 4.8% 1.9% (2.7%) 234,527 184,056 209,124 134,547 302,908 568,420 $79,444 $87,308 $66,300 $58,555 $80,212 $41,408 33.0% 34.7% 32.3% 34.3% 31.8% 34.5% 5.0% 7.4% 5.3% 5.0% 5.0% 9.7% 7.4% 6.3% 7.5% 8.9% 6.9% 9.9% 885,393 8,834,947 12,598,860 309,731,508 13.0% 5.0% 2.6% 10.1% 5.7% 1.7% 0.8% 4.6% 339,622 3,216,258 4,958,883 116,523,156 $61,789 $72,809 $53,225 $54,719 30.2% 32.2% 32.7% 29.8% 5.4% 5.6% 4.9% 4.1% 8.7% 9.2% 8.4% 9.5% |
 7 Asset-Generating Strategies: Business-Line Overview Community Bank Offers traditional community banking products and services Leverages the business relationships developed during management team’s tenure in banking Targets highly fragmented Philadelphia-Wilmington banking market Leasing Portfolio – Automobile Fleet Leasing Portfolio Eastern Corridor Average Transaction – 8-15 automobiles – $350,000 Acquired Mears Leasing in January 2005 Private Client – Deposit and asset gathering channel – Currently have 24 partners representing approximately $110 billion of assets under management SEI Investments, Legg Mason – Generates consumer loans, HELOC’s, installment loans, and securities
backed loans – Represents approximately 10% of loan portfolio at September 30, 2009 As with funding, The Bancorp employs a multi-channel growth strategy regarding loan origination, with the primary driver being its regional commercial banking operations September 30, 2009 Category Balance Avg. Yield Community Bank $ 1,285,312 4.84% Leasing 81,097 8.91% Private Client 143,435 3.50% Other 3,287 na |
 8 Historical Loan Portfolio Overview Proven track record at originating high quality loans – Loan / Deposit ratio currently stands at approximately 85% (1) Prior to December 31, 2007, construction loans were not broken out by category
Robust growth through strong community relationships, while maintaining
conservative underwriting standards (dollars in thousands) Year ended December 31, September 30, Category 2004 2005 2006 2007 2008 2009 Commercial $ 89,327 $ 119,654 $ 199,397 $ 325,166 $ 353,219 $ 394,316 Commercial Mortgage 140,755 190,153 327,639 369,124 488,986 562,611 Construction 97,239 168,149 275,079 307,614 305,889 227,226 Direct Financing Leases, net 44,795 81,162 92,947 89,519 85,092 81,097 Residential Mortgage 31,388 62,378 62,413 50,193 57,636 75,463 Consumer Loans and Other 24,894 61,017 108,374 144,882 157,446 170,238 Total Loans $ 428,398 $ 682,513 $ 1,065,849 $ 1,286,498 $ 1,448,268 $ 1,510,951 Supplemental loan data (1): Construction 1-4 family $167,485 $163,718 $119,752 Construction commercial, acquisition and development 140,129 142,171 107,474 $307,614 $305,889 $227,226 |
 9 Asset Quality Overview Non-Performing Loans / Total Loans (1) Regional peers include publicly-traded Mid-Atlantic commercial banks with
assets between $1 billion and $4 billion (2) Ratio was not meaningful for The
Bancorp prior to 2007 due to low levels of non-performing loans Source:
SNL Financial (3) Non-performing loans are defined as non-accrual
loans Reserves / Loans |
 Current
Loan Portfolio & Asset Quality Overview at 9/30/09 Non-performing
loans of 0.78% is significantly lower than peer 10 Category Commercial Commercial Mortgage Construction Direct Financing Leases, Net Residential Mortgage Security-Back Loans and Other Total Loans Non-performing loans are defined as non-accrual loans. Outstanding Balance $394,316 562,611 227,226 81,097 75,413 170,238 $1,510,901 Pct. Of Total Loans 26% 37% 15% 5% 5% 12% 100% Non-Accrual Total Loans $3,801 3,925 2,111 - 1,790 149 $11,776 Non-Accrual/ Total Loans 0.25% 0.26% 0.14% 0.00% 0.12% 0.01% 0.78% OREO - - - - - - - 30-89 Days Delinquent 90+ Days Delinquent - $1,661 1,133 2,193 - 191 $5,178 - $8,102 3,461 254 3,195 - $15,012 |
 11 Track Record of Significant Growth Since Inception Since 2000, The Bancorp has grown total assets at a compound annual growth rate of over
40% (dollars in thousands) |
 12 Deposit-Generating Strategies: Business-Line Overview “Private-Label” Banking – Provider of private label banking services for non-bank financial services
businesses – Operate over 300 unique programs – Access large customer groups at very low acquisition costs – Private label partners derive from our five main sources: Health Care Prepaid Card Issuing Private Client Merchant Processing 1031 Exchange Services Remote Deposit Capture – Market leader in the industry Distributed over 300 scanners Processed over 180,777 transactions representing in excess of $610 million in deposits
for the nine months ended September 30, 2009 The Bancorp employs a
multi-channel growth strategy in gathering attractively-priced, long-duration deposits on a national scale |
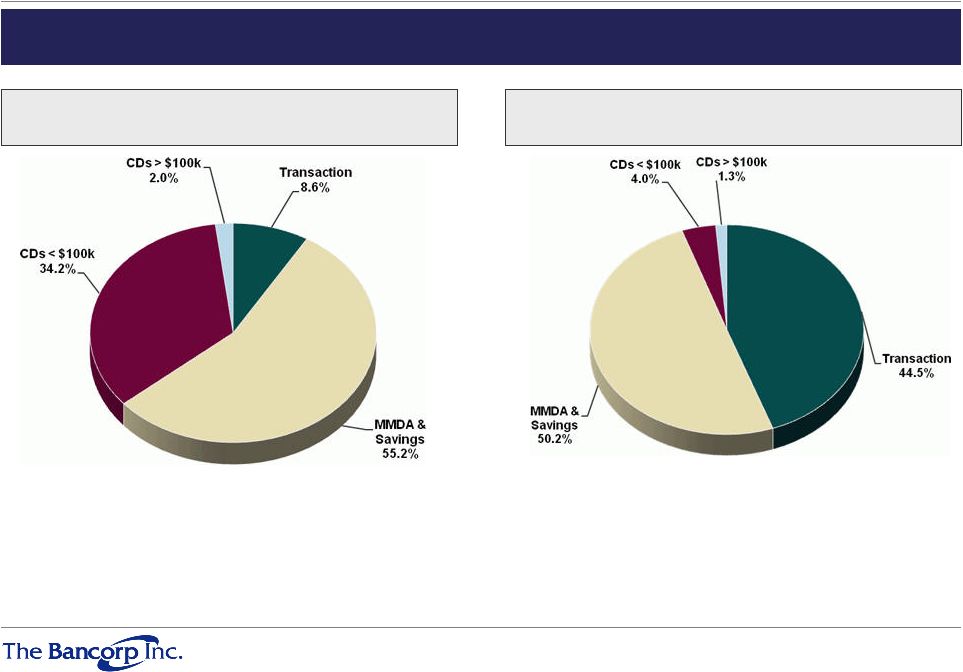 13 The Bancorp has leveraged its private label partnerships to grow core deposits meaningfully in recent periods, and expects that business to continue its growth through increased market
penetration September 30, 2007 September 30, 2009 Total Deposits: $1.1bn Average Cost: 4.40% Core Deposits: 63.8% Total Deposits: $1.8bn Average Cost: 0.94% Core Deposits: 94.7% Growth Engine: Strong Growth in Deposit
Business Lines at Low Cost |
 14 Growth Engine: Strong Growth in Deposit
Business Lines at Low Cost September 30, 2007 September 30, 2009 Category Balance Avg. Cost Community Bank $ 392 1.07% Health Care 278 1.54% Stored Value 799 0.14% Private Client 183 1.89% Merchant Processing 51 0.33% Category Balance Avg. Cost Community Bank $ 566 4.84% Health Care 82 3.71% Stored Value - Private Client 44 1.79% Merchant Processing 36 2.24% Significant growth in stored value, health care and other deposit business lines support significantly lower average cost of deposits |
 15 Private Label by Remaining Contractual Term < 1 year 41.0% 3 < > 5 years 24.0% 1 < > 3 years 35.0% Deposit-Generating Strategies: Attractive in Cost and
Duration The Bancorp has long term (in many cases exclusive) agreements in place with its private label banking partners. 90% of agreements contain provisions to automatically renew at maturity |
 16 Deposit-Generating Strategies: Growing Market Share in Expanding Markets Healthcare Affinity Relationships The Bancorp Bank is currently the 6th largest custodian in the space in 2008, according to Consumer Directed Health Care's March 2009 survey (1) Partner with insurance carriers, third party administrators, and large brokerage firm for distribution Dynamics of the healthcare insurance industry are generating rapid growth the HSA market – Between January 2008 to January 2009, there was an increase of 46.1% in the number of HSAs (2) – During that same period, HSA custodians and administrators reported that assets grew by 62.6% (2) – Since 2003, the number of Americans with HSA / HDHP has grown to over 8 million from a base of 3 million (3) – Expected to continue growth trends, reaching 11-13 million accounts and assets of $35 to $45 billion (3) (1) Insider Consumer Directed Health Care (2) Celent, “HSA Benchmarking Analysis: Market Trends and Economics 2009,"
March 2009 (3) AHIP’s Center for Policy and Research, January 2009 census HSA/High-Deductible Health
Plans (4) Nilson Report June 2009 (5) Mercator Advisory Group Prepaid Card Affinity Relationships Market leader in a rapidly growing market for open loop prepaid debit cards – 5 largest prepaid commercial debit card issuer (4) – 21 overall commercial card issuer (4) Through 2011, the aggregate size of the market is forecasted to grow at a substantial rate - Forecasted growth of open loop products to $125 billion in 2011, compared to $39 billion in 2007 (5) Industries largest Agent Bank gift card issuer Serve clients such as Higher One, Western Union, Digital Insight, Deluxe, Incomm, & Univision th st |
 17 Deposit-Generating Strategies: Growing
Market Share in Expanding Markets Private Client Affinity
Relationships • Private Label deposit and lending services to limited purpose trust companies - Currently have 27 partners representing approximately $128 billion of assets under management - Over 7,000 investment advisors serving more than 280,000 clients - SEI Investments, Legg Mason • Master Demand Account (MDA) - DTC / NSCC traded ERISA Qualified bank deposit account - Trades on the DTC & NSCC like Money Market Mutual Fund - FDIC insurance passed through to 401(k) participant - Schwab, Matrix, Sunguard, Daily Access • Safeharbor IRA Rollovers - Rollover Systems, WMSI Merchant Processing Relationships • 26th largest bank acquiring portfolio through June 30, 2009 • Annualized processing volume in excess of $3 billion • 3rd party ACH originators, ISO Network (Independent Service Organizations) • BillMatrix; BankServ, TSYS, Planet Payments 1031 Exchange Relationships • Provide value added services to Qualified Intermediaries • 23 relationships nationwide |
 Disciplined Acquisitions: Diverse, but complementary to augment organic growth 18 Mears Motor Livery Corp Acquisition Deal Overview: Target: Mears Motor Livery Corp Seller: Investor Group Deal Type: Specialty Finance Company Announced Deal Value ($MM): $ 5.0 Status: Completed Completion Date: 1/3/2005 Deal Summary: Wilmington, DE-based Bancorp Inc. has acquired Orlando, FL-based Mears Motor Livery Corporation from James C. Hartman and Arrow Holdings. Mears is an automobile leasing business. Consideration Breakout: Cash ($MM): $ 1.0 Common Stock ($MM): $ 4.0 Common Stock Issued (shares): 253,126 Stored Value Solutions Acquisition Deal Overview: Target: Stored Value Solutions Business Seller: Marshall BankFirst Corporation Deal Type: Financial Technology Company Announced Date Value ($MM): $ 60.6 Status: Completed Completion Date: 11/30/2007 Deal Summary: Wilmington, DE-based Bancorp Inc. has acquired the Stored Value Solutions business of Minneapolis MN-based Marshall BankFirst Corp. unit Sioux Falls, SD-based BankFirst. Stored Value Solutions provides customized and secure program development and issuing services to national stored value program managers. Consideration Breakout: Cash ($MM): $ 48.5 Common Stock ($MM): $ 12.1 Common Stock Issued (shares): 722,733 American Home Bank Acquisition Deal Overview: Target: American Home Bank Seller: American Home Mortgage Holdings Deal Type: Bank & Thrift Company Announced Deal Value ($MM): $ 7.0-$ 11.0 Status: Pending Expected Completion Date: 12/1/2009-1/31/2010 Deal Summary: Wilmington, DE-based Bancorp Inc. has agreed to acquire Melville, NY-based American Home Mortgage Holdings Inc.’s Chicago, IL-based American Home Bank. Consideration Breakout: Cash ($MM): $ 7.0-$ 11.0 |
 Investment Considerations 20-30 year Management Experience through all economic cycles Stable Philadelphia regional economy Stable, increasing, prepaid card deposits at 0% rate Infrastructure investment from relationships with industry leaders Above peer loan quality Structurally lower interest costs in normal rate environments Infrastructure starting to pay off in DDA growth Emphasis on high quality growth with opportunities in multiple business lines 19 |