Attached files
| file | filename |
|---|---|
| 8-K - FORM 8-K - ARCH RESOURCES, INC. | c54922e8vk.htm |
Exhibit 99.1

| FBR Capital Markets 2009 Fall Investor Conference John Eaves, President and Chief Operating Officer Arch Coal, Inc. New York City December 2009 |
| Forward-Looking Information This presentation contains “forward-looking statements” – that is, statements related to future, not past, events. In this context, forward-looking statements often address our expected future business and financial performance, and often contain words such as “expects,” “anticipates,” “intends,” “plans,” “believes,” “seeks,” or “will.” Forward-looking statements by their nature address matters that are, to different degrees, uncertain. For us, particular uncertainties arise from changes in the demand for our coal by the domestic electric generation industry; from legislation and regulations relating to the Clean Air Act and other environmental initiatives; from operational, geological, permit, labor and weather-related factors; from fluctuations in the amount of cash we generate from operations; from future integration of acquired businesses; and from numerous other matters of national, regional and global scale, including those of a political, economic, business, competitive or regulatory nature. These uncertainties may cause our actual future results to be materially different than those expressed in our forward-looking statements. We do not undertake to update our forward-looking statements, whether as a result of new information, future events or otherwise, except as may be required by law. For a description of some of the risks and uncertainties that may affect our future results, you should see the risk factors described from time to time in the reports we file with the Securities and Exchange Commission. |
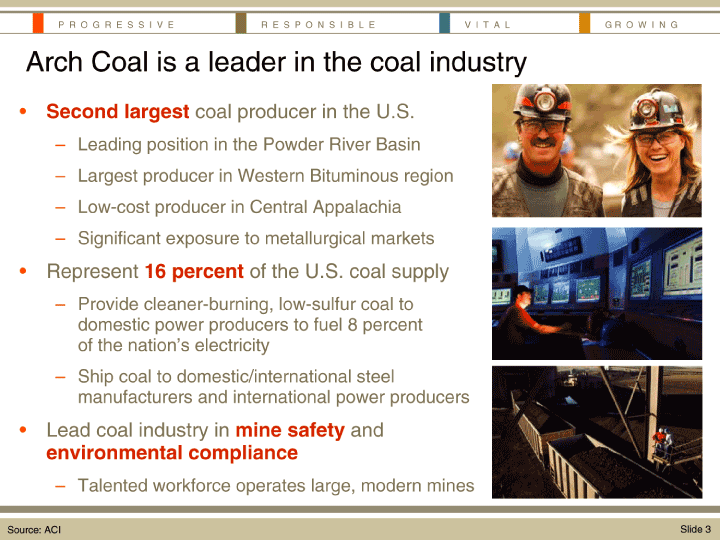
| P R O G R E S S I V ER E S P O N S I B L EV I T A L G R O W I N G Arch Coal is a leader in the coal industry |
| · Second largest coal producer in the U.S. – Leading position in the Powder River Basin – Largest producer in Western Bituminous region – Low-cost producer in Central Appalachia – Significant exposure to metallurgical markets |
| · Represent 16 percent of the U.S. coal supply |
| – Provide cleaner-burning, low-sulfur coal to domestic power producers to fuel 8 percent of the nation’s electricity – Ship coal to domestic/international steel manufacturers and international power producers |
| •Lead coal industry in mine safety and environmental compliance –Talented workforce operates large, modern mines Source: ACI Slide 3 |
| P R O G R E S S I V E R E S P O N S I B L E V I T A L G R O W I N G State of Coal Markets Slide 4 |
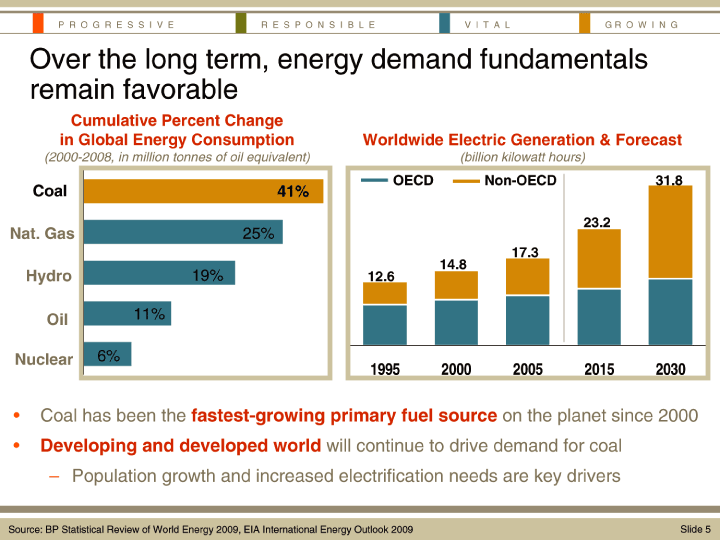
| P R O G R E S S I V E R E S P O N S I B L EV I T A L G R O W I N G Over the long term, energy demand fundamentals remain favorable Cumulative Percent Change in Global Energy Consumption Worldwide Electric Generation & Forecast |
| (2000-2008, in million tonnes of oil equivalent)(billion kilowatt hours) OECDNon-OECD31.8 Coal 41% 23.2 Nat. Gas25% 17.3 14.8 Hydro19% 12.6 Oil11% Nuclear6% 19952000 2005 20152030 |
| •Coal has been the fastest-growing primary fuel source on the planet since 2000 •Developing and developed world will continue to drive demand for coal –Population growth and increased electrification needs are key drivers Source: BP Statistical Review of World Energy 2009, EIA International Energy Outlook 2009 Slide 5 |
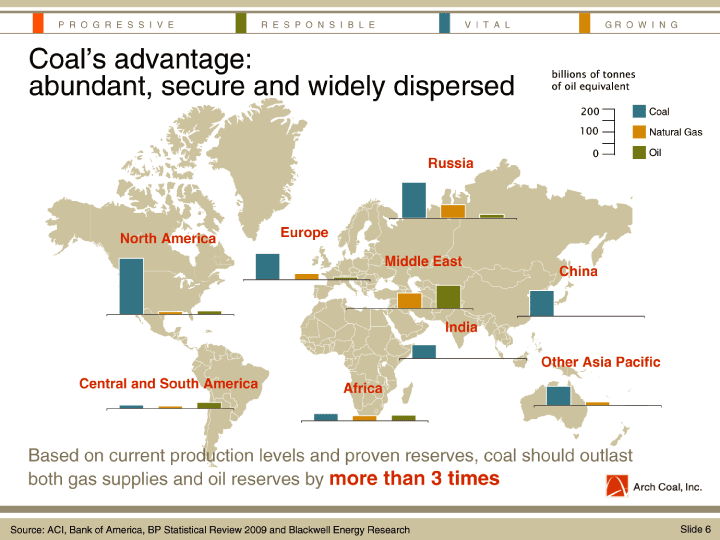
| P R O G R E S S I V E R E S P O N S I B L E V I T A LG R O W I N G Coal’s advantage: |
| billions of tonnes abundant, secure and widely dispersed of oil equivalent 200Coal 100 Natural Gas 0 Oil Russia North America Europe Middle East China India Other Asia Pacific Central and South AmericaAfrica |
| Based on current production levels and proven reserves, coal should outlast both gas supplies and oil reserves by more than 3 times |
| Source: ACI, Bank of America, BP Statistical Review 2009 and Blackwell Energy Research Slide 6 |
| P R O G R E S S I V ER E S P O N S I B L EV I T A L G R O W I N G |
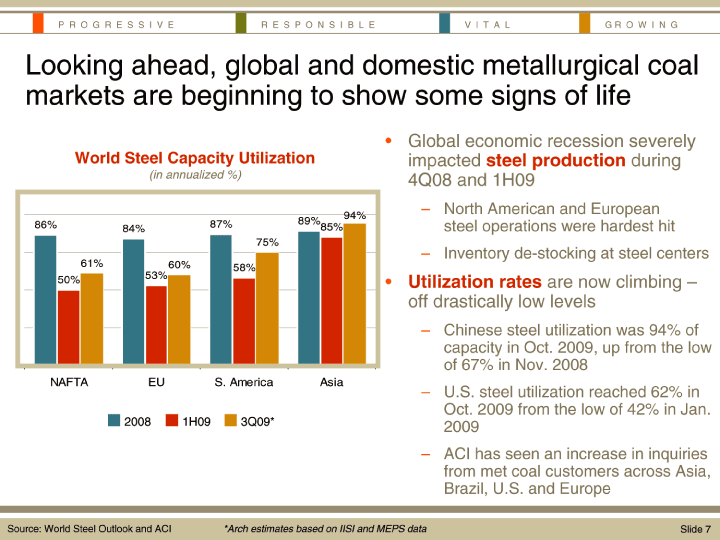
| Looking ahead, global and domestic metallurgical coal markets are beginning to show some signs of life · Global economic recession severely World Steel Capacity Utilization impacted steel production during (in annualized %) 4Q08 and 1H09 |
| – North American and European 94% 86% 87% 89% 84% 85% steel operations were hardest hit 75% – Inventory de-stocking at steel centers 61% 60% 58% |
| 50% 53% • Utilization rates are now climbing –off drastically low levels |
| – Chinese steel utilization was 94% of capacity in Oct. 2009, up from the low of 67% in Nov. 2008 NAFTAEU S. AmericaAsia – U.S. steel utilization reached 62% in Oct. 2009 from the low of 42% in Jan. 20081H09 3Q09*2009 |
| – ACI has seen an increase in inquiries from met coal customers across Asia, Brazil, U.S. and Europe Source: World Steel Outlook and ACI*Arch estimates based on IISI and MEPS dataSlide 7 |
| P R O G R E S S I V E R E S P O N S I B L E V I T A L G R O W I N G |
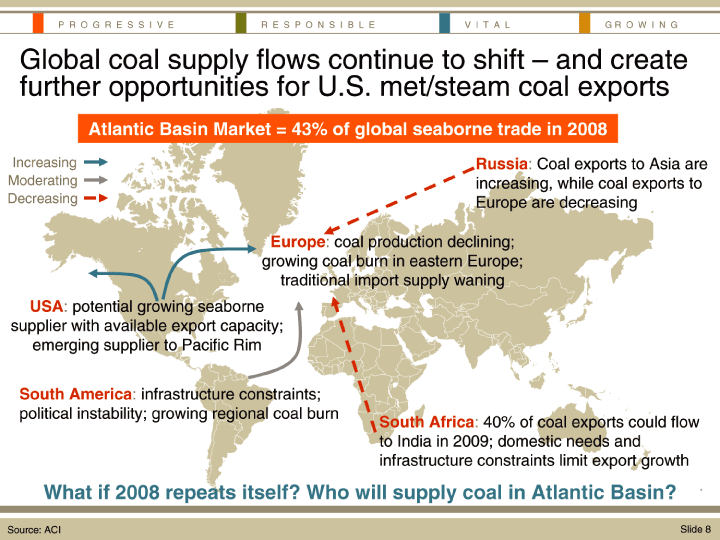
| Global coal supply flows continue to shift – and create further opportunities for U.S. met/steam coal exports |
| Atlantic Basin Market = 43% of global seaborne trade in 2008 IncreasingRussia: Coal exports to Asia are Moderating increasing, while coal exports to Decreasing Europe are decreasing |
| Europe: coal production declining; growing coal burn in eastern Europe; traditional import supply waning USA: potential growing seaborne supplier with available export capacity; emerging supplier to Pacific Rim |
| South America: infrastructure constraints; political instability; growing regional coal burn South Africa: 40% of coal exports could flow to India in 2009; domestic needs and infrastructure constraints limit export growth |
| What if 2008 repeats itself? Who will supply coal in Atlantic Basin? Source: ACI Slide 8 |
| P R O G R E S S I V E R E S P O N S I B L E V I T A L G R O W I N G |
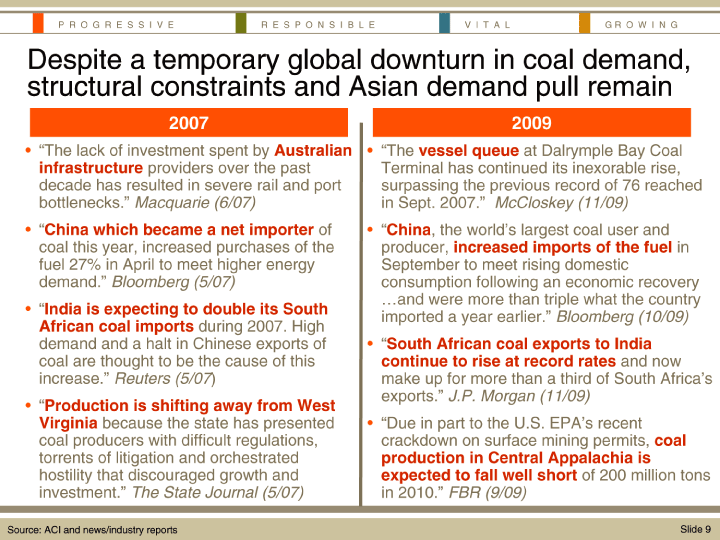
| Despite a temporary global downturn in coal demand, structural constraints and Asian demand pull remain 2007 2009 · “The lack of investment spent by Australian • “The vessel queue at Dalrymple Bay Coal infrastructure providers over the past Terminal has continued its inexorable rise, decade has resulted in severe rail and port surpassing the previous record of 76 reached bottlenecks.” Macquarie (6/07) in Sept. 2007.” McCloskey (11/09) |
| · “China which became a net importer of • “China, the world’s largest coal user and coal this year, increased purchases of the producer, increased imports of the fuel in fuel 27% in April to meet higher energy September to meet rising domestic demand.” Bloomberg (5/07) consumption following an economic recovery ...and were more than triple what the country |
| · “India is expecting to double its South imported a year earlier.” Bloomberg (10/09) |
| African coal imports during 2007. High demand and a halt in Chinese exports of • “South African coal exports to India coal are thought to be the cause of this continue to rise at record rates and now increase.” Reuters (5/07) make up for more than a third of South Africa’s exports.” J.P. Morgan (11/09) |
| · “Production is shifting away from West Virginia because the state has presented • “Due in part to the U.S. EPA’s recent coal producers with difficult regulations, crackdown on surface mining permits, coal torrents of litigation and orchestrated production in Central Appalachia is hostility that discouraged growth and expected to fall well short of 200 million tons investment.” The State Journal (5/07) in 2010.” FBR (9/09) |
| Source: ACI and news/industry reports Slide 9 |
| P R O G R E S S I V E R E S P O N S I B L E V I T A L G R O W I N G |
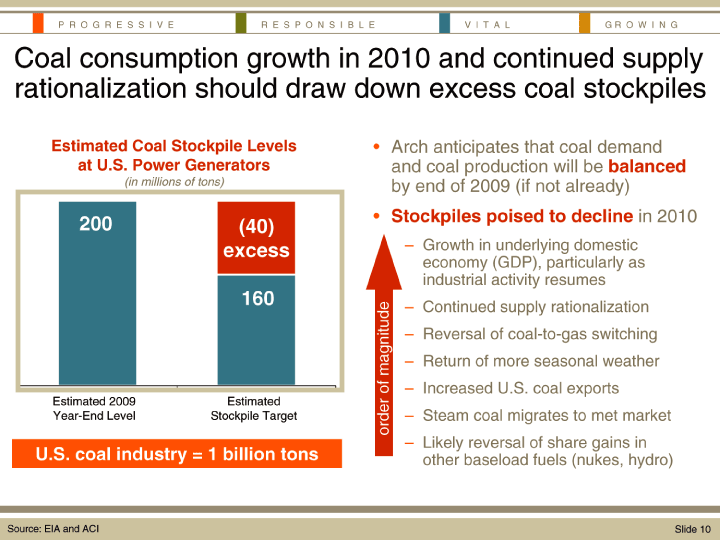
| Coal consumption growth in 2010 and continued supply rationalization should draw down excess coal stockpiles |
| Estimated Coal Stockpile Levels • Arch anticipates that coal demand at U.S. Power Generators and coal production will be balanced (in millions of tons) by end of 2009 (if not already) |
| 200 • Stockpiles poised to decline in 2010 (40) |
| excess – Growth in underlying domestic economy (GDP), particularly as industrial activity resumes 160 – Continued supply rationalization magnitude |
| – Reversal of coal-to-gas switching – Return of more seasonal weather – Increased U.S. coal exports Estimated 2009 Estimated Year-End Level Stockpile Target order of – Steam coal migrates to met market – Likely reversal of share gains in U.S. coal industry = 1 billion tons other baseload fuels (nukes, hydro) |
| Source: EIA and ACI Slide 10 |
| P R O G R E S S I V E R E S P O N S I B L E V I T A L G R O W I N G |
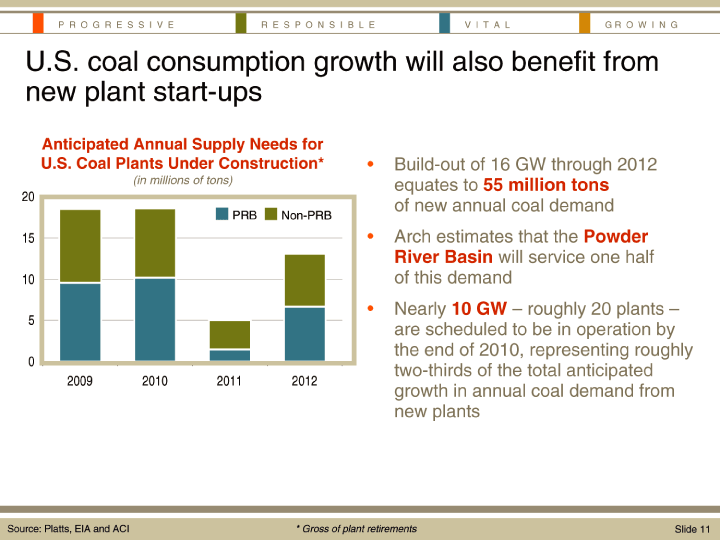
| U.S. coal consumption growth will also benefit from new plant start-ups Anticipated Annual Supply Needs for U.S. Coal Plants Under Construction* • Build-out of 16 GW through 2012 (in millions of tons) equates to 55 million tons 20 of new annual coal demand PRB Non-PRB |
| 15 • Arch estimates that the Powder River Basin will service one half 10 of this demand |
| · Nearly 10 GW – roughly 20 plants – 5 |
| are scheduled to be in operation by the end of 2010, representing roughly 0 two-thirds of the total anticipated |
| 2009 2010 2011 2012 |
| growth in annual coal demand from new plants Source: Platts, EIA and ACI * Gross of plant retirementsSlide 11 |
| P R O G R E S S I V E R E S P O N S I B L E V I T A L G R O W I N G |
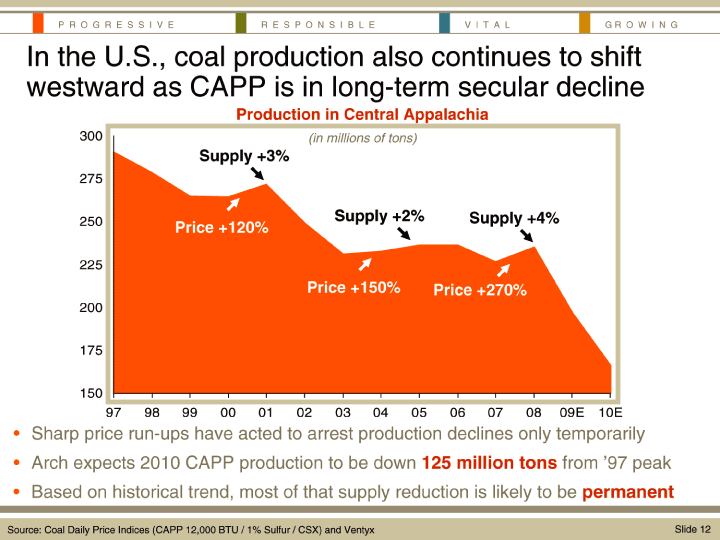
| In the U.S., coal production also continues to shift westward as CAPP is in long-term secular decline Production in Central Appalachia 300 (in millions of tons) Supply +3% 275 250 Supply +2% Supply +4% Price +120% |
| 225 Price +150% Price +270% |
| 200 175 150 97 98 99 00 01 02 03 04 05 060708 09E 10E •Sharp price run-ups have acted to arrest production declines only temporarily •Arch expects 2010 CAPP production to be down 125 million tons from ’97 peak •Based on historical trend, most of that supply reduction is likely to be permanent Source: Coal Daily Price Indices (CAPP 12,000 BTU / 1% Sulfur / CSX) and Ventyx Slide 12 |
| P R O G R E S S I V E R E S P O N S I B L E V I T A L G R O W I N G |
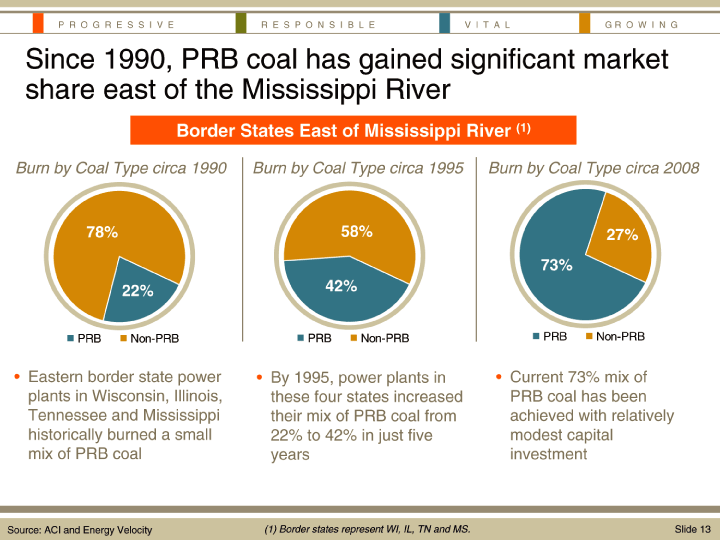
| Since 1990, PRB coal has gained significant market share east of the Mississippi River Border States East of Mississippi River (1) Burn by Coal Type circa 1990Burn by Coal Type circa 1995Burn by Coal Type circa 2008 32% 78% 58%50% 27% 73% 18% 22% 42% PRB Non-PRB PRBNon-PRB PRB Non-PRB |
| · Eastern border state power • By 1995, power plants in • Current 73% mix of plants in Wisconsin, Illinois, these four states increased PRB coal has been Tennessee and Mississippi their mix of PRB coal from achieved with relatively historically burned a small 22% to 42% in just five modest capital mix of PRB coal years investment |
| Source: ACI and Energy Velocity (1) Border states represent WI, IL, TN and MS. Slide 13 |
| P R O G R E S S I V ER E S P O N S I B L EV I T A LG R O W I N G |
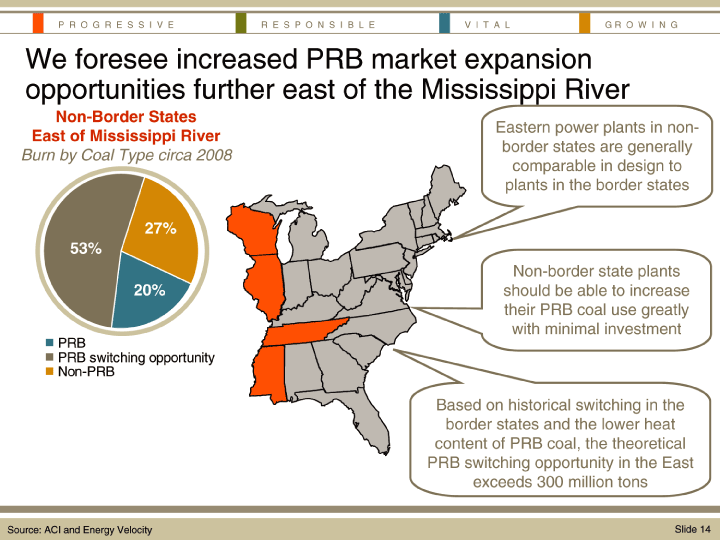
| We foresee increased PRB market expansion opportunities further east of the Mississippi River Non-Border States Eastern power plants in non- East of Mississippi River border states are generally Burn by Coal Type circa 2008 comparable in design to plants in the border states 27% 53% Non-border state plants 20%should be able to increase their PRB coal use greatly with minimal investment |
| PRB PRB switching opportunity Non-PRB |
| Based on historical switching in the border states and the lower heat content of PRB coal, the theoretical PRB switching opportunity in the East exceeds 300 million tons |
| Source: ACI and Energy Velocity Slide 14 |
| P R O G R E S S I V ER E S P O N S I B L E V I T A LG R O W I N G Energy, the environment and clean coal technologies Slide 15 |
| P R O G R E S S I V E R E S P O N S I B L EV I T A LG R O W I N G |
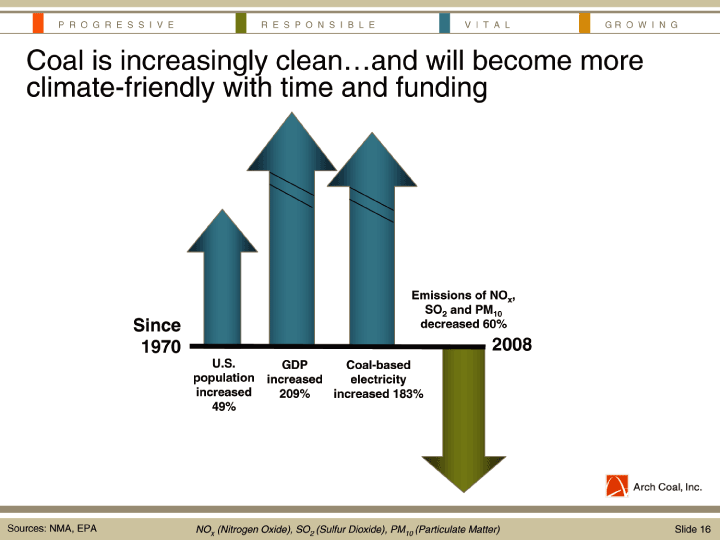
| Coal is increasingly clean...and will become more climate-friendly with time and funding Emissions of NOx, SO2 and PM10 Since decreased 60% 1970 2008 |
| U.S. GDP Coal-based population increased electricity increased 209% increased 183% 49% |
| Sources: NMA, EPA Slide 16 NOx (Nitrogen Oxide), SO2 (Sulfur Dioxide), PM10 (Particulate Matter) |
| P R O G R E S S I V ER E S P O N S I B L EV I T A L G R O W I N G |
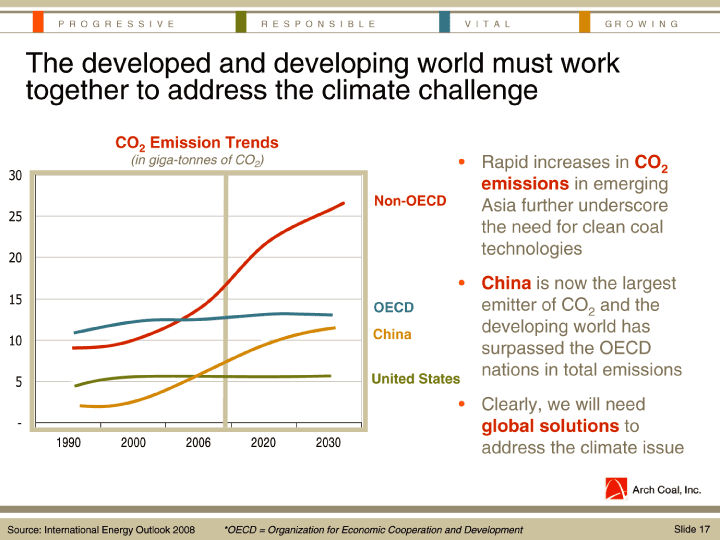
| The developed and developing world must work together to address the climate challenge CO2 Emission Trends (in giga-tonnes of CO2) • Rapid increases in CO2 30 emissions in emerging Non-OECDAsia further underscore 25 the need for clean coal technologies 20 |
| · China is now the largest 15 OECD emitter of CO2 and the developing world has 10 China surpassed the OECD nations in total emissions 5 United States |
| · Clearly, we will need - global solutions to 1990 2000 2006 2020 2030 address the climate issue Source: International Energy Outlook 2008 *OECD = Organization for Economic Cooperation and Development Slide 17 |
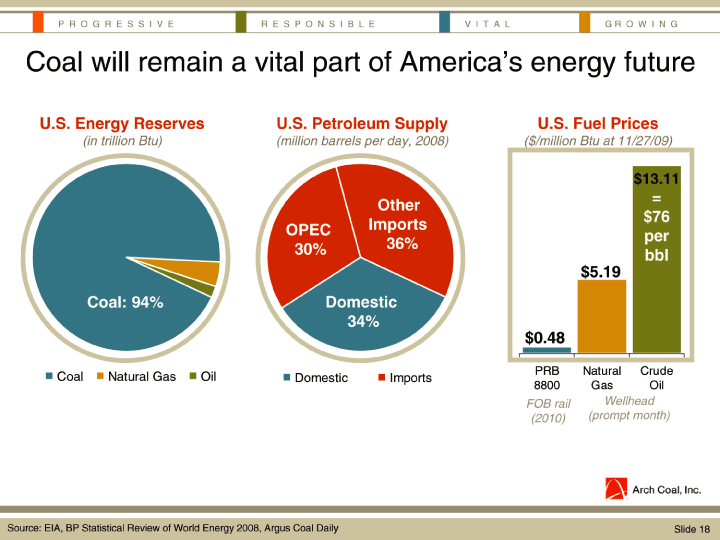
| P R O G R E S S I V E R E S P O N S I B L E V I T A L G R O W I N G Coal will remain a vital part of America’s energy future U.S. Energy Reserves U.S. Petroleum Supply U.S. Fuel Prices (in trillion Btu) (million barrels per day, 2008) ($/million Btu at 11/27/09) |
| $13.11 |
| = Other $76 OPEC Imports per 30% 36% bbl $5.19 Coal: 94% Domestic 34% $0.48 |
| Coal Natural Gas Oil PRBNatural Crude DomesticImports 8800 GasOil FOB rail Wellhead (2010) (prompt month) Source: EIA, BP Statistical Review of World Energy 2008, Argus Coal Daily Slide 18 |

| P R O G R E S S I V ER E S P O N S I B L E V I T A L G R O W I N G Arch Coal Overview Slide 19 |
| P R O G R E S S I V ER E S P O N S I B L E V I T A L G R O W I N G |
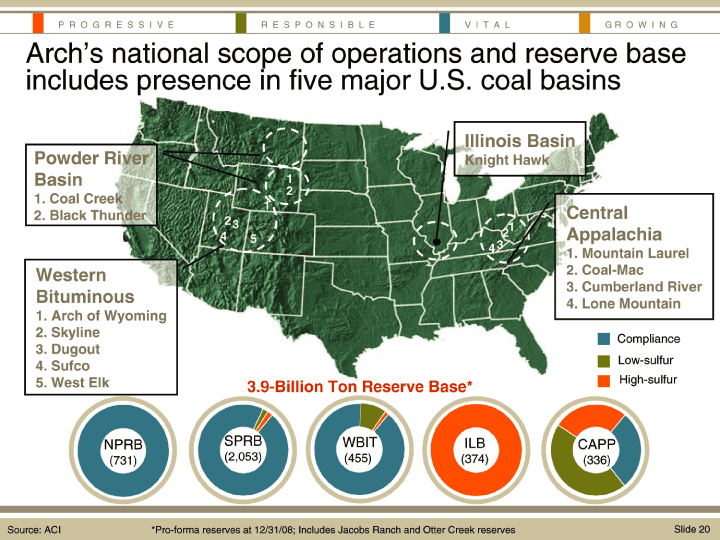
| Arch’s national scope of operations and reserve base includes presence in five major U.S. coal basins Illinois Basin Powder River Knight Hawk Basin1 |
| 2 1. Coal Creek 1 Central 2. Black Thunder |
| 23 4 21 Appalachia 5 4 3 |
| 1. Mountain Laurel Western 2. Coal-Mac 3. Cumberland River Bituminous 4. Lone Mountain 1. Arch of Wyoming 2. Skyline Compliance 3. Dugout 4. Sufco Low-sulfur |
| 5. West Elk3.9-Billion Ton Reserve Base* High-sulfur NPRBSPRB WBIT ILB CAPP (731)(2,053) (455)(374)(336) Source: ACI*Pro-forma reserves at 12/31/08; Includes Jacobs Ranch and Otter Creek reservesSlide 20 |
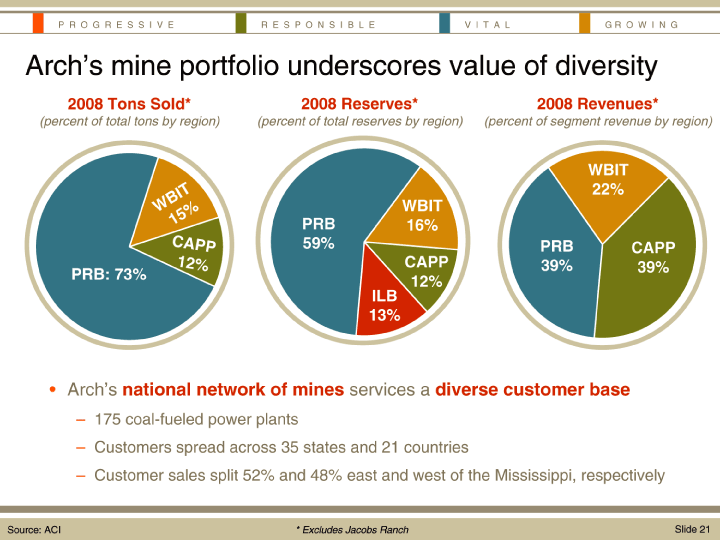
| P R O G R E S S I V E R E S P O N S I B L E V I T A L G R O W I N G Arch’s mine portfolio underscores value of diversity 2008 Tons Sold* 2008 Reserves*2008 Revenues* (percent of total tons by region) (percent of total reserves by region) (percent of segment revenue by region) WBIT T I22% B WBIT W% 1 5 PRB 16% A C P P 59%PRBCAPP 1 2 %CAPP 39%39% PRB: 73%12% ILB 13% •Arch’s national network of mines services a diverse customer base –175 coal-fueled power plants –Customers spread across 35 states and 21 countries –Customer sales split 52% and 48% east and west of the Mississippi, respectively Source: ACI * Excludes Jacobs Ranch Slide 21 |
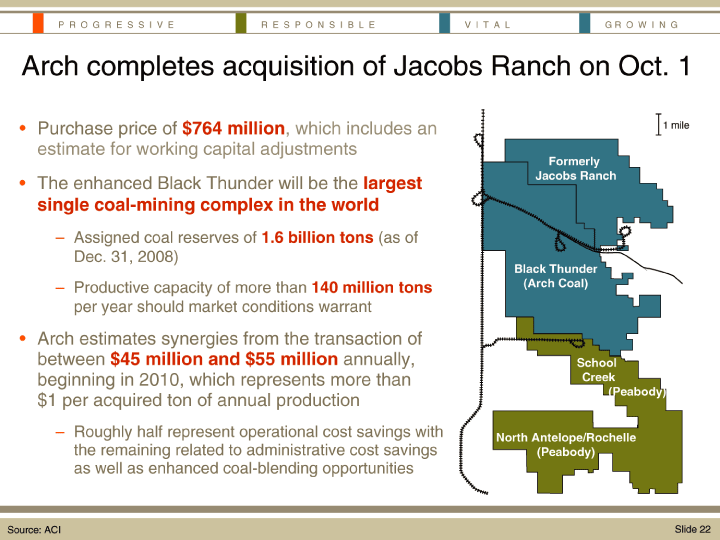
| P R O G R E S S I V E R E S P O N S I B L E V I T A L G R O W I N G Arch completes acquisition of Jacobs Ranch on Oct. 1 •Purchase price of $764 million, which includes an 1 mile estimate for working capital adjustments Formerly •The enhanced Black Thunder will be the largestJacobs Ranch single coal-mining complex in the world –Assigned coal reserves of 1.6 billion tons (as of Dec. 31, 2008) Black Thunder –Productive capacity of more than 140 million tons (Arch Coal) per year should market conditions warrant •Arch estimates synergies from the transaction of between $45 million and $55 million annually, School beginning in 2010, which represents more than Creek $1 per acquired ton of annual production(Peabody) –Roughly half represent operational cost savings withNorth Antelope/Rochelle the remaining related to administrative cost savings (Peabody) as well as enhanced coal-blending opportunities Source: ACI Slide 22 |
| P R O G R E S S I V E R E S P O N S I B L E V I T A L G R O W I N G |
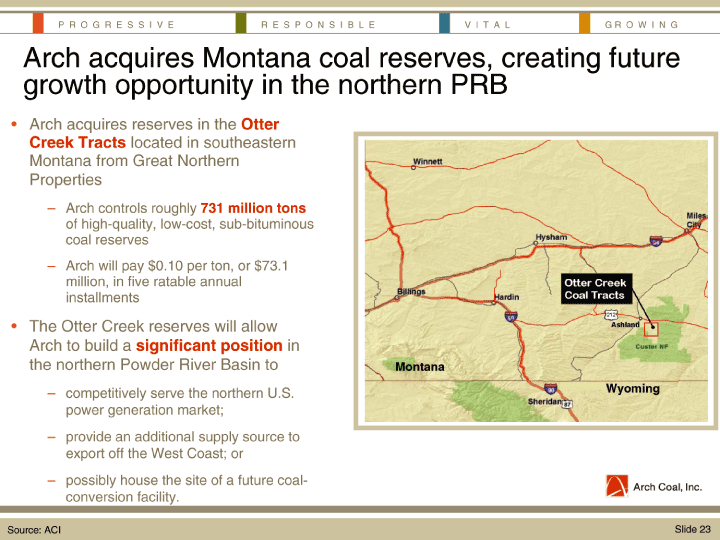
| Arch acquires Montana coal reserves, creating future growth opportunity in the northern PRB · Arch acquires reserves in the Otter Creek Tracts located in southeastern Montana from Great Northern Properties – Arch controls roughly 731 million tons of high-quality, low-cost, sub-bituminous coal reserves – Arch will pay $0.10 per ton, or $73.1 million, in five ratable annual installments · The Otter Creek reserves will allow Arch to build a significant position in the northern Powder River Basin to Montana |
| – competitively serve the northern U.S.Wyoming power generation market; – provide an additional supply source to export off the West Coast; or – possibly house the site of a future coal-conversion facility. Source: ACI Slide 23 |
| P R O G R E S S I V ER E S P O N S I B L E V I T A L G R O W I N G |
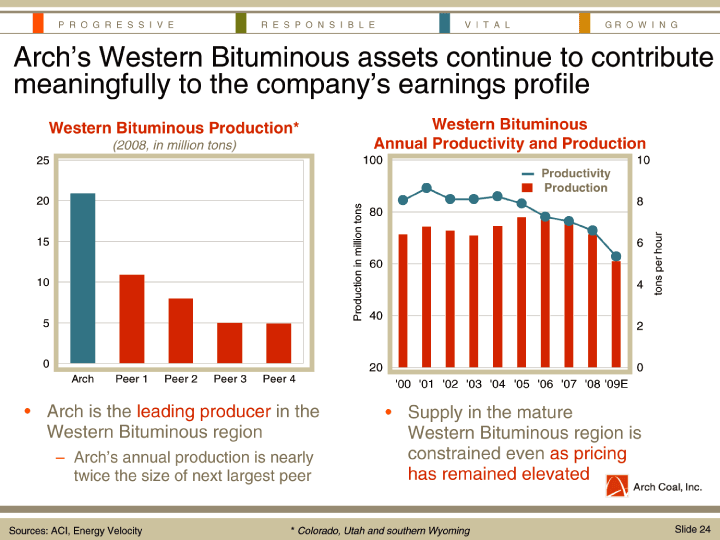
| Arch’s Western Bituminous assets continue to contribute meaningfully to the company’s earnings profile Western Bituminous Production* Western Bituminous (2008, in million tons) Annual Productivity and Production |
| 25 100 10 Productivity Production 208 tons 80 million 156 in 60 Production 104 tons per hour 40 5 2 020 0 Arch Peer 1 Peer 2 Peer 3 Peer 4 ‘00 ‘01 ‘02 ‘03 ‘04 ‘05 ‘06 ‘07 ‘08 ‘09E |
| · Arch is the leading producer in the • Supply in the mature Western Bituminous region Western Bituminous region is – Arch’s annual production is nearly constrained even as pricing twice the size of next largest peer has remained elevated |
| Sources: ACI, Energy Velocity * Colorado, Utah and southern Wyoming Slide 24 |
| P R O G R E S S I V E R E S P O N S I B L E V I T A LG R O W I N G |
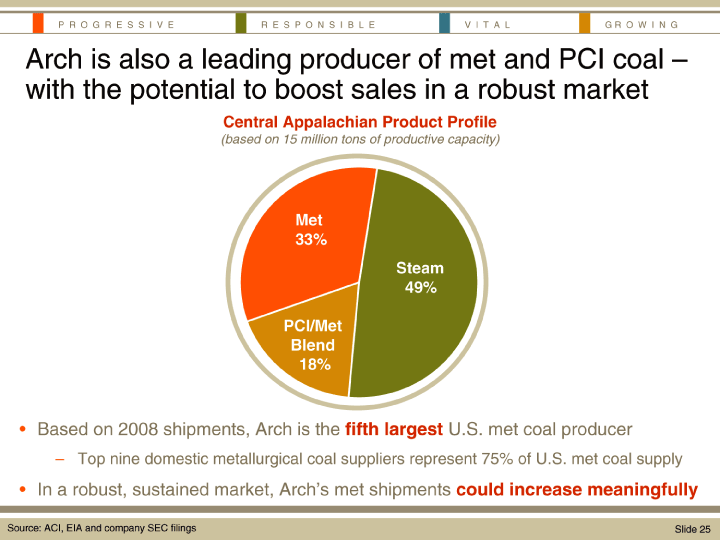
| Arch is also a leading producer of met and PCI coal –with the potential to boost sales in a robust market Central Appalachian Product Profile |
| (based on 15 million tons of productive capacity) Met 33% Steam 49% PCI/Met Blend 18% •Based on 2008 shipments, Arch is the fifth largest U.S. met coal producer –Top nine domestic metallurgical coal suppliers represent 75% of U.S. met coal supply •In a robust, sustained market, Arch’s met shipments could increase meaningfully Source: ACI, EIA and company SEC filingsSlide 25 |
| P R O G R E S S I V E R E S P O N S I B L E V I T A L G R O W I N G |
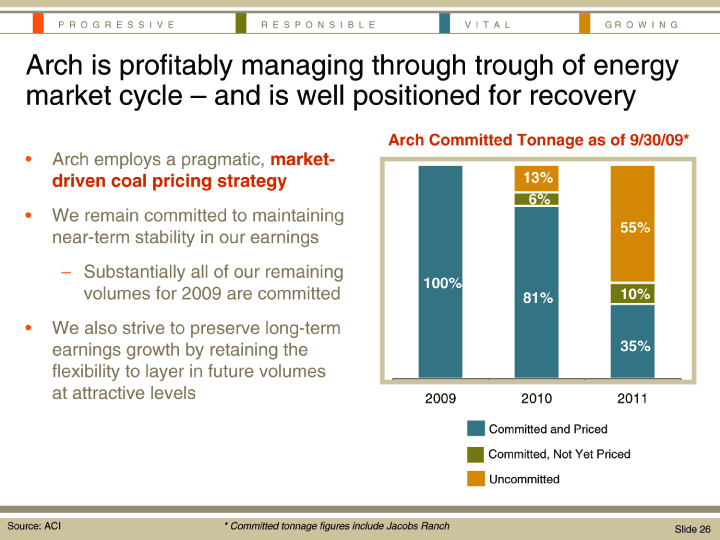
| Arch is profitably managing through trough of energy market cycle – and is well positioned for recovery |
| Arch Committed Tonnage as of 9/30/09* •Arch employs a pragmatic, market-driven coal pricing strategy 13% 6% •We remain committed to maintaining 55% near-term stability in our earnings –Substantially all of our remaining 100% volumes for 2009 are committed 81% 10% |
| · We also strive to preserve long-term earnings growth by retaining the 35% flexibility to layer in future volumes at attractive levels 2009 2010 2011 |
| Committed and Priced Committed, Not Yet Priced Uncommitted Source: ACI* Committed tonnage figures include Jacobs RanchSlide 26 |
| P R O G R E S S I V E R E S P O N S I B L E V I T A L G R O W I N G |
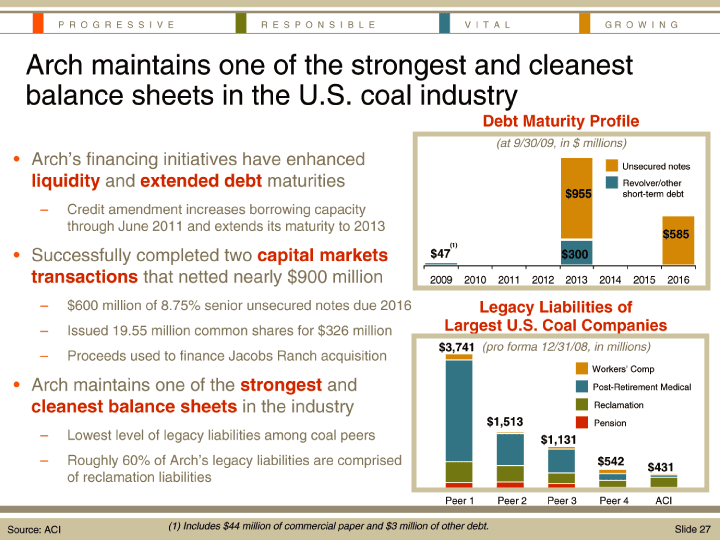
| Arch maintains one of the strongest and cleanest balance sheets in the U.S. coal industry Debt Maturity Profile |
| (at 9/30/09, in $millions) •Arch’s financing initiatives have enhanced Unsecured notes liquidity and extended debt maturities Revolver/other $955 short-term debt |
| – Credit amendment increases borrowing capacity through June 2011 and extends its maturity to 2013 $585 |
| (1) · Successfully completed two capital markets $47 $300 transactions that netted nearly $900 million 2009 2010 2011 2012 2013 2014 2015 2016 |
| –$600 million of 8.75% senior unsecured notes due 2016Legacy Liabilities of –Issued 19.55 million common shares for $326 million Largest U.S. Coal Companies $3,741 (pro forma 12/31/08, in millions) –Proceeds used to finance Jacobs Ranch acquisition Workers’ Comp •Arch maintains one of the strongest andPost-Retirement Medical cleanest balance sheets in the industry Reclamation $1,513 Pension –Lowest level of legacy liabilities among coal peers $1,131 |
| –Roughly 60% of Arch’s legacy liabilities are comprised $542 $431 of reclamation liabilities Peer 1 Peer 2Peer 3 Peer 4ACI Source: ACI (1) Includes $44 million of commercial paper and $3 million of other debt. Slide 27 |
| P R O G R E S S I V E R E S P O N S I B L EV I T A LG R O W I N G |
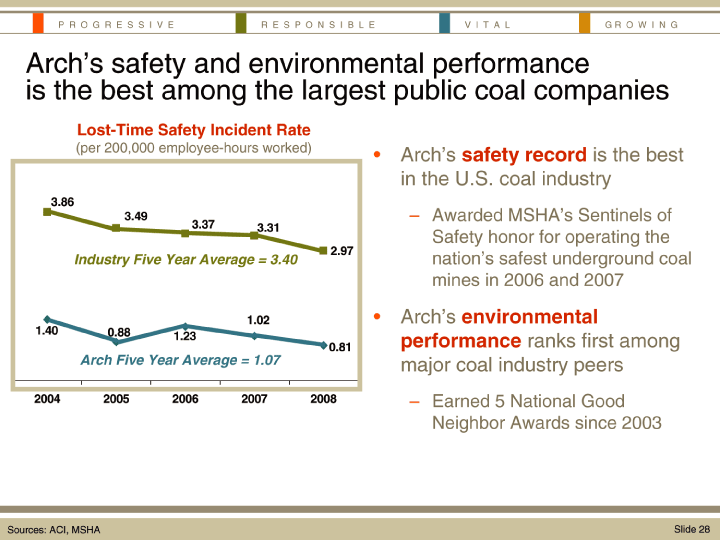
| Arch’s safety and environmental performance is the best among the largest public coal companies Lost-Time Safety Incident Rate (per 200,000 employee-hours worked) • Arch’s safety record is the best in the U.S. coal industry 3.86 3.49 – Awarded MSHA’s Sentinels of 3.37 3.31 Safety honor for operating the 2.97 Industry Five Year Average = 3.40 nation’s safest underground coal mines in 2006 and 2007 1.02 • Arch’s environmental 1.40 0.88 1.23 performance ranks first among 0.81 Arch Five Year Average = 1.07 major coal industry peers 2004 2005 2006 2007 2008 – Earned 5 National Good |
| Neighbor Awards since 2003 Sources: ACI, MSHA Slide 28 |
