Attached files
| file | filename |
|---|---|
| 8-K - FORM 8-K - AMERICAN STRATEGIC INCOME PORTFOLIO INC | c54896ae8vk.htm |
| 2009 Annual Shareholder Meeting First American Closed-End Funds Whole Loan Mortgage Funds Not FDIC insured No bank guarantee May lose value December 1, 2009 John Wenker Portfolio manager |
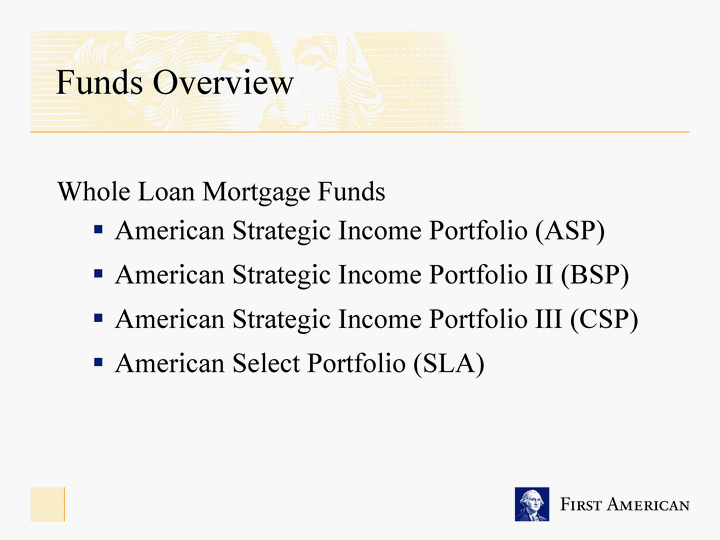
| Funds Overview Whole Loan Mortgage Funds American Strategic Income Portfolio (ASP) American Strategic Income Portfolio II (BSP) American Strategic Income Portfolio III (CSP) American Select Portfolio (SLA) |
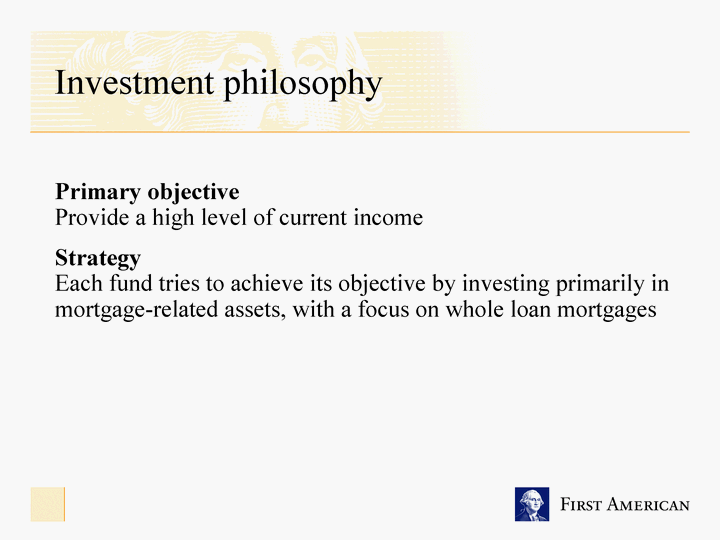
| Investment philosophy Primary objective Provide a high level of current income Strategy Each fund tries to achieve its objective by investing primarily in mortgage-related assets, with a focus on whole loan mortgages |
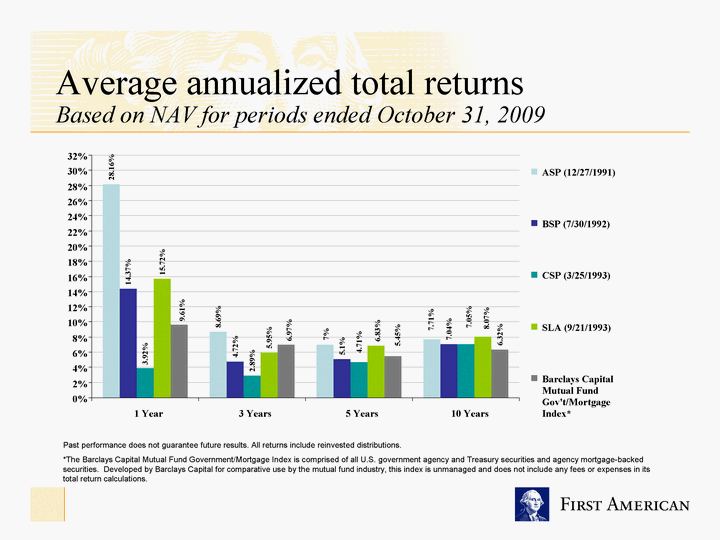
| Average annualized total returns Based on NAV for periods ended October 31, 2009 Past performance does not guarantee future results. All returns include reinvested distributions. *The Barclays Capital Mutual Fund Government/Mortgage Index is comprised of all U.S. government agency and Treasury securities and agency mortgage-backed securities. Developed by Barclays Capital for comparative use by the mutual fund industry, this index is unmanaged and does not include any fees or expenses in its total return calculations. 28.16% 8.69% 14.37% 4.72% 3.92% 2.89% 5.95% 6.32% 7.71% 7% 7.04% 5.1% 7.05% 4.71% 15.72% 8.07% 6.83% 9.61% 5.45% 6.97% 0% 2% 4% 6% 8% 10% 12% 14% 16% 18% 20% 22% 24% 26% 28% 30% 32% 1 Year 3 Years 5 Years 10 Years ASP (12/27/1991) BSP (7/30/1992) CSP (3/25/1993) SLA (9/21/1993) Barclays Capital Mutual Fund Gov't/Mortgage Index* |
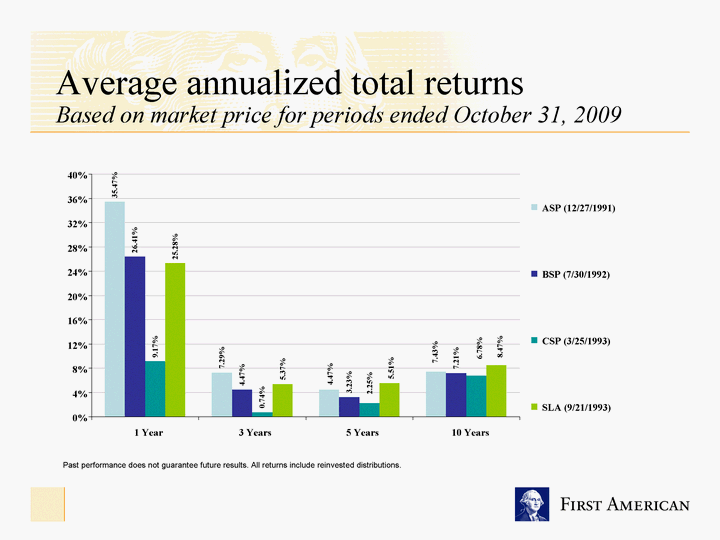
| Average annualized total returns Based on market price for periods ended October 31, 2009 Past performance does not guarantee future results. All returns include reinvested distributions. 7.29% 26.41% 4.47% 9.17% 0.74% 5.37% 35.47% 7.43% 4.47% 7.21% 3.23% 6.78% 2.25% 25.28% 8.47% 5.51% 0% 4% 8% 12% 16% 20% 24% 28% 32% 36% 40% 1 Year 3 Years 5 Years 10 Years ASP (12/27/1991) BSP (7/30/1992) CSP (3/25/1993) SLA (9/21/1993) |
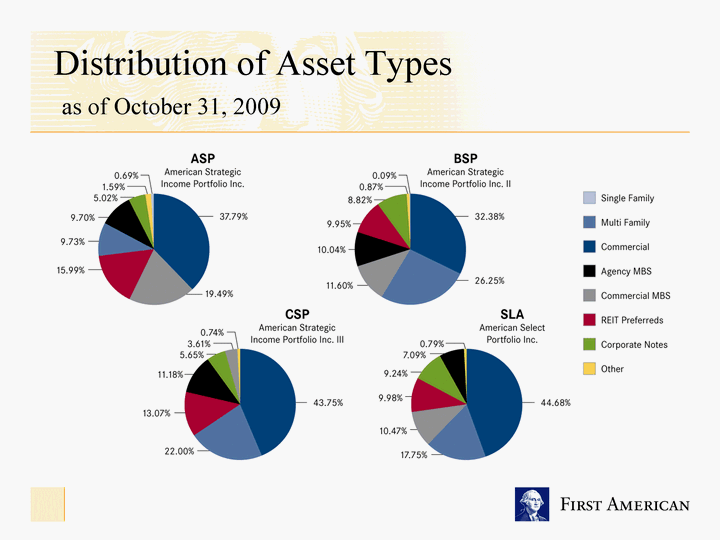
| Distribution of Asset Types as of October 31, 2009 |
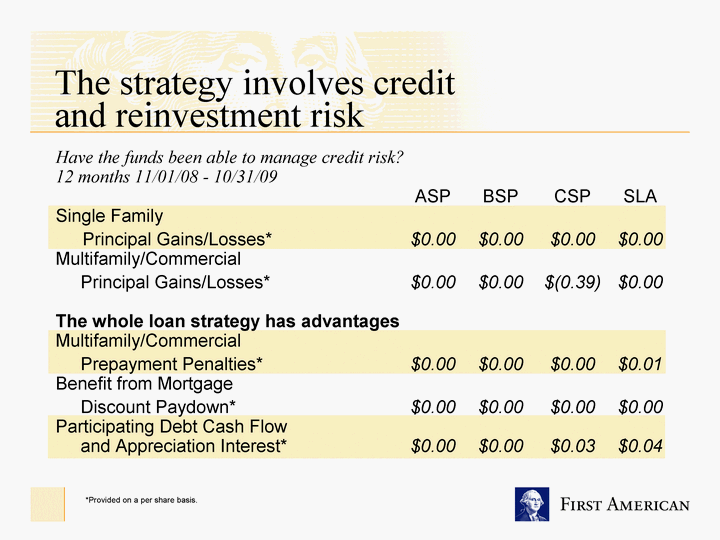
| Have the funds been able to manage credit risk? 12 months 11/01/08 - 10/31/09 ASP BSP CSP SLA Single Family Principal Gains/Losses* $0.00 $0.00 $0.00 $0.00 Multifamily/Commercial Principal Gains/Losses* $0.00 $0.00 $(0.39) $0.00 The whole loan strategy has advantages Multifamily/Commercial Prepayment Penalties* $0.00 $0.00 $0.00 $0.01 Benefit from Mortgage Discount Paydown* $0.00 $0.00 $0.00 $0.00 Participating Debt Cash Flow and Appreciation Interest* $0.00 $0.00 $0.03 $0.04 The strategy involves credit and reinvestment risk *Provided on a per share basis. |
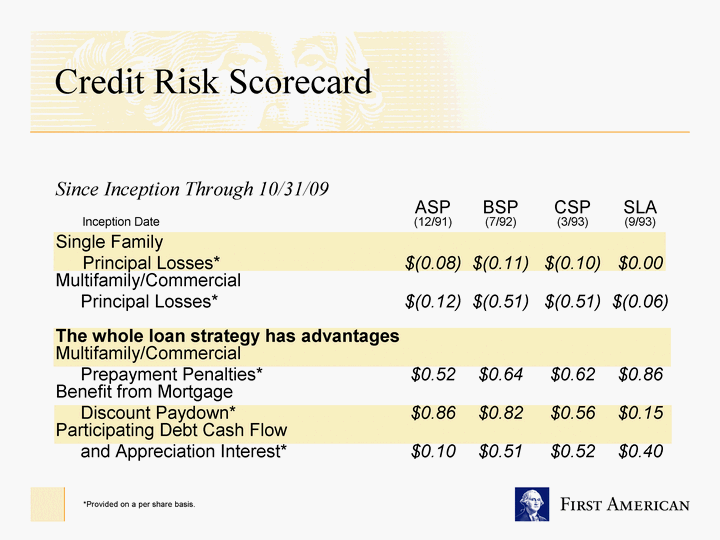
| Since Inception Through 10/31/09 ASP BSP CSP SLA Inception Date (12/91) (7/92) (3/93) (9/93) Single Family Principal Losses* $(0.08) $(0.11) $(0.10) $0.00 Multifamily/Commercial Principal Losses* $(0.12) $(0.51) $(0.51) $(0.06) The whole loan strategy has advantages Multifamily/Commercial Prepayment Penalties* $0.52 $0.64 $0.62 $0.86 Benefit from Mortgage Discount Paydown* $0.86 $0.82 $0.56 $0.15 Participating Debt Cash Flow and Appreciation Interest* $0.10 $0.51 $0.52 $0.40 Credit Risk Scorecard *Provided on a per share basis. |
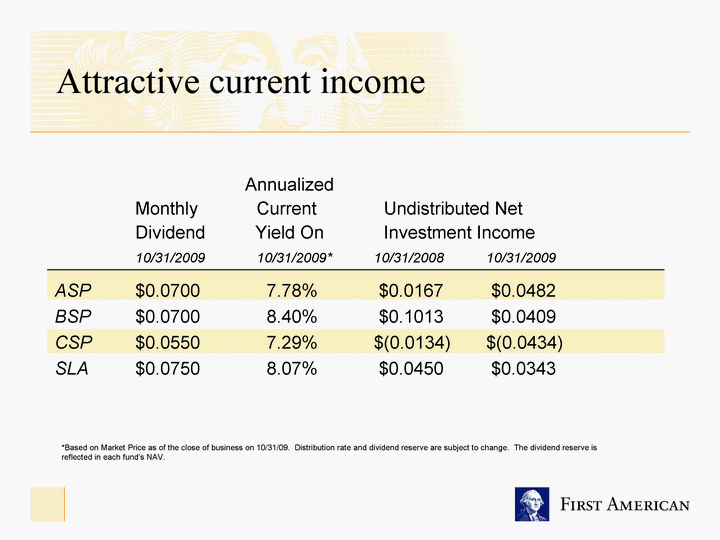
| Attractive current income *Based on Market Price as of the close of business on 10/31/09. Distribution rate and dividend reserve are subject to change. The dividend reserve is reflected in each fund's NAV. Annualized Monthly Current Undistributed Net Dividend Yield On Investment Income 10/31/2009 10/31/2009* 10/31/2008 10/31/2009 ASP $0.0700 7.78% $0.0167 $0.0482 BSP $0.0700 8.40% $0.1013 $0.0409 CSP $0.0550 7.29% $(0.0134) $(0.0434) SLA $0.0750 8.07% $0.0450 $0.0343 |
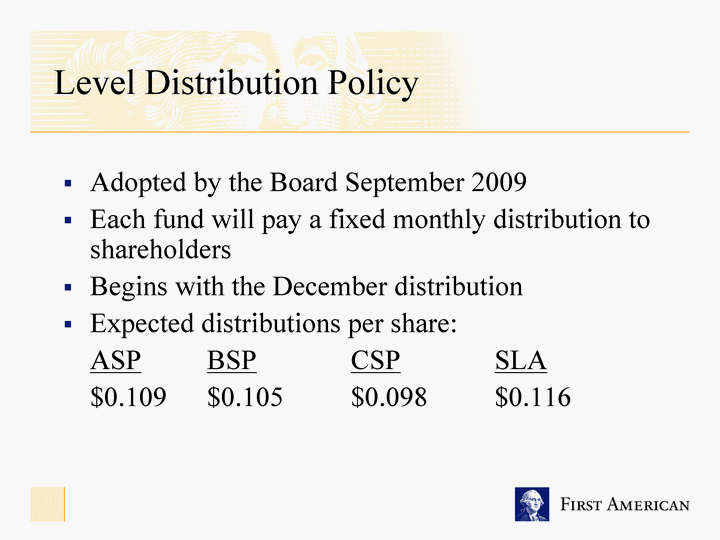
| Level Distribution Policy Adopted by the Board September 2009 Each fund will pay a fixed monthly distribution to shareholders Begins with the December distribution Expected distributions per share: ASP BSP CSP SLA $0.109 $0.105 $0.098 $0.116 |
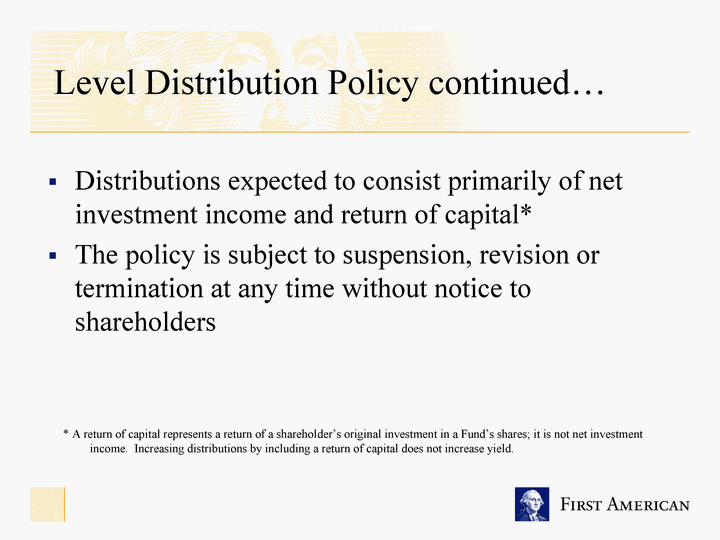
| Level Distribution Policy continued... Distributions expected to consist primarily of net investment income and return of capital* The policy is subject to suspension, revision or termination at any time without notice to shareholders * A return of capital represents a return of a shareholder's original investment in a Fund's shares; it is not net investment income. Increasing distributions by including a return of capital does not increase yield. |
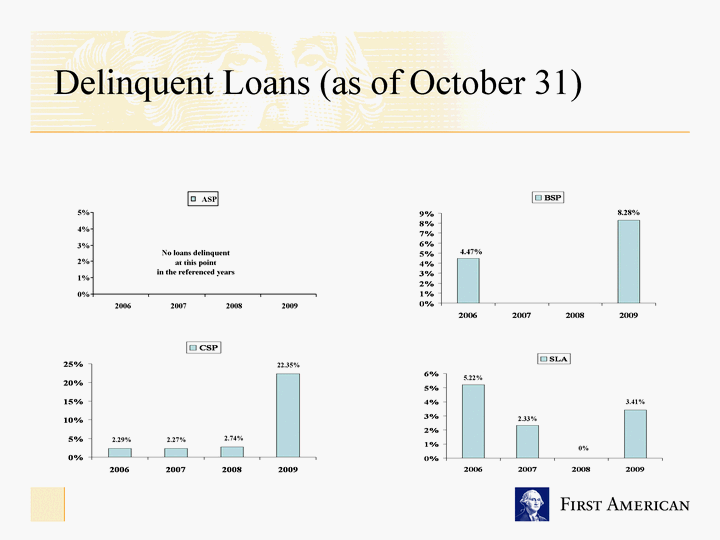
| Delinquent Loans (as of October 31) 2006 2007 2008 2009 BSP 0.0447 0 0 0.0828 4.47% 8.28% No loans delinquent at this point in the referenced years 2006 2007 2008 2009 CSP 0.0229 0.0227 0.0274 0.2235 2.29% 2.27% 2.74% 22.35% 2006 2007 2008 2009 SLA 0.0522 0.0233 0 0.0341 5.22% 2.33% 0% 3.41% 0% 1% 2% 3% 4% 5% 2006 2007 2008 2009 ASP |
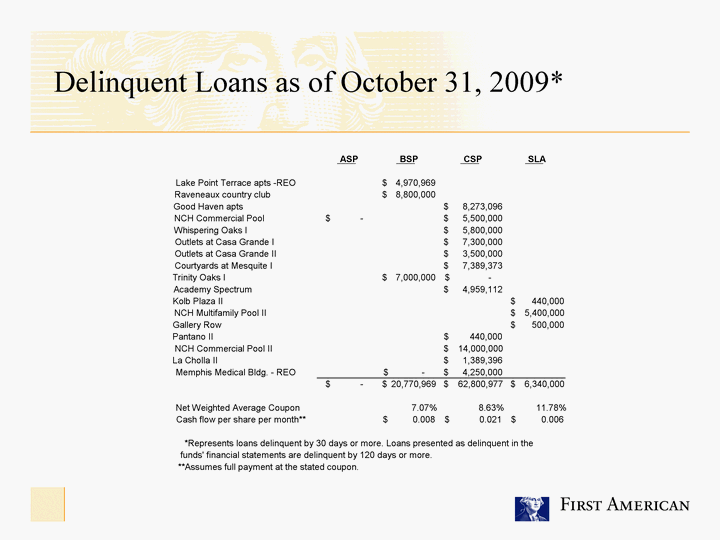
| Delinquent Loans as of October 31, 2009* ASP BSP CSP SLA Lake Point Terrace apts -REO 4,970,969 $ Raveneaux country club 8,800,000 $ Good Haven apts 8,273,096 $ NCH Commercial Pool - $ 5,500,000 $ Whispering Oaks I 5,800,000 $ Outlets at Casa Grande I 7,300,000 $ Outlets at Casa Grande II 3,500,000 $ Courtyards at Mesquite I 7,389,373 $ Trinity Oaks I 7,000,000 $ - $ Academy Spectrum 4,959,112 $ Kolb Plaza II 440,000 $ NCH Multifamily Pool II 5,400,000 $ Gallery Row 500,000 $ Pantano II 440,000 $ NCH Commercial Pool II 14,000,000 $ La Cholla II 1,389,396 $ Memphis Medical Bldg. - REO - $ 4,250,000 $ - $ 20,770,969 $ 62,800,977 $ 6,340,000 $ Net Weighted Average Coupon 7.07% 8.63% 11.78% Cash flow per share per month** 0.008 $ 0.021 $ 0.006 $ *Represents loans delinquent by 30 days or more. Loans presented as delinquent in the funds' financial statements are delinquent by 120 days or more. **Assumes full payment at the stated coupon. |
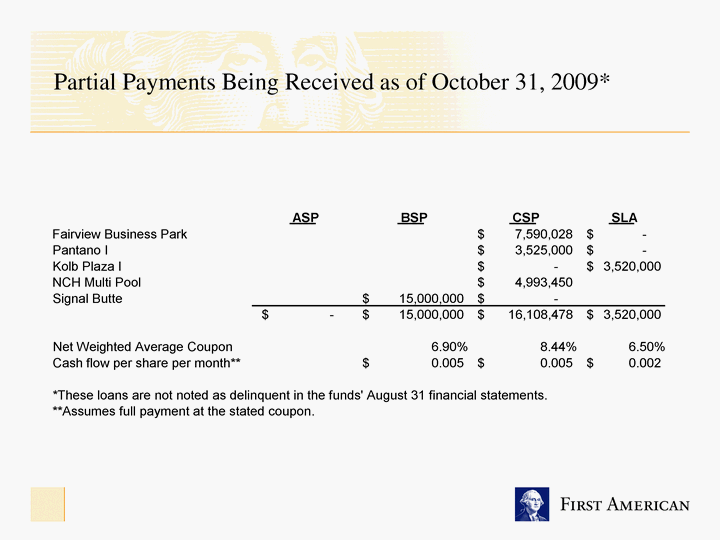
| Partial Payments Being Received as of October 31, 2009* ASP BSP CSP SLA Fairview Business Park 7,590,028 $ - $ Pantano I 3,525,000 $ - $ Kolb Plaza I - $ 3,520,000 $ NCH Multi Pool 4,993,450 $ Signal Butte 15,000,000 $ - $ - $ 15,000,000 $ 16,108,478 $ 3,520,000 $ Net Weighted Average Coupon 6.90% 8.44% 6.50% Cash flow per share per month** 0.005 $ 0.005 $ 0.002 $ *These loans are not noted as delinquent in the funds' most recent financial statements. **Assumes full payment at the stated coupon. |
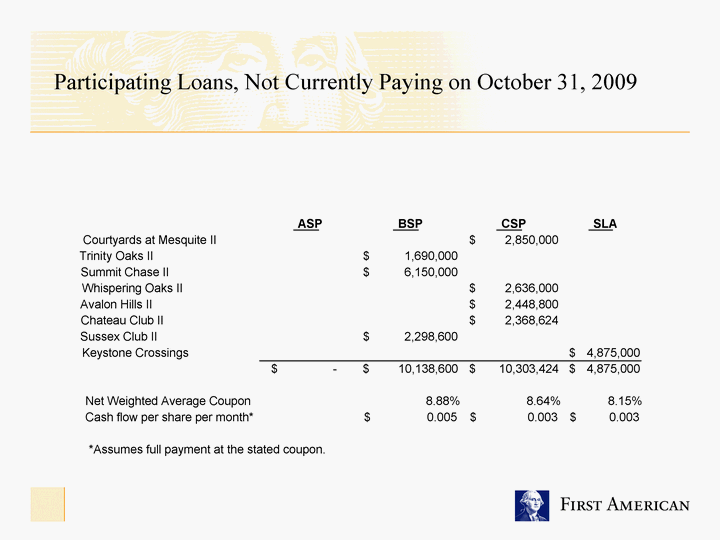
| Participating Loans, Not Currently Paying on October 31, 2009 ASP BSP CSP SLA Courtyards at Mesquite II 2,850,000 $ Trinity Oaks II 1,690,000 $ Summit Chase II 6,150,000 $ Whispering Oaks II 2,636,000 $ Avalon Hills II 2,448,800 $ Chateau Club II 2,368,624 $ Sussex Club II 2,298,600 $ Keystone Crossings 4,875,000 $ - $ 10,138,600 $ 10,303,424 $ 4,875,000 $ Net Weighted Average Coupon 8.88% 8.64% 8.15% Cash flow per share per month* 0.005 $ 0.003 $ 0.003 $ *Assumes full payment at the stated coupon. |
| As of September 30, 2009, FAF Advisors, Inc. managed more than $100 billion in total assets. Investment products, including shares of closed-end funds, are not obligations of, or guaranteed by, any bank including U.S. Bank or any of its affiliates, nor are they insured by the Federal Deposit Insurance Corporation, the Federal Reserve Board, or any other agency. An investment in such products involves investment risk, including possible loss of principal. A significant portion of the funds' portfolios include municipal, corporate, treasury and high yield bonds, as such when the interest rate increases the value of the bonds in the fund portfolio may decline therefore affecting the net assets value of the bond. Investment in asset-backed and mortgage-backed securities include additional risks that investors should be aware of such credit risk, prepayment risk, possible illiquidity and default, as well as increased susceptibility to adverse economic developments. FAF Advisors, Inc., is a subsidiary of U.S. Bank National Association. U.S. Bank National Association is a separate entity and wholly owned subsidiary of U.S. Bancorp. Disclosures |
