Attached files
| file | filename |
|---|---|
| 8-K - FORM 8-K - United Refining Energy Corp | d8k.htm |
 Roadshow
Presentation November 2009 Update Roadshow Presentation November 2009 Update Exhibit 99.1 |
 2 2 Confidential Information Confidential Information This presentation contains forward-looking statements. These forward-looking statements relate to,
among other things, our financial and operating performance and results, our business strategy,
market prices, our future commodity price risk management activities, and our plans and
forecasts. We have based these forward-looking statements on our current assumptions,
expectations and projections about future events. We may use the words “may,”
“expect,” “anticipate,” “estimate,” “believe,” “target,” “continue,” “intend,” “plan,” “budget” and other similar words to identify forward-looking statements. You should read statements that contain
these words carefully because they discuss future expectations, contain projections of results of operations or of our financial condition and/or state other “forward-looking” information. We do not undertake any obligation to update or revise publicly any forward- looking statements, except as required by law. These statements also involve risks and uncertainties that
could cause our actual results or financial condition to materially differ from our
expectations in this presentation, including, but not limited to fluctuations in prices of oil
and natural gas, future capital requirements and availability of financing, estimates of reserves, geological concentration of our reserves, risks associated with drilling and operating wells, discovery,
acquisition, development and replacement of oil and natural gas reserves, cash flow and
liquidity, timing and amount of future production of oil and natural gas, availability of
drilling and production equipment, marketing of oil and natural gas, developments in
oil-producing and natural gas-producing countries, competition, general economic conditions, governmental regulations, receipt of amounts owed to us by purchasers of our production and counterparties
to our commodity price risk management contracts, hedging decisions, including whether or not
to enter into derivative financial instruments, terrorist attacks, actions by third-party
co-owners of interests in properties in which we also own an interest, and fluctuations in
interest rates. We believe it is important to communicate our expectations of future performance
to our investors. However, events may occur in the future that we are unable to accurately predict, or over which we have no control. When considering our forward-looking statements, you should keep in mind the risk factors and other cautionary statements found in the proxy statement of United Refining Energy Corp. filed with the Securities and Exchange Commission on October 13,
2009. The risks noted therein and other factors noted throughout the proxy statement provide examples of risks, uncertainties and events that may cause our actual results to differ materially from those contained in any forward-looking statement. Please read the section entitled “Risk Factors” in the referenced proxy statement for a discussion of certain risks of our business. |
 3 3 Management Presenters Management Presenters Mark Fischer Chairman, CEO and President Joe Evans CFO John Catsimatidis Chairman and CEO Privately held independent, mid-cap oil & gas exploration and production company Founded in 1988 Publicly traded Special Purpose Acquisition Company (SPAC) with $452 million in funds Formed on June 25, 2007 United Refining Energy (URX) Chaparral Energy (CPR) |
 4 4 URX Rationale URX Rationale Transaction is a tremendous opportunity for growth given size and diversity of portfolio with significant upside potential for stock price appreciation Chaparral is a project & prospect rich company; URX cash infusion allows accelerated realization of value Attractive investment proposition with aggregate transaction value implying 2010E EBITDA multiple of 5.1x, a 34% discount to E&P peer group (1) Experienced management team that has built a track record of steady growth Substantial asset base of long-lived properties with a large inventory of low risk exploitation opportunities, as well as near-term high-potential drilling projects Offers the potential for substantial long-term reserve and production growth through a robust portfolio of EOR projects utilizing CO 2 with numerous candidates for development Notes: 1) Valuation as of October 12, 2009. Peer group includes ARD, CXO, DNR, EAC, PXD, REN and WLL
|
 5 5 Transaction Summary Transaction Summary Chaparral: 57%; URX Public: 38%; URX Sponsor: 5% (1) Ownership Summary December 2009 Expected Close Commitments in place for new $500 million credit facility to replace Chaparral existing facility Credit Facility Public and insider warrants redeemed at $0.55 per warrant and/or restructured with $13.00 strike, $18.00 redemption, 5 yr expiration Warrants CEO: Mark Fischer Executive Chairman: John Catsimatidis Nine-member board with five independent directors Management and Board Chaparral receives $300 million (1) cash for working capital Chaparral shareholders receive 51.5 million common shares and 10 million contingent shares Chaparral shareholders exchange their entire equity stake for shares in the combined entity URX sponsor shares restructured into 4.27 million common shares and 2.8 million contingent shares forfeitable based on performance Contingent shares awarded upon achievement of share price target of $ 15.00 (6 yr term) Consideration Chaparral Energy to go public through a merger with United Refining Energy Corp. (AMEX: URX) Total transaction size: $1.7 billion Transaction Notes: 1) Assuming 24% of URX public shareholders redeem their shares for cash and 50% of URX warrants are redeemed
for cash at $0.55 per warrant, Chaparral receives approximately $300MM in cash |
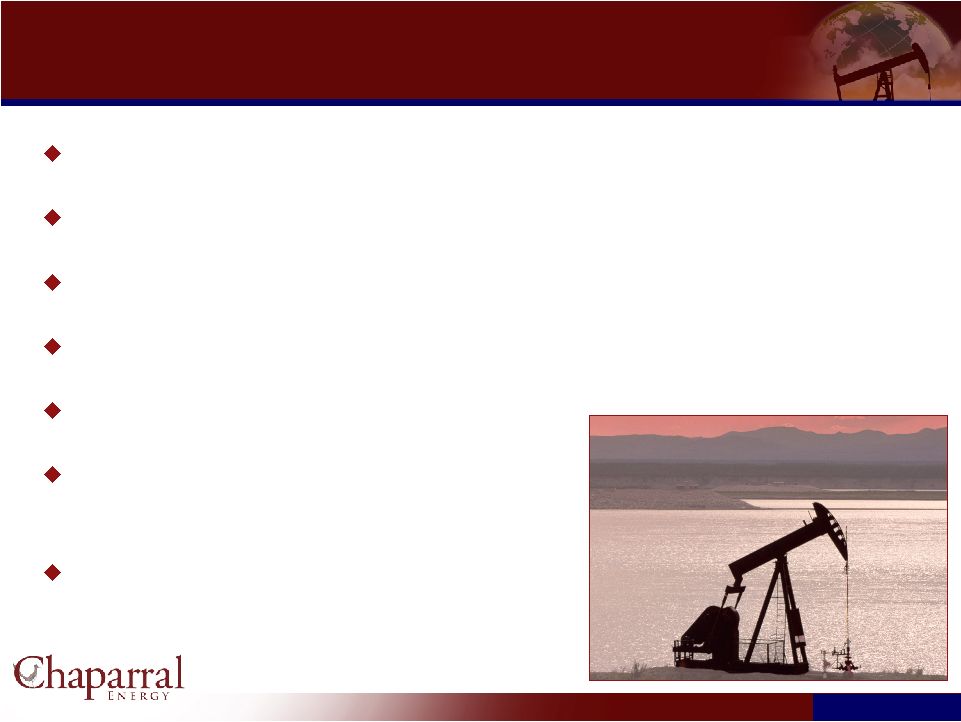
 6 6 Chaparral Overview Chaparral Overview Founded in 1988, based in Oklahoma City Core areas are Mid-Continent and Permian Basin Comprise 90% of reserves and 87% of 1Q-2Q 2009 production Third largest oil producer in Oklahoma Substantial resource potential Long-lived, shallow-decline conventional reserve base Significant resource potential via Enhanced Oil Recovery portfolio and infrastructure as well as Woodford shale gas opportunities Successful acquisition track record September 2005: $158 million CEI Bristol, 19 MMBoe of proved reserves October 2006: $500 million Calumet Oil, 58 MMBoe of proved reserves Experienced management team with high ownership stake Operational Stats Proved Reserves: % Oil: Production: SEC Reserve Value ($PV-10): R / P: 12/31/08 113 MMBoe (SEC) 45% 19 MBoe/d (Annual Avg.) $933MM 16 years 6/30/09 146 MMBoe (SEC) 62% 21 MBoe/d (1H 2009) $1.52Bn 19 years |
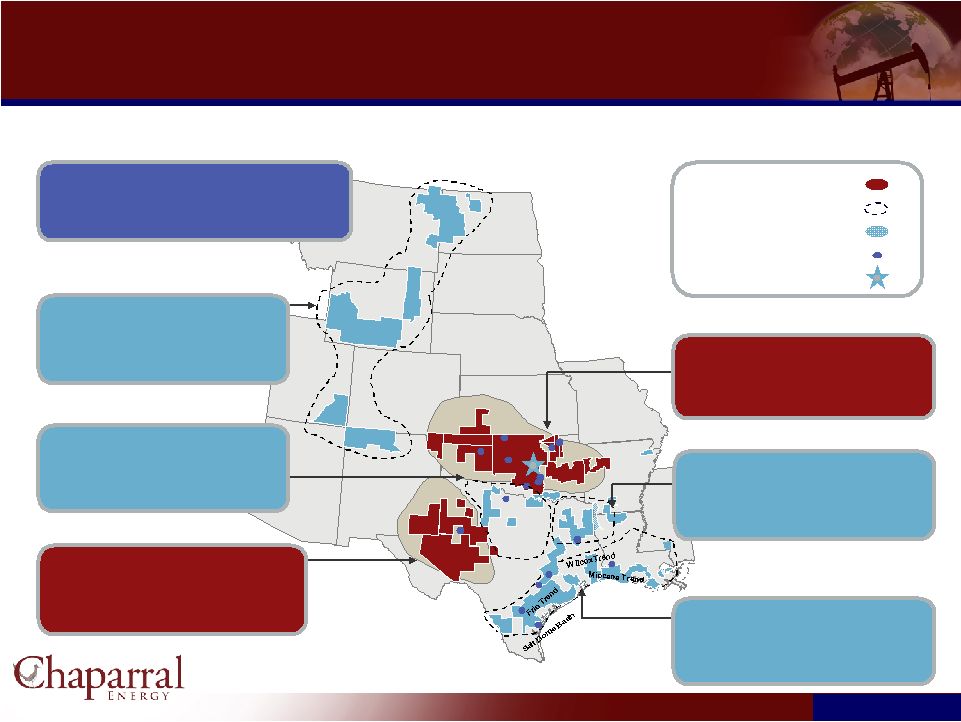 7 7 Operating Areas (1) Operating Areas (1) As of June 30, 2009 (SEC) Core Area Growth Area Acreage Field Offices Headquarters North Texas Reserves: 2.7 MMBoe, 2% of total Production: 0.5 Mboe/d, 2% of total Acreage (gross / net): 33,352 / 26,464 Permian Basin Reserves: 17.4 MMBoe, 12% of total Production: 4.9 Mboe/d, 23% of total Acreage (gross / net): 98,655 / 73,618 Rocky Mountains Reserves: 2.7 MMBoe, 2% of total Production: 0.3 MBoe/d, 1% of total Acreage (gross / net): 46,770 / 17,302 Company Total June 2009 proved reserves – 146 MMBoe 1H 2009 average daily production – 21 MBoe/d Acreage (gross / net): 1,276,505 / 638,936 Val Verde Basin Sabine Uplift Midland Basin Delaware Basin Ouachita Uplift Arkoma Basin Fort Worth Basin Williston Basin Powder River Basin Greater Green River Basin San Juan Basin Anadarko Woodford Basin OKC Notes: 1) Reserve and production data as of June 30, 2009; acreage as of 12/31/08 Gulf Coast Reserves: 6.6 MMBoe, 5% of total Production: 1.3 MBoe/d, 6% of total Acreage (gross / net): 94,361 / 57,571 Mid-Continent Reserves: 113.2 MMBoe, 78% of total Production: 13.6 MBoe/d, 64% of total Acreage (gross / net): 976,447 / 449,209 Ark-La-Tex Reserves: 2.9 MMBoe, 2% of total Production: 0.7 MBoe/d, 3% of total Acreage (gross / net): 26,920 / 14,772 |
 8 8 Investment Highlights Investment Highlights Long-lived, oil-oriented, diverse production base (6/30/09 R/P: 19 years) Large inventory of near-term, high-potential, drilling opportunities Strategic vision to capture value long-term via Enhanced Oil Recovery (EOR) Financial flexibility to execute growth strategy Proven management and financial sponsor All current shareholders exchange their entire equity stake for shares in the combined entity Earn-out structure fully aligns sponsor and management with new Chaparral shareholders |
 9 9 Company Overview Company Overview |
 10 10 Operating and Financial Strategy Operating and Financial Strategy Increase reserves and production through drilling of low-risk inventory Acquire mature properties and enhance production and reserves through drilling and operational efficiencies Expand EOR operations including CO 2 infrastructure Selectively pursue strategic opportunities with significant upside potential Hedge production to stabilize cash flow Achieve growth objectives while maintaining strong liquidity position |
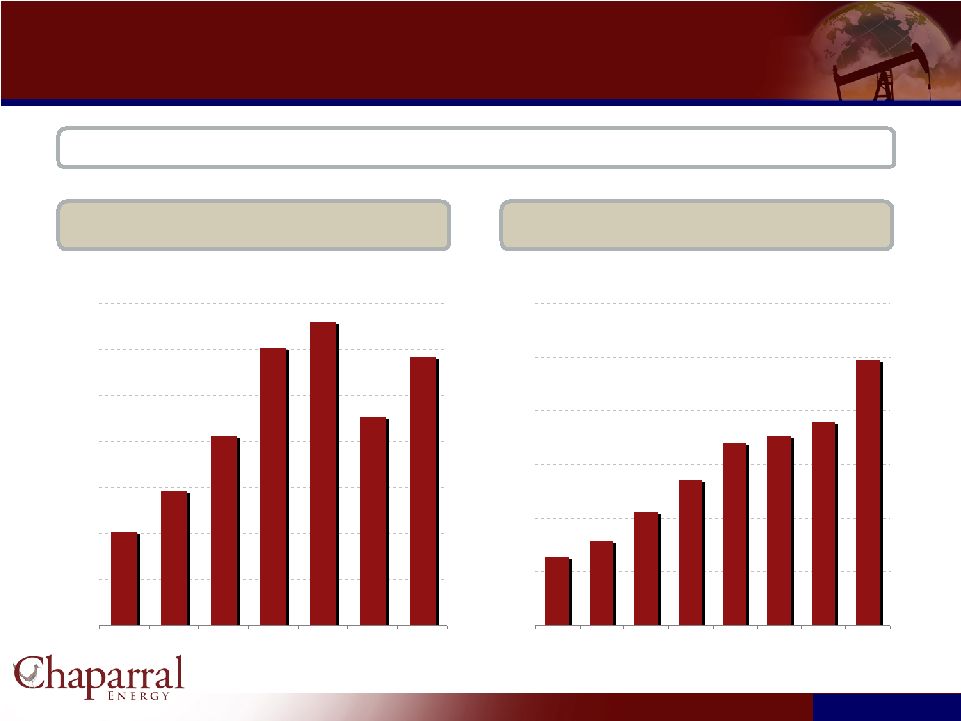 11 11 Strong Record of Reserve and Production Growth Strong Record of Reserve and Production Growth Year-End Reserves (MMBoe) (1)(2) 141466 113 164 151 103 73 51 0 25 50 75 100 125 150 175 2003 2004 2005 2006 2007 2008 Jun-09 2003 – June 2009 CAGR = 21.1% Annual Production (MMBoe) 9.9 7.6 7.1 6.8 5.4 4.2 3.2 2.6 0 2 4 6 8 10 12 2003 2004 2005 2006 2007 2008 2009E 2010E 2003 – 2009E CAGR = 19.6% 146 Note: 1)Reserves as of December 31, 2008 are based on flat SEC pricing of $44.60/Bbl and $5.62.Mcf 2)Reserves as of June 30, 2009 are based on flat SEC pricing of $69.89/Bbl and $3.89/Mcf Chaparral’s reserve replacement ratio has averaged 599% per year since 2002
|
 12 12 Stable Base and Growth Potential Stable Base and Growth Potential Stable Producing Base Long-lived reserve base • 8.8% projected annual decline in PDP production from 2009 to 2023 (1) 62% oil concentration 66% proved developed reserves 86% of proved reserves operated 85% of PDP production hedged over the next two years to stabilize cash flow Highly diversified production across fields (8,324 wells) Note: 1) Percent decline is average annual decline rate of PDP production from third-party reserve reports Low-Risk Long-Term Upside Significant Near-Term Growth 170 MMbo potentially recovered through EOR properties Reserve growth through CO 2 infrastructure Woodford Shale developments 3,997 identified additional potential drilling locations 15-year inventory of drilling locations at 363 drilling rate of 240 operated wells and 123 outside operated wells 835 enhancement projects 363 wells planned for 2010 with expected net exit rate production of 13.9 MBopde Low-risk infill or step-out wells (98% success rate in 2006- 2008) 1,487 identified proved undeveloped drilling locations • Primarily focused on the Mid-Continent region with 1,199 locations Undeveloped acreage: 108,894 net acres |
 13 13 Capital Budget Capital Budget 125 20 3 31 71 2009 Expanded Budget 377 302 230 667 Total 43 25 15 13 Tertiary Recovery 30 46 50 489 Acquisitions (1) 22 55 44 31 Enhancements 282 176 121 134 Drilling 2010 Prelim Budget 2008 2007 2006 Component Note: 1) 2006 Includes major acquisition of Calumet Oil Company 2010E Oil and Gas Capital Expenditures 6% 11% 75% 8% Drilling EOR Enhancements Acquisitions 7% 14% 75% 4% Mid-Continent Other Gulf Coast Permian Basin 2010E Drilling CAPEX by Major Plays Conventional Drilling EOR Drilling Oil & Gas Capital Expenditures ($MM) $MM $7.6 $10.4 $10.5 $12.2 $13.9 $14.1 $46.8 $49.6 0 5 10 15 20 25 30 35 40 45 50 Tunstill Camrick Osage County SWAGSU Haley Woodford Shale Cleveland Sand Granite Wash |
       14 14 Washita County, OK Granite Wash “A”, “B” & “C” Zones Horizontal drilling, 12,500’ depth Initial production rates: – 3 – 5 mmcf/d & 200 – 500 Bbl/d Scheduled to drill 12 wells in 2010 6 operated, avg WI 49% 6 non-operated, avg WI 13.4% Roxanne 1-17H Chap Op & 25% WI IP: 7.7 MMcf/d, 736 Bbl/d Peters 2H-19 Chap Op & 70% WI IP: 4.8 MMcf/d, 240 Bbl/d Gunter 2H-14 Chap Op & 70% WI IP: 6.5 MMcf/d, 500 Bbl/d Simpson 4-26H St. Mary’s Op, Chap: 16% WI IP: 5 MMcf/d, 200 Bbl/d West 7-35H, St. Mary’s Op, Chap: 11% WI IP: 5.2 MMcf/d, 480 Bbl/d Kliewer 18H (#1,2,3,4) CHK Op, Chap: 18% WI IP: 5.5 MMcf/d, 400 Bbl/d 3 Drilling, 1 proposed Kliewer #1-18H CHK Op, Chap: 18% WI IP: 11.6 MMcf/d, 700 Bbl/d Recently Drilled Wells Proposed Wells Sections w/Chap Interests Granite Wash Sand Play – Washita County, OK Granite Wash Sand Play – Washita County, OK 24 Potential drill locations: 23.7% Avg working interest: 1,620 Chaparral net acres: $6.4 Gross CapEx / well ($MM): 0.7 Gross reserves / well (MMboe): Formation Roxanne 2-17H Questar Op, Chap 25% WI Riley #1-20H CHK Op, Chap 14% WI Roxanne – 2-17H and 3-17H Questar Op, Chap 25% WI Proposed |
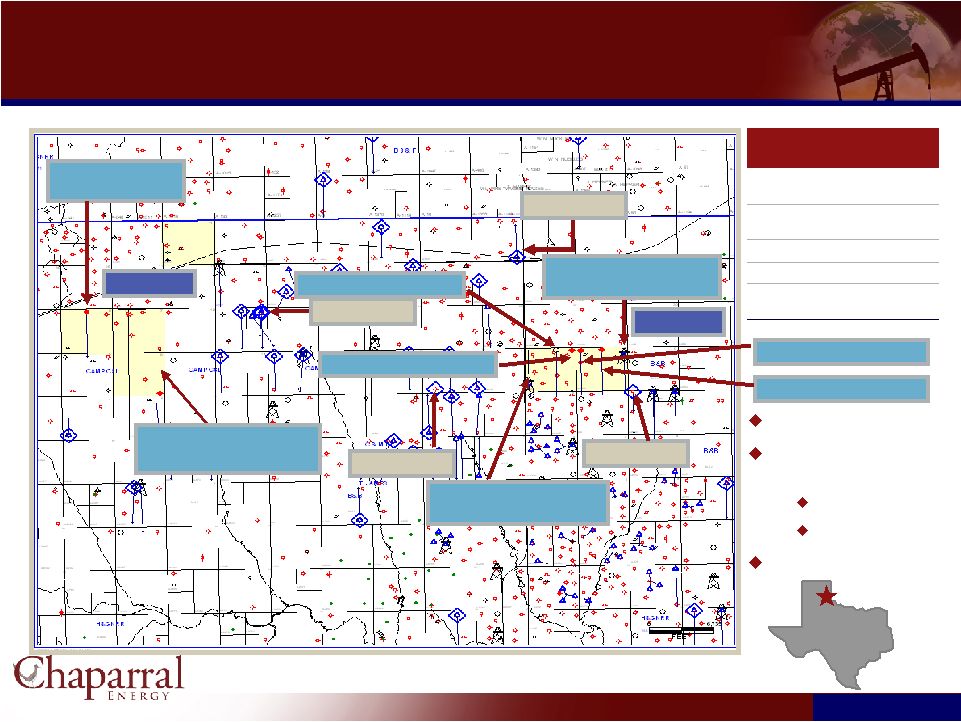 15 15 Granite Wash Sand Play - Wheeler Co., TX Granite Wash Sand Play - Wheeler Co., TX Brown “6” #2H WI 25% Proposed Brown “8” #2H WI 50%BPO, 50% WI - Proposed Britt 7-9H WI 40% Awaiting Completion Britt 8-5H WI 12.5% Awaiting Completion 21MMcfe/d 27.1MMcfe/d 10MMcfe/d 17MMcfe/d Brown Area Britt Area Britt #7-12H Drilling WI 40% Britt #7-11H Drilling WI 40%
Britt #8-6H Drilling WI 12.5% Britt #8-4H Drilling WI 12.5% 20 Potential drill locations: 51.2% Avg working interest: 855 Chaparral net acres: $7.38 Gross CapEx / well ($MM): 1.0 Gross reserves / well (MMboe): Play Statistics Horizontal Drilling Scheduled to drill 6 wells in 2010 4 op – WI 100% 2 nonop – WI 40% Depth 12,500’ |
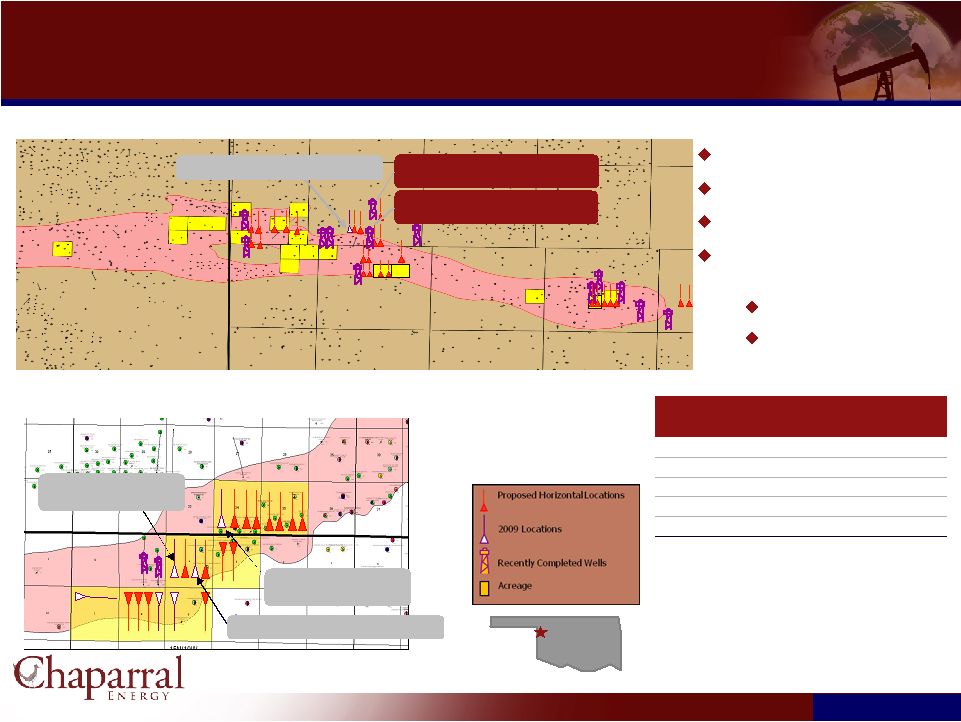 16 16 Cleveland Sand Play Cleveland Sand Play Ellis County Area Horizontal drilling Tight sand play Depth: 8,300 – 9,800 feet Scheduled to drill 30 wells in 2010 20 operated, avg WI 85% 10 non-op, avg WI 10% Aledo-Bray Area Milton #3H-26 Recently Completed Gilson 2H-24, Chap Op with 100% WI 1.8 mmcf/d, 240 BOPD State A 6H-36, Chap Op with 100% WI 2.8 mmcf/d, 250 BOPD Bray #3-4H Waiting on completion Chap Op 98% 62 Potential drill locations: 57% Avg working interest: 8,100 Chaparral net acres: $2.6 - $4.4 Gross CapEx / well ($MM): 0.3 – 0.5 Gross reserves / well (MMboe): Formation Robertson #3-34H Drilling Chap Op 100% WI Bray #4-4H Proposed Chap Op 100% WI |
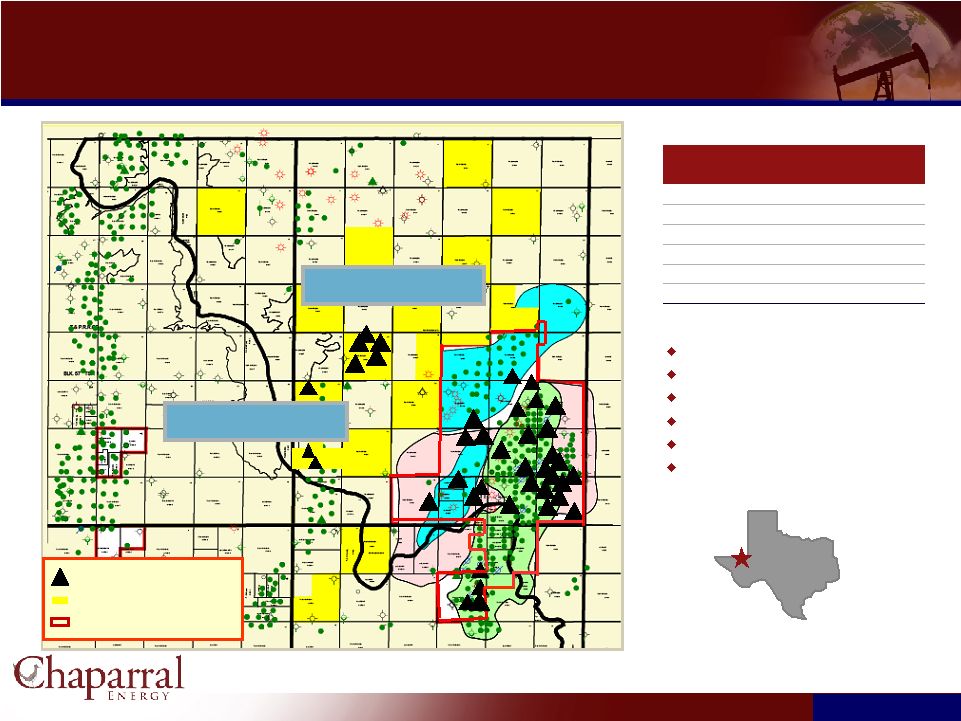
 17 17 Anadarko Basin - Woodford Shale Anadarko Basin - Woodford Shale Chaparral Operated Wells Chaparral Non-Operated Wells Industry Recently Permitted or Currently Drilling Locations Industry Completed Woodford Horizontal Wells Ellis Blaine Dewey Kingfisher Grady Caddo Washita Beckham Roger Mills Custer Canadian Chaparral’s Acreage 21,600 (+/-) net acres held by production (HBP), 1,080 non-producing acres Potential drilling locations 142 Play Economics (1) 4.0 – 6.0 Bcfe gross per well with 4,000 foot lateral Completed well costs: $7 – $9 million Recent Industry Woodford Gross IPs Golden 1 – 3H: 8.3 MMcfe/d Guinn 1 – 10H: 7.1 MMcfe/d Dixie 1 – 4H: 5.9 MMcfe/d Young 2-22H: 6.8 MMcfe/d Drilling Activity Expect to drill 10 wells in 2010, avg WI 20.2% Currently drilling: Kurtz 1-14H Proposed drilling: Cana 1-5H, Cana 1-34H, Cana 1-35H Note: 1) Play economics sourced from Cimarex May 2009 presentation |
 18 18 Haley Play Area Haley Play Area University 19-3-1, APC Op, IP: Jan ’07 12 month avg – 18.2 mmcfe/d Bowdle 47-2, Chap Op & 98% WI TD: 3Q08, IP 18.8 mmcfe/d Bowdle 48-1R, APC Op, IP Sept ’06 12-month avg: 3.5 mmcfe/d Haley 36-4, Chap Op, 91% WI, IP Aug ’06 12-month avg: 1.8 mmcfe/d Bowdle 48-2, APC Op, 2.8 mmcfe/d Bowdle 47-4, Chap Op & 98% WI Currently drilling Deep Drilling Locations Drilling or Recent Completions Chaparral Acreage Atoka and Morrow Play (17,700’ depth) Expensive wells High production rates Large reserve potential Haley 36-5, Chap op, 78% WI, Next proposed location 1 2010 Scheduled drill locations: (Chaparral operated) 74% Avg working interest: 3,840 Chaparral net acres: $10.2 Gross CapEx / well ($MM): 1.9 Gross reserves / well (MMboe): Morrow Formation Atoka 5 2010 Scheduled drill locations: (Chaparral Operated) 74% Avg working interest: 3,840 Chaparral net acres: $2.1 Gross CapEx / well ($MM): 0.3 Gross reserves / well (MMboe): Springs Formation Bone |
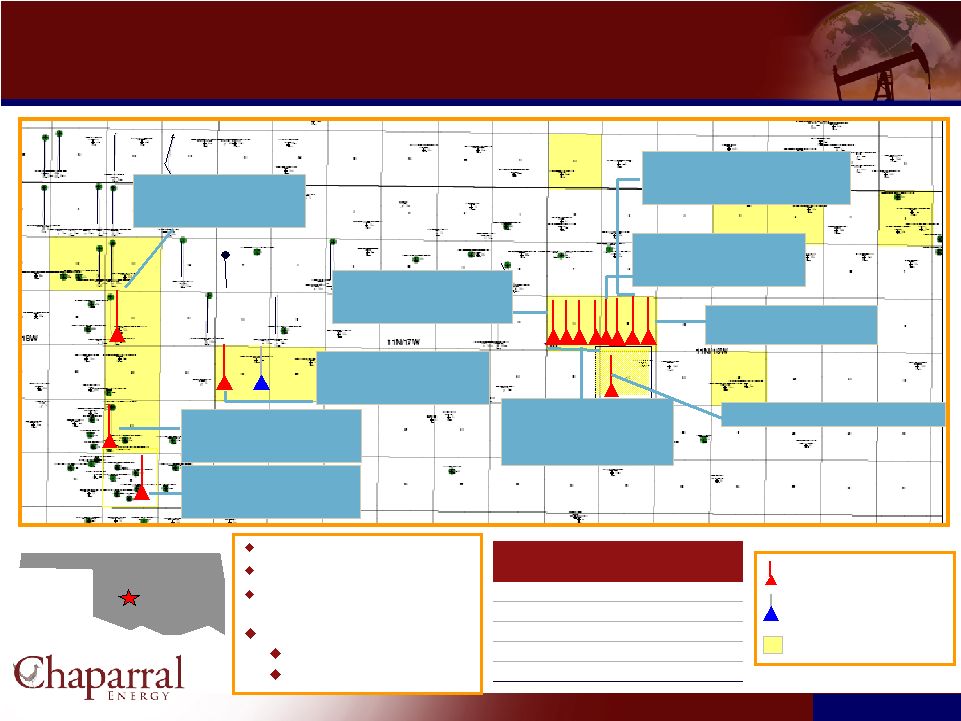
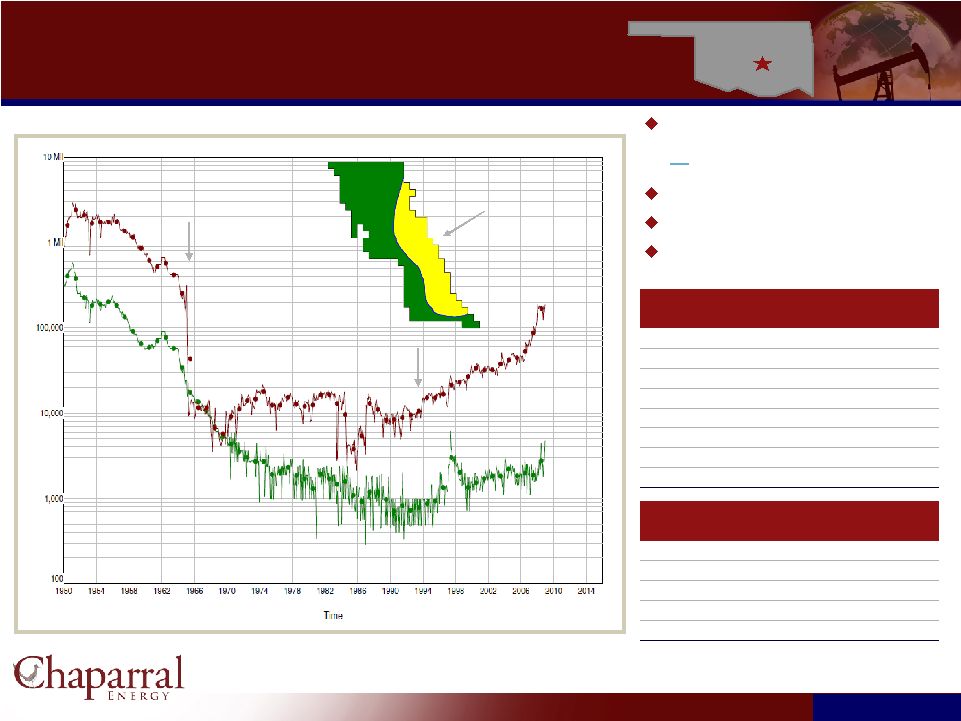 19 19 Southwest Antioch Gibson Sand Unit Southwest Antioch Gibson Sand Unit Chaparral’s second largest play by proved reserves 4% of proved reserves Location: Garvin Co., OK Depth: 7,000 feet Scheduled to drill 12 Chaparral operated wells in 2010 Garvin County, OK Chaparral Assumes Operations Gas Mcf/mo Oil Bbl/mo Field Shutdown and Plugging Area Affected by Gas Injection Chaparral Acreage 40 Potential drill locations: 99 Avg working interest: 9,520 Chaparral net acres: $1.0 Gross CapEx / well ($MM): 0.125 Gross reserves / well (MMBoe): Formation 190.7 OGIP (BCF) 6.4 Total Proved Reserves (MMBoe): 73.0 Current Gas-in-Place (Bcf): 142.5 Cumulative Injection (Bcf): 261.4 Cumulative Gas Recovery (Bcf): 19.1 Secondary Oil Recovery (MMboe): 21.2 Primary Oil Recovery (MMboe): 161.7 OOIP (MMBO) Unit Statistics |
 20 20 Enhanced Oil Recovery Opportunities Enhanced Oil Recovery Opportunities Chaparral utilizes CO 2 and polymer EOR techniques CO 2 EOR involves injection of CO 2 and water to enhance hydrocarbon mobility to drive hydrocarbons to wells Polymer EOR improves areal sweep efficiency and minimizes channeling |
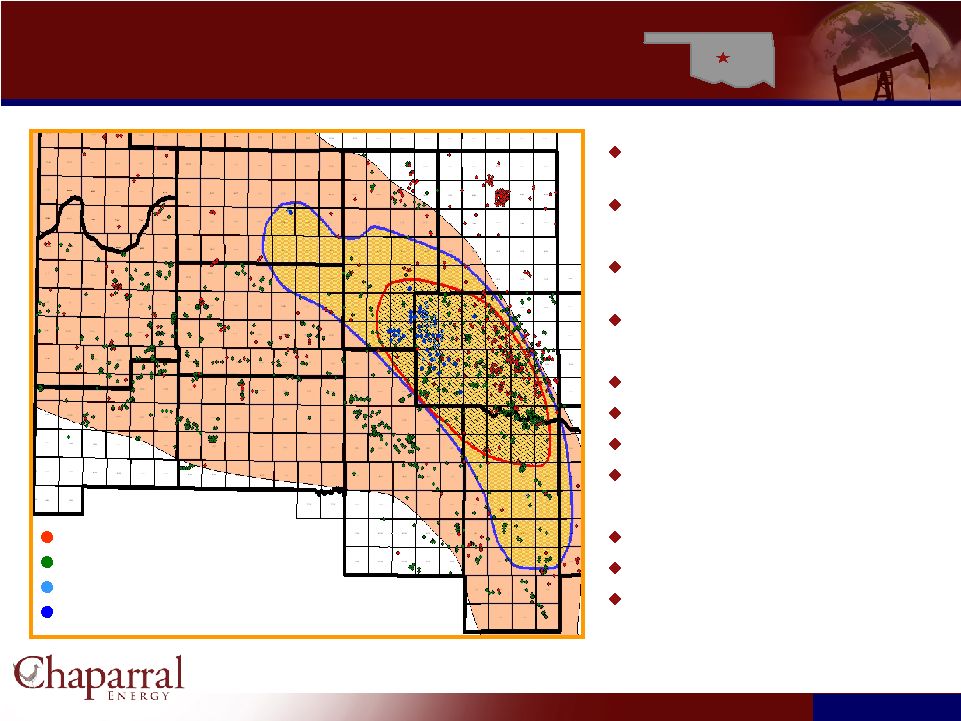
 21 21 North Burbank Unit – Polymer & CO 2 Tertiary Recovery North Burbank Unit – Polymer & CO 2 Tertiary Recovery WI - 99.25% (operated property) Size - 23,080 acres; Depth - 3,000’ OOIP – 671 MMBO Cum. Recovery - 317 MMBO (primary & secondary) Producing zone - Bartlesville Reservoir – 2 Tier Wells - 269 producing, 193 injection, 493 TA Upside Potential - Polymer EOR Phillips instituted polymer EOR Program on 1,440 acres from 1980 - 1986 as pilot area Production increased from 500 BOPD to 1,200 BOPD Phillips incremental oil recovery 2.4MMBO Reinstituted polymer flood on 485 acres; $6MM cost, 19 well pattern Return 400+ wells to production; 8-33 BOPD per well CO EOR Potential Chaparral Polymer Pilot Phillips’ Polymer Project North Burbank Improved Recovery 60 70 80 90 100 110 120 130 140 150 160 Boe/d 2 |
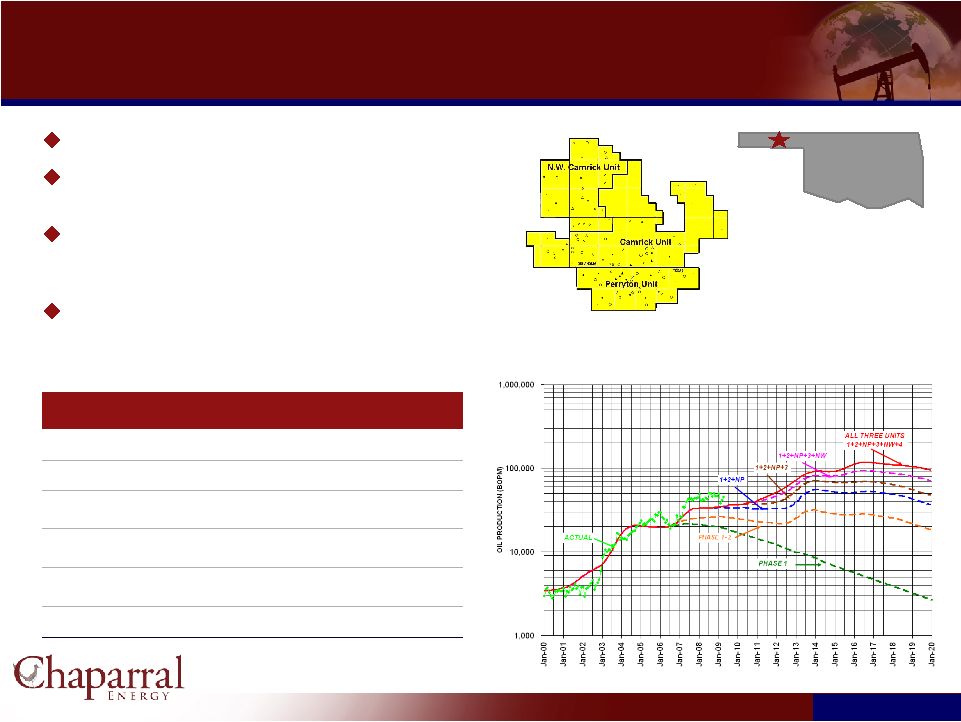 22 22 Camrick Area CO 2 Tertiary Recovery Camrick Area CO 2 Tertiary Recovery Consists of three unitized fields Operated with an average working interest of 54% CO 2 injection has improved gross production in Camrick Area from 175 Bbls/day to 1,600 Bbls/day Expansion of CO 2 injection operations is currently underway and is expected to be implemented across all units 14.4 Estimated tertiary CO2 recovery (Mmbo) 13.1 Secondary oil recovery (Mmbo) 16.6 Primary oil recovery (Mmbo) 125.6 OOIP (Mmbo) 15,200 Net Acreage Morrow Reservoir NW Camrick, Camrick and Perryton Units: 8/8 Basis Beaver & Texas Counties, OK Camrick CO2 Flood Oil Production by Month Camrick Area, OK |
 23 23 Substantial Upside With CO 2 Tertiary Recovery Substantial Upside With CO 2 Tertiary Recovery CO 2 project inventory 6 proved reserve projects 55 additional projects identified CO 2 Infrastructure 366 miles of existing line 46 MMcfe/d of CO 2 supply Includes connecting 15 - 18 MMcf/d of CO 2 from Arkalon 16 mile expansion in 2008 $20 million spent in 2008 $79.9 million investment $196.4 million net cash flow $65.7 million PV-10 3.5x ROI 39.5% IRR CO 2 Tertiary Recovery Projects Economics (6 Proved Reserves Projects) |
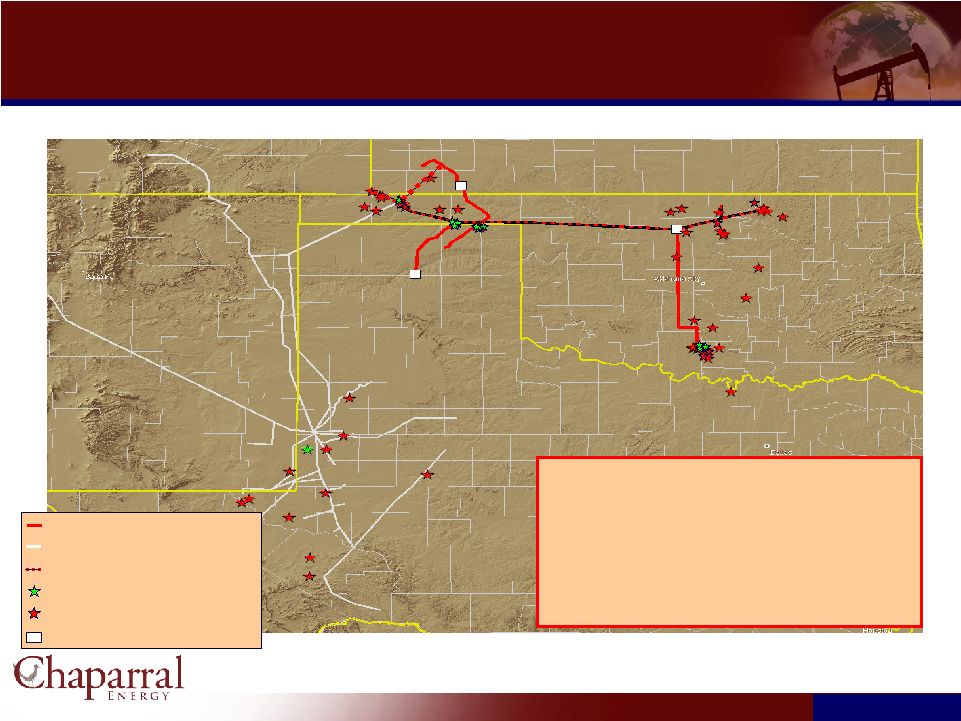 24 24 Currently Owned CO 2 Development Potential Currently Owned CO 2 Development Potential Total OOIP 3,140 MMBO Primary Production 543 MMBO Secondary Recovery 517 MMBO Tertiary Potential 301 MMBO Net Tertiary Potential 170 MMBO Existing CELLC CO Pipelines Existing Third Party CO Pipelines Proposed CELLC CO Pipelines Owned Active CO fields Owned Potential CO fields CO Source Locations 2 2 2 2 2 2 |
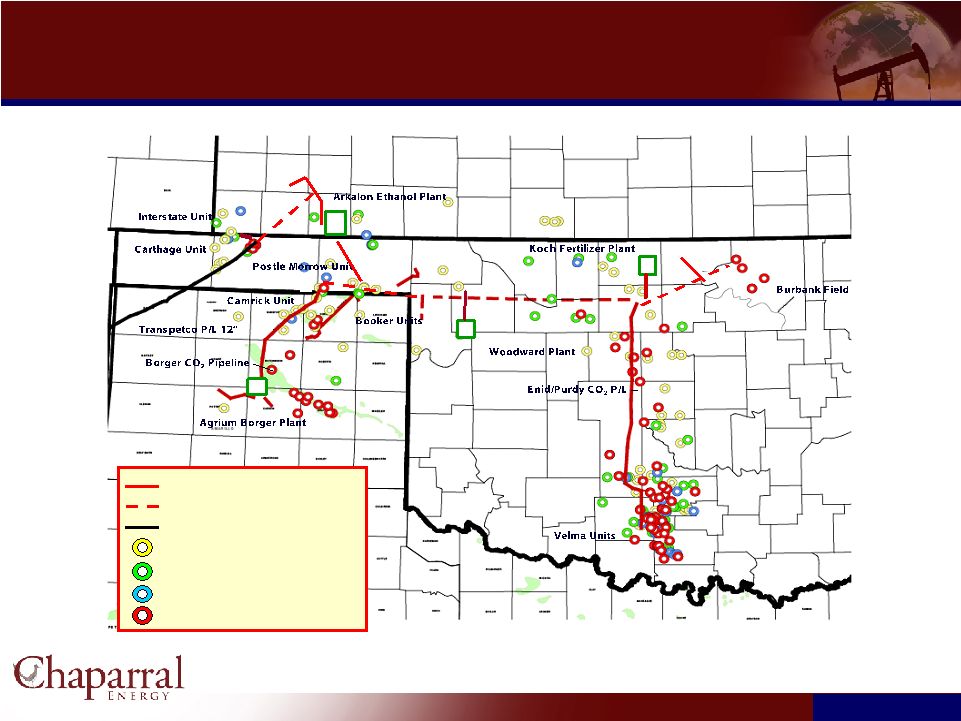 25 25 CO 2 Infrastructure & Resource Potential CO 2 Infrastructure & Resource Potential Chaparral CO Pipelines Proposed Chaparral Pipelines Third Party Pipelines Cum. Recovered 1-3 MMBO Cum. Recovered 3-5 MMBO Cum. Recovered 5-10 MMBO Cum. Recovered 10+ MMBO 2 |
 26 26 EOR Potential EOR Potential CO 2 - EOR is the fastest growing form of Enhanced Oil Recovery in the US 206,000 BOPD in 2004, mostly in Permian Basin and New Mexico 4% of US crude oil production Traditional oil recovery methods leave behind 390 billion barrels already discovered 1.5 11.5 17.8 154 Illinois & Michigan 11.8 65.6 89.6 222 Mid-Continent 6.9 27.5 44.4 239 Gulf Coast 5.2 57.3 83.3 172 California Technically Recoverable (Billion Barrels) ROIP (Billion Barrels) OOIP (Billion Barrels) CO 2 – EOR Technically Recoverable Resource Potential U.S. Department of Energy – Office of Fossil Energy – Office of Oil and Natural Gas 88.7 5.9 2.7 17.3 4.2 20.8 12.4 390.0 581.7 1,581 Total 15.7 28.1 99 Louisiana Offshore 9.5 13.2 93 Williston 73.6 109.0 199 Texas: East & Central 22.6 33.6 162 Rocky Mountains 61.7 95.4 207 Permian 45.0 67.3 34 Alaska All Reservoirs (Ten Basins / Areas Assessed) No. Large Reservoirs Assessed Basin / Area Source:Advanced Resources International, February 2006 Notes: 1) Original oil in place, in all reservoirs in basins / areas 2) Remaining oil in place, in all reservoirs in basins / areas (1) (2) |
 27 27 Financial Overview Financial Overview |
 28 28 Capitalization and Cash Proceeds Capitalization and Cash Proceeds 6.01 8.07 Total Debt / June 30, 2009 Proved Reserves ($/Boe) 2.6 3.5 Total Debt / 2010 EBITDA (x) 74% 99% Total Debt / Total Capitalization (%) Credit Statistics 1,187 1,187 Total Capitalization 309 300 9 Stockholder’s Equity 793 1,093 Net Debt 878 (300) 1,178 Total Debt 648 648 Senior Notes, Net 9 9 Installment Notes Payable, Due 2013 14 14 Real Estate Mortgage Notes, due 2011 Through 2039 207 (300) 507 Revolving Credit Line, Due 2010 Debt 85 85 Cash and Cash Equivalents Pro Forma Adjustments (1) 3Q09 ($MM) Chaparral Capitalization (109) Redemptions (1) ($MM) 300 Total Cash Proceeds (26) Transaction Fees (17) Warrant Repurchase (1) 452 Beginning URX Cash URX Cash Proceeds Notes: 1) Assumes 24% redemptions of URX public shares and $0.55 warrant repurchase price for 50% of outstanding
warrants 2) 2010E EBITDA estimates based on IBES consensus; Debt pro forma for announced transactions; Chaparral debt
based on Sept 30, 2009 debt pro forma for URX investment Total Debt / 2010E EBITDA (2) 2.6 2.3 3.9 2.0 3.6 1.7 2.1 0.0 1.0 2.0 3.0 4.0 5.0 PQ CWEI SD PETD KWK HK CPR Pro Forma B+ B (Stable) B (Neg) B- |
 29 29 Historical and Projected Financials Historical and Projected Financials 339.4 194.7 280.2 6.7 (86.0) 176.7 22.4 33.8 120.5 450.2 0.4 19.8 3.4 7.1 57.61 7.72 96.23 2008A (81.2) (88.9) Interest (Expense) 253.1 138.7 Discretionary Cash Flow 0.9 15.1 Other Income / (Expense) 412.8 129.3 Total Capex (2) 334.3 220.2 EBITDA 182.0 143.4 Operating Expenses 29.3 23.6 General and Administrative Expenses 39.0 21.5 Production and Ad Valorem Taxes 113.7 98.3 Lease Operating Expenses 515.4 348.4 Revenue Including Cash Settled Derivatives ($MM) 0.5 0.4 NGL (MMBbls) 29.7 22.5 Gas (Bcf) 4.4 3.5 Oil (MMBbls) 9.9 7.6 Production (MMBoe) 48.00 38.51 NGL – Wellhead ($/Bbl) 4.97 3.34 Gas – Wellhead ($/Mcf) 71.36 56.44 Oil – Wellhead ($/Bbl) Price Forecasts (1) 2010E 2009E Note: 1) Based on September 30, 2009 strip price of $60.39 / Bbl and $4.24 / Mcf in 2009 and $73.84 / Bbl and $6.21
/ Mcf in 2010 2) Includes oil & gas capex, non-drilling capex, and capitalized general and administrative
expenses |
 30 30 0% 10% 20% 30% 40% 50% 60% 70% 80% 90% 100% Hedge Portfolio Hedge Portfolio Provides financial security for next two volatile price years Leaves upside pricing potential for outer years Hedged natural gas basis for 85% of proved developed production for 2010 and 2011 to eliminate basis blow
out Note: 1) Dollars represent average strike price of hedges (includes all derivative instruments) (2) Jan-Dec 2011 Jan-Dec 2010 Nov-Dec 2009 Gas Basis Hedges 82% $0.74 86% $0.81 79% $0.96 % Gas PDP Price Nov – Dec 2009 2010 2011 $7.79 $7.43 $7.38 $67.30 $67.57 $68.06 $10.00 $10.00 $110.00 $110.00 $110.00 $13.85 $11.53 $164.00 $169.00 $153.00 Oil Collars Oil Swaps Gas Swaps Gas Collars 2Q 2009 - monetized 2012 & 2013 contracts, net cash proceeds $102 million 4Q 2008 and 1Q 2009 – monetized portion of 2009 contract, net cash proceeds $42 million % of Proved Developed Producing Hedged (October 26, 2009) |
 31 31 Valuation and Ownership Valuation and Ownership 10.03 Implied Share Price ($) (2) 89.9 Total Shares Outstanding (millions) 902 Equity Value (43) Less: Transaction Fees and Warrant Redemption (1) (1,093) Less: Net Debt 343 Add: URX Cash (1) 1,695 Aggregate Value 5.1 2010E AV / EBITDA (x) 334 2010E EBITDA $MM, Unless Noted Breakeven Valuation Post Transaction Ownership Summary URX Public URX Sponsor * Altoma * Notes: 1) Assumes 24% redemptions of URX public shares and $0.55 warrant repurchase price for 50% of outstanding
warrants 2) Share price based on redemption value of URX public shares assuming $452 million in trust as of Sept. 30,
2009 and 45 million public shares 3) As of October 12, 2009 based on IBES estimates and company filings pro forma for announced
transactions Aggregate Value / 2010E EBITDA (3) 5.1 9.5 8.6 7.8 7.7 7.5 6.2 5.3 0.0 2.0 4.0 6.0 8.0 10.0 WLL PXD REN CXO EAC DNR ARD CPR 7.7 Aggregate Value / 2008YE Reserves (3) 7.96 13.50 16.96 18.99 21.27 24.34 28.93 14.95 0.00 8.00 16.00 24.00 32.00 PXD REN WLL EAC ARD DNR CXO CPR 18.99 Chesapeake * Fischer Investments * (Mark Fischer) 38% 5% 15% 24% 18% ($/Boe) (x) * Subject to one-year lock-up period Pro Forma Pro Forma |
 32 32 Appendix Appendix |
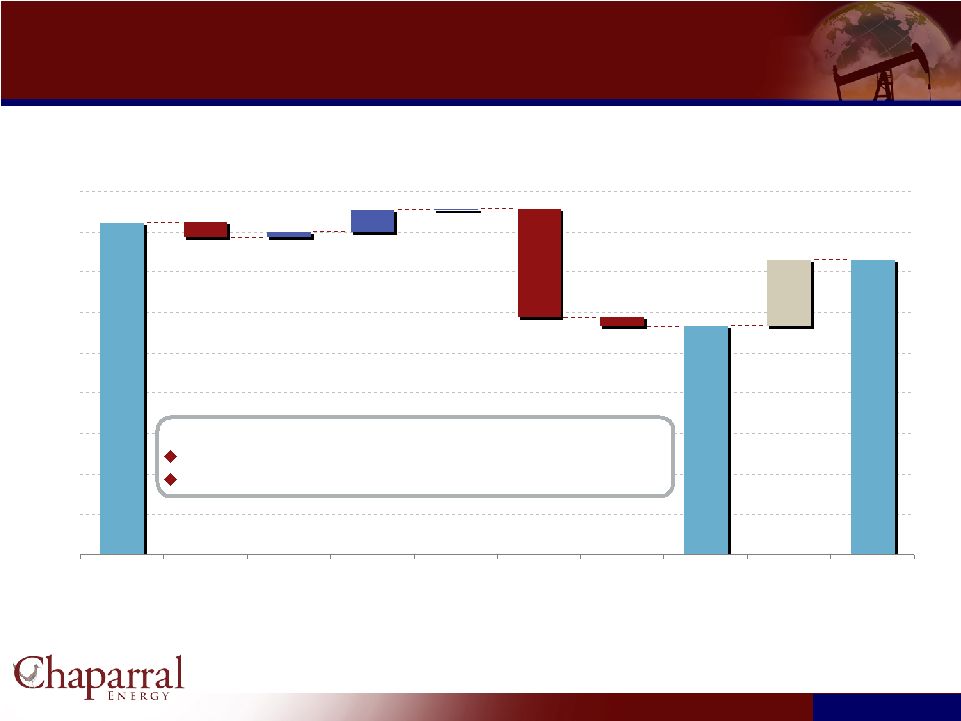 33 33 2008 Reserve Bridge 2008 Reserve Bridge SEC YE 2008 Pricing 146.0 32.6 (4.4) 164.5 (7.1) 2.4 11.0 0.7 (53.7) 113.4 0 20 40 60 80 100 120 140 160 180 YE 2007 Reserves Production Acquistions / Divestures Extensions / Discoveries Improved Recovery Revisions Due to Price Other Revisions YE 2008 Reserves Price Revisions and Other 1H 2009 Reserves Proved Reserves decreased by 51 MMBoe in 2008 Significantly lower YE 2008 prices – $44.60/Bbl, $5.62/MMBtu Select higher-cost EOR properties became uneconomic (1) Note: 1) Change from YE2008 to 1H2009 reserves due to increased commodity prices, extensions and discoveries, and reduced by oil and gas production |
 34 34 Drilling Opportunities Drilling Opportunities 19,171 54,447 596 86.4 4,579 53 Permian Basin 108,894 14,340 0 2,611 6,731 66,041 Undeveloped Acreage (net) 530,042 43,231 14,772 14,691 19,733 383,168 Developed Acreage (net) 3,997 46 34 102 191 3,028 Identified Additional Potential Drilling Locations 33.4 49,636 1,487 Total 226.3 1,132 5 Gulf Coast 125.6 503 4 Ark-La-Tex 10.2 1,050 103 Rocky Mountains 6.0 739 123 North Texas (1) 34.7 41,633 1,199 Mid-Continent MBoe per Proved Undeveloped Location (net) Proved Undeveloped Reserves (net MBoe) Identified Proved Undeveloped Drilling Locations (1) Note: 1) High number of drilling locations due to low ownership percentage in acreage
|
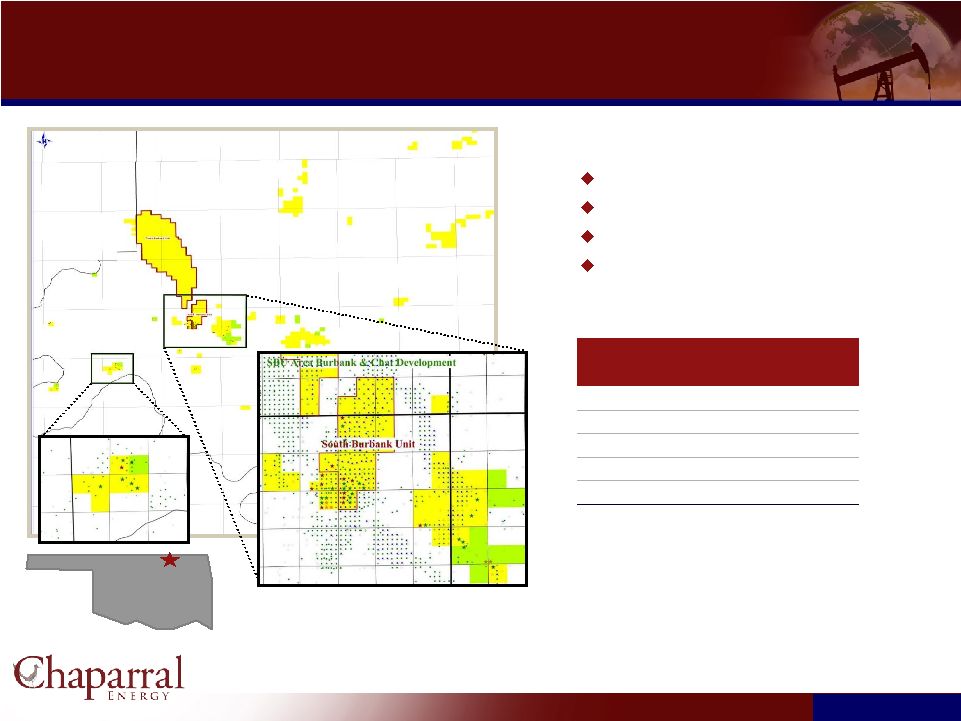 35 35 Osage And Creek Counties, OK Osage And Creek Counties, OK Osage County, OK North Burbank Unit South Burbank Unit West Fairfax Chat Chaparral’s largest property Producing depth: 3,000ft. 1 company rig currently running Scheduled to drill 38 Chaparral operated wells in 2010 187 Potential drill locations: 89.4% Avg working interest: 66,380 Chaparral net acres: $0.4 Gross CapEx / well ($MM): 0.1 Gross reserves / well (MMboe): Formation |
 36 36 Tunstill Field Play Tunstill Field Play BELL CANYON SAND Loving Co. Reeves Co. 292 Potential drill locations: 100% Avg working interest: 10 Total seismic sq.mi.: 20,640 Chaparral net acres: $0.9 Gross CapEx / well ($MM): 0.1 Gross reserves / well (MMboe): Formation Recently Drilled Locations Farm-In Acreage: 10,920 acres Existing Acreage: 9.400 acres Location: Loving County, Texas Substantial Bone Springs potential Delaware Basin Multi-pay environment Depth: 3300-5200 feet Scheduled to drill 10 Chaparral operated wells in 2010 CHERRY CANYON SAND |
 37 37 7.75 6.80 11.94 2.95 5.70 9.85 9.03 0.00 3.00 6.00 9.00 12.00 15.00 PQ CWEI SD PETD HK KWK CPR Credit Profile (1) (2) Credit Profile (1) (2) % $ / Boe $ / Boe x Notes: 1) Assumes 24% redemptions of URX public shares and $0.55 warrant repurchase price; Debt as of Sept 30, 2009
pro forma for URX investment 2) As of October 12, 2009 based on IBES estimates and company filings pro forma for announced
transactions Pro Forma Total Debt / Book Capitalization 56 58 98 41 75 43 74 0 20 40 60 80 100 120 PQ CWEI SD PETD KWK HK CPR Pro Forma B+ B (Stable) B- B (Neg) Total Debt / 2008YE Proved Reserves B+ B (Stable) B- B (Neg) Total Debt / 2008YE PD Reserves 10.42 10.63 21.38 6.73 13.09 11.93 12.30 0.00 5.00 10.00 15.00 20.00 25.00 PQ CWEI SD PETD HK KWK CPR Pro Forma B+ B (Stable) B (Neg) B- Total Debt / 2010E EBITDA 2.6 2.3 3.9 2.0 3.6 1.7 2.1 0.0 1.0 2.0 3.0 4.0 5.0 PQ CWEI SD PETD KWK HK CPR Pro Forma B+ B (Stable) B (Neg) B- |
 38 38 Experienced Management Team Experienced Management Team John A. Catsimatidis Executive Chairman and Director Mark A. Fischer CEO, President, Co-Founder and Director Joseph O. Evans Exec. VP and CFO Robert W. Kelly II Sr. VP and General Counsel Larry E. Gateley Sr. VP – Reservoir Engineering and Acquisitions James M. Miller Sr. VP – Operations and Production Engineering Chairman and CEO of Red Apple Group and United Refining Company, 70kb/d integrated oil refiner Interests in petroleum refining and distribution, real estate, supermarkets and finance 37 years experience in the Mid-Continent and Permain Basin regions Previous experience at Exxon, TXO and Slawson Exploration; co-founded Chaparral Energy in 1988 33 years experience in oil and gas accounting and finance Audit Partner, Deloitte and Touche’s Energy practice until 1997 28 years experience in oil and gas land, title, and legal affairs Previous experience with EOG Resources and TXO Production 36 years diversified management, operational, and technical experience Previous positions included Exxon, Post Petroleum and SMR Energy 22 years experience in petroleum engineering Previous experience at Robert A. Mason Production Co. and KEPCO Operating Inc.
|
 39 39 Independent Directors Independent Directors Frost W. Cochran Director Kathleen Alana McGinty Director Michael A. Creel Director Current Managing Director and founding partner of Post Oak Energy Capital Co-founder and President of Signal Hill Power. Managing Director of Torch Energy from 1998 until March 2002. Current operating partner at Element LLC; Director at NRG Energy Inc, Energy East, and Weston Solutions, Inc Secretary of the Pennsylvania Dept of Environmental Protection 2003-2008, Chair of the Pennsylvania
Energy Development Authority 2004-2008, and Chair of White House Council on Environmental
Quality 1993-1998 Current President and CEO of Enterprise Products GP, LLC. EPCO Group Vice Chairman Dec 07 to present and Exec Vice President And COO 2005-2007. Current Director of Duncan energy Partners LP and EPE Holdings, LLC Thomas E. Hassen Director Michael Bilirakis Director Current Vice Chairman of Irving Place Capital (formerly Bear Steams Merchant Banking) Global Industries Groups within Bear Stearns 2005-2008, Credit Suisse First Boston 1999-2005 and Morgan Stanley & Co. 1978-1999 Current Director of United Refining Company Member of the House of Representatives for 24 years; House Energy and Commerce Committee for 22 years,
and 14 years as a member of NATO Parliamentary Assembly |