Attached files
Table of Contents
UNITED STATES
SECURITIES AND EXCHANGE COMMISSION
Washington, D.C. 20549
FORM 10-K
| (Mark One) | ANNUAL REPORT PURSUANT TO SECTION 13 OR 15(d) | |
| x | OF THE SECURITIES EXCHANGE ACT OF 1934 | |
| For the fiscal year ended October 2, 2009 |
OR
| ¨ | TRANSITION REPORT PURSUANT TO SECTION 13 OR 15(d) OF THE | |
| SECURITIES EXCHANGE ACT OF 1934 | ||
| For the transition period from to |
Commission File Number: 0-25395
VARIAN SEMICONDUCTOR EQUIPMENT
ASSOCIATES, INC.
(Exact name of registrant as specified in its charter)
| DELAWARE | 77-0501994 | |
| (State or other jurisdiction of Incorporation or organization) |
(IRS Employer Identification No.) | |
| 35 Dory Road, Gloucester, Massachusetts |
01930-2297 | |
| (Address of principal executive offices) | (Zip Code) | |
Registrant’s telephone number, including area code (978) 282-2000
Securities registered pursuant to Section 12(b) of the Act:
| Title of Each Class |
Name of Exchange on Which Registered | |
| Common Stock, $0.01 par value | NASDAQ Global Select Market |
Securities registered pursuant to Section 12(g) of the Act:
None
Indicate by check mark if the registrant is a well-known seasoned issuer, as defined in Rule 405 of the Securities Act. YES x NO ¨
Indicate by check mark if the registrant is not required to file reports pursuant to Section 13 or Section 15(d) of the Act. YES ¨ NO x
Indicate by checkmark whether the registrant (1) has filed all reports required to be filed by Section 13 or 15(d) of the Securities Exchange Act of 1934 during the preceding 12 months (or for such shorter period that the registrant was required to file such reports), and (2) has been subject to such filing requirements for the past 90 days. YES x NO ¨
Indicate by check mark whether the registrant has submitted electronically and posted on its corporate Web site, if any, every Interactive Data File required to be submitted and posted pursuant to Rule 405 of Regulation S-T (§232.405 of this chapter) during the preceding 12 months (or for such shorter period that the registrant was required to submit and post such files). Yes ¨ No ¨
Indicate by checkmark if disclosure of delinquent filers pursuant to Item 405 of Regulation S-K (§229.405 of this chapter ) is not contained herein, and will not be contained, to the best of registrant’s knowledge, in definitive proxy or information statements incorporated by reference in Part III of this Form 10-K or any amendment to this Form 10-K. x
Indicate by check mark whether the Registrant is a large accelerated filer, an accelerated filer, a non-accelerated filer or a smaller reporting company. See definitions of “large accelerated filer,” “accelerated filer” and “smaller reporting company” in Rule 12b-2 of the Exchange Act (Check one):
Large accelerated filer x Accelerated filer ¨ Non-accelerated filer ¨ Smaller reporting company ¨
Indicate by checkmark whether the registrant is a shell company (as defined in Exchange Act Rule 12b-2). Yes ¨ No x
The aggregate market value of the registrant’s common stock held by non-affiliates as of April 3, 2009 was $1,772,812,733.
The registrant had 73,578,350 shares of common stock outstanding as of November 16, 2009.
An index of exhibits filed with this Form 10-K is located on page 39.
DOCUMENTS INCORPORATED BY REFERENCE:
| Document Description |
Part of Form 10-K into which incorporated | |
| Portions of the Registrant’s Proxy Statement with respect to the Annual Meeting of Stockholders to be held on February 8, 2010 to be filed with the Securities and Exchange Commission not later than 120 days after October 2, 2009. | Part III |
Table of Contents
VARIAN SEMICONDUCTOR EQUIPMENT ASSOCIATES, INC
FORM 10-K
FOR THE FISCAL YEAR ENDED OCTOBER 2, 2009
| PART I | ||||
| Item 1. | 1 | |||
| Item 1A. | 12 | |||
| Item 2. | 19 | |||
| Item 3. | 20 | |||
| Item 4. | 20 | |||
| PART II | ||||
| Item 5. | 21 | |||
| Item 6. | 23 | |||
| Item 7. | Management’s Discussion and Analysis of Financial Condition and Results of Operations |
25 | ||
| Item 7A. | 40 | |||
| Item 8. | 41 | |||
| Item 9. | Changes in and Disagreements with Accountants on Accounting and Financial Disclosure |
41 | ||
| Item 9A. | 41 | |||
| Item 9B. | 42 | |||
| PART III | ||||
| Item 10. | 43 | |||
| Item 11. | 43 | |||
| Item 12. | Security Ownership of Certain Beneficial Owners and Management and Related Stockholder Matters |
43 | ||
| Item 13. | Certain Relationships and Related Transactions, and Director Independence |
43 | ||
| Item 14. | 43 | |||
| PART IV | ||||
| Item 15. | 44 | |||
Table of Contents
| Item 1. | Business. |
Overview
We are the leading supplier of ion implantation systems used in the fabrication of integrated circuits, which we refer to as microchips or chips. We design, manufacture, market and service semiconductor processing equipment for virtually all of the major semiconductor manufacturers, in the United States, or U.S, Europe and Asia Pacific. The VIISta™ ion implanter products are designed to leverage single wafer processing technology for the full range of semiconductor implant applications. We have shipped more than 4,000 systems worldwide.
Our business is cyclical and depends upon semiconductor manufacturers’ expectations and resulting capacity investments for future integrated circuit demand. From 2005 to 2007, the total available market for ion implanters grew as memory manufacturers increased capacity to meet demand. During this time, we also realized significant market share gains through a superior product portfolio. In 2008, the semiconductor capital equipment industry entered a cyclical, supply-side driven downturn resulting from the significant capacity expansions of the previous three years. The downturn was exacerbated by a drop in demand due to a worsening worldwide macro-economic environment. In 2009, the total available market for the entire capital equipment industry is expected to decrease by over 45% from the prior year, as reported by Gartner Dataquest. While it is expected that we will realize modest market share growth in 2009, it will not offset the substantial drop in demand during that period.
We maintain a website at www.vsea.com. The information contained on the our website is not included in, or incorporated by reference into, this Annual Report on Form 10-K. Annual Reports on Form 10-K, Quarterly Reports on Form 10-Q and Current Reports on Form 8-K, and amendments to these reports, are made available through our website, free of charge, as soon as reasonably practicable following the electronic filing or furnishing of such materials by us to the Securities and Exchange Commission, or SEC, and are available at the SEC’s website at www.sec.gov.
The Industry
The semiconductor industry is essentially two different, but connected industries – microchip and capital equipment, or capex. The microchip industry is where microprocessors, dynamic random access memory, or DRAM, flash memory, or flash, signal processors, and hundreds of other electronic circuits are created on small squares of silicon known as “chips” or “die”. The manufacturers of these circuits can be categorized as either logic, memory, foundry, analog or discrete. Logic, memory and foundry represent the bulk of the industry. Logic manufacturers design and make chips that process information. Memory manufacturers design and make chips that store information. Foundry manufacturers are contractors that take chip designs from other companies and make the chips for them. Over the last several years, the demand for memory chips has outstripped the demand for logic chips. As the demand for memory-intensive applications such as cameras, phones and MP3 players grows, it is expected that memory will continue to represent the bulk of chips made worldwide.
We participate in the capex industry. The capex industry is comprised of companies that manufacture equipment used in the production of microchips. The two segments of the capex industry are known as front end of the line, or FEOL, and back end of the line, or BEOL. In the FEOL, the various circuit components such as transistors, diodes, resistors and capacitors are formed. In the BEOL, the wires, or interconnect, that join all of the components together to form the circuit are created. We manufacture tools that have traditionally been used to form the circuit components in the FEOL. In the last few years we have developed applications in precision materials modification that are also used in the BEOL. The semiconductor industry strives to provide more functionality for a lower cost. In order to achieve this dynamic and be successful, capex companies must innovate through aggressive research and development. Capex companies develop the technology and applications that drive the entire semiconductor industry.
1
Table of Contents
During the past five to ten years, the semiconductor capital equipment market has experienced a slowdown in growth as compared to historical levels. This is the result of improved productivity and efficiencies of capital equipment, the transition to larger 300mm (approximately 12 inch) wafers, the changing demand for next generation chips and the increasing technical difficulties with putting more and more transistors on a microchip.
Semiconductor manufacturing is highly competitive with each manufacturer seeking to provide products that consume the least amount of power, have the lowest cost and fastest processing speed. Integrated circuit manufacturers generally rely on equipment suppliers for the timely development of equipment and processes to meet their rapidly changing and complex requirements. Today, a semiconductor fabrication factory, or fab, can cost over $3.0 billion. As the industry transitions to 32nm (32 billionths of a meter) devices, these costs are expected to increase.
The fabrication of integrated circuits requires a number of complex and repetitive processing steps, including deposition, photolithography, etch, metrology, thermal anneal and ion implantation. Deposition is a process in which a film of either electrically insulating or electrically conductive material is deposited on the surface of a wafer. Photolithography is used to transfer a circuit pattern onto a light-sensitive material called photo-resist that, after development, can be used in turn to transfer the pattern onto the silicon surface. The etch process completes the transfer of the pattern into the various thin films used to make the integrated circuit. Metrology measures critical features and properties of the device to ensure correct fabrication. Thermal anneal is used to incorporate implanted impurities into the silicon crystal matrix and make them electrically active. Ion implantation provides a means for introducing impurities into the silicon, typically into selected areas defined by the photolithographic process. The selective implanting of ions into defined areas creates areas with different levels of conductivity that form the transistors of the integrated circuits.
Semiconductor manufacturers have historically sought to increase the number of transistors on each microchip by shrinking device structures. Through this relentless miniaturization, microchips have chronologically increased their processing capability or memory storage capacity. This is accomplished by exploiting advancements in photolithography. Each new advancement in photolithography is described by the minimum resolvable geometry and is commonly referred to as a “device node.” State-of-the-art production is now accomplished at 45nm nodes with 32nm nodes currently in development at more technologically advanced fabs. As advances in photolithography have become more challenging, ion implant has expanded its application portfolio to provide enabling capability in micro-chip device performance and yield, particularly in the area of damage engineering.
Improved productivity has been accomplished by transitioning to larger and larger silicon substrates, or wafers. From 25mm wafers used in the 1970’s to the current state–of-the-art wafer size at 300mm, each successive generation increases the number of microchips per wafer thereby increasing productivity. The use of a larger wafer generally requires a great deal of infrastructure changes in equipment and factory automation systems, so transitions only occur about every ten years. The use of 200mm wafers in production began at the end of the 1980’s. The migration from 200mm to 300mm began at the end of the 1990’s. 300mm tool sales now represent the majority of all new tool sales.
To achieve higher yields, implant systems must be capable of repeating the original process on a consistent basis for all devices on the wafer and for every wafer. These characteristics are known in the industry as uniformity and repeatability. In addition, implant systems must process wafers without damaging the device structures or introducing device-damaging contamination, which is typically characterized by cross contamination levels and particle defect adders. In many cases, implant performance is measured directly from the electrical performance of actual devices or device test structures. This is called electrical parametrics. In production fabs, there are typically multiple ion implantation systems performing the same processes in order to meet the production demands of the fab. In order to allow the greatest flexibility, semiconductor manufacturers require that each system perform equally well on each device step. This characteristic is known as tool-to-tool matching. In advanced device production, semiconductor manufacturers will often adjust the implant processes to compensate
2
Table of Contents
for variability in processes upstream from the implanter, making the implanter’s accuracy another important attribute. Uniformity, repeatability, accuracy, cross contamination, defect adders, parametrics and tool-to-tool matching are all critical in achieving commercially acceptable yields.
Semiconductor manufacturers generally measure the cost performance of their production equipment in terms of cost of ownership, which is determined by factoring in the fixed costs for acquisition and installation of the equipment, its variable operating costs and total wafer output. Equipment with higher wafer throughput increases total output and allows the semiconductor manufacturer to recover the purchase and installation costs of the equipment over a greater number of wafers and thereby reduces the cost of ownership of the equipment, on a per wafer basis. Throughput is most accurately measured on a net or overall basis, which takes into account the processing speed of the equipment and any system setup and non-operational downtime for cleaning, maintenance or other repairs. The increased difficulty of achieving desired transistor performance at advanced nodes has made high yields important in selecting processing equipment. The most desired systems are those that can achieve process results within critical tolerance limits and still operate at desired throughput rates.
The continuing evolution of semiconductor devices to smaller geometries and more complex multi-level circuitry has significantly increased the cost and performance requirements of the capital equipment used to manufacture these devices. As wafer fabs are projected to increase in cost substantially for each subsequent device node, yield losses and depreciation costs will become a much larger percentage of the aggregate production costs for semiconductor manufacturers relative to labor, materials and other variable manufacturing costs. As a result, there has been an increased focus by the semiconductor industry on obtaining increased capability and productivity to maintain returns from semiconductor manufacturing equipment, thereby increasing the revenue generated and reducing the effective cost of ownership of such systems.
Products
We design, market, manufacture and service ion implantation systems which are used to build the transistors that are the basis of integrated circuits or microchips. Ion implanters have the ability to implant selected elements into silicon wafers at precise locations and depths. Ion implanters create a beam of electrically charged particles called ions. Ions are created by taking elements like phosphorous or boron and adding or removing an electron from the elements atomic structure giving the ion an electric charge. The charge on the ion enables it to be moved, accelerated and focused using electromagnetic fields. The ion implanter creates an ion beam that embeds the ions into a silicon wafer, which is the substrate upon which chips are fabricated. The embedded ions change the electrical properties of the silicon. Implanted ions that are selectively placed form transistors which are a building block of all electronic circuits.
The most advanced microchip fabrication factories might have as many as 30 separate implant steps. An implant is characterized by the dose (amount of dopant) and the energy (depth that dopant goes into the silicon wafer). We provide four different single wafer implanter products, which cover the full range of required applications in these implant sectors: medium current—low dose, medium energy; high current—high dose, low energy; high energy—low dose, very high energy, and ultra high dose—very high dose, very low energy. There is some overlap of each implanter’s application coverage with the next. However, each implanter is designed to provide maximum productivity and yield within their respective application ranges.
We currently offer the following products:
Medium Current
Recognized as the industry benchmark for medium current performance and productivity, our single wafer VIISta 900XP series of ion implanters provide superior overall throughput, precision doping capability and unmatched contamination control. These systems excel at threshold voltage, or Vt, channel, retrograde well, pocket, and halo implants. Our other medium current systems include the VIISta 810XP, VIISta 810XE ion implanters. In addition, we continue to provide support for our older generation VIISta and legacy medium current ion implanters still in use by our customers.
3
Table of Contents
To achieve higher device speeds, chip designers often increase manufacturing process complexity by utilizing multiple transistor designs in the same integrated circuit. Multiple transistors require multiple implants, particularly the Vt implant. Additionally, energies are decreasing for all implant recipes as chips become more complex. This allows certain retrograde well implants, which are normally run on a high energy implanter, to be processed on more productive, less expensive medium current tools.
Medium current implanters are used in logic, memory and foundry manufacturers. In calendar year 2008, medium current represented about 35%, or $281.0 million, of the total available market, or TAM, for ion implant.
High Current
The high current VIISta HCS series of single wafer ion implanter provides the industry’s highest productivity and best contamination performance. In addition, these systems feature superior implant angle accuracy, beam steering correction and high-tilt angle capability—all of which are required for advanced device fabrication. The VIISta HCS has excellent process control capability for advanced ultra shallow junction applications, and can be used for source/drain, source/drain extension, gate doping, pre-amorphization, and materials modification applications. In addition, we continue to provide support for our older generation VIISta and legacy high current ion implanters still in use by our customers.
The high current sector is expected to grow relative to the overall implant market due to an increase in the number of implant steps needed to produce many advanced microchips. Due to the very low energies and high dose concentrations that are necessary for increased transistor speed and lower device power consumption, the productivity of high current systems tends to decline with advancing technology nodes, requiring more high current implanters. We were the first to introduce single wafer systems to this market sector through our VIISta platform.
High current implanters are used in logic, memory and foundry manufacturers. In calendar year 2008, high current represented about 47%, or $371.0 million, of the TAM for ion implant.
High Energy
The high energy VIISta HE and VIISta 3000 feature True ZeroTM degree implant and low contamination. Our high energy portfolio’s True ZeroTM capability provides a distinct advantage for semiconductor manufacturers that need increased device packing density in high-performance devices. The VIISta HE has outstanding process accuracy, offers excellent productivity, uniformity, angle control and medium current back-up flexibility. Our high energy products cover retrograde well, triple well, buried layers, and pocket applications. In addition, we continue to provide support for our older generation VIISta and legacy high energy ion implanters still in use by our customers.
High energy implanters are used in most wafer fabs, but predominantly by memory manufacturers. In calendar year 2008, high energy represented about 10%, or $79.0 million, of the TAM for ion implant.
Ultra High Dose
Medium current, high current and high energy tools utilize a focused ion beam to achieve the desired dose and energy for particular implant specie. For ultra high dose applications, the VIISta PLAD tool uses an altogether different technology. A plasma, or ionized gas, of the desired specie is created in a chamber where the wafer is held to a platen. A pulsed DC voltage is applied to the wafer platen which draws ions to the wafer at an energy level proportional to the DC pulse. This approach creates very high dose rates at low energies and provides conformal doping capability where the dopant covers all the angled surface features of the wafer uniformly. We have implemented many advanced control features on VIISta PLAD such as closed loop dosimetry to ensure accurate dosing of the wafer. With throughput up to six times greater than traditional beamline or modified-source beamline technologies, the VIISta PLAD has become an attractive solution for new critical very low-energy, very high-dose applications, such as dual poly gate.
4
Table of Contents
In the past, ultra high dose systems were used only by DRAM memory manufacturers. In fiscal year 2009 the VIISta PLAD product was shipped for new flash memory applications. In calendar year 2008, ultra high dose represented about 8%, or $67.0 million, of the TAM for ion implant. We expect ultra high dose will represent a larger percentage of overall TAM in 2009.
VIISta Platform
The VIISta 900XP, VIISta HCS, VIISta HE and VIISta PLAD are based on the same platform, thereby providing a high degree of commonality in subsystems and overall architecture. The VIISta platform provides customers with a great deal of flexibility in managing overall bay productivity, resulting in a reduction in customers’ time to first silicon, greater productivity across all applications, and an increase on their return on investment. We have shipped more than 1,000 VIISta systems. The VIISta platform of ion implanters is the only single wafer platform solution for all production applications. The VIISta products feature the Varian Control System, or VCS™, the Varian Positioning Systems, or VPS™, and the VIISta single wafer end-station. This high degree of commonality across the VIISta platform facilitates process matching throughout the system set, and provides flexibility in managing capacity, product mix changes, spare parts and training.
Product Upgrades
Previous generations of implant products have benefitted from product upgrades that focused exclusively on improvements to productivity. Implant has now become a device performance and yield enabling technology for advanced technology nodes in large part because of product upgrades. For example, we offer Superscan, PTC II and Carborane as enabling product upgrades. SuperScan is a software-driven upgrade that compensates for variability inherent in other process steps. Superscan can be used to alter the polish rate of a chemical mechanical planarization process across the wafer surface so the final result will yield a flatter wafer. Carborane is a molecular implant upgrade that improves device performance and unlike other molecular species does not require a specialized ion source. PTC II is a recently announced product upgrade that enables implants at very low wafer temperatures. Both Carborane and PTC II are used for damage engineering applications that improve device performance and speed and reduce leakage current providing longer battery life.
Customer Support and Services
We provide support services designed to maximize the productivity of our customers’ equipment and to increase uptime through the effective management of machine maintenance, parts inventory and product support. All of these services provide a direct link to our manufacturing facility and research centers.
We provide a wide range of programs, from a complete turnkey solution that supports the wafer fab’s ion implant performance, to economical service plans for those who require less support. These programs are customized to specific customer requirements, provide dedicated labor to maintain and troubleshoot the ion implanter, and make available on-call 24/7 service for around-the-clock support. Since 1984, we have been developing upgrades for the installed base that extends the life of the capital equipment. These upgrades provide our customers with benefits that are focused around increasing productivity and reducing cost-of-ownership. Specifically, the benefits are realized as enhancements to throughput, yield, uptime, maintenance and ergonomic improvements.
For parts management, we have approximately 30 parts banks strategically placed around the world that support more than 200 customer fabs. The use of a global enterprise resource planning system provides us with a distribution structure that efficiently manages inventory, delivery and logistics services. We also offer a comprehensive consumable and non-consumable parts program that can be tailored to individual fab needs to minimize our customers’ cost of ownership from the ordering of individual piece parts over our eCommerce site, vShop, to complete stocking and inventory management programs like Fab Specific Parts Programs.
Through VEDoc™, an electronic documentation system, customers can easily access information about their Varian ion implanters. All assembly drawings, schematics, parts lists, maintenance and operation manuals, and video-illustrated maintenance procedures are available in a CD-ROM format.
5
Table of Contents
Our commitment to customer service also includes extensive and comprehensive customer training programs. We offer a full range of technical training, from the basic operation and maintenance of the toolset to electronic troubleshooting and alignments. Training is available for all ion implanter products manufactured at our facility (medium current, high current, high energy and PLAD tools), with specialized courses available in process applications.
Over the years we have come to recognize the importance and value of customer support and service. We believe that there is a direct correlation between the quality of the support and service we offer and growth in our tool sales. We believe that growth in our market share and revenue over the last several years was partly attributable to a company-wide commitment to service and support. For 12 of the last 13 years we have won the VLSI Research award for Customer Satisfaction in large Semiconductor Capital Equipment, which we believe validates the success of our commitment. We are focused on improving our model of customer support and service. In the past, we were tuned to a model that fixed broken equipment and tried to reduce equipment downtime. Now we utilize a more progressive value-oriented model, where through product upgrades and high value service offerings that enhance our customers’ device performance and yield, we bring enabling value into the fab.
Marketing and Sales
We market, sell, install and service ion implantation systems directly to semiconductor industry manufacturers and have sold ion implantation products to most of the 20 largest semiconductor manufacturers in the world. Our sales objective is to work closely with customers to secure purchases of multiple systems as customers expand capacity, update existing facilities, introduce new manufacturing processes or build new wafer manufacturing facilities. We seek to build customer loyalty and to achieve a high level of repeat business by offering highly reliable products that give our customers a competitive edge, comprehensive field support and responsive parts replacement and service programs.
We have historically sold at least half of our systems in any particular period to a relatively small number of customers, some of which include Chartered Semiconductor Manufacturing Ltd., or Chartered, Elpida Memory Inc., or Elpida, Hynix Semiconductor Inc., or Hynix, Hynix-Numonyx Semiconductor Ltd., or Hynix-Numonyx, IM Flash Technologies LLC., or IM Flash, Inotera Memories Inc., or Inotera, Intel Corp., or Intel, International Business Machines Corp., or IBM, Micron Technology Inc., or Micron, Nanya Technology Corporation, or Nanya, Samsung Electronics Company Ltd., or Samsung, Taiwan Semiconductor Manufacturing Corp. Ltd., or tsmc, Sony Corporation, or Sony, and United Microelectronics Corp., or UMC,. Some of these customers have individually accounted for more than 10% of our total revenue in some periods. We expect that sales of our products to relatively few customers will continue to account for a high percentage of our revenue in the foreseeable future.
Revenue from our ten largest customers in fiscal years 2009, 2008 and 2007 accounted for approximately 73%, 74% and 72% of total revenue, respectively. In fiscal year 2009, revenue from Intel and tsmc accounted for 21% and 16%, respectively, of our total revenue. In fiscal year 2008, revenue from Samsung and Intel accounted for 16% and 13%, respectively of our total revenue. In fiscal year 2007, revenue from Samsung accounted for 17% of our total revenue.
None of our customers have entered into a long-term agreement requiring them to purchase our products. Although our largest customers have varied from year to year, the loss of a significant customer or a reduction in orders from any significant customer, including reductions due to market, economic or competitive conditions in the semiconductor industry or in the industries that manufacture products utilizing integrated circuits, could adversely affect our business, financial condition and results of operations. In addition, sales of our systems depend, significantly in part, upon the decision of a prospective customer to increase manufacturing capacity in an existing fab facility, to introduce a new manufacturing process or to transfer a manufacturing process to a new fab facility, all of which typically involve a significant capital commitment. Due to these and other factors, our products typically have a lengthy sales cycle during which we may expend substantial funds and management effort.
6
Table of Contents
Our ability to respond with prompt and effective field support is critical to our sales efforts. Due to substantial operational and financial commitments, customers who purchase ion implantation systems require assurance that the manufacturer can provide the necessary installation and operational support. Our strategy of supporting our installed base through our customer support and research and development groups has served to encourage the use of our systems in production applications and has accelerated penetration of certain key accounts. We believe that our marketing efforts are enhanced by the technical expertise of our research, development and engineering personnel, who provide customer process support and participate in a number of industry forums.
We market, sell, distribute and service our products directly. We have five sales and service offices located in the U.S., five in Europe and 23 in Asia Pacific for a total of 33 worldwide. Our sales, marketing and service engineers are linked through our information technology systems, allowing us to review bookings and sales forecasts globally against detailed account management plans.
International sales accounted for 72% of our total revenue in fiscal year 2009. In each of fiscal years 2008 and 2007, international sales accounted for 78% of our total revenues, respectively. More specifically, sales to Asia Pacific have accounted for 63%, 70% and 71% of total revenues in fiscal years 2009, 2008 and 2007, respectively. Refer to “Note 26. Operating Segments and Geographic Information” for additional information on the geographic distribution of revenues and long-lived assets.
Our business is generally not seasonal in nature, but it is cyclical based on the capital equipment investment expenditures of major semiconductor manufacturers. These expenditure patterns are based on many factors, including anticipated market demand for integrated circuits, the development of new technologies and global economic conditions.
Backlog
We had backlog of $117.8 million and $134.5 million as of fiscal year end 2009 and 2008, respectively. We include in our backlog only those orders for which we have accepted purchase orders and assigned system shipment dates within the following twelve months. Orders are typically subject to cancellation or rescheduling by customers. Due to possible changes in system delivery schedules, cancellation of orders and delays in systems shipments, our backlog at any particular date is not necessarily an accurate predictor of revenue for any succeeding period.
Manufacturing
We manufacture our products at our facility in Gloucester, Massachusetts. We benefit from the use of advanced manufacturing methods and technologies, including lean manufacturing and demand flow technology.
We purchase materials from multiple suppliers worldwide. We closely monitor overall demand and supply processes worldwide to ensure continuous availability. Additionally, long-lead agreements with suppliers are employed to provide a strategic safety stock at supplier locations.
We concentrate on product design characterization, high-level assembly and tests to reduce cycle time and improve our responsiveness in an inherently cyclical capital equipment market. We believe that outsourcing non-core competency assemblies enables us to minimize our fixed costs and capital expenditures, while also providing the flexibility to increase or decrease production capacity. We purchase materials and components that are either standard products or built to our specifications. This strategy also allows us to focus on product differentiation through system design and quality control. Our manufactured subsystems incorporate advanced technologies in robotics, vacuum and microcomputers. We work closely with our suppliers to achieve mutual cost reductions through joint design efforts. We manufacture and test selected components and systems in clean-room environments that are similar to the clean-rooms used by semiconductor manufacturers for wafer fabrication. This procedure is intended to reduce installation and production qualification times and the amount of particulates and other contaminants in the assembled system, which in turn improves yield and reduces downtime for the customer.
7
Table of Contents
Our quality efforts begin with product development. We use three dimensional computer-aided design, finite element analysis and other computer-based modeling methods to engineer and validate new designs. Product design is tested throughout all stages of development and validated through use of a “phase-gate” product introduction process before the first production system is built. Concurrent engineering programs coupled with product transition strategies integrate new designs into manufacturing quickly and successfully.
Competition
The semiconductor capital equipment market is highly competitive and is characterized by a small number of large companies. The larger companies include Applied Materials Inc., ASML Holding N.V., Tokyo Electron Limited, KLA-Tencor Corporation, or KLA-Tencor, Lam Research Corporation, Nikon Corporation, Dainippon Screen Mfg. co., Ltd., Hitachi High Technologies Corporation, Novellus Systems, Inc., and Canon Inc. We face significant competition in the ion implantation market sector. Within ion implant, multiple implant suppliers participate in one or more implant sectors. Generally, for each system selection, we compete with one or more major competitors. As reported by Gartner Dataquest for calendar year 2008, our revenue market share for ion implantation equipment was significantly higher than all of our competitors, including, Nissin Electric Company, Ltd., Sumitomo Eaton Nova Corporation, Axcelis Technologies, Inc., or Axcelis, and Ulvac Technologies, Inc. Market share data is also published by VLSI Research Inc. The VLSI published results were similar to the Gartner Dataquest report.
There are significant competitive factors in the ion implantation market that affect a company’s ability to succeed. Primary factors include the ability to provide highly productive, technically enabling solutions, the quality of strategic relationships with customers, the cost of ownership of the equipment, performance reliability of the equipment, the quality and cost of customer support, speed and cost-effectiveness of distribution and financial viability of the supplier. Secondary factors include, size of manufacturer, installed customer base and breadth of product line. Due to the constant innovation that has characterized semiconductor manufacturers, it is possible that the application needs and manufacturing technologies used by customers may change, significantly disrupting historical trends in the market. We believe we compete favorably in the ion implant business. To remain competitive, we recognize we may require significant financial resources in order to offer a broad range of products, to maintain customer service and support centers worldwide and to invest in product and process research and development.
Research, Development and Engineering
The semiconductor manufacturing industry is subject to rapid technological change requiring new product introductions and enhancements. Our ability to remain competitive in this market will depend in part upon our ability to develop new and enhanced systems and to introduce these systems at competitive prices and on a timely and cost-effective basis. Accordingly, we devote a significant portion of our personnel and financial resources to research, development and engineering programs and seek to maintain close relationships with our customers to remain responsive to their product needs.
Our current research, development and engineering efforts are directed at development of new systems and processes and improving existing system capabilities. We currently focus our research, development and engineering efforts on the enhancement of our VIISta platform. The VIISta platform is designed to cover the complete range of implants required for the next several generations of integrated circuits. The VIISta single wafer platform allows customers to use a single platform for all implant applications including high current, ultra high dose, medium current and high energy. In fiscal year 2009, research, development and engineering investments were made in growth opportunities in implant and materials modification.
Our expenditures for research, development and engineering during fiscal years 2009, 2008 and 2007 were $80.1 million, $111.2 million, and $104.0 million, respectively. We expect in future years that research, development and engineering expenditures will continue to represent a substantial percentage of operating expenses. In
8
Table of Contents
addition to developing new high current, ultra high dose and high energy products, we continue to focus on maintaining our leadership position in the market for medium current, high current and ultra high dose implanters, improving our position in the high energy business and continuing to invest in new and next generation products in both implant and materials modification.
Patent and Other Proprietary Rights
We pursue a policy of seeking patent, copyright, trademark and trade secret protection in the U.S. and other countries for developments, improvements and inventions originating within our organization that are incorporated in our products or that fall within our fields of interest. As of November 16, 2009, we owned approximately 193 patents in the U.S., 142 patents in other countries, and had 778 patent applications on file with various patent agencies worldwide. We intend to file additional patent applications as appropriate.
We rely on a combination of patent, copyright, trademark, trade secret and other laws, and contractual restrictions on disclosure, copying and transferring title to protect our rights. We have trademarks, both registered and unregistered, that are maintained and enforced to provide customer recognition for our products in the marketplace. We also have agreements with third parties that provide for licensing of patented or proprietary technology. These agreements include royalty-bearing licenses and technology cross-licenses. The termination of certain of such licenses could have a material adverse effect on our business.
Our competitors, like companies in many high-technology businesses, routinely review the products of others for possible conflict with their own patent rights. There has also been substantial litigation regarding patent and other intellectual property rights in semiconductor-related industries. Varian Semiconductor, our customers or suppliers could be subject to additional claims of patent infringement, and any such claim could require that we pay substantial damages or remove certain features from our products or both.
Pursuant to the dispute resolution provisions of an Agreement dated January 1, 1992, or the Agreement, between us and Applied Materials, in September 2002 we filed an arbitration demand with the American Arbitration Association asserting that Applied Materials breached the Agreement by failing to pay royalties on products we believed were covered by the Agreement’s patent license to Applied Materials. In our arbitration demand, we sought to recover back royalties, interest and attorneys’ fees. On May 2, 2003, the arbitration panel issued its decision that certain of Applied Materials’ products were subject to royalty obligations under the Agreement, and on September 1, 2004, the arbitration panel ruled that the patents at issue in the arbitration were valid and enforceable. Applied Materials made an initial payment of $22.0 million for back royalties and interest on October 4, 2004 and a final payment of $2.6 million for back interest and royalties on November 8, 2004. Applied Materials also was required to pay quarterly unit-based royalty payments to us on sales of certain products found to be within the scope of the Agreement through expiration of the Agreement on March 20, 2007.
In fiscal years 2009 and 2008, we recorded less than $0.1 million in royalty and license revenues, respectively, compared to $7.5 million in fiscal year 2007. The last of the principal patents covered by these licenses expired on March 20, 2007.
Environmental Matters
For a discussion of environmental matters, see “Risk Factors,” in Item 1A and “Note 23. Commitments, Contingencies and Guarantees” in Item 15.
Company History
On April 2, 1999, Varian Semiconductor was spun-off from Varian Associates, Inc., or VAI. Our business was operated as the Semiconductor Equipment Business, or SEB, of VAI. VAI contributed the SEB to us, then distributed to the holders of record of VAI common stock, one share of common stock of Varian Semiconductor for each share of VAI common stock owned.
9
Table of Contents
Our role in the semiconductor manufacturing market can be traced to VAI’s pioneering work in ultra-high vacuum technology. In the 1960’s, this technology was applied to many physics and space research projects requiring ultra-high vacuum environments. This technology proved critical in the semiconductor manufacturing process. SEB was successful in developing methods for controlling electron beams and ions in ultra-high vacuum environments and in depositing materials onto silicon wafers to create switching devices.
SEB entered the ion implantation business in fiscal year 1975 through the acquisition of Extrion Corporation in Gloucester, Massachusetts. Since then, we have developed a complete line of medium and high current ion implanters, added the high energy product line in fiscal year 1998 through the acquisition of Genus, Inc., and added the ultra high dose product in early 2007. These systems introduce precise quantities of dopant materials into silicon wafers, creating desired electrical characteristics.
Employees
As of November 16, 2009, we had 1,243 full-time employees worldwide—890 in North America, 293 in Asia Pacific and 60 in Europe. None of our employees based in the U.S. are subject to collective bargaining agreements and we have never experienced a work stoppage, slowdown or strike. None of our employees is represented by a labor union and we consider our employee relations to be good.
Executive Officers of the Registrant
Our current executive officers are listed below. Executive officers are elected on an annual basis and serve at the discretion of the Board of Directors.
| Name and Title |
Age | Business Experience | ||
| Gary E. Dickerson Chief Executive Officer |
52 | Mr. Dickerson has served as Varian Semiconductor’s Chief Executive Officer and a Director of Varian Semiconductor since October 2004. Prior to joining Varian Semiconductor, Mr. Dickerson was President and Chief Operating Officer of KLA-Tencor from July 2002 to April 2004. From July 1999 to June 2002, he served as Chief Operating Officer of KLA-Tencor. Previously at KLA-Tencor, Mr. Dickerson was the Executive Vice President of the Customer Group from July 1997 to June 1999, Group Vice President for the Wafer Inspection Group from January 1996 to June 1997, and General Manager of the Wisard Division from July 1994 to December 1995. | ||
| Robert J. Halliday Executive Vice President, Chief Financial Officer and Treasurer |
55 | Mr. Halliday has served as Varian Semiconductor’s Chief Financial Officer since March 2001 and Executive Vice President since October 2004. Mr. Halliday served as Varian Semiconductor’s Treasurer from November 2002 to October 2006 and from February 2009 to present. Prior to joining Varian Semiconductor, Mr. Halliday was Vice President and Chief Financial Officer of Unica Corporation, a software company. Previously, Mr. Halliday was at Ionics, Inc., a manufacturer of water treatment capital equipment. At Ionics, Inc., he was Chief Operating Officer in 2000; Vice President of the Consumer Water Group from 1996 to 2000; and Chief Financial Officer from 1990 to 2000. Mr. Halliday has been a director of Zoll Medical Corporation since July 2003. | ||
10
Table of Contents
| Name and Title |
Age | Business Experience | ||
| Robert J. Perlmutter, Ph.D. Executive Vice President, Implant Business Units |
52 | Dr. Perlmutter has served as Varian Semiconductor’s Executive Vice President of Implant Business Units since October 2006. Prior to joining Varian Semiconductor, Dr. Perlmutter was a Group Vice President of KLA-Tencor from July 2006 to October 2006. From October 2001 to June 2006, he served as Vice President and General Manager of KLA-Tencor’s WIN Division - responsible for the brightfield and darkfield patterned wafer inspection product lines. Previously at KLA-Tencor, Dr. Perlmutter was Vice President and General Manager of the Surfscan Division from October 1999 to October 2001. From September 1995 to September 1999, Dr. Perlmutter served as a Sr. Director and then, Vice President of Engineering for KLA-Tencor’s Reticle and Photomask Inspection Division. | ||
| Yong-Kil Kim, Ph.D. Executive Vice President, General Manager, Asia Pacific Operations, President of Varian Korea Ltd. |
52 | Dr. Kim has served as Varian Semiconductor’s Executive Vice President since October 2004. He has served as Varian Semiconductor’s Vice President and General Manager of its Asia Pacific Operations since May 2000 and President of Varian Korea, Limited since April 1999. From April 1997 to March 1999, he served as Executive Vice President of Varian Korea, Limited. From July 1994 to March 1997, he was Director of Sales and Marketing for the Asia Pacific Region. Dr. Kim joined Varian Associates, Inc. in August 1989 and held various managerial positions in Applications, Marketing and Sales. Previously, Dr. Kim worked for IBM’s T.J. Watson Research Center in Yorktown Heights, New York, from July 1988 to August 1989, and earlier at Massachusetts Institute of Technology in Cambridge, Massachusetts from 1983 to July 1988. | ||
| Gary J. Rosen, Ph.D. Vice President, Engineering |
44 | Dr. Rosen has served as Varian Semiconductor’s Vice President of Engineering since June 2005. Prior to joining Varian Semiconductor, Dr. Rosen was a Sr. Director and Deputy GM of Applied Material’s Common Platform Products Group from October 2001 to May 2005. From October 1994 to September 2001 he served in a variety of technical and management roles at Eaton Semiconductor Equipment Operations (now Axcelis) including Implanter Development Manager and High Current Engineering Manager. | ||
11
Table of Contents
| Item 1A. | Risk Factors. |
The continued deterioration in the global economy and credit markets may continue to adversely affect our future results of operations.
Our operations may continue to be adversely affected by the deterioration in the global economy causing our customers to delay or cease spending on our products. The recent tightening of the credit markets may continue to negatively impact our operations by affecting the solvency of our customers and key suppliers and the ability of our customers to obtain credit to finance purchases of our products. If the instability in the global economy and credit markets continues, our financial condition and results of operations could continue to be adversely impacted.
We face intense competition in the semiconductor equipment industry.
Significant competitive factors in semiconductor equipment manufacturing include the strength of customer relationships, pricing, technological performance and timing, distribution capabilities and financial viability. We believe that in order to remain competitive in this industry, we will need to devote significant financial resources to research and development, to develop and market a broad range of products and maintain and enhance customer service and support centers worldwide. The semiconductor equipment industry is increasingly dominated by large manufacturers who have resources to support customers worldwide, and some of our competitors have substantially greater financial resources and more extensive engineering, manufacturing, marketing, service and support than we do. With fewer resources, we may not be able to match the product offerings or customer service and technical support offered by our competitors. In addition, there are several smaller companies that provide innovative technology that may have performance advantages over our systems. If these manufacturers continue to improve their product performance and pricing, enter into strategic relationships, expand their current targeted geographic territory or consolidate with large equipment manufacturers, sales of our products may be adversely affected.
We derive a substantial portion of our revenues from a small number of customers, and our business may be harmed by the loss of any one significant customer.
From time to time within the same accounting period, we have sold significant percentages of our systems to our major customers, some of which include Chartered, Elpida, Fujitsu, Hynix, Hynix-Numonyx, IBM, IM Flash, Inotera, Intel, Micron, Nanya, Samsung, Sony, tsmc and UMC. During some quarters, some of these customers have individually accounted for more than 10% of our total revenue. We expect that sales of our products to relatively few customers will continue to account for a high percentage of our revenue in the foreseeable future. Furthermore, we may have difficulty attracting additional large customers because our sales depend, in large part, upon the decision of a prospective customer to increase manufacturing capacity in an existing fabrication facility or to transfer a manufacturing process to a new fabrication facility, both of which typically involve a significant capital commitment. Once a semiconductor manufacturer has selected a particular supplier’s capital equipment, the manufacturer generally relies upon that equipment for the specific production line application. Consequently, we may experience difficulty in selling to a prospective customer if that customer initially selects a competitor’s capital equipment.
Our quarterly results of operations are likely to fluctuate, and as a result, we may fail to meet the expectations of our investors and securities analysts, which may cause the price of our common stock to decline.
We have experienced and expect to continue to experience significant fluctuations in our quarterly financial results. From time to time, customers may accelerate, postpone or cancel shipments, or production difficulties may delay shipments. A cancellation, delay in shipment or delay in customer acceptance of the product upon installation in any quarter may cause revenue in such quarter to fall significantly below expectations, which could cause the market price of our common stock to decline. Our financial results also fluctuate based on gross
12
Table of Contents
profit realized on sales. Gross profit as a percentage of revenue may vary based on a variety of factors, including the mix and average selling prices of products sold, costs to manufacture and customize systems and inventory management. In addition, a number of other factors may impact our quarterly financial results, including, but not limited to the following:
| • | changing global economic conditions and worldwide political instability; |
| • | general conditions in the semiconductor equipment industry; |
| • | the extent that customers use our products and services in their business; |
| • | unexpected procurement or manufacturing difficulties; |
| • | pricing of key components; |
| • | fluctuations in foreign exchange rates; |
| • | a technical change that we are unable to address with our products; |
| • | a failure to achieve continued market acceptance of our key products; |
| • | ability to develop, introduce and market new, enhanced and competitive products in a timely manner; |
| • | introduction of new products by our competitors; |
| • | strategic technology investment decisions; |
| • | legal or technical challenges to our products and technology; |
| • | adverse weather conditions at our manufacturing facilities or customers’ facilities; |
| • | changes in the effective tax rate; and |
| • | new or modified accounting regulations. |
Our operating expenses also fluctuate on a quarterly basis. A high percentage of our expenses are relatively fixed, thus, even a minimal number of cancelled, postponed or delayed shipments could have a significant adverse impact on financial results. In addition, we may continue to heavily invest in areas such as research and development, despite lower revenue levels. As such, financial results could be adversely impacted.
It is difficult for us to predict the quarter in which we will be recognizing revenue from large product orders.
We customarily sell a relatively small number of systems within any period. Consequently, our revenue and financial results could be negatively impacted for a particular quarter if anticipated orders from even a few customers are not received in time to permit shipment and/or there are delays in customer acceptance of the product upon installation or future obligations included in the contract do not permit revenue to be recognized on current tool shipments under generally accepted accounting principles, or GAAP. Generally, we recognize all or a portion of the revenue from a product upon shipment provided title and risk of loss has passed to the customer, evidence of an arrangement exists, fees are contractually fixed or determinable, collectibility is reasonably assured through historical collection results and regular credit evaluations, and there are no uncertainties regarding customer acceptance. Please refer to the full revenue recognition policy in Item 7. Management’s Discussion and Analysis of Financial Condition and Results of Operations in the Critical Accounting Policies and Significant Judgments and Accounting Estimates section of this Annual Report on Form 10-K. As a result, it is often difficult to determine the timing of product revenue recognition. In addition, our product order backlog at the beginning of each quarter may not include all systems needed to achieve expected revenues for that quarter. Because we may build systems according to forecast, the absence of a significant backlog for an extended period of time could adversely affect financial results.
13
Table of Contents
Our future business depends, in part, on our ability to successfully introduce and manage the transition to new products, and we may not succeed in accomplishing these goals.
We believe that our future success will depend on our ability to develop, manufacture and successfully introduce new systems and product lines with improved capabilities and to continue enhancing existing products; in particular, products that respond to the trend toward single wafer processing and 300mm wafer processing at more advanced nodes. We derive virtually all of our revenue from sales and servicing of systems and related products and services. We must accurately forecast the demand for new products while managing the transition from older products. In addition, we may be unable to complete the development or meet the technical specifications of new systems or enhancements or to manufacture and ship these systems or enhancements in volume and on time, which may harm our reputation and business. If any of our new products have reliability or quality problems, we may incur additional warranty and service expenses, experience a decline in product orders or incur higher manufacturing costs to correct such problems, all of which could adversely affect financial results.
We are subject to the risks of operating internationally and we derive a substantial portion of our revenues from outside the U.S.
International revenues account for a substantial portion of our revenue. Because we rely on sales to customers in Asia Pacific for a significant portion of our revenue, our business is very likely to be adversely impacted by economic downturns and instability in that region. Our business in Asia Pacific is affected by demand in each country. In addition, international sales are subject to risks, including, but not limited to:
| • | changes in legal and regulatory requirements; |
| • | political and economic instability and acts of terrorism; |
| • | difficulties in accounts receivable collection; |
| • | natural disasters or public health crises; |
| • | difficulties in staffing for cultural diversity and managing international operations; |
| • | foreign trade disputes; and |
| • | fluctuations in foreign exchange rates. |
If we are unable to protect our proprietary rights adequately, we may lose our ability to compete effectively in the semiconductor equipment industry.
We rely on obtaining and maintaining patent, copyright and trade secret protection for significant new technologies, products and processes and obtaining key licenses because of the length of time and expense associated with bringing new products through the development process to market. We intend to continue to file applications as appropriate for patents covering new products and manufacturing processes. However, we cannot provide assurance of the following:
| • | that patents will be issued from any pending or future patent applications owned by, or licensed to, us; |
| • | that the claims allowed under any issued patents will be sufficiently broad to protect our technology position against competitors; |
| • | that any issued patents owned by or licensed to us will not be challenged, invalidated or circumvented; and |
| • | that the rights granted under our patents will provide us with competitive advantages. |
We also have agreements with third parties for licensing of patented or proprietary technology. These agreements include royalty-bearing licenses and technology cross-licenses.
14
Table of Contents
In addition, we maintain and enforce our trademarks to increase customer recognition of our products. If our trademarks are used by unauthorized third parties, our business may be harmed. We also rely on contractual restrictions on disclosure, copying and transferring title, including confidentiality agreements with vendors, strategic partners, co-developers, employees, consultants and other third parties to protect our proprietary rights. If these contractual agreements are breached, we may not have adequate remedies for any such breaches. We also cannot provide assurance that our trade secrets will not otherwise become known to or be independently developed by others.
Patent claims may be expensive to pursue, defend or settle and may substantially divert our resources and the attention of management.
We could incur substantial costs and diversion of management resources in defending patent suits brought against us or in asserting our patent rights against others. If the outcome of any such litigation is unfavorable to us, our business may be harmed. We may not be aware of pending or issued patents held by third parties that relate to our products or technologies. In the event that a claim is asserted against us, we may need to acquire a license to or contest the validity of a competitor’s patent. We cannot be certain that we could acquire such a license on commercially acceptable terms, if at all, or that it would prevail in such a proceeding. From time to time, we have received notices from and have issued notices to such third parties alleging infringement of patent and other intellectual property rights relating to our products. If we are subject to future claims of patent infringement, we may be required to make substantial settlement or damage payments and may have to devote substantial resources to reengineering our products.
We depend on limited groups of suppliers or single source suppliers, the loss of which could impair our ability to manufacture products and systems.
We obtain some of the components and subassemblies included in our products from a limited group of suppliers, or in some cases, a single source supplier. The loss of any supplier (or the temporary inability of any supplier to meet our production requirements, including any single source supplier) would require obtaining one or more replacement suppliers and may also require devoting significant resources to product development to incorporate new parts from other sources into our products. The need to change suppliers or to alternate between suppliers might cause delays in delivery or significantly increase our costs. Although we have insurance to protect against loss due to business interruption from some sources as necessary, we cannot provide assurance that such coverage will be adequate or that it will remain available on commercially acceptable terms. Although we seek to reduce our dependence on these limited source suppliers, disruption or loss of these sources could negatively impact our business and damage customer relationships.
Our outsource providers may fail to perform as we expect.
Outsource providers have an increasing role in our manufacturing operations, research, development and engineering initiatives and in transactional and administrative functions. Although we aim at selecting reputable providers and securing their performance on terms documented in written contracts, it is possible that one or more of these providers could fail to perform as we expect and such failure could have an adverse impact on our business. In addition, the expansive role of outsource providers has required and will continue to require us to implement changes to our existing operations and to adopt new procedures to deal with and manage the performance of these outsource providers. Any delay or failure in the implementation of our operational changes and new procedures could adversely affect our customer relationships and/or have a negative effect on our operating results.
15
Table of Contents
Our indemnification obligations under the Distribution Related Agreements could be substantial, and we may not be fully indemnified in accordance with the Distribution Related Agreements for the expenses we incur.
Under the terms of the Distribution Related Agreements, each of Varian Medical Systems, Inc., or VMS (formerly VAI), Varian, Inc., or VI and Varian Semiconductor has agreed to indemnify the other parties, and certain related persons, from and after the spin-off with respect to certain indebtedness, liabilities and obligations, which could be significant. The availability of such indemnities will depend upon the future financial strength of the companies. There is a risk that one or more of these companies will not be able to satisfy their indemnification obligations. In addition, the Distribution Related Agreements generally provide that if a court prohibits a company from satisfying its indemnification obligations, then such obligations will be shared equally by the other companies.
Failure to comply with present or future environmental regulations could subject us to penalties and environmental remediation costs.
We are subject to a variety of foreign, federal, state and local laws regulating the discharge of materials into the environment and the protection of the environment. These regulations include discharges into the soil, water and air and the generation, handling, storage and transportation and disposal of waste and hazardous substances. These laws increase the costs and potential liabilities associated with the conduct of our operations.
VAI has been named by the U.S. Environmental Protection Agency and third parties as a potentially responsible party under the Comprehensive Environmental Response Compensation and Liability Act of 1980, as amended, or CERCLA, at eight sites where VAI is alleged to have shipped manufacturing waste for recycling or disposal. VAI is also in various stages of environmental investigation and/or remediation under the direction of, or in consultation with foreign, federal, state and local agencies at certain current or former VAI facilities. The Distribution Related Agreements provide that each of VMS, Varian Semiconductor and VI will indemnify the others for one-third of these environmental investigation and remediation costs, as adjusted for any insurance proceeds and tax benefits expected to be realized upon payment of these costs.
For certain of these sites and facilities, various uncertainties make it difficult to assess the likelihood and scope of further investigation or remediation activities or to estimate the future costs of such activities if undertaken. We have accrued estimated environmental investigation and remediation costs for these sites and facilities. As to other sites and facilities, sufficient knowledge has been gained to be able to reasonably estimate the scope and costs of future environmental activities. As such, we have sufficient accruals to cover our portion of these costs.
Accrued amounts are only estimates of anticipated future environmental-related costs, and the amounts actually spent may be greater than such estimates. Accordingly, we may need to make additional accruals and subsequent payments to cover our indemnification obligations that would exceed current estimates. In addition, our present and past facilities have been in operation for many years, and over that time in the course of those operations, such facilities have used substances which are or might be considered hazardous. We also may have generated and disposed of wastes which are or might be considered hazardous. Therefore, it is possible that additional environmental issues may arise in the future that we cannot now predict.
Our ability to manage potential growth or decline, integration of potential acquisitions, and potential disposition of product lines and technologies creates risks.
The cyclical nature of the semiconductor industry may cause us to experience rapid growth or decline in demand for products and services. As a result, we may face significant challenges in maintaining adequate financial and business controls, materials management, management processes, information systems and procedures on a timely basis, training, managing and appropriately sizing the work force. There can be no assurance that we will be able to perform such actions successfully.
16
Table of Contents
An important element of our management strategy is to review acquisition prospects that would complement existing products, augment market coverage and distribution ability, or enhance technological capabilities. In the future, we may make acquisitions of complementary companies, products or technologies, or may reduce or dispose of certain product lines or technologies that no longer fit our long-term strategies. Managing an acquired business, disposing of product technologies or reducing personnel entails numerous operational and financial risks, including difficulties in assimilating acquired operations and new personnel or separating existing business or product groups, diversion of management’s attention to other business concerns, amortization of acquired intangible assets, the incurrence of debt and contingent liabilities and potential loss of key employees or customers of acquired or disposed operations, among others. Our success will depend, to a significant extent, on the ability of our executive officers and other members of our senior management to identify and respond to these challenges effectively. In addition, any acquisitions could result in dilutive issuances of equity securities. There can be no assurance that we will be able to achieve and manage successfully any such growth, decline, integration of potential acquisitions, disposition of product lines or technologies, or reduction in personnel, or that management, personnel or systems will be adequate to support continued operations. Any such inabilities or inadequacies may have a material adverse effect on our business, operating results, financial condition, cash flows and/or the price of our common stock.
We manufacture our products at one primary manufacturing facility and are thus subject to risk of disruption.
We have one primary manufacturing facility, located in Gloucester, Massachusetts, and our operations are subject to disruption for a variety of reasons, including, but not limited to natural disasters, work stoppages, operational facility constraints and terrorism. Such disruption may cause delays in shipments of products to our customers and may result in cancellation of orders or loss of customers and could seriously harm our business.
If we lose key employees or are unable to attract and retain key employees, we may be unable to pursue business opportunities.
Our future success depends to a significant extent on the continued service of key managerial, technical and engineering personnel. Competition for such personnel is intense, particularly in the labor markets around our facilities in Massachusetts. The available pool of qualified candidates is limited and we may not be able to retain our key personnel or to attract, train, assimilate or retain other highly qualified engineers and technical and managerial personnel in the future. The loss of these persons or our inability to hire, train or retrain qualified personnel could harm our business and results of operations.
We have anti-takeover defenses that could delay or prevent an acquisition and could adversely affect the price of our common stock.
Provisions of our certificate of incorporation and by-laws and of Delaware law could delay, defer or prevent an acquisition or change in control of Varian Semiconductor or otherwise adversely affect the price of our common stock. For example, our Board of Directors is classified into three classes, and stockholders do not have the right to call special meetings of stockholders. Our certificate of incorporation also permits our Board of Directors to issue shares of preferred stock without stockholder approval. In addition to delaying or preventing an acquisition, the issuance of a substantial number of preferred shares could adversely affect the price of the common stock.
We do not anticipate paying dividends on our common stock in the future.
We have not paid and do not anticipate paying dividends on our common stock. Our Board of Directors has discretion to make decisions to pay dividends to common stockholders in the future. The decision will depend on a number of factors, including results of operations, financial conditions and contractual restrictions that the Board, in its opinion, deems relevant.
17
Table of Contents
Our financial results may be adversely impacted by higher than expected tax rates or exposure to additional income tax liabilities.
As a global company, our effective tax rate is highly dependent upon the geographic composition of worldwide earnings and tax regulations governing each region. We are subject to income taxes in both the U.S. and various foreign jurisdictions and significant judgment is required to determine worldwide tax liabilities. Our effective tax rate could be adversely affected by changes in the distribution of earnings between countries with differing statutory tax rates, in the valuation of deferred tax assets, in tax laws or by material audit assessments, which could affect profitability. In particular, due to the global business realignment, the distribution of worldwide earnings has changed and has caused the tax rate to become more sensitive to the geographic distribution of profits. We could face significant challenges regarding the geographic composition of these earnings from one or more jurisdictions upon audit. Our effective tax rate has benefited from the research and development (“R & D”) tax credit which will expire on December 31, 2009. If the R & D credit is not extended, our tax liability may increase. The carrying value of deferred tax assets, which are predominantly in the U.S., is dependent on our ability to generate future taxable income in the U.S. or carry-back losses to prior profitable periods. Our tax returns are currently under audit by the Internal Revenue Service (IRS) and could be audited by other tax authorities. The IRS and other tax authorities have increasingly focused attention on intercompany transfer pricing with respect to sales of products, services, and the use of intangible assets. We could face significant future challenges on these transfer pricing issues in one or more jurisdictions. We regularly assess the likelihood of favorable or unfavorable outcomes resulting from these examinations to determine the adequacy of our provision for income taxes. Although we believe that our tax estimates are reasonable, there can be no assurance that any final determination will not be materially different from the treatment reflected in our historical income tax provisions and accruals.
The U.S. Government has recently announced tax proposals which, if enacted, would cause us to re-evaluate the structure of our international operations. We may incur additional costs to modify our international structure and be required to pay additional taxes if all or any of the proposals become law. Until further details on the proposals are provided in actual legislation, it is not possible to estimate the potential impact of these proposals on the results of our operations.
Strategic alliances may have negative effects on our business.
Increasingly, semiconductor companies are entering into strategic alliances with one another to expedite the development of processes and other manufacturing technologies. Often, one of the outcomes of such an alliance is the definition of a particular tool set for a certain function or a series of process steps that use a specific set of manufacturing equipment. While this could work to our advantage if our equipment becomes the basis for the function or process, it could work to our disadvantage if a competitor’s tools or equipment become the standard equipment for such function or process. In the latter case, even if our equipment was previously used by a customer, that equipment may be displaced in current and future applications by the tools standardized by an alliance of companies.
Similarly, our customers may team with, or follow the lead of, educational or research institutions that establish processes for accomplishing various tasks or manufacturing steps. If those institutions utilize a competitor’s equipment when they establish those processes, it is likely that customers will use the same equipment in setting up their own manufacturing lines. These actions could adversely impact our market share and subsequent business.
18
Table of Contents
The semiconductor equipment industry is highly cyclical. The purchasing decisions of our customers are highly dependent on the economies of both the local markets in which they are located and the semiconductor industry worldwide. If we fail to respond to industry cycles, our business could be seriously harmed.
The timing, length and severity of the up-and-down cycles in the semiconductor equipment industry are difficult to predict. The cyclical nature of the industry in which we operate is largely a function of our customers’ capital spending patterns and need for expanded manufacturing capacity, which in turn are affected by factors such as capacity utilization, consumer demand for products, inventory levels and our customers’ access to capital. This cyclicality affects our ability to accurately predict future revenue, and in some cases, future expense levels. In the current environment, our ability to accurately predict our future operating results is particularly limited. During down cycles in our industry, the financial results of our customers may be negatively impacted, which could result not only in a decrease in, or cancellation or delay of, orders (which are generally subject to cancellation or delay by the customer with limited or no penalty) but also a weakening of their financial condition that could impair their ability to pay for our products or our ability to recognize revenue from certain customers. When cyclical fluctuations result in lower than expected revenue levels, operating results may be adversely affected and cost reduction measures may be necessary in order for us to remain competitive and financially sound. During periods of declining revenues, as was experienced during fiscal year 2009, we must be in a position to adjust our cost and expense structure to prevailing market conditions and to continue to motivate and retain our key employees. If we fail to respond, or if our attempts to respond (such as the global workforce reductions and cost-reduction efforts that we announced in fiscal years 2008 and 2009) fail to accomplish our intended results, then our business could be seriously harmed. Furthermore, any workforce reductions and cost-reduction actions that we adopt in response to down cycles may result in additional restructuring charges, disruptions in our operations and loss of key personnel. In addition, during periods of rapid growth, we must be able to increase manufacturing capacity and personnel to meet customer demand. We can provide no assurance that these objectives can be met in a timely manner in response to industry cycles. Each of these factors could adversely impact our operating results and financial condition.
In addition, the semiconductor equipment industry is constantly developing and changing over time. These changes currently, or in the future may, include the increasing cost of building and operating fabrication facilities and the impact of such increases on our customers’ investment decisions; the variability of future growth rates in the semiconductor industry; the ever-increasing cost and complexity involved in the adoption by our customers of technology advances and the potential impact that may have on their rate of adoption; pricing trends in the end-markets for consumer electronics and other products, which places a growing emphasis on our customers’ cost of ownership; overall changes in capital spending patterns by our customers; and demand by semiconductor manufacturers for shorter cycle times for developing, manufacturing and installing capital equipment. If we do not successfully manage the risks resulting from any of these or other potential changes in our industry, our business, financial condition and operating results could be adversely impacted.
| Item 2. | Properties. |
Our headquarters and manufacturing facility is located in Gloucester, Massachusetts. In addition, we have five sales and service offices located in the U.S. and 33 located outside of the U.S., including offices in France, Germany, the Netherlands (three), Japan (ten), Korea (four), Taiwan (six), China (four), Switzerland, Singapore and Malaysia (two). These offices and facilities aggregate approximately 647 thousand square feet, of which 206 thousand square feet is leased. Since fiscal year 1994, the manufacturing facilities have been registered to the internationally recognized Quality Management System ISO 9001 standard. ISO 9001:2008 revised certification was obtained in fiscal year 2009. The most recent recertification obtained in August 2009 encompasses design, development, manufacture of ion implanters, including customer training and support.
Our management does not believe there is any material, long-term, excess capacity in our facilities, although utilization is subject to change based on customer demand. Furthermore, our management believes that our facilities and equipment generally are well maintained, in good operating condition, suitable for our purposes, and adequate for our present operations.
19
Table of Contents
The following table reflects our locations by geographic segment:
| Location |
Property Interest |
Approx. Sq. Footage of Floor Space | ||
| North America |
Own | 377,000 | ||
| North America |
Lease | 110,000 | ||
| Korea |
Own | 64,000 | ||
| Korea |
Lease | 5,000 | ||
| Japan |
Lease | 25,000 | ||
| Europe |
Lease | 20,000 | ||
| Taiwan |
Lease | 30,000 | ||
| Other |
Lease | 16,000 | ||
| Total |
647,000 | |||
| Item 3. | Legal Proceedings. |
Our operations are subject to various foreign, federal, state and/or local laws relating to the protection of the environment. These include laws regarding discharges into soil, water and air, and the generation, handling, storage, transportation and disposal of waste and hazardous substances. In addition, several countries are reviewing proposed regulations that would require manufacturers to dispose of their products at the end of a product’s useful life. These laws have the effect of increasing costs and potential liabilities associated with the conduct of certain operations.
We are presently a party to legal disputes. While we believe we have meritorious claims and/or defenses with respect to each dispute, we cannot predict the outcome of each such dispute. Management believes that the ultimate outcome of these disputes, individually and in the aggregate, will not have a material adverse effect on our financial condition or results of operations.
From time to time, we may become involved in a number of legal actions and could incur an uninsured liability in one or more of them. Accordingly, while the ultimate outcome of these legal matters is not determinable, management believes the resolution of these matters will not have a material adverse effect on our financial condition or results of operations.
| Item 4. | Submission of Matters to a Vote of Security Holders. |
No matters were submitted to a vote of our security holders, through solicitation of proxies or otherwise, during the last quarter of fiscal year 2009.
20
Table of Contents
| Item 5. | Market for Registrant’s Common Equity, Related Stockholder Matters and Issuer Purchases of Equity Securities. |
Since April 5, 1999, our common stock has traded on The Nasdaq Global Select Market under the symbol “VSEA.”
The prices per share reflected in the following table represent the high and low closing prices for our common stock on the NASDAQ Global Select Market for the periods indicated.
| Fiscal Year 2009 | Fiscal Year 2008 | |||||||||||
| High | Low | High | Low | |||||||||
| First Quarter |
$ | 22.69 | $ | 14.70 | $ | 55.00 | $ | 33.96 | ||||
| Second Quarter |
$ | 24.49 | $ | 16.06 | $ | 37.64 | $ | 27.34 | ||||
| Third Quarter |
$ | 26.35 | $ | 21.17 | $ | 41.16 | $ | 27.48 | ||||
| Fourth Quarter |
$ | 33.57 | $ | 23.74 | $ | 36.75 | $ | 21.70 | ||||
The reported closing price of our common stock on The Nasdaq Global Select Market on October 2, 2009 was $30.27 per share. The number of stockholders of record on November 16, 2009 was 2,175.
We have never declared or paid cash dividends on our common stock and do not expect to pay any cash dividends on our common stock in the foreseeable future.
In October 2004, our Board of Directors authorized the repurchase, from time to time, of up to $100.0 million of our common stock on the open market. Subsequently, the Board of Directors voted on increases to the amount of funds that may be expended in repurchasing our common stock to a total of $800.0 million. The program does not have a fixed expiration date. During fiscal year 2009, we did not repurchase any shares of our common stock. As of fiscal year end 2009, $85.6 million remained available for repurchase under the existing repurchase authorization. Also, we did not repurchase any shares between October 3, 2009 and November 16, 2009, the latest practicable date prior to the filing date.
See Item 12 of Part III of this Annual Report on Form 10-K for information regarding securities authorized for issuance under our equity compensation plans.
21
Table of Contents
COMPARISON OF FIVE-YEAR CUMULATIVE STOCKHOLDERS’ RETURNS
PERFORMANCE GRAPH FOR VARIAN SEMICONDUCTOR
The comparative stock performance graph below compares the cumulative stockholder return on our common stock from October 1, 2004, through October 2, 2009; with the cumulative total return on (1) the Nasdaq Global Select Market Composite and (2) the S&P North American Technology Semiconductor Index, which is a published industry index. The cumulative total return computations set forth in the performance graph assume the investment of $100 in our common stock and each of the indices from October 1, 2004, to October 2, 2009. The stock price performance shown on the graph and table below is not necessarily indicative of future price performance.
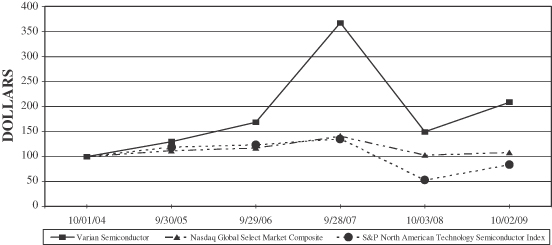
| Cumulative Total Return ($) | ||||||||||||
| ($100 Initial Investment) | ||||||||||||
| 10/1/2004 | 9/30/2005 | 9/29/2006 | 9/28/2007 | 10/3/2008 | 10/2/2009 | |||||||
| Varian Semiconductor Equipment Associates Inc. |
100.00 | 129.22 | 167.89 | 367.25 | 148.90 | 207.71 | ||||||
| Nasdaq Global Select Market Composite |
100.00 | 110.86 | 116.98 | 140.56 | 102.69 | 108.12 | ||||||
| S&P North American Technology Semiconductor Index |
100.00 | 118.43 | 122.65 | 134.90 | 52.81 | 83.68 | ||||||
22
Table of Contents
| Item 6. | Selected Financial Data. |
The information included in the following table reflects selected consolidated summary financial data for each of the last five fiscal years. The selected data has been revised to reflect the adjustments that are disclosed in Note 2 of the consolidated financial statements. This data should be read in conjunction with the consolidated financial statements and notes thereto included in “Item 15-Exhibits and Financial Statement Schedules,” and with “Item 7—Management’s Discussion and Analysis of Financial Condition and Results of Operations” below.
| Fiscal Year | ||||||||||||||||
| 20092 | 20082 | 20071,2 | 20062,3 | 20054 | ||||||||||||
| (Amounts in millions, except per share amounts) | ||||||||||||||||
| Consolidated Statements of Operations Data: |
||||||||||||||||
| Revenue |
$ | 362.1 | $ | 834.1 | $ | 1,054.9 | $ | 730.7 | $ | 600.5 | ||||||
| Gross profit |
$ | 142.7 | $ | 395.8 | $ | 488.9 | $ | 309.5 | $ | 268.7 | ||||||
| (Benefit from) provision for income taxes |
$ | (1.5 | ) | $ | 61.4 | $ | 132.3 | $ | 30.4 | $ | 32.2 | |||||
| Net (loss) income |
$ | (38.0 | ) | $ | 99.5 | $ | 144.4 | $ | 94.9 | $ | 72.1 | |||||
| Weighted average shares outstanding—basic |
72.3 | 73.3 | 80.2 | 84.6 | 82.8 | |||||||||||
| Weighted average shares outstanding—diluted |
72.3 | 74.7 | 82.2 | 85.8 | 84.6 | |||||||||||
| Net (loss) income per share—basic |
$ | (0.53 | ) | $ | 1.36 | $ | 1.80 | $ | 1.12 | $ | 0.87 | |||||
| Net (loss) income per share—diluted |
$ | (0.53 | ) | $ | 1.33 | $ | 1.76 | $ | 1.11 | $ | 0.85 | |||||
| Consolidated Balance Sheet Data: |
||||||||||||||||
| Cash and cash equivalents |
$ | 192.1 | $ | 139.7 | $ | 109.5 | $ | 258.9 | $ | 193.4 | ||||||
| Investments |
$ | 130.5 | $ | 138.5 | $ | 184.5 | $ | 290.6 | $ | 280.6 | ||||||
| Total assets |
$ | 666.2 | $ | 706.8 | $ | 802.9 | $ | 940.0 | $ | 864.2 | ||||||
| Working capital |
$ | 411.0 | $ | 440.4 | $ | 442.9 | $ | 565.8 | $ | 636.4 | ||||||
| Long-term liabilities |
$ | 67.9 | $ | 71.2 | $ | 60.5 | $ | 24.3 | $ | 20.1 | ||||||
| Total liabilities |
$ | 150.6 | $ | 186.6 | $ | 233.1 | $ | 183.4 | $ | 173.7 | ||||||
| Stockholders’ equity |
$ | 515.6 | $ | 520.2 | $ | 569.8 | $ | 756.5 | $ | 690.5 | ||||||
| (1) | Fiscal year 2007 includes a provision for income taxes of 48% due to the global realignment of our business structure. |
| (2) | In fiscal year 2006, we adopted the accounting standard for stock-based compensation, which resulted in $12.9 million net expense or $0.15 per diluted share in fiscal year 2006, $10.0 million net expense or $0.12 per diluted share in fiscal year 2007, $13.6 million net expense or $0.18 per diluted share in fiscal year 2008 and $22.1 million net expense or $0.31 per diluted share in fiscal year 2009. |
| (3) | Fiscal year 2006 includes a $9.0 million discrete income tax benefit and $1.6 million of related interest income, net income of $10.2 million after tax or $0.12 per diluted share in total, related to the completion of a routine tax examination by the U.S. Internal Revenue Service. |
| (4) | Fiscal year 2005 includes non-recurring pre-tax royalty revenue of $18.9 million and interest income of $5.7 million, net income of $17.0 million after tax or $0.20 per diluted share, relating to a settlement of a patent license agreement with Applied Materials. |
23
Table of Contents
QUARTERLY FINANCIAL DATA
(Unaudited)
Selected Quarterly Results of Operations
The following tables set forth unaudited quarterly condensed consolidated statements of operations data for each of the eight fiscal quarters in the period ended October 2, 2009. This data has been revised to reflect the adjustments that are disclosed in Note 2 of the consolidated financial statements. The quarterly data should be read in conjunction with the consolidated financial statements and notes thereto appearing elsewhere in this Annual Report on Form 10-K.
| Fiscal Year 2009 | |||||||||||||||||||
| First Quarter |
Second Quarter |
Third Quarter |
Fourth Quarter |
Total Year |
|||||||||||||||
| (Amounts in millions, except per share amounts) | |||||||||||||||||||
| Revenue |
$ | 107.4 | $ | 63.8 | $ | 73.4 | $ | 117.5 | $ | 362.1 | |||||||||
| Cost of revenue |
67.5 | 42.5 | 45.2 | 64.2 | 219.4 | ||||||||||||||
| Gross profit |
39.9 | 21.3 | 28.2 | 53.3 | 142.7 | ||||||||||||||
| Operating expenses |
55.1 | 45.1 | 42.0 | 43.2 | 185.4 | ||||||||||||||
| Operating (loss) income |
(15.2 | ) | (23.8 | ) | (13.8 | ) | 10.1 | (42.7 | ) | ||||||||||
| Interest and other income, net |
1.6 | 0.3 | 0.8 | 0.5 | 3.2 | ||||||||||||||
| (Loss) income before income taxes |
(13.6 | ) | (23.5 | ) | (13.0 | ) | 10.6 | (39.5 | ) | ||||||||||
| Provision for (benefit from) income taxes |
0.0 | (4.0 | ) | (0.5 | ) | 3.0 | (1.5 | ) | |||||||||||
| Net (loss) income |
$ | (13.6 | ) | $ | (19.5 | ) | $ | (12.5 | ) | $ | 7.6 | $ | (38.0 | ) | |||||
| Weighted average shares outstanding—basic |
71.9 | 72.2 | 72.5 | 72.7 | 72.3 | ||||||||||||||
| Weighted average shares outstanding—diluted |
71.9 | 72.2 | 72.5 | 73.8 | 72.3 | ||||||||||||||
| Net (loss) income per share—basic |
$ | (0.19 | ) | $ | (0.27 | ) | $ | (0.17 | ) | $ | 0.11 | $ | (0.53 | ) | |||||
| Net (loss) income per share—diluted |
$ | (0.19 | ) | $ | (0.27 | ) | $ | (0.17 | ) | $ | 0.10 | $ | (0.53 | ) | |||||
| Fiscal Year 2008 | |||||||||||||||||||
| First Quarter |
Second Quarter |
Third Quarter |
Fourth Quarter |
Total Year |
|||||||||||||||
| (Amounts in millions, except per share amounts) | |||||||||||||||||||
| Revenue |
$ | 254.1 | $ | 255.3 | $ | 182.6 | $ | 142.1 | $ | 834.1 | |||||||||
| Cost of revenue |
131.9 | 134.1 | 94.6 | 77.7 | 438.3 | ||||||||||||||
| Gross profit |
122.2 | 121.2 | 88.0 | 64.4 | 395.8 | ||||||||||||||
| Operating expenses |
61.3 | 61.3 | 60.0 | 60.9 | 243.5 | ||||||||||||||
| Operating income |
60.9 | 59.9 | 28.0 | 3.5 | 152.3 | ||||||||||||||
| Interest and other income, net |
2.8 | 2.1 | 1.9 | 1.8 | 8.6 | ||||||||||||||
| Income before income taxes |
63.7 | 62.0 | 29.9 | 5.3 | 160.9 | ||||||||||||||
| Provision for income taxes |
19.5 | 27.4 | 11.0 | 3.5 | 61.4 | ||||||||||||||
| Net income |
$ | 44.2 | $ | 34.6 | $ | 18.9 | $ | 1.8 | $ | 99.5 | |||||||||
| Weighted average shares outstanding—basic |
74.9 | 74.1 | 72.6 | 71.8 | 73.3 | ||||||||||||||
| Weighted average shares outstanding—diluted |
76.6 | 75.3 | 73.9 | 72.8 | 74.7 | ||||||||||||||
| Net income per share—basic |
$ | 0.59 | $ | 0.47 | $ | 0.26 | $ | 0.02 | $ | 1.36 | |||||||||
| Net income per share—diluted |
$ | 0.58 | $ | 0.46 | $ | 0.26 | $ | 0.02 | $ | 1.33 | |||||||||
24
Table of Contents
| Item 7. | Management’s Discussion and Analysis of Financial Condition and Results of Operations. |
This Annual Report on Form 10-K contains certain forward-looking statements. For purposes of the safe harbor provisions under The Private Securities Litigation Reform Act of 1995, any statements using the terms “believes,” “anticipates,” “expects,” “plans” or similar expressions, are forward-looking statements. The forward-looking statements involve risks and uncertainties that could cause actual results to differ materially from those projected. There are a number of important factors that could cause our actual results to differ materially from those indicated by forward-looking statements made in this report and presented by management from time to time. Some of the important risks and uncertainties that may cause our financial results to differ are described in Item 1A. “Risk Factors.”
Overview
We are the leading supplier of ion implantation equipment used in the fabrication of semiconductor chips. We design, manufacture, market and service semiconductor processing equipment for virtually all of the major semiconductor manufacturers in the world. The VIISta ion implanter products are designed to leverage single wafer processing technology for the full range of semiconductor implant applications. We have shipped more than 4,000 systems worldwide.
We provide support, training, and after-market products and services that help our customers obtain high utilization and productivity, reduce operating costs and extend capital productivity of investments through multiple product generations. In fiscal year 2009, we were ranked number one in customer satisfaction in VLSI Research Inc.’s customer survey for all large suppliers of wafer processing equipment, an honor received in twelve of the past thirteen years.
Our industry is cyclical. The business depends upon semiconductor manufacturers’ expectations and resulting capacity investments for future integrated circuit demand. Historically, our business has experienced significant volatility and we believe the semiconductor capital equipment business will continue to be volatile, largely due to fluctuations in the level of investment by foundry and memory manufacturers. During fiscal year 2009, we experienced a decrease in revenues of 57% compared to fiscal year 2008. This decline is in addition to a decline of approximately 21% in revenue from fiscal year 2007 to fiscal year 2008. We believe that overcapacity in the memory market was the primary driver for the decline in business from fiscal year 2007 to fiscal year 2008. We also believe that continued overcapacity in the memory markets, along with the global credit crisis and the decline in end-user demand for semiconductors has resulted in the rapid decline in revenue during fiscal year 2009. These factors are expected to continue to negatively impact our business through at least the first quarter of fiscal year 2010. Our after-market business has also been adversely affected as fabs are running at lower utilization levels, thus requiring fewer parts, upgrades and services.
We believe that our management team has the industry experience to quickly and effectively react to sizing adjustments required by the volatility in the market. As such, we began resizing our business in fiscal year 2008 and continued through fiscal year 2009. We do not expect any further significant restructuring activities at this time, but do plan to continue to closely monitor the industry.
Despite the decline in revenue, we believe that we have the financial strength and liquidity to continue investing in product development such that we can continue to maintain our leading industry position. At fiscal year end 2009, we had $322.6 million in cash and investments and approximately $2.2 million in debt. Furthermore, despite the year to date loss, we generated approximately $41.7 million in cash from operations during fiscal year 2009.
Our business is tied closely to our market share and the total available market for ion implanters. Calendar year 2008 semiconductor capital expenditure reports show that the total available market for ion implanters decreased by approximately 40% versus calendar year 2007. In addition, based mainly on references to leading industry analyst reports and current customer buying patterns, we believe that semiconductor capital equipment spending will significantly decline in 2009 from 2008.
25
Table of Contents
Wafer size and market. Most advanced devices below 90nm are produced on 300mm wafers. Memory manufacturers typically produce integrated circuits used for flash and dynamic random access memory, or DRAM, which store and retrieve information, while logic manufacturers typically produce integrated circuits used to process data. Foundry manufacturers have the capability to produce both memory and logic wafers.
Market Share and Total Available Market. The table below shows our calendar year 2008 and 2007 market share, as reported by Gartner Dataquest in April 2009 and April 2008, respectively. Market share estimates are calculated on a subset of revenue, and information reported by Gartner Dataquest may not be consistent on a company by company basis. The table below also shows the total available market for ion implanter sales in calendar years 2008 and 2007, also reported by Gartner Dataquest in April 2009 and April 2008, respectively. The total available market represents estimated worldwide total revenue for ion implanters sold during each of the calendar years.
| Market Share Calendar Year |
Total Available Market Calendar Year | |||||||||||
| 2008 | 2007 | 2008 | 2007 | |||||||||
| (Amounts in millions) | ||||||||||||
| By market |
||||||||||||
| Medium current |
41.5 | % | 56.6 | % | $ | 281 | $ | 454 | ||||
| High current |
78.1 | % | 77.8 | % | 371 | 672 | ||||||
| High energy |
22.8 | % | 12.8 | % | 79 | 147 | ||||||
| Ultra high dose |
100.0 | % | 100.0 | % | 67 | 64 | ||||||
| Overall |
61.5 | % | 64.5 | % | $ | 798 | $ | 1,337 | ||||
Market share and total available market research data is also published by VLSI Research Inc. In May 2009, VLSI Research Inc. reported that our overall market share was 65% and that the total available market was $757.8 million for calendar year 2008.
We estimate our market share on a regular basis. We do so based on extensive information, including our own revenues, competitor orders and other key information such as tool move-ins at the fabs. Our market share estimates are usually closely aligned with those of Gartner Dataquest. Revenue recognition disparities do not normally cause significant swings in calculations of market share. However, we believe the significant decline in semiconductor capital equipment business in 2008 caused revenue recognition delays from 2007 shipments to distort 2008 market share metrics. Our information indicates that based on a competitor’s delayed revenue recognition, a significant portion of their medium current tool shipments in 2007 was not recognized as revenue until 2008. As such, we believe our 2008 medium current market share, if normalized for these shipments, would be approximately flat from 2007 and our overall 2008 market share would be several percentage points higher than our overall 2007 market share. Our high current market share is a result of the industry shift to single wafer implanters at advanced technology nodes (65nm and below). We began developing single wafer high current tools in 1994 and are currently the industry leader. The increase in high energy market share is primarily related to customer mix in the total available market for high energy tools. Our position in the ultra high-dose market has resulted from the success of our plasma doping tool, known as the VIISta PLAD, which is used by memory manufacturers.
Revisions
During the quarter ended October 2, 2009, we identified certain instances dating back to fiscal year 1999 in which deferred income taxes and long-term tax liabilities were not properly recorded in our financial statements. These adjustments individually and in the aggregate were not material to our financial statements for all periods impacted. We have revised our historical financial statements to properly reflect these adjustments.
We recorded adjustments to increase deferred tax assets or reduce long-term tax liabilities and decrease income tax expense, resulting in an increase of net income, or reduction in net loss, by $1.8 million, $1.1 million and $2.2 million for the three months ended July 3, 2009 and fiscal years 2008 and 2007, respectively.
26
Table of Contents
We will continue to make corresponding adjustments as described above to other prior periods as appropriate when future financial statements are filed with the Securities and Exchange Commission, or SEC.
Critical Accounting Policies and Significant Accounting Estimates
Our discussion and analysis of our financial condition and results of operations are based upon our consolidated financial statements, which have been prepared in accordance with generally accepted accounting principles, or GAAP in the U.S. The preparation of these consolidated financial statements requires us to make estimates and judgments that affect the reported amounts of assets, liabilities, revenues and expenses, and related disclosures of contingent assets and liabilities. On a continual basis, we evaluate our estimates, including those related to revenues, inventories, accounts receivable, long-lived assets, income taxes, warranty obligations, deferred revenue, post-retirement benefits, contingencies, stock-based compensation and foreign currencies. We operate in a highly cyclical and competitive industry that is influenced by a variety of diverse factors including, but not limited to, technological advances, product life cycles, customer and supplier lead times, and geographic and macroeconomic trends. Estimating product demand beyond a relatively short forecasting horizon is difficult and prone to forecasting error due to the cyclical nature and inherent lack of visibility in the industry. We base our estimates on historical experience and on various other assumptions that are believed to be reasonable under the circumstances, the results of which form the basis for making judgments about the carrying values of assets and liabilities that are not readily apparent from other sources. Actual results may differ from these estimates under different assumptions or conditions. See also the factors discussed in the section titled “Risk Factors” in Item 1A.
We believe that the following sets forth our critical accounting policies used in the preparation of our consolidated financial statements.
Revenue Recognition
Product revenue includes established products, new products, upgrades and spare parts.
We recognize revenue from product sales upon shipment, provided title and risk of loss has passed to the customer, evidence of an arrangement exists, fees are contractually fixed or determinable, collectability is reasonably assured and there are no uncertainties regarding customer acceptance.
For established and new products, a portion of the total purchase price is typically not due until installation occurs and the customer accepts the product. For established products, the lesser of the amount allocated to the equipment or the contractual amount due upon delivery is recorded as product revenue upon delivery. The amount deferred is recognized as revenue upon customer acceptance. For new products, revenue allocated to the equipment is recognized upon customer acceptance. Spare parts and upgrade sales are recognized as revenue upon the later of delivery or the transfer of title and risk of loss to the customer.
We generally follow predetermined criteria for changing the classification of a new product to an established product. We generally recognize products as established after demonstrating success in achieving customer acceptance of the same tool type and specification, for the same or similar application. In most circumstances, once a new product achieves the predetermined criteria, the product is considered established. Furthermore, prior installation costs on the tool type can also influence the evaluation of tool maturity on a going forward basis.
Products are classified as established if the installation process and the post-delivery acceptance provisions are deemed routine, and there is a demonstrated history of achieving the predetermined established product criteria. The majority of products are designed and manufactured to meet contractual customer specifications, and established products must have been demonstrated to meet customer specifications before shipment.
Service revenue includes revenue from maintenance and service contracts, extended warranties, paid service and system installation services. Revenue related to maintenance and service contracts is recognized ratably over the
27
Table of Contents
duration of the contracts. Extended warranty revenue is deferred and recognized ratably over the applicable warranty term. Revenue related to paid service is recorded when earned and revenue related to installation is recorded upon fulfillment of the service obligation and customer acceptance. It generally takes approximately three to six weeks for our technicians to complete the installation of our products and perform tests agreed to with customers. Certain customers formally document their acceptance of our products at this time. Other customers elect to perform additional internal testing prior to formal acceptance, and this process generally takes eight to twelve weeks.
Royalty and license revenue is recognized when contractual obligations are met, and in the case of royalties, upon receipt of a royalty report from the customer, evidence of an arrangement exists, fees are fixed or determinable and collection is reasonably assured.
Our transactions frequently include the sale of systems and services under multiple element arrangements. Revenue under these arrangements is allocated to all elements, except systems, based upon the fair value of those elements. All elements may not be delivered and recognized as revenue during the same period. In such cases, we defer the fair value of the undelivered element until that element is delivered. The amount allocated to installation labor is based upon hourly rates at the estimated time to complete the service. The fair value of all other elements is based upon the price charged when these elements, or similar elements, are sold separately and unaccompanied by other elements. The amount of revenue allocated to systems is done on a residual method basis. Under this method, the total value of the arrangement is allocated first to the undelivered elements based on their fair values, with the remainder being allocated to systems revenue. If fair value cannot be determined for any of the undelivered elements, the entire value of the arrangement is deferred.
Inventory and Purchase Order Commitments
We value our inventory at the lower of cost or market. The determination of lower of cost or market requires that we make significant assumptions about future demand for products and the transition to new product offerings from legacy products. We also provide for losses on those open purchase order commitments in which our estimated obligation to receive inventory under the commitments exceed expected production demand. These assumptions include, but are not limited to, future manufacturing schedules, customer demand, supplier lead time and technological and market obsolescence. Once inventory is written down and a new cost basis has been established, it is not written back up if demand increases. If market conditions are less favorable than those projected by management, additional inventory provisions may be required. If market conditions are more favorable than those projected by management, and specific inventory previously written down is subsequently sold, gross profit could benefit by the amount of the specific write-down to carrying value previously recorded. In the case of purchase order commitments, more favorable market conditions or successful negotiations with suppliers will result in a reduction of provisions in the period the excess purchase order commitments are reduced.
Valuation Allowance on Deferred Tax Assets and Income Tax Provision
We record a valuation allowance against deferred tax assets if it is more likely than not that a portion of the deferred tax asset will not be realized. On a quarterly basis, we evaluate both the positive and negative evidence bearing upon the realizability of our deferred tax assets. We consider future taxable income, ongoing prudent and feasible tax planning strategies, and the ability to utilize tax losses and credits in assessing the need for a valuation allowance. A valuation allowance related to certain state tax credit carryforwards has been recorded. Although, due to the global reorganization we have increased our utilization of state tax credits, management has concluded that it is more likely than not that a portion of these credits will not be utilized since historically the annual amount of state credits generated exceeds the amount of credits that can be used. We record a benefit to the tax provision and corresponding reduction in the valuation allowance related to the utilization of state tax credits generated in prior years. Should we determine that we are not able to realize all or part of our other deferred tax assets in the future, a valuation allowance would be required resulting in an expense recorded within
28
Table of Contents
the provision for income taxes in the statement of operations in the period in which such determination was made. It is possible that the amount of the deferred tax asset considered realizable could be reduced in the near term if our forecast of future taxable income is reduced. Our effective tax rate is affected by levels of taxable income in domestic and foreign tax jurisdictions, U.S. tax credits generated and utilized for research and development expenditures, U.S. foreign income exclusion, investment tax credits and other tax incentives specific to domestic and foreign operations.
Product Warranties
We provide for the estimated cost of product warranties, the amount of which is based primarily upon historical information, at the time product revenue is recognized. While we engage in extensive product quality programs and processes including actively monitoring and evaluating the quality of our component suppliers, our warranty obligation is affected by product failure rates, utilization levels, material usage, service delivery costs incurred in correcting a product failure, and supplier warranties on parts delivered to us. Should actual product failure rates, utilization levels, material usage, service delivery costs incurred in correcting a product failure, or supplier warranties on parts differ from our estimates, revisions to the estimated warranty liability would be required.
Stock-based Compensation
Compensation cost for stock-based awards exchanged for employee and director services is measured at grant date and is based on the fair value of the award. The straight-line method is applied to all grants with service conditions, while the graded vesting method is applied to all grants with both service and performance conditions.
The choice of a valuation technique and the approach utilized to develop the underlying assumptions for that technique, involve significant judgments. These judgments reflect management’s assessment of the most accurate method of valuing the stock options we issue based on historical experience, knowledge of current conditions, and beliefs of what could occur in the future given available information. Our judgments could change over time if the facts underlying these assumptions change, or as additional information becomes available. Any change in judgments could have a material impact on our financial statements. We believe that these estimates incorporate all relevant information and represent a reasonable approximation in light of the difficulties involved in valuing non-traded stock options.
Results of Operations
Fiscal Year
Our fiscal year is a 52- or 53-week period that ends on the Friday nearest September 30. Fiscal year 2009 was comprised of a 52-week period ended on October 2, 2009. Fiscal year 2008 was comprised of a 53-week period ended on October 3, 2008. Fiscal year 2007 was comprised of a 52-week period ended on September 28, 2007.
29
Table of Contents
Fiscal Year 2009 Compared to Fiscal Year 2008 and
Fiscal Year 2008 Compared to Fiscal Year 2007
Revenue
The following table sets forth revenue by revenue stream and territory for fiscal years 2009, 2008 and 2007:
| Fiscal Year | Fiscal Year 2008 to Fiscal Year 2009 |
Fiscal Year 2007 to Fiscal Year 2008 |
|||||||||||||||||||||
| 2009 | 2008 | 2007 | Change | Percent Change |
Change | Percent Change |
|||||||||||||||||
| (Amounts in thousands) | |||||||||||||||||||||||
| Revenue |
|||||||||||||||||||||||
| Product |
$ | 309,230 | $ | 752,629 | $ | 961,329 | $ | (443,399 | ) | -59 | % | $ | (208,700 | ) | -22 | % | |||||||
| Service |
52,764 | 81,371 | 86,062 | (28,607 | ) | -35 | % | (4,691 | ) | -5 | % | ||||||||||||
| Royalty and license |
87 | 61 | 7,473 | 26 | 43 | % | (7,412 | ) | -99 | % | |||||||||||||
| Revenue |
$ | 362,081 | $ | 834,061 | $ | 1,054,864 | $ | (471,980 | ) | -57 | % | $ | (220,803 | ) | -21 | % | |||||||
| Revenue by territory: |
|||||||||||||||||||||||
| Asia Pacific |
$ | 227,108 | $ | 585,543 | $ | 749,382 | $ | (358,435 | ) | -61 | % | $ | (163,839 | ) | -22 | % | |||||||
| North America |
103,257 | 185,883 | 232,141 | (82,626 | ) | -44 | % | (46,258 | ) | -20 | % | ||||||||||||
| Europe |
31,716 | 62,635 | 73,341 | (30,919 | ) | -49 | % | (10,706 | ) | -15 | % | ||||||||||||
| Revenue |
$ | 362,081 | $ | 834,061 | $ | 1,054,864 | $ | (471,980 | ) | -57 | % | $ | (220,803 | ) | -21 | % | |||||||
Product
Our product sales decreased $443.4 million, or 59%, during fiscal year 2009 as compared to fiscal year 2008. Overcapacity in the memory market, along with the global credit crisis and the decline in end-user demand for semiconductors, has caused our customers to significantly decrease their spending for our products. On a unit basis, the number of tools recorded in revenue declined 62% during fiscal year 2009 as compared to fiscal year 2008. In addition, revenue from parts and upgrades sales during fiscal year 2009 decreased 46% as compared to fiscal year 2008, due to lower utilization levels at most customers.
In fiscal year 2008, our product sales decreased $208.7 million, or 22%, from fiscal year 2007, due to lower tool sales to memory customers in Asia Pacific. On a unit basis, the number of tools recorded in revenue in fiscal year 2008 decreased 33% as compared to fiscal year 2007. Despite the decline in tool sales, revenue from parts and upgrades sales increased 8% in the same period, primarily due to a higher installed base of tools.
Service
Service revenue decreased 35% in fiscal year 2009 as compared to fiscal year 2008, primarily related to a decrease in installation revenue due to fewer tool shipments and a decrease in service contract revenue as a result of customer fab closures and lower utilization levels. Service revenue decreased 5% in fiscal year 2008 as compared to fiscal year 2007, primarily as a result of a decrease in installation revenue on account of decreased tool sales. Generally, installation revenue is influenced by shipment volume of systems, product mix, customer mix, timing of customer acceptance and the fair value of installations. As products mature and the installation requires less effort to complete, the fair value of installation revenue per system is reduced, which reduces installation revenue per tool.
Royalty and License
In fiscal years 2009 and 2008, we recorded less than $0.1 million in royalty and license revenues, respectively, as compared to $7.5 million in fiscal year 2007. Until March 2007, Applied Materials was required by a royalty agreement to make quarterly unit-based royalties payments to us on sales of certain products within the scope of the agreement.
30
Table of Contents
Revenue by Territory
The Asia Pacific region has historically accounted for a significant percentage of our revenue. The decrease in revenue from this region in fiscal year 2009 as compared to fiscal year 2008 is due to the worldwide decrease in semiconductor manufacturing, particularly among memory and foundry customers in the Asia Pacific region. The decrease in revenue from the Asia Pacific region in fiscal year 2008, as compared to fiscal year 2007, is primarily due to substantial capacity additions by memory customers in fiscal year 2007. Revenue from North America decreased in fiscal year 2009 as compared to fiscal year 2008, and from fiscal year 2008 as compared to fiscal year 2007, primarily on account of a reduction in sales to both memory and logic customers. The most significant driver of change across all regions for the same periods is the substantial drop in memory business beginning in fiscal year 2008.
Customers
Revenue from our ten largest customers in fiscal years 2009, 2008 and 2007 accounted for approximately 73%, 74% and 72% of total revenue, respectively. In fiscal year 2009, revenue from Intel and tsmc accounted for 21% and 16%, respectively, of our total revenue. We expect that sales of our products to relatively few customers will continue to account for a high percentage of our revenue for the foreseeable future. In fiscal year 2008, revenue from Samsung and Intel accounted for 16% and 13%, respectively of our total revenue. In fiscal year 2007, revenue from Samsung accounted for 17% of our total revenue.
In addition, our accounts receivable is comprised of relatively few customer accounts. As of fiscal year end 2009, two customers accounted for 23% and 21% of the accounts receivable balance. As of fiscal year end 2008, four customers accounted for 16%, 12%, 11% and 10% of the total accounts receivable balance.
Shipment Mix
Our tools are used by logic, memory and foundry manufacturers of integrated circuits. Logic manufacturers make chips that process information, while memory manufacturers make chips that store information. Both memory and logic manufacturers are owned by the companies that design the chips. Foundry manufacturers are contractors that take chip designs from other companies and make the chips for them. For several years, up to and including 2007, the demand for memory chips has outstripped logic due to the growth in memory intensive applications such as cameras, phones and MP3 players. We believe that substantial capacity additions by memory customers through fiscal year 2007 led to excess supply of memory devices. In turn, this excess capacity has led to a significant decrease in tool purchases from memory manufacturers in fiscal years 2008 and 2009. Virtually all of our tool shipments are 300 mm tools, which began to replace 200 mm tools at the end of the 1990s. The following table sets forth tool shipments by market, as a percent of total tool shipments, for fiscal years 2009, 2008 and 2007. Percentages are based on the number of tools shipped during the respective period.
| Fiscal Year | |||||||||
| 2009 | 2008 | 2007 | |||||||
| By market |
|||||||||
| Memory |
29 | % | 56 | % | 70 | % | |||
| Logic |
31 | % | 23 | % | 14 | % | |||
| Foundry |
40 | % | 21 | % | 16 | % | |||
| Shipments |
100 | % | 100 | % | 100 | % | |||
Cost of Product Revenue
Cost of product revenue was $185.5 million and gross margin was 40% for fiscal year 2009, compared to the cost of product revenue of $386.7 million and gross margin of 49% for fiscal year 2008. The primary reason for the decrease in gross margin for fiscal year 2009 versus fiscal year 2008 is under utilization of the factory due to
31
Table of Contents
significantly lower manufacturing volume. We have decided to maintain a minimum number of employees in the factory despite the lower volume to ensure our ability to quickly add capacity when the industry begins to recover. Costs have been managed through multiple efforts, including a reduced workforce and mandatory shutdowns. The under utilized factory impacted gross profit by $10.3 million, or 3%, from fiscal year 2009 to fiscal year 2008. In addition, charges related to product transitions and reductions in the demand for legacy parts and upgrades resulted in approximately 3% and 1% reductions in gross margin during fiscal years 2009 and 2008, respectively. The impact of lower purchase volume reduced gross margin approximately 1% in fiscal year 2009 compared to fiscal year 2008. A lower sales mix of tools versus upgrades and parts partially offset the negative impact on gross margins for fiscal year 2009 versus fiscal year 2008. Tools typically are sold at lower margins than upgrades and parts. Furthermore, an unfavorable product mix, notably a higher concentration of high energy tools and some used tool sales, negatively impacted gross margin along with slightly lower margins on upgrades and parts sales in fiscal year 2009.
For fiscal year 2008, cost of product revenue was $386.7 million and gross margin was 49%, compared to the cost of product revenue of $511.1 million and gross margin of 47% for fiscal year 2007. The increase in gross margin from fiscal year 2007 to fiscal year 2008 was primarily due to a favorable product mix and lower warranty expense. The under utilized factory impacted gross profit by $15.8 million, or 2%, from fiscal year 2008 to fiscal year 2007. Generally, as tool sales become a lower portion of product revenue, product gross margin increases. This is due to the fact that tools generally have lower gross margins than parts and upgrades. These positive factors more than offset factory absorption and inventory charges resulting from lower tool sales.
Cost of Service Revenue
Cost of service revenue was $33.9 million and gross margin was 36% for fiscal year 2009, compared to $51.6 million and gross margin of 37% for fiscal year 2008. Cost of service revenue primarily consists of the costs to install the tool at the customer’s fab. Thus, fluctuations in service margins are mainly attributed to the change in installation margins, which are influenced by product and regional mix. The fair value of installations is assessed periodically and is largely based upon the historical experience of the effort and cost to complete installations.
In fiscal year 2008, cost of service revenue was $51.6 million and gross margin was 37%, compared to $54.8 million and gross margin of 36% for fiscal year 2007. The increase in service gross margin in fiscal year 2008 was related to a greater mix of higher margin paid service business. This positive factor more than offset lower margins on service contracts and installation.
Research, Development and Engineering
Research, development and engineering expenses were $80.1 million for fiscal year 2009, compared to $111.2 million for fiscal year 2008, a decrease of $31.2 million, or 28%. The decrease in research, development and engineering spending is attributable to the cost reduction efforts we have implemented, such as lower levels of headcount, mandatory shutdowns and reduced compensation plans. However, we continue to maintain our investments in new product development and growth initiatives. We are actively investing in finding new applications for our products. Additionally, we focus on maintaining our leadership position in the markets for medium current, high current and ultra high dose implanters, improving our position in the high energy business and we continue to invest in additional new and next generation products.
Research, development and engineering expenses were $111.2 million for fiscal year 2008, compared to $104.0 million for fiscal year 2007, an increase of $7.2 million, or 7%. The increases in research, development and engineering spending are attributable to our rapid product development cycle (which aims to introduce new products every nine to twelve months) and continuing efforts to improve productivity and technical development of our products.
32
Table of Contents
Marketing, General and Administrative
Marketing, general and administrative expenses were $96.2 million for fiscal year 2009, compared to $130.7 million for fiscal year 2008, a decrease of $34.5 million, or 26%. The decrease in expense from fiscal year 2008 to fiscal year 2009 was primarily due to cost reduction efforts implemented during the industry downturn. Compensation plans were significantly reduced and/or suspended and cost reduction efforts have resulted in lower levels of headcount and associated costs, such as travel. In addition, we mandated shutdowns for several weeks each quarter during fiscal year 2009.
Marketing, general and administrative expenses were $130.7 million for fiscal year 2008, compared to $128.1 million for fiscal year 2007, an increase of $2.6 million, or 2%. The increase in expense from fiscal year 2007 to fiscal year 2008 was due to increases in headcount, mainly in international locations across several functions and equity compensation.
Restructuring Costs
The semiconductor industry has historically experienced periodic downturns and in response, we have historically recorded restructuring charges in connection with cost reduction initiatives implemented in response to the industry downturns. Restructuring charges typically consist of severance, benefits and outplacement services offered to terminated employees and sometimes include charges for remaining lease payments on facilities that are closed. Prior to any restructuring announcements, the restructuring is approved by the appropriate level of management necessary to commit to the specific actions of the reduction in force.
In fiscal year 2009, we incurred restructuring charges of $9.2 million in connection with the continuation of cost reduction initiatives in response to the continued weakness in the semiconductor capital equipment market. The expense is related to a reduction of headcount of approximately 380 employees, mainly within manufacturing and engineering.
We began relocating the European operations in Houten, the Netherlands to Schaffhausen, Switzerland, in the fiscal fourth quarter of 2008. The restructuring is comprised primarily of one-time termination benefits and a contract termination expense, a facility lease. We estimate that the European restructuring activity, inclusive of activity through fiscal years 2009 and 2008 ($2.0 million and $0.4 million, respectively), will cost $2.5 million. The estimate also includes future, one-time termination benefits of $0.1 million.
The following table summarizes the restructuring activity for fiscal years 2009 and 2008.
| Ongoing Benefit Arrangements |
One-time Termination Benefits |
Contract Termination Costs |
Other Associated Costs |
Total | ||||||||||||||||
| (Amounts in thousands) | ||||||||||||||||||||
| Accrued charges at fiscal year end 2007 |
— | — | — | — | — | |||||||||||||||
| Costs incurred |
$ | 1,208 | $ | 324 | — | $ | 75 | $ | 1,607 | |||||||||||
| Costs paid |
(1,024 | ) | — | — | — | (1,024 | ) | |||||||||||||
| Non-cash settlements |
— | — | — | — | — | |||||||||||||||
| Accrued charges at fiscal year end 2008 |
$ | 184 | $ | 324 | $ | — | $ | 75 | $ | 583 | ||||||||||
| Costs incurred |
6,505 | 1,598 | 194 | 685 | 8,982 | |||||||||||||||
| Adjustments |
197 | (103 | ) | 173 | (76 | ) | 191 | |||||||||||||
| Costs paid |
(6,878 | ) | (1,337 | ) | (95 | ) | (464 | ) | (8,774 | ) | ||||||||||
| Non-cash settlements |
— | — | — | (192 | ) | (192 | ) | |||||||||||||
| Accrued charges at fiscal year end 2009 |
$ | 8 | $ | 482 | $ | 272 | $ | 28 | $ | 790 | ||||||||||
Cash outlays related to one-time termination benefits and contract termination costs to exit the Houten facility will continue through fiscal years 2010 and 2014, respectively.
33
Table of Contents
We did not recognize restructuring costs during fiscal year 2007.
Interest Income
We earned interest income of $5.3 million for fiscal year 2009, compared to $10.5 million for fiscal year 2008. The decrease in interest income for fiscal year 2009 was primarily attributable to significantly lower interest rates partially offset by an increase in average cash and investment balances. At fiscal year end 2009, we had $4.6 million in investments, which earned interest that was exempt from U.S. federal taxation, which are generally lower than rates earned on comparable fully-taxable investments.
In fiscal year 2008, we earned $10.5 million in interest income, compared to $20.8 million for fiscal year 2007. The decrease in interest income for fiscal year 2008 was related to a decrease in average cash and investment balances, primarily attributable to share repurchases of $179.5 million during fiscal year 2008. At fiscal year end 2008, we had $47.5 million in cash equivalents and investments whose interest was exempt from U.S. federal taxation. The rates of return on these cash equivalents were approximately 33% lower than rates earned on comparable fully-taxable cash equivalents.
Interest Expense
We incurred $1.0 million in interest expense for fiscal year 2009, compared to $1.7 million for fiscal year 2008 and $1.3 million for fiscal year 2007. In fiscal year 2009, we incurred lower interest expense compared to the two prior fiscal years, primarily due to lower finance charges on forward contracts used to hedge balance sheet related foreign exchange exposure.
Other (Expense) Income, Net
During fiscal year 2009, we recorded other expense, net of $1.1 million related to foreign currency exchange losses and miscellaneous charges. During fiscal year 2008, we recorded other expense, net of $0.1 million related to foreign currency exchange losses offset by miscellaneous income. During fiscal year 2007, we recorded other income, net of $0.3 million related to foreign currency exchange gains offset by miscellaneous charges.
Provision for Income Taxes
Our effective tax rate is based on the income for the year in the U.S. and other tax jurisdictions throughout the world. In fiscal year 2007, we implemented a plan to realign the legal entities within our worldwide affiliated group to make our legal structure more consistent with the geographic mix of our customers and suppliers. The realignment of our entities has caused the tax rate to become more sensitive to the geographic distribution of profits.
Our effective income tax rate was 4% in fiscal year 2009, 38% in fiscal year 2008 and 48% in fiscal year 2007. The fiscal year 2009, 2008 and 2007 tax provisions were impacted by tax charges related to our realignment of our global business structure and establishment of international operations that provide operational and financial services to all of our international locations. A significant element of the new structure involves the sharing of certain expenses related to the ongoing development of intangible property.
The fiscal year 2009 effective tax rate includes discrete charges of approximately $1.1 million related to tax return adjustments, $1.3 million related to interest accrued on uncertain tax positions and a discrete benefit of $2.1 million due to the expiration of the statute of limitations, primarily with respect to our U.S. federal tax filings for fiscal year 2005. The fiscal year 2008 effective tax rate includes discrete benefits of approximately $4.7 million related to current and prior year research and development tax credits, other discrete benefits of $0.3 million and a discrete charge of approximately $1.0 million to write-down the deferred tax asset for Swiss start-up losses, upon receipt of the final Swiss incentive ruling. The fiscal year 2007 rate benefited from discrete items of approximately $2.0 million, primarily related to the retroactive extension of the research and development tax credit in that year.
34
Table of Contents
We benefit from tax holidays on approved investments in Singapore and Switzerland. These tax holidays are scheduled to expire at varying times within the next one to four years and are extendable for a maximum of an additional five years provided that certain commitments are met. As a result of the tax holidays, our net income was lower by $0.9 million ($0.01 per share), higher by $2.4 million ($0.03 per share) and lower by $0.1 million ($0.00 per share) for fiscal years 2009, 2008, and 2007, respectively. The benefit of losses incurred in Switzerland in fiscal years 2009 and 2007 at a reduced rate resulted in an overall negative impact of the tax holidays to the consolidated financial statements in those years.
We adopted the accounting standard which provides guidance for accounting for uncertainty in income taxes at fiscal year end 2007. The net increase in the reserve for unrecognized tax benefits during fiscal year 2009 was $4.4 million for positions taken during the year. As of year end fiscal 2009, the total amount of unrecognized tax benefits was $55.0 million, of which $53.0 million would impact the effective tax rate, if recognized. The net increase in the reserve for unrecognized tax benefits during fiscal year 2008 was $11.6 million for positions taken during the year. As of the year end fiscal 2008, the total amount of unrecognized tax benefits was $52.4 million, of which $48.1 million would impact the rate if recognized. The difference between the total amount of unrecognized tax benefits and the amount that would impact the effective rate consists of items that are offset by deferred tax assets, relating to state tax credits which are fully offset by a valuation allowance. We will reexamine the tax provision and the effect of estimated unrecognized tax benefits on our financial position at the end of each reporting period. We include interest and penalties related to unrecognized tax benefits within our provision for income taxes. As of fiscal year end 2009 and 2008, the total amount of accrued interest and penalties was $4.1 million and $3.1 million, respectively, related to unrecognized tax benefits.
We and our subsidiaries are subject to examination by federal, state and foreign tax authorities. The statute of limitations for our tax filings with federal, state and foreign tax authorities is generally open for fiscal years 2003 through the present. The Internal Revenue Service, or IRS, commenced an examination of fiscal 2007 in December of 2008. The IRS completed examinations of certain refund claims filed for fiscal years 2002 to 2004 and we filed a protest of the refund claim audit findings with the Appeals Office of the IRS. The IRS audit of fiscal year 2007 is continuing. It is unknown whether agreement on the refund claims or resolution of the IRS audit of fiscal year 2007 will be reached within the next twelve months. The favorable resolution of the refund claims could result in a benefit to the tax provision in the range of $0.0 to $5.8 million, excluding interest. Based on the status of the IRS audit, it is not possible to estimate the impact of the amount of any changes to our previously recorded uncertain tax positions. It is reasonably possible that up to $3.7 million of unrecognized tax positions may be recognized within one year as the result of the lapse of statutes of limitations.
Net (Loss) Income
As a result of the foregoing factors, for fiscal year 2009, we recorded net loss of $38.0 million compared to net income of $99.5 million and $144.4 million, respectively, for fiscal years 2008 and 2007. In fiscal year 2009, the net loss per diluted share was $0.53 compared to net income per diluted share of $1.33 and $1.76, respectively, for fiscal years 2008 and 2007.
Liquidity and Capital Resources
We generated $41.7 million of cash from operations during fiscal year 2009 compared to $168.0 million during fiscal year 2008. Cash generated by operations in fiscal year 2009 was primarily a result of reductions in inventory of $56.1 million and a decrease in accounts receivables of $16.8 million, partially offset by a net loss of $38.0 million and decreases of $17.6 million in accrued expenses and $9.7 million in deferred revenue. Accrued expenses decreased mainly due to the payout of incentive compensation following the end of the fiscal year 2008. The decrease in inventory was primarily due to lower material receipts for the lower build plan and the decrease in accounts receivable was due to substantially lower sales volumes. Accounts receivable did not decrease as much as inventory partially due to extended payment terms.
35
Table of Contents
We generated $168.0 million of cash from operations during fiscal year 2008, compared to $108.3 million during fiscal year 2007. In fiscal year 2008, cash provided by operations was derived primarily from net income of $99.5 million and decreases in accounts receivable of $61.3 million and inventories of $4.9 million, due to significantly lower sales primarily in the fourth quarter of fiscal year 2008. The cash flow effects of net income and the changes in accounts receivable and inventories were partially offset by a decrease in accounts payable of $20.6 million and a decrease in deferred revenue of $23.6 million. The decrease in deferred revenue is also due to lower sales primarily in the fourth quarter of fiscal year 2008. Furthermore, accounts payable decreased in fiscal year 2008 as we scaled back buying materials due to a lower manufacturing build schedule.
During fiscal year 2007, we generated $108.3 million of cash from operations. Cash provided by operations in fiscal year 2007 was derived primarily from net income of $144.4 million. Increases in accounts receivable of $61.8 million and inventories of $51.6 million were related to higher business volume. These increases were partially offset by increases in accrued expenses and deferred revenue. The increase in accrued expenses is associated with an anticipated long-term tax liability relating to the global realignment. The increase in deferred revenue of $8.1 million was related to the increase in volume and timing of tool shipments and the increase in accrued expenses was related to incentive compensation in support of the increase in overall business activity.
During fiscal year 2009, we generated $11.6 million from the net sale and maturity of investments and used $7.1 million for the purchase of plant, property and equipment. During fiscal year 2008, we generated $42.7 million from the net sale and maturity of investments and used $9.5 million for the purchase of plant, property and equipment. In fiscal year 2009, cash generated from the net sale and maturity of investments decreased compared to fiscal year 2008 due to the timing of maturities and because fewer securities were purchased in the later part of fiscal year 2008 due to the market environment. During fiscal year 2007, we generated $108.7 million from the net sale and maturity of investments and used $10.9 million for the purchase of property, plant and equipment. Cash generated from the net sale and maturity of investments decreased from fiscal year 2007 to fiscal year 2008 as fewer securities were purchased in fiscal year 2007, in part due to the $426.5 million expenditure on the share repurchase program described below.
In October 2004, our Board of Directors authorized the repurchase, from time to time, of up to $100.0 million of our common stock on the open market. Subsequently, the Board of Directors voted on increases to the amount of funds that may be expended in repurchasing our common stock to a total of $800.0 million. The program does not have a fixed expiration date. As of fiscal year end 2009, $85.6 million remained available for repurchase under the existing repurchase authorization. Our stock repurchase plan is influenced by our growth and investment plans, stage in the industry cycle, attractiveness of share price, and liquidity needs.
During fiscal year 2009, we generated $8.4 million of cash from financing activities, primarily from $8.0 million of cash received from the issuance of common stock upon the exercise of stock options. We did not purchase any shares of our common stock during fiscal year 2009, due to our interest in preserving cash during the industry downturn. In fiscal year 2008, we used $170.1 million of cash for financing activities. During fiscal year 2008, we used $179.5 million to repurchase 4.8 million shares of stock at a weighted-average price per share of $37.74. This was partially offset by the issuance of stock upon the exercise of stock options and under the employee stock purchase plan of $7.3 million and the excess tax benefit from stock based compensation of $2.5 million. During fiscal year 2007, we used $355.2 million of cash for financing activities. We repurchased $426.5 million of our stock during fiscal year 2007. This was partially offset by the issuance of stock upon the exercise of stock options and under the employee stock purchase plan of $54.2 million and the excess tax benefit from stock based compensation of $17.6 million.
On May 23, 2008, we entered into a credit agreement with multiple financial institutions providing for borrowings of a maximum principal amount of up to $100.0 million under an unsecured revolving credit facility. Amounts could be borrowed, repaid and re-borrowed from time to time during the five year commitment period ending May 23, 2013. Borrowings would bear interest at a rate per annum equal to either: (1) the greater of (a) the prime rate and (b) the federal funds rate plus 0.50%; or (2) the sum of (a) LIBOR, with certain
36
Table of Contents
adjustments and (b) an “applicable rate,” defined in the credit agreement as a percentage spread based on our leverage ratio. The credit agreement contained events of default and covenants. The credit facility was intended to provide ongoing working capital and cash for acquisitions, repurchases of common stock, capital expenditures and other general corporate purposes. We terminated this credit agreement effective March 27, 2009, pursuant to the terms of the credit agreement. As of March 27, 2009, there were no outstanding borrowings under this credit agreement and we did not incur any early termination penalties in connection with the credit agreement termination. The termination of this credit facility did not materially impact our liquidity.
Our subsidiary in Japan had two credit facilities at different financial institutions during fiscal years 2009 and 2008, one of which was terminated during fiscal year 2009. Maximum available borrowing under the remaining facility was Yen 400,000,000 ($4.5 million) at fiscal year end 2009. The loan is not collateralized and contains no restrictive covenants, although the loan is guaranteed by us. The interest rate for this facility is the 3-month Tokyo interbank offered rate (TIBOR) plus 1.00%, which was approximately 1.6% and 1.9% at fiscal year end 2009 and 2008, respectively. There were no outstanding borrowings under this facility at fiscal year end 2009 and 2008. The termination of this credit facility did not materially impact our liquidity.
Our subsidiary in Taiwan terminated its credit facility of $1.0 million during fiscal year 2009. Any outstanding U.S. Dollar borrowings under the Taiwan facility accrued interest at the local base rate plus 2.0% plus taxes, which was approximately 7.4% at fiscal year end 2008. Any New Taiwan Dollar borrowings accrued interest at the local base rate plus 2.0% plus taxes, which was approximately 4.1% at fiscal year end 2008. There were no outstanding borrowings as of fiscal year end 2008 under this facility. The termination of this credit facility did not materially impact our liquidity.
During fiscal years 2008 and 2009, we also had borrowing capacity in Europe. Our subsidiary in Europe maintains a credit facility that includes overdraft protection of Euro 1.0 million, which at fiscal year end 2009 translated to $1.5 million. This credit facility was reduced during fiscal year 2009, from Euro 2.5 million at fiscal year end 2008 and this reduction did not materially impact our liquidity. Interest accrues at the Euro base rate plus 1.5% and was approximately 6.4% and 7.9% at fiscal year end 2009 and 2008, respectively. Borrowings under this facility are payable on demand. The credit facility is not collateralized nor does it contain any restrictive covenants, although the facility is guaranteed by us. There were no outstanding borrowings as of fiscal year end 2009 and 2008 under this facility.
In February 2003, we purchased our previously leased facility located in Newburyport, Massachusetts. The purchase price consisted of cash payments totaling $3.4 million, the assumption of the seller’s outstanding loan of $5.1 million and the transfer of other prepaid assets of $0.8 million. The loan has a fixed interest rate of 9.05% with monthly payments of principal and interest until the loan matures in January 2013. The loan may be prepaid in full, but not in part, at any time after November 5, 2006. Prepayment would require us to pay a prepayment penalty equal to the greater of two percent of the outstanding principal balance or the excess of the present value of all future loan payments over the outstanding principal balance of the loan. The $2.2 million carrying amount of the loan had an estimated fair value of $2.4 million at fiscal year end 2009. The fair value of the loan was estimated using a discounted cash flow analysis. The interest rate was estimated based on current market conditions and our financial condition at fiscal year end 2009. As of fiscal year end 2009, we also had a standby letter of credit outstanding for $0.5 million as a guarantee for the debt on this facility.
Our liquidity is affected by many factors, some based on the normal operations of the business and others related to the uncertainties of the industry and global economies. We believe that cash, cash equivalents and investments of $322.6 million at fiscal year end 2009 will be sufficient to satisfy working capital requirements, commitments for capital expenditures, any future common stock repurchases and other purchase commitments, environmental contingencies and cash requirements for the foreseeable future. We believe that we have the ability to hold cash equivalents and investments through maturity and therefore believe that any reduction in value of investments is temporary in spite of the current disruption in the credit markets.
37
Table of Contents
Off-Balance Sheet Arrangements
We do not have any relationships with unconsolidated entities or financial partnerships, such as entities often referred to as structured finance or special purpose entities, which would have been established for the purpose of facilitating off-balance-sheet arrangements or other contractually narrow or limited purposes. As such, we are not exposed to any financing, liquidity, market or credit risk that could arise if we had engaged in such relationships.
Contractual Obligations
Under GAAP, some obligations and commitments are not required to be included in the consolidated balance sheets and statements of operations. These obligations and commitments, while entered into in the normal course of business, may have a material impact on liquidity. The following commitments as of fiscal year end 2009 have not been included in the consolidated balance sheets and statements of operations included under Item 8. “Financial Statements and Supplementary Data.” We have various contractual obligations impacting our liquidity. The following table summarizes our future payments under contractual obligations as of October 2, 2009:
| Payment Due by Period | ||||||||||||||||||
| Total | Less Than 1 Year |
1-3 Years |
3-5 Years |
More Than 5 Years |
Other | |||||||||||||
| (Amounts in thousands) | ||||||||||||||||||
| Long-term debt and interest expense |
$ | 2,551 | $ | 785 | $ | 1,570 | $ | 196 | — | — | ||||||||
| Operating lease obligations |
3,075 | 1,704 | 1,181 | 190 | — | — | ||||||||||||
| Purchase obligations (a) |
48,466 | 48,457 | 9 | — | — | — | ||||||||||||
| Non-current income tax payable (b) |
47,217 | — | — | — | — | $ | 47,217 | |||||||||||
| Other long-term liabilities (c) |
19,140 | — | 3,677 | 778 | $ | 2,680 | 12,005 | |||||||||||
| Total contractual cash obligations |
$ | 120,449 | $ | 50,946 | $ | 6,437 | $ | 1,164 | $ | 2,680 | $ | 59,222 | ||||||
| (a) | Purchase obligations represent agreements to purchase materials or other goods and capital expenditures for the construction or purchase of property, plant and equipment. |
| (b) | Represents the non-current tax payable obligation pursuant to the authoritative guidance for accounting for uncertainty in income taxes. We are unable to make a reasonably reliable estimate of the timing of payments in individual years due to uncertainties in the timing of tax audit outcomes and therefore included this amount in the Other column. |
| (c) | Included in other long-term liabilities are liabilities for post-employment and post-retirement benefits, deferred compensation, warranty provision, environmental reserve and other obligations. For certain long-term obligations we are not able to provide a reasonably reliable estimate of the timing of future payments relating to these obligations and therefore we include these amounts in the Other column. |
Transactions with Affiliates and Related Parties
Operations prior to April 2, 1999 had been part of the former VAI, which now operates as VMS. On April 2, 1999, VAI contributed its SEB to Varian Semiconductor, then distributed to the holders of record of VAI common stock one share of common stock of Varian Semiconductor for each share of VAI common stock owned on March 24, 1999. At the same time, VAI contributed its Instruments Business, or IB, to VI and distributed to the holders of record of VAI common stock one share of common stock of IB for each share of VAI common stock owned on March 24, 1999. VAI retained its Health Care Systems business and changed its name to VMS effective as of April 2, 1999. These transactions were accomplished under the terms of a Distribution Agreement by and among Varian Semiconductor, VAI, hereafter referred to as VMS for periods following the spin-off and VI, or the Distribution Agreement. For purposes of providing an orderly transition and to define certain ongoing relationships between and among Varian Semiconductor, VMS and VI after the spin-off, Varian Semiconductor, VMS and VI also entered into the Distribution Related Agreements.
The Distribution Related Agreements provide that from and after the spin-off, VMS, VI and Varian Semiconductor will indemnify each and their respective subsidiaries, directors, officers, employees and agents
38
Table of Contents
against all losses arising in connection with shared liabilities (including certain environmental and legal liabilities). All shared liabilities will be managed and administered by VMS and expenses and losses, net of proceeds and other receivables, will be borne one-third each by VMS, VI, and Varian Semiconductor. The Distribution Related Agreements also provide that we shall assume all of our liabilities, other than shared liabilities (including accounts payable, accrued payroll and pension liabilities) in accordance with their terms. During fiscal years 2009, 2008 and 2007, we were charged $0.8 million, $1.0 million and $0.9 million, respectively, by VMS in settlement of these obligations.
Recent Accounting Pronouncements
In December 2007, the Financial Accounting Standards Board, or FASB, revised the authoritative guidance for business combinations which requires a number of changes in accounting for business combinations. These changes include the recognition of contingent consideration and certain contingent assets and liabilities at fair value, capitalization of acquired in-process research and development, expensing of acquisition related transaction costs and restructuring costs, and the recognition of changes in the acquirer’s income tax valuation allowance. This guidance will be effective for our fiscal year 2010, with early adoption prohibited. The adoption of this guidance will change our accounting treatment for business combinations on a prospective basis.
In September 2006, the FASB issued authoritative guidance for fair value measurements which defines fair value, establishes a framework for measuring fair value, and expands disclosures about assets and liabilities measured at fair value in the financial statements. In February 2008, the FASB issued authoritative guidance which allows for the delay of the effective date of the authoritative guidance for fair value measurements for one year for all nonfinancial assets and liabilities, except those that are recognized or disclosed at fair value in the financial statements on a recurring basis. We adopted the provisions of the guidance for financial assets and liabilities on October 4, 2008 but elected a partial deferral under the provisions related to nonfinancial assets and liabilities that are measured at fair value on a nonrecurring basis. We are currently evaluating the impact that the guidance will have on our consolidated financial statements when it is applied to non-financial assets and non-financial liabilities that are not measured at fair value on a recurring basis, beginning in the first quarter of fiscal year 2010.
In June 2008, the FASB issued authoritative guidance which classifies unvested share-based payment awards that contain non-forfeitable rights to dividends or dividend equivalents (whether paid or unpaid) as participating securities and requires them to be included in the computation of earnings per share pursuant to the two-class method. This guidance is effective for financial statements issued for fiscal years beginning after December 15, 2008, and interim periods within those years. All prior-period earnings per share data presented are to be adjusted retrospectively (including interim financial statements, summaries of earnings, and selected financial data), with early application not permitted. We are currently evaluating the effect, if any, that the adoption of this guidance will have on our consolidated financial statements in the first quarter of fiscal year 2010.
In October 2009, the FASB issued new standards for revenue recognition with multiple deliverables. These new standards impact the determination of when the individual deliverables included in a multiple-element arrangement may be treated as separate units of accounting. Additionally, these new standards modify the manner in which the transaction consideration is allocated across the separately identified deliverables by no longer permitting the residual method of allocating arrangement consideration. These new standards are effective for us beginning in the first quarter of fiscal year 2011, however early adoption is permitted. We are evaluating the effect these new standards will have on our consolidated financial statements.
In October 2009, the FASB issued new standards for the accounting for certain revenue arrangements that include software elements. These new standards amend the scope of pre-existing software revenue guidance by removing from the guidance non-software components of tangible products and certain software components of tangible products. These new standards are effective for us beginning in the first quarter of fiscal year 2011, however early adoption is permitted. We are evaluating the effect these new standards will have on our consolidated financial statements.
39
Table of Contents
| Item 7A. | Quantitative and Qualitative Disclosures About Market Risk. |
Foreign Currency Exchange Risk
As a multinational company, we face exposure to adverse movements in foreign currency exchange rates. This exposure may change over time as our business practices evolve and could impact our financial results. Historically, our primary exposures have resulted from non-U.S. dollar-denominated sales and purchases in Asia Pacific and Europe. We do not enter into forward exchange contracts for trading purposes. Our forward exchange contracts generally range from one to nine months in original maturity. No forward exchange contract exceeds one year in original maturity.
We hedge currency exposures that are associated with certain of our assets and liabilities denominated in various non-U.S. dollar currencies. The aggregate exchange losses for fiscal years 2009, 2008 and 2007 were approximately $0.4 million, $0.3 million and $0.3 million, respectively.
Forward exchange contracts outstanding are summarized as follows:
| Fiscal Year End 2009 | Fiscal Year End 2008 | |||||||||||||||||
| Notional Value |
Contract Rate |
Estimated Fair Value- Gain (Loss) |
Notional Value |
Contract Rate |
Estimated Fair Value- Gain (Loss) |
|||||||||||||
| (Dollars in thousands) | ||||||||||||||||||
| Foreign currency purchase contracts: |
||||||||||||||||||
| Singapore Dollar |
$ | 1,460 | 1.43 | $ | 24 | $ | 3,573 | 1.42 | $ | (54 | ) | |||||||
| Korean Won |
6,289 | 1,182.13 | 15 | 2,750 | 1,129.65 | (215 | ) | |||||||||||
| Japanese Yen |
— | — | — | 2,808 | 105.44 | (7 | ) | |||||||||||
| Euro |
1,143 | 1.43 | 23 | 2,342 | 0.71 | (31 | ) | |||||||||||
| Total foreign currency purchase contracts |
$ | 8,892 | $ | 62 | $ | 11,473 | $ | (307 | ) | |||||||||
| Foreign currency sell contracts: |
||||||||||||||||||
| Japanese Yen |
$ | 17,946 | 92.00 | $ | (448 | ) | $ | 38,477 | 106.11 | $ | (434 | ) | ||||||
| Korean Won |
13,318 | 1,250.50 | (806 | ) | 13,660 | 1,084.26 | 1,574 | |||||||||||
| Israeli Shekel |
1,053 | 3.80 | (7 | ) | 1,088 | 3.60 | (35 | ) | ||||||||||
| New Taiwan Dollar |
640 | 32.70 | (11 | ) | 1,009 | 32.02 | 5 | |||||||||||
| Total foreign currency sell contracts |
$ | 32,957 | $ | (1,272 | ) | $ | 54,234 | $ | 1,110 | |||||||||
| Total contracts |
$ | 41,849 | $ | (1,210 | ) | $ | 65,707 | $ | 803 | |||||||||
We use derivative instruments to protect our foreign operations from fluctuations in earnings and cash flows caused by volatility in currency exchange rates. We hedge our current exposures and a portion of our anticipated foreign currency exposures with hedging instruments having terms of up to twelve months.
Our international sales, except for those in Japan, are primarily denominated in the U.S. dollar. For foreign currency-denominated sales, however, the volatility of the foreign currency markets represents risk to us. Upon forecasting the exposure, we enter into hedges with forward sales contracts whose critical terms are designed to match those of the underlying exposure. These hedges are evaluated for effectiveness at least quarterly using the change in value of the forward contracts to the change in value of the underlying transaction, with the effective portion of the hedge accumulated in other comprehensive income. Any measured ineffectiveness is included immediately in other income and expense in the consolidated statements of operations. There was an immaterial amount of ineffectiveness recognized during fiscal years 2009 and 2008.
40
Table of Contents
Interest Rate Risk
Although payments under certain of our overseas borrowing facilities are tied to market indices, we are not exposed to material interest rate risk from these borrowing facilities. We have no material cash flow exposure due to rate changes for cash equivalents and short-term investments. We do not believe that a one percent change in interest rates would have a material impact on the fair value of our investment portfolio or our interest income. We maintain cash investments primarily in U.S. Treasury, government agency and investment-grade corporate and municipal securities, as well as short-term time deposits with investment grade financial institutions. Cash equivalents at fiscal year end 2009 and 2008 were $164.5 million and $110.2 million, respectively. At fiscal year end 2009 and 2008, our short-term investments were $44.0 million and $69.0 million, respectively, and consisted primarily of corporate bonds, certificates of deposit and government agency and U.S. Treasury securities with ratings of AA or better. At fiscal year end 2009 and 2008, our long-term investments were $86.4 million and $69.5 million, respectively, and consisted primarily of U.S. Treasury, government agency, and corporate bonds with ratings of AA or better.
Commodity Price Risk
We are not exposed to material commodity price risk.
| Item 8. | Financial Statements and Supplementary Data. |
The response to this item is submitted as a separate section to this report. See “Item 15. Exhibits and Financial Statement Schedules.”
| Item 9. | Changes in and Disagreements with Accountants on Accounting and Financial Disclosure. |
None.
| Item 9A. | Controls and Procedures. |
Disclosure Controls and Procedures
The management of Varian Semiconductor, with the participation of the Chief Executive Officer and Chief Financial Officer, evaluated the effectiveness of the disclosure controls and procedures of Varian Semiconductor as of October 2, 2009. The term “disclosure controls and procedures,” as defined in Rules 13a-15(e) and 15d-15(e) under the Securities Exchange Act of 1934, as amended, or the Exchange Act, means controls and other procedures of a company that are designed to ensure that information required to be disclosed by a company in the reports that it files or submits under the Exchange Act is recorded, processed, summarized and reported, within the time periods specified in the SEC’s rules and forms. Disclosure controls and procedures include, without limitation, controls and procedures designed to ensure that information required to be disclosed by a company in the reports that it files or submits under the Exchange Act is accumulated and communicated to Varian Semiconductor’s management, including its principal executive and principal financial officers, as appropriate to allow timely decisions regarding required disclosure. Management recognizes that any controls and procedures, no matter how well designed and operated, can provide only reasonable assurance of achieving their objectives and management necessarily applies its judgment in evaluating the cost-benefit relationship of possible controls and procedures. Based on the evaluation of Varian Semiconductor’s disclosure controls and procedures as of October 2, 2009, Varian Semiconductor’s Chief Executive Officer and Chief Financial Officer concluded that, as of such date, Varian Semiconductor’s disclosure controls and procedures were effective at the reasonable assurance level.
Changes in Internal Control over Financial Reporting
No change in Varian Semiconductor’s internal control over financial reporting (as defined in Rules 13a-15(f) and 15d-15(f) under the Exchange Act) occurred during the fiscal quarter ended October 2, 2009 that has materially affected, or is reasonably likely to materially affect, Varian Semiconductor’s internal control over financial reporting.
41
Table of Contents
Management’s Report on Internal Control over Financial Reporting
Management of Varian Semiconductor is responsible for establishing and maintaining adequate internal control over financial reporting as defined in Rules 13a-15(f) and 15d-15(f) under the Exchange Act. Management, with the participation of the Chief Executive Officer and Chief Financial Officer, assessed the effectiveness of Varian Semiconductor’s internal control over financial reporting as of October 2, 2009. In their evaluation, management used the criteria set forth by the Committee of Sponsoring Organizations of the Treadway Commission, or COSO in Internal Control—Integrated Framework.
Based on management’s evaluation using the COSO criteria, management concludes that Varian Semiconductor maintained effective internal control over financial reporting as of October 2, 2009. This evaluation has been audited by PricewaterhouseCoopers LLP, an independent registered accounting firm, as stated in their report which appears herein.
| Item 9B. | Other Information. |
None.
42
Table of Contents
| Item 10. | Directors, Executive Officers and Corporate Governance. |
The response to this item is contained in part under the caption “Executive Officers of the Registrant” in Part I of this Annual Report on Form 10-K and in part in Varian Semiconductor’s Proxy Statement for the Annual Meeting of Stockholders to be held on February 8, 2010 (the “2010 Proxy Statement”) under the captions “Election of Directors,” “Information About Stockholder Proposals for 2011 Annual Meeting” and “Corporate Governance” which sections are incorporated herein by this reference.
The information required by this Item pursuant to Item 405 of Regulation S-K will appear under the heading “Section 16(a) Beneficial Ownership Reporting Compliance” in the 2010 Proxy Statement, which section is incorporated herein by reference.
Varian Semiconductor has adopted a written code of ethics that applies to our principal executive officer, principal financial officer, and principal accounting officer or controller, or persons performing similar functions. Our code of ethics, which also applies to our directors and all of our officers and employees, can be found on our web site, which is located at www.vsea.com, and is also an exhibit to this report. We intend to make all required disclosures concerning any amendments to or waivers from, our code of business conduct and ethics on our web site.
| Item 11. | Executive Compensation. |
The response to this item is contained in the 2010 Proxy Statement under the captions “Executive Compensation,” “Compensation Discussion and Analysis,” “Potential Payments Upon Termination or Change in Control,” “Director Compensation,” “Compensation Committee Interlocks and Insider Participation” and “Compensation Committee Report” which sections are incorporated herein by this reference.
| Item 12. | Security Ownership of Certain Beneficial Owners and Management and Related Stockholder Matters. |
The response to this item is contained in the 2010 Proxy Statement under the caption “Security Ownership of Certain Beneficial Owners” and “Equity Compensation Plan Information,” which sections are incorporated herein by this reference.
| Item 13. | Certain Relationships and Related Transactions, and Director Independence. |
The response to this item is contained in the 2010 Proxy Statement under the captions “Director Independence,” “Policies and Procedures for Related Person Transactions” and “Transactions with Related Persons,” which section is incorporated herein by this reference.
| Item 14. | Principal Accountant Fees and Services. |
The response to this item is contained in the 2010 Proxy Statement under the caption “Independent Registered Public Accounting Firm’s Fees,” which section is incorporated herein by this reference.
43
Table of Contents
| Item 15. | Exhibits and Financial Statement Schedules. |
The following documents are filed as part of this Annual Report on Form 10-K:
| (1) | Consolidated Financial Statements: (see index on page F-1 of this report) |
| • | Report of Independent Registered Public Accounting Firm |
| • | Consolidated Balance Sheets as of October 2, 2009 and October 3, 2008 |
| • | Consolidated Statements of Operations for fiscal years ended October 2, 2009, October 3, 2008 and September 28, 2007 |
| • | Consolidated Statements of Cash Flows for fiscal years ended October 2, 2009, October 3, 2008 and September 28, 2007 |
| • | Consolidated Statements of Stockholders’ Equity and Comprehensive Income (Loss) for fiscal years ended October 2, 2009, October 3, 2008 and September 28, 2007 |
| • | Notes to Consolidated Financial Statements |
| (2) | Consolidated Financial Statement Schedule: (see index on page F-1 of this report) |
The following financial statement schedule of Varian Semiconductor and its subsidiaries for fiscal years 2009, 2008 and 2007 is filed as a part of this Annual Report on Form 10-K and should be read in conjunction with the consolidated financial statements of Varian Semiconductor and its subsidiaries.
| • | Schedule II—Valuation and Qualifying Accounts |
All other required schedules are omitted because of the absence of conditions under which they are required or because the required information is given in the financial statements or the notes thereto.
| (3) | The list of Exhibits filed as a part of this Annual Report on Form 10-K are set forth in the Exhibit Index immediately preceding such Exhibits, and is incorporated herein by this reference. |
44
Table of Contents
SIGNATURES
Pursuant to the requirements of Section 13 or 15(d) of the Securities Exchange Act of 1934, the Registrant has duly caused this report to be signed on its behalf by the undersigned, thereunto duly authorized.
| VARIAN SEMICONDUCTOR EQUIPMENT ASSOCIATES, INC. | ||
| By: | /s/ ROBERT J. HALLIDAY | |
| Robert J. Halliday Executive Vice President, Chief Financial Officer and Treasurer | ||
Date: November 24, 2009
Pursuant to the requirements of the Securities Exchange Act of 1934, this report has been signed below by the following persons on behalf of the Registrant and in the capacities and on the dates indicated.
| Signature |
Title |
Date | ||
| /s/ GARY E. DICKERSON Gary E. Dickerson |
Chief Executive Officer (Principal Executive Officer) |
November 24, 2009 | ||
| /s/ ROBERT J. HALLIDAY Robert J. Halliday |
Executive Vice President, Chief Financial Officer and Treasurer (Principal Financial Officer) |
November 24, 2009 | ||
| /s/ THOMAS C. BAKER Thomas C. Baker |
Vice President, Finance (Principal Accounting Officer) |
November 24, 2009 | ||
| /s/ RICHARD A. AURELIO Richard A. Aurelio |
Chairman of the Board |
November 24, 2009 | ||
| /s/ ROBERT W. DUTTON Robert W. Dutton |
Director |
November 24, 2009 | ||
| /s/ DENNIS G. SCHMAL Dennis G. Schmal |
Director |
November 24, 2009 | ||
| /s/ BIN-MING TSAI Bin-Ming Tsai |
Director |
November 24, 2009 | ||
| /s/ XUN CHEN Xun Chen |
Director |
November 24, 2009 | ||
45
Table of Contents
EXHIBIT INDEX
| Incorporated by Reference | ||||||||||
| Exhibit No. |
Description |
Form |
SEC Filing Date |
Exhibit Number |
Filed with this 10-K | |||||
| 2.1 | Distribution Agreement among Varian Associates, Inc., Varian Semiconductor Equipment Associates, Inc. and Varian, Inc. dated as of January 14, 1999. | 10-12(g) | 02/12/1999 | 2.1 | ||||||
| 3.1 | Restated Certificate of Incorporation of Varian Semiconductor Equipment Associates, Inc. | 10-12(g) | 02/12/1999 | 3.1 | ||||||
| 3.2 | By-Laws of Varian Semiconductor Equipment Associates, Inc. | 10-12(g)/a | 03/08/1999 | 3.2 | ||||||
| 3.3 | Amendment to By-Laws of Varian Semiconductor Equipment Associates, Inc. | 8-K | 03/04/2009 | 3.1 | ||||||
| 4.1 | Specimen Common Stock Certificate. | 10-12(g)/a | 03/08/1999 | 4.1 | ||||||
| 4.2 | Rights Agreement between First Chicago Trust Company of New York and the Registrant, dated as of February 19, 1999. | 10-12(g)/a | 03/08/1999 | 4.2 | ||||||
| 4.3 | Amendment dated as of October 15, 2001 to the Rights Agreement between First Chicago Trust Company of New York and Registrant, dated February 19, 1999, to appoint EquiServe Trust Company, N.A. | 10-K | 12/20/2001 | 10.12 | ||||||
| 4.4 | Amendment No. 2 dated as of October 25, 2004 to the Rights Agreement (as amended) between EquiServe Trust Company, N.A. and the Registrant. | 10-K | 12/14/2004 | 4.4 | ||||||
| 10.1 | Form of Employee Benefits Allocation Agreement among Varian Associates, Inc., Varian Semiconductor Equipment Associates, Inc. and Varian, Inc. | 10-12(g) | 02/12/1999 | 10.1 | ||||||
| 10.2 | Supplemental Retirement Plan of Varian Semiconductor Equipment Associates, Inc. 2005 Restatement. | 10-Q | 02/10/2009 | 10.1 | ||||||
| 10.3 | Form of Intellectual Property Agreement among Varian Associates, Inc., Varian Semiconductor Equipment Associates, Inc., and Varian, Inc. | 10-12(g) | 02/12/1999 | 10.2 | ||||||
| 10.4 | Form of Tax Sharing Agreement among Varian Associates, Inc., Varian Semiconductor Equipment Associates, Inc. and Varian, Inc. | 10-12(g) | 02/12/1999 | 10.3 | ||||||
| 10.5 | Form of Transition Services Agreement among Varian Associates, Inc., Varian Semiconductor Equipment Associates, Inc. and Varian, Inc. | 10-12(g) | 02/12/1999 | 10.4 | ||||||
| 10.6 | Form of Change in Control Agreement for Chief Executive Officer and Chairman of the Board. | 8-K | 10/15/2004 | 10.3 | ||||||
| 10.7 | Form of Indemnity Agreement with Directors and Executive Officers. | 10-12(g)/a | 03/08/1999 | 10.8 | ||||||
46
Table of Contents
| Incorporated by Reference | ||||||||||
| Exhibit No. |
Description |
Form |
SEC Filing Date |
Exhibit Number |
Filed with this 10-K | |||||
| 10.8 | Varian Semiconductor Equipment Associates, Inc. Amended and Restated 2006 Stock Incentive Plan | 8-K | 03/13/2006 | 10.6 | ||||||
| 10.9 | Varian Semiconductor Equipment Associates, Inc. 2006 Management Incentive Plan. | 10-K | 12/07/2006 | 10.8 | ||||||
| 10.10 | Varian Semiconductor Equipment Associates, Inc. Deferred Compensation Plan | 10-K | 12/07/2006 | 10.9 | ||||||
| 10.11 | Varian Semiconductor Equipment Associates, Inc. Employee Stock Purchase Plan. | 10-K | 12/20/2001 | 10.11 | ||||||
| 10.12 | Purchase and Sale Agreement made as of November 27, 2002, by and between Berkshire-Newburyport Limited Partnership and Varian Semiconductor Equipment Associates, Inc. | 10-Q | 02/05/2003 | 10.1 | ||||||
| 10.13 | First Amendment to Purchase and Sale Agreement, dated as of January 6, 2003, by and between Berkshire-Newburyport Limited Partnership and Varian Semiconductor Equipment Associates, Inc. | 10-Q | 02/05/2003 | 10.2 | ||||||
| 10.14 | Second Amendment to Purchase and Sale Agreement, dated as of January 28, 2003, by and between Berkshire-Newburyport Limited Partnership and Varian Semiconductor Equipment Associates, Inc. | 10-Q | 02/05/2003 | 10.3 | ||||||
| 10.15 | Form of Change in Control Agreement for Chief Financial Officer. | 8-K | 10/15/2004 | 10.4 | ||||||
| 10.16 | Form of Change in Control Agreement for Certain Designated Executives. | 8-K | 10/15/2004 | 10.5 | ||||||
| 10.17 | Form of Nonstatutory Stock Option Agreement for Directors | 8-K | 03/13/2006 | 10.1 | ||||||
| 10.18 | Form of Nonstatutory Stock Option Agreement for Officers | 8-K | 03/13/2006 | 10.2 | ||||||
| 10.19 | Form of Nonstatutory Stock Option Agreement for Employees | 8-K | 03/13/2006 | 10.3 | ||||||
| 10.20 | Form of Restricted Stock Agreement for Officers | 8-K | 03/13/2006 | 10.4 | ||||||
| 10.21 | Form of Restricted Stock Agreement for Employees | 8-K | 03/13/2006 | 10.5 | ||||||
| 10.22 | Form of Deferred Stock Units Agreement for Directors | 8-K | 03/17/2006 | 10.1 | ||||||
| 10.23 | Offer Letter from the Registrant to Gary E. Dickerson, as amended. | 10-Q | 08/05/2005 | 10.2 | ||||||
| 10.24 | Letter Agreement, dated as of January 2, 2006 between Richard A. Aurelio and Varian Semiconductor Equipment Associates, Inc. | 8-K | 01/03/2006 | 10.2 | ||||||
| 10.25 | Form of Amendment to all Change in Control Agreements | 10-K | 12/13/2005 | 10.22 | ||||||
| 10.26 | Amendment to Change in Control Agreement for Gary E. Dickerson | 10-Q | 02/10/2009 | 10.2 | ||||||
47
Table of Contents
| Incorporated by Reference | ||||||||||
| Exhibit No. |
Description |
Form |
SEC Filing Date |
Exhibit Number |
Filed with this 10-K | |||||
| 10.27 | Amendment to Change in Control Agreement for Robert J. Halliday | 10-Q | 02/10/2009 | 10.3 | ||||||
| 10.28 | Amendment to Change in Control Agreement for Yong-Kil Kim | 10-Q | 02/10/2009 | 10.4 | ||||||
| 10.29 | Amendment to Change in Control Agreement for Thomas C. Baker | 10-Q | 02/10/2009 | 10.5 | ||||||
| 10.30 | Form of Restricted Stock Agreement for Officers with Performance Vesting | 10-K | 12/07/2006 | 10.30 | ||||||
| 10.31 | Amendment, dated February 8, 2007, to Letter Agreement between Richard A. Aurelio and Varian Semiconductor Equipment Associates, Inc., dated as of January 2, 2006 | 10-K | 11/21/2007 | 10.30 | ||||||
| 10.32 | Credit Agreement, dated as of May 23, 2008, certain lenders named therein, JPMorgan Chase Bank, N.A. as administrative agent and Varian Semiconductor Equipment Associates, Inc. | 8-K | 05/23/2008 | 10.1 | ||||||
| 10.33 | Form of Promissory Note from Varian Semiconductor Equipment Associates, Inc. to Lender | 8-K | 05/23/2008 | 10.2 | ||||||
| 10.34 | Form of Nonstatutory Stock Option Agreement for Officers (effective as of August 15, 2008) | 8-K | 08/20/2008 | 10.1 | ||||||
| 10.35 | Form of Restricted Stock Agreement for Employees including Officers (effective as of August 15, 2008) | 8-K | 08/20/2008 | 10.2 | ||||||
| 10.36 | Second Amendment to Varian Semiconductor Equipment Associates, Inc. Amended and Restated 2006 Stock Incentive Plan | DEF 14A | 12/17/2008 | |||||||
| 14.1 | Code of Business Conduct and Ethics | 10-K | 12/07/2006 | 14.1 | ||||||
| 21.1 | Subsidiaries of the Registrant. | 10-K | 21.1 | X | ||||||
| 23.1 | Consent of PricewaterhouseCoopers LLP, Independent Registered Public Accounting Firm. | 10-K | 23.1 | X | ||||||
| 31.1 | Certification of the Chief Executive Officer pursuant to Section 302 of the Sarbanes-Oxley Act of 2002. | 10-K | 31.1 | X | ||||||
| 31.2 | Certification of the Chief Financial Officer pursuant to Section 302 of the Sarbanes-Oxley Act of 2002. | 10-K | 31.2 | X | ||||||
| 32.1 | Certification of the Chief Executive Officer pursuant to 18 U.S.C. Section 1350, as adopted pursuant to Section 906 of the Sarbanes-Oxley Act of 2002. | 10-K | 32.1 | X | ||||||
| 32.2 | Certification of the Chief Financial Officer pursuant to 18 U.S.C. Section 1350, as adopted pursuant to Section 906 of the Sarbanes-Oxley Act of 2002. | 10-K | 32.2 | X | ||||||
48
Table of Contents
VARIAN SEMICONDUCTOR EQUIPMENT ASSOCIATES, INC.
INDEX TO FINANCIAL STATEMENTS AND SCHEDULES
The following financial statements of the Registrant and its subsidiaries are required to be included in Item 8:
| Page | ||
| F-2 | ||
| Consolidated Balance Sheets as of October 2, 2009 and October 3, 2008 |
F-3 | |
| F-4 | ||
| F-5 | ||
| F-6 | ||
| F-7 | ||
| The following financial statement schedule of the Registrant and its subsidiaries for fiscal years 2009, 2008 and 2007 should be read in conjunction with the Consolidated Financial Statements of the Registrant and its subsidiaries: |
||
| Financial Statement Schedule |
||
| S-1 | ||
All other required schedules are omitted because of the absence of conditions under which they are required or because the required information is given in the financial statements or the notes thereto.
F-1
Table of Contents
Report of Independent Registered Public Accounting Firm
To the Board of Directors and Stockholders of
Varian Semiconductor Equipment Associates, Inc.:
In our opinion, the consolidated financial statements listed in the index appearing under Item 15(1) present fairly, in all material respects, the financial position of Varian Semiconductor Equipment Associates, Inc. and its subsidiaries (the “Company”) at October 2, 2009 and October 3, 2008, and the results of their operations and their cash flows for each of the three years in the period ended October 2, 2009 in conformity with accounting principles generally accepted in the United States of America. In addition, in our opinion, the financial statement schedule listed in the index appearing under Item 15(2) presents fairly, in all material respects, the information set forth therein when read in conjunction with the related consolidated financial statements. Also in our opinion, the Company maintained, in all material respects, effective internal control over financial reporting as of October 2, 2009, based on criteria established in Internal Control—Integrated Framework issued by the Committee of Sponsoring Organizations of the Treadway Commission (COSO). The Company’s management is responsible for these financial statements and financial statement schedule, for maintaining effective internal control over financial reporting and for its assessment of the effectiveness of internal control over financial reporting, included in Management’s Report on Internal Control over Financial Reporting appearing under Item 9A. Our responsibility is to express opinions on these financial statements, on the financial statement schedule, and on the Company’s internal control over financial reporting based on our integrated audits. We conducted our audits in accordance with the standards of the Public Company Accounting Oversight Board (United States). Those standards require that we plan and perform the audits to obtain reasonable assurance about whether the financial statements are free of material misstatement and whether effective internal control over financial reporting was maintained in all material respects. Our audits of the financial statements included examining, on a test basis, evidence supporting the amounts and disclosures in the financial statements, assessing the accounting principles used and significant estimates made by management, and evaluating the overall financial statement presentation. Our audit of internal control over financial reporting included obtaining an understanding of internal control over financial reporting, assessing the risk that a material weakness exists, and testing and evaluating the design and operating effectiveness of internal control based on the assessed risk. Our audits also included performing such other procedures as we considered necessary in the circumstances. We believe that our audits provide a reasonable basis for our opinions.
As discussed in Note 2 to the consolidated financial statements, the Company changed the manner in which it accounts for uncertain tax positions in fiscal year 2008 and the manner in which it accounts for fair value measurements in fiscal year 2009.
A company’s internal control over financial reporting is a process designed to provide reasonable assurance regarding the reliability of financial reporting and the preparation of financial statements for external purposes in accordance with generally accepted accounting principles. A company’s internal control over financial reporting includes those policies and procedures that (i) pertain to the maintenance of records that, in reasonable detail, accurately and fairly reflect the transactions and dispositions of the assets of the company; (ii) provide reasonable assurance that transactions are recorded as necessary to permit preparation of financial statements in accordance with generally accepted accounting principles, and that receipts and expenditures of the company are being made only in accordance with authorizations of management and directors of the company; and (iii) provide reasonable assurance regarding prevention or timely detection of unauthorized acquisition, use, or disposition of the company’s assets that could have a material effect on the financial statements.
Because of its inherent limitations, internal control over financial reporting may not prevent or detect misstatements. Also, projections of any evaluation of effectiveness to future periods are subject to the risk that controls may become inadequate because of changes in conditions, or that the degree of compliance with the policies or procedures may deteriorate.
/s/ PRICEWATERHOUSECOOPERS LLP
Boston, Massachusetts
November 24, 2009
F-2
Table of Contents
VARIAN SEMICONDUCTOR EQUIPMENT ASSOCIATES, INC.
CONSOLIDATED BALANCE SHEETS
| October 2, 2009 |
October 3, 2008 |
|||||||
| (Amounts in thousands, except share data) |
||||||||
| ASSETS | ||||||||
| Current assets |
||||||||
| Cash and cash equivalents |
$ | 192,148 | $ | 139,679 | ||||
| Short-term investments |
44,043 | 68,996 | ||||||
| Accounts receivable, net |
115,002 | 128,904 | ||||||
| Inventories |
100,764 | 165,201 | ||||||
| Deferred income taxes |
19,601 | 28,599 | ||||||
| Other current assets |
22,188 | 24,447 | ||||||
| Total current assets |
493,746 | 555,826 | ||||||
| Long-term investments |
86,439 | 69,491 | ||||||
| Property, plant and equipment, net |
65,785 | 66,636 | ||||||
| Goodwill |
12,280 | 12,280 | ||||||
| Long-term deferred tax assets |
5,325 | — | ||||||
| Other assets |
2,664 | 2,609 | ||||||
| Total assets |
$ | 666,239 | $ | 706,842 | ||||
| LIABILITIES AND STOCKHOLDERS’ EQUITY | ||||||||
| Current liabilities |
||||||||
| Current portion of long-term debt |
$ | 610 | $ | 558 | ||||
| Accounts payable |
26,449 | 29,072 | ||||||
| Accrued expenses |
22,812 | 41,745 | ||||||
| Income taxes payable |
1,820 | 4,103 | ||||||
| Product warranty |
3,943 | 7,661 | ||||||
| Deferred revenue |
27,098 | 32,285 | ||||||
| Total current liabilities |
82,732 | 115,424 | ||||||
| Long-term accrued expenses and other liabilities |
66,285 | 65,064 | ||||||
| Deferred income taxes |
— | 3,951 | ||||||
| Long-term debt |
1,592 | 2,203 | ||||||
| Total liabilities |
150,609 | 186,642 | ||||||
| Commitments, contingencies and guarantees (Note 23) |
||||||||
| Stockholders’ equity |
||||||||
| Preferred stock, $0.01 par value; 5,000,000 shares authorized; none issued or outstanding |
— | — | ||||||
| Common stock, $0.01 par value; 150,000,000 shares authorized; 94,519,926 shares issued and 72,804,096 outstanding at October 2, 2009; 93,535,106 shares issued and 71,819,276 outstanding at October 3, 2008 |
945 | 935 | ||||||
| Capital in excess of par value |
612,930 | 582,270 | ||||||
| Less: Cost of 21,715,830 shares of common stock held in treasury at October 2, 2009 and October 3, 2008, respectively |
(714,877 | ) | (714,877 | ) | ||||
| Retained earnings |
616,051 | 654,049 | ||||||
| Accumulated other comprehensive income (loss) |
581 | (2,177 | ) | |||||
| Total stockholders’ equity |
515,630 | 520,200 | ||||||
| Total liabilities and stockholders’ equity |
$ | 666,239 | $ | 706,842 | ||||
The accompanying notes to the consolidated financial statements are an integral part of these statements.
F-3
Table of Contents
VARIAN SEMICONDUCTOR EQUIPMENT ASSOCIATES, INC.
CONSOLIDATED STATEMENTS OF OPERATIONS
| Fiscal Year Ended | ||||||||||||
| October 2, 2009 |
October 3, 2008 |
September 28, 2007 |
||||||||||
| (Amounts in thousands, except per share data) | ||||||||||||
| Revenue |
||||||||||||
| Product |
$ | 309,230 | $ | 752,629 | $ | 961,329 | ||||||
| Service |
52,764 | 81,371 | 86,062 | |||||||||
| Royalty and license |
87 | 61 | 7,473 | |||||||||
| Total revenue |
362,081 | 834,061 | 1,054,864 | |||||||||
| Cost of revenue |
||||||||||||
| Product |
185,475 | 386,713 | 511,137 | |||||||||
| Service |
33,938 | 51,582 | 54,803 | |||||||||
| Total cost of revenue |
219,413 | 438,295 | 565,940 | |||||||||
| Gross profit |
142,668 | 395,766 | 488,924 | |||||||||
| Operating expenses |
||||||||||||
| Research, development and engineering |
80,063 | 111,240 | 104,025 | |||||||||
| Marketing, general and administrative |
96,193 | 130,672 | 128,055 | |||||||||
| Restructuring |
9,159 | 1,607 | — | |||||||||
| Total operating expenses |
185,415 | 243,519 | 232,080 | |||||||||
| Operating (loss) income |
(42,747 | ) | 152,247 | 256,844 | ||||||||
| Interest income |
5,283 | 10,505 | 20,792 | |||||||||
| Interest expense |
(929 | ) | (1,724 | ) | (1,268 | ) | ||||||
| Other (expense) income, net |
(1,088 | ) | (117 | ) | 300 | |||||||
| (Loss) income before income taxes |
(39,481 | ) | 160,911 | 276,668 | ||||||||
| (Benefit from) provision for income taxes |
(1,483 | ) | 61,395 | 132,259 | ||||||||
| Net (loss) income |
$ | (37,998 | ) | $ | 99,516 | $ | 144,409 | |||||
| Weighted average shares outstanding—basic |
72,321 | 73,318 | 80,151 | |||||||||
| Weighted average shares outstanding—diluted |
72,321 | 74,719 | 82,220 | |||||||||
| Net (loss) income per share—basic |
$ | (0.53 | ) | $ | 1.36 | $ | 1.80 | |||||
| Net (loss) income per share—diluted |
$ | (0.53 | ) | $ | 1.33 | $ | 1.76 | |||||
The accompanying notes to the consolidated financial statements are an integral part of these statements.
F-4
Table of Contents
VARIAN SEMICONDUCTOR EQUIPMENT ASSOCIATES, INC.
CONSOLIDATED STATEMENTS OF CASH FLOWS
| Fiscal Year End | ||||||||||||
| October 2, 2009 |
October 3, 2008 |
September 28, 2007 |
||||||||||
| (Amounts in thousands) | ||||||||||||
| Cash flow from operating activities: |
||||||||||||
| Net (loss) income |
$ | (37,998 | ) | $ | 99,516 | $ | 144,409 | |||||
| Adjustments to reconcile net (loss) income to net cash provided by operating activities: |
||||||||||||
| Depreciation and amortization |
15,603 | 17,106 | 14,370 | |||||||||
| Amortization of investment premiums |
611 | 412 | 88 | |||||||||
| Deferred income taxes |
(278 | ) | 3,195 | 1,620 | ||||||||
| Stock-based compensation |
22,140 | 23,107 | 19,651 | |||||||||
| Tax benefit from stock-based compensation |
554 | 2,629 | 21,721 | |||||||||
| Excess tax benefits from stock-based compensation |
(986 | ) | (2,499 | ) | (17,591 | ) | ||||||
| Changes in assets and liabilities: |
||||||||||||
| Accounts receivable |
16,756 | 61,341 | (61,844 | ) | ||||||||
| Inventories |
56,135 | 4,915 | (51,600 | ) | ||||||||
| Other current assets |
2,259 | 1,563 | (7,908 | ) | ||||||||
| Accounts payable |
(2,678 | ) | (20,619 | ) | 3,815 | |||||||
| Accrued expenses |
(17,595 | ) | 5,212 | 31,566 | ||||||||
| Product warranty |
(4,263 | ) | (4,706 | ) | 3,054 | |||||||
| Deferred revenue |
(9,659 | ) | (23,621 | ) | 8,124 | |||||||
| Other |
1,073 | 438 | (1,199 | ) | ||||||||
| Net cash provided by operating activities |
41,674 | 167,989 | 108,276 | |||||||||
| Cash flows from investing activities: |
||||||||||||
| Purchase of property, plant and equipment |
(7,095 | ) | (9,475 | ) | (10,968 | ) | ||||||
| Proceeds from sales of investments |
7,773 | 21,599 | 28,154 | |||||||||
| Proceeds from maturities of investments |
74,317 | 128,871 | 176,081 | |||||||||
| Purchase of investments |
(70,517 | ) | (107,730 | ) | (95,553 | ) | ||||||
| Net cash provided by investing activities |
4,478 | 33,265 | 97,714 | |||||||||
| Cash flows from financing activities: |
||||||||||||
| Proceeds from the issuance of common stock upon exercise of options and issuance of stock under the employee stock purchase plan |
7,976 | 7,338 | 54,159 | |||||||||
| Excess tax benefits from stock-based compensation |
986 | 2,499 | 17,591 | |||||||||
| Repurchase of common stock |
— | (179,454 | ) | (426,513 | ) | |||||||
| Repayment of long-term debt |
(559 | ) | (510 | ) | (465 | ) | ||||||
| Net cash provided by (used in) financing activities |
8,403 | (170,127 | ) | (355,228 | ) | |||||||
| Effects of exchange rates on cash |
(2,086 | ) | (962 | ) | (139 | ) | ||||||
| Net increase (decrease) in cash and cash equivalents |
52,469 | 30,165 | (149,377 | ) | ||||||||
| Cash and cash equivalents at beginning of period |
139,679 | 109,514 | 258,891 | |||||||||
| Cash and cash equivalents at end of period |
$ | 192,148 | $ | 139,679 | $ | 109,514 | ||||||
| Supplemental information to the cash flow: |
||||||||||||
| Cash payments for income taxes, net of refunds |
$ | 515 | $ | 39,161 | $ | 95,707 | ||||||
| Cash payments for interest |
$ | 509 | $ | 498 | $ | 358 | ||||||
| Non-cash transfers of engineering and demonstration tools from inventory to equipment, net |
$ | 8,668 | $ | 1,423 | $ | 15,242 | ||||||
The accompanying notes to the consolidated financial statements are an integral part of these statements.
F-5
Table of Contents
VARIAN SEMICONDUCTOR EQUIPMENT ASSOCIATES, INC.
CONSOLIDATED STATEMENTS OF STOCKHOLDERS’ EQUITY AND COMPREHENSIVE INCOME (LOSS)
| Common Shares Outstanding |
Common Stock |
Capital in Excess of Par Value |
Treasury Stock |
Retained Earnings |
Other Comprehensive Income (Loss) |
Total Stockholders’ Equity |
|||||||||||||||||||
| (Shares and amounts in thousands) | |||||||||||||||||||||||||
| Balance at Fiscal Year End 2006 |
83,341 | $ | 890 | $ | 453,710 | $ | (108,910 | ) | $ | 411,828 | $ | (976 | ) | $ | 756,542 | ||||||||||
| Components of comprehensive income: |
|||||||||||||||||||||||||
| Net income |
— | — | — | — | 144,409 | — | 144,409 | ||||||||||||||||||
| Unrealized gain on cash flow hedging instruments |
— | — | — | — | — | 335 | 335 | ||||||||||||||||||
| Reclassification adjustment for realized gains on cash flow hedging instruments included in net income |
— | — | — | — | — | (548 | ) | (548 | ) | ||||||||||||||||
| Unrealized loss on investments |
— | — | — | — | — | (787 | ) | (787 | ) | ||||||||||||||||
| Reclassification adjustment for realized losses on investments included in net income |
— | — | — | — | — | 27 | 27 | ||||||||||||||||||
| Total compehensive income |
— | — | — | — | — | — | 143,436 | ||||||||||||||||||
| Adjustment for unfunded benefit obligations (upon initial adoption of new accounting principle), net of tax |
— | — | — | — | — | 776 | 776 | ||||||||||||||||||
| Acquisition of treasury shares |
(11,343 | ) | — | — | (426,513 | ) | — | — | (426,513 | ) | |||||||||||||||
| Stock-based compensation expense |
— | — | 19,651 | — | — | 19,651 | |||||||||||||||||||
| Issuance of common stock under stock plans, including income tax benefit (6) |
3,754 | 37 | 75,843 | — | — | — | 75,880 | ||||||||||||||||||
| Balance at Fiscal Year End 2007 |
75,752 | 927 | 549,204 | (535,423 | ) | 556,237 | (1,173 | ) | $ | 569,772 | |||||||||||||||
| Components of comprehensive income: |
|||||||||||||||||||||||||
| Net income |
— | — | — | — | 99,516 | — | 99,516 | ||||||||||||||||||
| Unrealized gain on cash flow hedging instruments, net of |
— | — | — | — | — | 460 | 460 | ||||||||||||||||||
| Reclassification adjustment for realized gains on cash flow hedging instruments included in net income, net of |
— | — | — | — | — | (389 | ) | (389 | ) | ||||||||||||||||
| Unrealized loss on investments, net of tax (3) |
— | — | — | — | — | (1,469 | ) | (1,469 | ) | ||||||||||||||||
| Reclassification adjustment for realized gains on investments included in net income, net of tax (4) |
— | — | — | — | — | (235 | ) | (235 | ) | ||||||||||||||||
| Actuarial gain on pension plan, net of tax (5) |
— | — | — | — | — | 629 | 629 | ||||||||||||||||||
| Total comprehensive income |
— | — | — | — | — | — | 98,512 | ||||||||||||||||||
| Adjustment for uncertainty in income taxes (upon initial adoption of new accounting principle), net of tax |
— | — | — | — | (1,704 | ) | — | (1,704 | ) | ||||||||||||||||
| Acquisition of treasury shares |
(4,751 | ) | — | — | (179,454 | ) | — | — | (179,454 | ) | |||||||||||||||
| Stock-based compensation expense |
— | — | 23,107 | — | — | — | 23,107 | ||||||||||||||||||
| Issuance of common stock under stock plans, including income tax benefit (6) |
818 | 8 | 9,959 | — | — | — | 9,967 | ||||||||||||||||||
| Balance at Fiscal Year End 2008 |
71,819 | 935 | 582,270 | (714,877 | ) | 654,049 | (2,177 | ) | 520,200 | ||||||||||||||||
| Components of comprehensive loss: |
|||||||||||||||||||||||||
| Net loss |
— | — | — | — | (37,998 | ) | — | (37,998 | ) | ||||||||||||||||
| Unrealized loss on cash flow hedging instruments net of |
— | — | — | — | — | (1,405 | ) | (1,405 | ) | ||||||||||||||||
| Reclassification adjustment for realized losses on cash flow hedging instruments included in net loss, net of tax (2) |
— | — | — | — | — | 1,225 | 1,225 | ||||||||||||||||||
| Unrealized gain on investments, net of tax (3) |
— | — | — | — | — | 2,539 | 2,539 | ||||||||||||||||||
| Reclassification adjustment for realized losses on investments included in net loss, net of tax (4) |
— | — | — | — | — | 524 | 524 | ||||||||||||||||||
| Actuarial loss on pension plan, net of tax (5) |
— | — | — | — | — | (125 | ) | (125 | ) | ||||||||||||||||
| Total comprehensive loss |
— | — | — | — | — | — | (35,240 | ) | |||||||||||||||||
| Acquisition of treasury shares |
— | — | — | — | — | — | — | ||||||||||||||||||
| Stock-based compensation expense |
— | — | 22,140 | — | — | — | 22,140 | ||||||||||||||||||
| Issuance of common stock under stock plans, including income tax benefit (6) |
985 | 10 | 8,520 | — | — | — | 8,530 | ||||||||||||||||||
| Balance at Fiscal Year End 2009 |
72,804 | 945 | 612,930 | (714,877 | ) | 616,051 | 581 | $ | 515,630 | ||||||||||||||||
| (1) | Net of $(722) thousand and $317 thousand of tax in fiscal years 2009 and 2008, respectively. |
| (2) | Net of $(644) thousand and $277 thousand of tax in fiscal years 2009 and 2008, respectively. |
| (3) | Net of $1,544 thousand and $1,051 thousand of tax in fiscal years 2009 and 2008, respectively. |
| (4) | Net of $(21) thousand and $168 thousand of tax in fiscal years 2009 and 2008, respectively. |
| (5) | Net of $(69) thousand and $432 thousand of tax in fiscal years 2009 and 2008, respectively. |
| (6) | $554 thousand, $2,629 thousand and $21,721 thousand of income tax benefit in fiscal years 2009, 2008 and 2007, respectively. |
The accompanying notes to the consolidated financial statements are an integral part of these statements.
F-6
Table of Contents
VARIAN SEMICONDUCTOR EQUIPMENT ASSOCIATES, INC.
NOTES TO THE CONSOLIDATED FINANCIAL STATEMENTS
Note 1. Company
Varian Semiconductor Equipment Associates, Inc. (“Varian Semiconductor,” the “Company,” “we,” “our,” or “us”) designs, manufactures, markets and services semiconductor processing equipment used in the fabrication of integrated circuits to customers located both in the United States, or U.S., and in international markets. We face risk factors similar to all companies in the semiconductor manufacturing equipment market including, but not limited to, competition, market downturn, technological change, international operations and related foreign currency risks and the ability to recruit and retain key employees.
We evaluated subsequent events up to and including November 24, 2009, the date these financial statements were issued.
Note 2. Summary of Significant Accounting Policies
Revisions
During the quarter ended October 2, 2009, we identified certain instances dating back to fiscal year 1999 in which deferred income taxes and long-term tax liabilities were not properly recorded in our financial statements. These adjustments individually and in the aggregate were not material to our financial statements for all periods impacted. We have revised our historical financial statements to properly reflect these adjustments.
We recorded adjustments to increase deferred tax assets or reduce long-term tax liabilities and decrease income tax expense, resulting in an increase of net income, or reduction in net loss, by $1.8 million, $1.1 million and $2.2 million for the three months ended July 3, 2009 and fiscal years 2008 and 2007, respectively.
We will continue to make corresponding adjustments as described above to other prior periods as appropriate when future financial statements are filed with the Securities and Exchange Commission, or SEC.
Fiscal Year
Our fiscal year is a 52- to 53-week period that ends on the Friday nearest September 30. Fiscal year 2009 is comprised of a 52-week period ended on October 2, 2009. Fiscal year 2008 is comprised of a 53-week period ended on October 3, 2008. Fiscal year 2007 is comprised of a 52-week period ended on September 28, 2007.
Principles of Consolidation
The consolidated financial statements include our accounts and those of our wholly owned subsidiaries. All material intercompany accounts and transactions are eliminated in consolidation.
Use of Estimates
The preparation of financial statements in conformity with accounting principles generally accepted in the U.S. requires management to make estimates and assumptions that affect the amounts reported in the financial statements and accompanying notes. On an ongoing basis, we evaluate our estimates and assumptions including, but not limited to, deferred revenue, loss contingencies, warranty accruals, the reserve for excess and obsolete inventory, income taxes payable, deferred tax assets, stock-based compensation, and allowance for doubtful accounts. Actual results may differ from those estimates.
Revenue Recognition
Product revenue includes established products, new products, upgrades and spare parts.
F-7
Table of Contents
VARIAN SEMICONDUCTOR EQUIPMENT ASSOCIATES, INC.
NOTES TO THE CONSOLIDATED FINANCIAL STATEMENTS—(Continued)
We recognize revenue from product sales upon shipment, provided title and risk of loss has passed to the customer, evidence of an arrangement exists, fees are contractually fixed or determinable, collectability is reasonably assured and there are no uncertainties regarding customer acceptance.
For established and new products, a portion of the total purchase price is typically not due until installation occurs and the customer accepts the product. For established products, the lesser of the amount allocated to the equipment or the contractual amount due upon delivery is recorded as product revenue upon delivery. The amount deferred is recognized as revenue upon customer acceptance. For new products, revenue allocated to the equipment is recognized upon customer acceptance. Spare parts and upgrade sales are recognized as revenue upon the later of delivery or the transfer of title and risk of loss to the customer.
We generally follow predetermined criteria for changing the classification of a new product to an established product. We generally recognize products as established after demonstrating success in achieving customer acceptance of the same tool type and specification, for the same or similar application. In most circumstances, once a new product achieves the predetermined criteria, the product is considered established. Furthermore, prior installation costs on the tool type can also influence the evaluation of tool maturity on a going forward basis.
Products are classified as established if the installation process and the post-delivery acceptance provisions are deemed routine, and there is a demonstrated history of achieving the predetermined established product criteria. The majority of products are designed and manufactured to meet contractual customer specifications, and established products must have been demonstrated to meet customer specifications before shipment.
Service revenue includes revenue from maintenance and service contracts, extended warranties, paid service and system installation services. Revenue related to maintenance and service contracts is recognized ratably over the duration of the contracts. Extended warranty revenue is deferred and recognized ratably over the applicable warranty term. Revenue related to paid service is recorded when earned and revenue related to installation is recorded upon fulfillment of the service obligation and customer acceptance. It generally takes approximately three to six weeks for our technicians to complete the installation of our products and perform tests agreed to with customers. Certain customers formally document their acceptance of our products at this time. Other customers elect to perform additional internal testing prior to formal acceptance, and this process generally takes eight to twelve weeks.
Royalty and license revenue is recognized when contractual obligations are met, and in the case of royalties, upon receipt of a royalty report from the customer, evidence of an arrangement exists, fees are fixed or determinable and collection is reasonably assured.
Our transactions frequently include the sale of systems and services under multiple element arrangements. Revenue under these arrangements is allocated to all elements, except systems, based upon the fair value of those elements. All elements may not be delivered and recognized as revenue during the same period. In such cases, we defer the fair value of the undelivered element until that element is delivered. The amount allocated to installation labor is based upon hourly rates at the estimated time to complete the service. The fair value of all other elements is based upon the price charged when these elements, or similar elements, are sold separately and unaccompanied by other elements. The amount of revenue allocated to systems is done on a residual method basis. Under this method, the total value of the arrangement is allocated first to the undelivered elements based on their fair values, with the remainder being allocated to systems revenue. If fair value cannot be determined for any of the undelivered elements, the entire value of the arrangement is deferred.
F-8
Table of Contents
VARIAN SEMICONDUCTOR EQUIPMENT ASSOCIATES, INC.
NOTES TO THE CONSOLIDATED FINANCIAL STATEMENTS—(Continued)
Deferred Revenue
Deferred revenue includes customer advances and amounts that have been billed per the contractual terms but have not been recognized as revenue. We also defer the fair value of extended warranties bundled with equipment sales as deferred revenue. Deferred revenue for extended warranties is recognized ratably over the applicable warranty term, which generally is from 13 to 24 months from the date the customer accepts the products.
Evaluation Tools
We periodically supply evaluation tools to potential new customers, usually for a period of six months to one year. While the tool is at the customer’s semiconductor manufacturing factory, or fab, we work closely with the customer on complex processes to qualify the tool for that particular customer’s requirements. These qualification costs are included in marketing, general and administrative expenses in the period incurred. We generally reduce the carrying value of the evaluation tool ratably over a period of four years until it is determined that a sale may likely result. This cost is recorded as a component of marketing, general and administrative expenses and the carrying value of the evaluation tool is included in inventory. Customer evaluations are often successful and upon fulfillment of all four revenue recognition criteria, we recognize the revenue from the evaluation tool and remaining tool cost through revenue and cost of product revenue, respectively.
Stock-based Compensation
Compensation cost for stock-based awards exchanged for employee and director services is measured at grant date and is based on the fair value of the award. The straight-line method is applied to all grants with service conditions, while the graded vesting method is applied to all grants with both service and performance conditions.
The choice of a valuation technique and the approach utilized to develop the underlying assumptions for that technique, involve significant judgments. These judgments reflect management’s assessment of the most accurate method of valuing the stock options we issue based on historical experience, knowledge of current conditions, and beliefs of what could occur in the future given available information. Our judgments could change over time if the facts underlying these assumptions change, or as additional information becomes available. Any change in judgments could have a material impact on our financial statements. We believe that these estimates incorporate all relevant information and represent a reasonable approximation in light of the difficulties involved in valuing non-traded stock options.
Cash, Cash Equivalents and Investments
We consider currency on hand, demand deposits and all highly liquid investments with a remaining maturity of three months or less at the date of purchase to be cash and cash equivalents. The carrying amounts of cash and cash equivalents approximate estimated fair value because of the short-term maturities of those financial instruments.
Short-term investments consist primarily of certificates of deposit, Treasury and government agency securities and corporate bonds with ratings AA or better. All short-term investments have been classified as available-for-sale and are carried at fair market value, which approximates cost, due to the short period of time to maturity and the relative risk of the investments. As of fiscal year end 2009, we had the ability but not the intent to liquidate certain investments in order to meet our liquidity needs for the next twelve months. Accordingly, those investments with contractual maturities greater than one year from the date of acquisition have been classified as long-term.
F-9
Table of Contents
VARIAN SEMICONDUCTOR EQUIPMENT ASSOCIATES, INC.
NOTES TO THE CONSOLIDATED FINANCIAL STATEMENTS—(Continued)
Accounts Receivable and Allowance for Doubtful Accounts
Substantially all of our accounts receivable balance relates to trade receivables. Trade accounts receivable are recorded at the invoiced amount and generally do not bear interest. The allowance for doubtful accounts is our best estimate of the amount of probable credit losses in our existing accounts receivable. We maintain allowances for doubtful accounts for estimated losses resulting from the inability of our customers to make required payments for products and services. Accounts with known financial issues are first reviewed and specific estimates are recorded. The remaining accounts receivable balances are then grouped in categories by the amount of days the balance is past due and the estimated loss is calculated as a percentage of the total category based upon past history. Account balances are charged off against the allowance when it is probable the receivable will not be recovered.
Inventory and Purchase Order Commitments
We value our inventory at the lower of cost or market using the first-in, first-out method. On a quarterly basis, we assess the realizability of all inventories to determine whether adjustments for impairment are required. The determination of lower of cost or market requires that we make significant assumptions about future demand for products and the transition to new product offerings from legacy products. We also provide for losses on those open purchase order commitments in which our estimated obligation to receive inventory under the commitments exceeds expected production demand. These assumptions include, but are not limited to, future manufacturing schedules, customer demand, supplier lead time and technological and market obsolescence. Once inventory is written down and a new cost basis has been established, it is not written back up if demand increases.
Property, Plant and Equipment
Property, plant, and equipment are stated at cost. Major improvements are capitalized, while maintenance and repairs are expensed in the period the cost is incurred. Plant and equipment are depreciated over their estimated useful lives using the straight-line method. Leasehold improvements are amortized using the straight-line method over their estimated useful lives, or the remaining term of the lease, whichever is less. When assets are retired or otherwise disposed of, the assets and related accumulated depreciation are relieved from the accounts and resulting gains or losses are included in operating income in the consolidated statements of operations.
Goodwill and Other Long-Lived Assets
At fiscal year end 2009 and 2008, goodwill was $12.3 million. In accordance with the provisions of the goodwill accounting guidance, goodwill is not amortized. We test for the impairment of goodwill on an annual basis or whenever events or changes in circumstances suggest that the carrying amount may not be recoverable. We test for goodwill impairment at the entity level, as our subsidiaries do not constitute separate businesses and all possess similar economic characteristics. The test is performed by deducting the fair value of all assets and liabilities from the total estimated fair value to determine residual goodwill. We completed our annual goodwill impairment test and determined that no impairments existed at fiscal year end 2009.
Whenever events or changes in circumstances indicate that the carrying amounts of a long-lived asset may not be recoverable, we review these assets for impairment. If the future undiscounted cash flows are less than the carrying amount of that asset, impairment exists. We recognize an impairment loss based on the excess of the carrying amount over the fair value of the assets. Fair value is normally assessed using a discounted cash flow model.
Product Warranties
We provide for the estimated cost of product warranties, the amount of which is based primarily upon historical information, at the time product revenue is recognized. While we engage in extensive product quality programs and processes including actively monitoring and evaluating the quality of our component suppliers, our warranty
F-10
Table of Contents
VARIAN SEMICONDUCTOR EQUIPMENT ASSOCIATES, INC.
NOTES TO THE CONSOLIDATED FINANCIAL STATEMENTS—(Continued)
obligation is affected by product failure rates, utilization levels, material usage, service delivery costs incurred in correcting a product failure and supplier warranties on parts delivered to us. Should actual product failure rates, utilization levels, material usage, service delivery costs incurred in correcting a product failure or supplier warranties on parts differ from our estimates, revisions to the estimated warranty liability would be required.
Environmental Liabilities
Liabilities are recorded when environmental assessments and/or remedial efforts are probable and the costs can be reasonably estimated. Generally, the timing of these accruals coincides with completion of a feasibility study or our commitment to a formal plan of action. In situations where the various uncertainties make it difficult to assess the likelihood and scope of further investigation or remediation activities or to estimate then future costs, the lower limit of an estimated range is accrued on a non-discounted basis. All other liabilities, where we have generally sufficient knowledge to estimate the scope of costs and future activities, are accrued on a discounted basis. Should new information become available and/or different assumptions are applied in the estimation of environmental liabilities, revisions to the accrued environmental liability would be required.
Income Taxes
We use the asset and liability method of accounting for deferred income taxes. The provision for income taxes includes income taxes currently payable and those deferred as a result of temporary differences between the financial statement and tax bases of assets and liabilities. A valuation allowance is provided to reduce deferred tax assets to the amount of future tax benefit when it is more likely than not that some portion of the deferred tax assets will not be realized. Projected future taxable income and ongoing tax planning strategies are considered and evaluated when assessing the need for a valuation allowance. Any increase or decrease in a valuation allowance could have a material adverse or beneficial impact on our income tax provision and net income in the period in which the determination is made.
We adopted the accounting standard which provides guidance for accounting for uncertainty in income taxes at fiscal year end 2007. This accounting standard contains a two-step approach to recognizing and measuring uncertain tax positions accounted for in accordance with the accounting standard for income taxes. The first step is to evaluate the tax position for recognition by determining if the weight of available evidence indicates that it is more likely than not that the position will be sustained upon audit, including resolutions of related appeals or litigation processes, if any. The second step is to measure the tax benefit as the largest amount that is more than 50% likely of being realized upon ultimate settlement. We reevaluate these uncertain tax positions on a quarterly basis. This evaluation is based on factors including, but not limited to, changes in facts or circumstances, changes in tax law, effectively settled issues under audit and new audit activity. Any change in these factors could result in the recognition of a tax benefit or an additional charge to the tax provision. The accounting standard for uncertainty in income taxes also provides guidance on classification, interest and penalties, accounting in interim periods, disclosure and transition.
Derivative Financial Instruments
Our foreign subsidiaries operate and sell our products in various global markets. As a result, we are exposed to changes in foreign currency exchange rates. We utilize foreign currency forward exchange contracts to hedge against currency exposures that are associated with certain of our assets and liabilities denominated in various non-U.S. dollar currencies. The effect of exchange rate changes on forward exchange contracts is expected to offset the effect of exchange rate changes on the underlying hedged items. We believe these financial instruments do not subject us to speculative risk that would otherwise result from changes in currency exchange rates. We do not use derivative financial instruments for speculative or trading purposes.
F-11
Table of Contents
VARIAN SEMICONDUCTOR EQUIPMENT ASSOCIATES, INC.
NOTES TO THE CONSOLIDATED FINANCIAL STATEMENTS—(Continued)
All of our derivative financial instruments are recorded at fair value based upon quoted market prices for comparable instruments. For derivative instruments designated and qualifying as cash flow hedges of anticipated foreign currency denominated transactions, the effective portion of the gain or loss on these hedges is reported as a component of accumulated other comprehensive (loss) income in stockholders’ equity, and is reclassified into earnings when the hedged transaction affects earnings. If the transaction being hedged fails to occur, or if a portion of any derivative is ineffective, the gain or loss on the associated financial instrument is recorded immediately in earnings. For derivative instruments used to hedge existing foreign currency denominated assets or liabilities, the gain or loss on these hedges is recorded immediately in earnings to offset the changes in the fair value of the assets or liabilities being hedged. There was one forward foreign exchange sell contract designated as a hedge of anticipated product sales in Japanese Yen outstanding at fiscal year end 2009, totaling an equivalent notional value of $2.9 million.
Foreign Currency Translation
For international operations, the U.S. dollar is the functional currency. Monetary assets and liabilities of foreign subsidiaries are translated into U.S. dollars at current exchange rates. Nonmonetary assets such as inventories and property, plant, and equipment are translated at historical rates. Income and expense items are translated at effective rates of exchange prevailing during each year, except that inventories and depreciation charged to operations are translated at historical rates. Foreign exchange gains and losses are recorded in the consolidated statements of operations in other (expense) income, net.
Concentration of Risk
Financial instruments that potentially expose us to concentrations of credit risk consist principally of trade accounts receivable, cash investments and forward foreign exchange contracts. In recent fiscal years, we have sold over half of our systems to our ten largest customers, and our trade accounts receivable is primarily comprised of these respective customers. However, the concentration of credit risk is limited as the customer base is dispersed among many geographic regions and is comprised primarily of large multinational companies. Furthermore, for some higher risk customers, we may require a letter of credit to reduce credit exposure. We perform ongoing credit evaluations and generally do not require collateral from our customers. As of fiscal year end 2009, two customers accounted for 23% and 21% of the accounts receivable balance. As of fiscal year end 2008, four customers accounted for 16%, 12%, 11% and 10% of the total accounts receivable balance.
In fiscal year 2009, revenue from two customers accounted for 21% and 16% of our total revenue. In fiscal year 2008, revenue from two customers accounted for 16% and 13% of our total revenue. In fiscal year 2007, revenue from one customer accounted for 17% of our total revenue.
We consider currency on hand, demand deposits, and all highly liquid investments with a remaining maturity of three months or less at the date of purchase to be cash and cash equivalents. The carrying amounts of cash and cash equivalents approximate estimated fair value because of the short-term maturities of those financial instruments. Cash equivalents at fiscal year end 2009 and 2008 were $164.5 million and $110.2 million, respectively. Cash and cash equivalents are invested with multiple financial institutions. Investments consist primarily of U.S. Treasury, government agency and corporate bonds and certificates of deposit with ratings AA or better. All investments have been classified as available-for-sale and are carried at fair market value due to the short period of time to maturity and the relative risk of the investments. We manage our cash equivalents and investments as a single portfolio of highly marketable securities that is intended to be available to meet our current cash requirements. We also place forward foreign exchange contracts with investment grade financial institutions in order to minimize currency risk exposure.
F-12
Table of Contents
VARIAN SEMICONDUCTOR EQUIPMENT ASSOCIATES, INC.
NOTES TO THE CONSOLIDATED FINANCIAL STATEMENTS—(Continued)
We obtain some of the components and subassemblies that are included in our products from a limited group of suppliers, or in some cases a single source supplier. The loss of any supplier, including any single source supplier, would require obtaining one or more replacement suppliers and may also require devoting significant resources to product development to incorporate new parts from other sources into our products. The need to change suppliers or to alternate between suppliers might cause delays in delivery or significantly increase our costs. Although we have insurance to protect against loss due to business interruption from these and other sources, we cannot provide assurance that such coverage will be adequate or that it will remain available on commercially acceptable terms. Although we seek to reduce our dependence on these limited source suppliers, disruption or loss of these sources could negatively impact our business and damage customer relationships.
Research, Development and Engineering Costs
Research, development and engineering is comprised mainly of costs of internally-funded projects as well as continuing product development support. Costs incurred generally consist of employee and material costs, depreciation of equipment and other engineering related expenses. Research, development and engineering costs are expensed as incurred.
Recent Accounting Pronouncements
In December 2007, the Financial Accounting Standards Board, or FASB, revised the authoritative guidance for business combinations which requires a number of changes in accounting for business combinations. These changes include the recognition of contingent consideration and certain contingent assets and liabilities at fair value, capitalization of acquired in-process research and development, expensing of acquisition related transaction costs and restructuring costs, and the recognition of changes in the acquirer’s income tax valuation allowance. This guidance will be effective for our fiscal year 2010, with early adoption prohibited. The adoption of this guidance will change our accounting treatment for business combinations on a prospective basis.
In September 2006, the FASB issued authoritative guidance for fair value measurements which defines fair value, establishes a framework for measuring fair value, and expands disclosures about assets and liabilities measured at fair value in the financial statements. In February 2008, the FASB issued authoritative guidance which allows for the delay of the effective date of the authoritative guidance for fair value measurements for one year for all nonfinancial assets and liabilities, except those that are recognized or disclosed at fair value in the financial statements on a recurring basis. We adopted the provisions of the guidance for financial assets and liabilities on October 4, 2008 but elected a partial deferral under the provisions related to nonfinancial assets and liabilities that are measured at fair value on a nonrecurring basis. We are currently evaluating the impact that the guidance will have on our consolidated financial statements when it is applied to non-financial assets and non-financial liabilities that are not measured at fair value on a recurring basis, beginning in the first quarter of fiscal year 2010.
In June 2008, the FASB issued authoritative guidance which classifies unvested share-based payment awards that contain non-forfeitable rights to dividends or dividend equivalents (whether paid or unpaid) as participating securities and requires them to be included in the computation of earnings per share pursuant to the two-class method. This guidance is effective for financial statements issued for fiscal years beginning after December 15, 2008, and interim periods within those years. All prior-period earnings per share data presented are to be adjusted retrospectively (including interim financial statements, summaries of earnings, and selected financial data), with early application not permitted. We are currently evaluating the effect, if any, that the adoption of this guidance will have on our consolidated financial statements in the first quarter of fiscal year 2010.
F-13
Table of Contents
VARIAN SEMICONDUCTOR EQUIPMENT ASSOCIATES, INC.
NOTES TO THE CONSOLIDATED FINANCIAL STATEMENTS—(Continued)
In October 2009, the FASB issued new standards for revenue recognition with multiple deliverables. These new standards impact the determination of when the individual deliverables included in a multiple-element arrangement may be treated as separate units of accounting. Additionally, these new standards modify the manner in which the transaction consideration is allocated across the separately identified deliverables by no longer permitting the residual method of allocating arrangement consideration. These new standards are effective for us beginning in the first quarter of fiscal year 2011, however early adoption is permitted. We are evaluating the effect these new standards will have on our consolidated financial statements.
In October 2009, the FASB issued new standards for the accounting for certain revenue arrangements that include software elements. These new standards amend the scope of pre-existing software revenue guidance by removing from the guidance non-software components of tangible products and certain software components of tangible products. These new standards are effective for us beginning in the first quarter of fiscal year 2011, however early adoption is permitted. We are evaluating the effect these new standards will have on our consolidated financial statements.
Note 3. Fair Value
The accounting standard for fair value measurements, which we adopted in the beginning of fiscal year 2009, defines fair value, establishes a consistent framework for measuring fair value and expands disclosure requirements about fair value measurement. The framework requires fair value to be determined based on the exchange price that would be received for an asset or paid to transfer a liability (an exit price) in the principal or most advantageous market for the asset or liability in an orderly transaction between market participants.
In the third quarter of fiscal year 2009, we adopted an accounting standard which provides guidance in determining fair value when the volume and level of activity for the asset or liability have significantly decreased and identifying transactions that are not orderly. This accounting standard also provides additional guidance for estimating fair value when there is an inactive market or the market is not orderly. Upon adoption, there was no impact on our financial position, results of operations, and cash flows.
Fair Value Hierarchy
The accounting standard for fair value measurements specifies a hierarchy for disclosure of fair value measurement. The classification of assets and liabilities within the hierarchy is based on whether the inputs to the valuation methodology used for measurement are observable or unobservable. Observable inputs reflect market-derived or market-based information obtained from independent sources, while unobservable inputs reflect our estimates about market data. The three levels are defined as follows:
| • | Level 1 inputs are quoted prices (unadjusted) in active markets for identical assets or liabilities for the instrument or security to be valued. |
| • | Level 2 inputs are inputs other than quoted prices that are observable for the asset or liability, either directly or indirectly through corroboration with observable market data for substantially the full term of the asset or liability. |
| • | Level 3 inputs are derived from valuation techniques in which one or more significant inputs or significant value drivers are unobservable and are significant to the fair value of the assets or liabilities. |
This hierarchy requires the use of observable market data when available. We maintain policies and procedures to value instruments using the best and most relevant data available. Further, we used internal sources and considered external sources to assist us in valuing certain instruments.
F-14
Table of Contents
VARIAN SEMICONDUCTOR EQUIPMENT ASSOCIATES, INC.
NOTES TO THE CONSOLIDATED FINANCIAL STATEMENTS—(Continued)
Determination of Fair Value
We measure fair value utilizing the price that would be received to sell an asset or paid to transfer a liability in an orderly transaction between market participants at the measurement date.
The following is a description of valuation methodologies we used to measure assets and liabilities at fair value, including an indication of the level in the fair value hierarchy.
Cash equivalents
We consider demand deposits and all highly liquid investments with a remaining maturity of three months or less at the date of purchase to be cash equivalents and are classified as Level 1 in the valuation hierarchy. The carrying amounts of cash equivalents approximate estimated fair value due to the short-term maturities of those financial assets.
Securities available-for-sale
Securities are classified as Level 1 in the valuation hierarchy, where quoted prices are available in an active market. We may utilize an alternative pricing method (for example, matrix pricing) and quotations from bond dealers to assist in determining fair value for each security traded over-the-counter rather than on a securities exchange. Matrix pricing is a mathematical technique which considers information with respect to comparable bond and note transactions or by reference to other securities that are considered comparable in such characteristics as rating, interest rate and maturity date, to determine fair value. Securities priced using such methods are generally classified as Level 2 and typically include U.S. Treasury and agency securities, corporate bonds and municipal bonds.
Deferred compensation
The deferred compensation liability represents our obligation to pay benefits under our non-qualified deferred compensation plan. The related investments, held in a Rabbi Trust, consist of equity securities, primarily mutual funds, and are classified as Level 1 in the valuation hierarchy. Adjustments to fair value of both the equity securities and the related deferred compensation liabilities are recorded in marketing, general and administrative expense.
Derivatives
In general, and where applicable, we use quoted prices in an active market for derivative assets and liabilities, which are traded on exchanges. These derivative assets and liabilities are classified as Level 1.
F-15
Table of Contents
VARIAN SEMICONDUCTOR EQUIPMENT ASSOCIATES, INC.
NOTES TO THE CONSOLIDATED FINANCIAL STATEMENTS—(Continued)
Assets and Liabilities Measured at Fair Value on a Recurring Basis
| Fiscal Year End 2009 |
Quoted Prices in Active Markets for Identical Assets (Level 1) |
Significant Other Observable Inputs (Level 2) |
Significant Unobservable Inputs (Level 3) | |||||||||||
| (Amounts in thousands) | ||||||||||||||
| Cash equivalents |
$ | 164,511 | $ | 164,511 | — | — | ||||||||
| Short-term and long-term investments |
||||||||||||||
| U.S. Treasury and agency securities |
35,730 | — | $ | 35,730 | — | |||||||||
| Corporate bonds |
83,584 | — | 83,584 | — | ||||||||||
| Municipal bonds |
4,633 | — | 4,633 | — | ||||||||||
| Equity securities |
5,435 | 5,435 | — | — | ||||||||||
| Derivative assets |
(1,207 | ) | (1,207 | ) | — | — | ||||||||
| Total assets at fair value |
$ | 292,686 | $ | 168,739 | $ | 123,947 | $ | — | ||||||
| Deferred compensation |
$ | 5,435 | $ | 5,435 | — | — | ||||||||
| Total liabilities at fair value |
$ | 5,435 | $ | 5,435 | $ | — | $ | — | ||||||
Non-Marketable Equity Investments
The portfolio of financial assets excludes a $1.1 million minority equity investment in two private companies which is accounted for under the cost method and is outside the scope of the accounting standard for fair value measurements. This equity investment is included in long-term investments on the consolidated balance sheet.
Note 4. Stock-based Compensation
Stock-based compensation cost is measured at grant date and is based on the fair value of the award. The straight-line method is applied to all grants with service conditions, while the graded vesting method is applied to all grants with both service and performance conditions.
The estimated fair value of our stock-based awards, less expected forfeitures, is amortized over the awards’ vesting period. The effect of recording stock-based compensation for fiscal years 2009, 2008 and 2007 was as follows:
| Fiscal Year | |||||||||||
| 2009 | 2008 | 2007 | |||||||||
| (Amounts in thousands) | |||||||||||
| Effect of stock-based compensation on income by line item: |
|||||||||||
| Cost of product revenue |
$ | 944 | $ | 1,025 | $ | 1,261 | |||||
| Cost of service revenue |
789 | 1,035 | 1,048 | ||||||||
| Research, development and engineering expense |
4,620 | 4,611 | 3,863 | ||||||||
| Marketing, general and administrative expense |
15,787 | 16,436 | 13,479 | ||||||||
| (Provision) for income taxes |
— | (9,386 | ) | (9,535 | ) | ||||||
| Total cost related to stock-based compensation |
$ | 22,140 | $ | 13,721 | $ | 10,116 | |||||
We estimate the fair value of stock options using the Black-Scholes valuation model. Key input assumptions used to estimate the fair value of stock options include the exercise price of the award, the expected option term, the risk-free interest rate over the option’s expected term, the expected annual dividend yield and the expected
F-16
Table of Contents
VARIAN SEMICONDUCTOR EQUIPMENT ASSOCIATES, INC.
NOTES TO THE CONSOLIDATED FINANCIAL STATEMENTS—(Continued)
stock price volatility. Our expected term is calculated using historical data and assumes that all outstanding options will be exercised at the midpoint of the vest date and the full contractual term and is further adjusted for demographic data. We interpolate the risk-free interest rate from the U.S. Treasury zero-coupon bond that coincides with the expected term. We do not have a history of paying dividends, nor do we expect to in the future. In fiscal year 2009, we determined that a blended volatility, using exclusively our historical and implied volatility measures, best reflects expected volatility over the expected term of the option. Prior to fiscal year 2009, we relied on a blended volatility, using our historical and implied volatility measures, and a peer group implied volatility. Estimates of fair value are not intended to predict actual future events or the value ultimately realized by persons who receive equity awards.
The fair value of each option granted during fiscal years 2009, 2008 and 2007 was estimated on the grant date using the Black-Scholes option-pricing model with the following weighted-average assumptions:
| Fiscal Year | ||||||||||||
| 2009 | 2008 | 2007 | ||||||||||
| Expected life (in years) |
3.7 | 3.6 | 4.0 | |||||||||
| Expected volatility |
50.7 | % | 46.1 | % | 39.2 | % | ||||||
| Risk-free interest rate |
1.8 | % | 3.0 | % | 4.6 | % | ||||||
| Expected dividend yield |
0.0 | % | 0.0 | % | 0.0 | % | ||||||
| Weighted-average grant date fair value |
$ | 7.34 | $ | 13.47 | $ | 12.88 | ||||||
Stock Incentive Plan
The 2006 Stock Incentive Plan, or the Plan, which replaced the Amended and Restated Omnibus Stock Plan upon shareholder approval on February 9, 2006, provides for the grant of non-qualified share-based awards to our eligible employees, consultants and non-employee directors. As of fiscal year end 2009, a total of 5,910,975 shares were reserved for future issuance under the Plan.
Stock option awards granted under the Plan generally have a life no longer than eight years after the date of the grant and generally vest as to 25% one year from date of grant with the remaining 75% vesting in twelve equal quarterly installments so that all options are vested at the end of four years. We normally settle employee stock option exercises with newly issued common shares. Restricted stock awards are granted under the Plan at $0.01 per share and generally vest as to 25% one year from the date of grant with the remaining 75% vesting in twelve equal quarterly installments.
Stock compensation expense associated with restricted common stock and restricted stock units is charged for the difference between the market value on the date of grant and the issuance price, less estimated forfeitures, and is amortized over the awards’ vesting period on a straight-line basis for all grants with service conditions, while the graded vesting method applies to all grants with both service and performance conditions.
F-17
Table of Contents
VARIAN SEMICONDUCTOR EQUIPMENT ASSOCIATES, INC.
NOTES TO THE CONSOLIDATED FINANCIAL STATEMENTS—(Continued)
The following table summarizes the stock option and restricted stock activity for fiscal year 2009:
| Stock Option Activity | Unvested Restricted Stock Award Activity |
Unvested Restricted Stock Unit Activity | |||||||||||||||||||||
| Shares | Weighted- Average Exercise Price |
Weighted- Average Remaining Contractual Term |
Aggregate Intrinsic Value |
Shares | Weighted- Average Grant Date Fair Value |
Shares | Weighted- Average Grant Date Fair Value | ||||||||||||||||
| (In years) | (In thousands) | ||||||||||||||||||||||
| Outstanding at fiscal year end 2008 |
5,156,786 | $ | 23.76 | 785,663 | $ | 28.36 | 39,492 | $ | 27.90 | ||||||||||||||
| Granted |
1,379,870 | 18.98 | 291,588 | 18.89 | 27,140 | 18.42 | |||||||||||||||||
| Exercised |
(449,600 | ) | 14.12 | ||||||||||||||||||||
| Restricted stock vested |
(418,101 | ) | 26.35 | (11,568 | ) | 21.70 | |||||||||||||||||
| Forfeited/expired/cancelled |
(63,954 | ) | 28.59 | (34,210 | ) | 26.36 | — | — | |||||||||||||||
| Outstanding at fiscal year end 2009 |
6,023,102 | $ | 23.33 | 4.1 | $ | 54,248 | 624,940 | $ | 25.39 | 55,064 | $ | 24.53 | |||||||||||
| Options vested and expected to vest at fiscal year end 2009 |
5,948,157 | $ | 23.33 | 4.1 | $ | 53,616 | |||||||||||||||||
| Options exercisable at fiscal year end 2009 |
3,538,374 | $ | 21.35 | 3.0 | $ | 37,209 | |||||||||||||||||
The total intrinsic value is based on our closing stock price of $30.27 as of the last day of fiscal year 2009 and represents the amounts that would have been received by the option holders had all option holders exercised their options as of that date.
As of fiscal year end 2009, the unrecognized compensation cost, net of estimated forfeitures, related to unvested stock options and restricted stock was $19.7 million and $14.0 million, respectively. These amounts will be recognized over an estimated weighted average amortization period of 2.6 years and 2.0 years, respectively.
The total intrinsic value of options exercised during fiscal years 2009, 2008 and 2007 was $4.9 million, $4.8 million and $69.5 million, respectively, with intrinsic value defined as the difference between the market price on the date of exercise and the grant date strike price. The total amount of cash received from the exercise of these options was $6.3 million, $3.9 million and $51.0 million, respectively. The actual tax benefit realized for the tax deductions from option exercises in fiscal years 2009 and 2008 totaled $1.5 million, respectively. The actual tax benefit realized for the tax deductions from option exercises in fiscal year 2007 totaled $24.0 million. The total fair value of restricted stock grants that vested during the fiscal years 2009, 2008 and 2007 was $9.4 million, $16.9 million and $16.1 million, respectively.
F-18
Table of Contents
VARIAN SEMICONDUCTOR EQUIPMENT ASSOCIATES, INC.
NOTES TO THE CONSOLIDATED FINANCIAL STATEMENTS—(Continued)
Employee Stock Purchase Plan
Our employees, who elect to participate in the Employee Stock Purchase Plan, or ESPP, are able to purchase common stock at the lower of 85% of the fair market value of our common stock on the first or last day of the applicable offering period. Typically, each offering period lasts six months. On November 24, 2008, we decided to suspend enrollment and participation in the ESPP as of January 1, 2009. We expect to lift the suspension once the industry recovers. As of fiscal year end 2009, there were a total of 828,266 shares of common stock reserved for issuance under the ESPP. The fair value of shares issued under the ESPP was estimated on the commencement date of each offering period using the Black-Scholes option-pricing model with the following assumptions:
| Fiscal Year | ||||||||||||
| 2009 | 2008 | 2007 | ||||||||||
| Expected life (in years) |
0.5 | 0.5 | 0.5 | |||||||||
| Expected volatility |
49.0 | % | 53.2 | % | 44.6 | % | ||||||
| Risk-free interest rate |
2.1 | % | 2.7 | % | 5.1 | % | ||||||
| Expected dividend yield |
0.0 | % | 0.0 | % | 0.0 | % | ||||||
| Weighted-average grant date fair value |
$ | 10.44 | $ | 10.84 | $ | 9.69 | ||||||
Note 5. Cash, Cash Equivalents and Investments
We consider currency on hand, demand deposits, and all highly liquid investments with a remaining maturity of three months or less at the date of purchase to be cash and cash equivalents. The carrying amounts of cash and cash equivalents approximate estimated fair value because of the short-term maturities of those financial instruments. Cash equivalents at fiscal year end 2009 and 2008 were $164.5 million and $110.2 million, respectively.
Investments consist primarily of U.S. Treasury and government agency securities and corporate bonds with ratings AA or better. All investments have been classified as available-for-sale and are carried at fair value. The cost of securities sold was determined based on the specific identification method. Investments with contractual maturities greater than one year from the date of acquisition have been classified as long-term.
Net realized loss on investments for fiscal year 2009 was approximately $0.5 million. As of fiscal year end 2009 and 2008, net unrealized gain (loss) on investments of $0.9 million and ($3.7) million, respectively, was recorded as accumulated other comprehensive income.
We determined that the unrealized losses at fiscal year end 2009, as aggregated by security type in the table below, are temporary. This assessment is based upon the nature of the investments and the causes of the unrealized losses. The investments are in corporate bonds and U.S. Treasury and agency securities, as stated in the investment policy. The unrealized losses relate to the decline in fair value due to differences between the securities’ interest rates at acquisition and current interest rates and the decline in credit worthiness of certain debtors.
In the third quarter of 2009, we adopted the accounting standard which provides guidance for the recognition and presentation of an other-than-temporary impairment. This accounting standard provides additional guidance designed to create greater clarity and consistency in accounting and presenting impairment losses on securities. This accounting standard is intended to bring greater consistency to the timing of impairment recognition, and provide greater clarity to investors about the credit and noncredit components of impaired debt securities that are not expected to be sold. This accounting standard also requires increased and more timely disclosure regarding expected cash flows, credit losses, and an aging of securities with unrealized losses. Upon adoption there was no impact on our consolidated financial position, results of operations and cash flows.
F-19
Table of Contents
VARIAN SEMICONDUCTOR EQUIPMENT ASSOCIATES, INC.
NOTES TO THE CONSOLIDATED FINANCIAL STATEMENTS—(Continued)
Unrealized losses on investments at fiscal year end 2009 by investment category and length of time the investment has been in a continuous unrealized loss position are as follows:
| In Loss Position for Less than 12 Months |
In Loss Position for 12 Months or More |
Total | |||||||||||||||||||
| Estimated Fair Value |
Gross Unrealized Losses |
Estimated Fair Value |
Gross Unrealized Losses |
Estimated Fair Value |
Gross Unrealized Losses |
||||||||||||||||
| (Amounts in thousands) | |||||||||||||||||||||
| U.S. Treasury and agency securities |
$ | 2,001 | $ | (1 | ) | — | — | $ | 2,001 | $ | (1 | ) | |||||||||
| Corporate Bonds |
8,286 | (24 | ) | $ | 17,785 | $ | (309 | ) | 26,071 | (333 | ) | ||||||||||
| Other |
— | — | 5,435 | (128 | ) | 5,435 | (128 | ) | |||||||||||||
| Total |
$ | 10,287 | $ | (25 | ) | $ | 23,220 | $ | (437 | ) | $ | 33,507 | $ | (462 | ) | ||||||
Investments by security type at fiscal year end 2009 were as follows:
| Cost | Gross Unrealized Gains |
Gross Unrealized Losses |
Estimated Fair Value | ||||||||||
| (Amounts in thousands) | |||||||||||||
| U.S. Treasury and agency securities |
$ | 35,433 | $ | 298 | $ | (1 | ) | $ | 35,730 | ||||
| Corporate Bonds |
82,868 | 1,048 | (333 | ) | 83,583 | ||||||||
| Municipal Bonds |
4,598 | 36 | — | 4,634 | |||||||||
| Other |
6,663 | — | (128 | ) | 6,535 | ||||||||
| Total |
$ | 129,562 | $ | 1,382 | $ | (462 | ) | $ | 130,482 | ||||
Investments by security type at fiscal year end 2008 were as follows:
| Cost | Gross Unrealized Gains |
Gross Unrealized Losses |
Estimated Fair Value | ||||||||||
| (Amounts in thousands) | |||||||||||||
| U.S. Treasury and agency securities |
$ | 5,539 | $ | 46 | — | $ | 5,585 | ||||||
| Corporate Bonds |
106,059 | 119 | $ | (3,088 | ) | 103,090 | |||||||
| Municipal Bonds |
24,819 | 49 | (51 | ) | 24,817 | ||||||||
| Other |
5,780 | — | (785 | ) | 4,995 | ||||||||
| Total |
$ | 142,197 | $ | 214 | $ | (3,924 | ) | $ | 138,487 | ||||
The investment maturities are as follows:
| Fiscal Year End | ||||||
| 2009 | 2008 | |||||
| (Amounts in thousands) | ||||||
| Maturing within 1 year |
$ | 44,043 | $ | 68,996 | ||
| Maturing between 1 year and 5 years |
86,439 | 69,491 | ||||
| Total |
$ | 130,482 | $ | 138,487 | ||
F-20
Table of Contents
VARIAN SEMICONDUCTOR EQUIPMENT ASSOCIATES, INC.
NOTES TO THE CONSOLIDATED FINANCIAL STATEMENTS—(Continued)
Note 6. Accounts Receivable
Accounts receivable consist of the following:
| Fiscal Year End | ||||||||
| 2009 | 2008 | |||||||
| (Amounts in thousands) | ||||||||
| Accounts receivable |
$ | 116,754 | $ | 130,184 | ||||
| Allowance for doubtful accounts |
(1,752 | ) | (1,280 | ) | ||||
| Accounts receivable, net |
$ | 115,002 | $ | 128,904 | ||||
Note 7. Inventories
The components of inventories are as follows:
| Fiscal Year End | ||||||
| 2009 | 2008 | |||||
| (Amounts in thousands) | ||||||
| Raw materials and parts |
$ | 67,853 | $ | 82,343 | ||
| Work in process |
13,133 | 16,509 | ||||
| Finished goods |
19,778 | 66,349 | ||||
| Total inventories |
$ | 100,764 | $ | 165,201 | ||
Note 8. Property, Plant and Equipment
The components of property, plant, and equipment are as follows:
| Useful Life |
Fiscal Year End | |||||||||
| 2009 | 2008 | |||||||||
| (In years) | (Amounts in thousands) | |||||||||
| Land and land improvement |
— | $ | 6,065 | $ | 6,070 | |||||
| Buildings and leasehold improvements |
7-20 | 63,131 | 59,329 | |||||||
| Machinery and equipment |
2-7 | 128,442 | 126,950 | |||||||
| Construction in progress |
— | 5,508 | 3,514 | |||||||
| 203,146 | 195,863 | |||||||||
| Accumulated depreciation |
(137,361 | ) | (129,227 | ) | ||||||
| Property, plant and equipment, net |
$ | 65,785 | $ | 66,636 | ||||||
Depreciation expense was $15.6 million, $17.1 million and $14.4 million for fiscal years 2009, 2008 and 2007, respectively. There were no capital leases in fiscal years 2009 or 2008.
Note 9. Notes Payable
On May 23, 2008, we entered into a credit agreement with multiple financial institutions providing for borrowings of a maximum principal amount of up to $100.0 million under an unsecured revolving credit facility. Amounts could be borrowed, repaid and re-borrowed from time to time during the five year commitment period ending May 23, 2013. Borrowings would bear interest at a rate per annum equal to either: (1) the greater of
F-21
Table of Contents
VARIAN SEMICONDUCTOR EQUIPMENT ASSOCIATES, INC.
NOTES TO THE CONSOLIDATED FINANCIAL STATEMENTS—(Continued)
(a) the prime rate and (b) the federal funds rate plus 0.50%; or (2) the sum of (a) LIBOR, with certain adjustments and (b) an “applicable rate,” defined in the credit agreement as a percentage spread based on our leverage ratio. The credit agreement contained events of default and covenants. The credit facility was intended to provide ongoing working capital and cash for acquisitions, repurchases of common stock, capital expenditures and other general corporate purposes. We terminated this credit agreement effective March 27, 2009, pursuant to the terms of the credit agreement. As of March 27, 2009, there were no outstanding borrowings under this credit agreement and we did not incur any early termination penalties in connection with the credit agreement termination.
Our subsidiary in Japan had two credit facilities at different financial institutions during fiscal years 2009 and 2008, one of which was terminated during fiscal year 2009. Maximum available borrowing under the remaining facility was Yen 400,000,000 ($4.5 million) at fiscal year end 2009. The loan is not collateralized and contains no restrictive covenants, although the loan is guaranteed by us. The interest rate for the facility is the 3-month Tokyo interbank offered rate (TIBOR) plus 1.00%, which was approximately 1.6% and 1.9% at fiscal year end 2009 and 2008, respectively. There were no outstanding borrowings under the facility.
Our subsidiary in Taiwan terminated their credit facility of $1.0 million during fiscal year 2009. Any outstanding U.S. Dollar borrowings under the Taiwan facility accrued interest at the local base rate plus 2.0% plus taxes, which was approximately 7.4% at fiscal year end 2008. Any New Taiwan Dollar borrowings accrued interest at the local base rate plus 2.0% plus taxes, which was approximately 4.1% at fiscal year end 2008. There were no outstanding borrowings as of fiscal year end 2009 and 2008 under this facility.
During fiscal years 2008 and 2009, we also had borrowing capacity in Europe. Our subsidiary in Europe maintains a credit facility that includes overdraft protection of Euro 1.0 million which at fiscal year end 2009 translated to $1.5 million. Interest accrues at the Euro base rate plus 1.5% and was approximately 6.4% and 7.9% at fiscal year end 2009 and 2008, respectively. Borrowings under this facility are payable on demand. The credit facility is not collateralized nor does it contain any restrictive covenants, although the facility is guaranteed by us. There were no outstanding borrowings as of fiscal year end 2009 and 2008 under this facility.
Note 10. Accrued Expenses
The components of accrued expenses are as follows:
| Fiscal Year End | ||||||
| 2009 | 2008 | |||||
| (Amounts in thousands) | ||||||
| Accrued incentives |
$ | 3,637 | $ | 14,921 | ||
| Accrued employee benefits |
5,041 | 9,756 | ||||
| Accrued payroll |
4,725 | 7,367 | ||||
| Accrued retirement benefits |
578 | 2,593 | ||||
| Other |
8,831 | 7,108 | ||||
| Total accrued expenses |
$ | 22,812 | $ | 41,745 | ||
Note 11. Restructuring
The semiconductor industry has historically experienced periodic downturns and in response, we have historically recorded restructuring charges in connection with cost reduction initiatives implemented in response to the industry downturns. Restructuring charges typically consist of severance, benefits and outplacement
F-22
Table of Contents
VARIAN SEMICONDUCTOR EQUIPMENT ASSOCIATES, INC.
NOTES TO THE CONSOLIDATED FINANCIAL STATEMENTS—(Continued)
services offered to terminated employees and sometimes include charges for remaining lease payments on facilities that are closed. Prior to any restructuring announcements, the restructuring is approved by the appropriate level of management necessary to commit to the specific actions of the reduction in force.
In fiscal year 2009, we incurred restructuring charges of $9.2 million in connection with the continuation of cost reduction initiatives in response to the continued weakness in the semiconductor capital equipment market ($0.2 million in the fiscal fourth quarter of 2009). The expense is related to a reduction of headcount of approximately 380 employees, mainly within manufacturing and engineering.
We began relocating the European operations in Houten, the Netherlands to Schaffhausen, Switzerland, in the fiscal fourth quarter of 2008. The restructuring is comprised primarily of one-time termination benefits and a contract termination expense, a facility lease.
We estimate that the European restructuring activity, inclusive of activity through fiscal years 2009 and 2008 ($2.0 million and $0.4 million, respectively), will cost $2.5 million. The estimate also includes future, one-time termination benefits of $0.1 million.
The following table summarizes the restructuring activity for fiscal years 2009 and 2008.
| Ongoing Benefit Arrangements |
One-time Termination Benefits |
Contract Termination Costs |
Other Associated Costs |
Total | ||||||||||||||||
| (Amounts in thousands) | ||||||||||||||||||||
| Accrued charges at fiscal year end 2007 |
— | — | — | — | — | |||||||||||||||
| Costs incurred |
$ | 1,208 | $ | 324 | — | $ | 75 | $ | 1,607 | |||||||||||
| Costs paid |
(1,024 | ) | — | — | — | (1,024 | ) | |||||||||||||
| Non-cash settlements |
— | — | — | — | — | |||||||||||||||
| Accrued charges at fiscal year end 2008 |
$ | 184 | $ | 324 | $ | — | $ | 75 | $ | 583 | ||||||||||
| Costs incurred |
6,505 | 1,598 | 194 | 685 | 8,982 | |||||||||||||||
| Adjustments |
197 | (103 | ) | 173 | (76 | ) | 191 | |||||||||||||
| Costs paid |
(6,878 | ) | (1,337 | ) | (95 | ) | (464 | ) | (8,774 | ) | ||||||||||
| Non-cash settlements |
— | — | — | (192 | ) | (192 | ) | |||||||||||||
| Accrued charges at fiscal year end 2009 |
$ | 8 | $ | 482 | $ | 272 | $ | 28 | $ | 790 | ||||||||||
Cash outlays related to one-time termination benefits and contract termination costs to exit the Houten facility will continue through fiscal years 2010 and 2014, respectively.
We did not recognize restructuring costs during fiscal year 2007.
Note 12. Product Warranties
We warrant that our products will be free from defects in materials and workmanship and will conform to our standard published specifications in effect at the time of delivery for a period of three to twelve months from the date the customer accepts the products. Additionally, we warrant that maintenance services will be performed in a workmanlike manner consistent with generally accepted industry standards for a period of 90 days from the completion of any agreed-upon services. We provide for the estimated cost of product warranties, the amount of which is based primarily upon historical information, at the time product revenue is recognized. Our warranty obligation is affected by a number of factors, including product failure rates, utilization levels, material usage,
F-23
Table of Contents
VARIAN SEMICONDUCTOR EQUIPMENT ASSOCIATES, INC.
NOTES TO THE CONSOLIDATED FINANCIAL STATEMENTS—(Continued)
service delivery costs incurred in correcting a product failure, and supplier warranties on parts delivered to us. Should these factors or other factors affecting warranty costs differ from our estimates, revisions to the estimated warranty liability would be required.
Product warranty activity for fiscal years 2009 and 2008 was as follows:
| Fiscal Year End | ||||||||
| 2009 | 2008 | |||||||
| (Amounts in thousands) | ||||||||
| Beginning Balance |
$ | 8,339 | $ | 12,979 | ||||
| Accruals for warranties issued during the period |
5,183 | 11,325 | ||||||
| Decrease to pre-existing warranties |
(873 | ) | (861 | ) | ||||
| Settlements made during the period |
(8,423 | ) | (15,104 | ) | ||||
| Ending Balance |
$ | 4,226 | $ | 8,339 | ||||
| Current portion of product warranty |
$ | 3,943 | $ | 7,661 | ||||
| Long-term portion of product warranty |
283 | 678 | ||||||
| Total product warranty |
$ | 4,226 | $ | 8,339 | ||||
Note 13. Deferred Revenue
The components of deferred revenue are as follows:
| Fiscal Year End | ||||||
| 2009 | 2008 | |||||
| (Amounts in thousands) | ||||||
| Fully deferred systems, installation and acceptance revenue |
$ | 11,417 | $ | 16,794 | ||
| Extended warranties |
8,507 | 15,670 | ||||
| Maintenance and service contracts |
4,787 | 5,704 | ||||
| Other deferred revenue |
4,890 | 778 | ||||
| Total deferred revenue |
$ | 29,601 | $ | 38,946 | ||
| Current portion of deferred revenue |
$ | 27,098 | $ | 32,285 | ||
| Long-term portion of deferred revenue |
2,503 | 6,661 | ||||
| Total deferred revenue |
$ | 29,601 | $ | 38,946 | ||
Note 14. Long-term Accrued Expenses and Other Long-term Liabilities
There were $66.3 million and $65.1 million in long-term accrued expenses and other long-term liabilities at fiscal year end 2009 and 2008, respectively. Included in these amounts were $47.2 million and $43.8 million, respectively, for long-term tax liabilities. In addition, post-employment liabilities, environmental and other costs not expected to be expended within the next year are included in long-term accrued expenses and other long-term liabilities. The current portion is recorded within accrued expenses.
Note 15. Long-term Debt
In February 2003, we purchased our previously leased facility located in Newburyport, Massachusetts. The purchase price consisted of cash payments totaling $3.4 million, the assumption of the seller’s outstanding loan
F-24
Table of Contents
VARIAN SEMICONDUCTOR EQUIPMENT ASSOCIATES, INC.
NOTES TO THE CONSOLIDATED FINANCIAL STATEMENTS—(Continued)
of $5.1 million and the transfer of other prepaid assets of $0.8 million. The loan has a fixed interest rate of 9.05% with monthly payments of principal and interest until the loan matures in January 2013. The loan may be prepaid in full, but not in part, at any time after November 5, 2006. Prepayment would require us to pay a prepayment penalty equal to the greater of two percent of the outstanding principal balance or the excess of the present value of all future loan payments over the outstanding principal balance of the loan. The $2.2 million carrying amount of the loan had an estimated fair value of $2.4 million at fiscal year end 2009. The fair value of the loan was estimated using a discounted cash flow analysis. The interest rate was estimated based on current market conditions and our financial condition at fiscal year end 2009. As of fiscal year end 2009, we also had a standby letter of credit outstanding for $0.5 million as a guarantee for the debt on this facility.
The loan payments are as follows:
| Fiscal Year |
Annual Loan Payments | |||
| (Amounts in thousands) | ||||
| 2010 |
$ | 785 | ||
| 2011 |
785 | |||
| 2012 |
785 | |||
| 2013 |
196 | |||
| Total loan payments |
2,551 | |||
| Less: amount representing interest |
(349 | ) | ||
| Total principal |
2,202 | |||
| Current portion of long-term debt |
(610 | ) | ||
| Long-term debt |
$ | 1,592 | ||
Note 16. Derivative Financial Instruments
Effective January 3, 2009, we adopted an accounting standard which requires enhanced disclosures regarding an entity’s derivative and hedging activities. This accounting standard changes the disclosure requirements for derivative instruments and hedging activities and requires entities to provide enhanced disclosure about (a) how and why an entity uses derivative instruments, (b) how derivative instruments and related hedged items are accounted for under a previous accounting standard and its related interpretations, and (c) how derivative instruments and related hedged items affect an entity’s financial position, financial performance, and cash flows.
Although the majority of our transactions are in U.S. dollars, some transactions are based in various foreign currencies. We use derivatives to hedge the foreign currency exposure that is associated with certain of our revenues, assets and liabilities denominated in various non-U.S. dollar currencies.
We hedge our exposure in foreign currency denominated assets and liabilities with foreign currency forward contracts. Since these derivatives hedge existing exposures that are denominated in non-U.S. dollar currencies, these contracts do not qualify for hedge accounting.
We also use foreign currency forward contracts to hedge our exposure on non-U.S. dollar forecasted revenue transactions. These derivatives are designated as cash flow hedges. We do not engage in currency speculation. For purposes of presentation within the consolidated statements of cash flows, derivative gains and losses are presented within net cash provided by operating activities.
F-25
Table of Contents
VARIAN SEMICONDUCTOR EQUIPMENT ASSOCIATES, INC.
NOTES TO THE CONSOLIDATED FINANCIAL STATEMENTS—(Continued)
Cash flow hedges
A designated hedge of the exposure to variability in the future cash flows of an asset or liability, or of a forecasted transaction, is referred to as a cash flow hedge. We use foreign currency forward contracts to hedge exposures on forecasted non-U.S dollar denominated sales transactions. These instruments generally mature within 12 months. These derivative instruments are recognized on the balance sheet at fair value and changes in the fair value are reported as a component of accumulated other comprehensive income (loss) in stockholders’ equity. Once the underlying forecasted transaction is realized, the gain or loss from the derivative is reclassified from other comprehensive income (loss) to the consolidated statements of operations, in the related revenue caption, as appropriate. Gains and losses on the derivative instruments representing either hedge ineffectiveness or hedge components excluded from the assessment of effectiveness are recognized immediately in other (expense) income, net, in the consolidated statements of operations.
As of fiscal year end 2009, we had one currency forward contract that was entered into to hedge a forecasted transaction.
Non-designated hedges
Forward exchange contracts are generally used to hedge certain non-U.S. dollar denominated assets or liabilities. These derivatives are not designated for hedge accounting treatment. Accordingly, these outstanding non-designated derivatives are recognized on the balance sheet at fair value and changes in the fair value of these hedges are recorded in other (expense) income, net, in the consolidated statements of operations.
The following table provides the types of derivative instruments outstanding as of fiscal year end 2009 (amounts in thousands):
| Fair Values of Derivative Instruments | |||||||||||
| Asset Derivatives | Liability Derivatives | ||||||||||
| Balance Sheet Location |
Fair Value | Balance Sheet Location |
Fair Value | ||||||||
| Derivatives designated as hedging instruments: |
|||||||||||
| Foreign exchange contracts |
Other assets | $ | — | Other liabilities | $ | (11 | ) | ||||
| Derivatives not designated as hedging instruments: |
|||||||||||
| Foreign exchange contracts |
Other assets | $ | — | Other liabilities | $ | (1,196 | ) | ||||
The following table provides the effect derivative instruments had on accumulated other comprehensive income (loss) and the consolidated statement of operations for fiscal year end 2009:
| Derivatives in Cash Flow Hedging |
Amount of Gain (Loss) Recognized in Other Comprehensive Income on Derivative (Effective Portion) |
Gain (Loss) Reclassified from Accumulated Other Comprehensive Income into Income (Effective Portion) |
Gain (Loss) Recognized in Income on Derivative (Ineffective Portion and Amount Excluded from Effectiveness Testing) | ||||||||||||
| (Amounts in thousands) |
Amount | Location | Amount | Location | Amount | ||||||||||
| Foreign exchange contracts |
$ | (1,821 | ) | Product revenue |
$ | (1,719 | ) | Other (expense) income, net |
$ | 113 | |||||
| Derivatives Not Designated as |
Gain or (Loss) Recognized in Income on Derivative | ||||||||||||||
| (Amounts in thousands) |
Location | Amount | |||||||||||||
| Foreign exchange contracts |
Other (expense) income, net |
$(4,247) | |||||||||||||
F-26
Table of Contents
VARIAN SEMICONDUCTOR EQUIPMENT ASSOCIATES, INC.
NOTES TO THE CONSOLIDATED FINANCIAL STATEMENTS—(Continued)
Note 17. Forward Exchange Contracts
As a multinational company, we face exposure to adverse movements in foreign currency exchange rates. This exposure may change over time as our business practices evolve and could impact our financial results. Historically, our primary exposures have resulted from non-U.S. dollar-denominated sales and purchases in Asia Pacific and Europe. We do not enter into forward exchange contracts for trading purposes. Our forward exchange contracts generally range from one to nine months in original maturity. No forward exchange contract exceeds one year in original maturity.
We hedge currency exposures that are associated with certain of our assets and liabilities denominated in various non-U.S. dollar currencies. The aggregate exchange losses for fiscal years 2009, 2008 and 2007 were approximately $0.4 million, $0.3 million and $0.3 million, respectively.
Forward exchange contracts outstanding are summarized as follows:
| Fiscal Year End 2009 | Fiscal Year End 2008 | |||||||||||||||||
| Notional Value |
Contract Rate |
Estimated Fair Value- Gain (Loss) |
Notional Value |
Contract Rate |
Estimated Fair Value- Gain (Loss) |
|||||||||||||
| (Dollars in thousands) | ||||||||||||||||||
| Foreign currency purchase contracts: |
||||||||||||||||||
| Singapore Dollar |
$ | 1,460 | 1.43 | $ | 24 | $ | 3,573 | 1.42 | $ | (54 | ) | |||||||
| Korean Won |
6,289 | 1,182.13 | 15 | 2,750 | 1,129.65 | (215 | ) | |||||||||||
| Japanese Yen |
— | — | — | 2,808 | 105.44 | (7 | ) | |||||||||||
| Euro |
1,143 | 1.43 | 23 | 2,342 | 0.71 | (31 | ) | |||||||||||
| Total foreign currency purchase contracts |
$ | 8,892 | $ | 62 | $ | 11,473 | $ | (307 | ) | |||||||||
| Foreign currency sell contracts: |
||||||||||||||||||
| Japanese Yen |
$ | 17,946 | 92.00 | $ | (448 | ) | $ | 38,477 | 106.11 | $ | (434 | ) | ||||||
| Korean Won |
13,318 | 1,250.50 | (806 | ) | 13,660 | 1,084.26 | 1,574 | |||||||||||
| Israeli Shekel |
1,053 | 3.80 | (7 | ) | 1,088 | 3.60 | (35 | ) | ||||||||||
| New Taiwan Dollar |
640 | 32.70 | (11 | ) | 1,009 | 32.02 | 5 | |||||||||||
| Total foreign currency sell contracts |
$ | 32,957 | $ | (1,272 | ) | $ | 54,234 | $ | 1,110 | |||||||||
| Total contracts |
$ | 41,849 | $ | (1,210 | ) | $ | 65,707 | $ | 803 | |||||||||
We use derivative instruments to protect our foreign operations from fluctuations in earnings and cash flows caused by volatility in currency exchange rates. We hedge our current exposures and a portion of our anticipated foreign currency exposures with hedging instruments having terms of up to twelve months.
Our international sales, except for those in Japan, are primarily denominated in the U.S. dollar. For foreign currency-denominated sales, however, the volatility of the foreign currency markets represents risk to us. Upon forecasting the exposure, we enter into hedges with forward sales contracts whose critical terms are designed to match those of the underlying exposure. These hedges are evaluated for effectiveness at least quarterly using the change in value of the forward contracts to the change in value of the underlying transaction, with the effective portion of the hedge accumulated in other comprehensive income. Any measured ineffectiveness is included immediately in other income and expense in the consolidated statements of operations. There was an immaterial amount of ineffectiveness recognized during fiscal years 2009 and 2008.
F-27
Table of Contents
VARIAN SEMICONDUCTOR EQUIPMENT ASSOCIATES, INC.
NOTES TO THE CONSOLIDATED FINANCIAL STATEMENTS—(Continued)
Note 18. Income Taxes
Provision for income taxes:
| Fiscal Year | ||||||||||||
| 2009 | 2008 | 2007 | ||||||||||
| (Amounts in thousands) | ||||||||||||
| Current |
||||||||||||
| U.S. Federal |
$ | (2,172 | ) | $ | 46,343 | $ | 117,984 | |||||
| State |
9 | 1,274 | 2,499 | |||||||||
| Foreign |
958 | 10,220 | 10,156 | |||||||||
| Total current |
(1,205 | ) | 57,837 | 130,639 | ||||||||
| Deferred |
||||||||||||
| U.S. Federal |
(190 | ) | 5,573 | 5,576 | ||||||||
| State |
(9 | ) | 249 | 249 | ||||||||
| Foreign |
(79 | ) | (2,264 | ) | (4,205 | ) | ||||||
| Total deferred |
(278 | ) | 3,558 | 1,620 | ||||||||
| Provision for income taxes |
$ | (1,483 | ) | $ | 61,395 | $ | 132,259 | |||||
Total pre-tax income consists of the following:
| Fiscal Year | |||||||||||
| 2009 | 2008 | 2007 | |||||||||
| (Amounts in thousands) | |||||||||||
| U.S |
$ | (18,345 | ) | $ | 100,247 | $ | 298,706 | ||||
| Foreign |
(21,136 | ) | 60,664 | (22,038 | ) | ||||||
| Total |
$ | (39,481 | ) | $ | 160,911 | $ | 276,668 | ||||
The effective tax rate on income before taxes differs from the U.S. federal statutory tax rate as a result of the following:
| Fiscal Year | |||||||||
| 2009 | 2008 | 2007 | |||||||
| U.S. Federal statutory rate |
35.0 | % | 35.0 | % | 35.0 | % | |||
| State taxes, net |
— | 0.9 | 0.8 | ||||||
| Domestic manufacturing/Export sales incentive |
— | (0.5 | ) | (0.8 | ) | ||||
| Research and development tax credits |
2.0 | (2.9 | ) | (1.8 | ) | ||||
| Foreign tax differential and net U.S. tax on foreign income |
(27.0 | ) | 6.2 | 14.7 | |||||
| Tax return adjustments |
(2.9 | ) | (1.3 | ) | |||||
| Other |
(3.3 | ) | 0.8 | (0.1 | ) | ||||
| Effective tax rate |
3.8 | % | 38.2 | % | 47.8 | % | |||
As of fiscal year end 2009, we did not have any net unremitted foreign earnings. It is our intention to indefinitely reinvest future foreign earnings in non-U.S. operations. Due to actions taken in connection with the realignment of legal entities in fiscal years 2008 and 2007, we reported U.S. tax in those years on most of our prior unremitted foreign earnings.
F-28
Table of Contents
VARIAN SEMICONDUCTOR EQUIPMENT ASSOCIATES, INC.
NOTES TO THE CONSOLIDATED FINANCIAL STATEMENTS—(Continued)
The components of the deferred tax assets and liabilities were as follows:
| Fiscal Year End | ||||||||
| 2009 | 2008 | |||||||
| (Amounts in thousands) | ||||||||
| Deferred tax assets (liabilities): |
||||||||
| Inventory |
$ | 9,904 | $ | 8,911 | ||||
| Product warranty |
535 | 1,392 | ||||||
| Deferred revenue |
1,881 | 3,572 | ||||||
| Accrued vacation and other compensation |
4,310 | 5,889 | ||||||
| Allowance for doubtful accounts |
181 | 208 | ||||||
| State tax credit carryforwards |
10,608 | 9,119 | ||||||
| Stock compensation |
7,242 | 4,752 | ||||||
| Net operating loss |
6,800 | 4,232 | ||||||
| Property, plant and equipment |
(3,018 | ) | (2,832 | ) | ||||
| Other |
(208 | ) | 401 | |||||
| Total deferred tax assets (liabilities) |
38,235 | 35,644 | ||||||
| Less: Valuation allowance |
(13,309 | ) | (10,996 | ) | ||||
| Total net deferred tax assets |
$ | 24,926 | $ | 24,648 | ||||
Deferred tax assets and liabilities are recognized for the expected tax consequences of temporary differences between the tax bases of assets and liabilities and their reported amounts. Deferred tax assets include gross state tax credit carryforwards of $19.5 million, $17.0 million and $18.6 million at fiscal year end 2009, 2008 and 2007, respectively. These credits begin to expire in fiscal year 2018. Net operating losses included in deferred tax assets begin to expire in 2014.
We record a valuation allowance against deferred tax assets if it is more likely than not that a portion of the deferred tax asset will not be realized. We evaluate both the positive and negative evidence bearing upon the realizability of our deferred tax assets. We consider future taxable income, ongoing prudent and feasible tax planning strategies and the ability to utilize tax losses and credits in assessing the need for a valuation allowance. A valuation allowance related to certain state tax credit carryforwards has been recorded. Although, due to the global reorganization, we have increased our utilization of state tax credits, management has concluded that it is more likely than not that a portion of these credits will not be utilized, since historically the annual amount of state credits generated exceeds the amount of credits that can be used. We record a benefit to the tax provision and corresponding reduction in the valuation allowance related to the utilization of state tax credits generated in prior years. Should we determine that we are not able to realize all or part of our other deferred tax assets in the future, a valuation allowance would be required resulting in an expense recorded within the provision for income taxes in the statement of income in the period in which such determination was made. It is possible that the amount of the deferred tax asset considered realizable could be reduced in the near term, if our forecast of future taxable income is reduced. Our effective tax rate is affected by levels of taxable income in domestic and foreign tax jurisdictions, U.S. tax credits generated and utilized for research and development expenditures, U.S. foreign income exclusion, investment tax credits and other tax incentives specific to domestic and foreign operations.
We benefit from tax holidays on approved investments in Singapore and Switzerland. These tax holidays are scheduled to expire at varying times within the next one to four years and are extendable for a maximum of an additional five years provided that certain commitments are met. As a result of the tax holidays, our net income was lower by $0.9 million ($0.01 per share), higher by $2.4 million ($0.03 per share) and lower by $0.1 million
F-29
Table of Contents
VARIAN SEMICONDUCTOR EQUIPMENT ASSOCIATES, INC.
NOTES TO THE CONSOLIDATED FINANCIAL STATEMENTS—(Continued)
($0.00 per share) for fiscal years 2009, 2008, and 2007, respectively. The benefit of losses incurred in Switzerland in fiscal years 2009 and 2007 at a reduced rate, resulted in an overall negative impact of the tax holidays to the financial statements in those years.
In fiscal years 2009, 2008 and 2007, tax deductions associated with certain exercises of stock options, activity related to our ESPP and vesting of certain restricted stock shares resulted in a tax benefit recorded to capital in excess of par value of $0.6 million, $2.6 million and $21.7 million, respectively. We have elected to account for the indirect benefits of stock-based compensation on the research tax credit, extraterritorial income deduction and qualified production deduction through the statement of operations rather than through paid-in-capital.
We adopted the accounting standard which provides guidance for accounting for uncertainty in income taxes at fiscal year end 2007. The adoption of this accounting standard resulted in a reduction in retained earnings of $1.7 million.
The aggregate changes in the balances of gross unrecognized tax benefits were as follows:
| Fiscal Year | ||||||||
| 2009 | 2008 | |||||||
| (In thousands) | ||||||||
| Beginning Balance |
$ | 52,394 | $ | 40,758 | ||||
| Increases for tax positions taken in prior years |
650 | 1,587 | ||||||
| Decreases for tax positions taken in prior years |
(1,117 | ) | (341 | ) | ||||
| Increases for tax positions taken in current years |
4,894 | 10,390 | ||||||
| Decreases for lapsing of the statute of limitations |
(1,786 | ) | — | |||||
| Ending Balance |
$ | 55,035 | $ | 52,394 | ||||
The net increase in the reserve for unrecognized tax benefits during fiscal year 2009 was $4.4 million for positions taken in the current year. Of the $55.0 million of unrecognized tax benefits, $53.0 million would impact the effective tax rate, if recognized. The difference between the total amount of unrecognized tax benefits and the amount that would impact the effective rate consists of items that are offset by deferred tax assets, relating to state tax credits which are fully offset by a valuation allowance. We will reexamine the tax provision and the effect of estimated unrecognized tax benefits on our financial position at the end of each reporting period. As of fiscal year end 2009 and 2008, we accrued $4.1 million and $3.1 million, respectively, of interest and penalties related to unrecognized tax benefits. We include interest and penalties related to unrecognized tax benefits within our provision for income taxes.
We and our subsidiaries are subject to examination by federal, state and foreign tax authorities. The statute of limitations for our tax filings with federal, state and foreign tax authorities is generally open for fiscal years 2003 through the present. The Internal Revenue Service, or IRS, commenced an examination of fiscal year 2007 in December of 2008. The IRS completed examinations of certain refund claims filed for fiscal years from 2002 to 2004 and we filed a protest of the refund claim audit findings with the Appeals Office of the IRS. The IRS audit of fiscal year 2007 is continuing. It is unknown whether agreement on the refund claims or resolution of the IRS audit of fiscal 2007 will be reached within the next twelve months. The favorable resolution of the refund claims could result in a benefit to the tax provision in the range of $0.0 to $5.8 million, excluding interest. Based on the status of the IRS audit, it is not possible to estimate the impact of the amount of any changes to our previously recorded uncertain tax positions. It is reasonably possible that up to $3.7 million of unrecognized tax positions may be recognized within one year as the result of the lapse of statutes of limitations.
F-30
Table of Contents
VARIAN SEMICONDUCTOR EQUIPMENT ASSOCIATES, INC.
NOTES TO THE CONSOLIDATED FINANCIAL STATEMENTS—(Continued)
Note 19. Computation of Net (Loss) Income Per Share
Basic net (loss) income per share is calculated using net (loss) income and the weighted average number of shares of common stock outstanding during the reporting period. Diluted net (loss) income per share includes additional dilution from stock issuable pursuant to the exercise of stock options outstanding and unvested restricted stock. Options to purchase common shares with exercise prices that exceeded the market value of the underlying common stock are excluded from the computation of diluted earnings per share. For purposes of the diluted net (loss) income per share calculation, the additional shares issuable upon exercise of stock options are determined using the treasury stock method, which includes as assumed proceeds share-based compensation expense and the tax effect of such compensation.
The calculation of assumed proceeds, used to determine diluted weighted average shares outstanding under the treasury stock method is adjusted by tax windfalls and shortfalls associated with outstanding stock awards. Windfalls and shortfalls are computed by comparing the tax deductible amount of outstanding stock awards to their grant date fair values and multiplying the result by the applicable statutory tax rate. A positive result creates a windfall, which increases the assumed proceeds and a negative result creates a shortfall, which reduces the assumed proceeds.
A reconciliation of the numerator and denominator used in the net (loss) income per share calculations is presented as follows:
| Fiscal Year | ||||||||||
| 2009 | 2008 | 2007 | ||||||||
| (Amounts in thousands, except per share data) | ||||||||||
| Numerator |
||||||||||
| Net (loss) income |
$ | (37,998 | ) | $ | 99,516 | $ | 144,409 | |||
| Denominator |
||||||||||
| Denominator for basic net (loss) income per share: |
||||||||||
| Weighted average shares outstanding |
72,321 | 73,318 | 80,151 | |||||||
| Effect of dilutive securities: |
||||||||||
| Stock options and restricted common stock |
— | 1,401 | 2,069 | |||||||
| Denominator for diluted net (loss) income per share |
72,321 | 74,719 | 82,220 | |||||||
| Net (loss) income per share—basic |
$ | (0.53 | ) | $ | 1.36 | $ | 1.80 | |||
| Net (loss) income per share—diluted |
$ | (0.53 | ) | $ | 1.33 | $ | 1.76 | |||
For fiscal years 2009, 2008 and 2007, 4.1 million, 1.0 million and 0.3 million potentially dilutive shares, respectively, were excluded from the computation of diluted earnings per share as the effect would be anti-dilutive.
Note 20. Share Repurchase Plan
In October 2004, our Board of Directors authorized the repurchase, from time to time, of up to $100.0 million of our common stock on the open market. Subsequently, the Board of Directors voted on increases to the amount of funds that may be expended in repurchasing our common stock to a total of $800.0 million. The program does not have a fixed expiration date. As of fiscal year end 2009, $85.6 million remained available for repurchase under the existing repurchase authorization. In fiscal year 2008, we repurchased 4.8 million shares at an average
F-31
Table of Contents
VARIAN SEMICONDUCTOR EQUIPMENT ASSOCIATES, INC.
NOTES TO THE CONSOLIDATED FINANCIAL STATEMENTS—(Continued)
price of $37.74 for the total cost of $179.5 million. We did not make any common stock repurchases in fiscal year 2009 or between October 3, 2009 and November 16, 2009, the latest practicable date prior to the filing date of this annual report on Form 10-K.
Note 21. Retirement Plans
We have a defined contribution retirement plan covering substantially all of our U.S. employees. Generally, we make a guaranteed contribution, and in some years a discretionary contribution, to each participant’s account, generally calculated on fiscal year earnings and as a percentage of the participant’s base pay. Participants are entitled, upon termination or retirement, to their portion of the retirement fund assets, which are held by a third-party custodian. In addition, in connection with the spin-off from Varian Associates, Inc, we have retirement plan liabilities. We also have two subsidiaries which sponsor defined benefit pension plans.
Liabilities for post-employment and post-retirement benefits of $8.6 million and $6.9 million have been included in the consolidated financial statements as of fiscal year end 2009 and 2008, respectively. In fiscal years 2009, 2008 and 2007, our retirement benefit expense was $2.0 million, $7.6 million and $8.6 million, respectively. These expenses consist of our defined contribution retirement plan, defined benefit pension plans and amounts paid to Varian Medical Systems, Inc., or VMS, in reimbursement of shared retirement costs. Our defined contribution retirement plan operates on a calendar year basis and beginning January 1, 2009 corporate contributions were suspended for the year due to cost reduction efforts in response to the industry downturn.
Note 22. Lease Commitments
We lease various types of warehouse and office facilities and equipment, furniture and fixtures under non-cancelable lease agreements that expire at various dates. Future minimum lease payments under operating leases are as follows:
| Fiscal Year |
Operating Leases | ||
| (Amounts in thousands) | |||
| 2010 |
$ | 1,704 | |
| 2011 |
737 | ||
| 2012 |
444 | ||
| 2013 |
178 | ||
| 2014 |
12 | ||
| 2015 |
— | ||
| Total minimum lease payments |
$ | 3,075 | |
Rental expense for fiscal years 2009 and 2008 was $3.1 million, respectively. In fiscal year 2007 rental expense was $2.4 million.
Note 23. Commitments, Contingencies and Guarantees
From time to time, we may be named a defendant in legal actions and could incur an uninsured liability in one or more of them. In the opinion of management, there are presently no legal actions where the outcome would have a material adverse effect on our consolidated financial position, results of operations or cash flows.
As permitted under Delaware law, we have agreements whereby we indemnify our officers and directors for certain events or occurrences while the officer or director is, or was, serving in such capacity at our request. The term of the indemnification period is upon the later of (i) ten years after the person has ceased being an officer or
F-32
Table of Contents
VARIAN SEMICONDUCTOR EQUIPMENT ASSOCIATES, INC.
NOTES TO THE CONSOLIDATED FINANCIAL STATEMENTS—(Continued)
director, or (ii) the termination of all pending or threatened actions, suits, proceedings or investigations. The maximum potential amount of future payments we could be required to make under these indemnification agreements is unlimited; however, we have a director and officer insurance policy that limits our exposure and enables us to recover a portion of any future amounts paid. As a result of our insurance policy coverage, we believe the estimated fair value of these indemnification agreements is minimal. Accordingly, we have not recorded any liabilities for these agreements as of fiscal year end 2009.
We enter into indemnification agreements in the normal course of business. Pursuant to these agreements, we indemnify, hold harmless, and agree to reimburse the indemnified party for losses suffered or incurred by the indemnified party, generally our customers, in connection with any patent, or any copyright or other intellectual property infringement claim by any third party with respect to our products. The term of these indemnification agreements is generally perpetual any time after execution of the agreement. The maximum potential amount of future payments we could be required to make under these indemnification agreements may be unlimited. We believe the estimated fair value of these agreements is minimal. Accordingly, we have not recorded any liabilities for these agreements as of fiscal year end 2009.
We also indemnify certain customers with respect to damages, losses and liabilities they may suffer or incur relating to personal injury, personal property damage, product liability, and environmental claims related to the use of our products and services or resulting from the acts or omissions of us, our employees, officers, authorized agents or subcontractors. We have general and umbrella insurance policies that limit our exposure under these indemnification obligations and guarantees. As a result of our insurance policy coverage, we believe the estimated fair value of these indemnification agreements is minimal. Accordingly, we have not recorded any liabilities for these agreements as of fiscal year end 2009.
Prior to the spin-off of Varian Semiconductor from Varian Associates, Inc., or VAI, Varian Semiconductor’s business was operated as the Semiconductor Equipment Business, or SEB, of VAI. On April 2, 1999, VAI contributed its SEB to Varian Semiconductor, its Instruments Business to Varian, Inc., or VI, and changed its name to Varian Medical Systems, Inc., or VMS. In connection with the spin-off from VAI, Varian Semiconductor, VMS and VI entered into certain agreements which include a Distribution Agreement, an Employee Benefits Allocation Agreement, an Intellectual Property Agreement, a Tax Sharing Agreement, and a Transition Services Agreement, collectively, the Distribution Related Agreements, whereby Varian Semiconductor agreed to indemnify VMS and VI for any costs, liabilities or expenses relating to Varian Semiconductor’s legal proceedings. Under the Distribution Related Agreements, Varian Semiconductor has agreed to reimburse VMS for one-third of the costs, liabilities, and expenses, adjusted for any related tax benefits recognized or realized by VMS, with respect to certain legal proceedings relating to discontinued operations of VMS. We believe the estimated fair value of the indemnification agreements is minimal, except as already recorded on the financial statements.
Our operations are subject to various foreign, federal, state and/or local laws relating to the protection of the environment. These include laws regarding discharges into soil, water and air, and the generation, handling, storage, transportation and disposal of waste and hazardous substances. In addition, several countries are reviewing proposed regulations that would require manufacturers to dispose of their products at the end of a product’s useful life. These laws have the effect of increasing costs and potential liabilities associated with the conduct of certain operations.
We also enter into purchase order commitments in the normal course of business. As of fiscal year end 2009, we had approximately $48.5 million of purchase order commitments with various suppliers.
F-33
Table of Contents
VARIAN SEMICONDUCTOR EQUIPMENT ASSOCIATES, INC.
NOTES TO THE CONSOLIDATED FINANCIAL STATEMENTS—(Continued)
Environmental Remediation
VAI has been named by the United States Environmental Protection Agency and third parties as a potentially responsible party under the Comprehensive Environmental Response Compensation and Liability Act of 1980, at eight sites where VAI is alleged to have shipped manufacturing waste for recycling or disposal. VAI is also involved in various stages of environmental investigation and/or remediation under the direction of, or in consultation with, foreign, federal, state and/or local agencies at certain current or former VAI facilities (including facilities disposed of in connection with VAI’s sale of its Electron Devices business during fiscal year 1995, and the sale of its Thin Film Systems business during fiscal year 1997). The Distribution Related Agreements provide that each of VMS, Varian Semiconductor and VI will indemnify the others for one-third of these environmental investigation and remediation costs, as adjusted for any insurance proceeds and tax benefits expected to be realized upon payment of these costs.
For certain of these sites and facilities, various uncertainties make it difficult to assess the likelihood and scope of further investigation or remediation activities or to estimate the future costs of such activities if undertaken. Per the estimates provided by VMS, we have accrued $1.0 million and $1.1 million, respectively, in estimated environmental investigation and remediation costs for these sites and facilities as of fiscal year end 2009 and 2008. As to other sites and facilities, sufficient knowledge has been gained to be able to reasonably estimate the scope and costs of future environmental activities. As such, we have accrued $4.0 million and $4.0 million, respectively, as of fiscal year end 2009 and 2008, which represents future costs discounted at 7%, net of inflation, to cover our portion of these costs. This reserve is in addition to the $1.0 million and $1.1 million, respectively, as of fiscal year end 2009 and 2008, as previously described.
As of fiscal year end 2009, our environmental liability, based upon future environmental-related costs estimated by VMS as of that date and included in current and long-term accrued expenses, is calculated as follows:
| Year |
Recurring Costs |
Non-recurring Costs |
Total Anticipated Future Costs | ||||||
| (Amounts in millions) | |||||||||
| 2010 |
$ | 0.4 | $ | 0.4 | $ | 0.8 | |||
| 2011 |
0.2 | 0.4 | 0.6 | ||||||
| 2012 |
0.2 | 0.2 | 0.4 | ||||||
| 2013 |
0.2 | 0.2 | 0.4 | ||||||
| 2014 |
0.2 | 0.2 | 0.4 | ||||||
| Thereafter |
3.2 | 0.7 | 3.9 | ||||||
| Total costs |
$ | 4.4 | $ | 2.1 | 6.5 | ||||
| Less: imputed interest |
1.5 | ||||||||
| Environmental liability |
$ | 5.0 | |||||||
As of fiscal year end 2009, the current portion of the reserve is $0.8 million and the long-term portion of the reserve is $4.2 million, which is included in long-term accrued expenses.
The amounts set forth in the foregoing table are only estimates of anticipated future environmental-related costs and the amounts actually spent in the years indicated may be greater or less than such estimates. The aggregate range of cost estimates reflects various uncertainties inherent in many environmental investigation and remediation activities and the large number of sites where VMS is undertaking such investigation and remediation activities. VMS believes that most of these cost ranges will narrow as investigation and remediation
F-34
Table of Contents
VARIAN SEMICONDUCTOR EQUIPMENT ASSOCIATES, INC.
NOTES TO THE CONSOLIDATED FINANCIAL STATEMENTS—(Continued)
activities progress. We believe our reserves are adequate, but as the scope of the obligations become more clearly defined, these reserves may be modified and related charges against income may be made.
Although any ultimate liability arising from environmental-related matters described herein could result in significant expenditures that, if aggregated and assumed to occur within a single fiscal year, would be material to our financial statements, the likelihood of such occurrence is considered remote. Based on information currently available to management and our best assessment of the ultimate amount and timing of environmental-related events, our management believes that the costs of these environmental-related matters are not reasonably likely to have a material adverse effect on our consolidated financial statements.
We evaluate our liability for environmental-related investigation and remediation in light of the liability and financial wherewithal of potentially responsible parties and insurance companies where we believe that we have rights to contribution, indemnity and/or reimbursement. Claims for recovery of environmental investigation and remediation costs already incurred, and to be incurred in the future, have been asserted against various insurance companies and other third parties. In 1992, VAI filed a lawsuit against 36 insurance companies with respect to most of the above-referenced sites and facilities. VAI received certain cash settlements with respect to these lawsuits in prior years. VMS has also reached an agreement with an insurance company under which the insurance company agreed to pay a portion of our past and future environmental-related expenditures. Although VMS intends to aggressively pursue additional insurance recoveries, we have not reduced any liability in anticipation of recovery with respect to claims made against third parties.
Legal Proceedings
We are currently a party to legal disputes. While we believe we have meritorious claims and/or defenses with respect to each dispute, we cannot predict the outcome of each such dispute. Management believes that the ultimate outcome of these disputes, individually and in the aggregate, will not have a material adverse effect on our financial condition or results of our operations.
Note 24. Settlements and License Agreements
Pursuant to the dispute resolution provisions of an Agreement dated January 1, 1992 (“the Agreement”) between us and Applied Materials, in September 2002 we filed an arbitration demand with the American Arbitration Association asserting that Applied Materials breached the Agreement by failing to pay royalties on products we believed were covered by the Agreement’s patent license to Applied Materials. In our arbitration demand, we sought to recover back royalties, interest and attorneys’ fees. On May 2, 2003, the arbitration panel issued its decision that certain of Applied Materials’ products were subject to royalty obligations under the Agreement, and on September 1, 2004, the arbitration panel ruled that the patents at issue in the arbitration were valid and enforceable. Applied Materials made an initial payment of $22.0 million for back royalties and interest on October 4, 2004 and a final payment of $2.6 million for back interest and royalties on November 8, 2004. Applied Materials also was required to pay quarterly unit-based royalty payments to us on sales of certain products found to be within the scope of the Agreement through expiration of the Agreement on March 20, 2007.
In fiscal years 2009 and 2008, we recorded less than $0.1 million in royalty and license revenues, respectively, compared to $7.5 million in fiscal year 2007. The last of the principal patents covered by these licenses expired on March 20, 2007.
Note 25. Other Transactions with Affiliates
Varian Semiconductor, VMS and VI entered into the Distribution Related Agreements for purposes of providing an orderly transition and to define certain ongoing relationships between and among Varian Semiconductor, VMS and VI after the spin-off.
F-35
Table of Contents
VARIAN SEMICONDUCTOR EQUIPMENT ASSOCIATES, INC.
NOTES TO THE CONSOLIDATED FINANCIAL STATEMENTS—(Continued)
The Distribution Related Agreements provide that, from and after the spin-off, VMS, VI and Varian Semiconductor indemnify each other and their respective subsidiaries, directors, officers, employees and agents against all losses arising in connection with shared liabilities, including certain environmental and legal liabilities. All shared liabilities are managed and administered by VMS and expenses and losses, net of proceeds and other receivables, are borne one-third each by VMS, VI and Varian Semiconductor. The Distribution Related Agreements also provide we shall assume all of our liabilities, other than shared liabilities, including accounts payable, accrued payroll and pension liabilities, in accordance with their terms. During fiscal years 2009, 2008 and 2007, we were charged $0.8 million, $1.0 million and $0.9 million, respectively, by VMS in settlement of these obligations. Our accounts payable balances due to VMS at fiscal year end 2009 and 2008 were $0.1 million, respectively.
Note 26. Operating Segments and Geographic Information
We have determined that we operate in one business segment: the manufacturing, marketing and servicing of semiconductor processing equipment for ion implantation systems. Since we operate in one segment, all financial segment information can be found in the consolidated financial statements.
Revenue from our ten largest customers in fiscal years 2009, 2008 and 2007 accounted for approximately 73%, 74% and 72% of total revenue, respectively. In fiscal year 2009, revenue from Intel and tsmc accounted for 21% and 16%, respectively, of our total revenue. In fiscal year 2008, revenue from Samsung and Intel accounted for 16% and 13%, respectively of our total revenue. In fiscal year 2007, revenue from Samsung accounted for 17% of our total revenue.
Sales to Asia Pacific accounted for 63%, 70% and 71% of revenues in fiscal years 2009, 2008 and 2007, respectively. Our North American sales accounted for 28%, 22% and 22% of total revenues in fiscal years 2009, 2008 and 2007. European sales accounted for 9%, 8% and 7% of our total revenues in fiscal years 2009, 2008 and 2007, respectively.
The following table summarizes revenue based on final destination and long-lived assets by geography:
| North America |
Europe | Japan | Taiwan | Korea | Other | Consolidated | |||||||||||||||
| (Amounts in thousands) | |||||||||||||||||||||
| Fiscal Year 2009 |
|||||||||||||||||||||
| Revenue |
$ | 103,257 | $ | 31,716 | $ | 48,751 | $ | 97,950 | $ | 36,279 | $ | 44,128 | $ | 362,081 | |||||||
| Long-Lived Assets |
67,244 | 1,056 | 150 | 430 | 5,024 | 224 | 74,128 | ||||||||||||||
| Fiscal Year 2008 |
|||||||||||||||||||||
| Revenue |
$ | 185,883 | $ | 62,635 | $ | 56,678 | $ | 261,391 | $ | 154,417 | $ | 113,057 | $ | 834,061 | |||||||
| Long-Lived Assets |
60,617 | 379 | 296 | 553 | 7,055 | 345 | 69,245 | ||||||||||||||
| Fiscal Year 2007 |
|||||||||||||||||||||
| Revenue |
$ | 232,141 | $ | 73,341 | $ | 65,314 | $ | 283,562 | $ | 235,054 | $ | 165,452 | $ | 1,054,864 | |||||||
| Long-Lived Assets |
68,193 | 403 | 402 | 430 | 8,989 | 437 | 78,854 | ||||||||||||||
F-36
Table of Contents
VALUATION AND QUALIFYING ACCOUNTS
(Amounts in thousands)
| Description |
Beginning of Period |
Charges to Expenses |
Charged to Other Accounts |
Deductions | Balance at End of Period | ||||||||||||||
| Description | Amount | ||||||||||||||||||
| Allowance for Doubtful Accounts & Accounts Receivable |
|||||||||||||||||||
| Fiscal Year End 2009 |
$ | 1,280 | $ | 480 | $ | (2 | ) | Write-offs & adjustments | $ | 6 | $ | 1,752 | |||||||
| Fiscal Year End 2008 |
$ | 560 | $ | 807 | $ | (72 | ) | Write-offs & adjustments | $ | 15 | $ | 1,280 | |||||||
| Fiscal Year End 2007 |
$ | 908 | $ | 54 | $ | (211 | ) | Write-offs & adjustments | $ | 191 | $ | 560 | |||||||
| Excess and Obsolete Inventory Provision |
|||||||||||||||||||
| Fiscal Year End 2009 |
$ | 29,870 | $ | 9,640 | $ | — | Write-offs & adjustments | $ | 6,962 | $ | 32,548 | ||||||||
| Fiscal Year End 2008 |
$ | 23,738 | $ | 8,544 | $ | — | Write-offs & adjustments | $ | 2,412 | $ | 29,870 | ||||||||
| Fiscal Year End 2007 |
$ | 22,918 | $ | 3,443 | $ | — | Write-offs & adjustments | $ | 2,623 | $ | 23,738 | ||||||||
| Valuation Allowance on Deferred Tax Asset |
|||||||||||||||||||
| Fiscal Year End 2009 |
$ | 10,996 | $ | 2,313 | $ | — | Write-offs & adjustments | $ | — | $ | 13,309 | ||||||||
| Fiscal Year End 2008 |
$ | 12,089 | $ | (1,093 | ) | $ | — | State tax credit carryforwards | $ | — | $ | 10,996 | |||||||
| Fiscal Year End 2007 |
$ | 9,050 | $ | 3,039 | $ | — | State tax credit carryforwards | $ | — | $ | 12,089 | ||||||||
S-1