Attached files
| file | filename |
|---|---|
| EX-23.1 - EX-23.1 - AMERICAN ITALIAN PASTA CO | a2195602zex-23_1.htm |
| EX-32 - EX-32 - AMERICAN ITALIAN PASTA CO | a2195602zex-32.htm |
| EX-21 - EX-21 - AMERICAN ITALIAN PASTA CO | a2195602zex-21.htm |
| EX-23.2 - EX-23.2 - AMERICAN ITALIAN PASTA CO | a2195602zex-23_2.htm |
| EX-10.1 - EX-10.1 - AMERICAN ITALIAN PASTA CO | a2195602zex-10_1.htm |
| EX-31.2 - EX-31.2 - AMERICAN ITALIAN PASTA CO | a2195602zex-31_2.htm |
| EX-31.1 - EX-31.1 - AMERICAN ITALIAN PASTA CO | a2195602zex-31_1.htm |
UNITED STATES
SECURITIES AND EXCHANGE COMMISSION
Washington, D.C. 20549
Form 10-K
| (Mark one) | ||
| ý | ANNUAL REPORT PURSUANT TO SECTION 13 OR 15(d) OF THE SECURITIES EXCHANGE ACT OF 1934 | |
| For the fiscal year ended October 2, 2009 | ||
| OR | ||
| o | TRANSITION REPORT PURSUANT TO SECTION 13 OR 15(d) OF THE SECURITIES EXCHANGE ACT OF 1934 | |
| For the transition period from to | ||
Commission file number 001-13403
AMERICAN ITALIAN PASTA COMPANY
(Exact name of registrant as specified in its charter)
| Delaware (State or other jurisdiction of incorporation or organization) |
84-1032638 (I.R.S. Employer Identification No.) |
|
4100 N. Mulberry Drive, Suite 200 Kansas City, Missouri (Address of principal executive offices) |
64116 (Zip Code) |
Registrant's telephone number, including area code: (816) 584-5000
Securities registered pursuant to Section 12(b) of the Act:
| Title of Each Class | Name of Each Exchange on Which Registered | |
|---|---|---|
| Class A Convertible Common Stock: $.001 par value per share |
The NASDAQ Stock Market, LLC |
Securities registered pursuant to Section 12(g) of the Act: None
Indicate by check mark if the registrant is a well-known seasoned issuer, as defined in Rule 405 of the Securities Act. Yes o No ý
Indicate by check mark if the registrant is not required to file reports pursuant to Section 13 or Section 15(d) of the Act. Yes o No ý
Indicate by check mark whether the registrant (1) has filed all reports required to be filed by Section 13 or 15(d) of the Securities Exchange Act of 1934 during the preceding 12 months (or for such shorter period that the registrant was required to file such reports), and (2) has been subject to such filing requirements for the past 90 days. Yes ý No o
Indicate by check mark whether the registrant has submitted electronically and posted on its corporate Web site, if any, every Interactive Data File required to be submitted and posted pursuant to Rule 405 of Regulation S-T (§232.405 of this chapter) during the preceding 12 months (or for such shorter period that the registrant was required to submit and post such files). Yes o No o
Indicate by check mark if disclosure of delinquent filers pursuant to Item 405 of Regulation S-K (§ 229.405 of this chapter) is not contained herein, and will not be contained, to the best of registrant's knowledge, in definitive proxy or information statements incorporated by reference in Part III of this Form 10-K or any amendment to this Form 10-K. ý
Indicate by check mark whether the registrant is a large accelerated filer, an accelerated filer, a non-accelerated filer, or a smaller reporting company. See definition of "large accelerated filer", "accelerated finer", and "smaller reporting company" in Rule 12b-2 of the Exchange Act. (Check one):
| Large accelerated filer o | Accelerated filer ý | Non-accelerated filer o (Do not check if a smaller reporting company) |
Smaller Reporting Company o |
Indicate by check mark whether the registrant is a shell company (as defined in Rule 12b-2 of the Act). Yes o No ý
As of April 3, 2009, the aggregate market value of the Registrant's Class A Convertible Common Stock held by non-affiliates (using the closing price) was approximately $676,000,000.
The number of shares outstanding as of November 12, 2009 of the Registrant's Class A Convertible Common Stock was 21,055,000 and there were no shares outstanding of the Registrant's Class B Convertible Common Stock.
DOCUMENTS INCORPORATED BY REFERENCE: Portions of the definitive Proxy Statement to be delivered to Stockholders in connection with the 2010 Annual Meeting of Stockholders are incorporated by reference in Part III.
AMERICAN ITALIAN PASTA COMPANY
FORM 10-K
FISCAL YEAR ENDED OCTOBER 2, 2009
INDEX
i
Cautionary Note Regarding Forward-Looking Statements
This Annual Report on Form 10-K contains statements concerning potential future events. These forward-looking statements are based upon assumptions by our management, as of the date of this Annual Report on Form 10-K, including assumptions about risks and uncertainties faced by us. Readers can identify these forward-looking statements by the use of verbs such as expects, anticipates, believes, estimates, intends, projects, may, will, predicts, or similar verbs or conjugations of such verbs. If any of our assumptions prove incorrect or should unanticipated circumstances arise, our actual results could materially differ from those anticipated by such forward-looking statements. The differences could be caused by a number of factors or combination of factors including, but not limited to, those factors described below in Item 1A—Risk Factors. Readers are strongly encouraged to consider those factors when evaluating any such forward-looking statements. Except as otherwise required by the federal securities laws, we will not update any forward-looking statements in this Annual Report on Form 10-K to reflect future events or developments.
ii
General
American Italian Pasta Company is a Delaware corporation and was incorporated and commenced operations in 1988. Unless the context otherwise indicates, all references in this Annual Report on Form 10-K to "the Company", "we", "us", "our", and similar words are to American Italian Pasta Company and its subsidiaries. We believe we are the largest producer and marketer of dry pasta in North America, by volume, based on data available from The Nielsen Company ("Nielsen"), published competitor financial information, industry sources such as the National Pasta Association, suppliers, trade magazines and our own market research.
We report on a 52/53 week fiscal year end that generally consists of four thirteen week quarters that end on the Friday nearest the end of the quarter. Approximately every sixth year we report on a 53-week fiscal year that results in a fourteen week first quarter of that fiscal year. Fiscal year 2009, which ended on October 2, 2009, was a 53-week fiscal year. Fiscal years 2008 and 2007 were 52 weeks and ended on September 26, 2008 and September 28, 2007, respectively. There is no material seasonal impact on our operations. During the 53-week fiscal year ended October 2, 2009, we had revenues of $628.2 million.
We have production, milling, and distribution facilities located in Excelsior Springs, Missouri, Columbia, South Carolina, Tolleson, Arizona, and Verolanuova, Italy. We outsource distribution at all of our facilities and we outsource milling at the Arizona and Italy plants. Our U.S. plants serve both retail and institutional customers. We believe the construction of the Missouri plant in 1988 represented the first use in North America of a vertically integrated, high-capacity pasta plant using Italian milling and pasta production technology. Our South Carolina plant, which is also vertically integrated, commenced operations in 1995, and our Arizona plant commenced operations in 2003. Our Italian plant, which was constructed in 2001, serves primarily retail and institutional customers internationally and also serves retail and institutional customers in the United States.
Our executive offices are located at 4100 N. Mulberry Drive, Suite 200, Kansas City, Missouri 64116, and our telephone number is (816) 584-5000. Our website is located at http://www.aipc.com. Our annual report on Form 10-K, quarterly reports on Form 10-Q, current reports on Form 8-K, and all amendments to those reports are made available on our website as soon as reasonably practical after these materials are electronically filed with or furnished to the Securities and Exchange Commission. Information contained in our website is not a part of this Annual Report on Form 10-K.
AIPC Way
We have developed the AIPC Way, which embodies our vision, mission, operational model, business approach, core capabilities and values. The components of the AIPC Way are as follows:
- •
- Vision—What we will achieve—To be, and to be seen as, the best developer of category solutions for
our customers in dry grocery.
- •
- Mission—What we will do—Focus on dry grocery categories where we can leverage our relationships
and capabilities, to develop private label, branded and ingredient solutions for our retail, foodservice and industrial customers and, by exceeding expectations, provide our customers and shareholders
with enhanced value.
- •
- Operating Model—How we plan and execute—Always operate with high ethical standards. Strategic planning. Business planning and performance management. Sales and operations planning. People evaluation and development.
1
- •
- Core Capabilities—What do we need to be great—Great people. Category leadership. Service
leadership. Speed to market. Operational excellence. Cross function collaboration. Strong customer relationships.
- •
- Values—What we believe—Integrity. Quality. Environmental sustainability. Empowerment and accountability. Passion to exceed.
Pasta Markets
North American sales represented approximately 93%, 92% and 93% of our total revenues during fiscal years 2009, 2008 and 2007, respectively. The remainder of our sales were primarily in Europe.
The North American retail pasta category in all its forms ("Mega Pasta") includes such categories as refrigerated pasta, frozen meals with pasta, canned non-soup pasta, and stove top meals. As measured by Nielsen, pasta sales for the Mega Pasta category were estimated to be approximately $6.9 billion in fiscal year 2009. Nielsen data does not include Wal-Mart Stores, Inc. ("Wal-Mart") or other mass merchants.
Our products are marketed in the dry pasta category, which is a component of Mega Pasta. We estimate category trends as reported by Nielsen based upon total U.S. grocery and mass merchants. According to these estimates, during the 52 week period ended September 26, 2009 (the date nearest our fiscal year end for which this information is available), the dry pasta market volume grew at a rate of approximately 4.5% as compared to the comparable prior 52 week period. With the economic downturn, more people are choosing to cook at home and are taking advantage of the many alternatives available with a versatile food such as dry pasta. Dry pasta offerings include traditional semolina pasta as well as alternative formulations such as whole-wheat, multi-grain, and omega-added. Consumption of traditional semolina pasta, which comprises approximately 90% of the pasta market when expressed as a percent of pounds consumed, increased 3.9% during the 52 weeks ending September 26, 2009. During the same period, consumption of alternative formulation pasta grew at a growth rate of 9.9%. In addition, across nearly every store product category, consumers have been taking advantage of lower priced private label alternatives to traditional branded label products. For the pasta category, during the 52 week period ending September 26, 2009, total volume brand growth was 2.2% and private label growth was 9.4%.
The pasta industry consists of two primary customer markets: (i) Retail, which includes grocery retailers, club stores, mass merchants, drug and discount stores that sell branded and private label pasta to consumers; and (ii) Institutional, which includes both food service distributors that supply restaurants, hotels, schools and hospitals, as well as food processors that use pasta as a food ingredient.
Customer Markets—Retail: Retail market revenues include the sales of our pasta products to customers who resell the pasta in retail channels, including traditional grocery retailers, club stores, mass merchants, drug and discount stores. Based on Nielsen, Wal-Mart, and other mass merchant data, we believe we are the leading producer of retail dry pasta in the U.S. Our retail revenues include the sale of both our proprietary brands and the sale of private label brands (or, as we refer to them, "customer brands"). Our strategy is to provide our retail partners with a full portfolio of pasta products, including proprietary brands, private label customer brands, authentic Italian imported products, and alternative formula products, all delivered within the highest quality standards and with exceptional customer service.
During fiscal year 2009, we implemented a strategy (developed in fourth quarter of 2008) of focusing on growing customer brands in the overall market and our proprietary brands in core markets where they are strongest. As a part of that strategy, we began to extract our proprietary branded products from those markets in which they were underperforming in anticipation of realigning our proprietary brand portfolio. Further, we expanded our customer brand offerings to include more
2
premium and healthy products and invested more resources in category management and in helping retailers increase customer brand sales and profit. As a result, during fiscal 2009 we experienced volume and revenue growth in our customer brands and focus proprietary brands, partly offset by the anticipated decrease in proprietary branded products' volume and revenue in those markets in which we extracted branded products.
Customer Markets—Institutional: The Institutional market includes both food service distributors that supply restaurants, hotels, schools and hospitals, as well as food processors that use pasta as a food ingredient.
Food service customers include businesses that sell products to restaurants, healthcare facilities, schools, hotels, industrial caterers, and multi-unit restaurant chains that procure directly. The food service market is highly fragmented and is served by numerous regional and local food distributors. During fiscal year 2009, the food service channel, including restaurants, has been challenged as a result of current macro-economic conditions.
The Institutional market also includes sales to food processors who use pasta as an ingredient in their food products such as frozen dinner entrees, side dishes, dry side dish mixes, canned soups, and single-serve meals. The consistency and quality of the color, starch release, texture, cooking consistency, and gluten and protein content of pasta produced for food processors is crucial to the success of their products. As a result, food processors have stringent specifications for these attributes. The size of the Institutional market is affected by the number of food processors that elect to produce pasta internally rather than outsourcing their production. Ingredient customers often specify the use of non-durum wheat classes for production, and our revenues for these products are typically based upon a pass-through of charges in raw material costs and certain other cost changes as price adjustments. Although our per unit margin remained stable during 2009, the average selling prices decreased due primarily to declines in the cost of non-durum wheat and these pass-through arrangements.
Products
Our product line is comprised of approximately 3,700 items or stock-keeping units ("SKUs"). In many instances, we produce pasta to our customers' unique specifications. We produce approximately 300 different shapes and sizes of pasta products in multiple package configurations, including bulk packages for institutional customers and individually-wrapped packages for retail consumers. The varied shapes and sizes include long goods such as spaghetti, linguine, fettuccine, angel hair and lasagna, and short goods such as elbow macaroni, mostaccioli, rigatoni, rotini, ziti and egg noodles. These products are manufactured for a variety of customers including those who purchase our products as branded offerings from retailers and for retailers who sell products we manufacture as customer brands.
Our products are produced to satisfy the specifications of our customers as well as our own product specifications. We conduct internal laboratory evaluations against competitive products on physical characteristics and cooking performance. Physical characteristics considered include color, speck count, shape and consistency. Cooking performance considerations include starch release, protein content, and texture. Our customers also perform competitive product comparisons on a regular basis.
Marketing and Distribution
We actively sell and market our domestic products through our sales employees and with the use of food brokers and distributors throughout the United States and Canada. Our senior management is directly involved in the selling process in all customer markets. Our sales and marketing strategy is to provide category leadership, quality product, a complete product offering, competitive pricing and superior customer service to attract new customers and to maintain and grow pasta sales to existing customers. We work with our customers to develop marketing and promotional programs specifically
3
tailored to stimulate pasta consumption in their trading area based upon the specific strategy and role for pasta.
We have established a significant market presence in North America by developing strategic customer relationships with food industry leaders that have substantial pasta requirements. We supply customer branded and proprietary branded pasta to many of the largest grocery retailers in the United States, including serving as the exclusive supplier of customer brand pasta to Wal-Mart. We are the largest pasta supplier to Sysco Corporation ("Sysco"), the nation's largest marketer and distributor of food service products. We also have developed supply relationships with leading food processors, which use our pasta as an ingredient in their food products.
Our Italian plant enables us to offer authentic Italian pasta products. This facility serves European, North American, and other international markets with proprietary branded, customer branded, ingredient and food service products.
We have demonstrated our commitment to customer service through the development of enhanced customer service programs. Examples of these programs include our implementation of an Efficient Customer Response ("ECR") model, which uses Electronic Data Interchange ("EDI") and vendor replenishment programs to assist key customers, and category management services for our customer branded and proprietary branded customers.
As part of our overall customer development strategy, we use our category management expertise to assist customers in optimizing category growth and profitability. Our category management expertise allows us to recommend SKU assortment and shelf space allocation to both customer branded and proprietary branded customers. Our representatives also assist food processors in incorporating our pasta as an ingredient in their customers' food products. We provide technical support to our institutional customers by making recommendations regarding the processing of pasta in their facilities. We believe that these value-added activities provide customers with a better appreciation and acceptance of our products.
Our primary distribution centers in North America are strategically located at our production facilities in Missouri, South Carolina and Arizona to serve the national market. Finished products are automatically conveyed via enclosed case conveying systems from the production facilities to the distribution centers for palletizing and storage until shipping. The combination of integrated facilities and multiple distribution centers enables us to realize distribution cost savings and provides lead-time, fill rate and inventory management advantages to our customers. The operation of the Missouri, South Carolina and Arizona distribution centers is outsourced under a long term agreement with Ozburn-Hessey Logistics, LLC ("OHL"), a firm specializing in warehouse and logistics management services.
Pasta Production
Pasta's primary ingredient is semolina, which is extracted from durum wheat through a milling process. Durum wheat is used primarily for pasta. Each variety of durum wheat has its own unique set of protein, gluten content, moisture, density, color and other attributes which affect the quality and other characteristics of the semolina. We select and blend different durum wheat varieties in order to meet customer semolina specifications. Other types of wheat, as specified by our customers, may be used for production of our ingredient business pasta.
Our ability to produce high-quality pasta generally begins with purchasing durum wheat directly from elevators, U.S. grower-owned cooperatives, and the Canadian Wheat Board among other sources. This purchasing method ensures that the extracted semolina meets our specifications. We have several sources for durum wheat and are not dependent on any one supplier or sourcing area. As a result, we believe that we have adequate sources of supply for durum wheat. We occasionally buy and sell semolina to balance our milling and production requirements.
4
Durum wheat is a closely traded cash crop whose market price fluctuates and for which there is not a futures market. Therefore, we are not able to hedge purchases. To a certain extent, we manage our durum wheat cost risk through advance purchase contracts for the physical delivery of durum wheat that are generally less than six months in duration. We seek to manage the balance of such risk through continued improvement in our efficiencies and pricing of our products. Competitive pressures may limit our ability to fully recover additional raw material costs.
Durum wheat is shipped by rail to our production facilities in Missouri and South Carolina under annually negotiated contracts or market tariff rates. We source durum wheat and have it converted to semolina and semolina/flour blends for our Tolleson, Arizona facility from an adjacent milling facility owned by Bay State Milling Company ("Bay State") under the terms of a long-term supply agreement. The agreement is for an initial 10-year term with renewal provisions thereafter. In the event of ownership changes or sustained under-performance, we have contractual rights to purchase the mill at a book value established at the start of the supply agreement less accumulated depreciation. We are obligated to purchase 80% of our annual Tolleson requirements for semolina from Bay State with an annual minimum of 50 million pounds. We have satisfied our minimum requirements and paid Bay State approximately $27.8 million in fiscal year 2009, $21.2 million in fiscal year 2008, and $13.8 million in fiscal year 2007.
In Italy, we purchase our semolina requirements from Italian mills to meet our specific quality and customer needs.
We generate and sell by-products from our milling operations in the form of flour and mill feed. Proceeds from the sale of by-products is recognized as a reduction of our cost of goods sold. These products compete in the marketplace with alternative products for feed usage and, therefore, fluctuate in price accordingly.
We purchase our packaging supplies, including poly-cellophane, paperboard cartons, boxes and totes from third parties. We believe we have adequate sources of packaging supplies. In addition, we rely on supply chain logistics and operations planning to optimize finished goods inventory, minimize the risk of obsolescence for finished goods and raw materials, maximize customer service, and achieve efficient factory utilization.
Our U.S. and Italian production facilities are inspected for sanitation and food safety each year by the American Institute of Baking ("AIB"), a United States baking, food processing and allied industries evaluation agency. Our plants consistently achieve the AIB Excellent/Superior ratings. Our U.S. and Italian plants are also inspected by the British Retail Consortium ("BRC"), one of the recognized European Food Safety Bodies, for compliance to the new Global Food Safety Initiative ("GFSI") requirements, as approved by the Grocery Manufacturers Association ("GMA"). Our plants have received "Grade A/B" Certification from the BRC. In addition, we maintain a comprehensive Hazard Analysis Critical Control Point ("HACCP") program in all of our plants that ensures adequate protection and controls of our food safety systems on a daily basis.
Our Italian plant is an ISO 9002 certified production facility and is certified organic by Consorzio Per Il Controllo Dei Prodotti Biologici (Consortium for the Control of Biological Production). In addition, our Tolleson, Arizona plant is certified organic by the Organic Crop Improvement Association International.
Trademarks
We hold a number of federally registered and common law trademarks, primarily related to our brands, which we consider to be of value and importance to our business. We have also registered other trademarks.
5
Dependence on Major Customers
Historically, a limited number of customers have accounted for a substantial portion of our revenues. During the fiscal years ended October 2, 2009, September 26, 2008 and September 28, 2007, sales to Wal-Mart accounted for approximately 25%, 22% and 23%, respectively, of our total revenue. We expect to continue to rely on a limited number of major customers for a substantial portion of our revenue.
We generally do not have long-term supply contracts with our customers, including Wal-Mart. Additionally, we are dependent upon our customers to sell our products and to assist us in promoting market acceptance of, and creating demand for, our products.
Competition
We operate in a highly competitive environment against numerous well-established national, regional and foreign companies, and many smaller companies. We compete in the procurement of raw materials, the development of new products and product lines, the improvement and expansion of previously introduced products and product lines, and the production, marketing and distribution of these products. Some of these companies with which we compete have longer operating histories, significantly greater brand recognition, or more financial or other resources. Our products compete with a broad range of food products, both in the retail and institutional customer markets. Competition in these markets generally is based on achieving advantages relating to distribution, product quality, pricing, packaging, advertising, promotion, customer service, and logistics capabilities.
Our direct competitors include Barilla (a large privately owned Italian diversified food company), New World Pasta Company owned by Ebro Puleva (a Spanish company), Dakota Growers Pasta Company, Philadelphia Macaroni Co. Inc., A. Zerega's Sons, Inc., and other foreign companies. For sales in Europe and other international markets, our Italian plant competes with Barilla and numerous European pasta producers.
Government Regulation; Environmental Matters
We are subject to various laws and regulations related to the operation of our production facilities, the production, packaging, labeling and marketing of our products and pollution control, including air emissions, which are administered by federal, state, and other governmental agencies. Our production facilities are subject to inspection by the U.S. Food and Drug Administration ("FDA") and the Occupational Safety and Health Administration, as well as various state agencies.
Our facilities are subject to air permitting regulations administered by the U.S. Environmental Protection Agency and/or authorized States under federal and/or state regulations implementing the federal Clean Air Act. Each of our facilities is currently operating under valid permits. Costs to renew these permits are immaterial.
Our facilities are subject to certain safety regulations including regulations issued pursuant to the U.S. Occupational Safety and Health Act. These regulations require us to comply with certain manufacturing safety standards to protect our employees from accidents. We believe that we are in compliance with all employee safety regulations.
Our facilities are also subject to annual reporting requirements under the Emergency Planning and Community Right-to-Know Act and its implementing regulations. No permit is required, but we do submit reports to federal and/or state regulators, local emergency planning organizations, and the local fire department with jurisdiction over the facilities quantifying all hazardous materials stored on our property that meet or exceed threshold quantities. Costs associated with this annual reporting are minimal.
6
The Comprehensive Environmental Response Compensation and Liability Act of 1980 ("CERCLA"), as amended, and other similar state laws require the cleanup of hazardous waste disposal sites. Parties that may be liable under CERCLA for the cleanup of a hazardous waste disposal site include the current property owner, the operator, owners and operators of the property at the time of a release of hazardous substances, the arranger of the disposal, and the transporter of hazardous substances. To date, we have not been notified by the U.S. Environmental Protection Agency, any state agency, or any other private party that we are considered responsible or potentially responsible for some aspect of the cleanup of any hazardous waste disposal site under CERCLA or any other similar state laws.
We received the Customs Trade Partnership Against Terrorism ("C-TPAT") certification from the United States Customs and Border Protection ("CBP") division of the Department of Homeland Security. C-TPAT was developed by the CBP after the September 11, 2001 terrorist attacks as a way to identify low risk importers and facilitate the efficient release of goods, even under heightened security conditions. To become a participant of C-TPAT, our security measures were reviewed and certified by CBP. As part of the C-TPAT certification and review process, CBP has reviewed the implementation of our security measures and, effective August 2009, we became Tier 2 C-TPAT Certified. C-TPAT certification includes certain benefits to participants and may help reduce the risk of significant delays in the importation of our product.
All imported pasta is subject to U.S. import regulations. Duties are assessed in accordance with the Harmonized Tariff Schedule of the United States.
Employees
As of October 2, 2009, we employed 675 full-time persons worldwide of whom 190 were selling and administrative employees and 485 were manufacturing employees. Our 620 U.S. employees were not represented by any labor unions. We have 55 Italian employees, 45 of whom were represented by a labor union. We consider our employee relations to be excellent.
7
You should carefully consider the risks described below, as well as the other information included or incorporated by reference in this Annual Report on Form 10-K, before investing in our common stock. If any of the following risks occur, our business, financial condition or operating results could be materially adversely affected. The risks described below are not the only risks we face. Additional risks and uncertainties not presently known to us or that we currently believe to be immaterial may also materially adversely effect our business, financial condition or operating results.
A change in our relationship with our major customers could adversely affect our revenues.
Historically, a limited number of customers have accounted for a substantial portion of our revenues. If our relationship with one or more of our major customers changes or ends, our sales could suffer, which could have a material adverse effect on our business, financial condition or results of operations. We expect that we will continue to rely on a limited number of major customers for a substantial portion of our revenues in the future. During the 2009, 2008, and 2007 fiscal years, sales to Wal-Mart accounted for approximately 25%, 22% and 23%, respectively. During the 2009, 2008, and 2007 fiscal years, sales to Sysco accounted for approximately 8%, 9% and 9%, respectively. Currently, we do not have long-term supply agreements with a substantial number of our customers, including Wal-Mart and Sysco.
Fluctuations in the cost of raw materials, energy, packaging materials or other items could adversely affect us.
The principal raw material for the bulk of our products is durum wheat. We generally procure durum from North Dakota, Montana, Canada, and the southwest section of the U.S. for our Missouri and South Carolina plants, and we generally procure durum from the southwest section of the U.S. for our Arizona plant. The cost of durum wheat represents a substantial portion of our total cost of goods sold and changes in the supply of durum wheat could have a material adverse effect on our operating profit and margins. As durum wheat is used almost exclusively in pasta production and is a narrowly traded, cash-only commodity crop, we have limited means to protect ourselves from price fluctuations. Durum prices have been volatile and may continue to be volatile in the future.
The supply and price of durum wheat in North America and on a global scale is subject to market conditions and is influenced by several factors beyond our control, including:
- •
- general economic conditions;
- •
- global supply and demand (including acres planted and harvest quality and quantity);
- •
- natural disasters, insects, plant diseases, and weather conditions;
- •
- competition for raw materials from other users of durum wheat;
- •
- trade relations;
- •
- governmental programs and regulations;
- •
- natural gas costs, as natural gas is the primary component of anhydrous ammonia fertilizer used in the production of durum
wheat; and
- •
- transportation and fuel costs.
We rely on the supply of flexible film, folding cartons and other packaging materials, which represent a significant portion of our cost of goods sold, that fluctuate in price due to market conditions beyond our control.
We rely on rail carriers for transportation of durum wheat to our milling facilities, and ocean and truck freight for movement of our finished goods. Fuel costs have been and may continue to be
8
volatile. Increases in fuel costs would likely result in increased transportation costs and could have a material adverse effect on our business, financial condition or results of operations.
Historically, changes in sale prices of our pasta products have lagged changes in our materials costs. Furthermore, if the cost of raw materials, energy, packaging materials or other items increase, competitive pressures may limit our ability to raise prices or affect the timing or magnitude of such price increases. Conversely, if the cost of raw materials, energy, packaging materials or other items decrease, competitive pressures may cause us to lower prices before we have fully utilized higher priced inventory or the magnitude of price decreases may exceed the magnitude of the corresponding decrease in raw materials, energy, packaging materials or other costs. Accordingly, fluctuations in the cost or supply of raw materials (including durum wheat ingredients), energy (including utility and transportation costs), packaging materials or other items may have a material adverse impact on our results of operations and cash flows.
If our customers curtail their operations, our financial performance may be adversely affected.
Due to the highly competitive environment, combined with macro-economic challenges existing in the food retailing and foodservice industries, some of our retail and foodservice customers have experienced economic difficulty. In addition, the food retailing industry has experienced consolidation. Certain of our customers have been forced to close stores and certain others have sought bankruptcy protection. If a material number of our customers, or any one large customer, closed a significant number of stores, filed for bankruptcy protection, or consolidated operations with another company, these actions could have a material adverse impact on our business, financial condition, or results of operations.
A decline in demand for dry pasta could adversely affect our financial performance.
We focus primarily on producing and selling dry pasta. We expect to continue this primary focus. Because of our product concentration, any decline in consumer demand or preference, including diet driven changes, for dry pasta or any other factor that adversely affects the pasta market could have a material adverse effect on our business, financial condition or results of operations.
If aggregate production capacity in the U.S. pasta industry increases or is under-utilized, we may have to adopt a more aggressive pricing strategy, which could adversely affect our results of operations.
Our competitive environment is affected by the relationship between aggregate industry production capacity and aggregate market demand for pasta products. Production capacity above market demand can have a material adverse effect on our business, financial condition or results of operations.
If we are not able to compete effectively with established domestic and foreign producers of pasta products, our financial performance may be adversely affected.
The markets in which we operate are highly competitive. We compete against numerous well-established national, regional, local and foreign companies in every aspect of our business. Some of our competitors may have longer operating histories, greater brand recognition, or more financial or other resources than we do. Our customers may not continue to buy our products and we may not be able to compete effectively with these competitors.
Our advantage relative to customer brands may be diminished if competitors obtain the technology necessary to efficiently manufacture and distribute large numbers of stock-keeping units (SKU).
We believe our success in the customer brand market is attributable, in part, to our ability to efficiently manage the manufacture and distribution of large numbers of SKUs. Currently, we handle approximately 3,700 SKUs, most of which are related to customer brands. The technology and
9
know-how to manage large numbers of SKUs is not proprietary. If a competitor were to invest the technology and know-how to develop efficient SKU management, this portion of our business may be adversely affected, which could have a material adverse impact on our business, financial condition, or results of operations.
If we are unable to manage our production and inventory levels, our ability to operate cost-effectively and to maintain high customer service standards may be adversely affected.
Unanticipated fluctuations in demand make it difficult to manage production schedules, plant operations and inventories. Also, customer inventory management systems that are intended to reduce a retailer's inventory investment increase pressure on suppliers like us to fill orders promptly and thereby shift a portion of the retailer's inventory management cost to the supplier. If we overestimate the demand, the result will be the production of excess inventory which could result in markdowns and increased inventory carrying costs. If we underestimate the demand for our products, our customer service standards may suffer as we may be unable to provide adequate supplies of pasta products to retailers in a timely fashion, which may result in loss of sales and/or customers.
Our need for substantial capital and our level of indebtedness may restrict our operating and financial flexibility and could adversely affect our business, financial condition or operating results.
Our business has required and will continue to require substantial capital investment. A portion of this investment has been financed through third-party lenders. The amount of debt we carry and the terms of our indebtedness could adversely affect us in several ways, including:
- •
- our ability to obtain additional financing in the future for working capital, capital expenditures, and general corporate
purposes, including strategic acquisitions, may be impaired;
- •
- our ability to use operating cash flow in other areas of our business may be limited because a substantial portion of our
cash flow from operations may have to be dedicated to the payment of the principal and interest on our indebtedness;
- •
- the terms of such indebtedness restrict our ability to pay dividends; and
- •
- the level of debt we carry could restrict our corporate activities, including our ability to respond to competitive market conditions, to provide for capital expenditures beyond those permitted by our loan agreements, or to take advantage of acquisition opportunities and grow our business.
In the event that we fail to comply with the covenants in our current credit facility, or any future loan agreements, there could be an event of default under the applicable instrument. As a result, all amounts outstanding under our current or any future debt instruments may become immediately due and payable. We have used, and may in the future use, interest rate protection agreements covering our variable rate debt to limit our exposure to variable rates. However, we may not be able to enter into such agreements or such agreements may adversely affect our financial performance. If interest rates were to increase significantly or if we are unable to generate sufficient cash flow from operations in the future, we may not be able to service our debt and may have to refinance all or a portion of our debt, structure our debt differently, obtain additional financing or sell assets to repay such debt.
We may not be able to find alternative financing at the maturity of our credit facility.
Our U.S. credit facility matures in March 2011 and we may not be able to secure refinancing or alternative financing at commercially reasonable terms. Any financing obtained may contain restrictive covenants limiting our flexibility related to operations, capital expenditures, capital structure or other matters.
10
Changes in our capital structure could adversely affect our business, financial condition, or operating results.
Our current credit facility expires in March 2011. Prior to that time, we may decide, for strategic or other reasons, to terminate our credit facility and implement a new capital structure. Our new capital structure may result in a new credit facility, issuance of public debt, issuance of convertible debt, issuance of new shares, the repurchase of existing shares, other alternatives, or a combination of alternatives. Implementation of a new capital structure bears various risks, including risks related to new covenants, restrictions on specified business activities, potential mis-alignment with strategic initiatives, and a potential decrease in future financial flexibility.
If existing anti-dumping measures imposed against certain foreign imports terminate, we will face increased competition from foreign companies and our profit margins or market share could be adversely affected.
Anti-dumping and countervailing duties on certain Italian and Turkish imports imposed by the United States Department of Commerce ("DOC") in 1996 enable us and our domestic competitors to compete more favorably against Italian and Turkish producers in the U.S. pasta market. In September 2007, the U.S. International Trade Commission ("ITC") extended the anti-dumping and countervailing duty orders for an additional five years, through 2012. If the anti-dumping and countervailing duty orders are repealed or foreign producers sell competing products in the United States at prices lower than ours or enter the U.S. market by establishing production facilities in the United States, the result would further increase competition in the U.S. pasta market and could have a material adverse effect on our business, financial condition or results of operations.
A write-off or write down of our intangible and other long-lived assets could adversely affect our results of operations.
Our total assets include substantial intangible assets representing the acquisition date fair value of acquired brand names. We review these intangible assets for impairment annually or whenever events or changes in circumstances indicate that the carrying amount of an asset may not be recoverable. A determination that all or a portion of our intangible assets are not recoverable, although a non-cash charge to operations, could have a material adverse effect on our results of operations or total capitalization. At October 2, 2009, the balance of our intangible brand assets was $79.1 million.
Our total assets also reflect substantial long-lived fixed assets for property, plant and equipment. We review long-lived assets for impairment whenever events or changes in circumstances indicate that the carrying amount of an asset may not be recoverable. We evaluate recoverability of assets to be held and used by comparing the carrying amount of an asset to future net cash flows expected to be generated by the asset. If such assets are considered to be impaired, the impairment to be recognized is measured by the amount by which the carrying amount of the assets exceeds the fair value of the assets. Assets to be disposed of are reported at the lower of the carrying amount or fair value less costs to sell. A determination requiring write off of a significant portion of fixed assets, although a non-cash charge to operations, could have a material adverse effect on our results of operations or total capitalization. At October 2, 2009, net long-lived fixed assets totaled $291.2 million.
Because we produce food products, we may be subject to product liability claims and have costs related to product recalls.
We may need to recall some of our products if they are misbranded or mislabeled or become adulterated or infested. We may also be subject to claims or lawsuits if the consumption of any of our products causes injury. A widespread product recall or a significant product liability judgment against us could cause products to be unavailable for a period of time and result in a loss of consumer and customer confidence in our food products and could have a material adverse effect on our business. We carry insurance against most of these matters; however, our insurance coverage may not be adequate.
11
The cost of commercially available insurance has increased significantly and such insurance may not be available in the future at prices that we can afford. In addition, because we often indemnify our customers for costs related to product recalls, we could be subject to additional expenses that may not be covered by insurance and could have a material adverse impact on our business, results of operations, or financial condition.
The loss of the services of one or more members of our senior management team or other key subject matter expert could have a material adverse effect on our business, financial condition and results of operations.
Our operations and prospects depend in large part on the performance of our senior management team. We may not be able to find qualified replacements for any of these individuals if their services were no longer available. We do not currently maintain key person life insurance on any member of our senior management team. Except for Mr. John P. Kelly, our President and Chief Executive Officer, we do not provide employment agreements to our executive officers.
In addition to the executive team there are a limited number of subject matter experts in key functions that could impair the effective operations of the business or reporting requirements if appropriate replacements could not be found in a timely fashion.
If our competitors develop or acquire advanced technology, our financial performance may be adversely affected.
If other pasta producers acquire equipment similar to our equipment or more advanced equipment that provides greater efficiencies, what we believe to be our current competitive advantage might be diminished or eliminated, potentially causing pressure on profit margins or reducing our market share. Erosion of this advantage could have a material adverse effect on our business, financial condition or results of operations.
Disruptions in transportation of raw materials or finished products could adversely affect our financial results.
Durum wheat is shipped by rail to our production facilities in Missouri and South Carolina under annually negotiated contracts or market tariff rates. From time to time we also ship semolina, milled and processed at the Missouri facility, to our South Carolina facility. There is no assurance that the transportation costs will remain the same as fuel costs are volatile and, under these contracts, rail carriers have the ability to pass through certain increases in fuel cost. An extended interruption in our ability to ship durum wheat by railroad to the Missouri or South Carolina plants, or semolina to our South Carolina facility, could cause us to incur significantly higher costs and longer lead times associated with the distribution of our pasta to our customers. If we are unable to provide adequate supplies of pasta products to our customers in a timely fashion due to such delays, we may subsequently lose sales. This could have a material adverse effect on our business, financial condition or results of operations.
Disruptions in utilities at our facilities would impair our ability to produce products and could adversely affect our financial results.
Each of our production facilities relies heavily on the local electric, gas and water utilities for supply. If there are significant and lengthy interruptions in any of these utilities, our ability to meet customer shipments could be impaired. The disruptions could come from natural disasters, terrorist attacks or other causes. This could have a material adverse effect on our business, financial condition or results of operations.
12
Disruptions or failures in the software we use in our operations, or in the supporting hardware, could adversely affect our financial results.
We rely on a number of key systems to produce, ship, invoice and account for our products. In the event of a material failure of or disruption to one or more of these systems, including disruptions caused by the failure of the supporting hardware, our ability to accomplish one or more of these functions could be impaired. If the cause of the failure or disruption cannot be remedied in a short period of time, we would not be able to produce or ship products. This could have a material adverse effect on our business, financial condition or results of operations.
Our international business may not be successful.
We operate a pasta-producing facility in Italy. We do not have the same competitive scale of operations or historic relationships with the European trade or European supply base in overseas markets that we do in the U.S.
There are several risks inherent in doing business on an international level. These risks include:
- •
- export and import restrictions;
- •
- tariffs, trade duties, and other trade barriers;
- •
- difficulties in staffing and managing foreign operations;
- •
- managing regulatory requirements across multiple foreign jurisdictions;
- •
- fluctuations in currency exchange rates and inflation risks;
- •
- seasonal fluctuations in business activity in other parts of the world;
- •
- changes in a specific country's or region's political or economic conditions, particularly in emerging markets;
- •
- potentially adverse tax consequences; and
- •
- difficulty in securing or transporting raw materials or transporting finished product.
Any of these risks could adversely impact the success of our international operations. If our international revenues are inadequate to offset the expense of maintaining foreign operations, our business or results of operations could be harmed.
Our competitive position and financial results and condition could be adversely impacted if we are unable to protect our intellectual property.
Our brands are important to our success and our competitive position. Our actions to establish and protect our brands and other proprietary rights may be inadequate to prevent imitation of our products by others. Moreover, we may face claims by third parties that we violate their intellectual property rights. Any litigation or claims against us, whether or not successful, could result in substantial cost, divert management's time and attention from our core business, or significantly harm our reputation, our business or our results of operations.
A failure to comply with applicable laws and regulations could adversely affect our business.
We are subject to laws and regulations administered by federal, state, and other governmental agencies related to the operation of our production facilities, the production, packaging, labeling and marketing of our products and pollution control, including air emissions. Any determination by the FDA or other agencies that our facilities are not in compliance with applicable regulations could interfere with the continued manufacture and distribution of the affected products and, in some cases,
13
might also require the recall of previously distributed products. In addition, we could become subject to increased regulatory oversight related to ensuring a secure national food chain and, as a result, could incur material costs to comply with additional testing protocols, precertification of shipments, or other procedures required by such regulations. Any such determination or change in regulation could have a material adverse effect on our business, financial condition or results of operations.
Under environmental laws, we are exposed to liability primarily as an owner and operator of real property and, as such, we may be responsible for the clean-up or other remediation of contaminated property. Environmental laws and regulations can change rapidly and we may become subject to more stringent environmental laws and regulations in the future that may be retroactively applied to earlier events. In addition, compliance with more stringent environmental laws and regulations could involve significant capital investments. Additional information is provided in this Annual Report on Form 10-K under the heading "Business—Governmental Regulation; Environmental Matters."
We are subject to a consent injunction and agreement which, if we violate, could require us to pay substantial fines or other penalties or otherwise have a material adverse effect on us.
We are subject to a consent injunction with the Securities and Exchange Commission ("SEC") and a settlement agreement with the United States Attorney's Office for the Western District of Missouri on behalf of the Department of Justice ("DOJ"), violation of either of which could have a material adverse effect on us. In the fourth quarter of fiscal year 2008, the SEC and the DOJ announced the completion of their investigation of us and resolution of outstanding investigative matters. Under the terms of a settlement with the SEC, we agreed to a consent injunction requiring future compliance with federal securities laws. Under an agreement with the DOJ, we agreed to continue to cooperate with the DOJ. To the extent we fail to comply with either agreement, we could be subject to additional sanctions or fines, which could have a material adverse effect on our business, results of operations or financial condition.
Our ability to pay dividends to shareholders is restricted by factors including contractual provisions and our financial performance.
We have not paid dividends since June 2005. We anticipate that future free cash flow will be used principally to fund interest expense and repayment of debt. Payment of dividends is restricted by provisions in our current credit facility.
A significant percent of our outstanding voting stock is held by a limited number of institutional investors.
A significant percent of our outstanding voting stock is held by a limited number of institutional investors. As a result, the decision of relatively small number of shareholders could have a substantial impact on the trading price of our stock. Continued concentrated ownership could result in fewer shares being available to be traded in the market, resulting in reduced liquidity. In addition, a decision by one or more large investor to liquidate its holdings could adversely affect the trading price of our stock. So long as a significant percentage of our shares are held by a small number of investors, it is easier for any one shareholder to join with other shareholders to attempt to effect control of our company.
The integration of acquired businesses may require significant resources and may not be successful.
In the future, we may consider opportunities to expand our business through the acquisition of other companies, assets, or product lines. If we are unsuccessful in executing the integration of acquired companies, assets, or product lines, or if the integration is more difficult than anticipated, we may experience disruptions to our operations. A difficult or unsuccessful integration could have an adverse effect on our business, results of operations, or financial condition.
14
Risks that may affect our ability to successfully integrate and to fully realize the anticipated benefits of the acquisition include:
- •
- diversion of management's attention from other business concerns;
- •
- adverse effects on existing business relationships with customers;
- •
- increasing the scope and complexity of our operations; and
- •
- conforming standards, processes, information technology systems, procedures, and controls of the acquired business with our operations
ITEM 1B. UNRESOLVED STAFF COMMENTS
None.
Production Facilities: As of October 2, 2009, we owned pasta production plants located in Excelsior Springs, Missouri, Columbia, South Carolina, Tolleson, Arizona, and Verolanuova, Italy. Our U.S. facilities are strategically located to support North American distribution of our products and benefit from the rail and interstate highway infrastructure near each facility. As of October 2, 2009, our facilities had combined annual production capacity of approximately 940 million pounds of pasta. In addition, we occasionally purchase pasta products from other manufacturers for resale.
Distribution Centers: We own the distribution centers adjoining our Missouri, South Carolina, and Arizona plants. In addition, as of October 2, 2009, we leased space in public warehouses in Missouri and Arizona.
The warehousing operations at each of our distribution centers in Missouri, South Carolina and Arizona, including our leased facility in Missouri, are outsourced under a long-term agreement with OHL. OHL specializes in warehouse and logistics management services. In addition, OHL provides traffic and freight management services to us under a long term contract, thereby effectively providing for the shipment of our finished products from our domestic facilities.
Our credit facility, executed on March 13, 2006 and last amended December 27, 2007, grants a collateral interest to our lenders in substantially all of our tangible and intangible domestic assets.
SEC Investigation
In September 2008, the Company agreed to a consent injunction and settled all outstanding matters pertaining to the SEC investigation of the Company's historical accounting practices. Certain former officers of the Company also resolved claims asserted against them by the SEC in 2008 and 2009, with the exception of one former officer. As a result, the Company may continue to have indemnity obligations to this former officer under Delaware law and our articles of incorporation. We believe the effect of any indemnification obligation on our cash flows and results of operations will be immaterial.
Other Matters
From time to time and in the ordinary course of our business, we are the subject of government investigations or audits and named as a defendant in legal proceedings related to various other issues, including worker's compensation claims, tort claims and contractual disputes.
ITEM 4. SUBMISSION OF MATTERS TO A VOTE OF SECURITY HOLDERS
We did not submit any matters to the vote of our stockholders during the fourth quarter of fiscal year 2009.
15
ITEM 5. MARKET FOR REGISTRANT'S COMMON EQUITY, RELATED STOCKHOLDER MATTERS AND ISSUER PURCHASES OF EQUITY SECURITIES
Market Information
Our Class A Convertible Common Stock, par value $0.001 per share (the "common stock") was quoted on the NASDAQ Global Market under the symbol "AIPC".
Our articles of incorporation allowed two classes of common stock, Class A Convertible voting, and Class B Convertible nonvoting, with certain initial investors permitted to convert back and forth between the classes. The conversion features were not exercised and the conditions under which the Class B shares may be issued no longer exist.
The range of the high and low prices per share of the common stock for fiscal year 2009 and 2008 was as follows:
| |
Year Ended October 2, 2009 |
Year Ended September 26, 2008 |
|||||||||||
|---|---|---|---|---|---|---|---|---|---|---|---|---|---|
| |
High | Low | High | Low | |||||||||
First Quarter |
$ | 23.80 | $ | 11.90 | $ | 9.10 | $ | 6.55 | |||||
Second Quarter |
$ | 35.15 | $ | 21.68 | $ | 7.00 | $ | 4.39 | |||||
Third Quarter |
$ | 34.24 | $ | 23.59 | $ | 12.35 | $ | 5.45 | |||||
Fourth Quarter |
$ | 32.08 | $ | 27.17 | $ | 15.90 | $ | 11.00 | |||||
Holders
As of November 12, 2009, there were approximately 1,100 shareholders of record of our common stock.
Dividends
Payment of dividends is restricted by provisions in our current credit facility.
Securities Authorized for Issuance Under Equity Compensation Plans
See Item 12, "Security Ownership of Certain Beneficial Owners and Management and Related Stock Holder Matters," contained in this Annual Report on Form 10-K for additional information regarding our equity compensation plans.
Recent Sales of Unregistered Securities
None.
Issuer Purchases of Equity Securities
During the fourth quarter of fiscal 2009, we purchased 1,803 shares of our common stock, at an average price paid per share of $31.74 (all purchases were made during the four week period ending August 28, 2009), in connection with the withholding of taxes upon vesting of nonvested shares.
On October 4, 2002, our Board of Directors authorized up to $20.0 million to implement a common stock repurchase plan. There is $7.9 million available under the common stock repurchase plan. Purchases under the plan are restricted by provisions in our current credit facility and, accordingly, there were no purchases during fiscal year 2009.
16
Stockholder Return Performance Graph
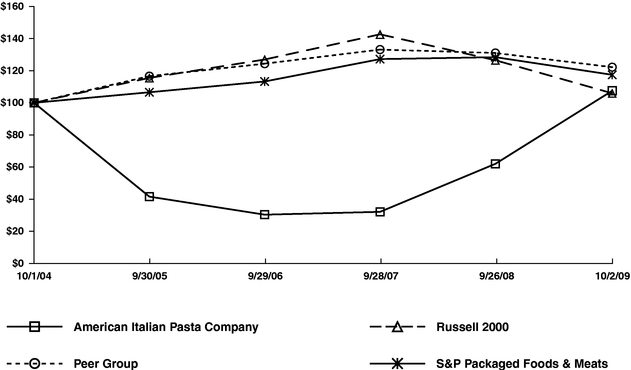
The following graph compares the cumulative total stockholders' return on the common stock for the five fiscal years ended October 2, 2009 (October 1, 2004 to October 2, 2009) against the cumulative total return of the Russell 2000® Index, the S&P Packaged Foods & Meats Index, and the peer group we used in fiscal 2008. The graph and table assume that $100 was invested on October 1, 2004 (the last day of fiscal year 2004) in our common stock, the Russell 2000® Index, the S&P Packaged Foods & Meats Index, and the peer group and that all dividends were reinvested.
COMPARISON OF 5 YEAR CUMULATIVE TOTAL RETURN*
Among American Italian Pasta Company, The Russell 2000 Index,
The S&P Packaged Foods & Meats Index And A Peer Group
- *
- $100 invested on 10/1/04 in stock or 9/30/04 in index, including reinvestment of dividends.
| |
Russell 2000® Index(1) |
Peer Group(2) | S&P Packaged Foods & Meats(3) |
American Italian Pasta |
|||||||||
|---|---|---|---|---|---|---|---|---|---|---|---|---|---|
October 1, 2004 |
100.00 | 100.00 | 100.00 | 100.00 | |||||||||
September 30, 2005 |
115.51 | 116.59 | 106.56 | 41.57 | |||||||||
September 29, 2006 |
126.97 | 124.37 | 113.27 | 30.34 | |||||||||
September 28, 2007 |
142.64 | 133.14 | 127.21 | 32.11 | |||||||||
September 26, 2008 |
126.50 | 131.02 | 128.41 | 62.00 | |||||||||
October 2, 2009 |
105.94 | 122.18 | 117.43 | 107.50 | |||||||||
- (1)
- The Russell 2000 Index measures the performance of the small-cap segment of the U.S. equity universe. It includes approximately 2000 of the smallest securities based on a combination of their market cap and current index membership. The Russell 2000 is constructed to provide a comprehensive and unbiased small-cap barometer and is completely reconstituted annually to ensure larger stocks do not distort the performance and characteristics of the true small-cap
17
opportunity set. Information concerning the Russell 2000 Index is available on the Internet at www.russell.com.
- (2)
- In
fiscal 2008, we compared our performance against a peer group, selected on the basis of similarity of their business to ours, comprised of the following
companies: Flowers Foods Inc. (FLO); Hormel Foods Corp. (HRL); J & J Snack Foods Corp. (JJSF); McCormick & Company Inc. (MKC); Ralcorp Holdings Inc. (RAH);
Smithfield Foods Inc. (SFD); and Treehouse Foods Inc. (THS). During 2009, we determined we would compare against the S&P Packaged Foods & Meats Index, a published industry or
line-of-business index, which we believe provides more meaningful information. For fiscal 2009, our transition year, we have included our performance against the peer group
used during fiscal 2008. We will not use this peer group in the future.
- (3)
- The S&P Packaged Foods & Meats Index includes producers of packaged foods including dairy products, fruit juices, meats, poultry, fish and pet foods.
18
ITEM 6. SELECTED FINANCIAL DATA
The following table presents selected historical financial data for the fiscal years ended October 2, 2009, September 26, 2008, September 28, 2007, September 29, 2006, and September 30, 2005 (in thousands, except per share data).
| |
YEAR ENDED | |||||||||||||||
|---|---|---|---|---|---|---|---|---|---|---|---|---|---|---|---|---|
| |
2009 | 2008 | 2007 | 2006 | 2005 | |||||||||||
| |
(53 weeks) |
(52 weeks) |
(52 weeks) |
(52 weeks) |
(52 weeks) |
|||||||||||
STATEMENT OF OPERATIONS DATA: |
||||||||||||||||
Revenues(1) |
$ | 628,162 | $ | 569,196 | $ | 398,122 | $ | 367,023 | $ | 364,159 | ||||||
Cost of goods sold |
451,513 | 446,891 | 308,819 | 284,777 | 300,151 | |||||||||||
Gross profit |
176,649 |
122,305 |
89,303 |
82,246 |
64,008 |
|||||||||||
Selling and marketing expense |
27,989 | 27,727 | 21,503 | 22,871 | 20,342 | |||||||||||
General and administrative expense(2) |
34,363 | 46,663 | 33,548 | 35,459 | 23,198 | |||||||||||
Litigation settlement(3) |
— | — | — | — | 14,000 | |||||||||||
Impairment charges to brands |
— | 3,654 | — | 998 | 88,550 | |||||||||||
(Gain) loss on disposition of brands(4) |
(500 | ) | — | — | 4,708 | — | ||||||||||
(Gains) losses related to long-lived assets(5) |
1,385 | 1,139 | (109 | ) | 22,268 | 9,759 | ||||||||||
Recovery from restructuring program(6) |
— | — | — | — | (554 | ) | ||||||||||
Operating profit (loss) |
113,412 | 43,122 | 34,361 | (4,058 | ) | (91,287 | ) | |||||||||
Interest expense, net |
16,499 | 26,240 | 29,421 | 29,509 | 16,234 | |||||||||||
Other (income) expense, net |
(8 | ) | 92 | (245 | ) | (913 | ) | (3,544 | ) | |||||||
Income (loss) before income taxes |
96,921 | 16,790 | 5,185 | (32,654 | ) | (103,977 | ) | |||||||||
Income tax provision (benefit) |
8,633 | (2,321 | ) | (163 | ) | (2,241 | ) | (3,730 | ) | |||||||
Net income (loss) |
$ | 88,288 | $ | 19,111 | $ | 5,348 | $ | (30,413 | ) | $ | (100,247 | ) | ||||
Net income (loss) per common share (basic) |
$ |
4.27 |
$ |
1.00 |
$ |
0.29 |
$ |
(1.65 |
) |
$ |
(5.49 |
) |
||||
Net income (loss) per common share (assuming dilution) |
$ |
4.10 |
$ |
0.99 |
$ |
0.28 |
$ |
(1.65 |
) |
$ |
(5.49 |
) |
||||
Cash dividend declared per common share |
$ |
— |
$ |
— |
$ |
— |
$ |
— |
$ |
0.5625 |
||||||
Weighted-average common shares outstanding |
20,692 |
19,118 |
18,673 |
18,386 |
18,247 |
|||||||||||
Weighted-average common shares outstanding (including dilutive securities) |
21,555 |
19,384 |
18,951 |
18,386 |
18,247 |
|||||||||||
OTHER FINANCIAL DATA (AT END OF PERIOD): |
||||||||||||||||
Cash and cash equivalents |
$ | 30,959 | $ | 38,623 | $ | 16,635 | $ | 22,805 | $ | 11,911 | ||||||
Working capital |
$ | 96,458 | $ | 72,350 | $ | 55,505 | $ | 54,285 | $ | 58,971 | ||||||
Plant, property and equipment—net |
$ | 291,212 | $ | 303,503 | $ | 316,109 | $ | 324,464 | $ | 360,740 | ||||||
Brands |
$ | 79,074 | $ | 79,769 | $ | 83,282 | $ | 82,772 | $ | 88,750 | ||||||
Total assets |
$ | 530,063 | $ | 553,024 | $ | 527,963 | $ | 531,969 | $ | 571,926 | ||||||
Long term debt, less current maturities |
$ | 104,100 | $ | 217,000 | $ | 240,000 | $ | 260,500 | $ | 276,006 | ||||||
Stockholders' equity |
$ | 307,416 | $ | 205,971 | $ | 171,918 | $ | 160,336 | $ | 186,026 | ||||||
Total debt/total capitalization |
26 | % | 54 | % | 58 | % | 62 | % | 60 | % | ||||||
Depreciation and amortization expense(7) |
$ | 24,986 | $ | 24,092 | $ | 23,409 | $ | 24,895 | $ | 25,132 | ||||||
We report on a 52/53 week fiscal year end, with a 53-week fiscal year occurring approximately every six years. Fiscal year 2009 was a 53-week fiscal year and fiscal years 2008, 2007, 2006 and 2005 were 52-week years. Accordingly, fiscal year 2009 includes revenues and expenses for one extra week.
19
- (1)
- The
U.S. Government enacted the Continued Dumping and Subsidy Offset Act of 2000 (the "CDSOA") which provides that assessed anti-dumping and
subsidy duties liquidated by the Department of Commerce after October 1, 2000 will be distributed to affected domestic producers. Accordingly, revenues in fiscal years 2009, 2008, 2007, 2006
and 2005 include payments received from the Department of Commerce of $0.8 million, $4.7 million, $3.0 million, $2.6 million and $1.0 million, respectively, as our
calculated share based on tariffs liquidated by the government during these periods on Italian and Turkish imported pasta. Effective October 1, 2007, the CDSOA was repealed, resulting in the
discontinuation of future distributions to affected domestic producers for duties assessed after such date. It is not possible to reasonably estimate amounts, if any, to be received in fiscal years
subsequent to 2009 on duties assessed prior to October 1, 2007.
- (2)
- Included
in general and administrative expenses are professional fees related to the restatement of historical financial statements and pending legal
matters that amounted to $0.8 million, $17.5 million, $13.3 million, $16.1 million, and $2.5 million in fiscal years 2009, 2008, 2007, 2006, and 2005, respectively.
- (3)
- Litigation
settlement relates to our settlement of the federal securities class action lawsuit. The settlement was for $25.0 million, comprised of
$11.0 million in cash, provided by our insurers, and $14.0 million satisfied through the issuance of 1.4 million shares of our common shares.
- (4)
- During
fiscal year 2009 we sold an unused brand for $0.5 million. The fiscal year 2006 loss on disposition of brands resulted from the sale of our
Mrs. Leeper's and Eddie's Spaghetti brands.
- (5)
- Losses
related to long-lived assets include the loss on sale of our Kenosha plant in fiscal year 2006 and losses related to certain pasta
manufacturing and packaging equipment that were disposed and excess equipment written down to fair market value, primarily in fiscal years 2005 and 2006. During fiscal year 2007 we recognized
$0.1 million on the gain on the sale of certain excess equipment. The losses during fiscal year 2009 and 2008 are due primarily to the write-off of fixed assets due to routine plant
changes and asset upgrades.
- (6)
- In
fiscal year 2005, we recognized $0.6 million benefit related to the reversal of a previously established restructuring reserve due to the early
reactivation of the Kenosha plant which was not contemplated at the time the restructuring reserve was established.
- (7)
- Reflects aggregate depreciation and amortization expense of property, plant and equipment and other amortizable assets excluding deferred debt issuance costs. Depreciation and amortization is included in our statement of operations under the captions cost of goods sold and general and administrative expense.
20
ITEM 7. MANAGEMENT'S DISCUSSION AND ANALYSIS OF FINANCIAL CONDITION AND RESULTS OF OPERATIONS
The following discussion and analysis of financial condition and results of operations should be read in conjunction with "Selected Financial Data," our consolidated historical financial statements and the notes to those statements that appear elsewhere in this report. Our discussion contains forward-looking statements based upon current expectations that involve risks and uncertainties, such as our plans, objectives, expectations and intentions. Actual results and the timing of events could differ materially from those anticipated in these forward-looking statements as a result of a number of factors, including those set forth under "Cautionary Note Concerning Forward-Looking Information" and "Risk Factors" elsewhere in this report.
Overview
We report on a 52/53 week fiscal year ending on the Friday nearest the end of the quarter. Fiscal year 2009 was a 53-week year and fiscal years 2008 and 2007 were 52-week years.
We believe we are the largest producer and marketer of dry pasta in North America, by volume, based on data available from Nielsen, published competitor financial information, industry sources such as the National Pasta Association, suppliers, trade magazines, other market date, and our own market research. Management believes that the combination of our low cost structure, our product strategy of offering proprietary branded, customer branded, imported and specialty products, our scalable production facilities and our key customer relationships create competitive advantages.
We generate revenues in two customer markets: retail and institutional. Retail market revenues include the sales of our pasta products to customers who resell the pasta in retail channels, including traditional grocery retailers, club stores, mass merchants, drug and discount stores, and encompasses sales of our proprietary branded products, customer branded (also referred to as "private label") products, and imported products. These revenues represented 78.9%, 74.8%, and 76.5% of our total revenue for the years ended October 2, 2009, September 26, 2008 and September 28, 2007, respectively. Institutional market revenues include the sales of our pasta products to customers to foodservice distributors (comprised of businesses and organizations that sell products to restaurants, healthcare facilities, schools, hotels, industrial caterers, and multi-unit restaurant chains that procure directly), food processors that use pasta as a food ingredient, government agencies, and other customers that we periodically supply. The institutional market represented 21.1%, 25.2% and 23.5% of our total revenue for the years ended October 2, 2009, September 26, 2008 and September 28, 2007, respectively.
Average selling prices for both our branded and non-branded products are based on the competitive market environment. In addition, average selling prices for our non-branded products may be affected by customer-specific packaging and raw material requirements, product manufacturing complexity and other service requirements. Average retail and institutional prices will also vary due to changes in the relative share of customer revenues and item specific sales volumes (i.e., product sales mix). Generally, average retail selling prices are higher than institutional selling prices. Selling prices of our proprietary branded products are higher than selling prices for our other product categories, including customer brands. Revenues are reported net of cash discounts, product returns, and promotional and slotting allowances.
Our cost of goods sold consists primarily of raw materials, packaging, manufacturing costs (including depreciation) and distribution (including transportation) costs, offset by by-product sales. A significant portion of our cost of goods sold is durum wheat. We purchase durum wheat on the open market and, consequently, those purchases are subject to fluctuations in cost. During the past three years, durum prices have been volatile and are expected to remain volatile. To a certain extent, we manage our durum wheat cost risk through advance purchase contracts for durum wheat that are generally less than six months in duration. As a result, our durum costs for any given period may be
21
higher or lower than the current spot market price. We seek to achieve low-cost production through vertical integration and investment in the most current pasta-making assets and technologies. The manufacturing and distribution related capital assets that have been or will be acquired to support this strategy are depreciated over their respective economic lives. Such depreciation expense is a component of inventory cost and cost of goods sold.
According to Nielsen data for U.S. grocery and mass merchants, during the 52 week period ending September 26, 2009 (the date nearest our fiscal year end for which this information is available), the dry pasta category grew at a rate of approximately 4.5% as compared to the prior 52 week period. The trend continued through the 13 weeks ending September 26, 2009, with growth of approximately 3.1% compared to the prior year period. With the economic downturn, we believe more people are choosing to cook at home and are taking advantage of the many alternatives available with a versatile food such as dry pasta. Dry pasta offerings include traditional semolina pasta as well as alternative formulations such as whole-wheat, multi-grain, and omega-added. Consumption of traditional semolina pasta, which comprises approximately 90% of the pasta market when expressed as a percent of pounds consumed, increased 3.9% and 2.0% during the 52 and 13 weeks ending September 26, 2009, respectively. The consumption of alternative formulation pasta grew at a growth rate of 9.9% and 11.9% during the 52 and 13 week periods ending September 26, 2009, respectively. In addition, across nearly every store product category, consumers have been taking advantage of lower priced private label alternatives to traditional branded label products. For the pasta category, during the 52 week period ending September 26, 2009, total brand growth was 2.2% and private label growth was 9.4%. Further, consumers are increasingly taking advantage of lower priced delivery channels, such as discount and dollar stores.
During 2009, we began implementation of our strategy to focus on growing customer brands (private label) in the overall market and our proprietary brands in core markets where they are strongest. As a part of that strategy, we are extracting our proprietary branded products from those markets in which they are underperforming. As a result, during 2009 we experienced volume and revenue growth in our private label and focus brands, partly offset by the anticipated decrease in branded volume and revenue in those markets in which we extracted branded products.
Our institutional business had significant changes during the last half of 2009. The food service channel, including restaurants, has been increasingly challenged as a result of current macro-economic conditions. The ingredient channel has benefited from consumption growth in products such as prepared dinners and soups, which use pasta as an ingredient. Within the ingredient channel, we generally receive a conversion fee with costs recovered on a pass-through basis. Ingredient products primarily use non-durum wheat classes for production. Although our per unit margin remained stable, average selling prices decreased due primarily to declines in the cost of non-durum wheat.
Critical Accounting Policies
Our results of operations and financial condition, as reflected in our consolidated financial statements, have been prepared in accordance with accounting principles generally accepted in the United States. As discussed in Note 2 to our consolidated financial statements, the preparation of financial statements in conformity with accounting principles generally accepted in the United States requires our management to make estimates and assumptions that affect the reported amounts of assets and liabilities and disclosure of assets and liabilities at the date of the financial statements and reported amounts of revenues and expenses during the reporting periods. On an ongoing basis, our management evaluates its estimates and judgments. We consider our accounting policies related to indefinite-lived intangible assets, long-lived assets, share-based compensation, allowance for doubtful accounts, reserves for slow-moving, damaged and discontinued inventory, reserve for obsolete and impaired spare parts, promotional allowances, and income taxes to be our critical accounting policies. Our management bases its estimates and judgments on relevant facts and circumstances, the results of
22
which form the basis for making judgments about the carrying values of assets and liabilities that are not readily apparent from other sources. Our most critical accounting policies are described below.
Indefinite-lived Intangible Assets: We assess indefinite-lived intangible assets, which are not subject to amortization, for impairment at least annually, during our fourth quarter, or whenever events or changes in circumstances indicate that the carrying amount of an asset may not be recoverable. We completed our annual review of fiscal year 2007 based on the 2008 fiscal year business plan and our forecast available in the fourth quarter of fiscal year 2007. Based on the review, no impairment charges were recorded in fiscal year 2007. We performed our fiscal year 2008 annual review of our brands based on the fiscal year 2009 business plan and forecasts, which resulted in a brand impairment of $3.7 million. We completed our annual review of fiscal year 2009 based on the 2010 fiscal year business plan and our forecast available in the fourth quarter of fiscal year 2009. Based on the review, no impairment charges were recorded in fiscal year 2009. Future events could cause our management to conclude that the carrying value of one or more of our brands is not recoverable and that the value of intangible assets is further impaired. At October 2, 2009, the balance of our intangible brand assets was $79.1 million.
Long-Lived Assets: We review long-lived assets for impairment whenever events or changes in circumstances indicate that the carrying amount of an asset may not be recoverable. We evaluate recoverability of assets to be held and used by comparing the carrying amount of an asset to future undiscounted net cash flows expected to be generated by the asset. If such assets are considered to be impaired, the impairment to be recognized is measured by the amount by which the carrying amount of the assets exceeds the fair value of the assets. Assets to be disposed of are reported at the lower of their carrying amount or fair value less cost to sell. At October 2, 2009, net long-lived assets totaled $291.2 million.
Share-Based Compensation: The fair value of stock options and stock appreciation rights classified as equity is measured based on the grant date fair value of the award. We recognize the fair value on a straight-line basis over the period during which an employee is required to provide service in exchange for the award. We use the Black-Scholes option pricing model to determine the grant date fair value of stock options and stock appreciation rights. Key assumptions of the Black-Scholes option pricing model include the expected term of the grants, the expected volatility of the price of the underlying share, the expected risk-free interest rate, and the expected dividends on the underlying shares. These assumptions reflect our best estimates, but they involve inherent uncertainties based on market conditions generally outside our control. While we do not believe share-based compensation would have been materially impacted by the variability in the range of reasonable assumptions we could have applied to value option awards, it is possible that share-based compensation could be materially impacted by the application of alternate assumptions in future periods. Also, we record share-based compensation expense for nonvested stock awards, stock options, and stock appreciation rights net of estimated forfeitures. Our forfeiture rate assumption used in determining share-based compensation expense is estimated based on historical data. The actual forfeiture rate could differ from those estimates, which could have a material impact on compensation expense.
Allowance for Doubtful Accounts: We evaluate the collectibility of our accounts receivable based on a combination of factors. In circumstances where we are aware of a specific customer's inability to meet its financial obligations to us (e.g. bankruptcy filings, substantial down-grading of credit scores), we record a specific reserve for bad debts against amounts due to reduce the net recognized receivable to the amount we reasonably believe will be collected. For all other customers, we recognize reserves for bad debts based on the length of time the receivables are past due and our historical experience. Our allowance for doubtful accounts was $1.4 million as of October 2, 2009.
Reserve for Slow-Moving, Damaged and Discontinued Inventory: We carry our finished goods inventory at standard cost, adjusted for capitalized variances, determined on a first-in, first-out (FIFO)
23
basis. At the end of each period, we review our inventory to ensure that the items are carried at lower of cost or market value. We periodically review our inventory for slow-moving, damaged and discontinued items and provide reserves to reduce such items identified to the recoverable amount. Our reserve balance was $0.6 million as of October 2, 2009.
Reserve for Obsolete and Impaired Spare Parts: We carry our spare parts inventory as a component of property, plant and equipment. Spare parts, valued at the lower of average cost or net realizable value, are not depreciated but are expensed when placed in service. We periodically review our spare parts for excess and obsolete items and establish reserves to reduce such items to their recoverable amounts. Our reserve balance was $0.9 million as of October 2, 2009.
Promotional Allowances: Promotional allowances related to our sales are recorded at the time revenue is recognized. Such allowances, where applicable, are estimated based on anticipated volume and promotional spending with specific customers. We periodically review our estimate for promotional allowances and adjust accruals to reflect our estimate of the future liability.
Income Taxes: We estimate our income tax provision or benefit in each of the jurisdictions in which we operate, including estimating exposures related to examinations by taxing authorities. Tax positions are initially recognized in the financial statements when it is more likely than not the position will be sustained upon examination by the tax authorities. Such tax positions are initially and subsequently measured as the largest amount of tax benefit that is greater than 50% likely of being realized upon ultimate settlement with the tax authority assuming full knowledge of the position and all relevant facts. Although we believe that our accruals for tax liabilities, including uncertain tax positions, are reasonable and adequate, tax regulations are subject to interpretation and the tax review and resolution process is inherently uncertain; therefore, our assessment can involve both a series of complex judgments about future events and rely heavily on estimates and assumptions. To the extent the probable tax outcome of these matters changes, such changes in estimates may have a material impact on the income tax provision and on our consolidated statements of operations in the period in which such determination is made.
We must also make judgments regarding the realizability of deferred tax assets and tax liabilities. Our judgments regarding future taxable income may change due to changes in market conditions, changes in tax laws, tax planning strategies or other factors. If our assumptions and consequently our estimates change in the future, the valuation allowances we have established may be increased or decreased, resulting in a respective increase or decrease in income tax expense which may have a material impact on our consolidated statements of operations in the period of the change in assumptions of estimates.
In accordance with FASB ASC 740, "Income Taxes", the valuation allowance against deferred tax assets as of October 2, 2009 and September 26, 2008 was $6.4 million and $37.1 million, respectively. During the fiscal years ended October 2, 2009, September 26, 2008 and September 28, 2007, the valuation reserve decreased $30.7 million, $12.7 million and $2.5 million, respectively. The valuation allowance at October 2, 2009 was primarily related to state and foreign operating loss carryforwards and state tax credit carryforwards that, in the judgment of management, were not more likely than not to be realized. The valuation allowance at September 26, 2008 was related to federal, state, and foreign net operating loss carryforwards, deferred tax assets, and tax credit carryforwards that, in the judgment of management, were not more likely than not to be realized. In assessing the realizability of deferred tax assets, management considers whether it is more likely than not that some or all of the deferred tax assets will not be realized. The ultimate realization of deferred tax assets depends on the generation of future taxable income during the periods in which those temporary differences are deductible. Management considers the scheduled reversal of deferred tax liabilities (including the impact of available carryback and carryforward periods) and tax planning strategies in making this assessment. In order to fully realize the deferred tax asset, we will need to generate future taxable income before the
24
expiration of the deferred tax assets as governed by the tax code. As we had a three-year cumulative loss as of September 26, 2008, management considered income from the reversal of net temporary differences in existence as of September 26, 2008 and did not considered future years' forecasted income in determining the measurement and recognition of our valuation allowance. During 2009, we achieved cumulative income for the preceding three-year period and based on all available evidence, both positive and negative, management determined that it is more likely than not that we will realize the benefit of federal and certain state net operating loss carryforwards that previously had a valuation allowance. The benefit of reducing that portion of the valuation allowance attributable to these loss carryforwards is reflected in the determination of our 2009 effective tax rate. Also during 2009, management determined, based upon all available evidence including future projected income, that it is more likely than not that we will utilize the benefits primarily related to AMT credit carryforwards. These benefits were recognized as a discrete event in our second quarter.
53-Week Fiscal Year 2009 Compared to 52-Week Fiscal Year 2008
Following is an analysis of changes in key items included in the consolidated statements of operations for the 53-week fiscal year ended October 2, 2009 compared to the 52-week fiscal year ended September 26, 2008. Amounts have been rounded. Percent of revenues, dollar change and percent change are all calculated based on amounts presented in this table (dollar amounts in millions):
| |
53-Week Fiscal Year Ended October 2, 2009 |
52-Week Fiscal Year Ended September 26, 2008 |
|
|
|||||||||||||||
|---|---|---|---|---|---|---|---|---|---|---|---|---|---|---|---|---|---|---|---|
| |
Amount | % of Revenues |
Amount | % of Revenues |
Dollar Change |
Percent Change |
|||||||||||||
Revenues: |
|||||||||||||||||||
Retail |
$ | 495.6 | 78.9 | % | $ | 425.5 | 74.8 | % | $ | 70.1 | 16.5 | % | |||||||
Institutional |
132.6 | 21.1 | 143.7 | 25.2 | (11.1 | ) | (7.7 | ) | |||||||||||
Total revenues |
628.2 | 100.0 | 569.2 | 100.0 | 59.0 | 10.4 | |||||||||||||
Significant Expenses |
|||||||||||||||||||
Cost of goods sold |
451.5 | 71.9 | 446.9 | 78.5 | 4.6 | 1.0 | |||||||||||||
Selling and marketing expense |
28.0 | 4.5 | 27.7 | 4.9 | 0.3 | 1.1 | |||||||||||||
General and administrative expense |
34.4 | 5.5 | 46.7 | 8.2 | (12.3 | ) | (26.3 | ) | |||||||||||
Impairment charges to brands |
— | — | 3.7 | 0.7 | (3.7 | ) | (100.0 | ) | |||||||||||
Interest expense, net |
16.5 | 2.6 | 26.2 | 4.6 | (9.7 | ) | (37.0 | ) | |||||||||||
Income tax expense (benefit) |
8.6 | 1.4 | (2.3 | ) | (0.4 | ) | 10.9 | n/c | |||||||||||
Key Measurements |
|||||||||||||||||||
Gross profit |
176.7 | 28.1 | 122.3 | 21.5 | 54.4 | 44.5 | |||||||||||||
Operating profit |
113.4 | 18.1 | 43.1 | 7.6 | 70.3 | 163.1 | |||||||||||||
Income before income taxes |
96.9 | 15.4 | 16.8 | 3.0 | 80.1 | 476.8 | |||||||||||||
Net income |
88.3 | 14.1 | 19.1 | 3.4 | 69.2 | 362.3 | |||||||||||||
n/c—not calculated
Revenues: Revenues increased $59.0 million, or approximately 10%, to $628.2 million for the fiscal year ended October 2, 2009, from $569.2 million for the fiscal year ended September 26, 2008. Revenues increased approximately $32.8 million, or 6%, due to higher volume and approximately $30.0 million, or 5%, due to increased average selling prices. The volume increase was partially due to an industry wide increase in consumption and partially to the inclusion of an additional week in fiscal year 2009. These increases were partly offset by a $3.8 million decrease in revenue related to payments received from the U.S. government under the Continued Dumping and Subsidy Offset Act of 2000 ("Byrd Amendment").
25
Retail revenues increased $70.1 million, or approximately 17%, to $495.6 million for the fiscal year ended October 2, 2009, from $425.5 million for the fiscal year ended September 26, 2008. The $70.1 million increase in revenues was comprised of a $38.2 million, or 9%, increase due to higher average selling prices and $35.7 million, or 8%, increase due to increased volume, partially offset by a $3.8 million decrease in payments received under the Byrd Amendment. The increase in revenues, exclusive of the impact Byrd Amendment payments received, of $73.9 million, consists of a $78.3 million increase in our strategic proprietary and customer brands, partly offset by a $4.4 million decrease in revenue related to proprietary brands we are extracting from underperforming markets. The increased volume was principally due to an industry wide increase in consumption combined with the inclusion of an additional week in fiscal year 2009. Our fiscal year 2009 selling prices include the full impact of pasta price increases made in response to rising commodity, transportation, and other input costs that had not been fully implemented during the first two quarters of the comparable period of the prior fiscal year.
Institutional revenues decreased $11.1 million, or approximately 8%, to $132.6 million for fiscal year ended October 2, 2009, from $143.7 million for fiscal year ended September 26, 2008. Revenues decreased $1.0 million, or 1%, due to decreased volume and decreased $10.1 million, or 7%, due to lower average selling prices. The primary reason for the revenue decline is that during the fiscal year 2008, we provided approximately $8.1 million of product pursuant to government contracts. Through most of 2009, we were precluded from bidding on this business due to restrictions limiting bids to small businesses as defined under the applicable government regulations. These bidding restrictions have changed. The U.S. Department of Agriculture allows certain qualified bidders (including us), who are not small businesses, to bid on specified portions of the government contracts. In addition, institutional revenue has recently been adversely affected by challenges to our customers in the food service industry and the impact of lower per-unit revenues on certain pass-through manufacturing agreements in our ingredient business.
Cost of goods sold: Cost of goods sold increased $4.6 million, or approximately 1%, to $451.5 million for the fiscal year ended October 2, 2009 from $446.9 million for the fiscal year ended September 26, 2008. As a percentage of revenues, cost of goods decreased to 71.9% for the fiscal year ended October 2, 2009 from 78.5% for fiscal year ended September 26, 2008. The fiscal year 2009 increase in cost of goods sold primarily resulted from higher sales volume, partially offset by lower commodity costs. The primary commodity used in production of pasta is durum wheat. The spot market price of durum declined during fiscal 2009 when compared to fiscal 2008. However, durum prices included as a component of cost of goods sold, while lower than in the prior year, were higher than spot market prices due to our forward purchases of durum and the use of the higher priced durum inventory in the manufacturing process. The lower durum wheat costs were partially offset by increases in other input costs including packaging, labor and energy.
Gross profit: Gross profit increased $54.4 million, or approximately 45%, to $176.7 million for the fiscal year ended October 2, 2009, from $122.3 million for the fiscal year ended September 26, 2008. Gross profit as a percentage of revenues increased to 28.1% during fiscal year 2009 compared to 21.5% during fiscal year 2008. The increase in gross profit primarily results from stabilized selling prices and favorable revenue shift to more retail and less institutional products.
Selling and marketing expense: Selling and marketing expense increased $0.3 million, or approximately 1%, to $28.0 million for the fiscal year ended October 2, 2009, from $27.7 million for fiscal year ended September 26, 2008. As a percentage of revenue, selling and marketing expense were 4.5% and 4.9% for the fiscal years 2009 and 2008, respectively. This increase is primarily the result of an increase in marketing expenses of $1.4 million and brand amortization expense of $0.8 million, partly offset by a decrease in consulting expenses of $1.6 million. The increase in marketing expense was due primarily to an overall increase in marketing programs resulting from our fiscal year 2008
26
strategic alignment. The increase in brand amortization expense results from the amortization of a brand that was designated as a definite life intangible as of the end of the prior fiscal year. The decrease in consulting expenses relates primarily to the costs, incurred and recognized during fiscal year 2008, related to an independent third party analysis of the pasta category and our market placement.
General and administrative expense: General and administrative expense decreased $12.3 or approximately 26% to $34.4 million for fiscal year 2009, from $46.7 million for fiscal year 2008. General and administrative expenses as a percentage of revenues were 5.5% for fiscal year 2009 compared to 8.2% for fiscal year 2008. This decrease was primarily due to reduction in professional fees of $15.4 million, partly offset by a $3.1 million increase in compensation and benefits. The decrease in professional fees was primarily related to restatement related fees incurred in the prior year. As previously disclosed, during fiscal year 2008 we concluded an investigation and restatement of our historical financial statements. During fiscal 2008, we incurred $17.5 million of restatement professional fees compared to $0.8 million of such fees during fiscal year 2009. In addition, non-restatement related professional fees decreased $1.5 million, due primarily to fees incurred during fiscal 2008 for filing our fiscal 2006, 2007 and 2008 10-Ks upon completion of our restatement. These decreases were partly offset by a $2.8 million increase in professional fees related to strategy development and various strategic initiatives. The increase in compensation related costs included a $2.2 million increase in stock based compensation and a $1.6 million increase in cash compensation costs. The stock based compensation increase was due primarily to changes in our stock price, which impacts certain stock awards accounted for under the liability method, combined with an increase in the impact of the number of equity awards granted during fiscal year 2008.
Impairment of brands: Our fiscal 2009 annual brand intangible review, which was based on our 2010 fiscal year business plan, did not result in an impairment charge. During fiscal 2008, we recorded a $3.7 million non-cash impairment charge related to the planned implementation of our strategy to extract our proprietary branded products from those markets in which they were underperforming.
(Gain) Loss related to long-lived assets: The losses related to long-lived assets of $0.9 million and $1.1 million for fiscal year 2009 and 2008, respectively, are due primarily to the write-off of fixed assets due to routine plant changes and asset upgrades. The fiscal year 2009 loss related to long-lived assets was reduced by a gain of approximately $0.5 million on the sale of an unused brand.
Interest expense: Interest expense for the fiscal year ended October 2, 2009, was $16.5 million, a decrease of $9.7 million, or approximately 37%, from the $26.2 million reported for the fiscal year ended September 26, 2008. This decrease is primarily due to the combination of lower interest rates and lower outstanding borrowings.
Income tax expense (benefit) Income tax expense for fiscal year 2009 was $8.6 million compared to a $2.3 million income tax benefit for fiscal year 2008. During the fiscal year 2009, management determined that based on all available evidence, both positive and negative, it was more likely than not that we will realize the benefit of federal and certain state net operating loss carryforwards that previously had a valuation allowance. Consequently, for the current year we estimate an annual effective tax rate of 19.5%, which is substantially below our statutory rate due to the benefit of reducing our valuation allowance related to these net operating loss carryforwards. Management also concluded based on all available evidence, both positive and negative, that it was more likely than not that we will be able to utilize our alternative minimum tax credit carryforward. Consequently, management decided to release the valuation allowance related, primarily to the alternative minimum tax credit, resulting in a discrete tax benefit of approximately $10.3 million. The tax benefit for fiscal year 2008 was primarily due to a reduction in the valuation allowance during the prior year against deductible temporary differences as well as a tax benefit from foreign operations.
27
Net income: Net income for fiscal year 2009, was $88.3 million, an increase of $69.2 million from the $19.1 million for fiscal year 2008, as a result of the $54.4 million increase in gross profit, the $15.4 million reduction in professional fees, and the $9.7 million reduction in interest expense, partly offset by the $10.9 million increase in income tax expense. Net income as a percentage of net revenues was 14.1% versus 3.4% in the prior year.
52-Week Fiscal Year 2008 Compared to 52-Week Fiscal Year 2007
Following is an analysis of changes in key items included in the consolidated statements of operations for the 52-week fiscal year ended September 26, 2008 compared to the 52-week fiscal year ended September 28, 2007. Amounts have been rounded. Percent of revenues, dollar change and percent change are all calculated based on amounts presented in this table (dollar amounts in millions):
| |
52-Week Fiscal Year Ended September 26, 2008 |
52-Week Fiscal Year Ended September 28, 2007 |
|
|
|||||||||||||||
|---|---|---|---|---|---|---|---|---|---|---|---|---|---|---|---|---|---|---|---|
| |
Amount | % of Revenues |
Amount | % of Revenues |
Dollar Change |
Percent Change |
|||||||||||||
Revenues: |
|||||||||||||||||||
Retail |
$ | 425.5 | 74.8 | % | 304.4 | 76.5 | % | $ | 121.1 | 39.7 | % | ||||||||
Institutional |
143.7 | 25.2 | 93.7 | 23.5 | 50.0 | 53.4 | |||||||||||||
Total revenues |
569.2 | 100.0 | 398.1 | 100.0 | 171.1 | 43.0 | |||||||||||||
Significant Expenses |
|||||||||||||||||||
Cost of goods sold |
446.9 | 78.5 | 308.8 | 77.6 | 138.1 | 44.7 | |||||||||||||
Selling and marketing expense |
27.7 | 4.9 | 21.5 | 5.4 | 6.2 | 28.8 | |||||||||||||
General and administrative expense |
46.7 | 8.2 | 33.5 | 8.4 | 13.2 | 39.4 | |||||||||||||
Impairment charges to brands |
3.7 | 0.7 | — | — | 3.7 | n/c | |||||||||||||
Interest expense, net |
26.2 | 4.6 | 29.4 | 7.4 | (3.2 | ) | (10.9 | ) | |||||||||||
Income tax expense (benefit) |
(2.3 | ) | — | (0.2 | ) | — | (2.1 | ) | 1050.0 | ||||||||||
Key Measurements |
|||||||||||||||||||
Gross profit |
122.3 | 21.5 | 89.3 | 22.4 | 33.0 | 37.0 | |||||||||||||
Operating profit |
43.1 | 7.6 | 34.4 | 8.6 | 8.7 | 25.3 | |||||||||||||
Income before income taxes |
16.8 | 3.0 | 5.2 | 1.3 | 11.6 | 223.1 | |||||||||||||
Net income |
19.1 | 3.4 | 5.3 | 1.3 | 13.8 | 260.4 | |||||||||||||
n/c—not calculated
Revenues: Revenues increased $171.1 million, or 43.0%, to $569.2 million for the fiscal year ended September 26, 2008, from $398.1 million for the fiscal year ended September 28, 2007. Revenues increased $171.6 million, or 43.1%, due to higher average selling prices, partly offset by a $2.2 million decrease related to slightly lower volume. Revenues increased by $1.7 million due to an increase in payments received from the U.S. government under the Continued Dumping and Subsidy Offset Act of 2000.
Retail revenues increased $121.1 million, or 39.7%, to $425.5 million for the fiscal year ended September 26, 2008, from $304.4 million for the fiscal year ended September 28, 2007. The revenue increase is primarily the result of a $117.0 million, or 38.4%, increase related to higher average selling prices, a $2.4 million, or 0.8%, increase in volume, and a $1.7 million, or 0.1% increase in payments received from the U.S. government under the Continued Dumping and Subsidy Offset Act of 2000.
Institutional revenues increased $50.0 million, or 53.4%, to $143.7 million for fiscal year ended September 26, 2008, from $93.7 million for fiscal year ended September 28, 2007. The revenue increase is primarily the result of a $53.5 million, or 57.1%, increase due to higher average selling prices partly
28
offset by a $3.5 million, or 3.7%, decrease due to lower volume. The decrease in volume is primarily due to eligibility changes in certain government contracts that focus on small companies as defined by the relevant governmental agency.
Cost of goods sold: Cost of goods sold increased $138.1 million, or 44.7%, to $446.9 million for the fiscal year ended September 26, 2008 from $308.8 million for the fiscal year ended September 28, 2007. As a percentage of revenues, cost of goods increased to 78.5% for the fiscal year ended September 26, 2008 from 77.6% for fiscal year ended September 28, 2007. Our raw materials, transportation, and other input costs were unfavorable compared to the prior year but the effect of the increase was substantially offset by higher selling prices. Cost of goods sold includes provision for obsolete finished goods inventory of $1.2 million for fiscal year 2008 and $0.8 million for fiscal year 2007. In addition, the fiscal year 2008 costs include the provision of $0.5 million related to the allowance for excess or obsolete spare parts.
Gross profit: Gross profit increased $33.0 million, or 37.0%, to $122.3 million for the fiscal year ended September 26, 2008, from $89.3 million for the fiscal year ended September 28, 2007. Gross profit as a percentage of revenues decreased to 21.5% during fiscal year 2008 compared to 22.4% during fiscal year 2007 due to increases in raw material, transportation, and other input costs that were not fully offset by higher prices. The increase in raw material costs was primarily the result of an increase in durum wheat prices and the increase in transportation costs was primarily the result of an increase in energy costs.
Selling and marketing expense: Selling and marketing expense increased $6.2 million, or approximately 29%, to $27.7 million for the fiscal year ended September 26, 2008, from $21.5 million for fiscal year ended September 28, 2007. This increase is primarily the result of an increase in brokerage commission costs of $2.2 million, consulting expenses of $1.6 million, compensation expenses of $1.2 million, and other business development costs of $0.5 million. The increase in broker costs are due to higher commissions as a result of increased selling prices. The increase in consulting expenses relate primarily to an independent third party analysis of the pasta category and our market placement. The increase in compensation expense is principally the result of stock based compensation, increased incentive compensation, and compensation accrued for certain employees terminated in the ordinary course of business. Selling and marketing expense, as a percentage of revenue, decreased to 4.9% for the fiscal year ended September 26, 2008 from 5.4% for the fiscal year ended September 28, 2007.
General and administrative expense: General and administrative expense increased approximately 39% to $46.7 million for the fiscal year ended September 26, 2008, from $33.5 million for the fiscal year ended September 28, 2007. General and administrative expenses as a percentage of revenues decreased to 8.2% for the fiscal year ended September 26, 2008 from 8.4% for the fiscal year ended September 28, 2007. As previously disclosed, during fiscal year 2008 we concluded an investigation and restatement of our historical financial statements. As a result of this process, we incurred certain professional fees including legal, forensic accounting, independent registered public accounting firm fees, public relations, and Alvarez & Marsal fees during fiscal years 2005 through 2008. During the fiscal year ended September 26, 2008, $17.5 million of professional fees related to the restatement of historical financial statements and pending legal matters were recorded compared to $13.3 million during the comparable period of fiscal year 2007. Included in the fiscal year 2008 amount is the monetary penalty of $7.5 million to the U.S. Department of Justice. The remaining change in general and administrative expense was due primarily to an increase of non-restatement related professional fees and consulting services of $4.2 million, an increase in compensation and benefits of $1.7 million, and an increase in stock-based compensation costs of $1.1 million. The non-restatement related professional fees primarily relate to $1.8 million of audit and legal fees associated with the filing of our fiscal years 2006 and 2007 Form 10-Ks filed in June 2008 and $1.0 million of fees related to our fiscal year 2008 filings. The consulting services are related to the review of our supply chain and operations
29
of $0.8 million and other consulting fees of $0.6 million. Compensation costs increased as a result of hiring additional personnel, including our new CEO, and increased incentive compensation.
Impairment of brands: We completed our annual review of fiscal year 2008 brand intangible values based on the 2009 fiscal year business plan and our forecast available in the fourth quarter of fiscal year 2008. We intend to invest more in our brands that are in a preferred position in the marketplace by focusing our resources on our strongest brands in their strongest markets and by extracting our proprietary branded products from those markets in which they were underperforming. Based on our review in the fourth quarter of fiscal year 2008, we have recorded a $3.7 million non-cash impairment charge on two of our brands.
(Gain) Loss related to long-lived assets: The $1.1 million loss during fiscal year 2008 is due primarily to the write-off of fixed assets due to routine plant changes and asset upgrades. During fiscal year 2007 we recognized a $0.1 million net gain on the sale of certain excess equipment.
Interest expense: Interest expense for the fiscal year ended September 26, 2008, was $26.2 million, a decrease of approximately 11% from the $29.4 million reported for the fiscal year ended September 28, 2007. The decrease is attributable to lower interest rates, partially offset by an increase in the amortization of deferred debt issuance costs. The average interest rate in effect during fiscal year 2008 and fiscal year 2007 was 10.2% and 11.4%, respectively. We recorded amortization of deferred debt issuance costs of $1.8 million in fiscal year 2008 and $1.3 million in fiscal year 2007. The $0.5 million increase is due to financing costs related to the amendment of our credit facility in December 2007.
Other (income) expense: During fiscal year 2008, we recognized net other expense of $0.1 million compared to the recognition of net other income of $(0.2) million during fiscal year 2007. These amounts primarily reflect our foreign currency transaction gains and losses.
Income tax benefit: Income tax benefit for the fiscal years ended September 26, 2008 and September 28, 2007 was $2.3 million and $0.2 million, respectively, and reflects effective income tax rates of (13.8%) and (3.1%), respectively. The effective rates in fiscal years 2008 and 2007 are substantially below statutory rates primarily due to decreases in our valuation allowances ($12.7 million in fiscal year 2008 and $2.5 million in fiscal year 2007). As we had a three-year cumulative loss as of September 26, 2008, management considered income from the reversal of net temporary differences in existence as of September 26, 2008 and did not considered future years' forecasted income in determining the measurement and recognition of our valuation allowance. If we generate income in the future, we may reverse a portion of our valuation reserve, which may have a material impact on our consolidated statements of operations.
Net income: Net income for the fiscal year ended September 26, 2008, was $19.1 million, an increase of $13.8 million from the $5.3 million for the fiscal year ended September 28, 2007, primarily as a result of the $33.0 million increase in gross margin partially offset by a $19.4 million increase in selling, general and administrative expenses. The increase in gross margin is due primarily to an increase in selling prices. The increase in selling, general and administrative expenses is due primarily to the Department of Justice monetary penalty and professional fees primarily related to the restatement and the filing of our Form 10-K for each of the fiscal years 2006, 2007 and 2008. Net income as a percentage of net revenues was 3.4% versus 1.3% in the prior year.
Liquidity and Capital Resources
Our primary sources of liquidity are cash provided by operations and borrowings under our credit facility. Cash and cash equivalents totaled $31.0 million and net working capital totaled $96.5 million at
30
October 2, 2009. Cash and cash equivalents totaled $38.6 million and net working capital totaled $72.4 million at September 26, 2008.
Our net cash provided by operating activities totaled $125.4 million for the fiscal year ended October 2, 2009 compared to $35.7 million for the fiscal year ended September 26, 2008 and $23.9 million for the fiscal year ended September 28, 2007. Our net cash provided by operating activities for the fiscal year ended October 2, 2009 was comprised primarily of net income of $88.3 million, adjusted for $35.8 million of non-cash charges and credits, primarily depreciation and amortization of $27.3 million and stock based compensation expense of $5.5 million, and a $1.3 million source of cash related to changes in operating assets and liabilities. The most significant changes in operating assets and liabilities were the $13.0 million source of cash related to the decrease of our inventories and the $2.0 million source of cash from the decrease in trade and other accounts receivable, partly offset by the $12.3 million source of cash generated by the decrease in accounts payable and accrued expenses. The source or use of cash related to inventory fluctuates from period to period based on the timing of inventory purchases and sales as well as changes in commodity costs. For the fiscal year ended October 2, 2009, the source of cash related to inventory was primarily attributable to lower levels of raw materials due to purchase and delivery timing and to lower production costs capitalized in finished goods inventory pounds. The source or use of cash related to trade and other receivables fluctuates from period to period based on the timing of sales and selling price. The source or use of cash related to accounts payable and accrued expenses fluctuates from period to period based on the timing of payments and changes in the cost of products and services used. For the fiscal year ended October 2, 2009, the use of cash related to accounts payable and accrued expense was due primarily to the $7.5 million payment made pursuant to our settlement with the Department of Justice and a $2.7 million decrease in accrued interest payable on our credit facility due a combination of payment timing, lower interest rates, and lower average outstanding balance.
Our net cash used in investing activities principally relates to investments in production and distribution, milling, and management information system assets. Cash provided by investing activities principally relates to proceeds from disposal of property, plant and equipment. Capital expenditures were $10.7 million, $12.4 million, and $9.8 million for the fiscal years 2009, 2008, and 2007, respectively. Cash used in fiscal year 2009 was partially offset by $2.1 million received from the liquidation of short term investments.
During the fiscal year ended October 2, 2009, our net cash used by financing activities amounted to $125.1 million. The primary uses of cash related to financing activities were the voluntary payments on our U.S. credit facility of $107.0 million, the mandatory payments under the excess cash provisions of our credit facility of $22.9 million, and the payment in full by our Italian subsidiary of its outstanding credit facility. These financing cash uses were partly offset by the recognition of excess tax benefits related to warrants and stock options of $6.8 million during fiscal 2009. Our fiscal year 2008 net use of cash included the payment of $0.5 million of financing costs to our bank related to the December 27, 2007 amendment and a $0.1 million mandatory principal payment under the provisions of our credit facility. In addition, we drew $15.0 million on our revolving credit facility to finance inventory purchases and advance payments, which was repaid during period. Our Italian subsidiary drew $1.1 million under revolving credit facilities during fiscal year 2008, which was repaid during the period.
As of October 2, 2009, our U.S. credit facility, as amended, was comprised of a $110.0 million term loan and a $30.0 million revolving credit facility. The U.S. credit facility is secured by substantially all of our domestic assets and provides for interest at either LIBOR rate plus 550 basis points or at an alternate base rate calculated as prime rate plus 450 basis points. The term loan matures in March 2011 and does not require any scheduled principal payments. Principal pre-payments are required if certain events occur in the future, including the sale of certain assets, issuance of equity and the generation of "excess cash flow" as defined in the credit agreement. The term loan interest rate in effect at October 2, 2009 and September 26, 2008 was 5.8% and 8.3%, respectively. As of October 2,
31
2009, we had no borrowings outstanding under the revolving credit facility. The outstanding letters of credit under our revolving credit facility totaled approximately $1.0 million as of October 2, 2009. Accordingly, under the credit facility we had additional borrowing capacity of approximately $29.0 million as of October 2, 2009.
Subsequent to year-end, we paid the $5.9 million current portion of the long term debt, which represents our excess cash flow liability, using available cash. In addition, we made voluntary prepayments of $14.1 million, reducing the outstanding term loan balance to $90.0 million.
Our U.S. credit facility contains restrictive covenants which include, among other things, financial covenants requiring minimum and cumulative earnings levels and limitations on the payment of dividends, stock purchases and our ability to enter into certain contractual arrangements. We were in compliance with these financial covenants as of October 2, 2009.
We anticipate cash generated from operations and available on our revolving credit facility to be sufficient to meet our expected capital and liquidity needs, including the funding of capital expenditures, debt repayments, and working capital requirements, for the foreseeable future.
Contractual Obligations
The following table shows our contractual payment obligations for our long term debt and future purchase obligations as of October 2, 2009. Approximately $2.7 million of unrecognized tax benefits, including interest and penalties, are not included in this contractual obligations table due to the uncertainty related to the timing of any payments. Interest on our long term debt is calculated based on the contractual loan maturity at the interest rate (5.8%) in effect at October 2, 2009 (in thousands):
Payments Due by Period
Certain Contractual Obligations
|
Total | Less than 1 year |
1 - 3 Years |
4 - 5 years |
After 5 years |
|||||||||||
|---|---|---|---|---|---|---|---|---|---|---|---|---|---|---|---|---|
Long term debt |
$ | 110,000 | $ | 5,900 | $ | 104,100 | $ | — | $ | — | ||||||
Interest payments |
9,289 | 6,409 | 2,880 | — | — | |||||||||||
Operating leases |
2,206 | 1,279 | 872 | 55 | — | |||||||||||
Supply agreement |
700 | 700 | — | — | — | |||||||||||
Other commitments |
1,410 | 1,410 | — | — | — | |||||||||||
Unconditional purchase obligations for durum, additives, and other production-related items |
47,076 | 44,076 | 2,000 | 1,000 | — | |||||||||||
Total contractual cash obligations |
$ | 170,681 | $ | 59,774 | $ | 109,852 | $ | 1,055 | $ | — | ||||||
Impact of Recent Accounting Pronouncements
The FASB issued ASU 2009-01, "Amendments based on Statement of Financial Accounting Standards No. 168—The FASB Accounting Standards Codification™ and the Hierarchy of Generally Accepted Accounting Principles", in June 2009 to codify in ASC 105, Generally Accepted Accounting Principles, FASB Statement 168, "The FASB Accounting Standards Codification™ and the Hierarchy of Generally Accepted Accounting Principles", which was issued to establish the Codification as the sole source of authoritative U.S. GAAP recognized by the FASB, excluding SEC guidance, to be applied by nongovernmental entities. The guidance in FASB ASC 105 is effective for financial statements issued for interim and annual periods ending after September 15, 2009. Applying the guidance in FASB ASC 105 did not impact our financial condition and results of operations. References to pre-Codification GAAP have been replaced with ASC references in our financial statements.
32
In December 2007, the FASB issued an amendment to FASB ACS 805 "Business Combinations" to improve the relevance, representational faithfulness, and comparability of the information that a reporting entity provides in its financial reports about a business combination and its effects. In April 2009, the FASB further amended ACS 805 "Business Combinations" to address the initial recognition and measurement of an asset acquired or a liability assumed in a business combination that arises from a contingency and for which the fair value of the asset or liability on the date of acquisition can be determined. These amendments are effective prospectively to business combinations on or after the beginning of the first annual reporting period beginning on or after December 15, 2008 (our fiscal year 2010). We do not believe that the adoption of these amendments will have a material effect on our consolidated financial statements.
In March 2008, the FASB issued an amendment to FASB ASC 815 "Derivative and Hedging" that requires enhanced disclosures about an entity's derivative and hedging activities, including how an entity uses derivative instruments, how derivative instruments and related hedged items are accounted for and how derivative instruments and related hedged items affect an entity's financial position, financial performance, and cash flows. This amendment is effective for financial statements issued for fiscal years beginning after November 15, 2008 (our fiscal year 2010), and interim periods within those fiscal years. We do not believe that the adoption of these amendments will have a material effect on our consolidated financial statements.
In April 2008, the FASB issued an amendment providing additional guidance regarding the factors that should be considered in developing renewal or extension assumptions used to determine the useful life of a recognized intangible asset as defined in FASB ASC 275 "Risks and Uncertainties" and FASB ASC 350 "Intangibles—Goodwill & Other". The intent of this amendment is to improve the consistency between the useful life of a recognized intangible asset and the period of expected cash flows used to measure the fair value of the asset. This amendment is effective for our interim and annual financial statements beginning in our fiscal year 2010. We do not believe that the adoption of these amendments will have a material effect on our consolidated financial statements.
In June 2009, the FASB issued SFAS 166 (not yet included in the Codification), "Accounting for Transfers of Financial Assets an amendment of FASB Statement No. 140" ("SFAS 166"), which amends the derecognition guidance in FASB Statement No. 140 and eliminates the exemption from consolidation for qualifying special-purpose entities. This statement is effective for financial asset transfers occurring after the beginning of an entity's first fiscal year that begins after November 15, 2009. This statement will be effective for us beginning in our fiscal 2011. We do not believe that the adoption of SFAS 166 will have a material effect on our consolidated financial statements.
In August 2009, the FASB issued FASB ASU 2009-05, "Measuring Liabilities at Fair Value", to clarify how entities should estimate the fair value of liabilities under FASB ASC 820, "Fair Value Measurements and Disclosures". The guidance applies to all entities that carry liabilities at fair value. The new guidance on measuring liabilities at fair value is effective for the first interim or annual reporting period beginning after August 28, 2009, our fiscal year 2010, with earlier application permitted if the financial statements for prior periods have not been issued. We are evaluating the impact of the adoption of FASB ASU 2009-05 on our consolidated financial statements.
Off-Balance Sheet Arrangements
As of October 2, 2009, we had no off-balance sheet arrangements that have or are reasonably likely to have a material current or future effect on our financial condition, changes in financial condition, revenues or expenses, results of operations, liquidity, capital expenditures, or capital resources.
33
ITEM 7A. QUANTITATIVE AND QUALITATIVE DISCLOSURES ABOUT MARKET RISK
Borrowings under our credit facility are variable based on changes in the London Inter-Bank Offering Rate (LIBOR). A 100 basis point increase in the LIBOR rate would result in an approximate $1.1 million increase in interest expense.
We have forward contracts for a certain portion of our future durum wheat requirements. These contracts are set price contracts to deliver grain to our mill, and are not derivative instruments as they have no net settlement provision and are not transferable.
34
ITEM 8. FINANCIAL STATEMENTS AND SUPPLEMENTARY DATA
AMERICAN ITALIAN PASTA COMPANY
Index to Consolidated Financial Statements
35
REPORT OF INDEPENDENT REGISTERED PUBLIC ACCOUNTING FIRM
Board
of Directors and Stockholders
American Italian Pasta Company
We have audited American Italian Pasta Company and subsidiaries' internal control over financial reporting as of October 2, 2009, based on criteria established in Internal Control—Integrated Framework issued by the Committee of Sponsoring Organizations of the Treadway Commission (COSO). American Italian Pasta Company's management is responsible for maintaining effective internal control over financial reporting and for its assessment of the effectiveness of internal control over financial reporting, included in the accompanying Management's Report on Internal Control over Financial Reporting appearing under Item 9a. Our responsibility is to express an opinion on American Italian Pasta Company's internal control over financial reporting based on our audit.
We conducted our audit in accordance with the standards of the Public Company Accounting Oversight Board (United States). Those standards require that we plan and perform the audit to obtain reasonable assurance about whether effective internal control over financial reporting was maintained in all material respects. Our audit included obtaining an understanding of internal control over financial reporting, assessing the risk that a material weakness exists, testing and evaluating the design and operating effectiveness of internal control based on the assessed risk, and performing such other procedures as we considered necessary in the circumstances. We believe that our audit provides a reasonable basis for our opinion.
A company's internal control over financial reporting is a process designed to provide reasonable assurance regarding the reliability of financial reporting and the preparation of financial statements for external purposes in accordance with generally accepted accounting principles. A company's internal control over financial reporting includes those policies and procedures that (1) pertain to the maintenance of records that, in reasonable detail, accurately and fairly reflect the transactions and dispositions of the assets of the company; (2) provide reasonable assurance that transactions are recorded as necessary to permit preparation of financial statements in accordance with generally accepted accounting principles, and that receipts and expenditures of the company are being made only in accordance with authorizations of management and directors of the company; and (3) provide reasonable assurance regarding prevention or timely detection of unauthorized acquisition, use, or disposition of the company's assets that could have a material effect on the financial statements.
Because of its inherent limitations, internal control over financial reporting may not prevent or detect misstatements. Also, projections of any evaluation of effectiveness to future periods are subject to the risk that controls may become inadequate because of changes in conditions, or that the degree of compliance with the policies or procedures may deteriorate.
In our opinion, American Italian Pasta Company and subsidiaries maintained, in all material respects, effective internal control over financial reporting as of October 2, 2009, based on criteria established in Internal Control—Integrated Framework issued by COSO.
We also have audited, in accordance with the standards of the Public Company Accounting Oversight Board (United States), the consolidated balance sheet and statements of operations, stockholders' equity and comprehensive income, and cash flows and financial statement schedule of American Italian Pasta Company and subsidiaries as of and for the year end October 2, 2009 and our report dated November 23, 2009 expressed an unqualified opinion.
/s/
Grant Thornton LLP
Kansas City, Missouri
November 23, 2009
36
REPORT OF INDEPENDENT REGISTERED PUBLIC ACCOUNTING FIRM
Board
of Directors and Stockholders
American Italian Pasta Company
We have audited the accompanying consolidated balance sheets of American Italian Pasta Company and subsidiaries as of October 2, 2009 and September 26, 2008 and the related consolidated statements of operations, stockholders' equity and comprehensive income, and cash flows for the years then ended. Our audits of the basic financial statements included the financial statement schedule listed in the Index under Item 15(a) as of and for the years ended October 2, 2009 and September 26, 2008. These financial statements and financial statement schedule are the responsibility of the Company's management. Our responsibility is to express an opinion on these consolidated financial statements and financial schedule based on our audits.
We conducted our audits in accordance with the standards of the Public Company Accounting Oversight Board (United States). Those standards require that we plan and perform the audit to obtain reasonable assurance about whether the financial statements are free of material misstatement. An audit includes examining, on a test basis, evidence supporting the amounts and disclosures in the financial statements, assessing the accounting principles used and significant estimates made by management, as well as evaluating the overall financial statement presentation. We believe that our audits provide a reasonable basis for our opinion.
In our opinion, the consolidated financial statements referred to above present fairly, in all material respects, the financial position of American Italian Pasta Company and subsidiaries as of October 2, 2009 and September 26, 2008, and the results of their operations and their cash flows for the years then ended in conformity with accounting principles generally accepted in the United States of America. Also, in our opinion, the related financial statement schedule, when considered in relation to the basic consolidated financial statements taken as a whole, presents fairly, in all material respects.
We also have audited, in accordance with the standards of the Public Company Accounting Oversight Board (United States), American Italian Pasta Company and subsidiaries' internal control internal control over financial reporting as of October 2, 2009 based on criteria established in Internal Control—Integrated Framework issued by the Committee of Sponsoring Organizations of the Treadway Commission (COSO) and our report dated November 23, 2009 expressed an unqualified opinion thereon.
/s/
Grant Thornton LLP
Kansas City, Missouri
November 23, 2009
37
REPORT OF INDEPENDENT REGISTERED PUBLIC ACCOUNTING FIRM
The
Board of Directors
American Italian Pasta Company
We have audited the consolidated statements of operations, stockholders' equity and comprehensive income, and cash flows of American Italian Pasta Company (the Company) for the year ended September 28, 2007. Our audit also included the financial statement schedule for the year ended September 28, 2007 listed in the Index at Item 15(a). These financial statements and schedule are the responsibility of the Company's management. Our responsibility is to express an opinion on these financial statements and schedule based on our audit.
We conducted our audit in accordance with the standards of the Public Company Accounting Oversight Board (United States). Those standards require that we plan and perform the audit to obtain reasonable assurance about whether the financial statements are free of material misstatement. An audit includes examining, on a test basis, evidence supporting the amounts and disclosures in the financial statements. An audit also includes assessing the accounting principles used and significant estimates made by management, as well as evaluating the overall financial statement presentation. We believe that our audit provides a reasonable basis for our opinion.
In our opinion, the financial statements referred to above present fairly, in all material respects, the consolidated results of operations and cash flows of American Italian Pasta Company for the year ended September 28, 2007, in conformity with U.S. generally accepted accounting principles. Also, in our opinion, the related financial statement schedule for the year ended September 28, 2007, when considered in relation to the basic financial statements taken as a whole, presents fairly in all material respects the information set forth therein.
/s/
Ernst & Young LLP
Kansas City, Missouri
June 27, 2008
38
AMERICAN ITALIAN PASTA COMPANY
CONSOLIDATED BALANCE SHEETS
(in thousands, except share amounts)
| |
October 2, 2009 | September 26, 2008 | |||||||
|---|---|---|---|---|---|---|---|---|---|
ASSETS |
|||||||||
Current assets: |
|||||||||
Cash and cash equivalents |
$ | 30,959 | $ | 38,623 | |||||
Trade and other receivables, net |
45,828 | 49,197 | |||||||
Inventories |
50,996 | 66,026 | |||||||
Other current assets |
6,372 | 8,189 | |||||||
Deferred income taxes |
22,202 | 2,126 | |||||||
Total current assets |
156,357 | 164,161 | |||||||
Property, plant and equipment, net |
291,212 | 303,503 | |||||||
Brands |
79,074 | 79,769 | |||||||
Other assets |
3,420 | 5,591 | |||||||
Total assets |
$ | 530,063 | $ | 553,024 | |||||
LIABILITIES AND STOCKHOLDERS' EQUITY |
|||||||||
Current liabilities: |
|||||||||
Accounts payable |
$ | 29,852 | $ | 29,541 | |||||
Accrued expenses |
24,147 | 37,357 | |||||||
Short term debt and current maturities of long term debt |
5,900 | 24,913 | |||||||
Total current liabilities |
59,899 | 91,811 | |||||||
Long term debt, less current maturities |
104,100 | 217,000 | |||||||
Deferred income taxes |
52,972 | 34,054 | |||||||
Other long term liabilities |
5,676 | 4,188 | |||||||
Total liabilities |
222,647 | 347,053 | |||||||
Commitments and contingencies |
|||||||||
Stockholders' equity: |
|||||||||
Preferred stock, $.001 par value: |
|||||||||
Authorized shares—10,000,000; Issued and outstanding shares—none |
— | — | |||||||
Class A common stock, $.001 par value: |
|||||||||
Authorized shares—75,000,000; Issued and outstanding shares—23,198,013 and 20,981,913, respectively, at October 2, 2009; 22,454,145 and 20,259,060, respectively, at September 26, 2008 |
23 | 22 | |||||||
Class B common stock, par value $.001 |
|||||||||
Authorized shares—25,000,000; Issued and outstanding—none |
— | — | |||||||
Additional paid-in capital |
274,142 | 261,772 | |||||||
Treasury stock 2,216,100 shares at October 2, 2009 and 2,195,085 shares at September 26, 2008, at cost |
(52,519 | ) | (52,076 | ) | |||||
Accumulated other comprehensive income |
17,957 | 16,728 | |||||||
Retained earnings (accumulated deficit) |
67,813 | (20,475 | ) | ||||||
Total stockholders' equity |
307,416 | 205,971 | |||||||
Total liabilities and stockholders' equity |
$ | 530,063 | $ | 553,024 | |||||
See accompanying notes to consolidated financial statements.
39
AMERICAN ITALIAN PASTA COMPANY
CONSOLIDATED STATEMENTS OF OPERATIONS
(in thousands, except per share amounts)
| |
Year Ended | |||||||||
|---|---|---|---|---|---|---|---|---|---|---|
| |
October 2, 2009 | September 26, 2008 | September 28, 2007 | |||||||
| |
(53 weeks) |
(52 weeks) |
(52 weeks) |
|||||||
Revenues |
$ | 628,162 | $ | 569,196 | $ | 398,122 | ||||
Cost of goods sold |
451,513 | 446,891 | 308,819 | |||||||
Gross profit |
176,649 | 122,305 | 89,303 | |||||||
Selling and marketing expense |
27,989 |
27,727 |
21,503 |
|||||||
General and administrative expense |
34,363 | 46,663 | 33,548 | |||||||
Impairment charges to brands |
— | 3,654 | — | |||||||
(Gain) loss related to long-lived assets |
885 | 1,139 | (109 | ) | ||||||
Operating profit |
113,412 | 43,122 | 34,361 | |||||||
Interest expense, net |
16,499 | 26,240 | 29,421 | |||||||
Other (income) expense, net |
(8 | ) | 92 | (245 | ) | |||||
Income before income taxes |
96,921 |
16,790 |
5,185 |
|||||||
Income tax expense (benefit) |
8,633 | (2,321 | ) | (163 | ) | |||||
Net income |
$ | 88,288 | $ | 19,111 | $ | 5,348 | ||||
Net income per common share (basic) |
$ |
4.27 |
$ |
1.00 |
$ |
0.29 |
||||
Weighted-average common shares outstanding |
20,692 |
19,118 |
18,673 |
|||||||
Net income per common share (assuming dilution) |
$ |
4.10 |
$ |
0.99 |
$ |
0.28 |
||||
Weighted-average common shares outstanding (including dilutive securities) |
21,555 |
19,384 |
18,951 |
|||||||
See accompanying notes to consolidated financial statements.
40
AMERICAN ITALIAN PASTA COMPANY
CONSOLIDATED STATEMENTS OF STOCKHOLDERS' EQUITY & COMPREHENSIVE INCOME
(in thousands)
| |
Class A Common Stock | |
|
|
|
|
|||||||||||||||||||
|---|---|---|---|---|---|---|---|---|---|---|---|---|---|---|---|---|---|---|---|---|---|---|---|---|---|
| |
Treasury Stock | Accumulated Other Comprehensive Income |
|
|
|||||||||||||||||||||
| |
|
|
Additional Paid-in Capital |
Accumulated Deficit |
Total Stockholders' Equity |
||||||||||||||||||||
| |
Shares | Amount | Shares | At Cost | |||||||||||||||||||||
Balance at September 29, 2006 |
20,779 | 21 | 245,623 | (2,139 | ) | (51,857 | ) | 10,815 | (44,266 | ) | 160,336 | ||||||||||||||
Net income (52 weeks) |
— | — | — | — | — | — | 5,348 | 5,348 | |||||||||||||||||
Foreign currency translation adjustment |
— | — | — | — | — | 4,537 | — | 4,537 | |||||||||||||||||
Comprehensive income |
9,885 | ||||||||||||||||||||||||
Stock-based compensation |
54 | — | 1,869 | — | — | — | — | 1,869 | |||||||||||||||||
Purchase treasury shares |
— | — | — | (19 | ) | (172 | ) | — | — | (172 | ) | ||||||||||||||
Balance at September 28, 2007 |
20,833 | 21 | 247,492 | (2,158 | ) | (52,029 | ) | 15,352 | (38,918 | ) | 171,918 | ||||||||||||||
Net income (52 weeks) |
— | — | — | — | — | — | 19,111 | 19,111 | |||||||||||||||||
Foreign currency translation adjustment |
— | — | — | — | — | 1,376 | — | 1,376 | |||||||||||||||||
Comprehensive income |
20,487 | ||||||||||||||||||||||||
Cumulative effect of adoption of FASB ASC 740 "Income Taxes", concerning uncertain tax positions (Note 11) |
— | — | — | — | — | — | (668 | ) | (668 | ) | |||||||||||||||
Stock issued on settlement of shareholder suit |
1,431 | 1 | 13,999 | — | — | — | — | 14,000 | |||||||||||||||||
Stock-based compensation |
190 | — | 1,376 | (30 | ) | — | — | — | 1,376 | ||||||||||||||||
Purchase treasury shares |
— | — | — | (7 | ) | (47 | ) | — | — | (47 | ) | ||||||||||||||
Stock based income tax benefit |
(1,095 | ) | (1,095 | ) | |||||||||||||||||||||
Balance at September 26, 2008 |
22,454 | 22 | 261,772 | (2,195 | ) | (52,076 | ) | 16,728 | (20,475 | ) | 205,971 | ||||||||||||||
Net income (53 weeks) |
88,288 | 88,288 | |||||||||||||||||||||||
Foreign currency translation adjustment |
1,229 | 1,229 | |||||||||||||||||||||||
Comprehensive income |
89,517 | ||||||||||||||||||||||||
Stock-based compensation |
744 | 1 | 4,875 | (4 | ) | 4,876 | |||||||||||||||||||
Purchase treasury shares |
(17 | ) | (443 | ) | (443 | ) | |||||||||||||||||||
Stock-based income tax benefit |
7,495 | 7,495 | |||||||||||||||||||||||
Balance at October 2, 2009 |
23,198 | $ | 23 | $ | 274,142 | (2,216 | ) | $ | (52,519 | ) | $ | 17,957 | $ | 67,813 | $ | 307,416 | |||||||||
See accompanying notes to consolidated financial statements.
41
AMERICAN ITALIAN PASTA COMPANY
CONSOLIDATED STATEMENTS OF CASH FLOWS
(in thousands)
| |
Year Ended | |||||||||||
|---|---|---|---|---|---|---|---|---|---|---|---|---|
| |
October 2, 2009 | September 26, 2008 | September 28, 2007 | |||||||||
| |
(53 weeks) |
(52 weeks) |
(52 weeks) |
|||||||||
OPERATING ACTIVITIES: |
||||||||||||
Net income |
$ | 88,288 | $ | 19,111 | $ | 5,348 | ||||||
Adjustments to reconcile net income to net cash provided by operations: |
||||||||||||
Depreciation and amortization |
24,986 | 24,092 | 23,409 | |||||||||
Amortization of deferred financing fees |
2,296 | 1,836 | 1,265 | |||||||||
Impairment charges to brands |
— | 3,654 | — | |||||||||
Provision for inventory obsolescence |
2,100 | 1,233 | 788 | |||||||||
Stock-based compensation expense |
5,539 | 3,165 | 1,869 | |||||||||
Deferred income tax (benefit) expense |
6,334 | (2,017 | ) | (667 | ) | |||||||
Excess tax benefit—share based compensation and warrants |
(6,799 | ) | — | — | ||||||||
Other |
1,377 | 2,201 | 54 | |||||||||
Changes in operating assets and liabilities: |
||||||||||||
Trade and other receivables |
1,976 | (9,011 | ) | (5,372 | ) | |||||||
Inventories |
13,028 | (22,800 | ) | (4,182 | ) | |||||||
Other current assets |
(425 | ) | 1,806 | (1,203 | ) | |||||||
Accounts payable and accrued expenses |
(12,339 | ) | 14,768 | 2,839 | ||||||||
Other |
(987 | ) | (2,296 | ) | (239 | ) | ||||||
Net cash provided by operating activities |
125,374 | 35,742 | 23,909 | |||||||||
INVESTING ACTIVITIES: |
||||||||||||
Short term investments under orderly liquidation |
— | (7,379 | ) | — | ||||||||
Redemption of short term investments |
2,124 | 4,803 | — | |||||||||
Additions to property, plant and equipment |
(10,691 | ) | (12,430 | ) | (9,836 | ) | ||||||
Proceeds from disposal of long-lived assets |
544 | 1,961 | 356 | |||||||||
Net cash used in investing activities |
(8,023 | ) | (13,045 | ) | (9,480 | ) | ||||||
FINANCING ACTIVITIES: |
||||||||||||
Proceeds from issuance of debt |
— | 16,151 | — | |||||||||
Principal payments on debt |
(131,799 | ) | (16,251 | ) | (20,500 | ) | ||||||
Excess tax benefit—stock based compensation and warrants |
6,799 | — | — | |||||||||
Other |
(56 | ) | (586 | ) | (480 | ) | ||||||
Net cash used in financing activities |
(125,056 | ) | (686 | ) | (20,980 | ) | ||||||
Effect of exchange rate changes on cash |
41 | (23 | ) | 381 | ||||||||
Net increase (decrease) in cash and cash equivalents |
(7,664 | ) | 21,988 | (6,170 | ) | |||||||
Cash and cash equivalents, beginning of year |
38,623 | 16,635 | 22,805 | |||||||||
Cash and cash equivalents, end of year |
$ | 30,959 | $ | 38,623 | $ | 16,635 | ||||||
See accompanying notes to consolidated financial statements.
42
AMERICAN ITALIAN PASTA COMPANY
SUPPLEMENTAL CASH FLOW INFORMATION
(in thousands)
| |
Year Ended | ||||||||||
|---|---|---|---|---|---|---|---|---|---|---|---|
| |
October 2, 2009 | September 26, 2008 | September 28, 2007 | ||||||||
| |
(53 weeks) |
(52 weeks) |
(52 weeks) |
||||||||
Cash paid for interest |
$ | 16,486 | $ | 23,851 | $ | 28,151 | |||||
Cash paid for income taxes, net |
$ | 1,535 | $ | 352 | $ | 74 | |||||
Non-cash investing and financing activities |
|||||||||||
Property, plant and equipment accrued in accounts payable |
$ | 789 | $ | 173 | $ | 161 | |||||
Cash received by escrow agent on litigation-related insurance proceeds |
$ | — | $ | 11,000 | $ | — | |||||
Cash distributed to shareholders by escrow agent under litigation settlement |
$ | — | $ | 11,000 | $ | — | |||||
Stock issued in relation to settlement liability |
$ | — | $ | 14,000 | $ | — | |||||
43
AMERICAN ITALIAN PASTA COMPANY
Notes to Consolidated Financial Statements
1. DESCRIPTION OF THE BUSINESS
American Italian Pasta Company is a Delaware corporation which began operations in 1988. We believe we are the largest producer and marketer of dry pasta in North America, by volume, based on data available from The Nielsen Company ("Nielsen"), published competitor financial information, industry sources such as the National Pasta Association, suppliers, trade magazines and our own market research. We have manufacturing and distribution facilities located in Excelsior Springs, Missouri, Columbia, South Carolina, Tolleson, Arizona, and Verolanuova, Italy.
2. SUMMARY OF SIGNIFICANT ACCOUNTING POLICIES
Principles of Consolidation—The consolidated financial statements include the accounts of our majority-owned subsidiaries. All significant intercompany accounts and transactions have been eliminated in consolidation.
Fiscal Year End—Our fiscal year ends on the last Friday of September or the first Friday of October, resulting in a 52- or 53-week year depending on the calendar. Our first three quarters end on the Friday last preceding December 31, March 31 and June 30 or the first Friday of the following month of each quarter. Fiscal year 2009 was a 53-week year and ended on October 2, 2009. Fiscal years 2008 and 2007 were 52 weeks and ended on September 26, 2008 and September 28, 2007.
Revenue Recognition—The provisions of FASB ASC 605 and all other related interpretations have been applied. Sales are recognized when delivery of product has occurred or services have been rendered, there is persuasive evidence of a sales arrangement, selling prices are fixed or determinable, and collection from the customer is reasonably assured. Transfer of title typically occurs upon delivery at the customers' place of business. Promotional allowances related to our sales are recorded at the time revenue is recognized and reflected as a reduction of revenues on the accompanying consolidated statements of operations. Such allowances, where applicable, are estimated based on anticipated volume and promotional spending with specific customers. We recognize revenue for subsidy offset payments from the Department of Commerce (see Note 10) when the amount and the right to receive payment can be reasonably determined.
Foreign Currency—Our foreign operations utilize the Euro as their functional currency. Accordingly, for purposes of translating foreign subsidiary financial statements to the U.S. dollar reporting currency, assets and liabilities of our foreign operations are translated at the period-end exchange rate and revenues and expenses are translated at the weighted-average exchange rates for the period and related gains or losses are recognized as other comprehensive income. Foreign currency gains and losses resulting from foreign currency transactions are included in consolidated operations in the period incurred. Realized net foreign currency transaction (gains) losses of $0.3 million, $0.2 million, and ($0.1) million for fiscal years 2009, 2008, and 2007, respectively, are reflected in the statement of operations under the caption other (income) expense, net.
Use of Estimates—The preparation of financial statements in conformity with accounting principles generally accepted in the United States requires us to make estimates and assumptions that affect the amounts reported in the financial statements and accompanying notes. Our accounting policies with significant estimates include indefinite-lived intangible assets, long-lived assets, share-based compensation, allowance for doubtful accounts, reserves for slow-moving, damaged and discontinued inventory, reserve for obsolete and impaired spare parts, promotional allowances, and income taxes. Actual results could differ from those estimates.
44
AMERICAN ITALIAN PASTA COMPANY
Notes to Consolidated Financial Statements (Continued)
2. SUMMARY OF SIGNIFICANT ACCOUNTING POLICIES (Continued)
Risks and Uncertainties—Pasta is made from semolina milled from durum wheat. Durum wheat is a narrowly traded commodity crop. We attempt to mitigate some of the effect of durum wheat cost fluctuations through forward purchase contracts for physical delivery. These contracts represent normal purchases and are recorded as performance occurs under the contract. Our commodity procurement and pricing practices are intended to reduce the risk of durum wheat cost increases on profitability, but also may affect our ability to benefit from durum wheat cost decreases.
A single customer accounts for a significant portion of our revenues and accounts receivable, as disclosed in Note 17. In addition, our customers are concentrated in the retail sector of the economy.
Financial Instruments—The carrying values of our financial instruments, including cash and cash equivalents, trade and other receivables, accounts payable, short term debt, and long term debt, as reported in the accompanying consolidated balance sheets at October 2, 2009 and September 26, 2008, approximate fair value.
Cash and Cash Equivalents—Cash and cash equivalents, including approximately $5.4 million in foreign jurisdictions as of October 2, 2009, is comprised of cash on hand, amounts due from banks and highly liquid marketable securities with maturities of three months or less at the date of purchase. At times, we have cash in excess of FDIC limits and place our cash and cash equivalents with well established financial institutions.
Trade Accounts Receivable—We grant credit to certain customers who meet our established credit requirements. Generally, we do not require collateral when trade credit is granted to customers. Trade receivables are determined to be past-due based upon terms established with each customer. We evaluate the collectability of accounts receivable and determine the appropriate reserve for doubtful accounts based upon a number of factors. We utilize specific criteria to determine uncollectible receivables to be written-off including whether a customer has filed for bankruptcy, has had accounts referred to outside parties for collection, or has had accounts past due over specified periods. The allowance for doubtful accounts at October 2, 2009 and September 26, 2008 was $1.4 million and $2.3 million, respectively and is netted against accounts receivable in the consolidated balance sheet. Uncollectible accounts are written-off against the allowance for doubtful accounts after collection efforts have been exhausted. During fiscal 2009, we wrote off approximately $1.1 million of fully-reserved accounts receivable that had been outstanding for an extended period. For the fiscal years 2009, 2008, and 2007, bad debt expense was $0.2 million, $0.4 million, and $0.2 million, respectively.
Inventories—Inventories are carried at standard cost adjusted for capitalized variances, which approximate the lower of cost, determined on a first-in, first-out (FIFO) basis, or market. We periodically review our inventory for slow-moving, damaged or discontinued items and provide reserves to reduce such items identified to their recoverable amount. Inbound freight costs are capitalized as a component of inventory. Warehousing costs, including storage costs, are expensed as incurred as a component of cost of goods sold.
45
AMERICAN ITALIAN PASTA COMPANY
Notes to Consolidated Financial Statements (Continued)
2. SUMMARY OF SIGNIFICANT ACCOUNTING POLICIES (Continued)
Property, Plant and Equipment—Capital additions and improvements are classified as property, plant and equipment and are recorded at cost. Depreciation is calculated for financial statement purposes using the straight-line method over the estimated useful life of the related asset as follows:
| |
Number of Years | |||
|---|---|---|---|---|
Land improvements |
28 - 40 | |||
Buildings |
30 - 40 | |||
Plant and mill equipment |
10 - 30 | |||
Furniture, fixtures and equipment |
3 - 10 | |||
Plant and mill equipment also includes spare parts, recorded at lower of average cost or realizable value. Spare parts, valued at the lower of average cost or net realizable value, are not depreciated but are expensed when placed in service. We periodically review our spare parts for excess and obsolete items and provide reserves to reduce such items to their recoverable amounts. At October 2, 2009 and September 26, 2008, the reserve was $0.9 million and $1.0 million, respectively.
Brands—In accordance with ASC 350-50 "Intangibles—Goodwill and Other"', we do not amortize the cost of intangible assets with indefinite lives. Our indefinite lived intangible assets consist entirely of brand names. We perform impairment tests of the carrying value of indefinite lived intangible assets at least annually during our fourth quarter and more frequently should events or changes in circumstances indicate that the carrying amount of an asset may not be fully recoverable. These impairment tests are impacted by judgments as to future cash flows and other considerations. If such assets are considered to be impaired, the impairment to be recognized is measured by the amount by which the carrying amount of the assets exceeds the fair value of the assets. Assets to be disposed of are reported at the lower of the carrying amount or fair value less costs to sell. See Note 6—Brands for a discussion of charges to income resulting from brand impairments.
Other Long-Lived Assets—We review long-lived assets, including amortizable intangible assets for impairment, whenever events or changes in circumstances indicate that the carrying amount of an asset may not be recoverable. We evaluate recoverability of assets to be held and used by comparing the carrying amount of an asset to future net undiscounted cash flows expected to be generated by the asset. If such assets are considered to be impaired, the impairment to be recognized is measured by the amount by which the carrying amount of the assets exceeds the fair value of the assets. Assets to be disposed of are reported at the lower of the carrying amount or fair value less costs to sell.
Income Taxes—A deferred tax asset or liability is recognized for the anticipated future tax consequences of temporary differences between the tax basis of assets or liabilities and their reported amounts in the financial statements and for operating loss and tax credit carryforwards. A valuation allowance is provided when, in the opinion of management, it is more likely than not that some portion or all of a deferred tax asset will not be realized. Realization of the deferred tax assets is dependent on our ability to generate sufficient future taxable income and, if necessary, execution of our tax planning strategies. In the event we determine that sufficient future taxable income, taking into consideration tax planning strategies, may not generate sufficient taxable income to fully realize net deferred tax assets, we may be required to establish or increase valuation allowances by a charge to income tax expense in the period such a determination is made. This charge may have a material impact on recognized income tax expense on our consolidated statement of operations. Deferred tax assets and liabilities are
46
AMERICAN ITALIAN PASTA COMPANY
Notes to Consolidated Financial Statements (Continued)
2. SUMMARY OF SIGNIFICANT ACCOUNTING POLICIES (Continued)
measured using enacted tax rates expected to apply to taxable income in the years in which those temporary differences are expected to be recovered or settled. The effect on deferred tax assets and liabilities of a change in tax rates is recognized in income in the period that includes the enactment date. The recognition of a change in enacted tax rates may have a material impact on recognized income tax expense and on our consolidated statements of operations.
Effective September 29, 2007, we adopted the provisions of FASB ASC 740 "Income Taxes" that changed the framework for accounting for uncertainty in income taxes and provided a comprehensive model to recognize, measure, present, and disclose in our financial statements uncertain tax positions taken or expected to be taken on a tax return. We initially recognize tax positions in the financial statements when it is more likely than not the position will be sustained upon examination by the tax authorities. Such tax positions are initially and subsequently measured as the largest amount of tax benefit that is greater than 50% likely of being realized upon ultimate settlement with the tax authority assuming full knowledge of the position and all relevant facts. Application requires numerous estimates based on available information. We consider many factors when evaluating and estimating our tax positions and tax benefits, and our recognized tax positions and tax benefits may not accurately anticipate actual outcomes. As we obtain additional information, we may need to periodically adjust our recognized tax positions and tax benefits. These periodic adjustments may have a material impact on our consolidated statements of operations. The cumulative effect of applying these provisions was reported as an adjustment to the opening balance of retained earnings as of September 29, 2007. The cumulative effect adjustment does not include items that would not be recognized in earnings, such as the effect on tax positions related to business combinations.
Share-Based Compensation—We recognize all share-based payments to employees in the income statement based on the fair value of the award for those awards that are expected to vest. Forfeitures of awards are estimated at the time of grant and revised appropriately in subsequent periods if actual forfeitures differ from those estimates. Nonvested share awards classified as equity are measured at fair value as if the share were vested and issued on the grant date. Nonvested share awards classified as liabilities are remeasured at each reporting date until the date of settlement. Compensation cost for each period is based on the percentage of the requisite service that has been rendered through the end of the period and the change in fair value of the award during the period. We utilize the Black-Scholes option valuation model to calculate the fair value of each stock option and stock appreciation right award. Expected volatility was based on the combination of the historical volatility of our common stock and the implied volatility of our options. The expected term of the options and stock appreciation rights represent the period of time until exercise or termination and is based on historical experience of similar awards, including vesting schedules and expectations of future behavior. The risk free interest rate is based on the U.S. Treasury rate at the time of the grant for instruments of a comparable life. Our valuation model assumes a zero dividend rate.
Advertising Costs—Advertising costs are expensed the first time the advertising takes place. Advertising costs were $3.6 million in the fiscal year 2009, $2.2 million in the fiscal year 2008, and $2.3 million in fiscal year 2007.
Other Comprehensive Income—Comprehensive income refers to revenue, expense, gains, and losses that are recorded as an element of stockholders' equity rather than as a component of net income. Our other comprehensive income consists primarily of foreign currency translation adjustments from foreign subsidiaries using the local currency as their functional currency.
47
AMERICAN ITALIAN PASTA COMPANY
Notes to Consolidated Financial Statements (Continued)
2. SUMMARY OF SIGNIFICANT ACCOUNTING POLICIES (Continued)
Impact of Recent Accounting Pronouncements—
The FASB issued ASU 2009-01, "Amendments based on Statement of Financial Accounting Standards No. 168—The FASB Accounting Standards Codification™ and the Hierarchy of Generally Accepted Accounting Principles", in June 2009 to codify in ASC 105, Generally Accepted Accounting Principles, FASB Statement 168, "The FASB Accounting Standards Codification™ and the Hierarchy of Generally Accepted Accounting Principles", which was issued to establish the Codification as the sole source of authoritative U.S. GAAP recognized by the FASB, excluding SEC guidance, to be applied by nongovernmental entities. The guidance in FASB ASC 105 is effective for financial statements issued for interim and annual periods ending after September 15, 2009. Applying the guidance in FASB ASC 105 did not impact our financial condition and results of operations. References to pre-Codification GAAP have been replaced with ASC references in our financial statements.
In December 2007, the FASB issued an amendment to FASB ACS 805 "Business Combinations" to improve the relevance, representational faithfulness, and comparability of the information that a reporting entity provides in its financial reports about a business combination and its effects. In April 2009, the FASB further amended ACS 805 "Business Combinations" to address the initial recognition and measurement of an asset acquired or a liability assumed in a business combination that arises from a contingency and for which the fair value of the asset or liability on the date of acquisition can be determined. These amendments are effective prospectively to business combinations on or after the beginning of the first annual reporting period beginning on or after December 15, 2008 (our fiscal year 2010). We do not believe that the adoption of these amendments will have a material effect on our consolidated financial statements.
In March 2008, the FASB issued an amendment to FASB ASC 815 "Derivative and Hedging" that requires enhanced disclosures about an entity's derivative and hedging activities, including how an entity uses derivative instruments, how derivative instruments and related hedged items are accounted for and how derivative instruments and related hedged items affect an entity's financial position, financial performance, and cash flows. This amendment is effective for financial statements issued for fiscal years beginning after November 15, 2008 (our fiscal year 2010), and interim periods within those fiscal years. We do not believe that the adoption of these amendments will have a material effect on our consolidated financial statements.
In April 2008, the FASB issued an amendment providing additional guidance regarding the factors that should be considered in developing renewal or extension assumptions used to determine the useful life of a recognized intangible asset as defined in FASB ASC 275 "Risks and Uncertainties" and FASB ASC 350 "Intangibles—Goodwill & Other". The intent of this amendment is to improve the consistency between the useful life of a recognized intangible asset and the period of expected cash flows used to measure the fair value of the asset. This amendment is effective for our interim and annual financial statements beginning in our fiscal year 2010. We do not believe that the adoption of these amendments will have a material effect on our consolidated financial statements.
In June 2009, the FASB issued SFAS 166 (not yet included in the Codification), "Accounting for Transfers of Financial Assets an amendment of FASB Statement No. 140" ("SFAS 166"), which amends the derecognition guidance in FASB Statement No. 140 and eliminates the exemption from consolidation for qualifying special-purpose entities. This statement is effective for financial asset transfers occurring after the beginning of an entity's first fiscal year that begins after November 15,
48
AMERICAN ITALIAN PASTA COMPANY
Notes to Consolidated Financial Statements (Continued)
2. SUMMARY OF SIGNIFICANT ACCOUNTING POLICIES (Continued)
2009. This statement will be effective for us beginning in our fiscal 2011. We do not believe that the adoption of SFAS 166 will have a material effect on our consolidated financial statements.
In August 2009, the FASB issued FASB ASU 2009-05, "Measuring Liabilities at Fair Value", to clarify how entities should estimate the fair value of liabilities under FASB ASC 820, "Fair Value Measurements and Disclosures". The guidance applies to all entities that carry liabilities at fair value. The new guidance on measuring liabilities at fair value is effective for the first interim or annual reporting period beginning after August 28, 2009, our fiscal year 2010, with earlier application permitted if the financial statements for prior periods have not been issued. We are evaluating the impact of the adoption of FASB ASU 2009-05 on our consolidated financial statements.
3. FAIR VALUE MEASURES
As of the beginning of our fiscal year 2009, we adopted FASB ASC 820 "Financial Value Measures and Disclosures", which defines fair value as the exchange price that would be received for an asset or paid to transfer a liability (an exit price) in the principal or most advantageous market for the asset or liability in an orderly transaction between market participants on the measurement date.
FASB ASC 820 establishes a fair value hierarchy which requires an entity to maximize the use of observable inputs and minimize the use of unobservable inputs when measuring fair value. The standard describes three levels of inputs that may be used to measure fair value:
Level 1—Quoted prices in active markets for identical assets or liabilities;
Level 2—Observable inputs other than Level 1 prices, such as quoted prices for similar assets or liabilities; quoted prices in markets that are not active; or other inputs that are observable or can be corroborated by observable market data for substantially the full term of the assets or liabilities; and
Level 3—Unobservable inputs that are supported by little or no market activity and that are significant to the fair value of the assets or liabilities.
As of October 2, 2009 we have no financial assets or liabilities that are required to be measured at fair value on a recurring basis. The carrying value of our financial assets or liabilities that are not required to be measured at fair value on a recurring basis, including cash and cash equivalents, short term investments, trade and other receivables, accounts payable, short term debt, and long term debt, as reported in the accompanying consolidated balance sheets as of October 2, 2009 and September 26, 2008, approximate fair value.
We do not believe that the application of the provisions of FASB ASC 820 to our non-financial assets and liabilities will have a material impact on our financial statements.
Effective at the beginning of our fiscal year 2009, we adopted FASB ASC 825, "Financial Instruments", which permits companies to choose to measure many financial instruments and certain other items at fair value as of the beginning of our current fiscal year. We have not elected to report any financial assets or liabilities at fair value under FASB ASC 825.
49
AMERICAN ITALIAN PASTA COMPANY
Notes to Consolidated Financial Statements (Continued)
4. INVENTORIES
Inventories are carried at standard cost adjusted for capitalized variances, which approximate the lower of cost, determined on a first-in, first-out (FIFO) basis, or market. We periodically review our inventory for slow-moving, damaged or discontinued items and adjust our reserves to reduce such items identified to their recoverable amount.
We recognized $2.1 million $1.2 million, and $0.8 million of expense related to slow moving, damaged, and discontinued inventory during fiscal years 2009, 2008 and 2007, respectively. This expense was included as a component of cost of goods sold on the consolidated statements of operations.
Inventories consist of the following (in thousands):
| |
October 2, 2009 | September 26, 2008 | |||||
|---|---|---|---|---|---|---|---|
Finished goods |
$ | 38,156 | $ | 44,861 | |||
Raw materials, additives, packaging materials and work-in-process |
13,422 | 21,856 | |||||
Reserves for slow-moving, damaged and discontinued inventory |
(582 | ) | (691 | ) | |||
|
$ | 50,996 | $ | 66,026 | |||
5. PROPERTY, PLANT AND EQUIPMENT
Property, plant and equipment consist of the following (in thousands):
| |
October 2, 2009 | September 26, 2008 | |||||
|---|---|---|---|---|---|---|---|
Land and improvements |
$ | 11,922 | $ | 11,812 | |||
Buildings |
113,484 | 112,861 | |||||
Plant and mill equipment |
354,327 | 352,235 | |||||
Furniture, fixtures and equipment |
25,845 | 32,028 | |||||
|
505,578 | 508,936 | |||||
Accumulated depreciation |
(225,156 | ) | (219,336 | ) | |||
|
280,422 | 289,600 | |||||
Spare parts, net of reserve |
7,508 | 7,910 | |||||
Construction in progress |
3,282 | 5,993 | |||||
|
$ | 291,212 | $ | 303,503 | |||
We capitalize interest costs associated with the construction and installation of property, plant and equipment. During the fiscal years ended October 2, 2009, September 26, 2008 and September 28, 2007, interest costs of $0.4 million, $0.5 million and $0.8 million, respectively, were capitalized.
Depreciation expense for the fiscal years ended October 2, 2009, September 26, 2008 and September 28, 2007, was $22.6 million, $22.4 million and $21.8 million, respectively.
As of October 2, 2009 and September 26, 2008, we maintain property, plant and equipment in Italy with a net book value totaling $39.0 million and $40.8 million, respectively.
50
AMERICAN ITALIAN PASTA COMPANY
Notes to Consolidated Financial Statements (Continued)
6. BRANDS
Our intangible assets consist solely of acquired brand names. Management has determined that each of our intangible brand assets have an indefinite life unless events and circumstances indicate otherwise.
We perform an annual impairment review of our brands. We performed our fiscal year 2009 annual review of our brands based on the fiscal year 2010 business plan and forecasts, which indicated no brand impairment in fiscal year 2009. We performed our fiscal year 2008 annual review of our brands based on the fiscal year 2009 business plan and forecasts, which resulted in a non-cash brand impairment of $3.7 million. As a part of the 2008 annual impairment review we determined that one of the impaired brands has a definite life and, accordingly, we began amortizing the $1.2 million fair value of this brand over its estimated economic life. During fiscal year 2009, we recognized $0.8 million of brand amortization expense related to this brand. Amortization expense is included as a component of selling and marketing expense in the accompanying consolidated statements of operations.
7. ACCRUED EXPENSES
Accrued expenses consist of the following (in thousands):
| |
October 2, 2009 | September 26, 2008 | |||||
|---|---|---|---|---|---|---|---|
Accrued promotional costs |
$ | 8,360 | $ | 9,411 | |||
Accrued interest expense |
72 | 2,801 | |||||
Accrued bonus expense |
5,277 | 4,417 | |||||
Other accrued expenses |
10,438 | 11,728 | |||||
Lawsuit settlement |
— | 1,500 | |||||
Investigation settlement |
— | 7,500 | |||||
|
$ | 24,147 | $ | 37,357 | |||
8. SHORT TERM DEBT
Our U.S. credit facility includes restrictions that limit borrowings by our Italian subsidiary, Pasta Lensi S.r.l. ("Lensi"), to $5.0 million, all of which is available as of the end of the current period. Lensi has credit facilities that allow 30-60 day advances that are based on accounts receivable balances pledged and are secured by Lensi's accounts receivables and other assets, as well as a general line of credit of approximately $0.6 million. As of October 2, 2009, there were no borrowings under these credit facilities and, as of September 26, 2008, we had borrowings under these facilities totaling $2.0 million.
9. LONG TERM DEBT
Long term debt consists of the following (in thousands):
| |
October 2, 2009 | September 26, 2008 | |||||
|---|---|---|---|---|---|---|---|
Borrowings under U.S. credit facility |
$ | 110,000 | $ | 239,900 | |||
Less current portion |
5,900 | 22,900 | |||||
|
$ | 104,100 | $ | 217,000 | |||
51
AMERICAN ITALIAN PASTA COMPANY
Notes to Consolidated Financial Statements (Continued)
9. LONG TERM DEBT (Continued)
As of October 2, 2009, the U.S. credit facility, as amended, is comprised of a $110.0 million term loan and a $30.0 million revolving credit facility. The U.S. credit facility is secured by substantially all of our domestic assets and provides for interest at either LIBOR rate plus 550 basis points or at an alternate base rate calculated as prime rate plus 450 basis points. The term loan matures in March 2011 and does not have scheduled principal payments. Principal pre-payments are required if certain contingent events occur, including the sale of certain assets, issuance of equity, and the generation of excess cash flow as defined in the credit agreement. The excess cash flow payment required under the agreement is reduced by voluntary pre-payments. As of October 2, 2009, the excess cash flow liability under this agreement was approximately $5.9 million. The term loan interest rate in effect at October 2, 2009 and September 26, 2008 was 5.8% and 8.3%, respectively. As of October 2, 2009, we had no borrowings outstanding under the revolving credit facility. The outstanding letters of credit under our revolving credit facility totaled approximately $1.0 million as of October 2, 2009. Accordingly, under the U.S. credit facility we had additional borrowing capacity of $29.0 million as of October 2, 2009.
Subsequent to year-end, we paid the $5.9 million current portion of the long term debt, which represents our excess cash flow liability, using available cash. In addition, we made voluntary prepayments of $14.1 million, reducing the outstanding term loan balance to $90.0 million.
Our U.S. credit facility contains restrictive covenants which include, among other things, financial covenants requiring minimum and cumulative earnings levels and limitations on the payment of dividends, stock purchases, capital spending, and our ability to enter into certain contractual arrangements. We were in compliance with these financial covenants as of October 2, 2009.
Annual maturities of long term debt obligations for each of the next five fiscal years reflecting the terms of the credit facility discussed above, are as follows (in thousands):
2010 |
$ | — | ||
2011 |
104,100 | |||
2012 |
— | |||
2013 |
— | |||
2014 |
— | |||
|
$ | 104,100 | ||
10. CONTINUED DUMPING AND SUBSIDY OFFSET ACT OF 2000
On October 28, 2000, the U.S. government enacted the "Continued Dumping and Subsidy Offset Act of 2000" (the "Act"), commonly known as the Byrd Amendment, which provides that assessed anti-dumping and subsidy duties liquidated by the Department of Commerce on Italian and Turkish imported pasta after October 1, 2000 will be distributed to affected domestic producers. The legislation creating the dumping and subsidy offset payment provides for annual payments from the U.S. government. We record the Byrd Amendment payment as revenue in the quarter in which the amount, and the right to receive payment, can reasonably be determined. We recognized revenue under the Act of $0.8 million, $4.7 million and $3.0 million in fiscal years 2009, 2008, and 2007, respectively. Effective October 1, 2007, the Act was repealed, resulting in the discontinuation of future distributions to affected domestic producers for duties assessed after such date.
52
AMERICAN ITALIAN PASTA COMPANY
Notes to Consolidated Financial Statements (Continued)
11. INCOME TAXES
Significant components of the income tax provision are as follows (in thousands):
| |
Year Ended | ||||||||||
|---|---|---|---|---|---|---|---|---|---|---|---|
| |
October 2, 2009 | September 26, 2008 | September 28, 2007 | ||||||||
| |
(53 weeks) |
(52 weeks) |
(52 weeks) |
||||||||
Current income tax expense (benefit): |
|||||||||||
U.S. |
$ | 1,936 | $ | (162 | ) | $ | 452 | ||||
Foreign |
363 | (142 | ) | 52 | |||||||
|
2,299 | (304 | ) | 504 | |||||||
Deferred income tax expense (benefit): |
|||||||||||
U.S. |
6,330 | (2,435 | ) | (722 | ) | ||||||
Foreign |
4 | 418 | 55 | ||||||||
|
6,334 | (2,017 | ) | (667 | ) | ||||||
Net income tax expense (benefit) |
$ |
8,633 |
$ |
(2,321 |
) |
$ |
(163 |
) |
|||
Deferred income taxes reflect the net tax effects of temporary differences between the carrying amounts of assets and liabilities for financial reporting purposes and the amounts used for income tax purposes. Significant components of our deferred tax assets and liabilities are as follows (in thousands):
| |
October 2, 2009 | September 26, 2008 | ||||||
|---|---|---|---|---|---|---|---|---|
Deferred tax assets: |
||||||||
Net operating loss carryforwards |
$ | 17,050 | $ | 39,452 | ||||
Tax credit carryforwards |
14,447 | 14,878 | ||||||
Stock-based compensation |
3,143 | 2,958 | ||||||
Intangible assets |
2,538 | 5,767 | ||||||
Other |
956 | 4,716 | ||||||
|
38,134 | 67,771 | ||||||
Valuation allowance |
(6,362 | ) | (37,079 | ) | ||||
Total deferred tax assets |
31,772 | 30,692 | ||||||
Deferred tax liabilities: |
||||||||
Property, plant and equipment |
62,104 | 62,115 | ||||||
Other |
438 | 505 | ||||||
Total deferred tax liabilities |
62,542 | 62,620 | ||||||
Net deferred tax liabilities |
$ |
30,770 |
$ |
31,928 |
||||
53
AMERICAN ITALIAN PASTA COMPANY
Notes to Consolidated Financial Statements (Continued)
11. INCOME TAXES (Continued)
The valuation allowance has been allocated to current and non-current deferred taxes as follows (in thousands):
Current deferred tax asset |
$ | 2,982 | ||
Non-current deferred tax asset |
3,380 | |||
Total deferred tax liabilities |
$ | 6,362 | ||
The following is the component of income (loss) before income tax benefit for domestic and foreign operations (in thousands):
| |
Year Ended | |||||||||
|---|---|---|---|---|---|---|---|---|---|---|
| |
October 2, 2009 | September 26, 2008 | September 28, 2007 | |||||||
| |
(53 weeks) |
(52 weeks) |
(52 weeks) |
|||||||
Domestic |
$ | 95,864 | $ | 18,315 | $ | 5,666 | ||||
Foreign |
1,057 | (1,525 | ) | (481 | ) | |||||
|
$ | 96,921 | $ | 16,790 | $ | 5,185 | ||||
The reconciliation of income tax computed at the U.S. statutory tax rate to income tax expense is as follows (in thousands):
| |
Year Ended | |||||||||
|---|---|---|---|---|---|---|---|---|---|---|
| |
October 2, 2009 | September 26, 2008 | September 28, 2007 | |||||||
Income before income taxes |
$ | 96,921 | $ | 16,790 | $ | 5,185 | ||||
U.S. statutory tax rate |
X 35 | % | X 35 | % | X 35 | % | ||||
Federal income tax expense at U.S. statutory rate |
33,922 | 5,877 | 1,815 | |||||||
State income tax expense / (benefit), Net of federal tax effect |
1,870 | 592 | (5 | ) | ||||||
Foreign tax rate differential |
(194 | ) | 297 | 365 | ||||||
Change in valuation allowance |
(17,018 | ) | (12,680 | ) | (2,574 | ) | ||||
Non-deductible fine |
— | 2,625 | — | |||||||
Other, net |
331 | 968 | 236 | |||||||
Total income tax expense (benefit) |
18,911 | (2,321 | ) | (163 | ) | |||||
Discrete event primarily related to reversal of alternative minimum tax valuation reserve |
(10,278 | ) | — | — | ||||||
Net income tax expense (benefit) |
$ | 8,633 | $ | (2,321 | ) | $ | (163 | ) | ||
We had federal net operating loss carryforwards of $33.6 million at October 2, 2009 and $94.7 million at September 26, 2008 that have various expiration dates from 2026 to 2027. At September 26, 2008, a partial valuation allowance existed against the federal net operating loss carryforward as we did not believe it is more likely than not that the carryforward will be utilized prior to expiration. In making this determination, we did not consider future taxable income due to the existence of a three-year cumulative loss as of September 26, 2008. We only considered taxable income to the extent of reversals of net temporary differences in existence as of September 26, 2008.
54
AMERICAN ITALIAN PASTA COMPANY
Notes to Consolidated Financial Statements (Continued)
11. INCOME TAXES (Continued)
As of the end of our first quarter of fiscal year 2009, we had cumulative pre-tax income for the preceding three-year period and based upon all available evidence, both positive and negative, management determined that it was more likely than not that we would realize the benefit of federal and certain state net operating loss carryforwards that previously had a valuation allowance. Consequently, the benefit of reducing that portion of the valuation allowance attributable to these loss carryforwards is reflected in the determination of our estimated annual effective rate.
We had AMT credit carryforwards of $11.8 million and $10.5 million at October 2, 2009 and September 26, 2008, respectively, with no expiration date. We had general business credit carryforwards of $0.6 million and $0.3 million as of October 2, 2009 and September 26, 2008 respectively, with various expiration dates from 2019 to 2024. A partial valuation allowance had been established against these credits as of September 26, 2008 as we did not believe it was more likely than not that these credits would be fully utilized. In making this determination, we did not consider future taxable income due to the existence of a three-year cumulative loss as of September 26, 2008. We only considered taxable income to the extent of reversals of net temporary differences in existence as of September 26, 2008. As of the end of our first quarter of fiscal 2009, we had cumulative pre-tax income for the preceding three-year period. During our second quarter, management determined, based upon all available evidence including future projected income, that it is more likely than not that we will utilize the benefits primarily related to AMT credit and general business credit carryforwards. Based on guidance related to changes in valuation allowances during interim periods, management concluded that it was proper to release the $10.3 million valuation allowance against these carryforwards during the second quarter as a discrete event.
We had various state net operating loss carryforwards of $87.7 million at October 2, 2009 and $151.8 million at September 26, 2008, that have various expiration dates from 2010 to 2029. The ultimate realization of these losses depends on our ability to generate taxable income in future years as well as on our continued business activity in each state and our corresponding apportioned taxable income in each state. A full valuation allowance existed against these net operating loss carryforwards as of September 26, 2008, as we did not believe it was more likely than not that they would be utilized prior to expiration. In making this determination, we did not consider future taxable income due to the existence of a three-year cumulative loss as of September 26, 2008. During fiscal year 2009, we determined based on all available evidence, both positive and negative, that we will realize the benefits related to these carryforwards. We will continue to evaluate the valuation allowance related to the remaining carryforwards at the end of each period taking into account current and forecasted operating results.
At October 2, 2009 and September 26, 2008, we had state tax credit carryforwards of $2.0 million and $4.1 million that have varying expiration dates from 2010 to 2018. A full valuation allowance has been established against these credits for both years as we do not believe it is more likely than not that these credits will be utilized prior to expiration.
During the fiscal year ended October 2, 2009 and September 26, 2008, we reduced the deferred tax assets and current taxes payable relating to stock options that expired unexercised by approximately $0.6 million and $1.1 million, respectively. This was recorded as a debit to additional paid in capital and is not a component of our total income tax expense or our effective tax rate. There were no such adjustments for stock options in fiscal year 2007.
55
AMERICAN ITALIAN PASTA COMPANY
Notes to Consolidated Financial Statements (Continued)
11. INCOME TAXES (Continued)
We have elected the tax law ordering approach to determine when excess tax deductions resulting from equity awards are realized. Therefore, excess tax benefits resulting from current year equity award exercises have been recognized as a component of additional paid-in capital. In accordance with the tax law ordering approach, a valuation allowance of $1.3 million existed as of September 26, 2008 against excess tax deductions resulting from fiscal 2005 equity awards. In addition, during fiscal year 2009, sufficient taxable income was realized to fully utilize the excess deductions from the fiscal 2005 equity awards and we released the related valuation allowance. The resulting benefit was recognized as a component of additional paid-in capital.
At October 2, 2009 and September 29, 2008, we had no undistributed earnings of foreign subsidiaries. Therefore, no U.S. income tax has been provided for.
As discussed in Note 1, "Summary of Significant Accounting Policies" we adopted new accounting principles on accounting for uncertain tax positions effective September 29, 2007. Under these principles, tax positions are evaluated in a two-step process. We first determine whether it is more likely than not that a tax position will be sustained upon examination. If a tax position meets the more-likely-than-not recognition threshold it is then measured to determine the amount of benefit to recognize in the financial statements. The tax position is measured as the largest amount of benefit that is greater than 50 percent likely of being realized upon ultimate settlement. Upon adoption of these new principles, we had a cumulative effect of a change in accounting principle resulted in an increase to retained earnings of $0.7 million. Beginning with the adoption of these new principles, we classify gross interest and penalties and unrecognized tax benefits that are not expected to result in payment or receipt of cash within one year as non-current liabilities in the consolidated balance sheets.
As of October 2, 2009, and September 26, 2008, the gross amount of unrecognized tax benefits, including penalty and interest, was approximately $2.7 million and $2.5 million, respectively. If recognized, approximately $2.2 million and $2.0 million would affect our effective tax rate.
A reconciliation of the beginning and ending amount of unrecognized tax benefits, excluding interest, penalties, and the associated state deferred tax assets, is as follows (in thousands):
Balance as of September 26, 2008 |
$ | 1,476 | ||
Change attributable to tax positions taken during a prior period |
16 | |||
Change attributable to tax positions taken during the current period |
— | |||
Decreases attributable to settlements with tax authorities |
(15 | ) | ||
Decreases attributable to lapse of statute of limitations |
— | |||
Balance as of October 2, 2009 |
$ | 1,477 | ||
We have classified interest and penalties as a component of income tax expense. As of October 2, 2009, we had accrued interest and penalties of $1.2 million ($1.0 million after tax). As of September 26, 2008, we had accrued interest and penalties of $0.8 million ($0.5 million after tax).
We file income tax returns in the U.S. federal jurisdiction, the United Kingdom, the Netherlands, Italy and various state jurisdictions. We have also made an evaluation of the potential impact of assessments by state jurisdictions in which we have not filed tax returns. During fiscal year 2008, the Internal Revenue Service completed the examination of our tax returns for the fiscal years 2002 through 2004, with no material change in taxes due for those periods. As of October 2, 2009, the
56
AMERICAN ITALIAN PASTA COMPANY
Notes to Consolidated Financial Statements (Continued)
11. INCOME TAXES (Continued)
federal tax returns for fiscal years 2004 through 2009 are open and will remain open until the statute closes for the years in which the net operating losses are utilized in the future. In addition, state and foreign tax returns for the fiscal years 2001 through 2009 are open to audit under the statute of limitations. As of October 2, 2009, it is not anticipated that any of the net unrecognized tax benefits will be recognized in the next twelve months.
12. COMMITMENTS AND CONTINGENCIES
Purchase and Supply Agreements:
We had durum wheat, semolina, and other supply purchase commitments totaling approximately $47.1 million and $102.0 million at October 2, 2009 and September 26, 2008, respectively.
We purchase our raw material requirements (including semolina and semolina/flour blends) for our Tolleson, Arizona facility from Bay State Milling Company ("Bay State") under a ten-year supply agreement that expires September 30, 2012. The agreement will automatically renew for a five-year term unless notice is given by either party on or before September 30, 2010, and may be renewed for additional periods under similar terms. We are obligated to purchase 80% of our annual Tolleson requirements for semolina from Bay State with an annual minimum of 50 million pounds. Pricing for these purchases are based on the cost of raw materials plus a conversion fee. We have satisfied our minimum requirements for fiscal years 2009, 2008 and 2007. In the event Bay State's ownership changes or under performs, we have the contractual right to purchase the mill at an established book value less accumulated depreciation.
Operating Leases:
We lease office space, computer equipment and other equipment, under lease agreements accounted for as operating leases. The office lease agreement contains renewal options and rental escalation clauses, as well as provisions for the payment of utilities, maintenance and taxes. As of October 2, 2009, our future minimum rental payments due under the non-cancelable operating lease agreements consist of the following (in thousands):
2010 |
$ | 1,279 | ||
2011 |
625 | |||
2012 |
173 | |||
2013 |
74 | |||
2014 |
51 | |||
Thereafter |
4 | |||
|
$ | 2,206 | ||
Rent expense was approximately $1.4 million for fiscal year 2009, $1.3 million for fiscal 2008, and $1.2 million for fiscal year 2007.
57
AMERICAN ITALIAN PASTA COMPANY
Notes to Consolidated Financial Statements (Continued)
12. COMMITMENTS AND CONTINGENCIES (Continued)
Legal Matters
In September of 2008, the Company agreed to a consent injunction and settled all outstanding matters pertaining to the SEC investigation of the Company's historical accounting practices. Certain former officers of the Company also resolved claims asserted against them by the SEC in 2008 and 2009, with the exception of one former officer. As a result, the Company may continue to have indemnity obligations to this former officer under Delaware law and our articles of incorporation. We believe the effect of any indemnification obligation on our cash flows and results of operations will be immaterial.
From time to time and in the ordinary course of business, we are named as a defendant in legal proceedings related to various issues, including worker's compensation claims, tort claims and contractual disputes. While the resolution of such matters may have an impact on our financial results for the period in which they are resolved, we believe that the ultimate disposition of these matters will not, individually or in the aggregate, have a material adverse effect upon its business or consolidated financial statements.
13. NET INCOME PER COMMON SHARE
Basic net income per share is computed by dividing net income available to common shareholders by the weighted average number of common shares outstanding for the period. Diluted net income per share is computed by dividing net income available to common shareholders, increased by the weighted average number of outstanding common shares and incremental shares that may be issued in future periods related to outstanding stock options and stock appreciation rights, if dilutive. When calculating incremental shares related to outstanding share options and stock appreciation rights, we apply the treasury stock method. The treasury stock method assumes that proceeds, consisting of the amount the employee must pay on exercise, compensation cost attributed to future services and not yet recognized, and excess tax benefits that would be credited to additional paid-in capital on exercise of the share options, are used to repurchase outstanding shares at the average market price for the period. The treasury stock method is applied only to share grants for which the effect is dilutive.
The computations of basic and diluted net income per share are as follows (in thousands, except share and per share data):
| |
October 2, 2009 (53 weeks) |
September 26, 2008 (52 weeks) |
September 28, 2007 (52 weeks) |
||||||||||||||||||||||||||
|---|---|---|---|---|---|---|---|---|---|---|---|---|---|---|---|---|---|---|---|---|---|---|---|---|---|---|---|---|---|
| |
Net Income |
Weighted Average Shares Outstanding |
Per Share Amount |
Net Income |
Weighted Average Shares Outstanding |
Per Share Amount |
Net Income |
Weighted Average Shares Outstanding |
Per Share Amount |
||||||||||||||||||||
Basic net income per share |
$ | 88,288 | 20,692 | $ | 4.27 | $ | 19,111 | 19,118 | $ | 1.00 | $ | 5,348 | 18,673 | $ | 0.29 | ||||||||||||||
Effect of dilutive securities: |
|||||||||||||||||||||||||||||
Stock options and stock appreciation rights |
863 | 266 | 278 | ||||||||||||||||||||||||||
Diluted income per share |
$ | 88,288 | 21,555 | $ | 4.10 | $ | 19,111 | 19,384 | $ | 0.99 | $ | 5,348 | 18,951 | $ | 0.28 | ||||||||||||||
58
AMERICAN ITALIAN PASTA COMPANY
Notes to Consolidated Financial Statements (Continued)
13. NET INCOME PER COMMON SHARE (Continued)
For the years ended 2009, 2008, and 2007, weighted average outstanding shares totaling approximately 0.7 million, 2.0 million, and 1.5 million shares of common stock, respectively, were anti-dilutive and, therefore, not included in the computation of diluted income per share.
14. EQUITY INCENTIVE PLANS
Our current equity plan, as approved in December 2000 and amended in February 2004, authorizes us to grant nonvested shares, stock options, and stock appreciation rights to the directors, officers, key employees and contract employees for the purchase or award of up to 1.8 million shares of our common stock, plus shares forfeited related to awards made under our prior equity incentive plan. Also outstanding are stock options to purchase approximately 0.1 million shares of our common stock that were issued under terminated equity incentive plans established during October 1992, October 1993, and October 1997. Generally, we issue new shares upon the award of nonvested shares and the exercise of stock options or stock appreciation rights. Accordingly, we do not anticipate we will repurchase shares on the open market during fiscal year 2010 for the purpose of satisfying nonvested share grants or stock option or stock appreciation right exercises.
We utilize the Black-Scholes option valuation model to calculate the fair value of each option and stock appreciation right award. Expected volatility was based on the combination of the historical volatility of our common stock and the implied volatility of our options. The expected term of the options and stock appreciation rights represents the period of time until exercise or termination and is based on historical experience of similar awards, including vesting schedules and expectations of future behavior. The risk free interest rate is based on the U.S. Treasury rate at the time of the grant for instruments of a comparable life. Our valuation model input assumes a zero dividend rate.
We did not issue stock options during the fiscal years 2009, 2008 and 2007. The assumptions used to record share-based compensation expense for stock appreciation rights for fiscal years 2009, 2008 and 2007 are as follows:
| |
2009 | 2008 | 2007 | |||
|---|---|---|---|---|---|---|
Expected volatility |
51.1% - 54.0% | 40.1% - 46.7% | 38.6% - 42.3% | |||
Weighted-average volatility |
51.1% | 41.6% | 39.2% | |||
Expected dividends |
0.0% | 0.0% | 0.0% | |||
Expected term (in years) |
4.3 - 4.4 | 3.8 - 5.9 | 3.8 - 5.2 | |||
Risk-free rate |
1.26% | 3.44% | 4.65% |
59
AMERICAN ITALIAN PASTA COMPANY
Notes to Consolidated Financial Statements (Continued)
14. EQUITY INCENTIVE PLANS (Continued)
Stock Options
A summary of our stock option activity, and related information, is as follows:
| |
Number of Shares |
Weighted Average Exercise Price |
Aggregate Intrinsic Value |
Weighted Average Remaining Contractual Term (in years) |
||||||||||
|---|---|---|---|---|---|---|---|---|---|---|---|---|---|---|
Outstanding at September 26, 2008 |
692,441 | $ | 30.66 | |||||||||||
Exercised |
(26,043 | ) | $ | 24.06 | ||||||||||
Forfeited |
(750 | ) | $ | 24.82 | ||||||||||
Expired |
(193,050 | ) | $ | 26.87 | ||||||||||
Outstanding at October 2, 2009 |
472,598 | $ | 32.89 | |||||||||||
Vested or expected to vest at October 2, 2009 |
471,442 |
$ |
32.91 |
$ |
209,000 |
3.5 |
||||||||
Exercisable at October 2, 2009 |
463,568 |
$ |
33.01 |
$ |
205,000 |
3.5 |
||||||||
The aggregate intrinsic values reflected above includes only those option awards for which the exercise price is less than the current market price as of October 2, 2009.
The stock options vest over three to five years in varying amounts, depending on the terms of the individual option agreements, and expire 10 years from the date of grant.
During the fiscal year ended 2009, we received cash of approximately $0.4 million for payment of the grant price of exercised share options with an intrinsic value of approximately $0.2 million and we anticipate we will realize a tax benefit of $0.1 million related to these exercised share options. The cash received for payment of the grant price is included as a component of cash flow from financing activities on the statement of cash flows. The tax benefit related to the option exercise price in excess of the option fair value at grant date is separately disclosed as a component of cash flow from financing activities within the consolidated statement of cash flows; the remainder of the tax benefit is included as a component of cash flow from operating activities. No stock options were exercised during fiscal years 2008 or 2007.
We recognized compensation expense, which is a non-cash charge, related to stock options of $0.2 million, $0.3 million, and $0.3 million in the fiscal years 2009, 2008 and 2007, respectively. The tax effect related to stock option compensation expense during 2009 was less than $0.1 million. There was no income tax effect related to the stock option compensation expense during fiscal years 2008 and 2007 because deferred income tax benefits otherwise provided were offset by valuation allowances as discussed in Note 11.
As of October 2, 2009, we had less than $0.1 million of future unrecognized compensation costs that are expected to be recognized over a weighted average period of less than one year.
60
AMERICAN ITALIAN PASTA COMPANY
Notes to Consolidated Financial Statements (Continued)
14. EQUITY INCENTIVE PLANS (Continued)
Stock Appreciation Rights
A summary of our stock appreciation rights activity, and related information, is as follows:
| |
Number of Shares |
Weighted Average Exercise Price |
Aggregate Intrinsic Value |
Weighted Average Remaining Contractual Term (in years) |
||||||||||
|---|---|---|---|---|---|---|---|---|---|---|---|---|---|---|
Outstanding at September 26, 2008 |
2,017,803 | $ | 7.21 | |||||||||||
Issued |
258,787 | $ | 24.79 | |||||||||||
Exercised |
(343,689 | ) | $ | 7.00 | ||||||||||
Forfeited |
(84,790 | ) | $ | 8.09 | ||||||||||
Outstanding at October 2, 2009 |
1,848,111 | $ | 9.67 | |||||||||||
Vested or expected to vest at October 2, 2009 |
1,658,993 |
$ |
9.61 |
$ |
29,797,000 |
4.7 |
||||||||
Exercisable at October 2, 2009 |
370,629 |
$ |
7.56 |
$ |
7,415,000 |
4.4 |
||||||||
The aggregate intrinsic values reflected above include only those stock appreciation rights for which the exercise price is less than the current market price. As of October 2, 2009, the exercise price was less than the current market price for all outstanding stock appreciation rights.
The stock appreciation rights vest over three or four years in varying amounts, depending on the terms of the individual agreements, and expire seven years from the date of grant. Only the number of shares of common stock issued in settlement of a stock appreciation right are counted against the available shares under our equity incentive plan.
Stock appreciation rights with an intrinsic value of $6.8 million were exercised during fiscal year 2009, resulting in the issuance of approximately 250,000 shares of common stock. We anticipate we will realize a tax benefit related to these exercised stock appreciation rights of approximately $2.5 million. The tax benefit related to the stock appreciation right exercise price in excess of the stock appreciation right fair value at grant date is separately disclosed as a component of cash flow from financing activities within the consolidated statements of cash flows; the remainder of the tax benefit is included as a component of cash flow from operating activities. No stock appreciation rights were exercised during the fiscal years 2008 or 2007.
We recognized compensation expense related to stock appreciation rights of $1.9 million, $1.3 million, and $0.6 million, in fiscal years 2009, 2008 or 2007, respectively. The tax effect related to stock appreciation rights compensation expense during 2009 was $0.7 million. There was no income tax effect related to the stock appreciation rights compensation expense during fiscal years 2008 or 2007 as deferred income tax benefits otherwise provided were offset by valuation allowances as discussed in Note 11.
The weighted average fair value for stock appreciation rights granted was $10.53, $3.01 and $3.56 for the fiscal years ended October 2, 2009, September 26, 2008 and September 28, 2007, respectively.
As of October 2, 2009, we had $4.0 million of future unrecognized compensation costs that are expected to be recognized over a weighted average period of approximately 1.5 years related to stock appreciation rights.
61
AMERICAN ITALIAN PASTA COMPANY
Notes to Consolidated Financial Statements (Continued)
14. EQUITY INCENTIVE PLANS (Continued)
Nonvested Share Liability Awards
Our nonvested share activity for awards subject to liability accounting is as follows:
| |
Number of Shares |
Weighted Average Grant Date Fair Value |
Aggregate Intrinsic Value |
|||||||
|---|---|---|---|---|---|---|---|---|---|---|
Nonvested at September 26, 2008 |
163,290 | $ | 7.34 | |||||||
Vested |
(39,594 | ) | $ | 10.21 | ||||||
Forfeited |
(1,639 | ) | $ | 10.88 | ||||||
Nonvested at October 2, 2009 |
122,057 | $ | 6.36 | $ | 3,365,000 | |||||
For awards granted prior to fiscal year 2008, we permitted employees to net-settle shares for taxes at amounts greater than minimum statutory withholding obligation, which resulted in the awards being classified as long term liabilities. The compensation expense or benefit recognized each period represents a portion, depending on the percentage of the requisite service that has been rendered at the reporting date, of the change in market value of the shares that have not vested as of the end of each reporting period plus the change in market value of shares that vested during the reporting period. Nonvested share liability awards may result in recognition of either compensation expense or compensation benefit (reduction in compensation expense) for a reporting period.
We did not issue any nonvested share liability awards during fiscal years 2009 or 2008. During the fiscal year ended September 28, 2007, we awarded 76,994 shares of nonvested share liability awards to employees with a weighted-average grant date value of $8.80. The shares vest over either four or five years.
Expense recognized related to nonvested shares subject to liability accounting amounted to $2.3 million, $1.1 million and $0.7 million in fiscal years 2009, 2008 and 2007, respectively. The weighted average remaining life of liability awards is less than one year.
The total fair value of nonvested shares under liability accounting that vested was $1.1 million, $0.3 million and $0.4 million during the fiscal years 2009, 2008 and 2007, respectively. The estimated tax benefit recognized on the vesting of these awards was $0.4 million during fiscal year 2009.
Nonvested Share Equity Awards
Our nonvested share activity for awards subject to equity accounting is as follows:
| |
Number of Shares |
Weighted Average Grant Date Fair Value |
Aggregate Intrinsic Value |
|||||||
|---|---|---|---|---|---|---|---|---|---|---|
Nonvested at September 26, 2008 |
147,379 | $ | 7.78 | |||||||
Granted |
74,004 | $ | 24.77 | |||||||
Vested |
(36,845 | ) | $ | 7.78 | ||||||
Forfeited |
(2,434 | ) | $ | 7.15 | ||||||
Nonvested at October 2, 2009 |
182,104 | $ | 14.69 | $ | 5,021,000 | |||||
62
AMERICAN ITALIAN PASTA COMPANY
Notes to Consolidated Financial Statements (Continued)
14. EQUITY INCENTIVE PLANS (Continued)
Nonvested shares issued during or after fiscal year 2008 are classified as equity and compensation expense is recognized over the vesting period based on the fair value of the nonvested shares at grant date. During the fiscal years ended October 2, 2009 and September 26, 2008, we granted nonvested share equity awards 74,004 shares and 154,897 shares, respectively at a weighted average value of $24.77 and $7.75, respectively. Nonvested share equity awards vest over either three or four years.
We recognized compensation expense, a non-cash charge, related to nonvested equity award shares of $0.8 million and $0.3 million for the fiscal years ended 2009 and 2008, respectively. There were no nonvested equity awards outstanding during fiscal year 2007. At October 2, 2009, unrecognized compensation expense related to these awards totaled approximately $1.5 million and will be recognized over a weighted average period of 2.0 years.
The total fair value of nonvested equity awards that vested during the fiscal year 2009 was $0.6 million. We anticipate we will recognize a tax benefit related to shares vesting during the year ended October 2, 2009 of approximately $0.2 million. No shares vested during the fiscal year ended 2008. The tax benefit related to equity share awards with a fair value at the vest date in excess of the fair value at the grant date is included as a component of cash flows from financing activities within the consolidated statements of cash flow; the remainder of the tax benefit is included as a component of cash flow from operating activities.
Holders of both equity and liability nonvested share awards are permitted to net settle shares to satisfy the minimum statutory tax withholding obligation. We received 16,942 shares at a weighted average price of $26.12, 6,606 shares at a weighted average price of $7.17 and 19,455 shares at a weighted average price of $8.82 in connection with the withholding of taxes upon vesting of nonvested shares in fiscal years 2009, 2008 and 2007, respectively, which is reflected as a financing activity within the consolidated statements of cash flows.
Other Stock Awards
We have recognized expense related to stock awards issued to directors that vest immediately upon grant of $0.3 million, $0.2 million, and $0.2 million in fiscal years 2009, 2008 and 2007, respectively.
Warrants
Pursuant to a 2005 agreement with Alvarez & Marsal, LLC ("A&M"), as a component of compensation for their evaluation of our business and recommendations for improving our operating and financial performance, we issued 472,671 warrants to acquire our common stock at a price of $5.67 per share. During March 2009, A&M exercised the warrants. Pursuant to the terms of the warrant, A&M elected a cashless exercise. As a result, we issued to A&M 387,482 shares of our common shares and A&M surrendered the right to purchase the remaining 85,189 common shares. The tax benefit related to fair value of these shares at the exercise date in excess of the fair value at the grant date is included as a component of cash flows from financing activities within the consolidated statements of cash flows; the remainder of the tax benefit is included as a component of cash flow from operating activities.
63
AMERICAN ITALIAN PASTA COMPANY
Notes to Consolidated Financial Statements (Continued)
15. EMPLOYEE BENEFIT PLANS
We have a defined contribution plan organized under Section 401(k) of the Internal Revenue Code covering substantially all employees. The plan allows all qualifying employees to contribute up to the tax deferred contribution limit allowable by the Internal Revenue Service. We currently match 50% of the employee contributions, which is not to exceed 6% - 12% of the employee's salary, depending on the length of the employee's service. We may contribute additional amounts to the plan as determined annually by the Board of Directors. Employer contributions related to the plan totaled $0.9 million, $0.9 million and $0.8 million for the years ended October 2, 2009, September 26, 2008, and September 28, 2007, respectively.
16. STOCK REPURCHASE PLAN
In October 2002, our Board of Directors authorized up to $20.0 million to implement a common stock repurchase plan. Stock purchases are restricted under our current credit agreement and we did not purchase any shares in fiscal years 2009, 2008, and 2007 under this program.
17. SIGNIFICANT CUSTOMERS
Sales to Wal-Mart, Inc. represented 25%, 22%, and 23% of revenues during the years ended October 2, 2009, September 26, 2008 and September 28, 2007, respectively.
Accounts receivable from Wal-Mart, as a percent of total trade and other receivables, amounted to 15% and 13% as of October 2, 2009 and September 26, 2008, respectively.
18. SUBSEQUENT EVENTS
We have evaluated subsequent events through November 23, 2009.
64
AMERICAN ITALIAN PASTA COMPANY
Notes to Consolidated Financial Statements (Continued)
19. QUARTERLY FINANCIAL DATA—UNAUDITED
The following quarterly financial data is unaudited, but in the opinion of management, all adjustments necessary for a fair presentation of the selected data for these interim periods presented have been included.
Quarterly financial data is as follows (in thousands, except per share data):
| |
First Quarter |
Second Quarter |
Third Quarter |
Fourth Quarter |
|||||||||
|---|---|---|---|---|---|---|---|---|---|---|---|---|---|
Fiscal Year ended October 2, 2009 |
|||||||||||||
Revenues |
$ | 171,206 | $ | 162,325 | $ | 145,527 | $ | 149,104 | |||||
Gross profit |
$ | 48,844 | $ | 44,161 | $ | 42,642 | $ | 41,002 | |||||
Net income |
$ | 26,028 | $ | 26,196 | $ | 20,232 | $ | 15,832 | |||||
Net income per common share (basic) |
$ | 1.28 | $ | 1.27 | $ | 0.97 | $ | 0.76 | |||||
Net income per common share (assuming dilution) |
$ | 1.23 | $ | 1.21 | $ | 0.93 | $ | 0.73 | |||||
Fiscal Year ended September 26, 2008 |
|||||||||||||
Revenues |
$ | 111,723 | $ | 139,568 | $ | 155,844 | $ | 162,061 | |||||
Gross profit |
$ | 24,335 | $ | 32,240 | $ | 24,997 | $ | 40,733 | |||||
Net income |
$ | 1,394 | $ | 9,444 | $ | 978 | $ | 7,295 | |||||
Net income per common share (basic) |
$ | 0.07 | $ | 0.50 | $ | 0.05 | $ | 0.37 | |||||
Net income per common share (assuming dilution) |
$ | 0.07 | $ | 0.50 | $ | 0.05 | $ | 0.36 | |||||
Due to changes in stock prices during the year and timing of issuance of shares, the cumulative total of quarterly net income per share amounts may not equal income per share for the year.
65
ITEM 9. CHANGES IN AND DISAGREEMENTS WITH ACCOUNTANTS ON ACCOUNTING AND FINANCIAL DISCLOSURE
None.
ITEM 9A. CONTROLS AND PROCEDURES
Evaluation of Disclosure Controls and Procedures
An evaluation was performed by management, under the supervision and with the participation of the Chief Executive Officer (CEO) and the Chief Financial Officer (CFO), of the effectiveness of the design and operation of our disclosure controls and procedures (as defined in Rule 13a-15(e) under the Securities Exchange Act of 1934, as amended (the 1934 Act)). Based on that evaluation, our CEO and CFO have concluded that, as of October 2, 2009, our disclosure controls and procedures were effective to ensure that information required to be disclosed in reports we file or submit under the 1934 Act has been recorded, processed, summarized and reported in accordance with the rules and forms of the Securities and Exchange Commission.
Changes in Internal Control Over Financial Reporting
In the quarter ended October 2, 2009, there have been no changes in our internal control over financial reporting that have materially affected, or are reasonably likely to materially affect, our internal control over financial reporting.
Management's Report on Internal Control Over Financial Reporting
Management is responsible for establishing and maintaining adequate internal control over financial reporting, as defined in Rules 13a-15(f) of the Securities Exchange Act of 1934. Our internal control system was designed to provide reasonable assurance to management and the board of directors regarding the preparation and fair presentation of published financial statements. Because of its inherent limitations, internal control over financial reporting may not prevent or detect misstatements. Also, projections of any evaluation of effectiveness to future periods are subject to the risk that controls may become inadequate because of changes in conditions, or the degree of compliance with the policies or procedures may deteriorate. Management conducted an evaluation of the effectiveness of our internal control over financial reporting as of October 2, 2009. In making this assessment, we used criteria set forth by the Committee of Sponsoring Organizations of the Treadway Commission (COSO) in Internal Control—Integrated Framework.
Based on this evaluation under the framework in Internal Control—Integrated Framework issued by COSO, management concluded that our internal control over financial reporting was effective as of October 2, 2009.
Our independent registered public accounting firm, Grant Thornton LLP, has audited the financial statements included in this Form 10-K and has issued an attestation report on our internal control over financial reporting. The attestation report on our internal control over financial reporting appears in Part II, Item 8.
None.
66
ITEM 10. DIRECTORS AND EXECUTIVE OFFICERS OF THE REGISTRANT
Information appearing under the captions "Information About the Board of Directors and Executive Officers" and "Section 16(a) Beneficial Ownership Reporting Compliance" in the Company's Proxy Statement for our 2010 Annual Meeting of Shareholders (the "2010 Proxy Statement") is hereby incorporated by reference.
ITEM 11. EXECUTIVE COMPENSATION
Information appearing under the captions "Information About the Board of Directors and Executive Officers—Director Compensation, and —Compensation Committee Interlocks and Insider Participation" and "Executive Compensation" (other than the "Compensation Committee Report," which is deemed furnished herein by reference) in the 2010 Proxy Statement is hereby incorporated by reference.
ITEM 12. SECURITY OWNERSHIP OF CERTAIN BENEFICIAL OWNERS AND MANAGEMENT AND RELATED STOCKHOLDER MATTERS
Information appearing under the captions "Stock Ownership of Major Stockholders", "Stock Ownership of Officers and Directors" and "Executive Compensation—Equity Compensation Plan Information" in the 2010 Proxy Statement is hereby incorporated by reference.
ITEM 13. CERTAIN RELATIONSHIPS AND RELATED TRANSACTIONS, AND DIRECTOR INDEPENDENCE
Information appearing under the captions "Related Party Transactions" and "Information About the Board of Directors and Executive Officers—Corporate Governance" in the 2010 Proxy Statement is hereby incorporated by reference.
ITEM 14. PRINCIPAL ACCOUNTING FEES AND SERVICES
Information appearing under the caption "Accounting Fees and Services" in the 2010 Proxy Statement is hereby incorporated by reference.
ITEM 15. EXHIBITS AND FINANCIAL STATEMENT SCHEDULES
- (a)
- The
following items are filed as a part of the report:
- 1.
- The
Company's consolidated financial statements prepared in accordance with Regulation S-X, including the consolidated statements of
operations, cash flows, stockholders' equity, and comprehensive income for the three fiscal years ended October 2, 2009, September 26, 2008, and September 28, 2007 and the
consolidated balance sheets as of October 2, 2009 and September 26, 2008, and related notes and the Report of Independent Registered Public Accounting Firm are included under
Item 8 of this Annual Report on Form 10-K.
- 2.
- Schedule II—Valuation
and Qualifying Accounts
- 3.
- The list of exhibits following the signature page of this Annual Report on Form 10-K is incorporated by reference herein in partial response to this Item 15.
67
Pursuant to the requirements of Section 13 or 15(d) of the Securities Exchange Act of 1934, the Registrant has duly caused this report to be signed on its behalf by the undersigned, thereunto duly authorized.
| AMERICAN ITALIAN PASTA COMPANY | ||||
By: |
/s/ JOHN P. KELLY John P. Kelly President and Chief Executive Officer |
|||
Date: November 23, 2009
Pursuant to the requirements of the Securities Exchange Act of 1934, this report has been signed below by the following persons on behalf of the Registrant and in the capacities and on the dates indicated.
POWER OF ATTORNEY AND SIGNATURES
Each of the undersigned hereby severally constitute and appoint Robert Schuller with power of substitution and resubstitution, as his true and lawful attorneys, with full power to them and each of them singly, to sign for us in our names in the capacities indicted below, all amendments to this Annual Report on Form 10-K and generally to do all things in our names and on our behalf in such capacities to enable American Italian Pasta Company to comply with the provisions of the Securities Exchange Act of 1934, and all requirements of the Securities and Exchange Commission with respect to this Annual Report on Form 10-K.
| /s/ WILLIAM R. PATTERSON William R. Patterson |
Chairman of the Board of Directors | November 23, 2009 | ||
/s/ JOHN P. KELLY John P. Kelly |
President, Chief Executive Officer and Director (principal executive officer) |
November 23, 2009 |
||
/s/ PAUL R. GEIST Paul R. Geist |
Executive Vice President and Chief Financial Officer (principal financial and accounting officer) |
November 23, 2009 |
||
/s/ DAVID W. ALLEN David W. Allen |
Director |
November 23, 2009 |
||
/s/ JONATHAN E. BAUM Jonathan E. Baum |
Director |
November 23, 2009 |
68
| /s/ CATHLEEN S. CURLESS Cathleen S. Curless |
Director | November 23, 2009 | ||
/s/ MARK C. DEMETREE Mark C. Demetree |
Director |
November 23, 2009 |
||
/s/ ROBERT J. DRUTEN Robert J. Druten |
Director |
November 23, 2009 |
||
/s/ JAMES A. HEETER James A. Heeter |
Director |
November 23, 2009 |
||
/s/ RONALD C. KESSELMAN Ronald C. Kesselman |
Director |
November 23, 2009 |
||
/s/ TIM M. POLLAK Tim M. Pollak |
Director |
November 23, 2009 |
69
SUPPLEMENTAL INFORMATION TO BE FURNISHED WITH REPORTS FILED
PURSUANT TO SECTION 15(D) OF THE ACT BY REGISTRANTS WHICH
HAVE NOT REGISTERED SECURITIES PURSUANT TO SECTION 12 OF THE ACT
Not applicable.
70
SCHEDULE II—VALUATION AND QUALIFYING ACCOUNTS
AMERICAN ITALIAN PASTA COMPANY
Description
|
Balance at Beginning of Period |
Charged to Costs and Expense |
Deductions(1) | Balance at End of Period |
||||||||||
|---|---|---|---|---|---|---|---|---|---|---|---|---|---|---|
Year Ended October 2, 2009: |
||||||||||||||
Deducted from asset accounts: |
||||||||||||||
Allowance for doubtful accounts |
$ | 2,334,000 | $ | 188,000 | $ | 1,075,000 | $ | 1,447,000 | ||||||
Allowance for excess or obsolete spare parts inventory |
962,000 | 97,000 | 186,000 | 873,000 | ||||||||||
Allowance for slow-moving, damaged and discontinued inventory |
691,000 | 2,100,000 | 2,209,000 | 582,000 | ||||||||||
Total |
$ | 3,987,000 | $ | 2,385,000 | $ | 3,470,000 | $ | 2,902,000 | ||||||
Year Ended September 26, 2008: |
||||||||||||||
Deducted from asset accounts: |
||||||||||||||
Allowance for doubtful accounts |
$ | 2,205,000 | $ | 368,000 | $ | 239,000 | $ | 2,334,000 | ||||||
Allowance for excess or obsolete spare parts inventory |
1,107,000 | 488,000 | 633,000 | 962,000 | ||||||||||
Allowance for slow-moving, damaged and discontinued inventory |
643,000 | 1,233,000 | 1,185,000 | 691,000 | ||||||||||
Total |
$ | 3,955,000 | $ | 2,089,000 | $ | 2,057,000 | $ | 3,987,000 | ||||||
Year Ended September 28, 2007: |
||||||||||||||
Deducted from asset accounts: |
||||||||||||||
Allowance for doubtful accounts |
$ | 2,276,000 | $ | 220,000 | $ | 291,000 | $ | 2,205,000 | ||||||
Allowance for excess or obsolete spare parts inventory |
1,278,000 | (91,000 | ) | 80,000 | 1,107,000 | |||||||||
Allowance for slow-moving, damaged and discontinued inventory |
1,499,000 | 788,000 | 1,644,000 | 643,000 | ||||||||||
Total |
$ | 5,053,000 | $ | 917,000 | $ | 2,015,000 | $ | 3,955,000 | ||||||
- (1)
- Deductions from the allowance for doubtful accounts equal accounts receivable written off, less recoveries, against the allowance. During fiscal year 2009, deductions were primarily related to the write-off of fully reserved accounts that had been outstanding for an extended period. Deductions from allowance for excess or obsolete spare parts inventory equal inventory written off against the allowance. Deductions from allowance for slow-moving, damaged and discontinued inventory equal inventory written off, less recoveries, against the allowance.
71
EXHIBIT INDEX
| |
Exhibit Number |
Description | ||||||
|---|---|---|---|---|---|---|---|---|
| (3) | Articles and By-Laws. | |||||||
3.1 |
The Company's amended and restated Certificate of Incorporation dated October 7, 1997 (incorporated by reference to Exhibit 3.1 to the Company's Annual Report on Form 10-K for fiscal 2005, filed June 16, 2008). |
|||||||
3.2 |
The Company's amended and restated Bylaws, as amended (incorporated by reference to Exhibit 3.1 to the Company's Form 8-K filed January 15, 2009). |
|||||||
(4) |
Instruments Defining the Rights of Security Holders, Including Indentures. |
|||||||
4.1 |
The specimen certificate representing the Company's Class A Convertible Common Stock, par value $0.001 per share (incorporated by reference to Exhibit 4.1 to the Company's statements on Form S-1, as amended (Commission file no. 333-32827) (the "IPO Registration Statement")). |
|||||||
4.2 |
The specimen certificate representing the Company's Class B Convertible Common Stock, par value $0.001 per share (incorporated by reference to Exhibit 4.2 to the IPO Registration Statement). |
|||||||
4.3 |
Section 7.1 of the Company's amended and restated Certificate of Incorporation (incorporated by reference to Exhibit 3.1 to the Company's Annual Report on Form 10-K for fiscal 2005 filed June 16, 2008). |
|||||||
4.4 |
Article II of the Company's amended and restated Bylaws (incorporated by reference to Exhibit 3.1 to the Company's Form 8-K filed January 15, 2009). |
|||||||
4.5 |
Sections 1, 2, 3, 4 of Article III of the Company's amended and restated Bylaws (incorporated by reference to Exhibit 3.1 to the Company's Form 8-K filed January 15, 2009). |
|||||||
4.6 |
Article VII of the Company's amended and restated Bylaws (incorporated by reference to Exhibit 3.1 to the Company's Form 8-K filed January 15, 2009). |
|||||||
4.7 |
Article IX of the Company's amended and restated Bylaws (incorporated by reference to Exhibit 3.1 to the Company's Form 8-K filed January 15, 2009). |
|||||||
4.8.1 |
Amended and Restated Credit Agreement, dated as of March 13, 2006, by and between the Company and Bank of America, N.A., as Lender, letter of credit issuer and Administrative Agent (incorporated by reference to Exhibit 4.1 to the Company's Form 8-K filed March 15, 2006). |
|||||||
4.8.2 |
First Amendment to Amended and Restated Credit Agreement, dated as of March 13, 2007 (incorporated by reference to Exhibit 4.2 to the Company's Form 8-K filed March 16, 2007). |
|||||||
4.8.3 |
Second Amendment to Amended and Restated Credit Agreement, dated as of December 27, 2007 (incorporated by reference to Exhibit 4.1 to the Company's Form 8-K filed December 31, 2007). |
|||||||
(10) |
Material Contracts. |
|||||||
10.1* |
Board of Directors Compensation Program. |
|||||||
10.2* |
Form of Indemnification Agreement with Officers and Directors (incorporated by reference to Exhibit 10.2 to the Company's Form 8-K filed August 16, 2005), and schedule of parties (incorporated by reference to Exhibit 10.2 to the Company's Annual Report on Form 10-K for fiscal 2005, filed June 16, 2008). |
|||||||
72
| |
Exhibit Number |
Description | ||||||
|---|---|---|---|---|---|---|---|---|
| 10.3.1* | Severance Agreement between the Company and Walt George dated October 1, 2005 (incorporated by reference to Exhibit 10.1 to the Company's Form 8-K filed October 6, 2005). | |||||||
10.3.2* |
Amendment, dated December 30, 2008, to Severance Agreement between the Company and Walt George dated October 1, 2005 (incorporated by reference to Exhibit 10.1 to the Company's Form 10-Q filed February 11, 2009). |
|||||||
10.3.4* |
Cash Bonus Plan (incorporated by reference to Exhibit 10.1 to the Form 8-K filed February 19, 2009). |
|||||||
10.3.5* |
Employment agreement dated November 6, 2007 between the Company and John P. Kelly (incorporated by reference to Exhibit 10.1 to the Company's Form 8-K filed November 8, 2007). |
|||||||
10.4.1* |
1997 Equity Incentive Plan (incorporated by reference to Exhibit 10.14 to the IPO Registration Statement). |
|||||||
10.4.2* |
First amendment to 1997 Equity Incentive Plan (incorporated by reference to Exhibit 10.1 to the Company's Form 10-Q for the period ending July 31, 1998) (Commission file no. 001-13403). |
|||||||
10.4.3* |
American Italian Pasta Company 2000 Equity Incentive Plan, as amended (incorporated by reference to Exhibit 10.5 to the Company's Form 10-Q for the period ending June 29, 2001) (Commission file no. 001-13403). |
|||||||
10.4.4* |
Amendment to the 2000 Equity Incentive Plan (incorporated by reference to Exhibit 10.1 to the Company's Form 10-Q for the period ending January 2, 2004) (Commission file no. 001-13403). |
|||||||
10.4.5* |
Form of Restricted Stock Agreement for Restricted Stock Awards granted pursuant to the Company's 2000 Equity Incentive Plan (incorporated by reference to Exhibit 10.25 to the Company's Form 10-K for the period ending September 30, 2002) (Commission file no. 001-13403). |
|||||||
10.4.6* |
Form of Stock Option Award Agreement for Stock Option Awards Pursuant to the Company's 2000 Equity Incentive Plan (incorporated by reference to Exhibit 10.4 to the Company's Form 10-Q for the period ending March 31, 2003) (Commission file no. 001-13403). |
|||||||
10.4.7* |
New Form of Restricted Stock Agreement (incorporated by reference to Exhibit 10.1 to the Company's Form 8-K filed March 8, 2006). |
|||||||
10.4.8* |
Form of Stock Appreciation Rights Award Agreement (incorporated by reference to Exhibit 10.2 to the Company's Form 8-K filed March 8, 2006). |
|||||||
10.5 |
Product Supply and Pasta Production Cooperation Agreement dated May 7, 1998 between the Registrant and Harvest States Cooperatives (incorporated by reference to Exhibit 10.2 to the Company's Form 10-Q for the period ending July 31, 1998) (Commission file no. 001-13403). |
|||||||
73
| |
Exhibit Number |
Description | ||||||
|---|---|---|---|---|---|---|---|---|
| 10.6 | Flour Purchase Agreement by and between American Italian Pasta Company and Bay State Milling Company dated August 7, 2002 (incorporated by reference to Exhibit 10.22 to the Company's Form 10-K for the period ending September 30, 2002) (Commission file no. 001-13403). (We have omitted certain information from the Agreement and filed it separately with the Securities and Exchange Commission pursuant to our request for confidential treatment under Rule 24b-2. We have identified the omitted confidential information by the following statement, "Confidential portions of material have been omitted and filed separately with the Securities and Exchange Commission," as indicated throughout the document with an asterisk in brackets ([*])). | |||||||
10.7 |
Letter Agreement between the Company and Alvarez & Marsal, LLC, dated September 28, 2005 (incorporated by reference to Exhibit 10.1 to the Company's Form 8-K filed October 4, 2005). |
|||||||
10.8 |
Letter Agreement between the Company and Alvarez & Marsal, LLC, dated March 10, 2006 (incorporated by reference to Exhibit 10.1 to the Company's Form 8-K filed March 16, 2006). |
|||||||
10.9 |
Letter Agreement between the Company and Alvarez & Marsal, LLC, dated March 21, 2007 (incorporated by reference to Exhibit 10.1 to the Company's Form 8-K filed March 27, 2007). |
|||||||
10.10 |
Letter Agreement between the Company and Alvarez & Marsal, LLC, dated January 24, 2008 (incorporated by reference to Exhibit 10.16 to the Company's Annual Report on Form 10-K for fiscal 2005, filed June 16, 2008). |
|||||||
10.11 |
Real Estate Contract between the Company and ST Specialty Foods, Inc. dated June 12, 2006 (incorporated by reference to Exhibit 10.1 to the Company's Form 8-K filed June 16, 2006). |
|||||||
10.12* |
American Italian Pasta Company Severance Plan for Senior Vice Presidents and Above. (incorporated by reference to Exhibit 10.18 to the Company's Annual Report on Form 10-K for fiscal 2007, filed June 27, 2008). |
|||||||
10.13* |
American Italian Pasta Company Amended and Restated Severance Plan for Senior Vice Presidents and Above. (incorporated by reference to Exhibit 10.1 to the Company's Form 8-K, filed November 5, 2009). |
|||||||
10.14* |
American Italian Pasta Company Restricted Stock Award Agreement for Senior Vice Presidents and Above. (incorporated by reference to Exhibit 10.2 to the Company's Form 8-K, filed November 5, 2009). |
|||||||
21 |
Subsidiaries of the registrant. |
|||||||
23.1 |
Consent of Grant Thornton LLP. |
|||||||
23.2 |
Consent of Ernst & Young LLP. |
|||||||
24 |
Power of Attorney. |
|||||||
The power of attorney is set forth on the signature page of this Annual Report on Form 10-K. |
||||||||
31.1 |
Certification Pursuant to Section 302 of the Sarbanes-Oxley Act of 2002. |
|||||||
31.2 |
Certification Pursuant to Section 302 of the Sarbanes-Oxley Act of 2002. |
|||||||
32 |
Certification Pursuant to Section 906 of the Sarbanes-Oxley Act of 2002. |
|||||||
- *
- Represents a management contract or a compensatory plan or arrangement.
74