Attached files
UNITED STATES
SECURITIES AND EXCHANGE COMMISSION
Washington, D.C. 20549
FORM 10-K
| (Mark one) | |||
| [ X ] | ANNUAL REPORT PURSUANT TO SECTION 13 OR 15(d) OF THE SECURITIES EXCHANGE ACT OF 1934 | ||
| For the Fiscal Year Ended: September 27, 2009 | |||
| OR | |||
| [ ] | TRANSITION REPORT PURSUANT TO SECTION 13 OR 15(d) OF THE SECURITIES EXCHANGE ACT OF 1934 | ||
| For the transition period from __________ to __________ | |||
|
Commission File Number: 1-6905 | |||
| RUDDICK CORPORATION |
| (Exact name of registrant as specified in its charter) |
| North Carolina | 56-0905940 | ||
| (State or other jurisdiction of | (I.R.S. Employer | ||
| incorporation or organization) | Identification Number) | ||
| 301 S. Tryon St., Suite 1800, Charlotte, North Carolina | 28202 | ||||
| (Address of principal executive offices) | (Zip Code) | ||||
Registrant's telephone number, including area code: (704) 372-5404
Securities registered pursuant to Section 12(b) of the Act:
| Title of each class: | Name of exchange on which registered: | |
| Common Stock | New York Stock Exchange, Inc. | |
| Rights to Purchase Series A Junior | ||
| Participating Additional Preferred Stock | New York Stock Exchange, Inc. |
Securities registered pursuant to Section 12(g) of the Act: None
Indicate by check mark if the registrant is a well-known seasoned issuer, as defined in Rule 405 of the Securities Act. Yes X No
Indicate by check mark if the registrant is not required to file reports pursuant to Section 13 or Section 15(d) of the Act. Yes No X
Indicate by check mark whether the
registrant (1) has filed all reports required to be filed by Section 13 or 15(d)
of the Securities Exchange Act of 1934 during the preceding 12 months (or for
such shorter period that the registrant was required to file such reports), and
(2) has been subject to such filing requirements for the past 90 days.
Yes X
No
Indicate by check mark whether the
registrant has submitted electronically and posted on its corporate Web site, if
any, every Interactive Data File required to be submitted and posted pursuant to
Rule 405 of Regulation S-T (§ 232.405 of this chapter) during the preceding 12
months (or for such shorter period that the registrant was required to submit
and post such files).
Yes
No
Indicate by check mark if disclosure of delinquent filers pursuant to Item 405 of Regulation S-K is not contained herein, and will not be contained, to the best of registrant's knowledge, in definitive proxy or information statements incorporated by reference in Part III of this Form 10-K or any amendment to this Form 10-K. [ ]
Indicate by check mark whether the registrant is a large accelerated filer, an accelerated filer, or a non-accelerated filer, or a smaller reporting company. See definition of “large accelerated filer,” “accelerated filer” and “smaller reporting company” in Rule 12b-2 of the Exchange Act. (Check one):
| Large accelerated filer X | Accelerated filer | |
| Non-accelerated filer | Smaller reporting company | |
| (Do not check if a smaller reporting company) |
Indicate by check mark whether the registrant is a shell company (as defined in Rule 12b-2 of the Exchange Act). Yes No X
The aggregate market value of the voting stock held by non-affiliates of the registrant, computed by reference to the closing price as of the last business day of the registrant’s most recently completed second fiscal quarter, March 29, 2009, was $949,348,000. The registrant has no non-voting stock.
As of November 13, 2009, the registrant had outstanding 48,572,319 shares of Common Stock.
DOCUMENTS INCORPORATED BY REFERENCE
Part III: Portions of the Definitive Proxy Statement to be filed with the Securities and Exchange Commission in connection with the solicitation of proxies for the Company’s 2010 Annual Meeting of Shareholders to be held on February 18, 2010 are incorporated by reference into Part III. (With the exception of those portions which are specifically incorporated by reference in this Form 10-K, the Proxy Statement is not deemed to be filed or incorporated by reference as part of this report.)
RUDDICK CORPORATION
AND
CONSOLIDATED SUBSIDIARIES
FORM 10-K FOR THE FISCAL YEAR ENDED SEPTEMBER 27, 2009
TABLE OF CONTENTS
| PART I | |||
| Page | |||
| Item 1. | Business | 1 | |
| Item 1A. | Risk Factors | 3 | |
| Item 1B. | Unresolved Staff Comments | 6 | |
| Item 2. | Properties | 6 | |
| Item 3. | Legal Proceedings | 7 | |
| Item 4. | Submission of Matters to a Vote of Security Holders | 7 | |
| Item 4A. | Executive Officers of the Registrant | 8 | |
| PART II | |||
| Item 5. | Market for Registrant's Common Equity, Related Shareholder | ||
| Matters and Issuer Purchases of Equity Securities | 9 | ||
| Item 6. | Selected Financial Data | 11 | |
| Item 7. | Management's Discussion and Analysis of Financial Condition | ||
| and Results of Operations | 12 | ||
| Item 7A. | Quantitative and Qualitative Disclosures about Market Risk | 25 | |
| Item 8. | Financial Statements and Supplementary Data | 26 | |
| Item 9. | Changes in and Disagreements with Accountants on Accounting | ||
| and Financial Disclosure | 50 | ||
| Item 9A. | Controls and Procedures | 51 | |
| Item 9B. | Other Information | 51 | |
| PART III | |||
| Item 10. | Directors and Executive Officers of the Registrant | 52 | |
| Item 11. | Executive Compensation | 52 | |
| Item 12. | Security Ownership of Certain Beneficial Owners and | ||
| Management and Related Shareholder Matters | 52 | ||
| Item 13. | Certain Relationships and Related Transactions, and Director | ||
| Independence | 52 | ||
| Item 14. | Principal Accountant Fees and Services | 52 | |
| PART IV | |||
| Item 15. | Exhibits and Financial Statement Schedules | 53 | |
PART I
Item 1. Business
Ruddick Corporation (the “Company”) is a holding company which, through its wholly-owned subsidiaries, is engaged in two primary businesses: Harris Teeter, Inc. (“Harris Teeter”) currently operates a regional chain of supermarkets in eight states primarily in the southeastern and mid-Atlantic United States, including the District of Columbia; and American & Efird, Inc. (“A&E”) manufactures and distributes industrial sewing thread, embroidery thread and technical textiles on a global basis.
At September 27, 2009, the Company and its subsidiaries had total consolidated assets of $1,844,321,000 and had approximately 24,800 employees. The principal executive office of the Company is located at 301 S. Tryon Street, Suite 1800, Charlotte, North Carolina, 28202.
Ruddick Corporation, which is incorporated under North Carolina law, was created in 1968 through the consolidation of the predecessor companies of Ruddick Investment Company (which was subsequently merged into Ruddick Operating Company) and A&E. In 1969, the Company acquired Harris Teeter. Ruddick Operating Company is not classified as a separate operating component of the Company due to its limited operations and relative size to the consolidated group. Ruddick Operating Company manages venture capital holdings in a limited number of entities and has investments in various independently managed venture capital investment funds. For information regarding the Company’s investments, see the Note entitled “Summary of Significant Accounting Policies” of the Notes to Consolidated Financial Statements in Item 8 hereof.
The two primary businesses of the Company, together with financial information and competitive aspects of such businesses, are discussed separately below. For other information regarding industry segments, see the Note entitled “Industry Segment Information” of the Notes to Consolidated Financial Statements in Item 8 hereof.
The only foreign operations conducted by the Company are through A&E. Neither of the two primary businesses would be characterized as seasonal. The following analysis is based upon the Company’s operating locations for the fiscal periods and year end (in thousands):
| 2009 | 2008 | 2007 | ||||||
| Net Sales for the Fiscal Year: | ||||||||
| Domestic United States | $ | 3,940,608 | $ | 3,810,635 | $ | 3,454,198 | ||
| Foreign Countries | 137,214 | 181,762 | 185,010 | |||||
| $ | 4,077,822 | $ | 3,992,397 | $ | 3,639,208 | |||
| Net Long-Lived Assets at Fiscal Year End: | ||||||||
| Domestic United States | $ | 1,088,602 | $ | 978,363 | $ | 860,493 | ||
| Foreign Countries | 36,238 | 40,625 | 41,990 | |||||
| $ | 1,124,840 | $ | 1,018,988 | $ | 902,483 | |||
The Company’s consolidated working capital as of September 27, 2009 consisted of $474,286,000 in current assets and $402,865,000 in current liabilities. Normal operating fluctuations in these balances can result in changes to cash flow from operating activities presented in the statements of consolidated cash flows that are not necessarily indicative of long-term operating trends. There are no unusual industry practices or requirements relating to working capital items in either of the Company’s subsidiary operations.
The Company employs fifteen people at its corporate headquarters, including two executive officers who formulate and implement overall corporate objectives and policies. The Company’s employees perform functions in a number of areas including finance, accounting, internal audit, risk management, financial reporting, employee benefits and public and shareholder relations. The Company assists its subsidiaries in developing long-range goals, in strengthening management personnel and their operations and financing. Management of each subsidiary is responsible for implementing operating policies and reports directly to management of the Company.
1
Harris Teeter
As of September 27, 2009, Harris Teeter operated 189 supermarkets located in North Carolina (132), Virginia (33), South Carolina (11), Maryland (3), Tennessee (4), Delaware (2), District of Columbia (2), Florida (1) and Georgia (1). These supermarkets offer a full assortment of groceries, produce, meat and seafood, delicatessen items, bakery items, wines and non-food items such as health and beauty care, general merchandise and floral. In addition, Harris Teeter operated pharmacies in 118 of their supermarkets as of September 27, 2009. Retail supermarket operations are supported by two company-owned distribution centers and one company-owned dairy production facility. Other than milk and ice cream produced by the company-owned facility, Harris Teeter purchases most of the products it sells, including its store brand products, from outside suppliers or directly from the manufacturers. Harris Teeter’s sales constituted 94% of the Company’s consolidated sales in fiscal 2009 (92% in fiscal 2008 and 91% in fiscal 2007).
The supermarket industry is highly competitive. Harris Teeter competes with local, regional and national food chains along with independent merchants. In addition to the more traditional food stores, Harris Teeter also competes with discount retailers (including supercenters that carry a full line of food items), many of which are larger in terms of assets and sales. The consolidation of competitors within the supermarket industry that has occurred over the past several years has reduced the number of local food chains and independent merchants. Additionally, some discount supercenter operators, such as Wal-Mart and Target, are continuing to expand and offer more items typically found in supermarket formats. As a result, Harris Teeter is likely to compete with more, larger food chains in its markets. Principal competitive factors include store location, price, service, convenience, cleanliness, product quality and product variety. No one customer or group of related customers has a material effect upon the business of Harris Teeter.
As of September 27, 2009, Harris Teeter employed approximately 10,000 full-time and 11,900 part-time individuals, none of whom were represented by a union. Harris Teeter considers its employee relations to be good.
American & Efird, Inc.
A&E is one of the world’s largest global manufacturers and distributors of industrial sewing thread, embroidery thread and technical textiles, produced from natural and synthetic fibers. Manufacturers of apparel, automotive materials, home furnishings, medical supplies and footwear rely on A&E industrial sewing thread to manufacture their products. A&E’s primary products are industrial sewing thread, embroidery thread and technical textiles sold through its employed sales representatives, commissioned agents and distributors. A&E also distributes sewing supplies manufactured by other companies. A&E sales constituted 6% of the Company’s consolidated sales in fiscal 2009 (8% in fiscal 2008 and 9% in fiscal 2007).
A majority of A&E’s sales are industrial thread for use in apparel products. The apparel market is made up of many categories servicing both genders and diverse age groups, including jeanswear, underwear, menswear, womenswear, outerwear, intimate apparel, workwear and childrenswear. A&E also manufactures industrial thread for use in a wide variety of non-apparel products including home furnishings, automotive, footwear, upholstered furniture, sporting goods, caps and hats, gloves, leather products, medical products and tea bag strings.
Headquartered in Mt. Holly, North Carolina, A&E operated six modern manufacturing facilities in North Carolina and four distribution centers strategically located in the United States as of the fiscal year ended September 27, 2009. Subsequent to the end of fiscal 2009, A&E completed the consolidation of one of its manufacturing facilities into one of its other North Carolina operations, thus reducing the number of manufacturing facilities in North Carolina to five. The manufacturing facilities have been designed for flexibility and efficiency to accommodate changing customer product demands.
A&E also has wholly-owned operations in Canada, China, Colombia, Costa Rica, El Salvador, England, Honduras, Hong Kong, Italy, Mexico, Malaysia, The Netherlands, Turkey, Poland and Slovenia; majority-owned joint ventures in China (two), Dominican Republic and South Africa; minority interest in ventures with ongoing operations in Bangladesh, Brazil, India and Sri Lanka; and a 50% ownership interest in a joint venture in China. A&E’s consolidated assets in these foreign operations total approximately $169 million at the end of fiscal 2009. Management expects to continue to expand foreign production and distribution operations, through acquisitions, joint ventures or new start-up operations.
The domestic order backlog, believed to be firm, as of September 27, 2009, was approximately $10,770,000 versus $10,535,000 at the end of the preceding fiscal year. The international order backlog as of the end of fiscal 2009 was approximately $1,984,000 versus $2,685,000 at the end of the preceding fiscal year. The majority of the domestic and international order backlog was filled within five weeks of the fiscal 2009 year end. As of September 27, 2009, A&E had approximately 7,500 domestic and 6,000 international active customer accounts. In fiscal 2009, no single customer accounted for more than 4% of A&E’s total net sales, and the ten largest customers accounted for approximately 14% of A&E’s total net sales.
2
A&E purchases cotton from farmers and domestic cotton merchants. There is presently a sufficient supply of cotton worldwide and in the domestic market. Synthetic fibers are bought from the principal American synthetic fiber producers for domestic operations and from the principal Asian and American synthetic fiber producers for operations in China. There is currently an adequate supply of synthetic fiber for A&E’s global operations.
A&E has three patents issued. There are no material licenses, franchises or concessions held by A&E. Research and development expenditures were $428,000, $509,000, and $487,000 in fiscal 2009, 2008 and 2007, respectively, none of which were sponsored by customers. Two full-time employees are currently engaged in this activity.
The industrial sewing thread industry is highly competitive. A&E is one of the world’s largest manufacturers of industrial sewing threads and also manufactures and distributes consumer sewing thread, embroidery thread and technical textiles. A&E competes globally with Coats plc, as well as regional producers and merchants in the industrial thread, embroidery thread and technical textile markets. The key competitive factors are quality, service and price.
A&E and its consolidated subsidiaries employed approximately 2,900 individuals worldwide as of September 27, 2009. None of the domestic employees and an insignificant number of employees of foreign operations are represented by a union. A&E considers its employee relations to be good.
Available Information
The Company’s Internet address is www.ruddickcorp.com. The Company makes available, free of charge, on or through its website, our annual report on Form 10-K, quarterly reports on Form 10-Q, current reports on Form 8-K, and amendments to those reports filed or furnished pursuant to Section 13(a) or 15(d) of the Securities Exchange Act of 1934, and beneficial ownership reports on Forms 3, 4, and 5 as soon as reasonably practicable after electronically filing such material with, or furnishing it to, the Securities and Exchange Commission.
Item 1A. Risk Factors
This report contains certain statements that are forward-looking within the meaning of the Private Securities Litigation Reform Act of 1995. These statements are not guarantees of future performance and involve certain risks, uncertainties and assumptions that are difficult to predict. Actual outcomes and results may differ materially from those expressed in, or implied by, our forward-looking statements. Words such as “expects,” “anticipates,” “believes,” “estimates” and other similar expressions or future or conditional verbs such as “will,” “should,” “would” and “could” are intended to identify such forward-looking statements. Readers of this report should not rely solely on the forward-looking statements and should consider all uncertainties and risks throughout this report. The statements are representative only as of the date they are made, and we undertake no obligation to update any forward-looking statement.
All forward-looking statements, by their nature, are subject to risks and uncertainties. Our actual future results may differ materially from those set forth in our forward-looking statements. We face risks that are inherent in the businesses and the market places in which Harris Teeter and A&E operate. The following discussion sets forth certain risks and uncertainties that we believe could cause actual future results to differ materially from expected results. In addition to the factors discussed below, other factors that might cause our future financial performance to vary from that described in our forward-looking statements include: (i) changes in federal, state or local laws or regulations; (ii) cost and stability of energy sources; (iii) cost and availability of energy and raw materials; (iv) management’s ability to predict accurately the adequacy of the Company’s present liquidity to meet future financial requirements; (v) continued solvency of any third parities on leases the Company has guaranteed; (vi) management’s ability to predict the required contributions to the pension plans of the Company; (vii) the Company’s requirement to impair recorded goodwill or long-lived assets; (viii) changes in labor and employee benefit costs, such as increased health care and other insurance costs; (ix) ability to recruit, train and retain effective employees and management in both of the Company’s operating subsidiaries; (x) the extent and speed of successful execution of strategic initiatives; (xi) volatility of financial and credit markets which would affect access to capital for the Company; and, (xii) unexpected outcomes of any legal proceedings arising in the normal course of business of the Company. Additional risks and uncertainties not presently known to us or that we currently deem immaterial also may impair our business operations and also could cause actual results to differ materially from those included, contemplated or implied by the forward-looking statements made in this report, and the reader should not consider any of the above list of factors and the following discussion to be a complete set of all potential risks or uncertainties.
3
Risks Related to Harris Teeter
The Supermarket Industry is Highly Competitive. The supermarket industry is characterized by narrow profit margins and competes on value, location and service. Harris Teeter faces increased competitive pressure in all of its markets from existing competitors and from the threatened entry by one or more major new competitors. The number and type of competitors faced by Harris Teeter vary by location and include: traditional grocery retailers (both national and regional), discount retailers such as “supercenters” and “club and warehouse stores,” specialty supermarkets, drug stores, dollar stores, convenience stores and restaurants. In addition, certain Harris Teeter supermarkets also compete with local video stores, florists, book stores and pharmacies. Aggressive supercenter expansion, increasing fragmentation of retail formats, entry of non-traditional competitors and market consolidation have further contributed to an increasingly competitive marketplace.
Additionally, increasingly competitive markets and economic uncertainty have made it difficult generally for grocery store operators to achieve comparable store sales gains. Because sales growth has been difficult to attain, Harris Teeter’s competitors have attempted to maintain market share through increased levels of promotional activities and discount pricing, creating a more difficult environment in which to achieve consistent sales gains. Some of Harris Teeter’s competitors have greater financial resources and could use these resources to take measures which could adversely affect Harris Teeter’s competitive position. Accordingly, Harris Teeter’s business, financial condition or results of operations could be adversely affected by competitive factors, including product mix and pricing changes which may be made in response to competition from existing or new competitors.
Harris Teeter’s Expansion Plans Are Subject to Risk. Harris Teeter has spent, and intends to continue to spend, significant capital and management resources on the development and implementation of expansion and renovation plans. Harris Teeter’s new store opening program has accelerated in recent years and involves expanding the company’s Washington, D.C. metro market area which incorporates northern Virginia, the District of Columbia, southern Maryland and coastal Delaware. The successful implementation of Harris Teeter’s renovation and expansion plans are subject to several factors including: the availability of new, suitable locations on reasonable commercial terms, or at all; the success of new stores, including those in new markets; management’s ability to manage expansion, including the effect on sales at existing stores when a new store is opened nearby; the ability to secure any necessary financing; change in regional and national economic conditions; and increasing competition or changes in the competitive environment in Harris Teeter’s markets.
Harris Teeter’s new stores may initially operate at a loss, depending on factors such as prevailing competition and market position in the surrounding communities and the level of sales and profit margins in existing stores may not be duplicated in new stores. Pursuing a strategy of growth, renovation and expansion in light of current highly competitive industry conditions could lead to a near-term decline in earnings as a result of opening and operating a substantial number of new stores, particularly with respect to stores in markets where Harris Teeter does not have a significant presence. If Harris Teeter’s expansion and renovation plans are unsuccessful, it could adversely affect Harris Teeter’s cash flow, business and financial condition due to the significant amount of capital and management resources invested.
Food Safety Issues Could Result in a Loss of Consumer Confidence and Product Liability Claims. Harris Teeter could be adversely affected if consumers lose confidence in the safety and quality of the food supply chain. These concerns could cause shoppers to avoid purchasing certain products from Harris Teeter, or to seek alternative sources of supply for their food needs, even if the basis for the concern is not valid and/or is outside of the company’s control. Adverse publicity about these types of concerns, whether or not valid, could discourage consumers from buying our products and any lost confidence on the part of our customers would be difficult and costly to reestablish. As such, any issue regarding the safety of any food items sold by Harris Teeter, regardless of the cause, could have a substantial and adverse effect on the company’s operations.
Harris Teeter’s Geographic Concentration May Expose it to Regional or Localized Downturns. Harris Teeter operates primarily in the southeastern United States, with a strong concentration in North Carolina, Virginia and South Carolina. As a result, Harris Teeter’s business is more susceptible to regional factors than the operations of more geographically diversified competitors. These factors include, among others, changes in the economy, weather conditions, demographics and population. Although the southeast region has experienced economic and demographic growth in the past, a significant economic downturn in the region could have a material adverse effect on Harris Teeter’s business, financial condition or results of operations.
The Ownership and Development of Real Estate May Subject Harris Teeter to Environmental Liability. Under applicable environmental laws, as an owner or developer of real estate, Harris Teeter may be responsible for remediation of environmental conditions that may be discovered and may be subject to associated liabilities (including liabilities resulting from lawsuits brought by private litigants) relating to Harris Teeter supermarkets and other buildings and the land on which those building are situated, whether the properties are leased or owned, and whether such environmental conditions, if in existence, were created by Harris Teeter or by a prior owner or tenant. The discovery of contamination from hazardous or toxic substances, or the failure to properly remediate such contaminated property, may adversely affect Harris Teeter’s ability to sell or rent real property or to borrow using real property as collateral. Liabilities or costs resulting from noncompliance with current or future applicable environmental laws or other claims relating to environmental matters could have a material adverse effect on Harris Teeter’s business, financial condition or results of operations.
4
Risks Related to A&E
A&E Operates in a Competitive Global Industry. A&E competes on a global basis with a large number of manufacturers in the highly competitive sewing thread, embroidery thread and technical textile industries. Maintaining A&E’s competitive position may require substantial investments in product development efforts, manufacturing facilities, distribution network and sales and marketing activities. Competitive pressures may also result in decreased demand for A&E’s products or force A&E to lower its prices. Other generally adverse economic and industry conditions, including a decline in consumer demand for apparel products, could have a material adverse effect on A&E’s business.
A&E may not Succeed at Integrating Its Acquisitions. In recent years, A&E has expanded its foreign production and distribution capacity by acquiring other manufacturers, entering into joint ventures or starting new businesses. Management expects A&E to continue this activity and expand foreign production and distribution operations through acquisitions, joint ventures or new start-up operations. The process of combining these acquisitions with A&E’s existing businesses involves risks. A&E will face challenges in consolidating functions, integrating organizations, procedures, operations and product lines in a timely and efficient manner and retaining key personnel. Failure to successfully manage and integrate acquisitions, joint ventures or new start-up businesses could lead to the potential loss of customers, the potential loss of employees who may be vital to the new operations, the potential loss of business opportunities or other adverse consequences that could affect A&E’s financial condition and results of operations. Even if integration occurs successfully, failure of future acquisitions to achieve levels of anticipated sales growth, profitability or productivity may adversely impact A&E’s financial condition and results of operations. Additionally, expansions involving foreign markets may present other complexities that may require additional attention from members of management. The diversion of management attention and any difficulties encountered in the transition and integration process could have a material adverse effect on A&E’s revenues, level of expenses and operating results.
A&E Has Substantial International Operations. In fiscal 2009, approximately 55% of A&E’s net sales and a large portion of A&E’s production occurred outside the United States, primarily in Europe, Latin America and Asia. A&E’s corporate strategy includes the expansion and growth of its international business on a worldwide basis, with an emphasis on Asia. As a result, A&E’s operations are subject to various political, economic and other uncertainties, including risks of restrictive taxation policies, changing political conditions and governmental regulations. A&E’s foreign operations also subjects A&E to the risks inherent in currency translations. A&E’s global operations make it impossible to eliminate completely all foreign currency translation risks and its impact on A&E’s financial results.
A&E Has Raw Material Price Volatility. The significant price volatility of many of A&E’s raw materials may result in increased production costs, which A&E may not be able to pass on to its customers. A significant portion of the raw materials A&E uses in manufacturing thread and technical textiles are petroleum-based. The prices for petroleum and petroleum-related products are volatile. While A&E at times in the past has been able to increase product prices due to raw material increases, A&E generally is not able to immediately raise product prices and may be unable to completely pass on underlying cost increases to its customers. Additional raw material and energy cost increases that A&E is not able to fully pass on to customers or the loss of a large number of customers to competitors as a result of price increases could have a material adverse effect on its business, financial condition, results of operations or cash flows.
Other Risks
Narrow Profit Margins may Adversely Affect the Company’s Business. Profit margins in the supermarket and thread industries are very narrow. In order to increase or maintain the Company’s profit margins, strategies are used to reduce costs, such as productivity improvements, shrink reduction, distribution efficiencies, energy efficiency programs and other similar strategies. Changes in product mix also may negatively affect certain financial measures. If the Company is unable to achieve forecasted cost reductions there may be an adverse effect on the Company’s business.
Our Self-Insurance Reserves are Subject to Variability and Unpredictable External Factors. As discussed in more detail below in “Management’s Discussion and Analysis of Financial Condition and Results of Operations—Critical Accounting Policies—Self-insurance Reserves for Workers’ Compensation, Healthcare and General Liability,” the Company is primarily self-insured for most U.S. workers’ compensation claims, healthcare claims and general liability and automotive liability losses. Accordingly, the Company determines the estimated reserve required for claims in each accounting period, which requires that management determine estimates of the costs of claims incurred and accrue for such expenses in the period in which the claims are incurred. The liabilities that have been recorded for these claims represent our best estimate of the ultimate obligations for reported claims plus those incurred but not reported. Changes in legal trends and interpretations, variability in inflation rates, changes in the nature and method of claims settlement, benefit level changes due to changes in applicable laws, and changes in discount rates could all affect ultimate settlements of claims or the assumptions underlying our liability estimates, which could cause a material change for our self-insurance liability reserves and impact earnings.
5
The Company may Incur Increased Pension Expenses. The Company maintains certain retirement benefit plans for substantially all domestic full-time employees and a supplemental retirement benefit plan for certain selected officers of the Company and its subsidiaries, including a qualified pension plan which is a non-contributory, funded defined benefit plan and a non-qualified supplemental pension plan for executives which is an unfunded, defined benefit plan. The Company has frozen participation and benefit accruals under the Company-sponsored defined benefit plan effective September 30, 2005 for all participants, with certain transition benefits provided to those participants that have achieved specified age and service levels on December 31, 2005; however, at September 27, 2009, the Company’s pension plans had projected benefit obligations in excess of the fair value of plan assets. The amount of any increase or decrease in our required contributions to our pension plans will depend on government regulation, returns on plan assets and actuarial assumptions regarding our future funding obligations. For more information, refer to the Note entitled “Employee Benefit Plans” in the Notes to Consolidated Financial Statements in Item 8 hereof.
Adverse Economic Conditions may Negatively Impact the Company’s Operating Results. The increase in unemployment and loss of consumer confidence can alter the consumers’ buying habits and demand for apparel products. In addition, consumers may decrease their purchases of more discretionary items and increase their purchase of lower cost food products. Adverse economic conditions in the financial markets, including the availability of financing, could also adversely affect the Company's operating results by increasing costs related to obtaining financing at acceptable rates and reduce our customers’ liquidity position. These conditions could materially affect the Company’s customers causing reductions or cancellations of existing sales orders and inhibit the Company’s ability to collect receivables. In addition, the Company’s suppliers may be unable to fulfill the Company’s outstanding orders or could change credit terms that would negatively affect the Company’s liquidity. All of these factors could adversely impact the Company’s results of operations, financial condition and cash flows.
Item 1B. Unresolved Staff Comments
None.
Item 2. Properties
The executive office of the Company is located in a leased space of a downtown office tower at 301 S. Tryon Street, Suite 1800, Charlotte, North Carolina, 28202.
Harris Teeter owns its principal offices near Charlotte, North Carolina, a 517,000 square foot distribution facility east of Charlotte, a 913,000 square foot distribution facility in Greensboro, North Carolina, and a 90,500 square foot dairy processing plant in High Point, North Carolina. Both distribution facilities contain dry grocery warehousing space and refrigerated storage for perishable goods. In addition, the Greensboro facility has frozen goods storage and a single pick facility for health and beauty care products and other general merchandise. Harris Teeter operates its retail stores primarily from leased properties. As of September 27, 2009, Harris Teeter held title to the land and buildings of four of its supermarkets. The remaining supermarkets are either leased in their entirety or the building is owned and situated on leased land. In addition, Harris Teeter holds interest in properties that are under development for store sites. Harris Teeter’s supermarkets range in size from approximately 16,000 square feet to 73,000 square feet, with an average size of approximately 47,300 square feet.
6
The following table sets forth selected statistics with respect to Harris Teeter stores for each of the last three fiscal years:
| 2009 | 2008 | 2007 | ||||||
| Stores Open at Period End | 189 | 176 | 164 | |||||
| Average Weekly Net Sales Per Store* | $ | 405,356 | $ | 414,101 | $ | 402,982 | ||
| Average Square Footage Per Store at Period End | 47,277 | 46,708 | 46,197 | |||||
| Average Square Footage Per New Store Opened | ||||||||
| During Period | 51,698 | 48,330 | 51,737 | |||||
| Total Square Footage at Period End | 8,935,271 | 8,220,583 | 7,576,302 | |||||
| ____________________ | ||||||||
| *Computed on the basis of aggregate sales of stores open for a full year. | ||||||||
A&E's principal offices, six domestic manufacturing plants and one distribution center are all owned by A&E and are all located in North Carolina. Domestic manufacturing and related warehouse facilities have an aggregate of approximately 1,537,000 square feet of floor space. A&E has a domestic dyeing production capacity of approximately 27,000,000 pounds per year. Capacities are based on 168 hours of operations per week. In addition, A&E leases three distribution centers strategically located in its domestic markets with an aggregate of approximately 84,000 square feet of floor space.
Through consolidated subsidiaries, A&E also owns seven international manufacturing and/or distribution facilities with an aggregate of approximately 799,000 square feet of floor space. A&E also leases another 19 international manufacturing and/or distribution facilities with an aggregate of approximately 427,000 square feet of floor space. The foreign consolidated subsidiaries engaged in manufacturing have a dyeing production capacity of approximately 22,480,000 pounds per year. Capacities are based on 168 hours of operations per week. In addition to its consolidated subsidiaries, A&E also has minority interests in various joint ventures and a 50% ownership interest in a joint venture in China.
The Company believes its facilities and those of its operating subsidiaries are adequate for its current operations and expected growth for the foreseeable future.
Item 3. Legal Proceedings
The Company and its subsidiaries are involved in various legal matters from time to time in connection with their operations, including various lawsuits and patent and environmental matters. These matters considered in the aggregate have not had, nor does the Company expect them to have, a material effect on the Company’s results of operations, financial position or cash flows.
Item 4. Submission of Matters to a Vote of Security Holders
Not applicable.
7
Item 4A. Executive Officers of the Registrant
The following list contains the name, age, positions and offices held and period served in such positions or offices for each of the executive officers of the Registrant.
Thomas W. Dickson, age 54, is the Chairman of the Board of Directors, President and Chief Executive Officer of the Company, and has been Chairman of the Board of Directors since March 2006 and President and principal executive officer since February 1997. Prior to that time, he served as Executive Vice President of the Company from February 1996 to February 1997. Prior to that time, from February 1994 to February 1996 he served as President of, and from February 1991 to February 1994 he served as Executive Vice President of, A&E.
John B. Woodlief, age 59, is the Vice President – Finance and Chief Financial Officer of the Company, and has been the Vice President – Finance and principal financial officer of the Company since November 1999. Prior to that time, he served as a partner in PricewaterhouseCoopers since 1998 and a partner in Price Waterhouse from 1985 to 1998. He served as Managing Partner of the Charlotte, North Carolina office of Price Waterhouse and PricewaterhouseCoopers from January of 1997 to June of 1999. He joined Price Waterhouse in 1972.
Frederick J. Morganthall, II, age 58, was elected President of Harris Teeter on October 30, 1997. Prior to that time, and beginning in October 1996, he served as Executive Vice President of Harris Teeter. He was also Harris Teeter’s Senior Vice President of Operations from October 1995 to October 1996, Vice President of Operations from April 1994 to October 1995 and Vice President of Sales and Distribution from October 1992 to April 1994.
Fred A. Jackson, age 59, has been President of A&E since August 1996. Prior to that time, and beginning in January 1996, he served as Executive Vice President of A&E. He was also A&E’s Senior Vice President - Industrial Thread Sales from October 1993 to January 1996.
The executive officers of the Company and its subsidiaries are elected annually by their respective Boards of Directors. Thomas W. Dickson is the nephew of Alan T. Dickson who is a director of the Company. No other executive officer has a family relationship as close as first cousin with any other executive officer or director or nominee for director.
8
PART II
Item 5. Market for Registrant's Common Equity, Related Shareholder Matters and Issuer Purchases of Equity Securities
Information regarding the principal market for the Company’s common stock (the “Common Stock”), number of shareholders of record, market price information per share of Common Stock and dividends declared per share of Common Stock for each quarterly period in fiscal 2009 and 2008 is set forth below.
The Common Stock is listed on the New York Stock Exchange. As of November 13, 2009, there were approximately 4,500 holders of record of Common Stock.
Quarterly Information
| First | Second | Third | Fourth | ||||||||
| Quarter | Quarter | Quarter | Quarter | ||||||||
| Fiscal 2009 | |||||||||||
| Dividend Per Share | $ | 0.12 | $ | 0.12 | $ | 0.12 | $ | 0.12 | |||
| Market Price Per Share | |||||||||||
| High | 33.74 | 29.20 | 26.87 | 28.00 | |||||||
| Low | 23.81 | 18.86 | 22.00 | 21.77 | |||||||
| Fiscal 2008 | |||||||||||
| Dividend Per Share | $ | 0.12 | $ | 0.12 | $ | 0.12 | $ | 0.12 | |||
| Market Price Per Share | |||||||||||
| High | 38.03 | 36.99 | 39.79 | 38.98 | |||||||
| Low | 31.15 | 31.71 | 33.89 | 29.47 | |||||||
The Company expects to continue paying dividends on a quarterly basis which is at the discretion of the Board of Directors and subject to legal and contractual requirements. Information regarding restrictions on the ability of the Company to pay cash dividends is set forth in "Management's Discussion and Analysis of Financial Condition and Results of Operations - Capital Resources and Liquidity" in Item 7 hereof.
Equity Compensation Plan Information
The following table provides information as of September 27, 2009 regarding the number of shares of Common Stock that may be issued under the Company’s equity compensation plans.
| Number of securities remaining | ||||||
| Number of securities to be | Weighted-average exercise | available for future issuance under | ||||
| issued upon exercise of | price of outstanding options, | equity compensation plans | ||||
| outstanding options, | warrants and rights | (excluding securities | ||||
| warrants and rights | reflected in column (a)) | |||||
| Plan category | (a) (1) | (b) (2) | (c) | |||
| Equity compensation plans | ||||||
| approved by security | ||||||
| holders | 509,184 | $19.29 | 1,465,221 | |||
| Equity compensation plans | ||||||
| not approved by security | ||||||
| holders | -0- | -0- | -0- | |||
| Total | 509,184 | $19.29 | 1,465,221 |
| (1) |
Includes grants of 136,700 performance shares outstanding as of September 27, 2009. Excludes 106,884 shares of Common Stock that are deliverable in connection with the 106,884 stock units outstanding under the Ruddick Corporation Director Deferral Plan (the “Deferral Plan”) that have been accumulated in a rabbi trust for the purpose of funding distributions from the Deferral Plan. Does not include any shares of restricted stock that were outstanding as of September 27, 2009 since these shares are already outstanding and do not represent potential dilution. For more information on the Company’s restricted stock and performance share grants, see the Note entitled “Stock Options and Stock Awards” of the Notes to Consolidated Financial Statements in Item 8 hereof. | |
| (2) |
The weighted average exercise price does not take into account performance share awards or restricted stock units outstanding as of September 27, 2009. |
9
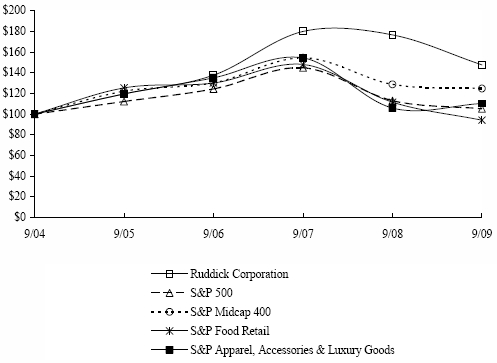
Comparison of Total Cumulative Shareholder Return for Five-Year Period Ending September 27, 2009
The following graph presents a comparison of the yearly percentage change in the Company’s cumulative total shareholders’ return on Common Stock with the (i) Standard & Poor’s 500 Index, (ii) Standard & Poor’s Midcap 400 Index, (iii) Standard & Poor’s Food Retail Index, and (iv) Standard & Poor’s Apparel, Accessories & Luxury Goods Index for the five-year period ended September 27, 2009.
Comparison of Five-Year Cumulative Total
Return*
Among Ruddick Corporation and Certain Indicies**
| Cumulative Total Return | ||||||||||||
| 9/30/04 | 9/30/05 | 9/30/06 | 9/30/07 | 9/30/08 | 9/30/09 | |||||||
| Ruddick Corporation | 100.00 | 119.64 | 137.71 | 180.08 | 176.60 | 147.73 | ||||||
| S & P 500 | 100.00 | 112.25 | 124.37 | 144.81 | 112.99 | 105.18 | ||||||
| S & P Midcap 400 | 100.00 | 122.16 | 130.17 | 154.59 | 128.81 | 124.80 | ||||||
| S & P Food Retail | 100.00 | 125.44 | 130.21 | 148.10 | 111.51 | 94.10 | ||||||
| S & P Apparel, Accessories & Luxury Goods | 100.00 | 119.54 | 135.07 | 154.44 | 105.89 | 110.34 | ||||||
* $100 invested on 9/30/04 in stock or index, including reinvestment of dividends.
** The Company utilizes two indices, rather than a single index, for its peer group comparison: Standard & Poor’s Food Retail Index and Standard & Poor’s Apparel, Accessories & Luxury Goods Index. The Company believes that the separate presentation of these indices more accurately corresponds to the Company’s primary lines of business.
10
Issuer Purchases of Equity Securities
The following table summarizes the Company’s purchases of its common stock during the quarter ended September 27, 2009.
| Total Number of | Maximum Number | |||||||
| Shares Purchased as | of Shares that May | |||||||
| Part of Publicly | Yet Be Purchased | |||||||
| Total Number of | Average Price | Announced Plans or | Under the Plans or | |||||
| Period | Shares Purchased | Paid per Share | Programs (1) | Programs | ||||
| June 29, 2009 to | ||||||||
| August 2, 2009 | - 0 - | n.a. | - 0 - | 2,822,469 | ||||
| August 3, 2009 to | ||||||||
| August 30, 2009 | - 0 - | n.a. | - 0 - | 2,822,469 | ||||
| August 31, 2009 to | ||||||||
| September 27, 2009 | - 0 - | n.a. | - 0 - | 2,822,469 | ||||
| Total | - 0 - | n.a. | - 0 - | 2,822,469 | ||||
| (1) |
In February 1996, the Company announced the adoption of a stock buyback program, authorizing, at management’s discretion, the Company to purchase and retire up to 4,639,989 shares, 10% of the then-outstanding shares of the Company’s common stock, for the purpose of preventing dilution as a result of the operation of the Company’s comprehensive stock option and awards plans. The stock purchases are effected from time to time pursuant to this authorization. As of September 27, 2009, the Company had purchased and retired 1,817,520 shares under this authorization and no shares were purchased during the quarter ended September 27, 2009. The stock buyback program has no set expiration or termination date. |
Item 6. Selected Financial Data (dollars in thousands, except per share data)
| 2009 (1) | 2008 | 2007 | 2006 | 2005 | ||||||||||
| Net sales | $ | 4,077,822 | $ | 3,992,397 | $ | 3,639,208 | $ | 3,265,856 | $ | 2,964,655 | ||||
| Operating profit | 154,851 | 173,785 | 148,174 | 123,069 | 115,260 | |||||||||
| Net income | 85,964 | 96,752 | 80,688 | 72,336 | 68,598 | |||||||||
| Net income per share | ||||||||||||||
| Basic | 1.79 | 2.02 | 1.69 | 1.53 | 1.45 | |||||||||
| Diluted | 1.78 | 2.00 | 1.68 | 1.52 | 1.44 | |||||||||
| Dividend per share | 0.48 | 0.48 | 0.44 | 0.44 | 0.44 | |||||||||
| Total assets | 1,844,321 | 1,696,407 | 1,529,689 | 1,362,936 | 1,203,640 | |||||||||
| Long-term debt -- including | ||||||||||||||
| current portion | 365,087 | 320,578 | 264,392 | 237,731 | 163,445 | |||||||||
| Shareholders' equity | 812,179 | 823,835 | 736,610 | 670,517 | 608,942 | |||||||||
| Book value per share | 16.73 | 17.06 | 15.31 | 14.10 | 12.82 |
Note: The Company’s fiscal year ends on the Sunday nearest to September 30. Fiscal years 2009, 2008, 2007, 2006 and 2005 includes the 52 weeks ended September 27, 2009, September 28, 2008, September 30, 2007, October 1, 2006 and October 2, 2005.
| (1) |
Reference is made to Item 7, “Management’s Discussion and Analysis of Financial Condition and Results of Operations – Results of Operations – Goodwill and Long-Lived Asset Impairments” which describes certain asset impairment charges as follows: |
- Fiscal 2009 – Non-cash charges of $9,891,000 ($6,099,000 after tax benefits, or $0.13 per diluted share) related to goodwill and long-lived asset impairments recognized by A&E.
11
Item 7. Management's Discussion and Analysis of Financial Condition and Results of Operations
This Management’s Discussion and Analysis of Financial Condition and Results of Operations includes forward-looking statements. We have based these forward-looking statements on our current plans, expectations and beliefs about future events. In light of the risks, uncertainties and assumptions discussed under Item 1A “Risk Factors” of this Annual Report on Form 10-K and other factors discussed in this section, there are risks that our actual experience will differ materially from the expectations and beliefs reflected in the forward-looking statements in this section and throughout this report. For more information regarding what constitutes a forward-looking statement, please refer to “Risk Factors” in Item 1A hereof.
Overview
The Company operates primarily in two business segments through two wholly owned subsidiaries: retail grocery (including related real estate and store development activities) – operated by Harris Teeter, and industrial sewing thread (textile primarily), including embroidery thread and technical textiles – operated by A&E. Harris Teeter is a regional supermarket chain operating primarily in the southeastern and mid-Atlantic United States, including the District of Columbia. A&E is a global manufacturer and distributor of sewing thread for the apparel and other markets, embroidery thread and technical textiles. The Company evaluates the performance of its two businesses utilizing various measures which are based on operating profit.
The economic environment has motivated changes in the consumption habits of the retail consumer which has impacted the financial results of both operating subsidiaries. Unprecedented economic uncertainty, tumultuous market conditions, and a decreasing level of consumer confidence has created a more cautious consumer and increased the competitive environment in Harris Teeter’s primary markets. Harris Teeter competes with other traditional grocery retailers, as well as other retail outlets including, but not limited to, discount retailers such as “neighborhood or supercenters” and “club and warehouse stores,” specialty supermarkets and drug stores. Generally, Harris Teeter’s markets continue to experience new store opening activity and aggressive feature pricing or everyday low prices by competitors. In response, Harris Teeter utilizes information gathered from various sources, including its Very Important Customer ("VIC") loyalty card program, and works with suppliers to deliver effective retail pricing and targeted promotional spending programs that drive customer traffic and create value for Harris Teeter customers. In addition, Harris Teeter differentiates itself from its competitors with its product selection, assortment and variety, and its focus on customer service. These efforts along with Harris Teeter’s new store development program have resulted in overall gains in market share within Harris Teeter’s primary markets.
Harris Teeter continued its planned new store development program and has opened 15 new stores during fiscal 2009, 15 new stores during fiscal 2008 and 19 new stores during fiscal 2007. Much of Harris Teeter’s new store growth is focused on expanding its Washington, D.C. metro market area which incorporates northern Virginia, the District of Columbia, southern Maryland and coastal Delaware. The new store activity, and its associated pre-opening and incremental start-up costs, has required additional borrowings under the Company’s revolving credit facility.
Business conditions for A&E’s customers have also been negatively impacted by the current economic environment and the cautious consumer. A&E has experienced a significant decline in sales as a result of the serious global economic conditions facing its customers in the apparel and non-apparel markets. In addition, apparel production in the Americas has continued to decline due to the shift of apparel sourcing from the Americas to other regions of the world, predominately Asia. It has been estimated by the U.S. Department of Commerce Office of Textiles and Apparel that Asia and the Indian sub-continent accounted for approximately 69% of the apparel imports into the U.S. in 2006, approximately 73% in 2007, approximately 74% in 2008 and approximately 76% for the first eight months in 2009. This has greatly impacted A&E’s operations in the Americas. As a result, A&E’s strategic plans have included the expansion of its operations in the Asian markets and the expansion of product lines beyond apparel sewing thread.
12
A&E’s growth in China, India and other Asian markets has been accomplished through additional investments in its wholly owned subsidiaries by way of capital expenditures and through strategic joint ventures. In fiscal 2003, A&E entered into a joint venture in China resulting in a 50% ownership interest in Huamei Thread Company Limited, which is one of the largest thread producers in the China market. During fiscal 2005, A&E acquired an 80% ownership interest in Jimei Spinning Company Limited (a thread yarn spinning company located in China) and increased its ownership interest in Hengmei Spinning Company Limited (another thread yarn spinning company in China) from 60% to 80%. During the third quarter of fiscal 2008, A&E entered into a joint venture with Vardhman Textiles Limited in India (“Vardhman”) to manufacture, distribute and sell sewing thread for industrial and consumer markets within India and for export markets. During the first quarter of fiscal 2009, A&E exercised its option to purchase an additional 14% ownership interest in Vardhman under the terms of the original joint venture agreement, which increased A&E’s total ownership interest in Vardhman to 49%. A&E continues to transform its business to be more Asian centric, which is in line with the global shifting of A&E’s customer base.
A&E also expanded its global presence during fiscal 2005 by entering into a joint venture in Brazil resulting in a 30% ownership interest in Linhas Bonfio S.A (“Linhas”). During the first quarter of fiscal 2009, A&E acquired an additional 13% ownership interest in Linhas, which increased A&E’s total ownership interest in Linhas to 43%. In addition, A&E obtained a majority ownership interest in its two joint ventures in South Africa during fiscal 2006.
A&E’s fiscal 2004 acquisition of certain assets and the U.S. business of Synthetic Thread Company, Inc. provided A&E with an entry into the technical textiles market. A&E expanded its customer base and product line offerings in the technical textiles arena by acquiring certain assets and the U.S. business of Ludlow Textiles Company, Inc. in fiscal 2005. Technical textiles represent non-apparel yarns A&E supplies to its customers in the automotive, telecommunication, wire and cable, paper production and other industries. Further diversification was achieved in fiscal 2005 by A&E’s acquisition of certain assets and the business of Robison-Anton Textile Co., a U.S. producer of high-quality embroidery threads. The sale of non-apparel threads and yarns resulting from these acquisitions has partially offset sales declines in the U.S. resulting from the shifting of apparel manufacturing. In fiscal 2006, A&E expanded its production and distribution of non-apparel products through the acquisition of TSP Tovarna Sukancev in Trakov d.d. (“TSP”) located in Maribor, Slovenia. A&E continues to expand the manufacturing and distribution of non-apparel products throughout its global operations.
A&E continues to face increased operating costs and highly competitive pricing in its markets. A&E has completed the integration and consolidation of the strategic investments made in the past few years. Management at A&E intends to continue to reduce expenses at its U.S. operations and certain foreign operations, and focus on its strategic plans to become more Asian centric.
Results of Operations
Goodwill and Long-Lived Asset Impairments
The continuing deterioration of the economic environment during 2009, particularly with respect to A&E’s customers in the retail apparel and non-apparel markets, caused management to lower the expected future cash flows of A&E’s U.S. operating segment during the Company’s annual strategic planning process. Based on the revised expectations, A&E was required to perform an interim test for goodwill impairment and, as a result, recorded non-cash impairment charges related to its U.S. operating segment during the third quarter of fiscal 2009. Impairment charges included the write-off of all of the goodwill associated with its U.S. acquisitions previously made in 1995 and 1996 and the write-down of certain long-lived assets of its U.S. operating segment. During fiscal 2009, A&E wrote off $7,654,000 of goodwill and wrote down certain long-lived assets of its U.S. operating segment by $2,237,000. A&E also recorded deferred tax benefits of $3,792,000 related to the impairment charges.
13
Consolidated Overview
The following table sets forth the operating profit components by each of the Company's operating segments and for the holding company ("Corporate") for the 52 weeks ended September 27, 2009 (fiscal 2009), September 28, 2008 (fiscal 2008), and September 30, 2007 (fiscal 2007). The table also sets forth each of the segment’s net income components as a percent to total net sales and the percentage increase or decrease of such components over the prior year (in thousands):
| Fiscal 2009 | Fiscal 2008 | Fiscal 2007 | % Inc. (Dec.) | |||||||||||||||||||||||
| % to | % to | % to | 09 vs | 08 vs | ||||||||||||||||||||||
| Sales | Sales | Sales | 08 | 07 | ||||||||||||||||||||||
| Net Sales | ||||||||||||||||||||||||||
| Harris Teeter | $ | 3,827,005 | 93.8 | $ | 3,664,804 | 91.8 | $ | 3,299,377 | 90.7 | 4.4 | 11.1 | |||||||||||||||
| American & Efird | 250,817 | 6.2 | 327,593 | 8.2 | 339,831 | 9.3 | (23.4 | ) | (3.6 | ) | ||||||||||||||||
| Total | $ | 4,077,822 | 100.0 | $ | 3,992,397 | 100.0 | $ | 3,639,208 | 100.0 | 2.1 | 9.7 | |||||||||||||||
| Gross Profit | ||||||||||||||||||||||||||
| Harris Teeter | $ | 1,169,441 | 28.68 | $ | 1,138,857 | 28.53 | $ | 1,021,739 | 28.07 | 2.7 | 11.5 | |||||||||||||||
| American & Efird | 47,916 | 1.17 | 69,590 | 1.74 | 74,608 | 2.05 | (31.1 | ) | (6.7 | ) | ||||||||||||||||
| Total | 1,217,357 | 29.85 | 1,208,447 | 30.27 | 1,096,347 | 30.12 | 0.7 | 10.2 | ||||||||||||||||||
| SG&A Expenses | ||||||||||||||||||||||||||
| Harris Teeter | 993,850 | 24.37 | 961,092 | 24.08 | 867,656 | 23.84 | 3.4 | 10.8 | ||||||||||||||||||
| American & Efird | 52,646 | 1.29 | 67,262 | 1.68 | 73,184 | 2.01 | (21.7 | ) | (8.1 | ) | ||||||||||||||||
| Corporate | 6,119 | 0.15 | 6,308 | 0.16 | 7,333 | 0.20 | (3.0 | ) | (14.0 | ) | ||||||||||||||||
| Total | 1,052,615 | 25.81 | 1,034,662 | 25.92 | 948,173 | 26.05 | 1.7 | 9.1 | ||||||||||||||||||
| Impairment Charges – A&E | ||||||||||||||||||||||||||
| Goodwill | 7,654 | 0.19 | - | - | - | - | n.m. | n.m. | ||||||||||||||||||
| Long-Lived Assets | 2,237 | 0.05 | - | - | - | - | n.m. | n.m. | ||||||||||||||||||
| Total | 9,891 | 0.24 | - | - | - | - | n.m. | n.m. | ||||||||||||||||||
| Operating Profit (Loss) | ||||||||||||||||||||||||||
| Harris Teeter | 175,591 | 4.31 | 177,765 | 4.45 | 154,083 | 4.23 | (1.2 | ) | 15.4 | |||||||||||||||||
| American & Efird | (14,621 | ) | (0.36 | ) | 2,328 | 0.06 | 1,424 | 0.04 | n.m. | 63.6 | ||||||||||||||||
| Corporate | (6,119 | ) | (0.15 | ) | (6,308 | ) | (0.16 | ) | (7,333 | ) | (0.20 | ) | (3.0 | ) | (14.0 | ) | ||||||||||
| Total | 154,851 | 3.80 | 173,785 | 4.35 | 148,174 | 4.07 | (10.9 | ) | 17.3 | |||||||||||||||||
| Other Expense, net | 16,662 | 0.41 | 19,674 | 0.49 | 17,683 | 0.48 | (15.3 | ) | 11.3 | |||||||||||||||||
| Income Tax Expense | 52,225 | 1.28 | 57,359 | 1.44 | 49,803 | 1.37 | (9.0 | ) | 15.2 | |||||||||||||||||
| Net Income | $ | 85,964 | 2.11 | $ | 96,752 | 2.42 | $ | 80,688 | 2.22 | (11.1 | ) | 19.9 | ||||||||||||||
Consolidated net sales increased 2.1% in fiscal 2009 and 9.7% in fiscal 2008 when compared to prior years as a result of strong sales gains at Harris Teeter. The fiscal 2009 and 2008 increases were partially offset by sales declines at A&E. Foreign sales for fiscal 2009 represented 3.4% of the consolidated sales of the Company, compared to 4.6% for fiscal 2008 and 5.1% for fiscal 2007. Over the past several years, A&E has pursued a global expansion strategy along with the diversification of its product lines; however, the percentage of foreign sales to consolidated net sales has declined during these periods as a result of the sales mix between the operating subsidiaries. Refer to the discussion of segment operations under the captions “Harris Teeter, Retail Grocery Segment” and “American & Efird, Industrial Thread Segment” for a further analysis of the segment operating results.
The gross profit increase for fiscal 2009 was driven by increased gross profit at Harris Teeter that was offset, in part, by a gross profit decline at A&E when compared to fiscal 2008. The increase in gross profit, and its percent to sales, for fiscal 2008 was driven by a gross profit increase at Harris Teeter that was offset, in part, by a gross profit decline at A&E from fiscal 2007 to fiscal 2008. Refer to the discussion of segment operations under the captions “Harris Teeter, Retail Grocery Segment” and “American & Efird, Industrial Thread Segment” for a further analysis of the segment operating results.
Consolidated selling, general & administrative (“SG&A”) expenses increased during fiscal 2009, when compared to the prior year, as a result of the increased operating costs at Harris Teeter driven by store expansion. The increase in SG&A expenses in fiscal 2009 was partially offset by reduced SG&A expenses at A&E and Corporate. SG&A expenses, as a percent to consolidated net sales, decreased in fiscal 2009 from fiscal 2008 and fiscal 2007 as a result of the leverage created through sales gains that apply against fixed costs at Harris Teeter and lower SG&A expenses at A&E and Corporate. Refer to the discussion of segment operations under the caption “Harris Teeter, Retail Grocery Segment” and “American & Efird, Industrial Thread Segment” for a further analysis of the segment operating results.
14
As discussed previously, A&E recorded non-cash impairment charges of $9,891,000 related to its U.S. operating unit during fiscal 2009. The related income tax benefit of these charges amounted to $3,792,000, resulting in a net income reduction of $6,099,000. Refer to the discussion of segment operations under the caption “American & Efird, Industrial Thread Segment” for a further analysis of the segment operating results.
Other expense, net includes interest expense, interest income, investment gains and losses, and minority interest. Net interest expense (interest expense less interest income) decreased $2.3 million in fiscal 2009 from fiscal 2008. The decrease in interest expense was driven by lower average interest rates on outstanding debt balances. Average outstanding debt balances increased between the comparable periods as a result of increased borrowings under the Company’s credit facility and new capital leases entered into in support of Harris Teeter’s new store development program. Net interest expense increased $1.8 million in fiscal 2008 over fiscal 2007 as a result of additional interest expense associated with increased borrowings under the Company’s credit facility in support of Harris Teeter’s new store development program. In addition, incremental borrowings were required for A&E’s fiscal 2008 equity investment in Vardhman. The increase in interest expense was offset, in part, by a lower weighted average interest rate realized during fiscal 2008.
The effective consolidated income tax rate for fiscal 2009 was 37.8% as compared to 37.2% for fiscal 2008 and 38.2% for fiscal 2007. Income tax expense for fiscal 2009 included the removal of $1.6 million of valuation allowances associated with foreign tax credits which management now believes will be realized and adjustments made for an increase in the Company’s state income taxes. Income tax expense for fiscal 2008 included refund claims related to prior years of approximately $2.4 million associated with A&E’s foreign operations.
As a result of the items discussed above, consolidated net income for fiscal 2009 decreased by $10.8 million, or 11.1%, over fiscal 2008 and net income per diluted share decreased by 11.0% to $1.78 per share in fiscal 2009 from $2.00 per share in fiscal 2008. The non-cash impairment charges recorded by A&E during fiscal 2009 reduced consolidated net income by $6.1 million, or $0.13 per diluted share. Consolidated net income for fiscal 2008 increased by $16.1 million, or 19.9%, over fiscal 2007 and net income per diluted share increased by 19.0% to $2.00 per share in fiscal 2008 from $1.68 per share in fiscal 2007.
Harris Teeter, Retail Grocery Segment
The following table sets forth the consolidated operating profit components for the Company's Harris Teeter supermarket subsidiary for fiscal years 2009, 2008, and 2007. The table also sets forth the percent to sales and the percentage increase or decrease over the prior year (in thousands):
| Fiscal 2009 | Fiscal 2008 | Fiscal 2007 | % Inc. (Dec.) | ||||||||||||||||
| % to | % to | % to | 09 vs | 08 vs | |||||||||||||||
| Sales | Sales | Sales | 08 | 07 | |||||||||||||||
| Net Sales | $ | 3,827,005 | 100.00 | $ | 3,664,804 | 100.00 | $ | 3,299,377 | 100.00 | 4.4 | 11.1 | ||||||||
| Cost of Sales | 2,657,564 | 69.44 | 2,525,947 | 68.92 | 2,277,638 | 69.03 | 5.2 | 10.9 | |||||||||||
| Gross Profit | 1,169,441 | 30.56 | 1,138,857 | 31.08 | 1,021,739 | 30.97 | 2.7 | 11.5 | |||||||||||
| SG&A Expenses | 993,850 | 25.97 | 961,092 | 26.23 | 867,656 | 26.30 | 3.4 | 10.8 | |||||||||||
| Operating Profit | $ | 175,591 | 4.59 | $ | 177,765 | 4.85 | $ | 154,083 | 4.67 | (1.2 | ) | 15.4 | |||||||
Sales increased 4.4% in fiscal 2009 over fiscal 2008 and 11.1% in fiscal 2008 over fiscal 2007. The increase in sales in fiscal 2009 was attributable to incremental new stores that was partially offset by a decline in comparable store sales, whereas the increase in sales in fiscal 2008 was attributable to both incremental new stores and comparable store sales increases. During fiscal 2009, Harris Teeter opened 15 new stores (2 of which were replacements) and closed 2 stores. During fiscal 2008, Harris Teeter opened 15 new stores (2 of which were replacements) and closed 3 stores and during fiscal 2007 Harris Teeter opened 19 new stores (2 of which were replacements) and closed 7 stores. The increase in sales from new stores exceeded the loss of sales from closed stores by $225.4 million in fiscal 2009, $275.7 million in fiscal 2008 and $230.1 million in fiscal 2007. Comparable store sales (see definition below) decreased 1.49% ($53.1 million) for fiscal 2009, as compared to increases of 2.86% ($91.3 million) for fiscal 2008 and 4.87% ($136.4 million) for fiscal 2007. Comparable store sales were negatively impacted by retail price deflation and, to some extent, the cannibalization created by strategically opening stores in key major markets that have a close proximity to existing stores. In addition, Harris Teeter customers, in theses economic times, are choosing lower priced store branded products and reducing their purchases of more discretionary categories such as floral, tobacco, and certain general merchandise. Store brand product penetration was 25.38% in fiscal 2009, an increase of 10 basis points over fiscal 2008. The number of shopping visits and items sold increased, however the average ticket size was down in fiscal 2009 from fiscal 2008. In addition, Harris Teeter experienced average increases in active households per comparable store (based on VIC data) in fiscal 2009 of 3.31% for the fourth quarter and 1.86% for year, evidencing a growing customer base in those stores. Harris Teeter’s strategy of opening additional stores in its core markets that have a close proximity to existing stores can negatively impact comparable store sales. However, management expects these stores, and any similar new additions in the foreseeable future, to have a strategic benefit of enabling Harris Teeter to capture sales and expand market share as the markets it serves continue to grow.
15
Harris Teeter considers its reporting of comparable store sales growth to be effective in determining core sales growth during periods of fluctuation in the number of stores in operation, their locations and their sizes. While there is no standard industry definition of "comparable store sales," Harris Teeter has been consistently applying the following definition. Comparable store sales are computed using corresponding calendar weeks to account for the occasional extra week included in a fiscal year. A new store must be in operation for 14 months before it enters into the calculation of comparable store sales. A closed store is removed from the calculation in the month in which its closure is announced. A new store opening within an approximate two-mile radius of an existing store that is to be closed upon the new store opening is included as a replacement store in the comparable store sales measurement as if it were the same store. Sales increases resulting from existing comparable stores that are expanded in size are included in the calculations of comparable store sales, if the store remains open during the construction period.
Fiscal 2009 gross profit as a percent to sales declined 52 basis points from fiscal 2008 as a result of additional promotional activity designed to provide more value to Harris Teeter’s customers. Management continues to adjust Harris Teeter’s promotional spending programs in response to the changing purchasing habits of Harris Teeter’s customers. The decline in the gross profit margin for fiscal 2009 was offset, in part, by management’s emphasis on distribution and manufacturing cost controls, decreasing fuel costs and a lower LIFO charge. Gross profit, and its percent to sales, for fiscal 2008 improved as a result of changes in Harris Teeter’s market mix and its retail pricing and targeted promotional spending strategies. The annual LIFO charge reduced gross profit by $4.4 million (0.12% to sales) in fiscal 2009, $8.8 million (0.24% to sales) in fiscal 2008 and $1.4 million (0.04% to sales) in fiscal 2007.
SG&A expenses for fiscal 2009 increased from fiscal 2008 as a result of incremental costs associated with Harris Teeter’s new store program (pre-opening costs and incremental start-up costs), increased credit and debit card fees and other occupancy costs. However, SG&A expenses as a percent to sales decreased 26 basis points in fiscal 2009 from fiscal 2008 as a result of the leverage created through sales gains that apply against fixed costs, along with improved labor management and additional cost controls in support departments. SG&A expenses as a percent to sales decreased in fiscal 2008 from fiscal 2007 as a result of the leverage created through sales gains that apply against fixed costs. Included with SG&A expenses are pre-opening costs, which consist of pre-opening rent, labor and associated fringe benefits and recruiting and relocations costs incurred prior to a new store opening and amounted to $14.4 million (0.37% of sales) in fiscal 2009, $15.4 million (0.42% of sales) in fiscal 2008 and $17.9 million (0.54% of sales) in fiscal 2007. Pre-opening costs fluctuate between periods depending on the new store opening schedule and market location.
As a result of the sales and cost elements described above, operating profit declined 1.2% in fiscal 2009 from fiscal 2008 and increased 15.4% in fiscal 2008 from fiscal 2007. Harris Teeter continues to invest within its core markets, which management believes have greater potential for improved returns on investment in the foreseeable future. Harris Teeter had 189 stores in operation at September 27, 2009, compared to 176 stores at September 28, 2008 and 164 stores at September 30, 2007.
16
American & Efird, Industrial Thread Segment
The following table sets forth the consolidated operating profit components for the Company's A&E textile subsidiary for fiscal years 2009, 2008 and 2007. The table also sets forth the percent to sales and the percentage increase or decrease over the prior year (in thousands):
| Fiscal 2009 | Fiscal 2008 | Fiscal 2007 | % Inc. (Dec.) | |||||||||||||||||||
| % to | % to | % to | 09 vs | 08 vs | ||||||||||||||||||
| Sales | Sales | Sales | 08 | 07 | ||||||||||||||||||
| Net Sales | $ | 250,817 | 100.00 | $ | 327,593 | 100.00 | $ | 339,831 | 100.00 | (23.4 | ) | (3.6 | ) | |||||||||
| Cost of Sales | 202,901 | 80.90 | 258,003 | 78.76 | 265,223 | 78.05 | (21.4 | ) | (2.7 | ) | ||||||||||||
| Gross Profit | 47,916 | 19.10 | 69,590 | 21.24 | 74,608 | 21.95 | (31.1 | ) | (6.7 | ) | ||||||||||||
| SG&A Expenses | 52,646 | 20.99 | 67,262 | 20.53 | 73,184 | 21.53 | (21.7 | ) | (8.1 | ) | ||||||||||||
| Goodwill Impairment | 7,654 | 3.05 | - | - | - | - | n.m. | n.m. | ||||||||||||||
| Long-Lived Asset Impairments | 2,237 | 0.89 | - | - | - | - | n.m. | n.m. | ||||||||||||||
| Operating (Loss) Profit | $ | (14,621 | ) | (5.83 | ) | $ | 2,328 | 0.71 | $ | 1,424 | 0.42 | n.m. | 63.6 | |||||||||
Sales decreased 23.4% in fiscal 2009 from fiscal 2008 and 3.6% in fiscal 2008 from fiscal 2007. The decrease in fiscal 2009 was driven primarily by sales declines for all regions between the comparable fiscal years. The global recession and its continuing negative impact on consumer spending is depressing the worldwide supply chain and A&E’s customers have cut back orders in response to the reduction of retail sales. The decrease in fiscal 2008 was driven primarily by sales declines in the United States, Canada and Mexico (the North American Free Trade Association Region or “NAFTA”) from fiscal 2007. Sales gains during fiscal 2008 in A&E’s Asian operations were offset by the sales declines realized in NAFTA.
Foreign sales accounted for approximately 55% of total A&E sales in both fiscal 2009 and fiscal 2008, and 54% in fiscal 2007. Foreign sales, especially in the Asian markets, will continue to be a significant proportion of total A&E sales due to the shifting global production of its customers and A&E's strategy of increasing its presence in such global markets. Management recognizes that a major challenge facing A&E is the geographic shift of its customer base and, as a result, management remains committed to its strategic plans that will transform A&E’s business to a more Asian-centric global supplier of sewing thread, embroidery thread and technical textiles.
Gross profit, and its percent to net sales, decreased during fiscal 2009 and fiscal 2008 when compared to the prior fiscal years primarily as a result of weak sales and poor overhead absorption in the U.S. operations and certain other foreign operations. Fiscal 2009 gross profit was reduced by $300,000 for severance costs associated with the consolidation of one of A&E’s manufacturing facilities in North Carolina into one of A&E’s other North Carolina operations, which was completed subsequent to the end of fiscal 2009. The shifting of apparel production from the Americas to Asia has continued and management is focused on optimizing costs and manufacturing capacities in its domestic and foreign operations.
SG&A expenses decreased in fiscal 2009 from fiscal 2008, as a result of increased net profit from non-consolidated subsidiaries and A&E reducing expenses to more closely match the decline in sales volume; however SG&A expenses as a percent to sales increased primarily due to sales declining faster than the expense reductions achieved during fiscal 2009. Expense reductions have been realized through the consolidation and rationalization of A&E's operations in the U.S. and certain foreign locations. SG&A expenses, and its percent to sales, in fiscal 2008 decreased from fiscal 2007, primarily as a result of increased net profit from non-consolidated subsidiaries and reduced costs in A&E's U.S. operations. In addition, SG&A expenses in fiscal 2008 were offset by an expense reversal of approximately $0.9 million for costs associated with certain import duties levied against A&E’s Mexico operations and previously accrued by A&E. As disclosed in prior filings, A&E resolved the dispute through an amnesty program provided by the Mexican authorities during the first quarter of fiscal 2008. The net decrease in fiscal 2008 was offset, in part, by increases in certain items, such as employee health care costs. Net profit from non-consolidated subsidiaries is recorded as a reduction to SG&A expenses and amounted to $4.4 million in fiscal 2009, as compared to $3.4 million in fiscal 2008 and $1.4 million in fiscal 2007. The increase in net profit from non-consolidated subsidiaries was driven primarily by A&E’s investments in Vardhman during fiscal 2008 and 2009.
As discussed above, A&E recorded non-cash impairment charges during fiscal 2009 totaling $9.9 million related to its U.S. operating unit. Impairment charges included $7.7 million for the write-off of all of the goodwill associated with its U.S. acquisitions previously made in 1995 and 1996, and $2.2 million for the write-down of long-lived assets.
A&E’s operating loss for fiscal 2009 was comprised of $9.9 million of impairment charges discussed above and $4.7 million of operating losses resulting from the challenging economic environment in many parts of the world and its impact on A&E’s customers. Although A&E has significantly reduced expenses, it was not enough to offset the decline in sales and reduced operating schedules. Management at A&E intends to continue to reduce expenses at its U.S. operations and certain foreign operations and focus on its strategic plans to become more Asian centric.
17
For fiscal 2009, all geographic areas of A&E’s operations, including Asia, experienced weak business conditions as a result of poor retail sales on a global basis. However, the accomplishments made in expense reduction, and overall improved sales and operating profit in Asia, enabled A&E to realize a significant increase in operating profit during the fourth quarter of fiscal 2009 over the fourth quarter of fiscal 2008. A&E’s operating results are not indicative of the progress that has been made in becoming more Asian centric due to the fact that increased sales and improved operating profit of its consolidated Asian operations realized during fiscal 2008 and the fourth quarter of fiscal 2009 have been offset by weakness in the U.S. and other operating areas outside of Asia. In addition, A&E has minority interests in certain Asian operations that are not consolidated with A&E’s reported sales, but have substantial sales and good operating results.
Outlook
Harris Teeter’s operating performance and the Company’s strong financial position provides the flexibility to continue with Harris Teeter’s store development program that includes new and replacement stores along with the remodeling and expansion of existing stores. During fiscal 2010, Harris Teeter plans to open 13 new stores (2 of which will be replacements for existing stores) and complete 2 major remodels (1 of which will be expanded in size). The new store opening program for fiscal 2010 is expected to result in a 6.8% increase in retail square footage as compared to an 8.7% increase in fiscal 2009. The annual number of new store openings for fiscal year 2011 and thereafter are expected to be similar to that of fiscal 2010 which is down from fiscal 2009. Management will continue to evaluate Harris Teeter’s capital expenditures during these times of economic uncertainty and will adjust its strategic plan accordingly. In addition, the Company routinely evaluates its existing store operations in regards to its overall business strategy and from time to time will close or divest older or underperforming stores.
The new store program for fiscal 2010 anticipates the continued expansion of Harris Teeter’s existing markets, including the Washington, D.C. metro market area which incorporates northern Virginia, the District of Columbia, southern Maryland and coastal Delaware. Real estate development by its nature is both unpredictable and subject to external factors including weather, construction schedules and costs. Any change in the amount and timing of new store development would impact the expected capital expenditures, sales and operating results.
Startup costs associated with opening new stores under Harris Teeter’s store development program can negatively impact operating margins and net income. In the current competitive environment, promotional costs to maintain market share could also negatively impact operating margins and net income in future periods. The continued execution of productivity initiatives implemented throughout all stores, maintaining controls over waste, implementation of operating efficiencies and effective merchandising strategies will dictate the pace at which Harris Teeter’s operating results could improve, if at all.
A&E has been able to diversify its customer base, product mix and geographical locations through acquisitions and joint venture agreements completed in recent years. In addition, A&E continues to increase its investment in China and India to support the growth opportunities in these countries and to become more Asian-centric. A&E will find it difficult to generate significant improvements in profitability in the absence of a more favorable retail environment. A&E management continues to focus on providing best-in-class service to its customers and expanding its product lines throughout A&E’s global supply chain. In addition, management intends to continue to reduce expenses at its U.S. operations and certain foreign operations, and to evaluate its structure to best position A&E to take advantage of opportunities available through its enhanced international operations.
The Company’s management is cautious in its expectations for fiscal 2010 due to the current economic environment and its impact on our customers. The Company will continue to refine its merchandising strategies to respond to the changing shopping demands as a result of the challenging economic environment. The retail grocery market remains intensely competitive and the textile and apparel environment faces additional challenges during this recessionary period. Operating improvement will be dependent on the Company’s ability to increase Harris Teeter’s market share, optimize A&E’s operations, offset increased operating costs with additional operating efficiencies, and to effectively execute the Company’s strategic expansion plans.
Capital Resources and Liquidity
The Company is a holding company which, through its wholly-owned operating subsidiaries, Harris Teeter and A&E, is engaged in the primary businesses of retail grocery and the manufacturing and distribution of industrial thread, technical textiles and embroidery thread, respectively. The Company has no material independent operations, nor material assets, other than the investments in its operating subsidiaries, as well as certain property and equipment, cash equivalents and life insurance contracts to support corporate-wide operations and benefit programs. The Company provides a variety of services to its subsidiaries and is dependent upon income and associated cash flows from its operating subsidiaries.
18
The Company's principal source of liquidity has been cash generated from operating activities and borrowings available under the Company’s credit facility. During fiscal 2009, the net cash provided by operating activities was $233.7 million, compared to $227.2 million during fiscal 2008 and $212.6 million during fiscal 2007. Investing activities during fiscal 2009 required net cash of $218.8 million, compared to $226.2 million during fiscal 2008 and $204.8 million during fiscal 2007. Capital spending has been financed by cash provided by operating activities along with borrowings under the Company’s credit facility. Financing activities for fiscal 2009 utilized $6.9 million of cash and included an additional $23.9 million of borrowings under the Company’s credit facility. Financing activity also includes $17.5 million for the payment of dividends in fiscal 2009, compared to $23.2 million in fiscal 2008 and $21.1 million in fiscal 2007.
During fiscal 2009, consolidated capital expenditures totaled $209.2 million. Harris Teeter capital expenditures were $206.7 million in fiscal 2009, compared to $192.2 million in fiscal 2008 and $205.5 million in fiscal 2007. A&E's capital expenditures were $2.5 million during fiscal 2009, compared to $7.3 million in fiscal 2008 and $7.7 million in fiscal 2007. In connection with the development of certain of its new stores, Harris Teeter invested an additional $7.6 million which was effectively offset by $7.5 million received from property investment sales and partnership distributions during fiscal 2009. Also in fiscal 2009, A&E invested an additional $8.7 million in Vardhman and an additional $0.7 million in its joint venture in Brazil. Fiscal 2010 consolidated capital expenditures are planned to total approximately $155 million, consisting of $150 million for Harris Teeter and $5 million for A&E. Harris Teeter anticipates that its capital for new store growth and store remodels will be concentrated in its existing markets in fiscal 2010 as well as the foreseeable future. A&E expects to mainly invest in the modernization of its global operations. Such capital investment is expected to be financed by internally generated funds, liquid assets and borrowings under the Company’s credit facility. Management believes that the Company’s revolving line of credit provides sufficient liquidity for what management expects the Company will require through the expiration of the line of credit in December 2012.
The Company’s credit facility was entered into on December 20, 2007 with eleven banks and provides for a five-year revolving credit facility (“Revolving Credit Facility”) in the aggregate amount of up to $350 million and a non-amortizing term loan of $100 million due December 20, 2012. The credit agreement also provides for an optional increase of the Revolving Credit Facility by an additional amount of up to $100 million and two 1-year maturity extension options, both of which require the consent of the lenders. The amount which may be borrowed from time to time and the interest rate on any outstanding borrowings are each dependent on a leverage factor. The leverage factor is based on a ratio of rent-adjusted consolidated funded debt divided by earnings before interest, taxes, depreciation, amortization and operating rents, as set forth in the credit agreement. The more significant of the financial covenants which the Company must meet during the term of the credit agreement include a maximum leverage ratio and a minimum fixed charge coverage ratio. As of September 27, 2009, the Company was in compliance with all financial covenants of the credit agreement and $52.9 million of borrowings were outstanding under the Revolving Credit Facility. Issued letters of credit reduce the amount available for borrowings under the Revolving Credit Facility and amounted to $22.1 million as of September 27, 2009. In addition to the $275.0 million of borrowings available under the Revolving Credit Facility as of September 27, 2009, the Company has the capacity to borrow up to an aggregate amount of $32.3 million from two major U.S. life insurance companies utilizing certain insurance assets as collateral. In the normal course of business, the Company will continue to evaluate other financing opportunities based on the Company’s needs and market conditions.
Covenants in certain of the Company’s long-term debt agreements limit the total indebtedness that the Company may incur. As of September 27, 2009, the amount of additional debt that could be incurred within the limitations of the most restrictive debt covenants exceeded the additional borrowings available under the Revolving Credit Facility. As such, Management believes that the limit on indebtedness does not restrict the Company’s ability to meet future liquidity requirements through borrowings available under the Company’s Revolving Credit Facility, including any liquidity requirements expected in connection with the Company’s expansion plans for the foreseeable future.
19
Contractual Obligations and Commercial Commitments
The Company has assumed various financial obligations and commitments in the normal course of its operations and financing activities. Financial obligations are considered to represent known future cash payments that the Company is required to make under existing contractual arrangements, such as debt and lease agreements. Management expects that cash provided by operations and other sources of liquidity, such as the Company’s Revolving Credit Facility and new sources of financing available to the Company, will be sufficient to meet these obligations on a short and long-term basis. The following table represents the scheduled maturities of the Company’s contractual obligations as of September 27, 2009 (in thousands):
| Less than | More than | |||||||||||||
| Total | 1 Year | 1-3 Years | 3-5 Years | 5 Years | ||||||||||
| Long-Term Debt (1) | $ | 339,377 | $ | 18,698 | $ | 29,857 | $ | 168,882 | $ | 121,940 | ||||
| Operating Leases (1) (2) | 1,467,802 | 93,876 | 191,287 | 193,898 | 988,741 | |||||||||
| Capital Lease Obligations (1) (2) | 202,353 | 9,651 | 21,349 | 21,436 | 149,917 | |||||||||
| Purchase Obligations – Fixed Assets | 39,326 | 39,326 | - | - | - | |||||||||
| Purchase Obligations – Inventory | 948 | 948 | - | - | - | |||||||||
| Purchase Obligations – Service Contracts/Other | 17,030 | 7,119 | 7,754 | 2,157 | - | |||||||||
| Unrecognized Tax Liability (3) | 5,003 | 1,967 | 3,036 | - | - | |||||||||
| Other (4) | 14,833 | 1,609 | 3,195 | 2,957 | 7,072 | |||||||||
| Total Contractual Cash Obligations | $ | 2,086,672 | $ | 173,194 | $ | 256,478 | $ | 389,330 | $ | 1,267,670 | ||||
| (1) | For a more detailed description of the obligations refer to the Notes entitled “Leases” and “Long-Term Debt” of the Notes to Consolidated Financial Statements in Item 8 hereof. Amounts represent total expected payments of principal and interest. Payment on variable interest debt is estimated using an interest rate of 2.0% applied to the outstanding balance. | |
| (2) | Represents the minimum rents payable and includes leases associated with closed stores. The obligations related to the closed store leases are discussed below. Amounts are not offset by expected sublease income and do not include various contingent liabilities associated with assigned leases as discussed below. | |
| (3) | For a more detailed description of the obligation refer to the Note entitled “Income Taxes” of the Notes to Consolidated Financial Statements in Item 8 hereof. The timing of payment, if any, for the unrecognized tax liability is not certain. However, we believe that we could possibly reach a settlement or resolution on the tax issues within the next three years. | |
| (4) | Represents the projected cash payments associated with certain deferred compensation contracts. The net present value of these obligations is recorded by the Company and included with other long-term liabilities in the Company’s consolidated balance sheets. | |
In connection with the closing of certain store locations, Harris Teeter has assigned leases to several sub-tenants with recourse. These leases expire over the next 12 years, and the future minimum lease payments of approximately $51.2 million, in the aggregate, over that future period have been assumed by these sub-tenants In the unlikely event, in management's opinion based on the current operations and credit worthiness of the assignees, that all such contingent obligations would be payable by Harris Teeter, the approximate aggregate amounts due by year would be as follows: $8.0 million in fiscal 2010 (25 stores), $7.6 million in fiscal 2011 (22 stores), $7.3 million in fiscal 2012 (21 stores), $6.1 million in fiscal 2013 (17 stores), $5.2 million in fiscal 2014 (14 stores) and $17.0 million in aggregate during all remaining years thereafter.
The Company utilizes various standby letters of credit and bonds as required from time to time by certain programs, most significantly for self-insured programs such as workers compensation and various casualty insurance. These letters of credit and bonds do not represent additional obligations of the Company since the underlying liabilities are recorded as insurance reserves and included with other current liabilities on the Company’s consolidated balance sheets. In addition, the Company occasionally utilizes documentary letters of credit for the purchase of merchandise in the normal course of business. Issued and outstanding letters of credit totaled $22.1 million at September 27, 2009.
Off Balance Sheet Arrangements
The Company is not a party to any off-balance sheet arrangements that have, or are reasonably likely to have, a current or future material effect on the Company’s financial condition, results of operations or cash flows.
20
Critical Accounting Policies
The preparation of financial statements in conformity with generally accepted accounting principles requires management to make estimates and assumptions about future events that affect the reported amounts of assets, liabilities, revenues and expenses and the disclosures of contingent assets and liabilities. Future events and their effects cannot be determined with absolute certainty. Therefore, management’s determination of estimates and judgments about the carrying values of assets and liabilities requires the exercise of judgment in the selection and application of assumptions based on various factors including historical experience, current and expected economic conditions and other factors believed to be reasonable under the circumstances. Actual results could differ from those estimates. The Company constantly reviews the relevant, significant factors and makes adjustments where the facts and circumstances dictate.
Management has identified the following accounting policies as the most critical in the preparation of the Company’s financial statements because they involve the most difficult, subjective or complex judgments about the effect of matters that are inherently uncertain.
Vendor Rebates, Credits and Promotional Allowances
Consistent with standard practices in the retail industry, Harris Teeter receives allowances from vendors through a variety of programs and arrangements. Given the highly promotional nature of the retail supermarket industry, the allowances are generally intended to defray the costs of promotion, advertising and selling the vendor’s products. Examples of such arrangements include, but are not limited to, promotional, markdown and rebate allowances; cooperative advertising funds; volume allowances; store opening discounts and support; and slotting, stocking and display allowances. The amount of such allowances may be determined on the basis of (1) a fixed dollar amount negotiated with the vendor, (2) an amount per unit purchased or as a percentage of total purchases from the vendor, or (3) amounts based on sales to the customer, number of stores, in-store displays or advertising. The proper recognition and timing of accounting for these items are significant to the reporting of the results of operations of the Company. The Company applies the authoritative guidance of the Securities and Exchange Commission’s Staff Accounting Bulletin No. 104 (“SAB No. 104”) – Revenue Recognition, Subtopic 605-50 of the Financial Accounting Standards Board (“FASB”) Accounting Standards Codification (“ASC”), and other authoritative guidance as appropriate. Under SAB No. 104, revenue recognition requires, as a prerequisite, the completion of the earnings process and its realization or assurance of realizability. Vendor rebates, credits and other promotional allowances that relate to Harris Teeter’s buying and merchandising activities, including lump-sum payments associated with long-term contracts, are recorded as a component of cost of sales as they are earned, the recognition of which is determined in accordance with the underlying agreement with the vendor, the authoritative guidance and completion of the earning process. Portions of vendor allowances that are refundable to the vendor, in whole or in part, by the nature of the provisions of the contract are deferred from recognition until realization is reasonably assured.
Harris Teeter’s practices are in accordance with ASC topic 605-50 and are based on the premise that the accounting for these vendor allowances should follow the economic substance of the underlying transactions, which is evidenced by the agreement with the vendor as long as the allowance is distinguishable from the merchandise purchase. Consistent with this premise, Harris Teeter recognizes allowances when the purpose for which the vendor funds were intended and committed to be used has been fulfilled and a cost has been incurred by the retailer. Thus, it is the Company’s policy to recognize the vendor allowance consistent with the timing of the recognition of the expense that the allowance is intended to reimburse and to determine the accounting classification consistent with the economic substance of the underlying transaction. Where the Company provides an identifiable benefit or service to the vendor apart from the purchase of merchandise, that transaction is recorded separately. For example, co-operative advertising allowances are accounted for as a reduction of advertising expense in the period in which the advertising cost is incurred. If the advertising allowance exceeds the cost of advertising, then the excess is recorded against the cost of sales in the period in which the related expense is recognized.
There are numerous types of rebates and allowances in the retail industry. The Company’s accounting practices with regard to some of the more typical arrangements are discussed as follows. Vendor allowances for price markdowns are credited to the cost of sales during the period in which the related markdown was taken and charged to the cost of sales. Slotting and stocking allowances received from a vendor to ensure that its products are carried or to introduce a new product at the Company’s stores are recorded as a reduction of cost of sales over the period covered by the agreement with the vendor based on the estimated inventory turns of the merchandise to which the allowance applies. Display allowances are recognized as a reduction of cost of sales in the period earned in accordance with the vendor agreement based on the estimated inventory turns of the merchandise to which the allowance applies. Volume rebates by the vendor in the form of a reduction of the purchase price of the merchandise reduce the cost of sales when the related merchandise is sold. Generally, volume rebates under a structured purchase program with allowances awarded based on the level of purchases are recognized, when realization is assured, as a reduction in the cost of sales in the appropriate monthly period based on the actual level of purchases in the period relative to the total purchase commitment and adjusted for the estimated inventory turns of the merchandise. Some of these typical vendor rebate, credit and promotional allowance arrangements require that the Company make assumptions and judgments regarding, for example, the likelihood of attaining specified levels of purchases or selling specified volumes of products, the duration of carrying a specified product and the estimation of inventory turns. The Company constantly reviews the relevant, significant factors and makes adjustments where the facts and circumstances dictate.
21
Inventory Valuation
The inventories of the Company’s operating subsidiaries are valued at the lower of cost or market with the cost of substantially all domestic U.S. inventories being determined using the last-in, first-out (LIFO) method. Foreign inventories and limited categories of domestic inventories are valued on the weighted average and on the first-in, first-out (FIFO) cost methods. LIFO assumes that the last costs in are the ones that should be used to measure the cost of goods sold, leaving the earlier costs residing in the ending inventory valuation. The Company uses the “link chain” method of computing dollar value LIFO whereby the base year values of beginning and ending inventories are determined using a cumulative price index. The Company generates an estimated internal index to “link” current costs to the original costs of the base years in which the Company adopted LIFO. The Company’s determination of the LIFO index is driven by the change in current year costs, as well as the change in inventory quantities on hand. Under the LIFO valuation method at Harris Teeter, all retail store inventories are initially stated at estimated cost as calculated by the Retail Inventory Method (RIM). Under RIM, the valuation of inventories at cost and the resulting gross margins are calculated by applying a calculated cost-to-retail ratio to the retail value of inventories. RIM is an averaging method that has been widely used in the retail industry due to its practicality. Inherent in the RIM calculation are certain significant management judgments and estimates, including markups, markdowns, lost inventory (shrinkage) percentages and the purity and similarity of inventory sub-categories as to their relative inventory turns, gross margins and on hand quantities. These judgments and estimates significantly impact the ending inventory valuation at cost, as well as gross margin. Management believes that the Company’s RIM provides an inventory valuation which reasonably approximates cost and results in carrying the inventory at the lower of cost or market. Management does not believe that the likelihood is significant that materially higher LIFO reserves are required given its current expectations of on-hand inventory quantities and costs.
The proper valuation of inventory also requires management to estimate the net realizable value of the Company’s obsolete and slow-moving inventory at the end of each period. Management bases its net realizable values upon many factors including historical recovery rates, the aging of inventories on hand, the inventory movement of specific products and the current economic conditions. When management has determined inventory to be obsolete or slow moving, the inventory is reduced to its net realizable value by recording an obsolescence reserve. Given the Company’s experiences in selling obsolete and slow-moving inventory, management believes that the amounts of the obsolescence reserves to the carrying values of its inventories are materially adequate.
With regard to the proper valuations of inventories, management reviews its judgments, assumptions and other relevant, significant factors on a routine basis and makes adjustments where the facts and circumstances dictate.
Self-insurance Reserves for Workers’ Compensation, Healthcare and General Liability
The Company is primarily self-insured for most U.S. workers’ compensation claims, healthcare claims and general liability and automotive liability losses. The Company has purchased insurance coverage in order to establish certain limits to its exposure on a per claim basis.
Actual U.S. workers’ compensation claims, and general liability and automotive liability losses, are reported to the Company by third party administrators. The third party administrators also report initial estimates of related loss reserves. The open claims and initial loss reserves are subjected to examination by the Company’s risk management and accounting management utilizing a consistent methodology which involves various assumptions, judgment and other factors. Such factors include but are not limited to the probability of settlement, the amount at which settlement can be achieved, the probable duration of the claim, the cost development pattern of the claim and the applicable cost development factor. The Company determines the estimated reserve required for U.S. worker compensation claims in each accounting period. This requires that management determine estimates of the costs of claims incurred and accrue for such expenses in the period in which the claims are incurred. The Company measures the liabilities associated with claims for workers’ compensation, general liability and automotive liability at Harris Teeter through the use of actuarial methods to project an estimate of ultimate cost for claims incurred. The estimated cost for claims incurred are discounted to present values using a discount rate representing a return on high-quality fixed income securities with an average maturity equal to the average payout of the related liability. Harris Teeter liabilities represent approximately 95% of the total Company self-insurance reserves for workers compensation, general liability and automotive liability claims. For liabilities associated with A&E’s workers’ compensation, general liability and automotive liability claims, management estimates the ultimate cost for claims incurred based on actual claims, reviewed for the status and probabilities associated with potential settlement and then adjusts them by development factors from published insurance industry sources. The Company constantly reviews the relevant, significant factors and makes adjustments where the facts and circumstances dictate. Management does not believe the likelihood is significant that existing worker compensation claims, general liability claims and automotive liability claims will be settled for materially higher amounts than those accrued.
22
The variety of healthcare plans available to employees are primarily self-insured, although some locations have insured health maintenance organization plans. The Company records an accrual for the estimated amount of self-insured healthcare claims incurred by all participants but not yet reported (IBNR) using an actuarial method of applying a development factor to the reported claims amount. The most significant factors which impact on the determination of the required accrual are the historical pattern of the timeliness of claims processing, changes in the nature or types of benefit plans, changes in the plan benefit designs, employer-employee cost sharing factors, and medical trends and inflation. Historical experience and industry trends are continually monitored, and accruals are adjusted when warranted by changes in facts and circumstances. The Company believes that the total healthcare cost accruals are reasonable and adequate to cover future payments on pre-existing claims.
Impairment of Long-lived Assets and Closed Store Obligations
The Company assesses its long-lived assets for possible impairment whenever events or changes in circumstances indicate the carrying value of an asset may not be recoverable. Recoverability is measured by a comparison of the carrying amount to the net non-discounted cash flows expected to be generated by the asset. An impairment loss is recognized for any excess of net book value over the estimated fair value of the asset impaired. The fair value is estimated based on expected future cash flows.
The value of property and equipment associated with closed stores and facilities is adjusted to reflect recoverable values based on the Company's prior history of disposing of similar assets and current economic conditions. Management continually reviews its fair value estimates and records impairment charges for assets held for sale when management determines, based on new information which it believes to be reliable, that such charges are appropriate.
The results of impairment tests are subject to management's estimates and assumptions of projected cash flows and operating results. The Company believes that, based on current estimates and assumptions of projected cash flows, materially different reported results are not likely to result from long-lived asset impairments. However, a change in assumptions or market conditions could result in a change in estimated future cash flows and the likelihood of materially different reported results.
The Company records liabilities for closed stores that are under long-term lease agreements. The liability represents an estimate of the present value of the remaining non-cancelable lease payments after the anticipated closing date, net of estimated subtenant income. The closed store liabilities usually are paid over the lease terms associated with the closed stores, unless settled earlier. Harris Teeter management estimates the subtenant income and future cash flows based on its historical experience and knowledge of (1) the market in which the store is located, (2) the results of its previous efforts to dispose of similar assets and (3) the current economic conditions. The actual cost of disposition for these leases is affected by specific real estate markets, inflation rates and general economic conditions and may differ significantly from those assumed and estimated.
Store closings generally are completed within one year after the decision to close. Adjustments to closed store liabilities primarily relate to changes in subtenants and actual costs differing from original estimates. Adjustments are made for changes in estimates in the period in which the change becomes known. Any excess store closing liability remaining upon settlement of the obligation is reversed to income in the period that such settlement is determined. The Company constantly reviews the relevant, significant factors used in its estimates and makes adjustments where the facts and circumstances dictate.
Retirement Plans and Post-Retirement Benefit Plans
The Company maintains certain retirement benefit plans for substantially all domestic full-time employees and supplemental retirement benefit plans for certain selected directors and officers of the Company and its subsidiaries. Employees in foreign subsidiaries participate to varying degrees in local pension plans, which, in the aggregate, are not significant. The qualified pension plan is a non-contributory, funded defined benefit plan, while the non-qualified supplemental retirement benefit plans are unfunded, defined benefit plans. The Company’s current funding policy for its qualified pension plan is to contribute annually an amount in excess of the contributions required by regulatory authorities to meet minimum funding requirements, as determined by its actuaries to be effective in increasing the funding ratios and reducing the volatility of future contributions.
23
The Company has certain deferred compensation arrangements which allow or allowed in prior years its directors, officers and selected key management personnel to forego the receipt of earned compensation for specified periods of time. The Company may also, from time to time, make discretionary annual contributions into the Director Deferral Plan on behalf of its outside directors. These plans are unfunded. The Company utilizes a rabbi trust to hold assets set aside to pay the respective liabilities of these plans. For further disclosures regarding the Company’s pension and deferred compensation plans, see the Note entitled “Employee Benefit Plans” of the Notes to Consolidated Financial Statements in Item 8 hereof.
The Company maintains a post-retirement healthcare plan for retirees whose sum of age and years of service equal at least 75 at retirement. The plan continues coverage from early retirement date until the earlier date of eligibility for Medicare or any other employer’s medical plan. The Company requires that the retiree pay the estimated full cost of the coverage. The Company also provides a $5,000 post-retirement mortality benefit to a small number of retirees under a prior plan. The obligations and expenses associated with each of these benefit plans are not material.
The determination of the Company’s obligation and expense for pension, deferred compensation and other post-retirement benefits is dependent on certain assumptions selected by management and used by the Company and its actuaries in calculating such amounts. The more significant of those assumptions applicable to the qualified pension plan include the discount rate, the expected long-term rate of return on plan assets, the rates of increase in future compensation and the rates of future employee turnover. Those assumptions also apply to determinations of the obligations and expense of the following plans, except as noted: (1) supplemental pension – no funded assets to be measured, and (2) deferred compensation arrangement and post-retirement mortality benefit – no funded assets to be measured and no dependency on future rates of compensation or turnover.
In accordance with generally accepted accounting principles, actual results that differ from management’s assumptions are accumulated and amortized over future periods and, therefore, generally affect the Company’s recognized expense and recorded obligation in such future periods. While management believes that its selections of values for the various assumptions are appropriate, significant differences in actual experience or significant changes in the assumptions may materially affect pension and other post-retirement obligations and future expense.
Recent Accounting Standards
The FASB Accounting Standards Codification (“ASC”) became effective for the Company as of its fiscal year ending September 27, 2009. The ASC is now the authoritative reference for nongovernment U.S. GAAP, except for Securities and Exchange Commission (“SEC”) rules and interpretive releases, which are also authoritative GAAP for SEC registrants. The ASC brings together in one place all authoritative GAAP previously in the superseded GAAP hierarchy that has been issued by standard setters, e.g., FASB Statements, FASB Interpretations, EITF Abstracts, FASB Staff Positions, and AICPA Statements of Position and Audit and Accounting Guides. Nonauthoritative GAAP includes items previously in the GAAP hierarchy’s lowest level (e.g., prevalent industry practice) and other accounting guidance, such as textbooks and articles. Going forward, accounting pronouncements issued by the FASB will be called Accounting Standards Updates (“ASU”).
In December 2007, the FASB issued an update to its authoritative literature for business combinations. The guidance is incorporated in ASC Subtopic 805-10 and requires most identifiable assets, liabilities, noncontrolling interest, and goodwill acquired in a business combination to be recorded at “full fair value.” The updated standard applies to all business combinations, including combinations among mutual entities and combinations by contract alone. The updated standards become effective for the Company’s 2010 fiscal year beginning on September 28, 2009 and will be applied to business combinations occurring after the effective date.
In December 2007, the FASB issued an update to its authoritative literature for reporting noncontrolling interest in consolidated financial statements. The guidance is incorporated in ASC Subtopic 810-10 and requires noncontrolling interest (previously referred to as minority interests) to be treated as a separate component of equity, not as a liability or other item outside of permanent equity. The updated standard applies to the accounting for noncontrolling interest and transactions with noncontrolling interest holders in consolidated financial statements and will become effective for the Company’s 2010 fiscal year beginning on September 28, 2009. Compliance with the updated standard is not expected to have a material impact on the Company’s results of operations, financial position or cash flows.
24
In November 2008, the FASB ratified the consensus reached by the Task Force in EITF Issue No. 08-6 regarding investments accounted for under the equity method. The guidance is incorporated in ASC Subtopic 323-10 and applies to all investments accounted for under the equity method and clarifies the accounting for certain transactions and impairment considerations involving those investments. The updated standards become effective for the Company’s 2010 fiscal year beginning on September 28, 2009. Compliance with the updated standard is not expected to have a material impact on the Company’s results of operations, financial position or cash flows.
In December 2008, the FASB issued an update to its authoritative literature for disclosures about pensions and other postretirement benefits. The guidance is incorporated in ASC Sections 715-20-50 and 55, and requires employers to disclose more information about how investment allocation decisions are made, more information about major categories of plan assets, including concentrations of risk and fair-value measurements, and the fair-value techniques and inputs used to measure plan assets. The updated disclosure requirements become effective for the Company’s 2010 fiscal year ending on October 3, 2010.
In June 2009, the FASB issued an update to its authoritative literature for the consolidation of variable interest entities (“VIE”). The guidance is incorporated in ASC Topic 810 and requires reporting entities to evaluate former qualifying special purpose entities for consolidation, changes the approach to determining a VIE’s primary beneficiary from a quantitative assessment to a qualitative assessment designed to identify a controlling financial interest, and increases the frequency of required reassessments to determine whether a company is the primary beneficiary of a VIE. It also clarifies, but does not significantly change, the characteristics that identify a VIE. The new guidance also requires additional year-end and interim disclosures. The updated standards become effective for the Company’s 2011 fiscal year beginning on October 4, 2010. The Company is currently evaluating the impact of the updated standards on its consolidated financial statements.
Item 7A. Quantitative and Qualitative Disclosures about Market Risk
The Company does not utilize financial instruments for trading or other speculative purposes, nor does it utilize leveraged financial instruments. The Company’s exposure to market risks results primarily from changes in interest rates. Generally, the fair value of debt with a fixed interest rate will increase as interest rates fall, and the fair value will decrease as interest rates rise. As of September 27, 2009, the Company had no significant foreign exchange exposure and two interest rate swap agreements accounted for as cash flow hedge derivatives.
The table below presents principal cash flows and related weighted average interest rates by expected maturity dates for the Company’s Senior Notes due at various dates through 2017 (which accounts for 99% of the Company’s fixed interest debt obligations):
| 2010 | 2011 | 2012 | 2013 | 2014 | Thereafter | Total | Fair Value | ||||||||||||||||
| Senior Notes | $ | 7,143 | $ | 7,142 | $ | - | $ | - | $ | - | $ | 100,000 | $ | 114,285 | $ | 134,322 | |||||||
| Weighted average interest rate | 6.48% | 6.48% | - | - | - | 7.64% | 7.49% | ||||||||||||||||
For a more detail description of fair value, refer to the Note entitled “Financial Instruments” of the Notes to Consolidated Financial Statements in Item 8 hereof.
During fiscal 2009, the Company entered into two separate three-year interest rate swap agreements with an aggregate notional amount of $80 million. The swap agreements effectively fixed the interest rate on $80 million of the Company’s term loan, of which $40 million is at 1.81% and $40 million is at 1.80%, excluding the applicable margin and associated fees. The fair value of these derivatives are recorded on the balance sheet at their respective fair value and amounted to a liability of $586,000 as of September 27, 2009. For a more detail description of fair value, refer to the Note entitled “Derivatives” of the Notes to Consolidated Financial Statements in Item 8 hereof.
25
Item 8. Financial Statements and Supplementary Data
RUDDICK CORPORATION
AND
CONSOLIDATED SUBSIDIARIES
INDEX TO CONSOLIDATED FINANCIAL STATEMENTS AND SCHEDULE
| Page | |
| Reports of Independent Registered Public Accounting Firm | 27 |
| Consolidated Balance Sheets, September 27, 2009 and September 28, 2008 | 29 |
| Statements of Consolidated Income for the fiscal years ended September 27, 2009, | |
| September 28, 2008 and September 30, 2007 | 30 |
| Statements of Consolidated Shareholders’ Equity and Comprehensive Income for the | |
| fiscal years ended September 27, 2009, September 28, 2008 and September 30, 2007 | 31 |
| Statements of Consolidated Cash Flows for the fiscal years ended September 27, 2009, | |
| September 28, 2008 and September 30, 2007 | 32 |
| Notes to Consolidated Financial Statements | 33 |
| Schedule I- Valuation and Qualifying Accounts and Reserves for the fiscal | |
| years ended September 27, 2009, September 28, 2008 and September 30, 2007 | S-1 |
26
Report of Independent Registered Public Accounting Firm
The Board of Directors and
Shareholders
Ruddick Corporation:
We have audited the accompanying consolidated balance sheets of Ruddick Corporation and subsidiaries (the Company) as of September 27, 2009 and September 28, 2008, and the related consolidated statements of income, shareholders’ equity and comprehensive income, and cash flows for each of the years in the three-year period ended September 27, 2009. In connection with our audits of the consolidated financial statements, we also have audited the financial statement schedule “Valuation and Qualifying Accounts and Reserves.” These consolidated financial statements and financial statement schedule are the responsibility of the Company’s management. Our responsibility is to express an opinion on these consolidated financial statements and financial statement schedule based on our audits.
We conducted our audits in accordance with the standards of the Public Company Accounting Oversight Board (United States). Those standards require that we plan and perform the audit to obtain reasonable assurance about whether the financial statements are free of material misstatement. An audit includes examining, on a test basis, evidence supporting the amounts and disclosures in the financial statements. An audit also includes assessing the accounting principles used and significant estimates made by management, as well as evaluating the overall financial statement presentation. We believe that our audits provide a reasonable basis for our opinion.
In our opinion, the consolidated financial statements referred to above present fairly, in all material respects, the financial position of the Company and subsidiaries as of September 27, 2009 and September 28, 2008, and the results of their operations and their cash flows for each of the years in the three-year period ended September 27, 2009, in conformity with U.S. generally accepted accounting principles. Also in our opinion, the related financial statement schedule, when considered in relation to the basic consolidated financial statements taken as a whole, present fairly, in all material respects, the information set forth therein.
We also have audited, in accordance with the standards of the Public Company Accounting Oversight Board (United States), the Company’s internal control over financial reporting as of September 27, 2009, based on criteria established in “Internal Control – Integrated Framework issued by the Committee of Sponsoring Organizations of the Treadway Commission (COSO),” and our report dated November 20, 2009, expressed, an unqualified opinion on the effectiveness of the Company’s internal control over financial reporting.
As discussed in the notes to the consolidated financial statements, the Company has changed its method of accounting for uncertain tax positions effective October 1, 2007, due to the adoption of Accounting Standards Codification Subtopic 740-10.
/s/ KPMG LLP
Charlotte, North Carolina
November 20, 2009
27
Report of Independent Registered Public Accounting Firm
The Board of Directors and
Shareholders
Ruddick Corporation:
We have audited Ruddick Corporation and subsidiaries’ (the Company) internal control over financial reporting as of September 27, 2009, based on criteria established in “Internal Control – Integrated Framework” issued by the Committee of Sponsoring Organizations of the Treadway Commission (COSO). The Company’s management is responsible for maintaining effective internal control over financial reporting and for its assessment of the effectiveness of internal control over financial reporting, included in the accompanying Management’s Annual Report on Internal Controls over Financial Reporting. Our responsibility is to express an opinion on the Company’s internal control over financial reporting based on our audit.
We conducted our audit in accordance with the standards of the Public Company Accounting Oversight Board (United States). Those standards require that we plan and perform the audit to obtain reasonable assurance about whether effective internal control over financial reporting was maintained in all material respects. Our audit included obtaining an understanding of internal control over financial reporting, assessing the risk that a material weakness exists, and testing and evaluating the design and operating effectiveness of internal control based on the assessed risk. Our audit also included performing such other procedures as we considered necessary in the circumstances. We believe that our audit provides a reasonable basis for our opinion.
A company’s internal control over financial reporting is a process designed to provide reasonable assurance regarding the reliability of financial reporting and the preparation of financial statements for external purposes in accordance with generally accepted accounting principles. A company’s internal control over financial reporting includes those policies and procedures that (1) pertain to the maintenance of records that, in reasonable detail, accurately and fairly reflect the transactions and dispositions of the assets of the company; (2) provide reasonable assurance that transactions are recorded as necessary to permit preparation of financial statements in accordance with generally accepted accounting principles, and that receipts and expenditures of the company are being made only in accordance with authorizations of management and directors of the company; and (3) provide reasonable assurance regarding prevention or timely detection of unauthorized acquisition, use, or disposition of the company’s assets that could have a material effect on the financial statements.
Because of its inherent limitations, internal control over financial reporting may not prevent or detect misstatements. Also, projections of any evaluation of effectiveness to future periods are subject to the risk that controls may become inadequate because of changes in conditions, or that the degree of compliance with the policies or procedures may deteriorate.
In our opinion, the Company maintained, in all material respects, effective internal control over financial reporting as of September 27, 2009, based on criteria established in “Internal Control – Integrated Framework” issued by the Committee of Sponsoring Organizations of the Treadway Commission.
We also have audited, in accordance with the standards of the Public Company Accounting Oversight Board (United States), the consolidated balance sheets of Ruddick Corporation and subsidiaries as of September 27, 2009 and September 28, 2008, and the related consolidated statements of operations, shareholders’ equity and comprehensive income, and cash flows for each of the years in the three-year period ended September 27, 2009, and our report dated November 20, 2009 expressed an unqualified opinion on those consolidated financial statements.
/s/ KPMG LLP
Charlotte, North Carolina
November 20, 2009
28
CONSOLIDATED BALANCE
SHEETS
RUDDICK CORPORATION AND
SUBSIDIARIES
(dollars in thousands)
| September 27, | September 28, | ||||||
| 2009 | 2008 | ||||||
| ASSETS | |||||||
| Current Assets | |||||||
| Cash and Cash Equivalents | $ | 37,310 | $ | 29,759 | |||
| Accounts Receivable, Net of Allowance For Doubtful Accounts of $3,690 and $2,819 | 80,146 | 91,528 | |||||
| Refundable Income Taxes | 9,707 | 8,607 | |||||
| Inventories | 310,271 | 312,589 | |||||
| Deferred Income Taxes | 6,502 | 6,477 | |||||
| Prepaid Expenses and Other Current Assets | 30,350 | 28,196 | |||||
| Total Current Assets | 474,286 | 477,156 | |||||
| Property | |||||||
| Land | 21,430 | 21,375 | |||||
| Buildings and Improvements | 270,145 | 238,413 | |||||
| Machinery and Equipment | 1,000,886 | 942,213 | |||||
| Leasehold Improvements | 734,073 | 619,677 | |||||
| Total, at Cost | 2,026,534 | 1,821,678 | |||||
| Accumulated Depreciation and Amortization | 946,208 | 854,347 | |||||
| Property, Net | 1,080,326 | 967,331 | |||||
| Investments | 156,434 | 143,902 | |||||
| Deferred Income Taxes | 30,285 | 361 | |||||
| Goodwill | 515 | 8,169 | |||||
| Intangible Assets | 23,754 | 26,355 | |||||
| Other Long-Term Assets | 78,721 | 73,133 | |||||
| Total Assets | $ | 1,844,321 | $ | 1,696,407 | |||
| LIABILITIES AND SHAREHOLDERS' EQUITY | |||||||
| Current Liabilities | |||||||
| Notes Payable | $ | 7,056 | $ | 11,150 | |||
| Current Portion of Long-Term Debt and Capital Lease Obligations | 9,526 | 9,625 | |||||
| Accounts Payable | 227,901 | 236,649 | |||||
| Dividends Payable | 5,825 | - | |||||
| Deferred Income Taxes | 68 | 347 | |||||
| Accrued Compensation | 65,295 | 63,826 | |||||
| Other Current Liabilities | 87,194 | 89,206 | |||||
| Total Current Liabilities | 402,865 | 410,803 | |||||
| Long-Term Debt and Capital Lease Obligations | 355,561 | 310,953 | |||||
| Deferred Income Taxes | 580 | 10,877 | |||||
| Pension Liabilities | 168,060 | 44,306 | |||||
| Other Long-Term Liabilities | 98,892 | 89,685 | |||||
| Minority Interest | 6,184 | 5,948 | |||||
| Commitments and Contingencies | - | - | |||||
| Shareholders' Equity | |||||||
| Common Stock, no par value - Shares Outstanding: 2009 – 48,545,080 | |||||||
| 2008 – 48,278,136 | 89,878 | 83,252 | |||||
| Retained Earnings | 830,236 | 767,562 | |||||
| Accumulated Other Comprehensive Loss | (107,935 | ) | (26,979 | ) | |||
| Total Shareholders' Equity | 812,179 | 823,835 | |||||
| Total Liabilities and Shareholders' Equity | $ | 1,844,321 | $ | 1,696,407 | |||
See Notes to Consolidated Financial Statements
29
STATEMENTS OF CONSOLIDATED
INCOME
RUDDICK CORPORATION AND SUBSIDIARIES
(dollars in thousands, except
per share data)
| 52 Weeks Ended | 52 Weeks Ended | 52 Weeks Ended | |||||||||
| September 27, | September 28, | September 30, | |||||||||
| 2009 | 2008 | 2007 | |||||||||
| Net Sales | $ | 4,077,822 | $ | 3,992,397 | $ | 3,639,208 | |||||
| Cost of Sales | 2,860,465 | 2,783,950 | 2,542,861 | ||||||||
| Selling, General and Administrative Expenses | 1,052,615 | 1,034,662 | 948,173 | ||||||||
| Goodwill Impairment Charge | 7,654 | - | - | ||||||||
| Long-Lived Asset Impairment Charge | 2,237 | - | - | ||||||||
| Operating Profit | 154,851 | 173,785 | 148,174 | ||||||||
| Interest Expense | 17,307 | 20,334 | 17,654 | ||||||||
| Interest Income | (493 | ) | (1,185 | ) | (307 | ) | |||||
| Net Investment (Gain) Loss | (746 | ) | 41 | (228 | ) | ||||||
| Minority Interest | 594 | 484 | 564 | ||||||||
| Income Before Taxes | 138,189 | 154,111 | 130,491 | ||||||||
| Income Tax Expense | 52,225 | 57,359 | 49,803 | ||||||||
| Net Income | $ | 85,964 | $ | 96,752 | $ | 80,688 | |||||
| Net Income Per Share: | |||||||||||
| Basic | $ | 1.79 | $ | 2.02 | $ | 1.69 | |||||
| Diluted | $ | 1.78 | $ | 2.00 | $ | 1.68 | |||||
| Weighted Average Number of Shares of Common Stock Outstanding: | |||||||||||
| Basic | 47,964 | 47,824 | 47,605 | ||||||||
| Diluted | 48,337 | 48,295 | 48,139 | ||||||||
See Notes to Consolidated Financial Statements
30
STATEMENTS OF CONSOLIDATED SHAREHOLDERS' EQUITY
AND COMPREHENSIVE INCOME
RUDDICK CORPORATION AND
SUBSIDIARIES
(dollars in thousands, except share
and per share amounts)
| Common Stock | Accumulated Other | Total | |||||||||||||||||||
| Shares | Common | Retained | Comprehensive | Shareholders' | Comprehensive | ||||||||||||||||
| (No Par Value) | Stock | Earnings | Income (Loss) | Equity | Income | ||||||||||||||||
| Balance at October 1, 2006 | 47,557,894 | $ | 70,729 | $ | 634,422 | $ | (34,634 | ) | $ | 670,517 | |||||||||||
| Exercise of Stock Options, Including | |||||||||||||||||||||
| Tax Benefits of $1,820 | 400,262 | 7,531 | - | - | 7,531 | ||||||||||||||||
| Directors' stock plan | - | 1 | - | - | 1 | ||||||||||||||||
| Share-Based Compensation | 184,365 | 3,853 | - | - | 3,853 | ||||||||||||||||
| Shares Effectively Purchased and | |||||||||||||||||||||
| Retired for Withholding Taxes | (15,269 | ) | (437 | ) | - | - | (437 | ) | |||||||||||||
| Net Earnings | - | - | 80,688 | - | 80,688 | $ | 80,688 | ||||||||||||||
| Dividends ($0.44 a Share) | - | - | (21,118 | ) | - | (21,118 | ) | ||||||||||||||
| Foreign Currency Translation | |||||||||||||||||||||
| Adjustment, Net of $298 for Taxes | - | - | - | 3,617 | 3,617 | 3,617 | |||||||||||||||
| Pension Liability Adjustment, | |||||||||||||||||||||
| Net of $10,774 for Taxes | - | - | - | 16,881 | 16,881 | 16,881 | |||||||||||||||
| Impact of SFAS 158 Adoption, | |||||||||||||||||||||
| Net of Tax Benefits of $16,072 | - | - | - | (24,923 | ) | (24,923 | ) | - | |||||||||||||
| Balance at September 30, 2007 | 48,127,252 | 81,677 | 693,992 | (39,059 | ) | 736,610 | $ | 101,186 | |||||||||||||
| Exercise of Stock Options, Including | |||||||||||||||||||||
| Tax Benefits of $1,917 | 233,158 | 5,276 | - | - | 5,276 | ||||||||||||||||
| Directors' Stock Plan | - | (12 | ) | - | - | (12 | ) | ||||||||||||||
| Share-Based Compensation | 196,494 | 5,376 | - | - | 5,376 | ||||||||||||||||
| Shares Effectively Purchased and | |||||||||||||||||||||
| Retired for Withholding Taxes | (29,168 | ) | (1,065 | ) | - | - | (1,065 | ) | |||||||||||||
| Shares Purchased and Retired | (249,600 | ) | (8,000 | ) | - | - | (8,000 | ) | |||||||||||||
| Net Earnings | - | - | 96,752 | - | 96,752 | $ | 96,752 | ||||||||||||||
| Dividends ($0.48 a Share) | - | - | (23,182 | ) | - | (23,182 | ) | ||||||||||||||
| Foreign Currency Translation | |||||||||||||||||||||
| Adjustment, Net of $384 for Taxes | - | - | - | 1,079 | 1,079 | 1,079 | |||||||||||||||
| Pension Liability Adjustment, | |||||||||||||||||||||
| Net of $6,988 for Taxes | - | - | - | 10,855 | 10,855 | 10,855 | |||||||||||||||
| Postemployment Benefits Liability | |||||||||||||||||||||
| Adjustment, Net of $95 for Taxes | - | - | - | 146 | 146 | 146 | |||||||||||||||
| Balance at September 28, 2008 | 48,278,136 | 83,252 | 767,562 | (26,979 | ) | 823,835 | $ | 108,832 | |||||||||||||
| Exercise of Stock Options, Including | |||||||||||||||||||||
| Tax Benefits of $482 | 104,199 | 2,080 | - | - | 2,080 | ||||||||||||||||
| Share-Based Compensation | 206,259 | 5,722 | - | - | 5,722 | ||||||||||||||||
| Shares Effectively Purchased and | |||||||||||||||||||||
| Retired for Withholding Taxes | (43,514 | ) | (1,176 | ) | - | - | (1,176 | ) | |||||||||||||
| Net Earnings | - | - | 85,964 | - | 85,964 | $ | 85,964 | ||||||||||||||
| Dividends ($0.48 a Share) | - | - | (23,290 | ) | - | (23,290 | ) | ||||||||||||||
| Foreign Currency Translation Adj., | |||||||||||||||||||||
| Adjustment, Including $400 for Taxes | - | - | - | (1,653 | ) | (1,653 | ) | (1,653 | ) | ||||||||||||
| Pension Liability Adjustment, | |||||||||||||||||||||
| Net of Tax Benefits of $50,535 | - | - | - | (78,640 | ) | (78,640 | ) | (78,640 | ) | ||||||||||||
| Postemployment Benefits Liability | |||||||||||||||||||||
| Net of Tax Benefits of $181 | - | - | - | (309 | ) | (309 | ) | (309 | ) | ||||||||||||
| Unrealized Loss on Cash Flow Hedge, | |||||||||||||||||||||
| Net of Tax Benefits of $231 | - | - | - | (354 | ) | (354 | ) | (354 | ) | ||||||||||||
| Balance at September 27, 2009 | 48,545,080 | $ | 89,878 | $ | 830,236 | $ | (107,935 | ) | $ | 812,179 | $ | 5,008 | |||||||||
See Notes to Consolidated Financial Statements
31
STATEMENTS OF CONSOLIDATED CASH
FLOWS
RUDDICK CORPORATION AND
SUBSIDIARIES
(dollars in
thousands)
| 52 Weeks Ended | 52 Weeks Ended | 52 Weeks Ended | ||||||||||
| September 27, | September 28, | September 30, | ||||||||||
| 2009 | 2008 | 2007 | ||||||||||
| CASH FLOW FROM OPERATING ACTIVITIES: | ||||||||||||
| Net Income | $ | 85,964 | $ | 96,752 | $ | 80,688 | ||||||
| Non-Cash Items Included in Net Income: | ||||||||||||
| Depreciation and Amortization | 125,487 | 114,405 | 100,798 | |||||||||
| Deferred Income Taxes | 10,393 | 13,665 | (3,108 | ) | ||||||||
| Net Gain on Property Sales | (792 | ) | (1,789 | ) | (2,432 | ) | ||||||
| Impairment Losses | 9,891 | - | - | |||||||||
| Share-Based Compensation | 5,722 | 5,376 | 3,853 | |||||||||
| Other, Net | (2,652 | ) | 1,832 | (2,031 | ) | |||||||
| Changes in Operating Accounts Providing (Utilizing) Cash: | ||||||||||||
| Accounts Receivable | 11,470 | 1,552 | (2,588 | ) | ||||||||
| Inventories | 1,833 | (16,853 | ) | (28,213 | ) | |||||||
| Prepaid Expenses and Other Current Assets | (6,769 | ) | (3,464 | ) | 303 | |||||||
| Accounts Payable | (9,196 | ) | 7,116 | 40,132 | ||||||||
| Other Current Liabilities | 5,550 | 8,331 | 13,054 | |||||||||
| Other Long-Term Operating Accounts | (4,102 | ) | (235 | ) | 11,662 | |||||||
| Dividends Received from Non-Consolidated Subsidiaries | 940 | 500 | 500 | |||||||||
| Net Cash Provided by Operating Activities | 233,739 | 227,188 | 212,618 | |||||||||
| INVESTING ACTIVITIES: | ||||||||||||
| Capital Expenditures | (209,203 | ) | (199,500 | ) | (219,903 | ) | ||||||
| Purchase of Other Investments | (16,980 | ) | (46,799 | ) | (9,835 | ) | ||||||
| Acquired Favorable Leases | - | (1,136 | ) | - | ||||||||
| Proceeds from Sale of Property | 5,944 | 24,606 | 14,989 | |||||||||
| Return of Partnership Investments | 3,152 | 129 | 12,557 | |||||||||
| Investments in Company-Owned Life Insurance | (702 | ) | (1,879 | ) | (1,881 | ) | ||||||
| Other, Net | (996 | ) | (1,647 | ) | (735 | ) | ||||||
| Net Cash Used in Investing Activities | (218,785 | ) | (226,226 | ) | (204,808 | ) | ||||||
| FINANCING ACTIVITIES: | ||||||||||||
| Net (Payments on) Proceeds from Short-Term Debt Borrowings | (3,836 | ) | 865 | 750 | ||||||||
| Net Proceeds from (Payments on) Revolver Borrowings | 23,900 | (62,000 | ) | 10,200 | ||||||||
| Proceeds from Long-Term Debt Borrowings | 1,652 | 100,371 | 319 | |||||||||
| Payments on Long-Term Debt and Capital Lease Obligations | (12,212 | ) | (10,207 | ) | (8,387 | ) | ||||||
| Dividends Paid | (17,465 | ) | (23,182 | ) | (21,118 | ) | ||||||
| Proceeds from Stock Issued | 1,598 | 3,359 | 5,711 | |||||||||
| Share-Based Compensation Tax Benefits | 482 | 1,917 | 1,820 | |||||||||
| Purchase and Retirement of Common Stock | - | (8,000 | ) | - | ||||||||
| Other, Net | (1,041 | ) | (1,139 | ) | (210 | ) | ||||||
| Net Cash (Used in) Provided by Financing Activities | (6,922 | ) | 1,984 | (10,915 | ) | |||||||
| Increase (Decrease) in Cash and Cash Equivalents | 8,032 | 2,946 | (3,105 | ) | ||||||||
| Effect of Foreign Currency Fluctuations on Cash | (481 | ) | 66 | 664 | ||||||||
| Cash and Cash Equivalents at Beginning of Year | 29,759 | 26,747 | 29,188 | |||||||||
| Cash and Cash Equivalents at End of Year | $ | 37,310 | $ | 29,759 | $ | 26,747 | ||||||
| Supplemental Disclosures of Cash Flows Information: | ||||||||||||
| Cash Paid During the Year For: | ||||||||||||
| Interest, Net of Amounts Capitalized | $ | 17,360 | $ | 19,263 | $ | 17,295 | ||||||
| Income Taxes | 43,588 | 46,072 | 52,384 | |||||||||
| Non-Cash Activity: | ||||||||||||
| Assets Acquired under Capital Leases | 30,034 | 26,844 | 23,207 | |||||||||
See Notes to Consolidated Financial Statements
32
RUDDICK CORPORATION AND
SUBSIDIARIES
NOTES TO CONSOLIDATED FINANCIAL STATEMENTS
SUMMARY OF SIGNIFICANT ACCOUNTING POLICIES
Principles of
Consolidation
The accompanying
consolidated financial statements include the accounts of Ruddick Corporation
and subsidiaries, including its wholly owned operating companies, Harris Teeter,
Inc. (“Harris Teeter”) and American & Efird, Inc. (“A&E”), collectively
referred to herein as the Company. All material intercompany amounts have been
eliminated. To the extent that non-affiliated parties held minority equity
investments in joint ventures of the Company, such investments are classified as
minority interest.
The Company reviews its investments in entities to determine if such entities are deemed to be variable interest entities (VIE’s) as defined by ASC paragraph 810-10-05-8. The Company will consolidate those VIE’s in which the Company is the primary beneficiary of the entity. The Company concluded that it did not have any VIE’s that required consolidation in fiscal years 2009, 2008 or 2007.
The Company has evaluated subsequent events through November 20, 2009, the filing date of this Form 10-K, and has determined that there were no subsequent events to recognize or disclose in these financial statements.
Fiscal Year
The Company's fiscal year ends on the Sunday nearest to
September 30. However, the Company’s Harris Teeter subsidiary’s fiscal periods
end on the Tuesday following the Company’s fiscal period end. Fiscal years 2009,
2008 and 2007 include the 52 weeks ended September 27, 2009 (September 29, 2009
for Harris Teeter), September 28, 2008 (September 30, 2008 for Harris Teeter)
and September 30, 2007 (October 2, 2007 for Harris Teeter),
respectively.
Use of Estimates
The preparation of financial statements in conformity with
generally accepted accounting principles requires management to make estimates
and assumptions that affect the reported amounts of assets and liabilities and
disclosure of contingent assets and liabilities at the date of the financial
statements and the reported amounts of revenues and expenses during the
reporting period. Actual amounts could differ from those estimates.
Cash and Cash
Equivalents
For purposes of the statements
of consolidated cash flows, the Company considers all highly liquid cash
investments purchased with a maturity of three months or less to be cash
equivalents.
Inventories
The Company’s inventories are valued at the lower of cost or
market with the cost of substantially all domestic U.S. inventories being
determined using the last-in, first-out (LIFO) method. Foreign inventories and
limited categories of domestic inventories are valued on the weighted average
and on the first-in, first-out (FIFO) cost methods. Under the LIFO valuation
method at Harris Teeter, all retail store inventories are initially stated at
estimated cost as calculated by the Retail Inventory Method (RIM). Under RIM,
the valuation of inventories at cost and the resulting gross margins are
calculated by applying a calculated cost-to-retail ratio to the retail value of
inventories. LIFO indices are developed approximately one month prior to year
end except for inventory held at Harris Teeter’s distribution facilities which
are developed at year end. The annual LIFO measurement is achieved by applying
the indices to the actual inventory on hand as of year end.
Vendor Rebates, Credits and
Promotional Allowances
Consistent with
standard practices in the retail industry, Harris Teeter receives allowances
from vendors through a variety of programs and arrangements. These allowances
are generally intended to defray the costs of promotion, advertising and selling
the vendor’s products. Vendor rebates, credits and other promotional allowances
that relate to Harris Teeter’s buying and merchandising activities, including
lump-sum payments associated with long-term contracts, are recorded as a
component of cost of sales as they are earned, the recognition of which is
determined in accordance with the underlying agreement with the vendor, the
authoritative guidance and completion of the earning process. Portions of vendor
allowances that are refundable to the vendor, in whole or in part, by the nature
of the provisions of the contract are deferred from recognition until
realization is reasonably assured.
Harris Teeter recognizes allowances when the purpose for which the vendor funds were intended and committed to be used has been fulfilled and a cost has been incurred by the retailer. Thus, it is the Company’s policy to recognize the vendor allowance consistent with the timing of the recognition of the expense that the allowance is intended to reimburse and to determine the accounting classification consistent with the economic substance of the underlying transaction. Where the Company provides an identifiable benefit or service to the vendor apart from the purchase of merchandise, that transaction is recorded separately. For example, co-operative advertising allowances are accounted for as a reduction of advertising expense in the period in which the advertising cost is incurred. If the advertising allowance exceeds the cost of advertising, then the excess is recorded against the cost of sales in the period in which the related expense is recognized.
33
Vendor allowances for price markdowns are credited to the cost of sales during the period in which the related markdown was taken and charged to the cost of sales. Slotting and stocking allowances received from a vendor to ensure that its products are carried or to introduce a new product at the Company’s stores are recorded as a reduction of cost of sales over the period covered by the agreement with the vendor based on the estimated inventory turns of the merchandise to which the allowance applies. Display allowances are recognized as a reduction of cost of sales in the period earned in accordance with the vendor agreement. Volume rebates by the vendor in the form of a reduction of the purchase price of the merchandise reduce the cost of sales when the related merchandise is sold. Generally, volume rebates under a structured purchase program with allowances awarded based on the level of purchases are recognized, when realization is assured, as a reduction in the cost of sales in the appropriate monthly period based on the actual level of purchases in the period relative to the total purchase commitment and adjusted for the estimated inventory turns of the merchandise.
Property and
Depreciation
Property is recorded at cost
and is depreciated, using principally the straight-line method, over the
following useful lives:
| Land improvements | 10-40 years | |
| Buildings | 15-40 years | |
| Machinery and equipment | 3-15 years |
Leasehold improvements are depreciated over the lesser of the estimated useful life or the remaining term of the lease. Assets under capital leases are amortized on a straight-line basis over the lesser of the estimated useful life or the lease term. Maintenance and repairs are charged against income when incurred. Expenditures for major renewals, replacements and betterments are added to property. The cost and the related accumulated depreciation of assets retired are eliminated from the accounts with gains or losses on disposal being added to or deducted from income. Property categories include $88,373,000 and $46,224,000 of accumulated costs for construction in progress at September 27, 2009 and September 28, 2008, respectively.
Impairment of Long-lived Assets and
Closed Store Obligations
The Company
assesses its long-lived assets for possible impairment whenever events or
changes in circumstances indicate the carrying value of an asset may not be
recoverable. Recoverability is measured by a comparison of the carrying amount
to the net non-discounted cash flows expected to be generated by the asset. An
impairment loss is recognized for any excess of net book value over the
estimated fair value of the asset impaired, and recorded as an offset to the
asset value. The fair value is estimated based on expected future cash flows or
third party valuations, if available.
The continuing deterioration of the economy during fiscal 2009, particularly with respect to A&E’s customers in the retail apparel and non-apparel markets, caused management to lower the expected future cash flows of A&E’s U.S. operating segment used in the strategic plan that is completed annually in third fiscal quarter. As a result, A&E recorded an impairment charge of $2,237,000 for the write-down of long-lived assets of its U.S. operating segment, along with related deferred tax benefits of $860,000 in the third quarter of fiscal 2009.
The value of property and equipment associated with closed stores and facilities is adjusted to reflect recoverable values based on the Company's prior history of disposing of similar assets and current economic conditions. Management continually reviews its fair value estimates and records impairment charges for assets held for sale when management determines, based on new information which it believes to be reliable, that such charges are appropriate.
The Company records liabilities for closed stores that are under long-term lease agreements. The liability represents an estimate of the present value of the remaining non-cancelable lease payments after the anticipated closing date, net of estimated subtenant income. The closed store liabilities usually are paid over the lease terms associated with the closed stores, unless settled earlier. Harris Teeter management estimates the subtenant income and future cash flows based on its historical experience and knowledge of (1) the market in which the store is located, (2) the results of its previous efforts to dispose of similar assets and (3) the current economic conditions.
34
Investments
The
Company’s Harris Teeter subsidiary invests in certain real estate development
projects, with a managing partner or partners, in which Harris Teeter either
operates or plans to operate a supermarket. A&E has investments in various
non-consolidated foreign entities in which they hold a minority interest and a
50% ownership interest in a joint venture in China. These investments, depending
on the state of development, are accounted for either under the equity method of
accounting or at cost. In addition, the Company continues to hold certain equity
investments in a few emerging growth companies as a result of investments made
in certain venture capital funds during prior years. Real estate and other
investments are carried at the lower of cost or market and are periodically
reviewed for potential impairment as discussed above. Investments accounted for
under the equity method totaled $110,515,000 and $91,194,000 at September 27,
2009 and September 28, 2008, respectively. Investments accounted for under the
cost method totaled $45,919,000 and $52,708,000 at September 27, 2009 and
September 28, 2008, respectively.
Goodwill and Other
Intangibles
Goodwill and certain other
intangibles with indefinite lives are tested for impairment at least annually,
or more frequently, if circumstances indicate a potential impairment. Intangible
assets with finite, measurable lives are amortized over their respective useful
lives until they reach their estimated residual values, and are reviewed for
impairment along with other long-lived assets as discussed above.
Insurance
The Company utilizes a combination of self-insured retention
and high-deductible programs for most U.S. workers’ compensation claims,
healthcare claims, and general liability and automotive liability losses. The
Company has purchased insurance coverage in order to establish certain limits to
its exposure on a per claim basis. The Company determines the estimated reserve
required for U.S. worker compensation claims, general liability and automotive
liability by first analyzing the costs of claims incurred and then adjusts such
estimates by development factors from published insurance industry sources. The
Company measures the cost associated with workers’ compensation claims, and
general liability and automotive liability losses at Harris Teeter based upon a
projection of the ultimate cost for claims incurred. The estimated total
expected costs of claims includes an estimate for claims incurred but not
reported (IBNR) and is discounted to present values using a discount rate
representing a return on high-quality fixed income securities with an average
maturity equal to the average payout of the related liability.
The Company records an accrual for the estimated amount of self-insured healthcare IBNR claims. These reserves are recorded based on historical experience and industry trends, which are continually monitored, and accruals are adjusted when warranted by changes in facts and circumstances.
Deferred Rent
The Company recognizes rent holidays, including the period of
time the Company has access prior to the store opening, which typically includes
construction and fixturing activity, and rent escalations on a straight-line
basis over the term of the lease. The deferred rent amount is included in Other
Long-Term Liabilities on the Company’s Consolidated Balance Sheets. The Company
expenses construction period rent as incurred.
Derivatives
The Company utilizes derivative financial instruments to hedge
its exposure to changes in interest rates. All derivative financial instruments
are recorded on the balance sheet at their respective fair value. The Company
does not use financial instruments or derivatives for any trading or other
speculative purposes.
ASC paragraph 815-10-05-4 requires that derivatives be carried at fair value on the balance sheet and provides for hedge accounting when certain conditions are met. In accordance with this standard, the Company’s derivative financial instruments are recognized on the balance sheet at fair value. Changes in the fair value of derivative instruments designated as “cash flow” hedges, to the extent the hedges are highly effective, are recorded in other comprehensive income, net of tax effects. Ineffective portions of cash flow hedges, if any, are recognized in current period earnings. Other comprehensive income or loss is reclassified into current period earnings when the hedged transaction affects earnings.
The Company assesses, both at the inception of the hedge and on an ongoing basis, whether derivatives used as hedging instruments are highly effective in offsetting the changes in the cash flow of the hedge items. If it is determined that a derivative is not highly effective as a hedge or ceases to be highly effective, the Company will discontinue hedge accounting prospectively.
35
Harris Teeter enters into purchase commitments for a portion of the fuel utilized in its distribution operations. Harris Teeter expects to take delivery of and to utilize these resources in a reasonable period of time and in the conduct of normal business. Accordingly, these fuel purchase commitments qualify as normal purchases.
Counterparty Credit
Risk
By entering into derivative
instrument contracts, the Company exposes itself, from time to time, to
counterparty credit risk. Counterparty credit risk is the failure of the
counterparty to perform under the terms of the derivative contract. When the
fair value of a derivative contract is in an asset position, the counterparty
has a liability to the Company, which creates credit risk for the Company. The
Company attempts to minimize this risk by selecting counterparties with
investment grade credit ratings, limiting its exposure to any single
counterparty and regularly monitoring its market position with each
counterparty.
Credit-Risk Related Contingent
Features
The Company’s derivative
instruments do not contain any credit-risk related contingent
features.
Revenue
Recognition
The Company recognizes revenue
from retail operations at the point of sale to its customers and from
manufacturing operations at the point of shipment to its customers, based on
shipping terms.
Cost of Sales
The major components of cost of sales in the retail
supermarket segment are (a) the cost of products sold determined under the
Retail Inventory Method (see "Inventories” above) reduced by purchase cash
discounts and vendor purchase allowances and rebates, (b) the cost of various
sales promotional activities reduced by vendor promotional allowances, and
reduced by cooperative advertising allowances to the extent an advertising
allowance exceeds the cost of the advertising, (c) the cost of product waste,
including, but not limited to, physical waste and theft, (d) the cost of product
distribution, including warehousing, freight and delivery, and (e) any charges,
or credits, associated with LIFO reserves and reserves for obsolete and slow
moving inventories. Additionally, the costs of production of product sold by the
dairy operation to outsiders are included in cost of sales in the period in
which the sales are recognized in revenues.
The major components of cost of sales in the textile manufacturing and distribution segment are (a) the materials and supplies, labor costs and overhead costs associated with the manufactured products sold, (b) the purchased cost of products bought for resale, (c) any charges, or credits, associated with LIFO reserves and reserves for obsolete and slow moving inventories, (d) the freight costs incurred to deliver the products to the customer from the point of sale, and (e) all other costs required to be classified as cost of sales under authoritative accounting pronouncements.
Selling, General and Administrative
Expenses
The major components of selling,
general and administrative expenses in the retail supermarket segment are (a)
the costs associated with store operations, including store labor and training,
fringe benefits and incentive compensation, supplies and maintenance, regional
and district management and store support, store rent and other occupancy costs,
property management and similar costs, (b) advertising costs, (c) shipping and
handling costs, excluding freight, warehousing and distribution costs, (d)
merchandising and purchasing department staffing, supplies and associated costs,
(e) customer service and support, and (f) the costs of maintaining general and
administrative support functions, including, but not limited to, personnel
administration, finance and accounting, treasury, credit, information systems,
marketing, and environmental, health and safety, based on appropriate
classification under generally accepted accounting principles.
The major components of selling, general and administrative expenses in the textile manufacturing and distribution segment are (a) the costs of maintaining a sales force, including compensation, incentive compensation, benefits, office and occupancy costs, travel and all other costs of the sales force, (b) shipping and handling costs, excluding freight, (c) the costs of advertising, customer service, sales support and other similar costs, and (d) the costs of maintaining general and administrative support functions, including, but not limited to, personnel administration, finance and accounting, treasury, credit, information systems, training, marketing, and environmental, health and safety, to the extent that such overhead activities are not allocable to indirect manufacturing costs in cost of sales under generally accepted accounting principles. The Company also includes the net profit of unconsolidated subsidiaries within selling, general and administrative expenses. The net profit from non-consolidated subsidiaries included in selling, general and administrative expenses amounted to $4,435,000 in fiscal 2009, $3,445,000 in fiscal 2008 and $1,386,000 in fiscal 2007.
The major components of selling, general and administrative expenses in the corporate segment are (a) the costs associated with a portion of compensation and benefits of holding company employees, and (b) certain other costs that are not related to the operating companies.
36
Advertising
Costs incurred to produce media advertising are expensed in
the period in which the advertising first takes place. All other advertising
costs are also expensed when incurred. Cooperative advertising income from
vendors is recorded in the period in which the related expense is incurred and
amounted to $1,972,000, $1,717,000 and $1,635,000 in fiscal 2009, 2008 and 2007,
respectively. Net advertising expenses of $24,312,000, $25,818,000, and
$24,486,000 were included in the Company's results of operations for fiscal
2009, 2008 and 2007, respectively.
Foreign Currency
Assets and liabilities of foreign operations (if applicable)
are translated at the current exchange rates as of the end of the accounting
period, and revenues and expenses are translated using average exchange rates.
The resulting translation adjustments are net of income taxes and accumulated as
a component of other comprehensive income in shareholders’ equity.
Income Taxes
The Company and its subsidiaries file a consolidated federal
income tax return. Tax credits are recorded as a reduction of income taxes in
the years in which they are generated. Deferred tax liabilities or assets at the
end of each period are determined using the tax rate expected to be in effect
when taxes are settled or realized. Accordingly, income tax expense will
increase or decrease in the same period in which a change in tax rates is
enacted. A valuation allowance is established for deferred tax assets for which
realization is not more likely than not.
The Company adopted the provisions on accounting for uncertainty in income taxes as prescribed by ASC Subtopic 740-10 on October 1, 2007. This standard clarifies the accounting for uncertainty in income taxes by prescribing a minimum recognition threshold for a tax position taken or expected to be taken in a tax return that is required to be met before being recognized in the financial statements. ASC Subtopic 740-10 also provides guidance on derecognition, measurement, classification, interest and penalties, accounting in interim periods, disclosure and transition. The Company has elected to record interest expense related to unrecognized tax benefits in interest expense. Penalties, if incurred, would be recorded as a component of income tax expense.
Earnings Per Share
(“EPS”)
Basic EPS is based on the weighted
average outstanding common shares. Diluted EPS is based on the weighted average
outstanding common shares adjusted by the dilutive effect of potential common
stock equivalents resulting from the operation of the Company’s comprehensive
stock option and awards plans.
Stock Options and Stock
Awards
The
Company uses fair-value accounting for all share-based payments to employees for
new awards and previously granted awards that were not vested as of the first
quarter of fiscal 2006. Compensation expense for stock awards are based on the
grant date fair value and are expensed ratably over their vesting period,
resulting in more expense in the early years. Income tax benefits attributable
to stock options exercised are credited to capital stock.
Other Comprehensive
Income
Other comprehensive income refers
to revenues, expenses, gains and losses that are not included in net earnings
but rather are recorded directly in shareholders’ equity. The components of
accumulated other comprehensive loss, net of taxes at September 27, 2009,
September 28, 2008 and September 29, 2007 consisted of the following (in
thousands):
| 2009 | 2008 | 2007 | ||||||||||
| Accumulated unrecognized losses for minimum pension liabilities | $ | (112,168 | ) | $ | (33,527 | ) | $ | (44,382 | ) | |||
| Accumulated unrecognized losses for postemployment liabilities | (230 | ) | 78 | (68 | ) | |||||||
| Accumulated unrecognized losses on cash flow hedges | (354 | ) | - | - | ||||||||
| Accumulated net gains for foreign currency translation adjustments | 4,817 | 6,470 | 5,391 | |||||||||
| Total accumulated other comprehensive loss | $ | (107,935 | ) | $ | (26,979 | ) | $ | (39,059 | ) | |||
Cash Flows
A portion of the sales and operating costs of A&E’s
foreign operations are denominated in currencies other than the U.S. dollar.
This creates an exposure to foreign currency exchange rates. The impact of
changes in the relationship of other currencies to the U.S. dollar has
historically not been significant, and such changes in the future are not
expected to have a material impact on the Company’s results of operations or
cash flows.
Reclassifications
To conform with
classifications used in the current year, the financial statements for the prior
year reflect certain reclassifications.
37
INVENTORIES
Inventories are valued at the lower of cost or market with the cost of substantially all domestic U.S. inventories being determined using the last-in, first-out (LIFO) method. The LIFO cost of such inventories was $37,131,000 and $32,651,000 less than the first-in, first-out (FIFO) cost method at September 27, 2009 and September 28, 2008, respectively. Foreign inventories and limited categories of domestic inventories, totaling $69,500,000 for fiscal 2009 and $76,360,000 for fiscal 2008, are valued on the weighted average and on the FIFO cost methods.
The following table summarizes the components of inventories at September 27, 2009 and September 28, 2008 (in thousands):
| 2009 | 2008 | |||||
| Finished Goods | $ | 286,113 | $ | 281,952 | ||
| Raw Materials and Supplies | 19,504 | 23,901 | ||||
| Work in Process | 4,654 | 6,736 | ||||
| Total Inventories | $ | 310,271 | $ | 312,589 | ||
COMPANY OWNED LIFE INSURANCE (COLI)
The Company has purchased life insurance policies to fund its obligations under certain benefit plans for officers, key employees and directors. The cash surrender value of these policies is recorded net of policy loans and included with other long-term assets in the Company’s consolidated balance sheets. The cash value of the Company’s life insurance policies were $57,965,000 at September 27, 2009 and $54,880,000 at September 28, 2008, and no policy loans were outstanding at either date.
INTANGIBLE ASSETS
The carrying amount of intangible assets at September 27, 2009 and September 28, 2008 was as follows (in thousands):
| 2009 | 2008 | ||||||
| Acquired favorable operating leases | $ | 18,170 | $ | 18,170 | |||
| Customer lists | 5,534 | 5,534 | |||||
| Land use rights – foreign operations | 4,451 | 4,439 | |||||
| Non-compete agreements | 2,963 | 4,054 | |||||
| Trademarks, licenses and other | 2,554 | 2,554 | |||||
| Total amortizing intangibles | 33,672 | 34,751 | |||||
| Accumulated amortization | (9,918 | ) | (8,396 | ) | |||
| Total intangible assets, net of accumulated amortization | $ | 23,754 | $ | 26,355 | |||
Acquired favorable operating leases are recorded at Harris Teeter. All other intangible assets are recorded by A&E. The Company has no non-amortizing intangible assets. Amortization expense for intangible assets was $2,613,000, $2,658,000 and $2,619,000 in fiscal years 2009, 2008, and 2007, respectively. Amortizing intangible assets have remaining useful lives from one year to 46 years. Projected amortization expense for intangible assets existing as of September 27, 2009 is: $2,340,000, $1,898,000, $1,697,000, $1,595,000 and $1,544,000 for fiscal years 2010, 2011, 2012, 2013 and 2014, respectively.
GOODWILL
Goodwill is recorded by A&E. On an annual basis, A&E performs a fair value-based impairment test on the net book value of goodwill and will perform the same procedures on an interim basis if certain events or circumstances indicate that an impairment loss may have occurred. The annual review was conducted in the first quarter of fiscal 2009, resulting in no goodwill impairment charge being required. However, the continuing deterioration of the economy during fiscal 2009, particularly with respect to A&E’s customers in the retail apparel and non-apparel markets, caused management to lower the expected future cash flows of A&E’s U.S. operating segment used in the strategic plan that is completed annually in third fiscal quarter. The reduced cash flow projections indicated the possibility of impairment which required A&E to perform an interim impairment test of goodwill. As a result of the interim goodwill impairment test, A&E recorded a non-cash impairment charge related to all of the goodwill of its U.S. operating segment of $7,654,000 in the third quarter of fiscal 2009. A&E also recorded related deferred tax benefits of $2,932,000. There were no goodwill impairment charges required for fiscal 2008 or fiscal 2007.
38
LEASES
The Company leases certain equipment under agreements expiring during the next 6 years. Harris Teeter leases most of its stores under leases that expire during the next 26 years. It is expected that such leases will be renewed by exercising options or replaced by leases of other properties. Most store leases provide for additional rentals based on sales, and certain store facilities are sublet under leases expiring during the next 9 years. Certain leases also contain rent escalation clauses (step rents) that require additional rental amounts in the later years of the term. Rent expense for the fiscal years was as follows (in thousands):
| 2009 | 2008 | 2007 | |||||||
| Minimum, net of sublease income | $ | 95,010 | $ | 85,693 | $ | 84,106 | |||
| Contingent | 1,688 | 1,932 | 1,597 | ||||||
| Total | $ | 96,698 | $ | 87,625 | $ | 85,703 | |||
Future minimum lease commitments (excluding leases assigned - see below) and total minimum sublease rental income to be received under non-cancelable subleases at September 27, 2009 were as follows (in thousands):
| Operating | Capital | ||||||||||
| Fiscal Year | Leases | Subleases | Leases | ||||||||
| 2010 | $ | 93,877 | $ | (2,209 | ) | $ | 9,650 | ||||
| 2011 | 95,760 | (1,982 | ) | 10,667 | |||||||
| 2012 | 95,527 | (1,791 | ) | 10,682 | |||||||
| 2013 | 97,082 | (1,383 | ) | 10,696 | |||||||
| 2014 | 96,816 | (1,124 | ) | 10,740 | |||||||
| Later years | 988,740 | (2,393 | ) | 149,918 | |||||||
| Total minimum lease obligations (receivables) | $ | 1,467,802 | $ | (10,882 | ) | 202,353 | |||||
| Amount representing interest | (106,112 | ) | |||||||||
| Present value of net minimum obligation (included with long-term debt) | $ | 96,241 | |||||||||
In connection with the closing of certain store locations, Harris Teeter has assigned leases to several sub-tenants with recourse. These leases expire over the next 12 years and the future minimum lease payments totaling $51,167,000 over this period have been assumed by these sub-tenants.
LONG-TERM DEBT
On December 20, 2007, the Company and eleven banks entered into a credit agreement that provides for a five-year revolving credit facility in the aggregate amount of up to $350 million and a non-amortizing term loan of $100 million due December 20, 2012. The credit agreement also provides for an optional increase of the revolving credit facility by an additional amount of up to $100 million and two 1-year maturity extension options, both of which require consent of the lenders. Outstanding borrowings under the credit agreement bear interest at a variable rate based on a reference to: rates on federal funds transactions with members of the Federal Reserve System or the prime rate in effect on the interest determination date; the LIBOR Market Index Rate; or, the LIBOR Rate, each plus an applicable margin. The amount which may be borrowed from time to time and the applicable margin to the referenced interest rate are each dependent on a leverage factor. The leverage factor is based on a ratio of rent-adjusted consolidated funded debt divided by earnings before interest, taxes, depreciation, amortization and operating rents, as set forth in the credit agreement. The more significant of the financial covenants which the Company must meet during the term of the credit agreement include a maximum leverage ratio and a minimum fixed charge coverage ratio. As of September 27, 2009, the Company was in compliance with all financial covenants of the credit agreement. Issued letters of credit reduce the amount available for borrowings under the revolving credit facility and amounted to $22,147,000 as of September 27, 2009. The Company is charged a variable commitment fee based on the amount available for borrowings, which amounted to $274,953,000 as of September 27, 2009. The commitment fee rate applied to the net unused balance was 0.120%, per annum for each of fiscal 2009, 2008 and 2007.
Covenants in certain of the Company’s long-term debt agreements limit the total indebtedness that the Company may incur. The most restrictive of these covenants is a consolidated maximum leverage ratio and a minimum fixed charge coverage ratio as defined in the Company’s credit agreement. As of September 27, 2009, the amount of additional debt that could be incurred within the limitations of the debt covenants exceeded the additional borrowings available under the revolving credit facility. As such, management believes that the limit on indebtedness does not restrict the Company’s ability to meet future liquidity requirements through borrowings available under the Company’s revolving credit facility, including any liquidity requirements expected in connection with the Company’s expansion plans for the foreseeable future.
39
Long-term debt at September 27, 2009 and September 28, 2008 was as follows (in thousands):
| 2009 | 2008 | |||||
| 6.48% Senior Note due $7,143 annually through April, 2011 | $ | 14,286 | $ | 21,428 | ||
| 7.72% Senior Note due April, 2017 | 50,000 | 50,000 | ||||
| 7.55% Senior Note due July, 2017 | 50,000 | 50,000 | ||||
| Bank Term Loan due December, 2012, variable interest (2.24% and 3.55% at | ||||||
| September 27, 2009 and September 28, 2008, respectively) | 100,000 | 100,000 | ||||
| Revolving Line of Credit, variable interest (1.00% and 4.46% at September 27, 2009 | ||||||
| and September 28, 2008, respectively) | 52,900 | 29,000 | ||||
| Capital lease obligations | 96,241 | 66,558 | ||||
| Other obligations | 1,660 | 3,592 | ||||
| Total | 365,087 | 320,578 | ||||
| Less current portion | 9,526 | 9,625 | ||||
| Total long-term debt | $ | 355,561 | $ | 310,953 | ||
Long-term debt maturities (including capital lease obligations) in each of the next five fiscal years are as follows: 2010 - $9,526,000; 2011 - $10,374,000; 2012 - $2,647,000; 2013 - $155,623,000; 2014 - $2,877,000.
Total interest expense, net of amounts capitalized, on debt and capital lease obligations was $17,673,000, $20,085,000 and $17,654,000 for fiscal 2009, 2008 and 2007, respectively. Capitalized interest totaled $2,881,000, $2,220,000 and $2,318,000 for fiscal 2009, 2008 and 2007, respectively.
INTEREST RATE SWAP AGREEMENTS
During fiscal 2009, the Company entered into two separate three-year interest rate swap agreements with an aggregate notional amount of $80 million. The swap agreements effectively fixed the interest rate on $80 million of the Company’s term loan, of which $40 million is at 1.81% and $40 million is at 1.80%, excluding the applicable margin and associated fees. Both interest rate swaps were designated as cash flow hedges.
The following tables present the required quantitative disclosures under ASC paragraph 820-10-50-1, on a combined basis, for the Company’s financial instruments, designated as cash flow hedges (in thousands):
| Fair Value Measurements at September 27, 2009 | ||||||||||||
| Carrying Value | Quoted Prices in Active Markets for Identical Instruments (Level 1) |
Significant Other Observable Inputs (Level 2) |
Significant Unobservable Inputs (Level 3) | |||||||||
| Interest rate swaps (included with | ||||||||||||
| Other Long-Term Liabilities on | ||||||||||||
| the balance sheet) | $ | 585 | $ | - | $ | 585 | $ | - | ||||
The pre-tax unrealized loss associated with the cash flow hedges for the fiscal years was as follows (in thousands):
| 2009 | 2008 | 2007 | |||||||
| Unrealized loss included with other comprehensive income | $ | 585 | $ | - | $ | - | |||
40
FINANCIAL INSTRUMENTS
Financial instruments which potentially subject the Company to concentration of credit risk consist principally of cash equivalents and notes receivables. The Company limits the amount of credit exposure to each individual financial institution and places its temporary cash into investments of high credit quality. Concentrations of credit risk with respect to receivables are limited due to their dispersion across various companies and geographies.
The carrying amounts for certain of the Company's financial instruments, including cash and cash equivalents, accounts and notes receivable, accounts payable and other accrued liabilities approximate fair value because of their short maturities. The fair value of variable interest debt is equal to its carrying amount. The estimated fair value of the Company’s Senior Notes due at various dates through 2017 (which accounts for 99% of the Company’s fixed interest debt obligations) is computed based on borrowing rates currently available to the Company for loans with similar terms and maturities. The estimated fair value of the Company’s Senior Notes and its carrying amount outstanding as of September 27, 2009 and September 28, 2008 is as follows (in thousands):
| 2009 | 2008 | |||||
| Senior Notes – estimated fair value | $ | 134,322 | $ | 127,053 | ||
| Senior Notes – carrying amount | 114,285 | 121,428 | ||||
CAPITAL STOCK
The capital stock of the Company authorized at September 28, 2008 was 75,000,000 shares of no par value Common Stock, 4,000,000 shares of Preference Stock (non-cumulative voting $0.56 convertible, $10 liquidation value), and 1,000,000 shares of Additional Preferred Stock. No shares of Preference Stock or Additional Preferred Stock were issued or outstanding at September 27, 2009 or September 28, 2008.
One preferred share purchase right is attached to each outstanding share of common stock, which rights expire on November 16, 2010. Each right entitles the holder to purchase one one-hundredth of a share of a new Series A Junior Participating Additional Preferred Stock for $60. The rights will become exercisable only under certain circumstances related to a person or group acquiring or offering to acquire a substantial portion of the Company's common stock. If certain additional events then occur, each right would entitle the rightholder to acquire common stock of the Company, or in some cases of an acquiring entity, having a value equal to twice the exercise price. Under certain circumstances the Board of Directors may extinguish the rights by exchanging one share of common stock or an equivalent security for each qualifying right or may redeem each right at a price of $0.01. There are 600,000 shares of Series A Junior Participating Additional Preferred Stock reserved for issuance upon exercise of the rights.
The Board of Directors adopted a stock buyback program in 1996, authorizing, at management’s discretion, the Company to purchase and retire up to 10% of the then outstanding shares of the Company’s common stock for the purpose of preventing dilution as a result of the operation of the Company’s comprehensive stock option and awards plans. Pursuant to this plan, the Company purchased and retired 250,000 shares at a total cost of $8,000,000, or an average price of $32.05 per share during fiscal 2008. There were no stock purchases in fiscal years 2009 or 2007.
STOCK OPTIONS AND STOCK AWARDS
At September 27, 2009, the Company has 1993, 1995, 1997, 2000 and 2002 equity incentive plans, which were approved by the Company’s shareholders and authorized the issuance of 5,500,000 shares of common stock pursuant thereto. Under certain stock option plans, the Company has granted incentive stock options to employees or nonqualified stock options to employees and outside directors. The Company’s incentive stock options generally become exercisable in installments of 20% per year at each of the first through fifth anniversaries from grant date and expire seven years from grant date and nonqualified stock options expire ten years from grant date. Historically and pursuant to the terms of certain plans, the Company grants a single, one-time nonqualified stock option of 10,000 shares, generally vested immediately, to each of its outside directors at the time of their initial election to the Board. Under each of the stock option plans, the exercise price of each stock option shall be no less than the market price of the Company's stock on the date of grant, and an option's maximum term is ten years. At the discretion of the Company, under certain plans a stock appreciation right may be granted and exercised in lieu of the exercise of the related option (which is then forfeited). Certain of the plans also allow the Company to grant stock awards such as restricted stock. Under the plans, as of September 27, 2009, the Company may grant additional options or stock awards and performance shares in the amount of 1,103,000 shares.
41
The Board of Directors began approving equity awards in lieu of stock options in November 2004. These awards have historically been apportioned 50% as a fixed award of restricted stock (restricted from sale or transfer until vesting ratably over a five-year period of continued employment) and 50% as performance share awards, based on the attainment of certain performance targets for the ensuing fiscal year. If the fiscal year performance targets are met, the performance shares are subsequently issued as restricted stock and vest over four years of continued employment.
Stock awards are being expensed ratably over the employees’ five-year requisite service period in accordance with the graded vesting schedule, resulting in more expense being recognized in the early years. Compensation expense related to restricted awards totaled $5,710,000, $5,339,000 and $3,529,000 for fiscal years 2009, 2008 and 2007, respectively. The remaining unamortized expense as of September 27, 2009 is $7,351,000, with a weighted average recognition period of 1.70 years.
Compensation expense related to stock options totaled $12,000, $37,000 and $324,000 for fiscal years 2009, 2008 and 2007, respectively. The fair value of the stock options was estimated at the date of grant using the Black-Scholes option pricing model. The Company used historical data to estimate the expected life, volatility and expected forfeitures of the stock option value. The risk-free rate was based on the U.S. Treasury rate in effect at the time of grant. The weighted average fair value for stock options granted in fiscal 2008 was $11.28 per option and was based on the following weighted average assumptions: an expected life of 6.32 years; a risk-free interest rate of 3.23%; volatility of 31.51%; and a dividend yield of 1.38%. No options were granted in fiscal years 2009 or 2007.
A summary of the status of the Company's restricted stock awards as of September 27, 2009, September 28, 2008 and September 30, 2007, changes during the periods ending on those dates and weighted average grant-date fair value (WAGFV) is presented below (shares in thousands):
| Stock Awards | September 27, 2009 | September 28, 2008 | September 30, 2007 | |||||||||||||
| Shares | WAGFV | Shares | WAGFV | Shares | WAGFV | |||||||||||
| Non-vested at beginning of period | 589 | 30.34 | 477 | 25.17 | 325 | $ | 20.92 | |||||||||
| Granted | 268 | 26.54 | 278 | 36.69 | 269 | 28.63 | ||||||||||
| Vested | (129 | ) | 26.97 | (90 | ) | 23.62 | (50 | ) | 21.55 | |||||||
| Forfeited | (61 | ) | 35.18 | (76 | ) | 29.02 | (67 | ) | 21.09 | |||||||
| Non-vested at end of period | 667 | 29.02 | 589 | 30.34 | 477 | 25.17 | ||||||||||
The total fair value of stock awards that vested during fiscal years 2009, 2008 and 2007 was $3,514,000, $3,280,000 and $1,417,000, respectively.
A summary of the status of the Company's stock option plans as of September 27, 2009, September 28, 2008, and September 30, 2007, changes during the years ending on those dates and related weighted average exercise price is presented below (shares in thousands):
| 2009 | 2008 | 2007 | ||||||||||||||||
| Stock Options | Shares | Price | Shares | Price | Shares | Price | ||||||||||||
| Outstanding at beginning of year | 483 | $ | 16.40 | 731 | $ | 16.01 | 1,179 | $ | 15.82 | |||||||||
| Granted | - | - | 10 | 35.24 | - | - | ||||||||||||
| Exercised | (110 | ) | 16.07 | (248 | ) | 16.01 | (440 | ) | 15.50 | |||||||||
| Forfeited | - | - | (8 | ) | 16.70 | (7 | ) | 16.40 | ||||||||||
| Expired | - | - | (2 | ) | 15.11 | (1 | ) | 15.83 | ||||||||||
| Outstanding at end of year | 373 | $ | 16.49 | 483 | $ | 16.40 | 731 | $ | 16.01 | |||||||||
| Options exercisable at year end | 373 | $ | 16.49 | 386 | $ | 16.27 | 447 | $ | 15.85 | |||||||||
As of September 27, 2009, all outstanding stock options were exercisable and the price per share ranged from $11.50 to $35.24. The total cash received from stock options exercised for the exercise price and related tax deductions are included in the Consolidated Condensed Statements of Shareholders’ Equity and Comprehensive Income. The Company has historically issued new shares to satisfy the stock options exercised. The aggregate intrinsic value of stock options outstanding at September 27, 2009 and September 28, 2008 was as follows (in thousands):
| 2009 | 2008 | |||||
| Intrinsic value of outstanding options at end of fiscal year | $ | 3,859 | $ | 8,346 | ||
| Intrinsic value of options exercisable at end of fiscal year | 3,859 | 6,713 | ||||
42
The aggregate intrinsic value of stock options exercised during fiscal 2009, 2008 and 2007 was $1,153,000, $4,847,000 and $6,178,000, respectively.
INCOME TAXES
The Company adopted the provisions on accounting for uncertainty in income taxes as prescribed by ASC Subtopic 740-10 at the beginning of fiscal 2008. At the date of adoption, the Company’s consolidated balance sheet included $6.7 million of tax positions that are highly certain but for which there is uncertainty about the timing. Because of the impact of deferred tax accounting, other than interest and penalties, the disallowance of these positions would not affect the annual effective tax rate but would accelerate the payment of cash to the tax authority to an earlier period. Also as of the adoption date, the Company had accrued interest expense related to the unrecognized tax liabilities of approximately $1.2 million. Due to the timing nature of the tax positions and the amount of related interest previously accrued, there was no cumulative effect of adopting the new provisions required to be recorded against retained earnings or material effect on the Company’s financial position, results of operations or cash flows.
The following table provides a reconciliation of the unrecognized tax liability for fiscal years 2009 and 2008 (in thousands):
| 2009 | 2008 | ||||||
| Gross taxes at beginning of year | $ | 5,036 | $ | 7,089 | |||
| Additions based on tax positions related to the current year | - | - | |||||
| Additions for tax positions of prior years | 510 | 239 | |||||
| Reductions for tax positions of prior years | (1,590 | ) | (792 | ) | |||
| Reductions for settlements | - | - | |||||
| Reductions for deposits made | - | (1,500 | ) | ||||
| Gross taxes at end of year | 3,956 | 5,036 | |||||
| Accumulated interest | 1,239 | 1,400 | |||||
| Federal tax benefit of state income tax deduction | (192 | ) | (289 | ) | |||
| Balance included in the Consolidated Balance Sheets at end of year | $ | 5,003 | $ | 6,147 | |||
The Company and its subsidiaries file a consolidated U.S. federal income tax return. The U.S. federal statute of limitations remains open for the fiscal year 1999 and onward with fiscal years 1999 to 2004 under examination by the Internal Revenue Service (the “IRS”). In connection with the fiscal years under examination, the Company has reached a settlement with the Appeals Division of the IRS and is in the process of completing the required documents and amending tax returns where required. The Company and some of its subsidiaries file separate tax returns with the state of North Carolina. The North Carolina statute of limitations for a few entities remains open for the fiscal years 2004 to 2006 due to an on-going audit by the North Carolina Department of Revenue (“NCDR”). The Company is currently in settlement negotiations with the NCDR and expects to conclude the matter within the next twelve months. Foreign and U.S. state jurisdictions have statutes of limitations generally ranging from 3 to 5 years.
Liabilities related to tax matters currently in the process of being settled are included with Other Current Liabilities in the Company’s Consolidated Balance Sheets. Management believes appropriate provisions for all outstanding issues have been made for all jurisdictions and all open tax years.
The provision for income taxes consisted of the following (in thousands):
| 2009 | 2008 | 2007 | ||||||||
| CURRENT | ||||||||||
| Federal | $ | 34,981 | $ | 34,313 | $ | 44,147 | ||||
| State and other | 6,851 | 9,381 | 8,764 | |||||||
| 41,832 | 43,694 | 52,911 | ||||||||
| DEFERRED | ||||||||||
| Federal | 8,092 | 12,398 | (3,550 | ) | ||||||
| State and other | 2,301 | 1,267 | 442 | |||||||
| 10,393 | 13,665 | (3,108 | ) | |||||||
| Provision for income taxes | $ | 52,225 | $ | 57,359 | $ | 49,803 | ||||
43
Income (loss) from foreign operations before income taxes in fiscal years 2009, 2008 and 2007 was $(1,949,000), $1,420,000 and $2,868,000, respectively. Income taxes provided on foreign operations in fiscal years 2009, 2008 and 2007 was $96,000, $931,000 and $425,000, respectively, including the minority interest in such taxes.
Income tax expense differed from an amount computed by applying the statutory tax rates to pre-tax income as follows (in thousands):
| 2009 | 2008 | 2007 | |||||||||
| Income tax on pre-tax income at the statutory | |||||||||||
| federal rate of 35% | $ | 48,366 | $ | 53,939 | $ | 45,672 | |||||
| Increase (decrease) attributable to: | |||||||||||
| State and other income taxes, net of federal income tax benefit | 6,585 | 6,589 | 6,229 | ||||||||
| Tax credits | (2,640 | ) | (2,820 | ) | (424 | ) | |||||
| Employee Stock Ownership Plan (ESOP) | (806 | ) | (920 | ) | (1,010 | ) | |||||
| COLI | (823 | ) | (459 | ) | (1,081 | ) | |||||
| Foreign Subsidiaries Loss (indefinitely invested) | 961 | 260 | 349 | ||||||||
| Other items, net | 582 | 770 | 68 | ||||||||
| Income tax expense | $ | 52,225 | $ | 57,359 | $ | 49,803 | |||||
The tax effects of temporary differences giving rise to the Company's consolidated deferred tax assets and liabilities at September 27, 2009 and September 28, 2008 are as follows (in thousands):
| 2009 | 2008 | ||||||
| Deferred Tax Assets: | |||||||
| Employee benefits | $ | 76,960 | $ | 27,466 | |||
| Rent obligations | 23,132 | 20,997 | |||||
| Reserves not currently deductible | 16,517 | 16,075 | |||||
| Vendor allowances | 6,766 | 7,656 | |||||
| Other | 6,103 | 5,261 | |||||
| Total deferred tax assets | $ | 129,478 | $ | 77,455 | |||
| Deferred Tax Liabilities: | |||||||
| Property, plant and equipment | $ | (75,043 | ) | $ | (60,296 | ) | |
| Inventories | (13,723 | ) | (14,205 | ) | |||
| Undistributed earnings on foreign subsidiaries | (3,696 | ) | (3,695 | ) | |||
| Other | (877 | ) | (3,645 | ) | |||
| Total deferred tax liabilities | $ | (93,339 | ) | $ | (81,841 | ) | |
As of September 27, 2009, the Company had approximately $6,108,000 of state cumulative net operating loss carryforwards, $9,169,000 of foreign cumulative net operating loss carryforwards and $309,000 of foreign tax credit carryforwards. The state net operating losses will begin to expire in fiscal 2022, the foreign net operating losses begin to expire in fiscal 2011 and the foreign tax credits begin to expire in fiscal 2010. A valuation allowance of $2,217,000 and $2,553,000 is included with deferred income taxes as of September 27, 2009 and September 28, 2008, respectively. The valuation allowance decreased by $336,000 from fiscal 2008 to fiscal 2009, increased by $1,117,000 from fiscal 2007 to fiscal 2008 and increased $697,000 from fiscal 2006 to fiscal 2007. The allowance was developed based upon the uncertainty of the realization of certain state and foreign deferred tax assets related to net operating losses and other foreign tax items. Although realization is not assured for the remaining deferred tax assets, it is considered more likely than not the deferred tax assets will be realized through future taxable earnings.
Undistributed earnings of the Company's foreign operations amount to approximately $20.9 million at September 27, 2009. Of those earnings, approximately $9.5 million are considered to be indefinitely reinvested and accordingly, no provision for U.S. federal and state income taxes is required to be provided thereon. If those earnings were distributed, the Company would be subject to U.S. federal taxes and withholding taxes payable to the various foreign countries of approximately $3.3 million.
44
INDUSTRY SEGMENT INFORMATION
The Company operates primarily in two businesses: retail grocery (including the real estate and store development activities of the Company) - Harris Teeter and industrial thread (textile primarily), including technical textiles and embroidery thread – A&E. Harris Teeter operates a regional chain of supermarkets in the southeastern United States. A&E manufactures and distributes sewing thread for the apparel and other markets, technical textiles and embroidery thread throughout their global operations. The Company evaluates performance of its two businesses utilizing various measures which are based on operating profit.
Summarized financial information for fiscal years 2009, 2008 and 2007 is as follows (in millions):
| Industrial | Retail | ||||||||||||
| Thread | Grocery | Corporate (1) | Consolidated | ||||||||||
| 2009 | |||||||||||||
| Net Sales | $ | 250.8 | $ | 3,827.0 | $ | 4,077.8 | |||||||
| Gross Profit | 47.9 | 1,169.5 | 1,217.4 | ||||||||||
| Operating Profit (Loss) | (14.6 | ) | 175.6 | $ | (6.1 | ) | 154.9 | ||||||
| Assets Employed at Year End | 261.4 | 1,463.5 | 119.4 | 1,844.3 | |||||||||
| Depreciation and Amortization | 15.6 | 109.8 | 0.1 | 125.5 | |||||||||
| Capital Expenditures | 2.5 | 206.7 | - | 209.2 | |||||||||
| 2008 | |||||||||||||
| Net Sales | $ | 327.6 | $ | 3,664.8 | $ | 3,992.4 | |||||||
| Gross Profit | 69.6 | 1,138.8 | 1,208.4 | ||||||||||
| Operating Profit (Loss) | 2.3 | 177.8 | $ | (6.3 | ) | 173.8 | |||||||
| Assets Employed at Year End | 291.4 | 1,306.2 | 98.8 | 1,696.4 | |||||||||
| Depreciation and Amortization | 17.9 | 96.4 | 0.1 | 114.4 | |||||||||
| Capital Expenditures | 7.3 | 192.2 | - | 199.5 | |||||||||
| 2007 | |||||||||||||
| Net Sales | $ | 339.8 | $ | 3,299.4 | $ | 3,639.2 | |||||||
| Gross Profit | 74.6 | 1,021.7 | 1,096.3 | ||||||||||
| Operating Profit (Loss) | 1.4 | 154.1 | $ | (7.3 | ) | 148.2 | |||||||
| Assets Employed at Year End | 284.3 | 1,150.5 | 94.9 | 1,529.7 | |||||||||
| Depreciation and Amortization | 19.1 | 81.1 | 0.6 | 100.8 | |||||||||
| Capital Expenditures | 7.7 | 205.5 | 6.7 | 219.9 | |||||||||
| (1) |
Corporate Operating Profit (Loss) includes a portion of compensation and benefits of holding company employees and certain other costs that are not related to the operating companies. Operating profit of the operating companies include all direct expenses and the common expenses incurred by the holding company on behalf of its operating subsidiaries. Corporate Assets Employed include investments in certain property and equipment, cash equivalents and life insurance contracts to support corporate-wide operations and benefit programs. |
Geographic information for the Company’s fiscal years is based on the operating locations where the items were produced or distributed as follows (in thousands):
| 2009 | 2008 | 2007 | ||||||
| Net Revenues – Domestic United States | $ | 3,940,608 | $ | 3,810,635 | $ | 3,454,198 | ||
| Net Revenues – Foreign | 137,214 | 181,762 | 185,010 | |||||
| $ | 4,077,822 | $ | 3,992,397 | $ | 3,639,208 | |||
| Net Long-Lived Assets – Domestic United States | $ | 1,088,602 | $ | 978,363 | $ | 860,493 | ||
| Net Long-Lived Assets – Foreign | 36,238 | 40,625 | 41,990 | |||||
| $ | 1,124,840 | $ | 1,018,988 | $ | 902,483 | |||
45
EMPLOYEE BENEFIT PLANS
The Company maintains various retirement benefit plans for substantially all domestic full-time employees of the Company and its subsidiaries. These plans include the Ruddick Retirement and Savings Plan (“Savings Plan”) which is a defined contribution retirement plan, the Ruddick Corporation Employees’ Pension Plan (“Pension Plan”) which is a qualified non-contributory defined benefit plan and the Supplemental Executive Retirement Plan (“SERP”) which is a non-qualified supplemental defined benefit pension plan for certain executive officers. Effective September 30, 2005, participation in the Pension Plan was closed to new entrants and frozen for all participants, with certain transition benefits provided to those participants that have achieved specified age and service levels on December 31, 2005.
Substantially all domestic full-time employees of the Company and its subsidiaries participate in one of the Company sponsored retirement plans. Employees in foreign subsidiaries participate to varying degrees in local pension plans, which, in the aggregate, are not significant. Employee retirement benefits or Company contribution amounts under the various plans are a function of both the years of service and compensation for a specified period of time before retirement. The Company's current funding policy for the Pension Plan is to contribute annually the amount required by regulatory authorities to meet minimum funding requirements and an amount to increase the funding ratios over future years to a level determined by its actuaries to be effective in reducing the volatility of contributions.
The Company’s fiscal year end is used as the measurement date for Company-sponsored defined benefit plans. The following table sets forth the change in the benefit obligation and plan assets, as well as the funded status and amounts recognized in the Company's consolidated balance sheets at September 27, 2009 and September 28, 2008 for the Pension Plan and SERP (in thousands):
| Pension Plan | SERP | ||||||||||||||
| 2009 | 2008 | 2009 | 2008 | ||||||||||||
| Change in benefit obligation: | |||||||||||||||
| Benefit obligation at the beginning of year | $ | 228,719 | $ | 280,151 | $ | 27,450 | $ | 30,863 | |||||||
| Service cost | 310 | 1,588 | 664 | 822 | |||||||||||
| Interest cost | 18,181 | 17,010 | 2,119 | 1,889 | |||||||||||
| Actuarial loss (Gain) | 91,251 | (58,932 | ) | 10,931 | (4,889 | ) | |||||||||
| Special Termination Benefits | 192 | - | - | - | |||||||||||
| Benefits paid | (11,217 | ) | (11,098 | ) | (1,235 | ) | (1,235 | ) | |||||||
| Pension benefit obligation at end of year | 327,436 | 228,719 | 39,929 | 27,450 | |||||||||||
| Change in plan assets: | |||||||||||||||
| Fair value of assets at the beginning of year | 211,863 | 248,193 | - | - | |||||||||||
| Actual return on plan assets | (7,463 | ) | (31,402 | ) | - | - | |||||||||
| Employer contribution | 7,500 | 7,500 | 1,235 | 1,235 | |||||||||||
| Benefits paid | (11,217 | ) | (11,098 | ) | (1,235 | ) | (1,235 | ) | |||||||
| Non-investment expenses | (1,378 | ) | (1,330 | ) | - | - | |||||||||
| Fair value of assets at end of year | 199,305 | 211,863 | - | - | |||||||||||
| Funded status | (128,131 | ) | (16,856 | ) | (39,929 | ) | (27,450 | ) | |||||||
| Unrecognized net actuarial loss | 169,477 | 50,830 | 12,412 | 1,481 | |||||||||||
| Unrecognized prior service cost | 353 | 508 | 2,044 | 2,292 | |||||||||||
| Prepaid (accrued) benefit cost | $ | 41,699 | $ | 34,482 | $ | (25,473 | ) | $ | (23,677 | ) | |||||
| Amounts recognized in the Consolidated Balance Sheets | |||||||||||||||
| consist of: | |||||||||||||||
| (Prepaid) Accrued benefit liability | $ | (41,699 | ) | $ | (34,482 | ) | $ | 25,473 | $ | 23,677 | |||||
| Accumulated other comprehensive income | 169,830 | 51,338 | 14,456 | 3,773 | |||||||||||
| Net amount recognized | $ | 128,131 | $ | 16,856 | $ | 39,929 | $ | 27,450 | |||||||
46
The Company’s defined benefit pension plans had projected and accumulated benefit obligations in excess of the fair value of plan assets as follows (in thousands):
| Pension Plan | SERP | ||||||||||
| 2009 | 2008 | 2009 | 2008 | ||||||||
| Projected benefit obligation | $ | 327,436 | $ | 228,719 | $ | 39,929 | $ | 27,450 | |||
| Accumulated benefit obligation | 288,937 | 207,093 | 28,133 | 19,903 | |||||||
| Fair value of plan assets | 199,305 | 211,863 | - | - | |||||||
A minimum pension liability adjustment is required when the projected benefit obligation exceeds the fair value of plan assets and accrued pension liabilities. This adjustment also requires the elimination of any previously recorded pension assets. The minimum liability adjustment, net of tax benefit, is reported as a component of other comprehensive income and included in the Statements of Consolidated Shareholders’ Equity and Comprehensive Income.
Net periodic pension expense for the Company’s defined benefit pension plans for fiscal years 2009, 2008 and 2007 included the following components (in thousands):
| Pension Plan | 2009 | 2008 | 2007 | ||||||||
| Service cost | $ | 310 | $ | 1,588 | $ | 2,040 | |||||
| Interest cost | 18,181 | 17,010 | 16,157 | ||||||||
| Expected return on plan assets | (18,555 | ) | (18,598 | ) | (17,335 | ) | |||||
| Amortization of prior service cost | 155 | 220 | 220 | ||||||||
| Recognized net actuarial loss | - | 4,424 | 6,971 | ||||||||
| Net periodic pension expense | $ | 91 | $ | 4,644 | $ | 8,053 | |||||
| SERP | |||||||||||
| Service cost | $ | 664 | $ | 822 | $ | 800 | |||||
| Interest cost | 2,119 | 1,889 | 1,741 | ||||||||
| Amortization of prior service cost | 247 | 248 | 109 | ||||||||
| Recognized net actuarial loss | - | 461 | 767 | ||||||||
| Net periodic pension expense | $ | 3,030 | $ | 3,420 | $ | 3,417 | |||||
Net periodic pension expense for the Company’s defined benefit pension plans is determined using assumptions as of the beginning of each year. The projected benefit obligation and related funded status are determined using assumptions as of the end of each year. The following table summarizes the assumptions utilized:
| 2009 | 2008 | 2007 | ||||||
| Weighted Average Discount Rate – Pension Plan | 5.75% | 7.90% | 6.25% | |||||
| Weighted Average Discount Rate – SERP | 5.60% | 7.90% | 6.25% | |||||
| Rate of Increase in Future Payroll Costs: | ||||||||
| Pension Plan | 3.0% - 8.0% | * | 3.0% - 8.0% | * | 3.0% - 8.0% | * | ||
| SERP | 6.0% | 6.0% | 6.0% | |||||
| Assumed Long-Term Rate of Return on Assets (Pension Plan only) | 8.00% | 8.00% | 8.25% |
* Rate varies by age, higher rates are associated with lower aged participants.
Discount rates are based on the expected timing and amounts of the expected employer paid benefits and are established by reference to a representative yield curve of non-callable bonds with a credit rating of Aa and above with durations similar to the pension liabilities. The weighted average discount rate utilized at the end of fiscal 2009 of 5.75% for the Pension Plan represents a decrease of 215 basis points over the prior year and significantly increased the recorded pension liabilities, under-funded status and unrecognized net actuarial loss as of the end of fiscal 2009. These increases will require the Company to recognize approximately $9.0 million of net actuarial losses as part of the Pension Plan’s net periodic pension expense in fiscal 2010.
Expected long-term return on plan assets is estimated by asset class and is generally based on historical returns, volatilities and risk premiums. Based upon the plan’s asset allocation, composite return percentiles are developed upon which the plan’s expected long-term rate of return is based.
47
The SERP is unfunded, with benefit payments being made from the Company’s general assets. Assets of the Pension Plan are invested in directed trusts. Assets in the directed trusts as of the fiscal year end were invested as follows:
| Asset Class | 2009 | 2008 | |
| Fixed income | 40.2% | 30.3% | |
| Domestic equities | 31.5 | 37.1 | |
| International equities | 8.1 | 7.5 | |
| Tactical asset allocation fund | - | 11.1 | |
| Alternative Investments – Real Estate | 3.1 | 4.5 | |
| Alternative Investments – Hedge Funds | 3.4 | 4.7 | |
| Guaranteed investment contracts | 1.0 | 0.9 | |
| Cash equivalents | 12.7 | 3.9 | |
| 100% | 100% |
Investments in the pension trust are overseen by the Retirement Plan Committee which is made up of officers of the Company and directors. The plan assets are split into two segments: the Strategic Allocation segment over which the Committee retains responsibility for directing and monitoring asset allocation, and the Tactical Allocation segment which is directed by an advisor selected by the Committee.
The Company has developed an Investment Policy Statement based on the need to satisfy the long-term liabilities of the Pension Plan. The Company seeks to maximize return with reasonable and prudent levels of risk. Risk management is accomplished through diversification across asset classes, multiple investment manager portfolios and both general and portfolio-specific investment guidelines. Asset guidelines for the Strategic Allocation segment are:
| Asset Class | Minimum Exposure | Target | Maximum Exposure | ||
| Investment grade fixed income and cash equivalents | 30.0% | 40.0% | 50.0% | ||
| Domestic equities: | 25.0 | 40.0 | 55.0 | ||
| Large cap value | 3.0 | 9.0 | 20.0 | ||
| Large cap growth | 3.0 | 9.0 | 20.0 | ||
| Large cap core | 3.0 | 10.0 | 20.0 | ||
| Small cap value | 0.0 | 6.0 | 12.0 | ||
| Small cap growth | 0.0 | 6.0 | 12.0 | ||
| International equities: | 5.0 | 10.0 | 15.0 | ||
| International growth | 0.0 | 5.0 | 10.0 | ||
| International value | 0.0 | 5.0 | 10.0 | ||
| Alternative Investments: | 0.0 | 10.0 | 20.0 | ||
| Real Estate | 0.0 | 5.0 | 10.0 | ||
| Hedge Funds | 0.0 | 5.0 | 10.0 |
Managers are expected to generate a total return consistent with their philosophy, offer protection in down markets and achieve a rate of return which ranks in the top 40% of a universe of similarly managed portfolios and outperforms a target index, net of expenses, over rolling three year periods.
The Investment Policy Statement contains the following guidelines:
| – |
Categorical restrictions such as limiting the average weighted duration of fixed income investments, limiting the aggregate amount of American Depository Receipts (ADRs), no direct foreign currency speculation, limited foreign exchange contracts, and limiting the use of derivatives; | |
| – |
Portfolio restrictions that address such things as investment restrictions, proxy voting, and brokerage arrangements; and | |
| – |
Asset class restrictions that address such things as single security or sector concentration, capitalization limits and minimum quality standards. |
The Company plans to contribute $7.5 million to the Pension Plan and approximately $1.3 million to the SERP during fiscal 2010. Due to the current economic environment that has resulted in a significant decrease in the market value of Pension Plan assets during fiscal 2009, the Company may increase the planned contribution in fiscal 2010. The Company’s contribution to the SERP represents the benefit payments made during the fiscal year.
48
The following benefit payments, which reflect expected future service, as appropriate, are expected to be paid by the Company’s defined benefit pension plans (in thousands):
| Pension Plan | SERP | ||||
| 2010 | $ | 11,809 | $ | 1,279 | |
| 2011 | 12,720 | 1,262 | |||
| 2012 | 13,703 | 1,367 | |||
| 2013 | 14,733 | 1,644 | |||
| 2014 | 15,794 | 2,173 | |||
| Years 2015-2019 | 95,876 | 13,445 | |||
The Savings Plan is a defined contribution retirement plan pursuant to Section 401(k) of the Internal Revenue Code, that was authorized for the purpose of providing retirement benefits for employees of the Company. The Company provides a matching contribution based on the amount of eligible compensation contributed by the associate and an automatic retirement contribution based on age and years of service.
The Company has certain deferred compensation arrangements which allow, or allowed in prior years, its directors, officers and selected key management personnel to forego the receipt of earned compensation for specified periods of time. These arrangements include (1) a directors’ compensation deferral plan, funded in a rabbi trust, the benefit and payment under such plan being made in the Company’s common stock that has historically been purchased on the open market, (2) a key management deferral plan, unfunded, the benefit liability under such plan determined on the basis of the performance of selected market investment indices, and (3) other compensation deferral arrangements, unfunded and only available to directors and select key management in prior years, the benefit liability for which is determined based on fixed rates of interest.
Expense associated with the Savings Plan, deferred compensation arrangements and other plans, were as follows (in thousands):
| 2009 | 2008 | 2007 | ||||
| Savings Plan | $ 21,608 | $ 19,189 | $ 18,350 | |||
| Deferred Compensation and other | 1,734 | 394 | 1,679 |
COMPUTATION OF EARNINGS PER SHARE (EPS)
The following table details the computation of EPS for fiscal years 2009, 2008 and 2007 (in thousands except per share data):
| 2009 | 2008 | 2007 | ||||||
| Basic EPS: | ||||||||
| Net income | $ | 85,964 | $ | 96,752 | $ | 80,688 | ||
| Weighted average common shares outstanding | 47,964 | 47,824 | 47,605 | |||||
| Basic EPS | $ | 1.79 | $ | 2.02 | $ | 1.69 | ||
| Diluted EPS: | ||||||||
| Net income | $ | 85,964 | $ | 96,752 | $ | 80,688 | ||
| Weighted average common shares outstanding | 47,964 | 47,824 | 47,605 | |||||
| Net potential common share equivalents - stock options | 119 | 260 | 379 | |||||
| Net potential common share equivalents - stock awards | 254 | 211 | 155 | |||||
| Weighted average common shares outstanding | 48,337 | 48,295 | 48,139 | |||||
| Diluted EPS | $ | 1.78 | $ | 2.00 | $ | 1.68 | ||
| Excluded from the calculation of common share equivalents: | ||||||||
| Anti-dilutive common share equivalents – stock options | 10 | 6 | - | |||||
| Anti-dilutive common share equivalents – stock awards | - | - | - | |||||
Stock awards that are based on performance are excluded from the calculation of potential common share equivalents until the performance criteria are met. Accordingly, the impact of 137,000, 139,000 and 114,000 performance shares for the fiscal years 2009, 2008 and 2007, respectively, were excluded from the computation of diluted shares.
49
COMMITMENTS AND CONTINGENCIES
The Company is involved in various lawsuits and environmental and patent matters arising in the normal course of business. Management believes that such matters will not have a material effect on the financial condition or results of operations of the Company.
See "Leases" above in this Item 8 for additional commitments and contingencies.
QUARTERLY INFORMATION (UNAUDITED)
The Company’s stock is listed and traded on the New York Stock Exchange. The following table sets forth certain financial information, the high and low sales prices and dividends declared for the common stock for the periods indicated (in millions, except per share data):
| First | Second | Third | Fourth | Fiscal | ||||||||||
| Quarter | Quarter | Quarter | Quarter | Year | ||||||||||
| 2009 Operating Results (1) | ||||||||||||||
| Net Sales | $ | 995.0 | $ | 1,010.0 | $ | 1,024.9 | $ | 1,047.9 | $ | 4,077.8 | ||||
| Gross Profit | 300.9 | 304.9 | 305.2 | 306.4 | 1,217.4 | |||||||||
| Net Income | 22.9 | 22.9 | 16.5 | 23.7 | 86.0 | |||||||||
| Net Income Per Share: | ||||||||||||||
| Basic | 0.48 | 0.48 | 0.34 | 0.49 | 1.79 | |||||||||
| Diluted | 0.47 | 0.48 | 0.34 | 0.49 | 1.78 | |||||||||
| Dividend Per Share | 0.12 | 0.12 | 0.12 | 0.12 | 0.48 | |||||||||
| Market Price Per Share: | ||||||||||||||
| High | 33.74 | 29.20 | 26.87 | 28.00 | 33.74 | |||||||||
| Low | 23.81 | 18.86 | 22.00 | 21.77 | 18.86 | |||||||||
| 2008 Operating Results | ||||||||||||||
| Net Sales | $ | 976.7 | $ | 975.6 | $ | 1,013.6 | $ | 1,026.5 | $ | 3,992.4 | ||||
| Gross Profit | 291.0 | 301.4 | 307.4 | 308.6 | 1,208.4 | |||||||||
| Net Income | 23.4 | 24.1 | 24.5 | 24.8 | 96.8 | |||||||||
| Net Income Per Share: | ||||||||||||||
| Basic | 0.49 | 0.50 | 0.51 | 0.52 | 2.02 | |||||||||
| Diluted | 0.48 | 0.50 | 0.51 | 0.51 | 2.00 | |||||||||
| Dividend Per Share | 0.12 | 0.12 | 0.12 | 0.12 | 0.48 | |||||||||
| Market Price Per Share: | ||||||||||||||
| High | 38.03 | 36.99 | 39.79 | 38.98 | 39.79 | |||||||||
| Low | 31.15 | 31.71 | 33.89 | 29.47 | 29.47 | |||||||||
| (1) |
Operating results include non-cash charges of $9,891,000 ($6,099,000 after tax benefits, or $0.13 per diluted share) related to goodwill and long-lived asset impairments recognized by A&E in the third quarter of fiscal 2009. |
Item 9. Changes in and Disagreements with Accountants on Accounting and Financial Disclosure
None
50
Item 9A. Controls and Procedures
(a) Evaluation of disclosure controls and procedures. As of September 27, 2009, an evaluation of the effectiveness of the Company’s disclosure controls and procedures (as defined in Rule 13a-15(e) and 15d-15(e) promulgated under the Securities Exchange Act of 1934, as amended (the “Exchange Act”)) was performed under the supervision and with the participation of the Company’s management, including the Chief Executive Officer and Chief Financial Officer. Based on that evaluation, the Company’s Chief Executive Officer and Chief Financial Officer have concluded that the Company’s disclosure controls and procedures are effective to ensure that information required to be disclosed by the Company in its reports that it files or submits under the Exchange Act is recorded, processed, summarized and reported within the time periods specified in the Securities and Exchange Commission rules and forms, and that information required to be disclosed by the Company in the reports the Company files or submits under the Exchange Act is accumulated and communicated to the Company’s management, including its Chief Executive Officer and Chief Financial Officer, as appropriate to allow timely decisions regarding required disclosure.
(b) Management’s annual report on internal control over financial reporting. Management of the Company is responsible for establishing and maintaining adequate internal control over financial reporting (as defined in Rule 13a-15(f) and 15d-15(f) promulgated under the Exchange Act). The Company’s internal control over financial reporting is a process designed to provide reasonable assurance regarding the reliability of financial reporting and the preparation of financial statements for external purposes in accordance with generally accepted accounting principles. The Company’s internal control over financial reporting includes those policies and procedures that (i) pertain to the maintenance of records that, in reasonable detail, accurately and fairly reflect the transactions and dispositions of the assets of the Company; (ii) provide reasonable assurance that transactions are recorded as necessary to permit preparation of financial statements in accordance with generally accepted accounting principles, and that receipts and expenditures of the Company are being made only in accordance with authorizations of management and directors of the Company; and (iii) provide reasonable assurance regarding prevention or timely detection of unauthorized acquisition, use, or disposition of the Company’s assets that could have a material effect on the financial statements.
Because of its inherent limitations, internal control over financial reporting may not prevent or detect misstatements. Also, projections of any evaluation of effectiveness to future periods are subject to the risk that controls may become inadequate because of changes in conditions, or that the degree of compliance with the policies or procedures may deteriorate.
Management assessed the effectiveness of the Company’s internal control over financial reporting as of September 27, 2009, based on the framework set forth by the Committee of Sponsoring Organizations of the Treadway Commission (COSO) in Internal Control-Integrated Framework. Based on that assessment, management concluded that, as of September 27, 2009, the Company’s internal control over financial reporting is effective based on the criteria established in Internal Control-Integrated Framework.
(c) Attestation report of the registered public accounting firm. The effectiveness of the Company’s internal control over financial reporting as of September 27, 2009 has been audited by KPMG, LLP, an independent registered public accounting firm. Their report, which appears in Item 8, Financial Statement and Supplementary Data included herein, expresses an unqualified opinion on the effectiveness of the Company’s internal control over financial reporting as of September 27, 2009.
(d) Changes in internal control over financial reporting. During the Company’s fourth fiscal quarter of 2009, there has been no change in the Company’s internal controls over financial reporting that has materially affected, or is reasonably likely to materially affect, the Company’s internal controls over financial reporting.
Item 9B. Other Information
None.
51
PART III
Item 10. Directors and Executive Officers of the Registrant
For information regarding executive officers, refer to “Executive Officers of the Registrant” in Item 4A hereof. Other information required by this item is incorporated herein by reference to the sections entitled "Election of Directors," “Corporate Governance Matters” and “Section 16(a) Beneficial Ownership Reporting Compliance” in the Company's Proxy Statement to be filed with the Securities and Exchange Commission with respect to the Company's 2010 Annual Meeting of Shareholders (the "2010 Proxy Statement").
Code of Ethics and Code of Business
Conduct and Ethics
The Company has adopted
a written Code of Ethics (the “Code of Ethics”) that applies to our Chairman of
the Board, President and Chief Executive Officer, Vice President-Finance and
Chief Financial Officer and our Vice President and Treasurer. The Company has
also adopted a Code of Business Conduct and Ethics (the “Code of Conduct”) that
applies to all employees, officers and directors of the Company as well as any
subsidiary company officers that are executive officers of the Company. Each of
our operating subsidiaries maintains a code of ethics tailored to their
businesses. The Code of Ethics and Code of Conduct are available on the
Company’s website, www.ruddickcorp.com, under the “Corporate Governance” caption, and print copies
are available to any shareholder that requests a copy. Any such requests should
be directed to: Ruddick Corporation, 301 South Tryon Street, Suite 1800,
Charlotte, North Carolina 28202, Attention: Secretary of the Company. Any
amendments to the Code of Ethics or Code of Conduct, or any waivers of the Code
of Ethics, or any waiver of the Code of Conduct for directors or executive
officers, will be disclosed on the Company’s website promptly following the date
of such amendment or waiver. Information on the Company’s website, however, does
not form a part of this Form 10-K.
Corporate Governance Guidelines and
Committee Charters
In furtherance of its
longstanding goal of providing effective governance of the Company’s business
and affairs for the benefit of shareholders, the Board of Directors of the
Company has approved Corporate Governance Guidelines. The Guidelines contain
general principles regarding the functions of the Company’s Board of Directors.
The Guidelines are available on the Company’s website referenced above and print
copies are available to any shareholder that requests a copy. In addition,
committee charters for the Company’s Audit Committee, Compensation Committee and
Corporate Governance and Nominating Committee are also included on the Company’s
website and print copies are available to any shareholder that requests a copy
in accordance with the procedures set forth above.
Item 11. Executive Compensation
The information required by this item is incorporated herein by reference to the sections entitled “Election of Directors -Directors' Fees and Attendance,” “Compensation Committee Interlocks and Insider Participation in Compensation Decisions,” “Report of the Compensation Committee,” “Compensation Discussion and Analysis” and “Section 16(a) Beneficial Ownership Reporting Compliance” in the 2010 Proxy Statement.
Item 12. Security Ownership of Certain Beneficial Owners and Management and Related Shareholder Matters
The information required by this item is incorporated herein by reference to the sections entitled “Principal Shareholders” and “Election of Directors-Beneficial Ownership of Company Stock” in the 2010 Proxy Statement and “Equity Compensation Plan Information” in Item 5 hereof.
Item 13. Certain Relationships and Related Transactions, and Director Independence
The information required by this item is incorporated herein by reference to the section entitled “Transactions with Related Persons and Certain Control Persons” and “Corporate Governance Matters” in the 2010 Proxy Statement.
Item 14. Principal Accountant Fees and Services
The information required by this item is incorporated herein by reference to the section entitled “Ratification of the Independent Registered Public Accounting Firm” in the 2010 Proxy Statement.
52
PART IV
Item 15. Exhibits and Financial Statement Schedules
| (a) | The following documents are filed as part of this report: | Page | ||||
| (1) | Financial Statements: | |||||
| Report of Independent Registered Public Accounting Firm | 27 | |||||
| Consolidated Balance Sheets, September 27, 2009 and September 28, 2008 | 29 | |||||
| Statements of Consolidated Income for the fiscal years ended September 27, 2009, September 28, 2008, and September 30, 2007 | 30 | |||||
| Statements of Consolidated Shareholders’ Equity and Comprehensive Income for the fiscal years ended September 27, 2009, September 28, 2008, and September 30, 2007 | 31 | |||||
| Statements of Consolidated Cash Flows for the fiscal years ended September 27, 2009, September 28, 2008, and September 30, 2007 | 32 | |||||
| Notes to Consolidated Financial Statements | 33 | |||||
| (2) | Financial Statement Schedules: The following report and financial statement schedules are filed herewith: | |||||
| Schedule I - Valuation and Qualifying Accounts and Reserves | S-1 | |||||
| All other schedules are omitted as the required information is inapplicable or the information is presented in the consolidated financial statements or related notes thereto. | ||||||
| (3) | Index to Exhibits: The following exhibits are filed with this report or, as noted, incorporated by reference herein. | |||||
| Exhibit | |||
| Number | Description of Exhibit | ||
| 3.1* |
Restated Articles of Incorporation of the Company, dated December 14, 2000, incorporated herein by reference to Exhibit 3.1 of the registrant’s Annual Report on Form 10-K for the fiscal year ended October 1, 2000 (Commission File No. 1-6905). | ||
| 3.2* |
Amended and Restated Bylaws of Ruddick Corporation, incorporated herein by reference to Exhibit 3.1 of the registrant’s Current Report on Form 8-K dated February 21, 2008 (Commission File No. 1-6905). | ||
| 4.1* |
$50,000,000 6.48% Series A Senior Notes due March 1, 2011 and $50,000,000 Private Shelf Facility dated March 1, 1996 between Ruddick Corporation and The Prudential Insurance Company of America, incorporated herein by reference to Exhibit 4.1 of the registrant’s Quarterly Report on Form 10-Q for the quarterly period ended March 31, 1996 (Commission File No. 1-6905). | ||
| 4.2* |
$50,000,000 7.55% Senior Series B Notes due July 15, 2017 and $50,000,000 7.72% Series B Senior Notes due April 15, 2017 under the Note Purchase and Private Shelf Agreement dated April 15, 1997 between Ruddick Corporation and The Prudential Insurance Company of America, incorporated herein by reference to Exhibit 4.3 of the registrant’s Annual Report on Form 10-K for the fiscal year period ended September 28, 1997 (Commission File No. 1-6905). | ||
53
| Exhibit | |||
| Number | Description of Exhibit | ||
| 4.3* |
Credit Agreement, dated December 20, 2007, among Ruddick Corporation, as Borrower, Wachovia Bank, National Association, Branch Banking and Trust Company, Regions Bank, Bank of America, N.A., JPMorgan Chase Bank, N.A., RBC Centura, CoBank, ACB, AgFirst Farm Credit Bank, U.S. AgBank, FCB, Farm Credit Bank of Texas and GreenStone Farm Credit Services, ACA, as Lenders, and Wachovia Bank, National Association, as administrative agent for the Lenders, incorporated herein by reference to Exhibit 10.1 of the registrant’s Current Report on Form 8-K dated December 20, 2007 (Commission File No. 1-6905). | ||
|
The Company has other long-term debt but has not filed the instruments evidencing such debt as part of Exhibit 4 as none of such instruments authorize the issuance of debt exceeding 10 percent of the total consolidated assets of the Company. The Company agrees to furnish a copy of each such agreement to the Commission upon request. | |||
| 10.1* |
Ruddick Supplemental Executive Retirement Plan, as amended and restated, incorporated herein by reference to Exhibit 10.1 of the registrant’s Current Report on Form 8-K dated December 9, 2008 (Commission File No. 1-6905).** | ||
| 10.2* |
Resolutions adopted by the Board of Directors of the Company and the Plan's Administrative Committee with respect to benefits payable under the Company's Supplemental Executive Retirement Plan to Alan T. Dickson and R. Stuart Dickson, incorporated herein by reference to Exhibit 10.3 of the registrant’s Annual Report on Form 10-K for the fiscal year ended September 29, 1991 (Commission File No. 1-6905).** | ||
| 10.3* |
Deferred Compensation Plan for Key Employees of Ruddick Corporation and subsidiaries, as amended and restated, incorporated herein by reference to Exhibit 10.5 of the registrant’s Annual Report on Form 10-K for the fiscal year ended September 30, 1990 (Commission File No. 1-6905).** | ||
| 10.4* |
1993 Incentive Stock Option and Stock Appreciation Rights Plan, incorporated herein by reference to Exhibit 10.7 of the registrant’s Annual Report on Form 10-K for the fiscal year ended October 3, 1993 (Commission File No. 1-6905).** | ||
| 10.5* |
Description of the Ruddick Corporation Long Term Key Management Incentive Program, incorporated herein by reference to Exhibit 10.7 of the registrant’s Annual Report on Form 10-K for the fiscal year ended September 29, 1991 (Commission File No. 1-6905).** | ||
| 10.6* |
Ruddick Corporation Irrevocable Trust for the Benefit of Participants in the Long Term Key Management Incentive Program, incorporated herein by reference to Exhibit 10.9 of the registrant's Annual Report on Form 10-K for the fiscal year ended September 30, 1990 (Commission File No. 1-6905).** | ||
| 10.7* |
Rights Agreement dated November 16, 2000 by and between the Company and First Union National Bank, incorporated herein by reference to Exhibit 10.9 of the registrant’s Annual Report on Form 10-K for the fiscal year ended October 1, 2000 (Commission File No. 1-6905). | ||
| 10.8* |
Ruddick Corporation Senior Officers Insurance Program Plan Document and Summary Plan Description, incorporated herein by reference to Exhibit 10.10 of the registrant’s Annual Report on Form 10-K for the fiscal year ended September 27, 1992 (Commission File No. 1-6905).** | ||
| 10.9* |
Ruddick Corporation 1995 Comprehensive Stock Option Plan (the “1995 Plan”), incorporated herein by reference to Exhibit 10.1 of the registrant’s Quarterly Report on Form 10-Q for the quarterly period ended June 30, 1996 (Commission File No. 1-6905).** | ||
| 10.10* |
Ruddick Corporation 1997 Comprehensive Stock Option and Award Plan (the “1997 Plan”), incorporated herein by reference to Exhibit 10.1 of the registrant’s Quarterly Report on Form 10-Q for the quarterly period ended December 28, 1997 (Commission File No. 1-6905).** | ||
| 10.11* |
Ruddick Corporation Director Deferral Plan, as amended and restated, incorporated herein by reference to Exhibit 10.3 of the registrant’s Current Report on Form 8-K dated December 9, 2008 (Commission File No. 1-6905).** | ||
54
| Exhibit | |||
| Number | Description of Exhibit | ||
| 10.12* |
Ruddick Corporation Senior Officers Insurance Program, incorporated herein by reference to Exhibit 10.3 of the registrant’s Quarterly Report on Form 10-Q for the quarterly period ended March 29, 1998 (Commission File No. 1-6905).** | ||
| 10.13* |
Ruddick Corporation 2000 Comprehensive Stock Option and Award Plan (the “2000 Plan”), incorporated herein by reference to Exhibit 10.1 of the registrant’s Quarterly Report on Form 10-Q for the quarterly period ended April 1, 2001 (Commission File No. 1-6905).** | ||
| 10.14* |
Description of retirement arrangement between the Company and each of Alan T. Dickson and R. Stuart Dickson effective May 1, 2002, incorporated herein by reference to Exhibit 10.1 of the registrant’s Quarterly Report on Form 10-Q for the quarterly period ended June 30, 2002 (Commission File No. 1-6905).** | ||
| 10.15* |
Ruddick Corporation Flexible Deferral Plan – Amendment and Restatement Effective July 1, 2009, incorporated herein by reference to Exhibit 10.2 of the registrant’s Quarterly Report on Form 10-Q for the quarterly period ended June 28, 2009 (Commission File No. 1-6905).** | ||
| 10.16* |
Ruddick Corporation 2002 Comprehensive Stock Option and Award Plan (the “2002 Plan”), incorporated herein by reference to Exhibit 10.1 of the Registrant’s Quarterly Report on Form 10-Q for the quarterly period ended March 30, 2003 (Commission File No. 1-6905).** | ||
| 10.17* |
Form of Ruddick Corporation Non-Employee Director Nonqualified Stock Option Agreement for use in connection with the 1995 Plan, 1997 Plan, 2000 Plan and 2002 Plan, incorporated herein by reference to Exhibit 10.1 to the Company’s Current Report on Form 8-K dated November 17, 2004 (Commission File No. 1-6905).** | ||
| 10.18* |
Form of Ruddick Corporation Incentive Stock Option Award Agreement for use in connection with the 1995 Plan, 1997 Plan, 2000 Plan and 2002 Plan, incorporated herein by reference to Exhibit 10.2 to the Company’s Current Report on Form 8-K dated November 17, 2004 (Commission File No. 1-6905).** | ||
| 10.19* |
Form of Ruddick Corporation Nonqualified Stock Option Agreement for use in connection with the 1995 Plan, 1997 Plan, 2000 Plan and 2002 Plan, incorporated herein by reference to Exhibit 10.3 to the Company’s Current Report on Form 8-K dated November 17, 2004 (Commission File No. 1-6905).** | ||
| 10.20* |
Form of Ruddick Corporation Restricted Stock Award Agreement for use in connection with the 1997 Plan, 2000 Plan and 2002 Plan, incorporated herein by reference to Exhibit 10.4 to the Company’s Current Report on Form 8-K dated November 17, 2004 (Commission File No. 1-6905).** | ||
| 10.21* |
Summary of Executive Bonus Plan, incorporated by reference to Exhibit 10.26 of the registrant’s Annual Report on Form 10-K for the fiscal year ended October 3, 2004 (Commission File No. 1-6905).** | ||
| 10.22* |
Ruddick Corporation Supplemental Executive Retirement Plan for the benefit of Alan T. Dickson effective March 31, 2006, incorporated herein by reference to Exhibit 10.1 of the registrant’s Current Report on Form 8-K dated March 31, 2006 (Commission File No. 1-6905).** | ||
| 10.23* |
Ruddick Corporation Supplemental Executive Retirement Plan for the benefit of R. Stuart Dickson effective March 31, 2006, incorporated herein by reference to Exhibit 10.2 of the registrant’s Current Report on Form 8-K dated March 31, 2006 (Commission File No. 1-6905).** | ||
| 10.24* |
Ruddick Corporation Cash Incentive Plan, incorporated herein by reference to Exhibit 10.1 of the registrant’s Current Report on Form 8-K dated February 15, 2007 (Commission File No. 1-6905).** | ||
| 10.25* |
Addendum to the Ruddick Corporation 2002 Comprehensive Stock Option and Award Plan, incorporated herein by reference to Exhibit 10.2 of the registrant’s Current Report on Form 8-K dated February 15, 2007 (Commission File No. 1-6905).** | ||
55
| Exhibit | ||
| Number | Description of Exhibit | |
| 10.26* | Change-in-Control and Severance Agreement dated September 19, 2007 between the registrant and Mr. Tomas W. Dickson, incorporated herein by reference to Exhibit 10.1 of the registrant’s Current Report on Form 8-K dated September 19, 2007 (Commission File No. 1-6905).** | |
| 10.27* | Change-in-Control and Severance Agreement dated September 19, 2007 between the registrant and Mr. John B. Woodlief, incorporated herein by reference to Exhibit 10.2 of the registrant’s Current Report on Form 8-K dated September 19, 2007 (Commission File No. 1-6905).** | |
| 10.28* | Change-in-Control and Severance Agreement dated September 19, 2007 between the registrant and Mr. Frederick J. Morganthall, II, incorporated herein by reference to Exhibit 10.3 of the registrant’s Current Report on Form 8-K dated September 19, 2007 (Commission File No. 1-6905).** | |
| 10.29* | Change-in-Control and Severance Agreement dated September 19, 2007 between the registrant and Mr. Fred A. Jackson, incorporated herein by reference to Exhibit 10.4 of the registrant’s Current Report on Form 8-K dated September 19, 2007 (Commission File No. 1-6905).** | |
| 10.30* | Ruddick Supplemental Executive Retirement Plan, Amendment No. 2 dated September 19, 2007, incorporated herein by reference to Exhibit 10.5 of the registrant’s Current Report on Form 8-K dated September 19, 2007 (Commission File No. 1-6905).** | |
| 10.31* | First Amendment to the Ruddick Corporation Director Deferral Plan, incorporated herein by reference to Exhibit 10.1 of the registrant’s Quarterly Report on Form 10-Q for the quarterly period ended March 29, 2009 (Commission File No. 1-6905).** | |
| 10.32* | Second Amendment to the Ruddick Corporation Director Deferral Plan, incorporated herein by reference to Exhibit 10.1 of the registrant’s Quarterly Report on Form 10-Q for the quarterly period ended June 28, 2009 (Commission File No. 1-6905).** | |
| 10.33+ | Summary of Non-Employee Director Compensation. | |
| 21+ | List of Subsidiaries of the Company. | |
| 23+ | Consent of Independent Registered Public Accounting Firm. | |
| 31.1+ | Certification of Chief Executive Officer pursuant to Rule 13a-14(a)/15d-14(a) of the Securities Exchange Act of 1934, as adopted pursuant to Section 302 of the Sarbanes-Oxley Act of 2002. | |
| 31.2+ | Certification of Chief Financial Officer pursuant to Rule 13a-14(a)/15d-14(a) of the Securities Exchange Act of 1934, as adopted pursuant to Section 302 of the Sarbanes-Oxley Act of 2002. | |
| 32.1+ | Certification of Chief Executive Officer pursuant to 18 U.S.C. Section 1350, as adopted pursuant to Section 906 of the Sarbanes-Oxley Act of 2002. | |
| 32.2+ | Certification of Chief Financial Officer pursuant to 18 U.S.C. Section 1350, as adopted pursuant to Section 906 of the Sarbanes-Oxley Act of 2002. | |
| * | Incorporated by reference. |
| ** | Indicates management contract or compensatory plan required to be filed as an Exhibit. |
| + | Indicates exhibits filed herewith and follow the signature pages. |
| (b) | Exhibits |
| See (a )(3) above. | |
| (c) | Financial Statement Schedules |
| See (a) (2) above. |
56
SIGNATURES
Pursuant to the requirements of Section 13 or 15(d) of the Securities Exchange Act of 1934, the Registrant has duly caused this report to be signed on its behalf by the undersigned, thereunto duly authorized.
| RUDDICK CORPORATION | ||||
| (Registrant) | ||||
| Dated: November 20, 2009 | By: | /s/ THOMAS W. DICKSON | ||
| Thomas W. Dickson, | ||||
| Chairman of the Board, President and | ||||
| Chief Executive Officer | ||||
Pursuant to the requirements of the Securities Exchange Act of 1934, this report has been signed below by the following persons on behalf of the Registrant and in the capacities and on the dates indicated:
| Name | Title | Date | ||
| /s/ THOMAS W. DICKSON | Chairman of the Board , President and | November 20, 2009 | ||
| Thomas W. Dickson | Chief Executive Officer and Director | |||
| (Principal Executive Officer) | ||||
| /s/ JOHN B. WOODLIEF | Vice President – Finance and Chief | November 20, 2009 | ||
| John B. Woodlief | Financial Officer (Principal Financial Officer) | |||
| /s/ RONALD H. VOLGER | Vice President and Treasurer | November 20, 2009 | ||
| Ronald H. Volger | (Principal Accounting Officer) | |||
| /s/ JOHN R. BELK | Director | November 20, 2009 | ||
| John R. Belk | ||||
| /s/ JOHN P. DERHAM CATO | Director | November 20, 2009 | ||
| John P. Derham Cato | ||||
| /s/ ALAN T. DICKSON | Director | November 20, 2009 | ||
| Alan T. Dickson | ||||
| /s/ JAMES E. S. HYNES | Director | November 20, 2009 | ||
| James E. S. Hynes | ||||
| /s/ ANNA S. NELSON | Director | November 20, 2009 | ||
| Anna S. Nelson | ||||
| /s/ BAILEY W. PATRICK | Director | November 20, 2009 | ||
| Bailey W. Patrick | ||||
| Director | November __, 2009 | |||
| Robert H. Spilman, Jr. | ||||
| /s/ HAROLD C. STOWE | Director | November 20, 2009 | ||
| Harold C. Stowe | ||||
| /s/ ISAIAH TIDWELL | Director | November 20, 2009 | ||
| Isaiah Tidwell | ||||
| /s/ WILLIAM C. WARDEN, JR. | Director | November 20, 2009 | ||
| William C. Warden, Jr. | ||||
57
SCHEDULE I
RUDDICK CORPORATION AND SUBSIDIARIES
VALUATION AND QUALIFYING ACCOUNTS AND RESERVES
For
the Fiscal Years Ended
September 27, 2009,
September 28, 2008
and September 30, 2007
(in thousands)
| COLUMN A | COLUMN B | COLUMN C | COLUMN D | COLUMN E | |||||||||
| ADDITIONS | |||||||||||||
| BALANCE | CHARGED TO | BALANCE | |||||||||||
| AT BEGINNING | COSTS AND | AT END | |||||||||||
| DESCRIPTION | OF FISCAL YEAR | EXPENSES | DEDUCTIONS | OF PERIOD | |||||||||
| Fiscal Year Ended September 30, 2007: | |||||||||||||
| Reserves deducted from assets | |||||||||||||
| to which they apply - | |||||||||||||
| Allowance For Doubtful Accounts | $ | 3,719 | $ | 971 | $ | 728 | * | $ | 3,962 | ||||
| Fiscal Year Ended September 28, 2008: | |||||||||||||
| Reserves deducted from assets | |||||||||||||
| to which they apply - | |||||||||||||
| Allowance For Doubtful Accounts | $ | 3,962 | $ | 32 | $ | 1,175 | * | $ | 2,819 | ||||
| Fiscal Year Ended September 27, 2009: | |||||||||||||
| Reserves deducted from assets | |||||||||||||
| to which they apply - | |||||||||||||
| Allowance For Doubtful Accounts | $ | 2,819 | $ | 1,360 | $ | 489 | * | $ | 3,690 | ||||
*Represents accounts receivable balances written off as uncollectible, less recoveries.
S-1