Attached files
| file | filename |
|---|---|
| EX-23.2 - CONSENT OF DELOITTE & TOUCHE LLP - METALS USA HOLDINGS CORP. | dex232.htm |
Table of Contents
As filed with the Securities and Exchange Commission on November 20, 2009
Registration No. 333-150999
UNITED STATES
SECURITIES AND EXCHANGE COMMISSION
WASHINGTON, D.C. 20549
AMENDMENT NO. 3
TO THE
FORM S-1
REGISTRATION STATEMENT
UNDER
THE SECURITIES ACT OF 1933
METALS USA HOLDINGS CORP.
(Exact name of registrant as specified in its charter)
| Delaware | 5051 | 20-3779274 | ||
| (State or other jurisdiction of incorporation or organization) |
(Primary Industrial Classification Code Number) |
(I.R.S. Employer Identification Number) |
One Riverway, Suite 1100
Houston, Texas 77056
(713) 965-0990
(Address, including zip code, and telephone number, including area code, of registrant’s principal executive offices)
William A. Smith II
Vice President, General Counsel and Secretary
One Riverway, Suite 1100
Houston, Texas 77056
(713) 965-0990
(Name, address, including zip code, and telephone number, including area code, of agent for service)
Copies to:
| Andrew J. Nussbaum Wachtell, Lipton, Rosen & Katz 51 West 52nd Street New York, New York 10019 (212) 403-1000 |
LizabethAnn R. Eisen Cravath, Swaine & Moore LLP 825 Eighth Avenue New York, New York 10019 (212) 474-1000 |
Approximate date of commencement of proposed sale to the public: As promptly as practicable after the effective date of this registration statement.
If any of the securities being registered on this Form are to be offered on a delayed or continuous basis pursuant to Rule 415 under the Securities Act of 1933, as amended, check the following box. ¨
If this Form is filed to register additional securities for an offering pursuant to Rule 462(b) under the Securities Act, please check the following box and list the Securities Act registration statement number of the earlier effective registration statement for the same offering. ¨
If this Form is a post-effective amendment filed pursuant to Rule 462(c) under the Securities Act, check the following box and list the Securities Act registration statement number of the earlier effective registration statement for the same offering. ¨
If this Form is a post-effective amendment filed pursuant to Rule 462(d) under the Securities Act, check the following box and list the Securities Act registration statement number of the earlier effective registration statement for the same offering. ¨
Indicate by check mark whether the registrant is a large accelerated filer, an accelerated filer, a non-accelerated filer, or a smaller reporting company. See the definitions of “large accelerated filer,” “accelerated filer” and “smaller reporting company” in Rule 12b-2 of the Exchange Act.
| Large accelerated filer ¨ |
Accelerated filer ¨ | Non-accelerated filer x | Smaller reporting company ¨ | |||
| (Do not check if a smaller reporting company) | ||||||
CALCULATION OF REGISTRATION FEE
| Title of Each Class of Securities to Be Registered |
Proposed Maximum Aggregate Offering Price(1)(2) |
Amount of Registration Fee(2)(3) | ||
| Common Stock, $0.01 par value |
$200,000,000 | $7,860 | ||
| (1) | Estimated solely for the purpose of calculating the amount of the registration fee pursuant to Rule 457(o) under the Securities Act of 1933, as amended, at a rate equal to $39.30 per $1,000,000 of the proposed maximum aggregate offering price. |
| (2) | Includes shares of common stock which may be purchased by the underwriters to cover over-allotments, if any. |
| (3) | The registrant previously paid a registration fee of $21,400.00 with a registration statement on Form S-1, File No. 333-134533, initially filed on May 26, 2006. Pursuant to Rule 457(p) of the Securities Act, $7,860 of the previously paid registration fee is offset against the registration fee otherwise due for this registration statement. |
The registrant hereby amends this registration statement on such date or dates as may be necessary to delay its effective date until the registrant shall file a further amendment which specifically states that this registration statement shall thereafter become effective in accordance with Section 8(a) of the Securities Act of 1933 or until the registration statement shall become effective on such date as the Commission, acting pursuant to said Section 8(a), may determine.
Table of Contents
The information in this prospectus is not complete and may be changed. Neither we nor the selling stockholders may sell these securities until the registration statement filed with the U.S. Securities and Exchange Commission is effective. This prospectus is not an offer to sell these securities and it is not soliciting an offer to buy these securities in any state where the offer or sale is not permitted.
Subject to completion, dated November 20, 2009.
PROSPECTUS

Metals USA Holdings Corp.
Common Stock
This is an initial public offering of shares of common stock, par value $0.01 per share, of Metals USA Holdings Corp. We are offering shares of common stock, and the selling stockholders identified in this prospectus are offering shares of common stock. We will not receive any proceeds from the sale of shares by the selling stockholders.
No later than 60 days following our receipt of the proceeds of this offering, we will make an offer to all holders of our senior floating rate toggle notes due 2012, including our affiliates, to repurchase the maximum principal amount of the notes that may be purchased out of the net proceeds of this offering, estimated to be approximately $ million, at a price equal to 100% of the principal amount, plus accrued and unpaid interest to the date of the closing of the repurchase offer.
If the net proceeds of this offering are greater than the purchase price of the notes tendered by holders, we will use the balance of the net proceeds, if any, for general corporate purposes. Prior to this offering, there has been no public market for our common stock. It is currently estimated that the initial public offering price per share will be between $ and $ . We have applied to list our common stock on The New York Stock Exchange under the symbol “MUSA.”
Investing in our common stock involves risks. See “Risk Factors” on page 18 to read about factors you should consider before buying shares of our common stock.
Neither the U.S. Securities and Exchange Commission nor any state securities commission has approved or disapproved of these securities or determined if this prospectus is truthful or complete. Any representation to the contrary is a criminal offense.
| Per Share | Total | |||||
| Initial public offering price |
$ | $ | ||||
| Underwriting discount |
$ | $ | ||||
| Proceeds, before expenses, to Metals USA Holding Corp. |
$ | $ | ||||
| Proceeds, before expenses, to Selling Stockholders |
$ | $ | ||||
To the extent that the underwriters sell more than shares of common stock, the underwriters have the option to purchase up to an additional shares from us and an additional shares from the selling stockholders at the initial public offering price less the underwriting discount.
The underwriters expect to deliver the shares against payment in New York, New York on , 2010.
Prospectus dated , 2010.
Table of Contents
Prospectus
| Page | ||
| 1 | ||
| 12 | ||
| 18 | ||
| 32 | ||
| 34 | ||
| 36 | ||
| 38 | ||
| 40 | ||
| 42 | ||
| MANAGEMENT’S DISCUSSION AND ANALYSIS OF FINANCIAL CONDITION AND RESULTS OF OPERATIONS |
45 | |
| 74 | ||
| 76 | ||
| 92 | ||
| 113 | ||
| 115 | ||
| 118 | ||
| 124 | ||
| 129 | ||
| MATERIAL UNITED STATES FEDERAL INCOME TAX CONSEQUENCES FOR NON-U.S. HOLDERS |
131 | |
| 135 | ||
| 139 | ||
| 139 | ||
| 139 | ||
| F-1 |
No dealer, salesperson or other person is authorized to give any information or to represent anything not contained in this prospectus. You must not rely on any unauthorized information or representations. This prospectus is an offer to sell only the shares offered hereby, but only under circumstances and in jurisdictions where it is lawful to do so. The information contained in this prospectus is current as of this date.
Industry and Market Data
This prospectus includes industry data that we obtained from periodic industry publications and internal company surveys. Industry publications and surveys generally state that the information contained therein has been obtained from sources believed to be reliable. In addition, this prospectus includes market share and industry data that we prepared primarily based on our knowledge of the industry and industry data. We have not independently verified any of the data from third-party sources nor have we ascertained the underlying economic assumptions relied upon therein. Statements as to our market position relative to our competitors are approximated and based on the above-mentioned third-party data and internal analysis and estimates and have not been verified by independent sources. Unless otherwise noted, all information regarding our market share is based on the latest available data, which in some cases may be several years old, and all references to market shares refer to both revenue and volume.
i
Table of Contents
This summary highlights material information appearing elsewhere in this prospectus. Because this is a summary, it may not contain all of the information that you should consider before investing in our common stock, par value $0.01 per share, which we refer to as our “common stock,” and you should carefully read the entire prospectus, including the financial data and related notes and the information presented under the caption “Risk Factors.”
Except as otherwise indicated herein or as the context otherwise requires, references in this prospectus to (a) “Metals USA Holdings,” the “Company,” “we,” “our,” and “us” refer collectively to (1) Metals USA, Inc. and its subsidiaries on a consolidated basis prior to the consummation of the merger of Flag Acquisition Corporation, which we refer to as “Flag Acquisition,” with and into Metals USA on November 30, 2005, which we refer to as the “Merger” (see “Organizational Structure—Description of the Apollo Transactions”), and (2) Metals USA Holdings Corp., which we refer to as “Metals USA Holdings,” Flag Intermediate Holdings Corporation, which we refer to as “Flag Intermediate,” Metals USA, Inc. and Metals USA, Inc.’s subsidiaries on a consolidated basis after the consummation of the Merger, and (b) “Metals USA” refers collectively to Metals USA, Inc. and its subsidiaries. Metals USA prior to the Merger is referred to as the “Predecessor Company.”
Our Company
As one of the largest metal service center businesses in the United States, we believe that we are a leading provider of value-added processed carbon steel (“value-added” refers to enhanced metal processing and services beyond basic delivery which are recognized and desired by many end-users as efficient cost savings opportunities), stainless steel, aluminum, red metals and manufactured metal components. We believe that we serve an important function as an intermediary between primary metal producers that generally sell large volumes in limited sizes and configurations and end-users that generally require more services and smaller quantities of customized products. Operating 35 facilities comprising almost 5 million square feet of industrial space, our metal service center business sold more than 1.4 million tons of metal products in 2008. We sell our products and services to a diverse customer base and broad range of end markets, including the land and marine transportation, energy, aerospace, defense, electrical and appliance manufacturing, fabrication, furniture, commercial construction, and machinery and equipment industries, among several others, throughout the United States. We strive to earn a margin over the cost of metal. Management’s strategy, manifested through organic growth initiatives and our acquisitions of Port City, Lynch Metals, and Philadelphia Plate (each as defined below), focuses on maximizing the margin we earn over the cost of metal by offering additional value-added processing services and diversifying our product mix. We believe our growth and acquisition strategy, in combination with management’s demonstrated ability to manage metal purchasing and inventories to consistently meet our customers’ high expectations for service and reliability, serves as a foundation for future revenue growth and stable operating profit per ton through the economic cycle. For the nine months ended September 30, 2009 our net income was $7.9 million and for the years ended December 31, 2008 and 2007, our net income was $72.6 million and $13.9 million, respectively. Net income for the nine months ended September 30, 2009, has been negatively impacted by the global economic crisis and positively impacted by the Company’s repurchase of its debt at a discount. Net income for the year ended December 31, 2008, benefited as the industry experienced record global steel prices through the first half of 2008. Cash flow from operations for the twelve month period ended September 30, 2009 was $404.5 million and net debt, defined as the net book value of debt less cash, at September 30, 2009 was $481.0 million.
1
Table of Contents
Metals USA Holdings, which was formerly named Flag Holdings Corporation, was incorporated in Delaware on May 9, 2005. Metals USA Holdings is owned by investment funds affiliated with Apollo Management, L.P. as well as certain members of its management. Flag Intermediate is a wholly owned subsidiary of Metals USA Holdings and, in turn, owns all the shares of Metals USA. Metals USA and its subsidiaries are the operating entities. See “Organizational Structure—Description of the Apollo Transactions.”
We report our results in three segments: our Plates and Shapes Group, our Flat Rolled and Non-Ferrous Group, and our Building Products Group.
| Ÿ | Plates and Shapes Group (53% of 2008 net sales). The Plates and Shapes Group processes and sells steel plates and structural beams, bars, angles and tubes. We believe we are one of the largest distributors of steel plates and structural beams in the United States. In 2008, we sold approximately 837 thousand tons of products through 21 metal service centers located primarily in the southern and eastern regions of the United States. Our metal service centers are generally equipped to provide additional value-added processing, and a substantial portion of our volume is processed prior to being delivered to the end-user. These processing services include burning, blasting and painting (the process of cleaning steel plate by shot-blasting, then immediately applying a paint or primer), tee-splitting (the cutting of metal beams along the length to form separate pieces), cambering (the bending of structural shapes to improve load-bearing capabilities), leveling (the flattening of metals to uniform tolerances for proper machining), cutting, sawing, punching, drilling, beveling, surface grinding, braking (bending), shearing and cutting-to-length (the cutting of metals into pieces and along the width of a coil to create sheets or plates). We sell our products to a diversified customer base, including a large number of small customers who purchase products in small order sizes. We generally earn additional margin from our customers by providing services such as product marking, item sequencing, just-in-time delivery and kitting. The customers who require these products and services are primarily in the fabrication, commercial construction, machinery and equipment, land and marine transportation, and energy industries. Because our metal service centers are generally located in close proximity to our metal suppliers and our customers, we are able to meet our customers’ product and service needs reliably and consistently. In May 2006, we completed the acquisition of the Port City Metal Services business (which we refer to as “Port City”), a higher value-added plate facility located in Tulsa, Oklahoma, which has bolstered our presence in the construction and oil-field services sectors. More recently in February 2009, we acquired substantially all of the operating assets of VR Laser, a metal processor of carbon plate products located in Philadelphia, PA (which assets we collectively refer to as “Philadelphia Plate”), which has expanded our presence in the northeast region of the United States and augmented our presence in the marine and defense sectors. |
| Ÿ | Flat Rolled and Non-Ferrous Group (41% of 2008 net sales). The Flat Rolled and Non-Ferrous Group processes and sells flat rolled carbon (which we refer to as “ferrous”) and stainless steel, aluminum, brass and copper (which we collectively refer to as “non-ferrous”) in a number of alloy grades and sizes through 14 metal service centers located primarily in the mid-western and southern regions of the United States. We sold approximately 601 thousand tons of these products in 2008 split approximately 59% and 41% between ferrous products and non-ferrous products, respectively. Substantially all of the products from this group that are sold undergo value-added processing prior to shipment to our customers. These processing services include precision blanking (the process in which metal is cut into precise two-dimensional shapes), slitting (the cutting of coiled metals to specified widths along the length of the coil), shearing and cutting-to-length, punching and leveling. We sell our products and services to customers in the electrical and appliance manufacturing, fabrication, furniture, machinery and equipment, transportation and aerospace industries. Many of our large |
2
Table of Contents
| customers purchase through pricing arrangements or contractual agreements that specify the margin over the cost of metal and we generally earn additional margin from these customers by providing services such as product marking and labeling, just-in-time delivery and kitting. We are able to provide these services reliably because our metal service centers are generally located in close proximity to our metal suppliers and our customers. In July 2007, we acquired Lynch Metals, Inc. and Lynch Metals of California, Inc. (which we collectively refer to as “Lynch Metals”), a metal service center business that provides additional value-added, specialized aluminum products to customers who are predominantly manufacturers of air/heat transfer products specifically focused on aerospace, industrial and automotive applications. |
| Ÿ | Building Products Group (6% of 2008 net sales). The Building Products Group manufactures and sells roofing and patio products. We generally sell these products through a network of independent distributors and home improvement contractors. Our roofing products business manufactures and sells a high performance roofing product consisting of a pressed and stone-coated steel panel that mimics the appearance of traditional shake and tile roofing. Our roofing product is well suited for all areas subject to threats of high winds, fires and hail storms. In May 2006, we acquired Duraloc Roofing Systems, Ltd., a Canadian-based competitor which we have re-branded as Allmet Roofing Products. This acquisition provided us with manufacturing capabilities on both the east and west coasts of North America. Our patio products business manufactures and sells building components used primarily for the erection of residential shade structures such as patio covers and enclosures. With facilities located throughout the southern and western regions of the United States, we believe we are one of only a few suppliers of patio products with national scale. |
Industry Overview
Our operations focus on the metal service center industry and the building products industry.
| Ÿ | Metal Service Centers. Metal service centers and processors purchase approximately 35% of all the metals used in the U.S. and Canada and play an important intermediary role between the production mills and the end-users. Over the last several years primary metal producers have consolidated and focused on optimizing throughput and operating efficiencies of their production facilities. This has expanded the demand for metal service centers and processors to perform value-added services for end-users. As a result of the industry consolidation, most end-users cannot obtain processed products directly from primary metals producers, and therefore, over 300,000 original equipment manufacturers (which we refer to as “OEMs”), contractors and fabricators nationwide rely on metal service centers for their primary supply of metal products and services. End-users generally buy metal products and services from metal service centers on a margin over the base cost of the metal. When customers require additional processing or specific services, value-added metal service centers, including ours, earn an additional premium margin for the value-added processing elements they perform on base metal prior to delivering it to end-users. |
OEMs and other end-users have also recognized the economic advantages associated with outsourcing their customized metals processing needs, which include (1) permitting end-users to reduce total production costs by shifting the responsibility of pre-production processing to metal service centers and (2) allowing OEMs and end-users to reduce inventories and focus on realizing value from additional inventory management measures. These supply-chain services, which are not normally provided by primary metals producers, enable end-users to reduce input costs, decrease inventory and equipment capital requirements and save time, labor and other expenses.
3
Table of Contents
We believe that long-term growth opportunities for metal service centers will continue to expand as both primary metal producers and end-users increasingly seek to have their metal processing and inventory management requirements met by value-added metal service centers. Although the service center industry remains fragmented with approximately 1,200 companies competing in North America, we believe larger and financially flexible companies, like ours, enjoy significant advantages over smaller companies such as obtaining higher discounts associated with volume purchases, servicing customers with operations in multiple locations, offering a broader range of products and services and utilizing more sophisticated information systems.
The metals production and distribution industries have experienced an increase in demand for steel and other metals in recent years driven largely by new market development in China, Brazil, India, Russia and Eastern Europe. Through the first half of 2008, demand growth outpaced supply inputs creating upward cost pressure on commodity inputs such as ores, energy and transportation. In early 2008, global steel prices were at record highs.
United States steel consumption has remained relatively constant from 2000 through 2007, averaging approximately 130 million tons annually. The global financial crisis that started during the third quarter of 2008 has caused a significant reduction in the consumption of steel world-wide (excluding China). In the United States, domestic steel demand has declined by almost half and is now expected to be approximately 60 million tons in 2009. Similar volume declines have occurred in virtually all developed economies. Service centers, distributors, and the rest of the supply chain have responded by aggressively reducing inventories. Through the first eight months of 2009, industry-based inventory metrics reported lowest-ever inventory levels during the 32 years that this data has been collected. Consequently, domestic steel producers have been reported as operating at levels below 50 percent capacity utilization.
Steel pricing dropped during the first six months of 2009 as steel producers continually reduced prices in the face of shrinking order backlogs. Since late June 2009, prices have been trending upwards as signs indicated an increase in global demand for steel and raw material inputs. Domestic demand also benefited from the government’s “Cash for Clunkers” program. We have seen a modestly improving trend in our order inquiry activity during the third quarter of 2009 and it appears, with the exception of non-residential construction, that steel demand may be entering a slow recovery stage. Even in a historically low demand environment, we believe rising price trends are sustainable if producers generate product commensurate with demand. The impact from federal stimulus legislation has not yet had a meaningful impact on the industry as actual spending continues to work through governmental channels. We believe that stimulus spending should have a meaningful impact on 2010 steel consumption and, in combination with basic economic recovery, domestic steel consumption should experience a year over year increase.
| Ÿ | Building Products. Notwithstanding recent conditions in the United States housing sector, we believe some signs, such as increases in sales of new and existing homes, indicate an improving outlook for the housing sector. Moreover, we believe that factors including an historically low interest rate environment and an aging American housing stock are generating significant pent-up demand for remodeling that should manifest itself when the housing sector rebounds. We believe that these factors support a strong long-term outlook for residential remodeling as a cost-effective alternative to new housing construction. |
4
Table of Contents
Our Competitive Strengths
| Ÿ | Premium Margins Over Metal. Metal service centers generally earn a margin over the cost of metal, which provides stability to metal service centers’ cash flows relative to primary metal producers through pricing cycles. In addition, we earn a premium margin over the cost of metal by providing inventory management services and performing certain value-added processing services before shipping product to customers. We also sell an enhanced product mix across our metal service center business by supplementing our core carbon offerings with non-ferrous volumes. Over the last several years, we have invested in our facilities and completed acquisitions to expand our service offerings and improve our ability to continue earning premium margins on a broad and diverse range of products and services. |
| Ÿ | Platform for Strong Growth. Over the five years ended December 31, 2008, we have spent approximately $134.8 million on growth initiatives, including $45.9 million to grow our business organically and $88.9 million for acquisitions. In addition to selectively pursuing growth projects, from December 31, 2008 to September 30, 2009 we repurchased $178.8 million face value of our debt at a substantial discount to par value, which generated attractive returns for us and improved our balance sheet flexibility going forward. Our growth initiatives have focused on increasing and diversifying our mix of higher-margin products and services, such as value-added processing, inventory management services, and non-ferrous volumes. Our largest organic growth project during the last three years was a $17.5 million investment in our Plates and Shapes metal service center in Waggaman, Louisiana to capitalize upon the strong gulf coast marine market. This investment equipped this facility with additional value-added processing capabilities, such as blast, paint, laser and plasma cutting (the cutting of metals to produce shapes under strict tolerance requirements) and press brake services. In late 2005, we established and trained a dedicated acquisitions team that is responsible for identifying, evaluating, executing, integrating and monitoring acquisitions. This team has completed three strategic acquisitions for our metal service center business: (1) Port City in our Plates and Shapes Group that increased our plate processing capabilities to customers serving the oil field, construction equipment and refining industries, (2) Lynch Metals in our Flat Rolled and Non-Ferrous Group that provides value-added, specialized aluminum products to customers who are predominantly manufacturers of air/heat transfer products specifically focused on aerospace, industrial and automotive applications and (3) Philadelphia Plate in our Plates and Shapes Group that further expanded our existing processing capabilities into the northeast region of the United States and to the marine and defense industries. |
| Ÿ | Skilled Inventory Management. Inventory management is critical to metal service centers’ ability to balance investment in working capital, maintain cost competitiveness and meet customer needs for timely and often just-in-time delivery. The Company’s purchasing practices follow a market driven inventory management framework that is designed to generate attractive returns on our inventory investment while reliably meeting customer demands irrespective of steel prices. Our Chief Executive Officer monitors and adjusts this framework on at least a weekly basis. Within this framework, inventory and processing services are tailored to the needs of each individual metal service center location’s particular customers. We believe our inventory management framework and flexible capital structure allow us to quickly react to changing metal prices and customer needs. Our information technology systems facilitate sharing inventory among our facilities, which helps us maximize returns and reliably satisfy our customers’ needs. In addition, our inventory management framework enhances our ability to generate earnings during rising metal price environments and free cash flow in declining metal price environments, which we demonstrated by generating record earnings in 2008 and record operating free cash flow in the first nine months of 2009. After dramatically reducing inventories |
5
Table of Contents
| in 2009 which included changing the way we work with our suppliers, we believe that we will continue to operate our business at substantially lower inventory levels. |
| Ÿ | Streamlined Cost Structure: Because we operate our business on a lean basis relative to our competitors, we have one of the lowest relative non-metal cost structures in our industry. For example, we had a lower ratio of selling, general and administrative expenses compared to revenues for the six months ended June 30, 2009 than a similarly situated peer group of public companies. Since the fourth quarter of 2008, we have implemented $50 million of annualized cost savings, a vast majority of which we believe are permanent reductions that further reduce what we believe to be the lowest cost structure in the industry. The cost savings have come primarily as a result of various actions including reducing our headcount by approximately 30%, modifying employee benefits, closing 7 facilities primarily in our Building Products Group, reducing work hours for our employees and streamlining our delivery fleet. The combination of our lean cost structure and skilled inventory management has allowed us to convert a high percentage of our earnings into free cash flow, resulting in $404.5 million of cash flow from operations over the twelve months ended September 30, 2009. We have used this cash to deleverage our balance sheet by $463.7 million over the same period and complete the acquisition of Philadelphia Plate in early 2009. |
| Ÿ | Strong Relationships with Key Suppliers. We are one of the largest domestic purchasers of steel, and we have established strong relationships with large domestic and international metal suppliers. Because we are a significant customer of our major suppliers, we obtain volume discounts and historically have been able to obtain sufficient access to feedstock in periods of tight supply. We believe that access to feedstock during these periods enhances our standing with end users relative to our competitors, particularly those competitors that do not have such access. Our relationships with our metal suppliers also help us to optimize our inventory management because we believe that we can often purchase inventory with significantly shorter lead times relative to our competitors. |
| Ÿ | Diversified Customer Base, Products and End-Markets. Our business supplies a broad range of products to a large and diversified customer base (over 471,095 transactions to 11,900 customers in 2008) in a wide variety of end-markets and industries. For the twelve months ended December 31, 2008, our average transaction size was approximately $4,162. However, we have sought to enhance our position in stable growth industries that demand additional value-added services and reduce our exposure to more cyclical sectors. As a result of our organic growth projects and acquisitions, we have capitalized on growth opportunities with products such as aluminum brazing sheet, armor plate, marine grade aluminum plate, and pressure vessel plate to service the aerospace, marine, defense, and oil and gas industries. Our broad range of high-quality product and customized value-added service offerings allows us to offer one-stop shopping to our customers. We believe one-stop shopping provides a significant competitive advantage over smaller metal service centers, which generally stock fewer products and offer fewer services than we do. Moreover, many products and services in our broad range of offerings exhibit diverse and distinct cyclical trends. For example, many of the products and services we sell through our Plates and Shapes Group tend to trail the economic cycle, which provides an attractive balance to our Flat Rolled and Non-Ferrous Group product and service offerings that tend to lead the economic cycle. We believe that this diversity helps provide stability to our results during economic downturns and positions us well for an economic and volume recovery. |
| Ÿ | Experienced and Proven Management Team. Our senior management team has on average over 27 years of metals industry experience and is supported by, in our opinion, considerable management talent, including our division vice presidents and facility general |
6
Table of Contents
| managers, amongst others. Our President, Chief Executive Officer and Chairman, C. Lourenco Goncalves, has 29 years of experience in the metals industry, including his terms as Chief Executive Officer of California Steel Industries (which we refer to as “CSI”), which had many of the same value chain dynamics as a metal service center, and as managing director, among other positions, of Companhia Siderúrgica Nacional (which we refer to as “CSN”). Under Mr. Goncalves’ leadership our management team has executed a strategy that has significantly improved our earnings growth, cash flow stability, and competitiveness. |
Our Strategy
| Ÿ | Expand Value-Added Services. We intend to continue expanding our value-added services, which enhance our relationships with existing customers and help us build new customer relationships. Customers increasingly demand and are willing to pay a premium margin for additional value-added services to facilitate more efficient inventory management and reduce total production costs. In addition, we experience an increased level of repeat business from customers who utilize our value-added services. Demand for these services generally remains strong through most economic cycles. We intend to continue to identify and invest in capital projects that provide attractive returns to fulfill this growing demand. We believe that our operating expertise, organizational structure, high-quality facilities, size, and our low cost and flexible capital structure enable us to reliably provide a full range of value-added services to our customers relative to our competitors, particularly smaller metal service centers. |
| Ÿ | Increase Sales of Higher Margin Products and Services. The sale of higher margin products and services, which tend to have higher growth prospects and are more stable, will continue to be one of our core strategies. We intend to continue executing on this strategy by increasing our attractive core carbon offerings, non-ferrous volumes, and our sales of processed products. Focusing on this strategy has historically increased our margins, stabilized our earnings, and optimized our investment in working capital, and we expect this strategy will continue benefiting us in these areas. We anticipate that we will continue investing in and acquiring companies to maintain and expand our processing facilities, which will enable us to increase market share. |
| Ÿ | Execute Strategic Acquisitions to Improve Our Business. The North American metal service center industry is highly fragmented, which we believe provides us with opportunities to execute our core strategies through synergistic “bolt-on” acquisitions. We completed three accretive and strategic acquisitions, Port City and Philadelphia Plate for our Plates and Shapes Group and Lynch Metals for our Flat-Rolled and Non-Ferrous Group, all of which have benefited us financially, operationally and strategically through realization of cost synergies, increased value-added processing capabilities, reduced inventory levels, and increased cross selling opportunities. The combination of our track record of acquiring and successfully integrating acquisitions and our internal acquisition team’s industry relationships has resulted in proprietary deal flow being brought to us and has helped us maintain an active pipeline of opportunities. We intend to continue to pursue our acquisition strategy, and we will generally target one to two “bolt-on” acquisitions per year that will enhance our metal service center strategy. We believe that we are well positioned to take advantage of acquisition opportunities in the fragmented service center industry because of our flexible capital structure, which we have significantly improved over the twelve months ending September 30, 2009 by generating cash flow from operations of $404.5 million and from December 31, 2008 through September 30, 2009 by repurchasing $178.8 million face value of debt at a substantial discount in open market transactions. |
7
Table of Contents
| Ÿ | Maintain and Strengthen Our Strong Relationships with Suppliers and Customers. As one of the largest metal service center businesses in the United States, we intend to use our relationships to leverage the opportunities presented by the consolidation of steel producers and the changing needs of our customers. Steel producers continue to seek long-term relationships with metal service centers that have access to numerous customers, while customers are seeking relationships with metal service centers that can provide a one stop, reliable source of both high-quality products and value-added services. |
| Ÿ | Continue Strong Focus on Inventory Management. We will continue managing our inventory to maximize our returns, profitability and cash flow while maintaining sufficient inventory to respond to customer demands. During the recent economic downturn we reinforced and strengthened our long-standing relationships with key suppliers, and as a result, we believe we will benefit from shorter lead times allowing us to operate with a lower investment in working capital going forward. In addition, we intend to further integrate our salespeople and operating employees into the operations of our customers to enhance our visibility into in-process orders and further improve our just-in-time delivery and customer service. Constant evaluation of our inventory management framework will allow us to continue supplying our customers reliably, even during periods of tight metal supply. We expect our inventory management framework will continue generating strong earnings during periods of rising metal prices and strong cash flow during periods of declining metal prices. Moreover, since industry wide service center inventories are near record low levels, we believe our inventory management framework will enable us to benefit disproportionately as compared to our competitors when end market demand begins to recover. |
| Ÿ | Maintain High Free Cash Flow Generation and Conversion. Senior management has implemented a strategy designed to maximize our profitability and cash flow. Part of this strategy included a $50 million annualized cost savings program we implemented over the twelve months ended September 30, 2009 that permanently reduces our cost structure. We believe this program will improve our ability to generate attractive margins and free cash flow throughout future economic cycles. We believe that we are a reliable supplier, especially of higher margin products and services, to our customers even in periods of tight supply. We believe that our reliability allows us to generate higher margins and more stable operating income through the business cycle. Moreover, we believe our inventory management framework, bolstered by our relationships with our metals suppliers, will stabilize earnings during periods of weakness. Our core business also requires minimal maintenance capital investment. We believe these strengths taken together underscore our ability to generate high levels of free cash flow, which will enable us to reinvest in our business, consummate future acquisitions, pay down debt, and achieve other corporate and financial objectives. |
Risk Factors
An investment in our common stock involves substantial risks and uncertainties. Metals USA Holdings is a holding company. Flag Intermediate is also a holding company and does not have any material assets or operations other than ownership of the capital stock of Metals USA. Some of the more significant challenges and risks include:
| Ÿ | those associated with our susceptibility to conditions in the United States and international economies; |
| Ÿ | our ability to pass through increases in our costs to our customers; |
| Ÿ | the cost of energy and raw materials; |
| Ÿ | our substantial indebtedness; |
8
Table of Contents
| Ÿ | our acquisition strategy; and |
| Ÿ | the highly competitive nature of the industry in which we operate. |
See “Risk Factors” for a discussion of the factors you should consider before investing in our common stock.
Principal Stockholders
Our principal stockholders are investment funds affiliated with or managed by Apollo Management V, L.P., including Apollo Investment Fund V, L.P. and its parallel co-investment funds. Apollo Investment Fund V, L.P. is an investment vehicle with committed capital, along with its parallel investment funds, of over $3.7 billion. Apollo Management V, L.P., Apollo Investment Fund V, L.P. and its parallel investment funds are affiliates of Apollo Global Management, LLC, a leading global alternative asset manager with offices in New York, Los Angeles, London, Frankfurt, Singapore and Mumbai. Apollo Global Management, LLC has assets under management in private equity and credit-oriented capital markets funds invested across a core group of industries where Apollo Global Management, LLC has considerable knowledge and resources. Companies in which affiliates of Apollo Global Management, LLC have a significant equity investment include, among others, Affinion Group Holdings, Inc., Berry Plastics Corporation, CEVA Logistics, Momentive Performance Materials Inc., Noranda Aluminum Holding Corporation, Parallel Petroleum Corporation and Rexnord Holdings, Inc. Except as otherwise indicated herein or as the context otherwise requires, “Apollo” refers to investment funds affiliated with, or co-investment vehicles managed, indirectly by Apollo Management L.P., including Apollo Investment Fund V, L.P., along with its parallel investment funds.
Metals USA Holdings entered into a management agreement with Apollo on November 30, 2005, pursuant to which Apollo provides us with management services. See “Certain Relationships and Related Party Transactions—Related Party Transactions—Apollo Agreements” for a description of this management agreement.
Metals USA Holdings
Metals USA Holdings was incorporated in Delaware on May 9, 2005. The principal executive offices of Metals USA Holdings are at One Riverway, Suite 1100, Houston, Texas 77056, and the telephone number is (713) 965-0990.
We also maintain an internet site at http://www.metalsusa.com. Our website and the information contained therein or connected thereto will not be deemed to be incorporated into this prospectus or the registration statement of which this prospectus forms a part, and you should not rely on any such information in making your decision whether to purchase our securities.
Metals USA, Inc. was incorporated in Delaware on July 3, 1996, and began operations upon completion of an initial public offering on July 11, 1997. Metals USA Holdings acquired Metals USA on November 30, 2005 in connection with the Merger. Pursuant to the Merger, Flag Acquisition Corporation, a Delaware corporation, and wholly owned subsidiary of Metals USA Holdings, merged with and into Metals USA, with Metals USA surviving. To finance the Merger and related transaction costs, Metals USA entered into a six-year $450.0 million senior secured asset-based revolving credit facility, completed a private placement of $275.0 million aggregate principal amount of Metals USA’s 11 1/8% senior secured notes due 2015, and Apollo and certain members of management of Metals USA contributed $140.0 million to Metals USA Holdings in exchange for Metals USA Holdings common stock. See “Organizational Structure—Description of the Apollo Transactions.”
9
Table of Contents
The Offering
| Common stock offered by us |
shares |
| Common stock offered by the selling stockholders |
shares |
| Underwriters’ over-allotment option to purchase additional common stock from us and the selling stockholders |
Up to shares and shares, respectively |
| Shares of our common stock to be outstanding immediately following this offering |
shares (including shares that will be sold to the underwriters if they exercise their over-allotment option in full) |
| Use of proceeds |
We estimate that we will receive net proceeds from this offering of approximately $ million after deducting the estimated underwriting discounts and commissions and expenses, assuming the shares are offered at $ per share, which represents the midpoint of the range set forth on the cover page of this prospectus. |
As described in “Use of Proceeds,” no later than 60 days following our receipt of the proceeds of this offering, we will make an offer to all holders of our Senior Floating Rate Toggle Notes due 2012, which we refer to as the “2007 Notes,” to repurchase the maximum principal amount of the 2007 Notes, of which $178.9 million aggregate principal amount were outstanding as of September 30, 2009, that may be purchased out of the net proceeds of this offering, estimated to be approximately $ million, at a price equal to 100% of the principal amount, plus accrued and unpaid interest to the date of the closing of the repurchase offer. The 2007 Notes include the word “toggle” in their title to highlight to investors that we have the ability to “toggle” or switch back and forth, among paying interest entirely in cash, entirely by increasing the principal amount of the 2007 Notes or issuing new 2007 Notes (which we refer to as “PIK Interest”), or 50% in cash and 50% as PIK Interest (which we refer to as “Partial PIK Interest”), pursuant to the terms and conditions described in more detail in “Description of Certain Indebtedness—2007 Notes.”
| Our affiliates, including Apollo, that are holders of the 2007 Notes may participate in the repurchase offer. See “Certain Relationships and Related Party Transactions—Related Party Transactions—Repurchase Offer.” |
10
Table of Contents
If the net proceeds of this offering are greater than the purchase price of the 2007 Notes tendered in the repurchase offer, we will use the balance of the net proceeds, if any, for general corporate purposes, including working capital, the expansion of our production capabilities, research and development, purchases of capital equipment and potential acquisitions of businesses.
We intend to use the net proceeds from any sales of our common stock sold by us pursuant to the underwriters’ over-allotment for the uses specified above. If the maximum number of additional shares is purchased from us by the underwriters, the offer to repurchase would be increased by approximately $ million. We will not receive any of the proceeds from the sale of our common stock by the selling stockholders, including with respect to any shares sold by the selling stockholders pursuant to the underwriters’ exercise of their option to purchase additional shares. For sensitivity analyses as to the offering price and other information, see “Use of Proceeds.”
This prospectus is not an offer to purchase, a solicitation of an offer to purchase or a solicitation of a consent with respect to our 2007 Notes.
| Dividends |
We do not currently anticipate paying any dividends on our common stock in the foreseeable future. See “Dividend Policy.” |
| Listing |
We have applied to list our common stock on The New York Stock Exchange under the trading symbol “MUSA.” |
Other Information About This Prospectus
Except as otherwise indicated, all information in this prospectus:
| Ÿ | assumes no exercise of the underwriters’ over-allotment option; |
| Ÿ | does not give effect to shares of our common stock issuable upon the exercise of outstanding options as of , 2009; and |
| Ÿ | does not give effect to shares of common stock reserved for future issuance under our Amended and Restated 2005 Stock Incentive Plan, which we refer to as the “2005 Plan.” |
11
Table of Contents
SUMMARY HISTORICAL CONSOLIDATED FINANCIAL DATA
Set forth below is summary historical consolidated financial data of our business, as of the dates and for the periods indicated. The summary historical consolidated financial data as of December 31, 2007 and 2008 and for the years ended December 31, 2006, 2007 and 2008, respectively have been derived from our audited consolidated financial statements and related notes included elsewhere in this prospectus. The selected historical financial data as of December 31, 2006 has been derived from the Company’s audited consolidated financial statements not included in this prospectus.
The summary historical consolidated financial data as of September 30, 2009 and for the nine months ended September 30, 2008 and 2009 have been derived from our unaudited condensed consolidated financial statements which are included elsewhere in this prospectus. The September 30, 2008 and 2009 unaudited financial statements have been prepared on a basis consistent with our audited consolidated financial statements and reflect all adjustments, consisting of normal recurring adjustments that are, in the opinion of management, necessary for a fair presentation of the financial position and results of operations for the periods presented. The results of any interim period are not necessarily indicative of the results that may be expected for any other interim period or for the full fiscal year, and the historical results set forth below do not necessarily indicate results expected for any future period.
The summary historical consolidated financial data should be read in conjunction with the information about the limitations on comparability of our financial results, including as a result of acquisitions. See “Selected Historical Consolidated Financial Data,” “Management’s Discussion and Analysis of Financial Condition and Results of Operations,” “Risk Factors” and our consolidated financial statements and related notes included elsewhere in this prospectus.
EBITDA and Adjusted EBITDA
We use the terms EBITDA and adjusted EBITDA throughout this prospectus. EBITDA is defined as net income (loss) before interest, taxes, depreciation and amortization. Adjusted EBITDA (as defined by the loan and security agreement governing the ABL facility entered into by Metals USA in connection with the Merger, which we refer to as “the ABL facility,” and the indentures governing 11 1/8% Senior Secured Notes due 2015, which we refer to as the “Metals USA Notes,” and the 2007 Notes) is defined as EBITDA further adjusted to exclude certain non-cash, non-recurring and realized (or in the case of the indentures, expected) future cost savings directly related to prior acquisitions. EBITDA and adjusted EBITDA are not defined terms under generally accepted accounting principles in the United States, which we refer to as “GAAP,” and should not be used as an alternative to net income as an indicator of operating performance or to cash flow as a measure of liquidity.
Limitations of EBITDA and Adjusted EBITDA
There are material limitations associated with making the adjustments to our earnings to calculate EBITDA and adjusted EBITDA and using these non-GAAP financial measures as compared to the most directly comparable GAAP financial measures. For instance, EBITDA and adjusted EBITDA do not include:
| Ÿ | interest expense, and, because we have borrowed money in order to finance our operations, interest expense is a necessary element of our costs and ability to generate revenue; |
| Ÿ | depreciation and amortization expense, and, because we use capital assets, depreciation and amortization expense is a necessary element of our costs and ability to generate revenue; and |
| Ÿ | income tax expense, and because the payment of taxes is part of our operations, tax expense is a necessary element of our costs and ability to operate. |
Fixed charges should not be considered an alternative to interest expense.
12
Table of Contents
Our use of EBITDA
While EBITDA is frequently used as a measure of operations and the ability to meet debt service requirements, it is not necessarily comparable to other similarly titled captions of other companies due to potential inconsistencies in the method of calculation. We present EBITDA because we consider it an important supplemental measure of our performance and believe it is frequently used by our investors and other interested parties, as well as by our management, in the evaluation of companies in our industry, many of which present EBITDA when reporting their results. In addition, EBITDA provides additional information used by our management and our board of directors to facilitate internal comparisons to historical operating performance of prior periods. Further, management believes EBITDA facilitates their operating performance comparisons from period to period because it excludes potential differences caused by variations in capital structure (affecting interest expense), tax positions (such as the impact of changes in effective tax rates or net operating losses) and the age and book depreciation of facilities and equipment (affecting depreciation expense).
Our use of Adjusted EBITDA
We believe that the inclusion of supplementary adjustments to EBITDA applied in presenting adjusted EBITDA are appropriate to provide additional information to investors about the performance of the business and it provides investors the same information that we use internally for the following reasons.
Similarly to the reasons explained above for EBITDA, we present adjusted EBITDA because we consider it an important supplemental measure of our performance and believe it is frequently used by our investors and other interested parties, as well as by our management, in the evaluation of companies in our industry, many of which present adjusted EBITDA when reporting their results. In addition, similarly to the reasons explained above for EBITDA, adjusted EBITDA also provides additional information used by our management and board of directors to facilitate internal comparisons to historical operating performance of prior periods. Further, management believes that, like EBITDA, adjusted EBITDA facilitates their operating performance comparisons from period to period because it excludes potential differences caused by variations in capital structure (affecting interest expense), tax positions (such as the impact of changes in effective tax rates or net operating losses) and the age and book depreciation of facilities and equipment (affecting depreciation expense).
In addition, management uses adjusted EBITDA as a measure for certain performance-based bonus plans.
Because access to debt capital is currently and in the future will continue to be important to us, we believe that the inclusion of supplementary adjustments to EBITDA applied in presenting adjusted EBITDA are appropriate to provide additional information to investors to demonstrate compliance with the covenants in our debt agreements. Our fixed charge coverage ratio, which we refer to as “FCCR”, as defined by the ABL facility is calculated based on a numerator consisting of adjusted EBITDA less cash taxes and capital expenditures and a denominator consisting of interest expense and certain distributions, and is calculated based on such amounts for the most recent period of four consecutive fiscal quarters. Failure to comply with the FCCR covenant of the ABL facility can result in limiting our long-term growth prospects by hindering our ability to incur future indebtedness or grow through acquisitions. As of September 30, 2009, our FCCR was 0.14. As of September 30, 2009, we had $128.9 million of additional borrowing capacity under the ABL facility.
The indentures governing the Metals USA Notes and the 2007 Notes contain covenants that restrict our ability to take certain actions, such as incurring additional debt and making certain acquisitions, if we
13
Table of Contents
are unable to meet defined adjusted EBITDA to fixed charge coverage and consolidated total debt ratios (each, as defined). The covenants in the indentures require us to have an adjusted EBITDA to fixed charge coverage ratio (measured on a trailing four-quarter basis and calculated differently from the fixed charge coverage ratio as defined by the ABL facility) of 2.0 to 1.0 to incur “ratio” indebtedness and a consolidated total debt ratio of no greater than 4.75 to 1.0 to incur “ratio” indebtedness in connection with acquisitions. Based on the calculations for the trailing four quarters, we are not able to satisfy these covenants and incur additional indebtedness under these ratios, including for acquisition purposes, under our indentures. The most restrictive of the covenants in all of our debt agreements is the FCCR in our ABL facility; accordingly, we have presented adjusted EBITDA in the table below on that basis.
| Historical | ||||||||||||||||||||
| Years Ended December 31, | Nine Months Ended September, |
|||||||||||||||||||
| 2006 | 2007 | 2008 | 2008 | 2009 | ||||||||||||||||
| (in millions, except per share data and shipments) | ||||||||||||||||||||
| Net Sales |
$ | 1,802.9 | $ | 1,845.3 | $ | 2,156.2 | $ | 1,699.8 | $ | 853.4 | ||||||||||
| Operating costs and expenses: |
||||||||||||||||||||
| Cost of sales (exclusive of operating and delivery, and depreciation and amortization shown below) |
1,371.8 | 1,418.8 | 1,612.9 | 1,245.9 | 702.4 | |||||||||||||||
| Operating and delivery |
175.5 | 178.4 | 186.1 | 144.6 | 97.5 | |||||||||||||||
| Selling, general and administrative |
115.1 | 112.3 | 126.8 | 96.5 | 66.6 | |||||||||||||||
| Depreciation and amortization(1) |
21.4 | 22.1 | 21.3 | 16.2 | 14.2 | |||||||||||||||
| (Gain) loss on sale of property and equipment |
0.1 | 0.1 | (2.4 | ) | (2.4 | ) | — | |||||||||||||
| Impairment of assets |
— | 0.2 | 5.1 | — | — | |||||||||||||||
| Operating income (loss) |
119.0 | 113.4 | 206.4 | 199.0 | (27.3 | ) | ||||||||||||||
| Other (income) expense: |
||||||||||||||||||||
| Interest expense |
54.6 | 87.0 | 87.9 | 65.4 | 50.5 | |||||||||||||||
| Loss (gain) on extinguishment of debt |
— | 8.4 | — | — | (89.1 | ) | ||||||||||||||
| Other (income) expense, net |
(0.7 | ) | (0.7 | ) | (0.2 | ) | 0.2 | (0.3 | ) | |||||||||||
| Income (loss) before income taxes |
65.1 | 18.7 | 118.7 | 133.4 | 11.6 | |||||||||||||||
| Provision (benefit) for income taxes |
25.8 | 4.8 | 46.1 | 53.8 | 3.7 | |||||||||||||||
| Net income (loss) |
$ | 39.3 | $ | 13.9 | $ | 72.6 | $ | 79.6 | $ | 7.9 | ||||||||||
| Income (loss) per share: |
||||||||||||||||||||
| Income (loss) per share—basic |
$ | 2.80 | $ | 0.99 | $ | 5.16 | $ | 5.66 | $ | 0.56 | ||||||||||
| Income (loss) per share—diluted |
$ | 2.79 | $ | 0.96 | $ | 4.99 | $ | 5.47 | $ | 0.56 | ||||||||||
| Number of common shares used in the per share calculations: |
||||||||||||||||||||
| Basic |
14.1 | 14.1 | 14.1 | 14.1 | 14.1 | |||||||||||||||
| Diluted |
14.1 | 14.4 | 14.5 | 14.6 | 14.1 | |||||||||||||||
| Cash flow data: |
||||||||||||||||||||
| Cash flows provided by (used in) operating activities |
$ | (45.7 | ) | $ | 119.2 | $ | 78.4 | $ | (97.7 | ) | $ | 228.4 | ||||||||
| Cash flows provided by (used in) investing activities |
(61.0 | ) | (58.5 | ) | (7.7 | ) | 0.6 | (7.6 | ) | |||||||||||
| Cash flows provided by (used in) financing activities |
251.2 | (202.9 | ) | 82.4 | 256.6 | (367.4 | ) | |||||||||||||
| Other operating data: |
||||||||||||||||||||
| Shipments (in thousands of tons) |
1,505 | 1,429 | 1,428 | 1,147 | 694 | |||||||||||||||
| Capital expenditures |
$ | 16.9 | $ | 21.5 | $ | 12.2 | $ | 8.9 | $ | 3.6 | ||||||||||
| Other financial data: |
||||||||||||||||||||
| EBITDA(2) |
$ | 141.6 | $ | 137.1 | $ | 230.0 | $ | 217.2 | $ | (11.4 | ) | |||||||||
| Adjusted EBITDA(2) |
$ | 156.2 | $ | 146.1 | $ | 242.1 | $ | 223.0 | $ | (8.7 | ) | |||||||||
14
Table of Contents
| Historical | Pro Forma | ||||||||||||||||
| As of December 31, | As of September 30, |
As of September 30, | |||||||||||||||
| 2006 | 2007 | 2008 | 2009 | 2009(3) | |||||||||||||
| (in millions) | |||||||||||||||||
| Balance Sheet Data: |
|||||||||||||||||
| Cash |
$ | 155.8 | $ | 13.6 | $ | 166.7 | $ | 20.1 | |||||||||
| Total assets |
1,127.0 | 959.0 | 1,088.2 | 662.5 | |||||||||||||
| Total debt |
755.4 | 857.3 | 944.2 | 501.1 | |||||||||||||
| Net debt(4) |
599.6 | 843.7 | 777.5 | 481.0 | |||||||||||||
| Total liabilities |
979.4 | 1,084.6 | 1,139.2 | 703.4 | |||||||||||||
| Stockholder’s equity (deficit) |
147.6 | (125.6 | ) | (51.0 | ) | (40.9 | ) | ||||||||||
| (1) | Excludes depreciation expense reflected in cost of sales for the Building Products Group. |
| (2) | Below is a reconciliation of net income to EBITDA and Adjusted EBITDA: |
| Historical | |||||||||||||||||||
| Years Ended December 31, | Nine Months Ended September 30, |
||||||||||||||||||
| 2006 | 2007 | 2008 | 2008 | 2009 | |||||||||||||||
| (in millions, except ratios) | |||||||||||||||||||
| Net income |
$ | 39.3 | $ | 13.9 | $ | 72.6 | $ | 79.6 | $ | 7.9 | |||||||||
| Depreciation and amortization(a) |
22.6 | 23.7 | 23.6 | 18.2 | 15.9 | ||||||||||||||
| Interest expense |
54.6 | 87.0 | 87.9 | 65.4 | 50.5 | ||||||||||||||
| (Gain) loss on extinguishment of debt |
— | 8.4 | — | — | (89.1 | ) | |||||||||||||
| Provision (benefit) for income taxes |
25.8 | 4.8 | 46.1 | 53.8 | 3.7 | ||||||||||||||
| Other (income) expense |
(0.7 | ) | (0.7 | ) | (0.2 | ) | 0.2 | (0.3 | ) | ||||||||||
| EBITDA |
141.6 | 137.1 | 230.0 | 217.2 | (11.4 | ) | |||||||||||||
| Covenant defined adjustments: |
|||||||||||||||||||
| Inventory purchase adjustments(b) |
10.8 | — | — | — | — | ||||||||||||||
| Stock options and grant expense(c) |
1.2 | 4.8 | 1.1 | 0.9 | 0.3 | ||||||||||||||
| Facilities closure(d) |
1.4 | 0.7 | 4.0 | 4.0 | 1.5 | ||||||||||||||
| Pension withdrawal liability(e) |
— | 2.0 | — | — | — | ||||||||||||||
| Management fees and other costs(f) |
1.2 | 1.5 | 1.9 | 0.9 | 0.9 | ||||||||||||||
| Impairment of assets(g) |
— | — | 5.1 | — | — | ||||||||||||||
| Adjusted EBITDA (as defined in the ABL facility) |
$ | 156.2 | $ | 146.1 | $ | 242.1 | $ | 223.0 | $ | (8.7 | ) | ||||||||
| Fixed charge coverage ratio numerator(h) |
$ | 115.6 | $ | 103.2 | $ | 197.9 | $ | 210.1 | $ | 16.1 | |||||||||
| Fixed charge coverage ratio denominator(h) |
$ | 76.7 | $ | 78.6 | $ | 68.1 | $ | 65.4 | $ | 117.3 | |||||||||
| FCCR(h) |
1.51 | 1.31 | 2.91 | 3.21 | 0.14 | ||||||||||||||
| (a) | Includes depreciation for Building Products that is included in cost of sales. |
| (b) | As a result of management’s analysis and evaluation of the replacement cost of inventory at the date of the closing of the Apollo Transactions, a purchase accounting increase in the fair value of inventory of $14.9 million was recorded as of December 1, 2005, with $4.1 million of that amount charged to cost of sales in December 2005 and $10.8 million charged to cost of sales in the first quarter of 2006. |
| (c) | Non-cash stock option and stock grant expense. |
| (d) | The amount for 2006 represents charges incurred in connection with the closure of two locations within our metal service center business and three locations within our building products business. The amount for 2007 represents charges in the building products |
15
Table of Contents
| business for the closure of two facilities in the third quarter of 2007 and one in the fourth quarter of 2007. The amounts for 2008 represent charges incurred for the closure of six facilities during 2008, five of which were closed during the first quarter of 2008. The amount for the nine months ended September 30, 2009, represents charges to the building products business for severance costs and the closure of one facility, in addition to charges for the closure of one facility in our metal service center business. |
| (e) | This amount represents accrued expenses incurred in connection with the withdrawal of two of our operating facilities from a multi-employer pension fund. |
| (f) | Includes accrued expenses related to the management agreement we have with Apollo, pursuant to which Apollo provides us with management services, which will be terminated upon consummation of this offering. See “Certain Relationships and Related Party Transactions—Related Party Transactions—Apollo Agreements.” |
| (g) | This amount represents non-cash impairment charges related to goodwill and customer list intangible assets associated with our building products business. |
| (h) | As defined by the loan and security agreement governing the ABL facility and the indentures governing the Metals Notes and the 2007 Notes. |
Under the ABL facility, the FCCR is determined on a rolling four-quarter period, often referred to as a last-twelve month period, by dividing (1) the sum of adjusted EBITDA (as defined in the loan and security agreement governing the ABL facility) of Metals USA minus income taxes paid in cash minus non-financed capital expenditures by (2) the sum of certain distributions paid in cash, cash interest expense and scheduled principal reductions on debt paid by Metals USA. The interest rate in respect of borrowings under the ABL facility is determined in reference to the FCCR, and should borrowing availability under the ABL facility fall below $45.0 million, we must maintain a FCCR of at least 1.0 to 1.0, measured on a trailing four-quarter basis. As of September 30, 2009, our borrowing availability under the ABL facility was $128.9 million. In addition, the FCCR also is an important measure of our liquidity and affects our ability to take certain actions, including paying dividends to stockholders and making acquisitions.
Although the indentures governing the Metals USA Notes and the 2007 Notes also contain covenants that restrict our ability to incur indebtedness and pay dividends based on our FCCR, the definition and application of the FCCR contained in the indentures differ from the definition and application of the FCCR in the ABL facility in that the numerator of the FCCR as defined in the indentures does not include cash income taxes or non-financed capital expenditures and the denominator of the FCCR as defined in the indentures does not include the sum of certain distributions paid in cash and scheduled principal reductions on debt, and separate FCCRs are required under certain circumstances. See “Management’s Discussion and Analysis of Financial Condition and Results of Operations—Financing Activities.”
Assuming an initial public offering price of $ per share, which represents the midpoint of the range set forth on the cover page of this prospectus, and the subsequent purchase of the maximum principal amount of the 2007 Notes out of the net proceeds of this offering (assuming the exercise of the underwriters’ option to purchase additional shares in full), the FCCR under our ABL facility on a pro forma basis for the year ended December 31, 2008 and the twelve months ended September 30, 2009 would have been and , respectively.
| (3) | The pro forma combined balance sheet data reflects the balance sheet data as of September 30, 2009, adjusted for this offering and the use of the proceeds assuming the purchase of the maximum principal amount of the 2007 Notes out of the net proceeds from this offering, and |
16
Table of Contents
| assuming an initial public offering price of $ per share. A $1.00 increase (decrease) in the assumed initial public offering price of $ per share would decrease (increase) net total debt by approximately $ million, and increase (decrease) stockholders’ equity by $ , assuming the number of shares offered by us, as set forth on the cover page of this prospectus, remains the same and after deducting the estimated underwriting discounts and commissions and offering expenses payable by us. For every additional 1,000,000 shares sold by us in this offering, including as a result of the exercise by the underwriters of their option to purchase additional shares from us, stockholders’ equity would increase by $ , assuming an initial public offering price of $ per share and after deducting the estimated underwriting discounts and commissions and offering expenses payable by us. |
| (4) | Defined as the net book value of debt less cash. |
17
Table of Contents
Investing in our common stock involves a high degree of risk. You should carefully consider the risk factors set forth below as well as the other information contained in this prospectus before investing in our common stock or deciding whether you will or will not participate in this offering. Any of the following risks could materially and adversely affect our business, financial condition, results of operations or cash flows. In such a case, you may lose all or part of your original investment.
Risks Related to Our Business
Our business, financial condition, results of operations and cash flows are heavily affected by changing metal prices.
Metals costs typically represent approximately 75% of our net sales. Metals costs can be volatile due to numerous factors beyond our control, including domestic and international economic conditions, labor costs, production levels, competition, import duties and tariffs and currency exchange rates. This volatility can significantly affect the availability and cost of raw materials for us and may, therefore, adversely affect our net sales, operating margin and net income. Our metal service centers maintain substantial inventories of metal to accommodate the short lead-times and just-in-time delivery requirements of our customers. Accordingly, using information derived from customers, market conditions, historic usage and industry research, we purchase metal in an effort to maintain our inventory at levels that we believe to be appropriate to satisfy the anticipated needs of our customers. Our commitments for metal purchases are generally at prevailing market prices in effect at the time we place our orders. We have no substantial long-term, fixed-price purchase contracts. When raw material prices rise, we may not be able to pass the price increase on to our customers. When raw material prices decline, customer demands for lower prices could result in lower sale prices and, to the extent we reduce existing inventory quantities, lower margins. There have been historical periods of rapid and significant movements in the prices of metal both upward and downward. Any limitation on our ability to pass through any price increases to our customers could have a material adverse effect on our business, financial condition, results of operations or cash flows.
Changes in metal prices also affect our liquidity because of the time difference between our payment for our raw materials and our collection of cash from our customers. We sell our products and typically collect our accounts receivable within 45 days after the sale; however, we tend to pay for replacement materials (which are more expensive when metal prices are rising) over a much shorter period, in part to benefit from early-payment discounts. As a result, when metal prices are rising, we tend to draw more on the ABL facility to cover the cash flow cycle from our raw material purchases to cash collection. This cash requirement for working capital is higher in periods when we are increasing inventory quantities. Our liquidity is thus adversely affected by rising metal prices. See “Management’s Discussion and Analysis of Financial Condition and Results of Operations—Liquidity and Capital Resources—Operating and Investing Activities.”
Our operating results and liquidity could be negatively affected during economic downturns because the demand for our products is cyclical.
Many of our products are used in businesses that are, to varying degrees, cyclical and have historically experienced periodic downturns due to economic conditions, energy prices, consumer demand and other factors beyond our control. These economic and industry downturns have been characterized by diminished product demand, excess capacity and, in some cases, lower average selling prices for our products. The recent economic downturn and uncertainty about current global economic conditions pose risks as businesses in one or more of the markets that we serve, or consumers in one or more of the end-markets that our customers serve, may postpone purchases in
18
Table of Contents
response to tighter credit, negative financial news and/or declines in asset values, which could have a material adverse effect on the demand for our products and services and on our financial condition, results of operations or cash flows. Additionally, as an increasing amount of our customers relocate their manufacturing facilities outside of the United States, we may not be able to maintain our level of sales to those customers.
More recently, the decline in steel prices resulting from weakened demand and an oversupply of steel throughout the supply chain during the latter half of 2008 and first half of 2009 have contributed to a significant decline in steel product shipments from metals service centers in the U.S in year-over-year comparisons. Reduced demand in a number of our markets combined with the foreign relocation of some of our customers could have an adverse effect on our business, financial condition, results of operations or cash flows.
Our customers sell their products abroad, and some of our suppliers buy feedstock abroad. As a result, our business is affected by general economic conditions and other factors outside the United States, primarily in Europe and Asia. Our suppliers’ access to metal, and therefore our access to metal, is additionally affected by such conditions and factors. Similarly, the demand for our customers’ products, and therefore our products, is affected by such conditions and factors. These conditions and factors include enhanced imbalances in the world’s iron ore, coal and steel industries, a downturn in world economies, increases in interest rates, unfavorable currency fluctuations or a slowdown in the key industries served by our customers. In addition, demand for the products of our Building Products Group has been and is expected to continue to be adversely affected if the current state of the housing market continues to contract, since the results of that group depend on a strong residential remodeling industry, which in turn has been historically driven by an expansion in the broader housing market and relatively high consumer confidence.
We rely on metal suppliers in our business and purchase a significant amount of metal from a limited number of suppliers and termination of one or more of our relationships with any of them could have a material adverse effect on our business, financial condition, results of operations or cash flows.
We use a variety of metals in our business. Our operations depend upon obtaining adequate supplies of metal on a timely basis. We purchase most of our metal from a limited number of metal suppliers. As of September 30, 2009, our top two metals suppliers represent a significant portion of our total metal purchasing cost. Termination of our relationship with either of these suppliers could have a material adverse effect on our business, financial condition, results of operations or cash flows if we were unable to obtain metal from other sources in a timely manner.
In addition, the domestic metals production industry has experienced consolidation in recent years. Further consolidation could result in a decrease in the number of our major suppliers or a decrease in the number of alternative supply sources available to us, which could make it more likely that termination of one or more of our relationships with major suppliers would result in a material adverse effect on our business, financial condition, results of operations or cash flows. Consolidation could also result in price increases for the metal that we purchase. Such price increases could have a material adverse effect on our business, financial condition, results of operations or cash flows if we were not able to pass these price increases on to our customers.
Intense competition in our fragmented industry could adversely affect our profitability.
We are engaged in a highly fragmented and competitive industry. We compete with a large number of other value-added oriented metals processor/metal service centers on a regional and local basis, some of which may have greater financial resources than we have. The United States and
19
Table of Contents
Canadian metal service center industry generated $153 billion in sales from approximately 1,200 participants in 2008. Based on 2008 revenues the top 100 competitors represent approximately 47% of industry revenue. Metals USA is ranked ninth among this group based on 2008 revenues. We also compete, to a much lesser extent, with primary metals producers, who typically sell to very large customers requiring regular shipments of large volumes of metals. Because price, particularly in the ferrous flat rolled business, is a competitive factor we may be required in the future to reduce sales volumes to maintain our level of profitability. Increased competition in any of our businesses could have a material adverse effect on our business, financial condition, results of operations or cash flows.
Our ability to retain our key employees is critical to the success of our business, and failure to do so may adversely affect our revenues and as a result could materially adversely affect our business, financial condition, results of operations and cash flows.
We are dependent on the services of our Chief Executive Officer and other members of our senior management team to remain competitive in our industry. We may not be able to retain or replace one or more of these key employees, we may suffer an extended interruption in one or more of their services or we may lose the services of one or more of these key employees entirely. Our current key employees are subject to employment conditions or arrangements that permit the employees to terminate their employment without notice. See “Management—Management Agreements with Metals USA and Related Stock Option Grants from Metals USA Holdings.” Other than a life insurance policy maintained by us on our Chief Executive Officer, for which we are the beneficiary, we do not maintain any life insurance policies for our key employees. If any of our key employees were not able to dedicate adequate time to our business, due to personal or other factors, if we lose or suffer an extended interruption in the services of any of our key employees or if any of our key employees were to terminate their employment it could have a material adverse effect on our business, financial condition, results of operations or cash flows. In addition, the market for qualified individuals may be highly competitive and we may not be able to attract and retain qualified personnel to replace or succeed members of our senior management or other key employees, should the need arise.
From time to time, there are shortages of qualified operators of metals processing equipment. In addition, during periods of low unemployment, turnover among less-skilled workers can be relatively high. Any failure to retain a sufficient number of such employees in the future could have a material adverse effect on our business, financial condition, results of operations or cash flows.
We are subject to litigation that could strain our resources and distract management.
From time to time, we are involved in a variety of claims, lawsuits and other disputes arising in the ordinary course of business. These suits concern issues including product liability, contract disputes, employee-related matters and personal injury matters. It is not feasible to predict the outcome of all pending suits and claims, and the ultimate resolution of these matters as well as future lawsuits could have a material adverse effect on our business, financial condition, results of operations or cash flows or reputation.
Environmental costs could decrease our net cash flow and adversely affect our profitability.
Our operations are subject to extensive regulations governing waste disposal, air and water emissions, the handling of hazardous substances, remediation, workplace exposure and other environmental matters. Some of the properties we own or lease are located in areas with a history of heavy industrial use, and are near sites listed for clean up under the Comprehensive Environmental Response, Compensation, and Liability Act, which we refer to as “CERCLA.” See “Business—Government Regulation and Environmental Matters.” CERCLA established joint and several responsibility for clean-up without regard to fault for persons who have arranged for disposal of hazardous substances at sites that have become contaminated and for persons who own or operate
20
Table of Contents
contaminated facilities. We have a number of properties located in or near industrial or light industrial use areas; accordingly, these properties may have been contaminated by pollutants which would have migrated from neighboring facilities or have been deposited by prior occupants. Some of our properties are affected by contamination from leaks and drips of cutting oils and similar materials. The costs of clean-ups to date have not been material. It is possible that we could be notified of such claims in the future. See “Business—Government Regulation and Environmental Matters.” It is also possible that we could be identified by the Environmental Protection Agency, a state agency or one or more third parties as a potentially responsible party under CERCLA or under analogous state laws. If so, we could incur substantial costs related to such claims, which could decrease our net cash flows and adversely affect our profitability.
Adverse developments in our relationship with our unionized employees could adversely affect our business.
As of September 30, 2009, approximately 176 of our employees (approximately 10%) at various sites were members of unions. We are currently a party to seven collective-bargaining agreements. One expires in 2009, five expire in 2010 and one expires in 2011. Presently we do not anticipate any problems or issues with respect to renewing these agreements upon acceptable terms. However, no assurances can be given that we will succeed in negotiating new collective-bargaining agreements to replace the expiring ones without a strike. Any strikes in the future could have a material adverse effect on our business, financial condition, results of operations or cash flows. See “Business—Employees” for a discussion of our previous negotiations of collective-bargaining agreements.
Our historical financial information is not comparable to our current financial condition, results of operations and cash flows because of our use of purchase accounting in connection with the Merger (which resulted in a new valuation for the assets and liabilities of Metals USA to their fair values) and the acquisitions of Port City, Lynch Metals and Allmet.
It may be difficult for you to compare both our historical and future results to our results for the fiscal year ended December 31, 2008 and the nine months ended September 30, 2009. The Merger was accounted for utilizing purchase accounting, which resulted in a new valuation for the assets and liabilities of Metals USA to their fair values. This new basis of accounting began on November 30, 2005. In addition, the acquisition of Port City and Dura-loc Roofing Systems Limited, subsequently renamed Allmet, which we refer to as “Allmet” (collectively, which we refer to as the “2006 Acquisitions”), and the acquisition of Lynch Metals were, and we expect future acquisitions will be, also accounted for using purchase accounting and, therefore, similar limitations regarding comparability of historical and subsequent results could arise. Under the purchase method of accounting, the operating results of each of the acquired businesses, including the 2006 Acquisitions and Lynch Metals, are included in our financial statements only from the date of the acquisitions. As a result, amounts presented in the consolidated financial statements and footnotes may not be comparable with those of prior periods.
We may not successfully implement our acquisition strategy, and acquisitions that we pursue may present unforeseen integration obstacles and costs, increase our leverage and negatively impact our performance.
We intend to continue to pursue our acquisition strategy, and we generally target one to two “bolt-on” acquisitions per year that will enhance our metal service center strategy. We may not be able to identify suitable acquisition candidates, and if we do identify suitable candidates, they may be larger than our historical targets. The expense incurred in consummating acquisitions of related businesses, or our failure to integrate such businesses successfully into our existing businesses, could affect our growth or result in our incurring unanticipated expenses and losses. Furthermore, we may not be able to realize any anticipated benefits from acquisitions. We regularly evaluate potential acquisitions and
21
Table of Contents
may complete one or more significant acquisitions in the future. To finance an acquisition, we may incur debt or issue equity, both of which could be materially greater amounts than in connection with prior acquisitions. The process of integrating acquired operations into our existing operations may result in unforeseen operating difficulties and may require significant financial resources that would otherwise be available for the ongoing development or expansion of existing operations. Some of the risks associated with our acquisition strategy, which could have an adverse effect on our business, financial condition, results of operations and cash flows, include:
| Ÿ | potential disruption of our ongoing business and distraction of management; |
| Ÿ | unexpected loss of key employees or customers of the acquired company; |
| Ÿ | conforming the acquired company’s standards, processes, procedures and controls with our operations; |
| Ÿ | coordinating new product and process development; |
| Ÿ | hiring additional management and other critical personnel; |
| Ÿ | encountering unknown contingent liabilities that could be material; and |
| Ÿ | increasing the scope, geographic diversity and complexity of our operations. |
As a result of the foregoing, our acquisition strategy may not be successfully received by customers, and we may not realize any anticipated benefits from acquisitions.
We may not be able to sustain the annual cost savings realized as part of our recent cost reduction initiatives.
Since the fourth quarter of 2008, we have implemented approximately $50.0 million of annualized cost savings, a vast majority of which we believe are permanent reductions that further reduce what we believe to be the lowest cost structure in our industry. The cost savings have come primarily as a result of various actions, including reducing our headcount by approximately 30%, modifying employee benefits, closing 7 facilities primarily in our Building Products Group, reducing work hours for our employees and streamlining our delivery fleet. We may not be able to sustain all, or any part of, these cost savings on an annual basis in the future, which could have an adverse effect on our business, financial condition, results of operations and cash flows.
Metals USA Holdings is a holding company and relies on dividends and other payments, advances and transfers of funds from its subsidiaries to meet its dividend and other obligations.
Metals USA Holdings has no direct operations and derives all of its cash flow from its subsidiaries. Because Metals USA Holdings conducts its operations through its subsidiaries, Metals USA Holdings depends on those entities for dividends and other payments to generate the funds necessary to meet its financial obligations, and to pay any dividends with respect to our common stock. Legal and contractual restrictions in the ABL facility, the indenture governing the Metals USA Notes, the 2007 Notes indenture and other agreements governing current and future indebtedness of Metals USA Holdings’ subsidiaries, as well as the financial condition and operating requirements of Metals USA Holdings’ subsidiaries, may limit Metals USA Holdings’ ability to obtain cash from its subsidiaries. The earnings from, or other available assets of, Metals USA Holdings’ subsidiaries may not be sufficient to pay dividends or make distributions or loans to enable Metals USA Holdings to pay any dividends on our common stock.
22
Table of Contents
We may not be able to retain or expand our customer base if the North American manufacturing industry continues to erode through moving offshore or through acquisition and merger or consolidation activity in our customers’ industries.
Our customer base, including our Flat Rolled and Non-Ferrous Group’s customer base, primarily includes manufacturing and industrial firms. Some of these customers operate in industries that are undergoing consolidation through acquisition and merger activity; some are considering or have considered relocating production operations overseas or outsourcing particular functions overseas; and some customers have closed as they were unable to compete successfully with overseas competitors. Our facilities are predominately located in the mid-western and southern United States. To the extent that these customers cease U.S. operations, relocate or move operations overseas to regions in which we do not have a presence, we could lose their business. In addition, acquirers of manufacturing and industrial firms may have suppliers of choice that do not include us, which could affect our customer base and sales.
We may face product liability claims that are costly and create adverse publicity.
If any of the products that we sell cause harm to any of our customers, we could be exposed to product liability lawsuits. If we were found liable under product liability claims, we could be required to pay substantial monetary damages. Further, even if we successfully defended ourselves against this type of claim, we could be forced to spend a substantial amount of money in litigation expenses, our management could be required to spend valuable time to defend against these claims and our reputation could suffer, any of which could harm our business.
We may not be able to generate sufficient cash to service all of our indebtedness.
Our ability to make payments on our indebtedness depends on our ability to generate cash in the future. The Metals USA Notes, the ABL facility and our other outstanding indebtedness are expected to account for significant cash interest expenses in fiscal 2009 and subsequent years. Accordingly, we will have to generate significant cash flows from operations to meet our debt service requirements. If we do not generate sufficient cash flow to meet our debt service and working capital requirements, we may need to seek additional financing; however, this insufficient cash flow may make it more difficult for us to obtain financing on terms that are acceptable to us, or at all. Furthermore, Apollo has no obligation to provide us with debt or equity financing and we therefore may be unable to generate sufficient cash to service all of our indebtedness.
Our substantial leverage exposes us to interest rate risk and could adversely affect our ability to raise additional capital to fund our operations, limit our ability to react to changes in the economy or our industry and prevent us from meeting our obligations under our indebtedness.
We are highly leveraged. As of September 30, 2009, our total indebtedness was $501.1 million. We also had an additional $128.9 million available for borrowing under the ABL facility as of that date. As of September 30, 2009, we had $500.9 million of indebtedness outstanding under the ABL facility, the Metals USA Notes, the 2007 Notes and an Industrial Revenue Bond, which we refer to as “IRB,” and $0.2 million of junior indebtedness outstanding. We are required by the terms of the 2007 Notes to make an offer to all holders of the 2007 Notes, of which $178.9 million aggregate principal amount were outstanding as of September 30, 2009, within 60 days of the receipt of the proceeds of this offering to repurchase the maximum principal amount of the 2007 Notes that may be purchased out of the net proceeds, estimated to be approximately $ million, or $ million if the over-allotment option is exercised in full, at a price equal to 100% of the principal amount, plus accrued and unpaid interest to the date of the closing of the repurchase offer. We cannot assure you that holders of the 2007 Notes will accept our offer. We will also continue to be subject to the covenants in the indenture governing the 2007 Notes if any 2007 Notes remain outstanding after the offer. See “Use of Proceeds.”
23
Table of Contents
Our substantial indebtedness could have important consequences for you, including:
| Ÿ | it may limit, along with the financial and other restrictive covenants in our indebtedness, among other things, our ability to borrow money, dispose of assets or sell equity for our working capital, capital expenditures, dividend payments, debt service requirements, strategic initiatives or other purposes; |
| Ÿ | it may limit our flexibility in planning for, or reacting to, changes in our operations or business; |
| Ÿ | we may be more highly leveraged than some of our competitors, which may place us at a competitive disadvantage; |
| Ÿ | it may make us more vulnerable to downturns in our business or the economy; and |
| Ÿ | there would be a material adverse effect on our business, financial condition, results of operations or cash flows if we were unable to service our indebtedness or obtain additional financing, as needed. |
Our debt agreements impose significant operating and financial restrictions, which could have a material adverse effect on our business, financial condition, results of operations or cash flows.
The ABL facility and the indentures governing the Metals USA Notes and the 2007 Notes contain various covenants that limit or prohibit our ability, among other things, to:
| Ÿ | incur or guarantee additional indebtedness or issue certain preferred shares; |
| Ÿ | pay dividends on our capital stock or redeem, repurchase, retire or make distributions in respect of our capital stock or subordinated indebtedness or make other restricted payments; |
| Ÿ | make certain loans, acquisitions, capital expenditures or investments; |
| Ÿ | sell certain assets, including stock of our subsidiaries; |
| Ÿ | enter into sale and leaseback transactions; |
| Ÿ | create or incur liens; |
| Ÿ | consolidate, merge, sell, transfer or otherwise dispose of all or substantially all of our assets; and |
| Ÿ | enter into certain transactions with our affiliates. |
The indentures governing the Metals USA Notes and the 2007 Notes contain covenants that restrict our ability to take certain actions, such as incurring additional debt, if we are unable to meet defined adjusted EBITDA to fixed charges and consolidated total debt ratios (each, as defined by the applicable indenture). The covenants in the indentures require us to have an adjusted EBITDA to fixed charge ratio (measured on a trailing four-quarter basis and calculated differently from the FCCR as defined by the ABL facility) of 2.0 to 1.0 to incur “ratio” indebtedness and a consolidated total debt ratio of no greater than 4.75 to 1.0 to incur “ratio” indebtedness in connection with acquisitions. Based on the calculations for the trailing four quarters, we are not able to satisfy these covenants and incur additional indebtedness under these ratios, including for acquisition purposes, under our indentures.
As of September 30, 2009, our FCCR was 0.14. As of September 30, 2009 we had $128.9 million of additional borrowing capacity under the ABL facility. Failure to comply with the FCCR covenant of the ABL facility can result in limiting our long-term growth prospects by hindering our ability to incur future indebtedness or grow through acquisitions. The interest rate in respect of borrowings under the ABL facility is determined in reference to the FCCR, and should borrowing availability under the ABL facility fall below $45.0 million, we must maintain an FCCR of at least 1.0 to 1.0, measured on a trailing four-quarter basis.
24
Table of Contents
A breach of any of these covenants could result in a default under our debt agreements. See “Management’s Discussion and Analysis of Financial Condition and Results of Operations—Financing Activities—Covenant Compliance.”
The restrictions contained in the agreements that govern the terms of our debt could:
| Ÿ | limit our ability to plan for or react to market conditions or meet capital needs or otherwise restrict our activities or business plans; |
| Ÿ | adversely affect our ability to finance our operations, to enter into strategic acquisitions, investments or other capital needs or to engage in other business activities that would be in our interest; and |
| Ÿ | limit our access to the cash generated by our subsidiaries. |
Upon the occurrence of an event of default under the ABL facility, the lenders could elect to declare all amounts outstanding under the ABL facility to be immediately due and payable and terminate all commitments to extend further credit. If we were unable to repay those amounts, the lenders under the ABL facility could proceed against the collateral granted to them to secure the ABL facility on a first-priority lien basis. If the lenders under the ABL facility accelerate the repayment of borrowings, such acceleration could have a material adverse effect on our business, financial condition, results of operations or cash flows. In addition, we may not have sufficient assets to repay the 2007 Notes or the Metals USA Notes upon acceleration.
For a more detailed description on the limitations on our ability to incur additional indebtedness, please see “Management’s Discussion and Analysis of Financial Condition and Results of Operations—Financing Activities” and “Description of Certain Indebtedness.”
Despite our substantial indebtedness, we may still be able to incur significantly more indebtedness which could have a material adverse effect on our business, financial condition or results of operations.
The terms of the Metals USA Notes indenture, the 2007 Notes indenture and the ABL facility contain restrictions on our ability to incur additional indebtedness. These restrictions are subject to a number of important qualifications and exceptions, and the indebtedness incurred in compliance with these restrictions could be substantial. Accordingly, we or our subsidiaries could incur significant additional indebtedness in the future. As of September 30, 2009, we had approximately $128.9 million available for additional borrowing under the ABL facility, including the subfacility for letters of credit, and the covenants under our debt agreements would allow us to borrow a significant amount of additional indebtedness. In addition, the Metals USA Notes indenture does not limit the amount of indebtedness that may be incurred by Flag Intermediate or Metals USA Holdings. Additional leverage could have a material adverse effect on our business, financial condition or results of operations and could increase the risks described in “—Our substantial leverage exposes us to interest rate risk and could adversely affect our ability to raise additional capital to fund our operations, limit our ability to react to changes in the economy or our industry and prevent us from meeting our obligations under our indebtedness,” “—Our debt agreements impose significant operating and financial restrictions, which could have a material adverse effect on our business, financial condition, results of operations or cash flows” and “—Because a substantial portion of our indebtedness bears interest at rates that fluctuate with changes in certain prevailing short-term interest rates, we are vulnerable to interest rate increases.”
25
Table of Contents
Because a substantial portion of our indebtedness bears interest at rates that fluctuate with changes in certain prevailing short-term interest rates, we are vulnerable to interest rate increases.
A substantial portion of our indebtedness, including the ABL facility and the 2007 Notes, bears interest at rates that fluctuate with changes in certain short-term prevailing interest rates. As of September 30, 2009, we had approximately $274.6 million of floating rate debt under the 2007 Notes, the ABL facility and the IRB. We also had an additional $128.9 million available for borrowing under the ABL facility as of September 30, 2009. Assuming a consistent level of debt, a 100 basis point change in the interest rate on our floating rate debt effective from the beginning of the year would increase or decrease our fiscal 2009 interest expense under the 2007 Notes, the ABL facility and the IRB by approximately $2.7 million. We use derivative financial instruments to manage a portion of the potential impact of our interest rate risk. To some extent, derivative financial instruments can protect against increases in interest rates, but they do not provide complete protection over the longer term. If interest rates increase dramatically, we could be unable to service our debt which could have a material adverse effect on our business, financial condition, results of operations or cash flows.
Cash interest on the 2007 Notes will accrue at a rate per annum, reset quarterly, equal to London Interbank Offered Rate which we refer to as “LIBOR,” plus a spread of 6.00%, which increases by 0.25% to 6.25% in the second year of the issuance of the 2007 Notes, by 0.50% to 6.50% in the third year of the issuance of the 2007 Notes, and by 0.75% to 6.75% in the fourth year of the issuance of the 2007 Notes. The spread increased to 6.25% on July 10, 2008 and to 6.50% on July 10, 2009. Assuming a LIBOR rate of % and the adjusted spread of 6.50% and assuming $ million of our 2007 Notes are repurchased with the proceeds of this offering, our annual interest expense would be reduced by $ million. We cannot assure you, however, that holders of our 2007 Notes will accept our offer to repurchase their notes. For each $1.0 million of 2007 Notes that remain outstanding our interest expense related thereto will be $ .
Risks Related to an Investment in Our Common Stock and This Offering
There is no existing market for our common stock and we do not know if one will develop, which could impede your ability to sell your shares and depress the market price of our common stock.
Prior to this offering, there has not been a public market for our common stock. We cannot predict the extent to which investor interest in our company will lead to the development of an active trading market on The New York Stock Exchange or otherwise or how liquid that market might become. If an active trading market does not develop, you may have difficulty selling any of our common stock that you buy. The initial public offering price for the common stock will be determined by negotiations between us and the representative of the underwriters and may not be indicative of prices that will prevail in the open market following this offering. See “Underwriting.” Consequently, you may not be able to sell our common stock at prices equal to or greater than the price you paid in this offering.
Apollo controls us and its interests may conflict with or differ from your interests as a stockholder.
After the consummation of this offering, Apollo will beneficially own approximately % of our common stock, assuming the underwriters do not exercise their over-allotment option. If the underwriters exercise in full their over-allotment option, Apollo will beneficially own approximately % of our common stock immediately after the consummation of this offering. As a result, Apollo will continue to have the power to elect all of our directors and will have the ability to prevent any transaction that requires the approval of our board of directors or stockholders, including the approval of significant corporate transactions such as mergers and the sale of substantially all of our assets.
26
Table of Contents
The amended and restated investors rights agreement that we intend to enter into with Apollo and each of our management members, which we refer to as the “amended and restated investors rights agreement,” will provide that, except as otherwise required by applicable law, Apollo will have the right to nominate (a) four directors as long as Apollo owns (including shares of common stock issuable under the terms of any exchangeable securities issued by us) at least 30% but less than 50% of our outstanding common stock, (b) three directors as long as Apollo owns (including shares of common stock issuable under the terms of any exchangeable securities issued by us) at least 20% but less than 30% of our outstanding common stock and (c) two directors as long as Apollo owns (including shares of common stock issuable under the terms of any exchangeable securities issued by us) at least 10% but less than 20% of our outstanding common stock. In the event that the board of directors increases its size beyond nine members, Apollo’s nomination rights will be proportionately increased, rounded up to the nearest whole number. Thus, Apollo will continue to be able to significantly influence or effectively control our decisions. See “Certain Relationships and Related Party Transactions—Related Party Transactions—Amended and Restated Investors Rights Agreement” and “Description of Capital Stock—Composition of Board of Directors; Election and Removal of Directors.”
The interests of Apollo could conflict with or differ from your interests as a holder of our common stock. For example, the concentration of ownership held by Apollo could delay, defer or prevent a change of control of our company or impede a merger, takeover or other business combination that you as a stockholder may otherwise view favorably. Apollo is in the business of making or advising on investments in companies and holds, and may from time to time in the future acquire, interests in or provide advice to businesses that directly or indirectly compete with certain portions of our business or are suppliers or customers of ours. They may also pursue acquisitions that may be complementary to our business, and, as a result, those acquisition opportunities may not be available to us. Further, Apollo will realize substantial benefits from the sale of their shares in this offering. A sale of a substantial number of shares of stock in the future by funds affiliated with Apollo could cause our stock price to decline.
Because all of the proceeds from this offering of our common stock may be used to repay the 2007 Notes, none or very little of such proceeds may be used to further invest in our business.
The 2007 Notes indenture requires that we make an offer to all holders of the 2007 Notes within 60 days of the receipt of the proceeds of this offering to repurchase the maximum principal amount of the 2007 Notes that may be purchased out of the net proceeds, estimated to be approximately $ million, or $ million if the over-allotment option is exercised in full, at a price equal to 100% of the principal amount, plus accrued and unpaid interest to the date of the closing of the repurchase offer. As a result, none or very little of such proceeds may be used to further invest in our business. On November 13, 2009, the 2007 Notes traded at 80.625%, based on quoted market prices. See “Use of Proceeds.”
We are a “controlled company” within the meaning of The New York Stock Exchange rules and, as a result, will qualify for, and intend to rely on, exemptions from certain corporate governance requirements.
Upon the closing of this offering, Apollo will continue to control a majority of our voting common stock. As a result, we are a “controlled company” within the meaning of The New York Stock Exchange corporate governance standards. Under The New York Stock Exchange rules, a company of which more than 50% of the voting power is held by an individual, group or another company is a “controlled company” and may elect not to comply with certain New York Stock Exchange corporate governance requirements, including:
| Ÿ | the requirement that a majority of the board of directors consists of independent directors; |
27
Table of Contents
| Ÿ | the requirement that we have a nominating/governance committee that is composed entirely of independent directors with a written charter addressing the committee’s purpose and responsibilities; |
| Ÿ | the requirement that we have a compensation committee that is composed entirely of independent directors with a written charter addressing the committee’s purpose and responsibilities; and |
| Ÿ | the requirement for an annual performance evaluation of the nominating/governance and compensation committees. |
Following this offering, we intend to utilize the exemptions from The New York Stock Exchange corporate governance requirements, including the foregoing. As a result, we will not have a majority of independent directors nor will our nominating/governance and compensation committees consist entirely of independent directors and we will not be required to have an annual performance evaluation of the nominating/governance and compensation committees. See “Management.” Accordingly, you will not have the same protections afforded to stockholders of companies that are subject to all of The New York Stock Exchange corporate governance requirements.
The price of our common stock may fluctuate significantly and you could lose all or part of your investment.
Volatility in the market price of our common stock price may prevent you from being able to sell your common stock at or above the price you paid for your common stock. The market price for our common stock could fluctuate significantly for various reasons, including:
| Ÿ | our operating and financial performance and prospects; |
| Ÿ | our quarterly or annual earnings or those of other companies in our industry; |
| Ÿ | conditions that impact demand for our products and services; |
| Ÿ | future announcements concerning our business or our competitors’ businesses; |
| Ÿ | the public’s reaction to our press releases, other public announcements and filings with the U.S. Securities and Exchange Commission, which we refer to as the “SEC”; |
| Ÿ | changes in earnings estimates or recommendations by securities analysts who track our common stock; |
| Ÿ | market and industry perception of our success, or lack thereof, in pursuing our growth strategy; |
| Ÿ | strategic actions by us or our competitors, such as acquisitions or restructurings; |
| Ÿ | changes in government and environmental regulation; |
| Ÿ | general market, economic and political conditions; |
| Ÿ | changes in accounting standards, policies, guidance, interpretations or principles; |
| Ÿ | arrival and departure of key personnel; |
| Ÿ | the number of shares to be publicly traded after this offering; |
| Ÿ | sales of common stock by us, Apollo or members of our management team; |
| Ÿ | adverse resolution of new or pending litigation against us; and |
| Ÿ | changes in general market, economic and political conditions in the United States and global economies or financial markets, including those resulting from natural disasters, terrorist attacks, acts of war and responses to such events. |
See “—Risks Related to Our Business.”
28
Table of Contents
In addition, in recent years, the stock market has experienced significant price and volume fluctuations. This volatility has had a significant impact on the market price of securities issued by many companies, including companies in our industry. The changes frequently appear to occur without regard to the operating performance of the affected companies. Hence, the price of our common stock could fluctuate based upon factors that have little or nothing to do with our company, and these fluctuations could materially reduce our share price.
We have no plans to pay regular dividends on our common stock, so you may not receive funds without selling your common stock.
We have no plans to pay regular dividends on our common stock. Any payment of future dividends will be at the discretion of our board of directors and will depend on, among other things, our earnings, financial condition, capital requirements, level of indebtedness, statutory and contractual restrictions applying to the payment of dividends, and other considerations that our board of directors deems relevant. The ABL facility and the indentures governing the 2007 Notes and the Metals USA Notes also include limitations on the ability of our subsidiaries to pay dividends to us. Accordingly, you may have to sell some or all of your common stock in order to generate cash flow from your investment.
Future sales or the possibility of future sales of a substantial amount of our common stock may depress the price of shares of our common stock.
We may sell additional shares of common stock in subsequent public offerings or otherwise, including to finance acquisitions. Our amended and restated articles of incorporation will authorize us to issue shares of common stock, of which shares will be outstanding upon consummation of this offering. This number includes shares that we are selling in this offering, which may be resold immediately in the public market. Of the remaining shares, or % are restricted from immediate resale under the federal securities laws and the lock-up agreements between our current stockholders and the underwriters described in the “Underwriting” section of this prospectus, but may be sold into the market in the near future. These shares will become available for sale at various times following the expiration of the lock-up agreements, which, without the prior consent of the representative of the underwriters, is 180 days after the date of this prospectus (which period could be extended by the underwriters for up to an additional 18 days under certain circumstances). Immediately after the expiration of the 180-day lock-up period, the shares will be eligible for resale under Rule 144 or Rule 701 of the Securities Act subject to volume limitations and applicable holding period requirements. In addition, immediately following this offering, we intend to file a registration statement under the Securities Act registering 1,400,000 shares reserved for issuance under the 2005 Plan (of which shares will not be subject to the 180-day lock-up).
We cannot predict the size of future issuances of our common stock or the effect, if any, that future issuances and sales of our common stock will have on the market price of our common stock. Sales of substantial amounts of our common stock (including shares issued in connection with an acquisition), or the perception that such sales could occur, may adversely affect prevailing market prices for our common stock.
29
Table of Contents
Our organizational documents may impede or discourage a takeover, which could deprive our investors of the opportunity to receive a premium for their shares.
Provisions of our amended and restated certificate of incorporation and bylaws may make it more difficult for, or prevent a third party from, acquiring control of us without the approval of our board of directors. These provisions include:
| Ÿ | a classified board of directors; |
| Ÿ | the sole power of a majority of the board of directors to fix the number of directors; |
| Ÿ | limitations on the removal of directors; |
| Ÿ | the ability of our board of directors to designate one or more series of preferred stock and issue shares of preferred stock without stockholder approval; |
| Ÿ | the sole power of our board of directors to fill any vacancy on our board, whether such vacancy occurs as a result of an increase in the number of directors or otherwise; and |
| Ÿ | advance notice requirements for nominating directors or introducing other business to be conducted at stockholder meetings. |
The foregoing factors, as well as the significant common stock ownership by Apollo, could impede a merger, takeover or other business combination or discourage a potential investor from making a tender offer for our common stock, which, under certain circumstances, could reduce the market value of our common stock. See “Description of Capital Stock.”
You will suffer an immediate and substantial dilution in the net tangible book value of the common stock you purchase.
Prior investors have paid substantially less per share than the price in this offering. The initial offering price is substantially higher than the net tangible book value per share of the outstanding common stock immediately after this offering. Accordingly, based on an assumed initial public offering price of $ per share (the midpoint of the range set forth on the cover page of this prospectus), purchasers of common stock in this offering will experience immediate and substantial dilution of approximately $ per share in net tangible book value of the common stock. See “Dilution,” including the discussion of the effects on dilution from a change in the price of this offering.
Any issuance of preferred stock could make it difficult for another company to acquire us or could otherwise adversely affect holders of our common stock, which could depress the price of our common stock.
Our board of directors has the authority to issue preferred stock and to determine the preferences, limitations and relative rights of shares of preferred stock and to fix the number of shares constituting any series and the designation of such series, without any further vote or action by our stockholders. Our preferred stock could be issued with voting, liquidation, dividend and other rights superior to the rights of our common stock. The potential issuance of preferred stock may delay or prevent a change in control of us, discouraging bids for our common stock at a premium over the market price, and adversely affect the market price and the voting and other rights of the holders of our common stock.
30
Table of Contents
The additional requirements of having a class of publicly traded equity securities may strain our resources and distract management.
After the consummation of this offering, we will be subject to additional reporting requirements of the Securities Exchange Act of 1934, or the Exchange Act, and the Sarbanes-Oxley Act of 2002, which we refer to as the “Sarbanes-Oxley Act.” The Sarbanes-Oxley Act requires that we maintain effective disclosure controls and procedures and internal control for financial reporting. These requirements may place a strain on our systems and resources. Under Section 404 of the Sarbanes-Oxley Act, we are currently required to include a report of management on our internal control over financial reporting in our Annual Reports on Form 10-K. After consummation of this offering, our independent public accountants auditing our financial statements must attest to the effectiveness of our internal control over financial reporting. This requirement will first apply to our Annual Report on Form 10-K for our fiscal year ending December 31, 2010. In order to maintain and improve the effectiveness of our disclosure controls and procedures and internal control over financial reporting, significant resources and management oversight will be required. This may divert management’s attention from other business concerns, which could have a material adverse effect on our business, financial condition, results of operations and cash flows. If we are unable to conclude that our disclosure controls and procedures and internal control over financial reporting are effective, or if our independent public accounting firm is unable to provide us with an unqualified report as to management’s assessment of the effectiveness of our internal control over financial reporting in future years, investors may lose confidence in our financial reports and our stock price may decline.
31
Table of Contents
CAUTIONARY STATEMENT CONCERNING FORWARD-LOOKING STATEMENTS
This prospectus contains “forward-looking statements” that involve risks and uncertainties. You can identify forward-looking statements because they contain words such as “believes,” “expects,” “may,” “should,” “seeks,” “approximately,” “intends,” “plans,” “estimates,” or “anticipates” or similar expressions that relate to our strategy, plans or intentions. All statements we make relating to our estimated and projected earnings, margins, costs, expenditures, cash flows, growth rates and financial results or to our expectations regarding future industry trends are forward-looking statements. In addition, we, through our senior management, from time to time make forward-looking public statements concerning our expected future operations and performance and other developments. These forward-looking statements are subject to risks and uncertainties that may change at any time, and, therefore, our actual results may differ materially from those that we expected. We derive many of our forward-looking statements from our operating budgets and forecasts, which are based upon many detailed assumptions. While we believe that our assumptions are reasonable, we caution that it is very difficult to predict the impact of known factors, and, of course, it is impossible for us to anticipate all factors that could affect our actual results. All forward-looking statements are based upon information available to us on the date of this prospectus.
Important factors that could cause actual results to differ materially from our expectations, which we refer to as “cautionary statements,” are disclosed under “Risk Factors” and elsewhere in this prospectus, including, without limitation, in conjunction with the forward-looking statements included in this prospectus. All forward-looking information in this prospectus and subsequent written and oral forward-looking statements attributable to us, or persons acting on our behalf, are expressly qualified in their entirety by the cautionary statements. Some of the factors that we believe could affect our results include:
| Ÿ | supply, demand, prices and other market conditions for steel and other commodities; |
| Ÿ | the timing and extent of changes in commodity prices, including the cost of energy and raw materials; |
| Ÿ | the effects of competition in our business lines; |
| Ÿ | the condition of the steel and metal markets generally, which will be affected by interest rates, foreign currency fluctuations and general economic conditions; |
| Ÿ | the ability of our counterparties to satisfy their financial commitments; |
| Ÿ | tariffs and other government regulations relating to our products and services; |
| Ÿ | adverse developments in our relationship with both our key employees and unionized employees; |
| Ÿ | operational factors affecting the ongoing commercial operations of our facilities, including catastrophic weather-related damage, regulatory approvals, permit issues, unscheduled blackouts, outages or repairs, unanticipated changes in fuel costs or availability of fuel emission credits or workforce issues; |
| Ÿ | our ability to operate our businesses efficiently, manage capital expenditures and costs (including general and administrative expenses) tightly and generate earnings and cash flow; |
| Ÿ | our ability to pass through increases in our costs to our customers; |
| Ÿ | our substantial indebtedness described in this prospectus; |
| Ÿ | restrictive covenants in our indebtedness that may adversely affect our operational flexibility; |
| Ÿ | general political conditions and developments in the United States and in foreign countries whose affairs affect supply, demand and markets for steel, other metals and metal products; |
32
Table of Contents
| Ÿ | conditions in the United States and international economies; |
| Ÿ | our expectations with respect to our acquisition activity; |
| Ÿ | our ability to retain key employees; and |
| Ÿ | the costs of being a public company, including Sarbanes-Oxley compliance. |
We caution you that the foregoing list of important factors may not contain all of the material factors that are important to you. In addition, in light of these risks and uncertainties, the matters referred to in the forward-looking statements contained in this prospectus may not in fact occur. Accordingly, investors should not place undue reliance on those statements. We undertake no obligation to publicly update or revise any forward-looking statement as a result of new information, future events or otherwise, except as otherwise required by law.
33
Table of Contents
Assuming an initial public offering price of $ per share, which represents the midpoint of the range set forth on the cover page of this prospectus, our net proceeds from this offering are estimated to be approximately $ million after deducting the estimated underwriting discounts and commissions and offering expenses that will be paid out of the proceeds of this offering. We currently intend to use the net proceeds from the shares being sold by us in this offering, including any net proceeds from any sales of our common stock sold pursuant to the underwriters’ over-allotment, as follows:
| Ÿ | approximately $ million to make an offer to all holders of our 2007 Notes to repurchase the maximum principal amount of the 2007 Notes that may be purchased out of the net proceeds of this offering, estimated to be approximately $ million, at a price equal to 100% of the principal amount, plus accrued and unpaid interest to the date of the closing of the repurchase offer; |
| Ÿ | approximately $ million for estimated fees and expenses; and |
| Ÿ | any remaining net proceeds will be used for general corporate purposes. |
Under the terms of the indenture governing the 2007 Notes, we must offer to repurchase all of a holder’s 2007 Notes or a pro rata portion thereof. The 2007 Notes will be repurchased no earlier than 30 days nor later than 60 days from the date we commence the repurchase offer, which may be commenced no later than 60 days following our receipt of the proceeds of this offering. Prior to the commencement of the repurchase offer, we must irrevocably deposit the net proceeds of this offering with the trustee, Wells Fargo Bank, N.A., and the proceeds must be invested in cash or cash equivalents to be held for the payment of the purchase price of the 2007 Notes. We cannot assure you that holders of the 2007 Notes, of which $178.9 million aggregate principal amount are outstanding as of September 30, 2009, will accept our offer. If the amount deposited is greater than the purchase price of the 2007 Notes tendered by holders, the trustee will deliver the excess to us immediately after the expiration of the repurchase offer. We will use the balance of the net proceeds, if any, for general corporate purposes, as described below.
Our affiliates, including Apollo, that are holders of the 2007 Notes may participate in the repurchase offer. See “Certain Relationships and Related Party Transactions—Related Party Transactions—Repurchase Offer.” Assuming the number of shares offered by us, as set forth on the cover page of this prospectus, remains the same, after deducting the estimated underwriting discounts and commissions and estimated offering expenses payable by us in connection with the offering, a $1.00 increase (decrease) in the assumed public offering price of $ per share would increase (decrease) the amount of proceeds from this offering by $ million, with a corresponding increase (decrease) in the repurchase offer made to holders of the 2007 Notes.
If the net proceeds of this offering, including any net proceeds from any sales of our common stock sold pursuant to the underwriters’ over-allotment, are greater than the purchase price of the 2007 Notes tendered in the repurchase offer, we will use any remaining net proceeds for general corporate purposes. General corporate purposes includes working capital, the expansion of our production capabilities, research and development, purchases of capital equipment and potential acquisitions of businesses that we believe are complementary to our business. We have not determined the specific portion of any net proceeds to be used for these purposes, and the net proceeds from this offering have not been accounted for in our normal budgeting process. Although from time to time we evaluate possible acquisitions of companies and assets, we currently have no definitive commitments or agreements to make any acquisitions, and cannot assure you that we will make any acquisitions in the
34
Table of Contents
future. The amounts actually expended for these purposes may vary significantly and will depend on a number of factors, including the amount of cash we generate from future operations, the actual expenses of operating our business, opportunities that may be or become available to us and the other factors described under “Risk Factors.” Notwithstanding the uses described above, we will retain broad discretion in the allocation of any remaining net proceeds after the purchase of the 2007 Notes tendered in the repurchase offer.
We will not receive any proceeds from the sale of our common stock by the selling stockholders, including with respect to any shares sold by the selling stockholders pursuant to the underwriters’ exercise of their option to purchase additional shares. In the aggregate, the selling stockholders will receive approximately $ million of proceeds from this offering, after deducting the estimated underwriting discounts and commissions and offering expenses, or approximately $ million if the underwriters’ option to purchase additional shares is exercised in full, assuming the shares are offered at $ per share, which is the midpoint of the estimated offering price range set forth on the cover of this prospectus.
The initial five interest payments on the 2007 Notes were paid solely in cash. For any interest period thereafter, we may elect to pay (1) interest entirely in cash or (2) PIK Interest or (3) Partial PIK Interest. On September 26, 2008, we made a permitted election under the indenture governing the 2007 Notes to pay all interest that was due on January 1, 2009, for the interest period beginning on October 1, 2008, and ending on December 31, 2008, entirely through PIK Interest. The January 1, 2009 PIK Interest payment amounted to $8.2 million. We have continued to make PIK interest payments subsequent to January 1, 2009. The April 1, 2009 PIK interest payment amounted to $5.6 million, the July 1, 2009 PIK interest payment amounted to $3.8 million, and the October 1, 2009 PIK interest payment amounted to $3.5 million. The Company must make an election regarding whether subsequent interest payments will be made in cash, through PIK Interest, or Partial PIK Interest, prior to the start of the applicable interest period. In the absence of such an election for any interest period, interest on the 2007 Notes will be payable according to the election for the previous interest period. As a result, the PIK Interest election is now the default election for future interest periods unless we elect otherwise not later than the commencement of an interest period.
Cash interest on the 2007 Notes will accrue at a rate per annum, reset quarterly, equal to LIBOR plus a spread of 6.00%, which increases by 0.25% to 6.25% in the second year of the issuance of the 2007 Notes, by 0.50% to 6.50% in the third year of the issuance of the 2007 Notes, and by 0.75% to 6.75% in the fourth year of the issuance of the 2007 Notes. In the event PIK Interest is paid on the 2007 Notes, the then-applicable margin over LIBOR on 2007 Notes would increase by 0.75% for each period in which PIK Interest is paid. The 2007 Notes, including any notes issued to pay PIK Interest or Partial PIK Interest, mature on July 1, 2012. See “Management’s Discussion and Analysis of Financial Condition and Results of Operations—Financing Activities—2007 Notes.”
35
Table of Contents
We do not currently anticipate paying any dividends on our common stock in the foreseeable future. Any future determination as to our dividend policy will be made at the discretion of our board of directors and will depend upon many factors, including our financial condition, earnings, legal requirements, restrictions in our debt agreements and other factors our board of directors deems relevant. The terms of the indebtedness of Metals USA, our subsidiary, may also restrict it from paying cash dividends to us under some circumstances. See “Description of Certain Indebtedness,” and “Description of Capital Stock—Common Stock.”
On July 10, 2007, Metals USA Holdings used the net proceeds from the issuance of $300.0 million initial aggregate principal amount of the 2007 Notes as well as approximately $8.3 million of additional borrowings under the ABL facility, to redeem the 2006 Notes (for approximately $150.0 million plus accrued and unpaid interest of approximately $5.4 million) to pay a cash dividend of approximately $130.3 million to its stockholders, which include Apollo and certain members of management, to pay approximately $9.2 million to its stock option holders in order to equitably adjust such stock options to reflect such dividend, which include certain members of our management, which we refer to collectively as the “July 2007 dividend,” and to pay fees and expenses related to the offering of the 2007 Notes.
In connection with the July 2007 dividend, stock option holders were paid approximately $9.25 per share on outstanding options (an amount equal to the per-share amount of the July 2007 dividend), for a total of approximately $9.2 million. The cash payment to holders of outstanding options to acquire shares of Metals USA Holdings’ common stock was made to equitably adjust such option holders by the Metals USA Holdings board of directors pursuant to the exercise of its discretion to preserve the rights of options holders under the 2005 Plan. As a result of the cash payment on outstanding options, we were required to recognize $0.3 million of non-cash stock-based compensation expense, net of related tax effects, in the third quarter of 2007.
During December 2006, Metals USA Holdings issued $150.0 million initial aggregate principal amount of the 2006 Notes. On January 3, 2007, Metals USA Holdings used the net proceeds from the issuance of the 2006 Notes, as well as $8.2 million of additional borrowings under the ABL facility, to pay a cash dividend of approximately $144.8 million to its stockholders, which include Apollo and certain members of our management, to make a cash payment (partially in lieu of the cash dividend) of approximately $4.2 million to its vested stock option holders, which include certain members of our management, and to pay fees and expenses related to the issuance of the 2006 Notes, including a $1.5 million non-recurring transaction fee to Apollo. We refer to such cash payment and the cash dividend collectively as the “January 2007 dividend.”
In connection with the January 2007 dividend, the outstanding employee stock options under the 2005 Plan were adjusted a second time. The combination of the reduction of the per share exercise price of the stock options and the cash payment to vested stock option holders was, on a per share basis, approximately equal to the per share amount of the dividend.
Because the payment of the January 2007 dividend resulted in the achievement of certain performance targets with respect to Apollo’s investment in Metals USA Holdings, the board of directors exercised its discretion under the 2005 Plan to vest all of the outstanding Tranche B options. In addition, the board of directors exercised its discretion to vest Tranche A options granted to directors affiliated with Apollo.
On January 3, 2007, the board of directors of Metals USA Holdings adopted our 2006 Deferred Compensation Plan. Our 2006 Deferred Compensation Plan was adopted in connection with the
36
Table of Contents
January 2007 dividend, and credited to individual accounts established for stock option holders an amount equal to $6.56 per share on certain unvested options, for a total of $2.3 million. Payment of this liability was subject to continued employment for two years following the adoption date. The entire amount was paid in one lump sum on January 5, 2009, upon completion of such period.
37
Table of Contents
The following table sets forth cash and cash equivalents and capitalization as of September 30, 2009:
| Ÿ | on a historical basis; and |
| Ÿ | on a pro forma basis to give effect to: |
| (a) | the issuance of shares of our common stock to our existing stockholders immediately prior to the consummation of this offering; |
| (b) | the sale of approximately shares of our common stock in this offering at the initial public offering price of $ per share, which represents the midpoint of the range set forth on the cover page of this prospectus, providing net proceeds to us from this offering (after deducting the estimated underwriting discounts and commissions) of approximately $ million; and |
| (c) | the application of the net proceeds as described in “Use of Proceeds.” |
This table should be read together with “Use of Proceeds,” “Selected Historical Consolidated Financial Data,” “Risk Factors,” “Management’s Discussion and Analysis of Financial Condition and Results of Operations” and the combined financial statements and notes to those statements, in each case, included elsewhere in this prospectus.
| As of September 30, 2009 | ||||||
| Historical | Pro Forma(1) | |||||
| (in millions) | ||||||
| Cash and cash equivalents(2) |
$ | 20.1 | ||||
| Total debt: |
||||||
| ABL facility(3) |
$ | 90.0 | ||||
| Metals USA Notes |
226.3 | |||||
| 2007 Notes(2) |
178.9 | |||||
| Other long-term debt(4) |
5.9 | |||||
| Total debt |
501.1 | |||||
| Stockholders’ deficit: |
||||||
| Common stock(5)(6) |
0.1 | |||||
| Additional paid-in capital |
6.7 | |||||
| Retained deficit |
(46.6 | ) | ||||
| Accumulated other comprehensive loss |
(1.1 | ) | ||||
| Total stockholders’ deficit |
$ | (40.9 | ) | |||
| Total capitalization |
$ | 460.2 | ||||
| (1) | Assuming the number of shares offered by us, as set forth on the cover page of this prospectus, remains the same, after deducting the estimated underwriting discounts and commissions and estimated offering expenses payable by us in connection with the offering, a $1.00 increase (decrease) in the assumed public offering price of $ per share would increase (decrease) cash and cash equivalents by $ million, additional paid-in capital by $ million, total stockholders’ equity by $ million and total capitalization by $ million. |
| (2) | Assuming the number of shares offered by us, as set forth on the cover remains the same, we currently intend to use approximately $ million of the net proceeds from the shares being sold by us in this offering to make an offer to all holders of our 2007 Notes to repurchase the maximum principal amount of the 2007 Notes that may be purchased out of the net proceeds of this offering, estimated to be approximately $ million, at a price equal to 100% of the |
38
Table of Contents
| principal amount, plus accrued and unpaid interest to the date of the closing of the repurchase offer. We cannot assure you that holders of the 2007 Notes will accept our offer, and even if they do, we expect that $ million of the 2007 Notes will remain outstanding. |
| (3) | As of September 30, 2009, the ABL facility provided for up to $625.0 million of senior secured revolving credit borrowings and letters of credit, subject to a borrowing base determined primarily by the value of our eligible receivables and eligible inventory, subject to certain reserves. As of September 30, 2009, we had eligible collateral of $234.3 million, $90.0 million in outstanding advances, $15.4 million in open letters of credit, and $128.9 million of borrowing availability. |
| (4) | Consists of an IRB with $5.7 million principal amount outstanding as of September 30, 2009, which is payable on May 1, 2016 in one lump sum payment, and $0.2 million in vendor financing and purchase money notes. |
| (5) | shares authorized; shares issued and outstanding, pro forma for this offering. |
| (6) | Upon consummation of this offering, there will be options to purchase shares of our common stock issuable upon the exercise of options outstanding under the 2005 Plan. |
39
Table of Contents
Dilution is the amount by which the offering price paid by the purchasers of the common stock to be sold in this offering will exceed the pro forma net tangible book value per share of common stock after this offering. Our net tangible book deficit as of September 30, 2009 was $ million, or $ per share of common stock. We have calculated this amount by:
| Ÿ | subtracting our total liabilities from our total tangible assets; and |
| Ÿ | dividing the difference by the number of shares of our common stock outstanding. |
If we give effect to the sale of shares of our common stock by us in this offering at the assumed public offering price of $ per share (the midpoint of the range set forth on the cover of this prospectus), after deducting the estimated underwriting discounts and commissions and estimated offering expenses payable by us in connection with this offering, our pro forma net tangible book deficit as of September 30, 2009 would have been $ million, or $ per share. This amount represents an immediate dilution of $ per share to new investors. The following table illustrates this dilution per share:
| Per Share | ||||||
| Initial public offering price per share |
||||||
| Net tangible book deficit as of September 30, 2009 |
$ | |||||
| Increase in net tangible book value attributable to this offering(1) |
||||||
| Pro forma net tangible book deficit after this offering |
||||||
| Dilution to new investors |
$ | |||||
| (1) | Net tangible book deficit is calculated by subtracting goodwill, identifiable intangibles, deferred tax assets and deferred financing costs from total net assets. |
If the underwriters exercise their over-allotment option in full, our as adjusted net tangible book value will increase to $ per share, representing an increase to existing holders of $ per share, and there will be an immediate dilution of $ per share to new investors.
Assuming the number of shares offered by us, as set forth on the cover page of this prospectus, remains the same, after deducting the estimated underwriting discounts and commissions and estimated offering expenses payable by us in connection with the offering, a $1.00 increase (decrease) in the assumed public offering price of $ per share would increase (decrease) the net tangible book value attributable to this offering by $ per share and the dilution to new investors by $ per share and decrease (increase) the as adjusted net tangible book deficit after this offering by $ per share.
The following table summarizes, as of September 30, 2009, as adjusted to give effect to this offering, the difference between the number of shares of our common stock purchased from us, the total consideration paid to us, and the average price per share paid by existing stockholders and by new investors, at the initial public offering price of $ per share, before deducting the estimated underwriting discounts and commissions and offering expenses payable by us in connection with this offering:
| Shares Purchased | Total Consideration | Average Price per Share | ||||||||
| Number | Percent | Amount | Percent | |||||||
| (in millions) | (in millions) | |||||||||
| Existing stockholders |
||||||||||
| Existing option holders |
||||||||||
| New investors |
||||||||||
| Total |
||||||||||
40
Table of Contents
The foregoing table does not reflect proceeds to be realized by selling stockholders in this offering.
Assuming the number of shares offered by us, as set forth on the cover page of this prospectus, remains the same, after deducting the estimated underwriting discounts and commissions and estimated offering expenses payable by us in connection with the offering, a $1.00 increase (decrease) in the assumed public offering price of $ per share would increase (decrease) the total consideration paid by new investors by $ million, the total consideration paid by all stockholders by $ million and the average price per share by $ per share.
The number of shares purchased is based on shares of common stock outstanding as of September 30, 2009. The discussion and table above exclude shares of our common stock issuable upon the exercise of options outstanding under the 2005 Plan. To the extent outstanding options are exercised, new investors will experience further dilution.
41
Table of Contents
SELECTED HISTORICAL CONSOLIDATED FINANCIAL DATA
On May 18, 2005, Metals USA Holdings, Flag Acquisition and Metals USA entered into the Agreement and Plan of Merger, which we refer to as the “Merger Agreement.” On November 30, 2005, Flag Acquisition, then a wholly-owned subsidiary of Flag Intermediate, merged with and into Metals USA, with Metals USA being the surviving corporation. Metals USA Holdings, Flag Intermediate and Flag Acquisition conducted no operations during the period May 9, 2005 (date of inception) to November 30, 2005.
We applied purchase accounting on the closing date of the Merger and, as a result, the merger consideration was allocated to the respective values of the assets acquired and liabilities assumed from the Predecessor Company. As a result of the application of purchase accounting, the Successor Company balances and amounts presented in the consolidated financial statements and footnotes are not comparable with those of the Predecessor Company. In addition, we have completed a number of acquisitions that may affect comparability of our financial results. The selected consolidated and combined financial data should be read in conjunction about the limitations on comparability of our financial results, including as a result of acquisitions. See “Summary Historical Consolidated Financial Data,” “Management’s Discussion and Analysis of Financial Condition and Results of Operations,” “Risk Factors” and our consolidated financial statements and related notes included elsewhere in this prospectus.
After the consummation of the Apollo Transactions (as defined below), Metals USA Holdings, along with its consolidated subsidiaries, is referred to collectively in this prospectus as the “Successor Company.” Prior to the consummation of the Transactions, Metals USA, along with its consolidated subsidiaries, is referred to collectively in this prospectus as the “Predecessor Company.” We applied Statement of Financial Accounting Standards (“SFAS”) No. 141, “Business Combinations,” which we refer to as “SFAS 141,” on November 30, 2005, or the closing date of the Merger, and as a result, the Merger consideration was allocated to the respective fair values of the assets acquired and liabilities assumed from the Predecessor Company. As a result of the application of purchase accounting, the Successor Company balances and amounts presented in the consolidated financial statements and footnotes are not comparable with those of the Predecessor Company. In addition, we have completed a number of acquisitions that may affect comparability of our financial results.
As a result of purchase accounting for the Apollo Transactions, the Merger consideration was allocated to the respective fair values of the assets acquired and liabilities assumed from the Predecessor Company. The fair value of inventories, property and equipment and intangibles (customer lists) was increased by $14.9 million, $118.6 million and $22.2 million, respectively. For the year ended December 31, 2006, the Successor Company’s operating costs and expenses increased by $23.9 million ($10.8 million for cost of sales and $13.1 million of additional depreciation and amortization) as the inventory was sold and additional depreciation and amortization was recorded.
The “Apollo Transactions” collectively refers to:
| Ÿ | the Merger; |
| Ÿ | Flag Acquisition’s issuance of the Metals USA Notes pursuant to a private placement, which Metals USA assumed pursuant to the Merger. In September 2006, Metals USA exchanged the Metals USA Notes for an equal principal amount of Metals USA Notes that were registered under the Securities Act of 1933, as amended, which we refer to as the “Securities Act;” |
| Ÿ | the borrowings under the ABL facility on the date of the Merger; |
42
Table of Contents
| Ÿ | the contribution by Apollo and certain members of management of Metals USA of $140.0 million to Metals USA Holdings, in exchange for common stock of Metals USA Holdings at the effective time of the Merger; and |
| Ÿ | the other related transactions. |
For a more complete description of the Apollo Transactions and the terms of the indebtedness incurred in connection therewith, see “Organizational Structure—Ownership and Corporate Structure,” “Organizational Structure—Description of the Apollo Transactions” and “Description of Certain Indebtedness.”
The following table sets forth our selected historical consolidated financial data as of the dates and for the periods indicated. The selected historical consolidated financial data for the years ended December 31, 2006, 2007 and 2008, and as of December 31, 2007 and 2008, have been derived from our audited consolidated financial statements and related notes included in this prospectus. The selected historical financial data for the year ended December 31, 2004 and for the period from January 1, 2005 to November 30, 2005, and as of December 31, 2004, for the Predecessor Company, and for the period from May 9, 2005 to December 31, 2005, and as of December 31, 2005 and 2006 for the Successor Company have been derived from the Successor Company’s audited consolidated financial statements not included in this prospectus. The historical consolidated financial data for the nine months ended September 30, 2008 and 2009 have been derived from our unaudited consolidated financial statements included elsewhere in this prospectus. The September 30, 2008 and 2009 financial statements have been prepared on a basis consistent with our audited consolidated financial statements and reflect all adjustments, consisting of normal recurring adjustments that are, in the opinion of management, necessary for a fair presentation of the financial position and results of operations for the periods presented. The Successor Company had no assets and conducted no operations from May 9, 2005 (date of inception) to November 30, 2005. The historical results set forth below do not necessarily indicate results expected for any future period, and should be read in conjunction with, and are qualified by reference to, “Management’s Discussion and Analysis of Financial Condition and Results of Operations,” “Risk Factors” and the consolidated financial statements and related notes thereto included elsewhere in this prospectus.
43
Table of Contents
| Predecessor Company | Successor Company | |||||||||||||||||||||||||||||||||
| Year Ended December 31, |
Period from January 1, 2005 through November 30, |
Period from May 9, 2005 (Date of Inception) through December 31, |
Years Ended December 31, | Nine Months Ended September 30, |
||||||||||||||||||||||||||||||
| 2004 | 2005 | 2005 | 2006 | 2007 | 2008 | 2008 | 2009 | |||||||||||||||||||||||||||
| (in millions, except per share and shipments data) | ||||||||||||||||||||||||||||||||||
| Net Sales |
$ | 1,509.8 | $ | 1,522.1 | $ | 116.9 | $ | 1,802.9 | $ | 1,845.3 | $ | 2,156.2 | $ | 1,699.8 | $ | 853.4 | ||||||||||||||||||
| Operating costs and expenses: |
||||||||||||||||||||||||||||||||||
| Cost of sales (exclusive of operating and delivery, and depreciation and amortization) |
1,080.1 | 1,189.3 | 92.5 | 1,371.8 | 1,418.8 | 1,612.9 | 1,245.9 | 702.4 | ||||||||||||||||||||||||||
| Operating expenses(1)(2) |
256.0 | 250.7 | 23.5 | 312.1 | 313.1 | 336.9 | 254.9 | 178.3 | ||||||||||||||||||||||||||
| Operating income (loss) |
173.7 | 82.1 | 0.9 | 119.0 | 113.4 | 206.4 | 199.0 | (27.3 | ) | |||||||||||||||||||||||||
| Other (income) expense: |
||||||||||||||||||||||||||||||||||
| Interest expense |
8.4 | 12.0 | 4.1 | 54.6 | 87.0 | 87.9 | 65.4 | 50.5 | ||||||||||||||||||||||||||
| Loss (gain) on extinguishment of debt |
— | — | — | — | 8.4 | — | — | (89.1 | ) | |||||||||||||||||||||||||
| Other (income) expense, net |
(2.5 | ) | (0.1 | ) | — | (0.7 | ) | (0.7 | ) | (0.2 | ) | 0.2 | (0.3 | ) | ||||||||||||||||||||
| Income (loss) before income taxes |
167.8 | 70.2 | (3.2 | ) | 65.1 | 18.7 | 118.7 | 133.4 | 11.6 | |||||||||||||||||||||||||
| Provision (benefit) for income taxes |
63.3 | 26.7 | (1.2 | ) | 25.8 | 4.8 | 46.1 | 53.8 | 3.7 | |||||||||||||||||||||||||
| Net income (loss) |
$ | 104.5 | $ | 43.5 | $ | (2.0 | ) | $ | 39.3 | $ | 13.9 | $ | 72.6 | $ | 79.6 | $ | 7.9 | |||||||||||||||||
| Income (loss) per share: |
||||||||||||||||||||||||||||||||||
| Income (loss) per share—basic |
5.17 | 2.14 | (0.14 | ) | $ | 2.80 | $ | 0.99 | $ | 5.16 | $ | 5.66 | $ | 0.56 | ||||||||||||||||||||
| Income (loss) per share—diluted |
5.05 | 2.05 | (0.14 | ) | $ | 2.79 | $ | 0.96 | $ | 4.99 | $ | 5.47 | $ | 0.56 | ||||||||||||||||||||
| Number of common shares used in the per share calculations: |
||||||||||||||||||||||||||||||||||
| Basic |
20.2 | 20.3 | 14.0 | 14.1 | 14.1 | 14.1 | 14.1 | 14.1 | ||||||||||||||||||||||||||
| Diluted |
20.7 | 21.2 | 14.0 | 14.1 | 14.4 | 14.5 | 14.6 | 14.1 | ||||||||||||||||||||||||||
| Balance Sheet Data (at end of period): |
||||||||||||||||||||||||||||||||||
| Working Capital |
$ | 565.0 | $ | 453.7 | $ | 713.6 | $ | 506.3 | $ | 699.0 | $ | 874.5 | $ | 303.9 | ||||||||||||||||||||
| Total assets(3) |
710.0 | 795.3 | 1,127.0 | 959.0 | 1,088.2 | 1,335.3 | 662.5 | |||||||||||||||||||||||||||
| Total debt, less current portion |
266.6 | 472.9 | 754.9 | 855.0 | 942.6 | 1,116.2 | 501.0 | |||||||||||||||||||||||||||
| Stockholder’s equity (deficit) |
328.2 | 132.4 | 147.6 | (125.6 | ) | (51.0 | ) | (37.8 | ) | (40.9 | ) | |||||||||||||||||||||||
| Cash flow data: |
||||||||||||||||||||||||||||||||||
| Cash flows provided by (used in) operating activities |
$ | (128.6 | ) | $ | 170.1 | $ | 7.3 | $ | (45.7 | ) | $ | 119.2 | $ | 78.4 | $ | (97.7 | ) | $ | 228.4 | |||||||||||||||
| Cash flows provided by (used in) investing activities |
(16.0 | ) | (15.8 | ) | (434.5 | ) | (61.0 | ) | (58.5 | ) | (7.7 | ) | 0.6 | (7.6 | ) | |||||||||||||||||||
| Cash flows provided by (used in) financing activities |
145.8 | (120.7 | ) | 438.5 | 251.2 | (202.9 | ) | 82.4 | 256.6 | (367.4 | ) | |||||||||||||||||||||||
| Other operating data: |
||||||||||||||||||||||||||||||||||
| Shipments (in thousands of tons) |
1,502 | 1,332 | 107 | 1,505 | 1,429 | 1,428 | 1,147 | 694 | ||||||||||||||||||||||||||
| Capital expenditures |
$ | 17.4 | $ | 15.9 | $ | 4.4 | $ | 16.9 | $ | 21.5 | $ | 12.2 | $ | 8.9 | $ | 3.6 | ||||||||||||||||||
| (1) | For the one-month period ended December 31, 2005, the Successor Company’s operating expenses increased by $5.2 million ($4.1 million for cost of sales and $1.1 million of additional depreciation and amortization) as the inventory was sold and additional depreciation and amortization was recorded. For the year ended December 31, 2006, the Successor Company’s operating expenses increased by $23.9 million ($10.8 million in the first quarter of 2006 for cost of sales as the inventory was sold and $13.1 million of additional depreciation and amortization). As a result of the application of purchase accounting, the Successor Company balances and amounts presented in the consolidated financial statements are not comparable with those of the Predecessor Company. |
| (2) | We incurred certain costs related to the Merger that were charged to the Predecessor Company’s selling, general and administrative expense during the period from January 1, 2005 to November 30, 2005. Such expenses of $15.8 million included $14.6 million paid by us on the closing date of the Merger to holders of 1,081,270 vested in-the-money options and holders of 45,437 restricted stock grant awards related to the long-term incentive compensation plan of the Predecessor Company. Additionally, we recorded expenses of $0.8 million related to severance costs and $0.4 million for other costs associated with the Merger. |
| (3) | The Merger was accounted for as a purchase, with the Successor Company applying purchase accounting on the closing date of the Merger. As a result, the merger consideration was allocated to the respective fair values of the assets acquired and liabilities assumed from the Predecessor Company. The fair value of inventories, property and equipment and intangibles (customer lists) were increased by $14.9 million, $118.6 million, and $22.2 million, respectively. |
44
Table of Contents
MANAGEMENT’S DISCUSSION AND ANALYSIS OF FINANCIAL CONDITION
AND RESULTS OF OPERATIONS
Readers should refer to “Risk Factors” for risk factors that may affect future performance. The following discussion should be read in conjunction with “Selected Historical Consolidated Financial Data,” “Summary Historical Consolidated Financial Data,” “Consolidated Financial Statements” and related notes included elsewhere in the prospectus.
Overview
We believe that we are a leading provider of value-added processed carbon steel, stainless steel, aluminum and specialty metals, as well as manufactured metal components. For the nine months ended September 30, 2009, approximately 91% of our revenue was derived from our metals service center and processing activities, which are segmented into two groups: Flat Rolled and Non-Ferrous Group and Plates and Shapes Group. The remaining portion of our revenue was derived from our Building Products Group, which principally manufactures and sells aluminum products related to the residential remodeling industry. We purchase metal from primary producers that generally focus on large volume sales of unprocessed metals in standard configurations and sizes. In most cases, we perform the customized, value-added processing services required to meet the specifications provided by end-use customers. Our Plates and Shapes Group and Flat Rolled and Non-Ferrous Group customers are in the land and marine transportation, energy, aerospace, defense, electrical and appliance manufacturing, fabrication, furniture, commercial construction, and machinery and equipment industries. Our Building Products Group customers are primarily distributors and contractors engaged in the residential remodeling industry.
Selected Operational Information
Net sales. We derive the net sales of our Plates and Shapes and Flat Rolled and Non-Ferrous Groups from the processing and sale of metal products to end-users including metal fabrication companies, general contractors and OEMs. Pricing is generally based upon the underlying metal cost as well as a margin associated with customized value-added services specified by the customer. The net sales of our Building Products Group are derived from the sales of finished goods to local distributors and general contractors who are generally engaged in the residential remodeling industry.
Cost of sales. Our Plates and Shapes and Flat Rolled and Non-Ferrous Groups follow the normal industry practice which classifies, within cost of sales, the underlying commodity cost of metal purchased in mill form and the cost of inbound freight charges together with third-party processing cost, if any. Generally, the cost of metal approximates 75% of net sales for the Plates and Shapes and Flat Rolled and Non-Ferrous Groups. Cost of sales for our Building Products Group includes the cost of raw materials, manufacturing labor and overhead costs, together with depreciation and amortization expense associated with property, buildings and equipment used in the manufacturing process. Amounts included within this caption may not be comparable to similarly titled captions reported by other companies.
Operating and delivery expense. Our operating and delivery expense reflects the cost incurred by our Plates and Shapes and Flat Rolled and Non-Ferrous Groups for labor and facility costs associated with the value-added metal processing services that we provide. With respect to our Building Products Group, operating costs are associated with the labor and facility costs attributable to the distribution and warehousing of our finished goods at our metal service center facilities. Delivery expense reflects labor, material handling and other third party costs incurred with the delivery of product to customers. Amounts included within this caption may not be comparable to similarly titled captions reported by other companies.
45
Table of Contents
Selling, general and administrative expenses. Selling, general and administrative expenses include sales and marketing expenses, executive officers’ compensation, office and administrative salaries, insurance, accounting, legal, computer systems, and professional services and costs not directly associated with the processing, manufacturing, operating or delivery costs of our products. Amounts included within this caption may not be comparable to similarly titled captions reported by other companies.
Depreciation and amortization. Depreciation and amortization expense represents the costs associated with property, buildings and equipment used throughout the company except for depreciation and amortization expense associated with the manufacturing assets employed by our Building Products Group, which is included within cost of sales. This caption also includes amortization of intangible assets.
Industry Trends
Metal Service Centers
U.S. steel consumption has remained relatively constant from 2000 through 2007 averaging approximately 130 million tons annually. The global financial crisis that started during the third quarter 2008 has caused a significant reduction in the consumption of steel world-wide. In the U.S., steel demand has declined by almost half and is now expected to be approximately 60 million tons in 2009. Similar demand declines have occurred in virtually all developed economies. Service centers, distributors, and the rest of the supply chain responded by aggressively working down inventories. Through the first eight months of 2009 industry-based inventory metrics reported lowest-ever inventory levels when comparing 32 years of data. Consequently, domestic steel producers have been reported as operating at levels below 50 percent capacity utilization.
Steel pricing dropped during the first six months of this year as mills continually reduced prices in the face of shrinking order backlogs. Since late June price trends have been favorable as signs revealed a pickup in global demand for steel and raw material inputs. Domestic demand also benefited from the government’s “Cash for Clunkers” program. Order inquiry activity has increased in recent weeks and it appears that, with the exception of non-residential construction, steel demand may be entering into a slow recovery stage. The impact from federal stimulus legislation has not yet had a meaningful impact on the industry as actual spending continues to work through governmental channels. The Company believes that stimulus spending should have a meaningful impact on 2010 steel consumption and, in combination with basic economic recovery, domestic steel consumption should experience significant year over year growth percentages.
Building Products
The current state of the housing and mortgage markets continues to cause contraction in the home improvement remodeling industry. Research indicates that remodeling activity is pro-cyclical with both new residential construction and the broader economy, but remodeling lags homebuilding by several quarters. The high cyclicality of remodeling activity appears to be driven by discretionary improvements, similar to the products sold by our building products business, which are quite volatile. Improvement spending is expected to be much more cyclical and more sensitive to upturns and downturns in the general economy, whereas maintenance and repair spending is expected to be fairly stable over time.
While the pace of the decline in homeowner remodeling projects appears to be moderating, increased remodeling activity does not seem likely to materialize until further signs of recovery emerge in the broader housing market. Although lower financing costs are reducing the cost of financing home improvement projects, weak home prices and decreased cost recovery for most types of remodeling projects continue to discourage owners from pursuing upper-end improvements.
46
Table of Contents
Product demand for the Company’s Building Products Group may be influenced by numerous factors such as interest rates, general economic conditions, consumer confidence and other factors beyond our control. Declines in existing home sales and improvement remodeling expenditures due to such factors could continue to significantly reduce the segment’s performance.
Cost Reduction Initiatives
Since the fourth quarter of 2008, we have implemented approximately $50.0 million of annualized cost savings, a vast majority of which we believe are permanent reductions that further reduce what we believe to be the lowest cost structure in our industry. The cost savings have come primarily as a result of various actions, including reducing our headcount by approximately 30%, modifying employee benefits, closing 7 facilities primarily in our Building Products Group, reducing work hours for our employees and streamlining our delivery fleet.
Consolidated Results of Operations
The following financial information reflects our historical financial statements.
| Fiscal Years Ended December 31, |
Nine Months Ended September 30, |
||||||||||||||||||||||||||||||||
| 2006 | % | 2007 | % | 2008 | % | 2008 | % | 2009 | % | ||||||||||||||||||||||||
| (in millions, except percentages) | |||||||||||||||||||||||||||||||||
| Net sales |
$ | 1,802.9 | 100.0% | $ | 1,845.3 | 100.0% | $ | 2,156.2 | 100.0% | $1,699.8 | 100.0% | $ | 853.4 | 100.0% | |||||||||||||||||||
| Cost of sales |
1,371.8 | 76.1% | 1,418.8 | 76.9% | 1,612.9 | 74.8% | 1,245.9 | 73.3% | 702.4 | 82.3% | |||||||||||||||||||||||
| Operating and delivery |
175.5 | 9.7% | 178.4 | 9.7% | 186.1 | 8.6% | 144.6 | 8.5% | 97.5 | 11.4% | |||||||||||||||||||||||
| Selling, general and administrative |
115.1 | 6.4% | 112.3 | 6.1% | 126.8 | 5.9% | 96.5 | 5.7% | 66.6 | 7.8% | |||||||||||||||||||||||
| Depreciation and amortization |
21.4 | 1.2% | 22.1 | 1.2% | 21.3 | 1.0% | 16.2 | 1.0% | 14.2 | 1.7% | |||||||||||||||||||||||
| (Gain) loss on sale of property and equipment |
0.1 | 0.0% | 0.1 | 0.0% | (2.4 | ) | (0.1% | ) | (2.4 | ) | (0.1% | ) | — | — | |||||||||||||||||||
| Impairment of assets |
— | — | 0.2 | 0.0% | 5.1 | 0.2% | — | — | — | — | |||||||||||||||||||||||
| Operating income |
119.0 | 6.6% | 113.4 | 6.1% | 206.4 | 9.6% | 199.0 | 11.7% | (27.3 | ) | (3.2% | ) | |||||||||||||||||||||
| Interest expense |
54.6 | 3.0% | 87.0 | 4.7% | 87.9 | 4.1% | 65.4 | 3.8% | 50.5 | 5.9% | |||||||||||||||||||||||
| (Gain) loss on debt extinguishment |
— | — | 8.4 | 0.5% | — | — | — | — | (89.1 | ) | (10.4% | ) | |||||||||||||||||||||
| Other (income) expense, net |
(0.7 | ) | 0.0% | (0.7 | ) | 0.0% | (0.2 | ) | 0.0% | 0.2 | 0.0% | (0.3 | ) | 0.0% | |||||||||||||||||||
| Income before income taxes |
$ | 65.1 | 3.6% | $ | 18.7 | 1.0% | $ | 118.7 | 5.5% | $ | 133.4 | 7.8% | $ | 11.6 | 1.4% | ||||||||||||||||||
Results of Operations—Nine Months Ended September 30, 2009 Compared to September 30, 2008
Net sales. Net sales decreased $846.4 million, or 49.8%, from $1,699.8 million for the nine months ended September 30, 2008 to $853.4 million for the nine months ended September 30, 2009. The decrease was primarily attributable to a 39.5% decrease in volumes for our Flat Rolled and Non-Ferrous and Plates and Shapes Product Groups, in addition to a 19.4% decrease in average realized prices. Net sales decreased $27.3 million for our Building Products Group.
Cost of sales. Cost of sales decreased $543.5 million, or 43.6%, from $1,245.9 million for the nine months ended September 30, 2008, to $702.4 million for the nine months ended September 30, 2009. The decrease was primarily attributable to a 39.5% decrease in volumes for our Flat Rolled and Non-Ferrous and Plates and Shapes Product Groups, in addition to an 8.1% decrease in the average cost per ton for our metals service center businesses. Cost of sales decreased $23.6 million for our
47
Table of Contents
Building Products Group. We recorded $46.7 million of write-downs during the nine months ended September 30, 2009 for inventory lower of cost or market adjustments in our metal service center businesses as a result of price decreases and weak demand for steel products. Inventory tonnage on hand as of September 30, 2009 was reduced 32.7% from December 31, 2008. Cost of sales as a percentage of net sales increased from 73.3% for the first nine months of 2008 to 82.3% for the first nine months of 2009.
Operating and delivery. Operating and delivery expenses decreased $47.1 million, or 32.6%, from $144.6 million for the nine months ended September 30, 2008 to $97.5 million for the nine months ended September 30, 2009. The decrease was a result of lower variable costs associated with decreased shipments. As a percentage of net sales, operating and delivery expenses increased from 8.5% for the nine months ended September 30, 2008 to 11.4% for the nine months ended September 30, 2009.
Selling, general and administrative. Selling, general and administrative expenses decreased $29.9 million, or 31.0%, from $96.5 million for the nine months ended September 30, 2008 to $66.6 million for the nine months ended September 30, 2009. Lower variable costs of $16.2 million associated with decreased incentive compensation, in addition to lower salaries of $6.1 million achieved in connection with cost reduction initiatives, were the primary contributors to the period-over-period decrease. As a percentage of net sales, selling, general and administrative expenses increased from 5.7% for the nine months ended September 30, 2008 to 7.8% for the nine months ended September 30, 2009.
Depreciation and amortization. Depreciation and amortization expense decreased $2.0 million, or 12.3%, from $16.2 million for the nine months ended September 30, 2008 to $14.2 million for the nine months ended September 30, 2009. The decrease was primarily due to lower amortization of customer list intangible assets (which is recognized on an accelerated basis and decreases over the life of the assets) recorded in connection with the acquisitions completed in May 2006, the acquisition of Lynch Metals in July 2007, and the Merger.
Operating income (loss). Operating income (loss) decreased $226.3 million, or 113.7%, from operating income of $199.0 million for the nine months ended September 30, 2008 to an operating loss of $27.3 million for the nine months ended September 30, 2009. The decrease was primarily a result of the decrease in net sales discussed above. As a percentage of net sales, operating income (loss) decreased from 11.7% for the nine months ended September 30, 2008 to (3.2%) for the nine months ended September 30, 2009.
Interest expense. Interest expense decreased $14.9 million, or 22.8%, from $65.4 million for the nine months ended September 30, 2008 to $50.5 million for the nine months ended September 30, 2009. The decrease was primarily a function of reduced borrowings, in addition to lower average interest rates, on our ABL facility, as well as debt extinguishments and a lower LIBOR base rate on the 2007 Notes. The weighted average outstanding balance on our ABL facility decreased from $343.4 million for the nine months ended September 30, 2008 to $213.2 million for the same period of 2009. The weighted average facility rate decreased from 4.59% for the nine months ended September 30, 2008 to 3.05% for the nine months ended September 30, 2009.
Results of Operations—Year Ended December 31, 2008 Compared to 2007
Net sales. Net sales increased $310.9 million, or 16.8%, from $1,845.3 million for the year ended December 31, 2007 to $2,156.2 million for the year ended December 31, 2008. Results of operations for Lynch Metals, which closed in July 2007, were included for the entire year ended December 31, 2008, and as a result, accounted for $17.2 million of increased sales for the year. The remaining increase of $293.7 million was primarily attributable to an 19.3% increase in average realized prices for our Flat Rolled and Non-Ferrous and Plates and Shapes Product Groups, partially offset by a net sales decrease of $26.4 million for our Building Products Group.
48
Table of Contents
Cost of sales. Cost of sales increased $194.1 million, or 13.7%, from $1,418.8 million for the year ended December 31, 2007, to $1,612.9 million for the year ended December 31, 2008. The Lynch Metals acquisition accounted for $10.6 million of additional cost of sales for the year. The remaining increase of $183.5 million was primarily attributable to a 15.4% increase in the average cost per ton for our Flat Rolled and Non-Ferrous and Plates and Shapes Groups, partially offset by a decrease of $13.4 million in cost of sales for our Building Products Group. In addition, we recorded a $6.8 million write-down for inventory lower of cost or market adjustments during the fourth quarter of 2008 in our metal service center businesses as a result of volatility in steel prices during the latter half of the year. As a result of the rapid price decrease and an overall decline in demand, we elected to reduce inventory tonnage on hand, which resulted in the replacement cost of certain inventory items declining below their carrying cost as of December 31, 2008. Cost of sales as a percentage of net sales decreased from 76.9% for the year ended December 31, 2007 to 74.8% for the year ended December 31, 2008.
Operating and delivery. Operating and delivery expenses increased $7.7 million, or 4.3%, from $178.4 million for the year ended December 31, 2007 to $186.1 million for the year ended December 31, 2008. The acquisition of Lynch Metals accounted for $0.8 million of additional operating and delivery expenses for the year. The remaining increase was a result of higher variable costs of $6.9 million, which were primarily attributable to higher fuel and freight costs. As a percentage of net sales, operating and delivery expenses decreased from 9.7% for the year ended December 31, 2007 to 8.6% for the year ended December 31, 2008.
Selling, general and administrative. Selling, general and administrative expenses increased $14.5 million, or 12.9%, from $112.3 million for the year ended December 31, 2007 to $126.8 million for the year ended December 31, 2008. The Lynch Metals acquisition accounted for $2.0 million of the increase while increased incentive compensation accounted for an additional $9.7 million of the increased selling, general and administrative expenses for the period. These increases were partially offset by a decrease in stock-based compensation expense of $3.5 million, $3.0 million of which was recognized in the first quarter of 2007 due to the accelerated vesting of stock options in connection with the January 2007 dividend, and the remainder of which was recognized in the third quarter of 2007 in connection with the July 2007 dividend. As a percentage of net sales, selling, general and administrative expenses decreased from 6.1% for the year ended December 31, 2007 to 5.9% for the year ended December 31, 2008.
Depreciation and amortization. Depreciation and amortization decreased $0.8 million, or 3.6%, from $22.1 million for the year ended December 31, 2007 to $21.3 million for the year ended December 31, 2008. The Lynch Metals acquisition accounted for $6.0 million of additional depreciation and amortization for the year. This increase was offset by a decrease of $6.8 million for the year, which resulted primarily from lower amortization of customer list intangible assets recorded in connection with the acquisitions completed in May 2006 and the Merger.
Operating income. Operating income increased $93.0 million, or 82.0%, from $113.4 million for the year ended December 31, 2007 to $206.4 million for the year ended December 31, 2008. The Lynch Metals acquisition resulted in a decrease of $2.2 million of operating income for the year. The remaining increase of $95.2 million resulted primarily from increased net sales, in addition to a $2.4 million gain we recognized on the sale of property and equipment. This increase was partially offset by a $5.1 million charge we recognized in the fourth quarter of 2008 related to the impairment of goodwill and customer list intangible assets associated with our building products business. As a percentage of net sales, operating income increased from 6.1% for the year ended December 31, 2007 to 9.6% for the year ended December 31, 2008.
Interest expense. Interest expense increased $0.9 million, or 1.0%, from $87.0 million for the year ended December 31, 2007 to $87.9 million for the year ended December 31, 2008. The increase
49
Table of Contents
in incremental interest expense when comparing the year ended December 31, 2008 to the same period of 2007 reflects the issuance of the 2007 Notes and redemption of the 2006 Notes in July 2007, which resulted in increased interest expense on the $150.0 million incremental borrowings. The effect of increased debt levels on interest expense was partially offset by lower average interest rates on our ABL facility. While the weighted average outstanding balance on our ABL facility increased $64.8 million for the year ended December 31, 2008 versus the same period of 2007, the weighted average interest rate decreased from 7.06% for the year ended December 31, 2007 to 4.31% for the year ended December 31, 2008.
Results of Operations—Year Ended December 31, 2007 Compared to 2006
Net sales. Net sales increased $42.4 million, or 2.4%, from $1,802.9 million for the year ended December 31, 2006 to $1,845.3 million for the year ended December 31, 2007. The acquisition of Lynch Metals accounted for $15.6 million of increased sales for the period. Results of operations for the 2006 Acquisitions, which closed in May 2006, were included for the entire year ended December 31, 2007, and as a result, accounted for $25.7 million of increased sales for the year ended December 31, 2007 versus the same period of 2006. The remaining increase of $1.1 million was primarily attributable to a 9.8% increase in average realized prices, partially offset by a 6.7% decrease in volumes for our metal service center businesses and a decline in sales for our building products business of $37.4 million.
Cost of sales. Cost of sales increased $47.0 million, or 3.4%, from $1,371.8 million for the year ended December 31, 2006, to $1,418.8 million for the year ended December 31, 2007. The Lynch Metals acquisition accounted for $9.5 million of additional cost of sales for the period, while the 2006 Acquisitions accounted for $15.6 million of the increase. The remaining increase of $21.9 million was primarily attributable to an 11.2% increase in the average cost per ton, offset in part by a 6.7% decrease in volumes for our metal service center businesses, and by a decrease of $22.6 million in cost of sales for our building products business. Cost of sales as a percentage of net sales increased from 76.1% for the year ended December 31, 2006 to 76.9% for the same period in 2007.
Operating and delivery. Operating and delivery expenses increased $2.9 million, or 1.7%, from $175.5 million for the year ended December 31, 2006 to $178.4 million for the year ended December 31, 2007. The acquisition of Lynch Metals accounted for $0.6 million of additional operating and delivery expenses for the period, while the 2006 Acquisitions accounted for a $6.8 million increase. These increases were partially offset by lower variable costs of $4.5 million associated with decreased shipments. As a percentage of net sales, operating and delivery expenses for 2007 remained level with 2006 at 9.7%.
Selling, general and administrative. Selling, general and administrative expenses decreased $2.8 million, or 2.4%, from $115.2 million for the year ended December 31, 2006 to $112.4 million for the year ended December 31, 2007. The acquisition of Lynch Metals accounted for $1.6 million of increased selling, general and administrative expenses for the period, while the 2006 Acquisitions accounted for a $0.2 million increase. These acquisition increases were offset by a decrease of $4.6 million, which was primarily attributable to lower salaries, incentive compensation and advertising expenses at our Building Products segment, in addition to lower bad debt expense at our Flat Rolled and Non-Ferrous Group. As a percentage of net sales, selling, general and administrative expenses decreased from 6.4% for the year ended December 31, 2006 to 6.1% for the year ended December 31, 2007.
Depreciation and amortization. Depreciation and amortization increased $0.7 million, or 3.3%, from $21.4 million for the year ended December 31, 2006 to $22.1 million for the year ended December 31, 2007. The acquisition of Lynch Metals accounted for $1.7 million of additional depreciation and amortization for the period, while the 2006 Acquisitions accounted for an increase of
50
Table of Contents
$1.3 million for the period. These acquisition increases were partially offset by a decrease of $2.3 million, which was primarily attributable to lower amortization of customer list intangible assets (which is recognized on an accelerated basis) recorded in connection with the Merger and the 2006 Acquisitions.
Operating income. Operating income decreased $5.6 million, or 4.7%, from $119.0 million for the year ended December 31, 2006 to $113.4 million for the year ended December 31, 2007. The acquisition of Lynch Metals contributed $2.2 million of operating income for the period, while the 2006 Acquisitions accounted for a $1.8 million increase versus the same period of last year. The remaining decrease of $9.6 million resulted primarily from higher cost of sales, which was driven by an increase in average cost per ton that exceeded the increase in average realized prices for our metal service center businesses, in addition to a decrease in operating income of $10.0 million for our building products business, which was driven by lower net sales and operating costs that increased year-over-year on a percentage of net sales basis. As a percentage of net sales, operating income decreased from 6.6% for the year ended December 31, 2006 to 6.1% for the year ended December 31, 2007.
Interest expense. Interest expense increased $32.4 million, or 59.3%, from $54.6 million for the year ended December 31, 2006 to $87.0 million for the year ended December 31, 2007. This increase was primarily a function of higher debt levels for the year ended December 31, 2007. In July 2007, we issued $300.0 million initial aggregate principal amount of the 2007 Notes (a portion of the proceeds of which were used to redeem the $150.0 million initial aggregate principal amount of the 2006 Notes issued in December 2006). In addition, during the year ended December 31, 2007, the average daily balance outstanding on our ABL facility was $319.3 million, at a weighted average interest rate of 7.06%, compared to $274.1 million at 7.05% for the comparable period of 2006.
51
Table of Contents
Results of Operations by Segment
Segment Results—Nine Months Ended September 30, 2009 Compared to September 30, 2008
| Net Sales |
Operating Costs and Expenses |
Operating Income (Loss) |
Capital Spending |
Tons Shipped(1) |
|||||||||||||
| (in millions, except shipments data) | |||||||||||||||||
| 2009: |
|||||||||||||||||
| Plates and Shapes |
$ | 413.1 | $ | 430.9 | $ | (17.8 | ) | $ | 2.8 | 370 | |||||||
| Flat Rolled and Non-Ferrous |
374.0 | 364.3 | 9.7 | 0.5 | 330 | ||||||||||||
| Building Products |
73.0 | 75.6 | (2.6 | ) | — | — | |||||||||||
| Corporate and other |
(6.7 | ) | 9.9 | (16.6 | ) | 0.3 | (6 | ) | |||||||||
| Total |
$ | 853.4 | $ | 880.7 | $ | (27.3 | ) | $ | 3.6 | 694 | |||||||
| 2008: |
|||||||||||||||||
| Plates and Shapes |
$ | 915.1 | $ | 760.1 | $ | 155.0 | $ | 6.0 | 672 | ||||||||
| Flat Rolled and Non-Ferrous |
695.0 | 622.9 | 72.1 | 1.8 | 483 | ||||||||||||
| Building Products |
100.3 | 106.7 | (6.4 | ) | 0.6 | — | |||||||||||
| Corporate and other |
(10.6 | ) | 11.1 | (21.7 | ) | 0.5 | (8 | ) | |||||||||
| Total |
$ | 1,699.8 | $ | 1,500.8 | $ | 199.0 | $ | 8.9 | 1,147 | ||||||||
| (1) | Shipments are expressed in thousands of tons and are not an applicable measure for the Building Products Group. |
| Fiscal Years Ended December 31, | |||||||||||||||||||||||||
| Net Sales |
% | Operating Costs and Expenses |
% | Operating Income (Loss) |
% | Capital Spending |
Tons Shipped(1) |
||||||||||||||||||
| (in millions, except shipments data) | |||||||||||||||||||||||||
| 2008: |
|||||||||||||||||||||||||
| Plates and Shapes |
$ | 1,161.2 | 53.9% | $ | 990.5 | 50.8% | $ | 170.7 | 82.7% | $ | 8.6 | 837 | |||||||||||||
| Flat Rolled and Non-Ferrous |
882.9 | 40.9% | 804.7 | 41.3% | 78.2 | 37.9% | 2.2 | 601 | |||||||||||||||||
| Building Products |
126.0 | 5.8% | 135.1 | 6.9% | (9.1 | ) | (4.4% | ) | 0.7 | — | |||||||||||||||
| Corporate and other |
(13.9 | ) | (0.6% | ) | 19.5 | 1.0% | (33.4 | ) | (16.2% | ) | 0.7 | (10 | ) | ||||||||||||
| Total |
$ | 2,156.2 | 100.0% | $ | 1,949.8 | 100.0% | $ | 206.4 | 100.0% | $ | 12.2 | 1,428 | |||||||||||||
| 2007: |
|||||||||||||||||||||||||
| Plates and Shapes |
$ | 889.7 | 48.2% | $ | 796.9 | 46.0% | $ | 92.8 | 81.8% | $ | 16.6 | 826 | |||||||||||||
| Flat Rolled and Non-Ferrous |
817.7 | 44.3% | 767.6 | 44.3% | 50.1 | 44.2% | 2.9 | 614 | |||||||||||||||||
| Building Products |
152.4 | 8.3% | 152.7 | 8.8% | (0.3 | ) | (0.3% | ) | 1.6 | — | |||||||||||||||
| Corporate and other |
(14.5 | ) | (0.8% | ) | 14.7 | 0.8% | (29.2 | ) | (25.7% | ) | 0.4 | (11 | ) | ||||||||||||
| Total |
$ | 1,845.3 | 100.0% | $ | 1,731.9 | 100.0% | $ | 113.4 | 100.0% | $ | 21.5 | 1,429 | |||||||||||||
| 2006: |
|||||||||||||||||||||||||
| Plates and Shapes |
$ | 856.6 | 47.5% | $ | 760.7 | 45.2% | $ | 95.9 | 80.6% | $ | 11.1 | 843 | |||||||||||||
| Flat Rolled and Non-Ferrous |
776.0 | 43.0% | 731.7 | 43.5% | 44.3 | 37.2% | 2.8 | 680 | |||||||||||||||||
| Building Products |
189.8 | 10.5% | 180.1 | 10.7% | 9.7 | 8.2% | 2.7 | — | |||||||||||||||||
| Corporate and other |
(19.5 | ) | (1.1% | ) | 11.4 | 0.7% | (30.9 | ) | (26.0% | ) | 0.3 | (18 | ) | ||||||||||||
| Total |
$ | 1,802.9 | 100.0% | $ | 1,683.9 | 100.0% | $ | 119.0 | 100.0% | $ | 16.9 | 1,505 | |||||||||||||
| (1) | Shipments are expressed in thousands of tons and are not an appropriate measure for the Building Products Group. |
52
Table of Contents
Segment Results—Nine Months Ended September 30, 2009 Compared to September 30, 2008
Plates and Shapes. Net sales decreased $502.0 million, or 54.9%, from $915.1 million for the nine months ended September 30, 2008 to $413.1 million for the nine months ended September 30, 2009. The decrease was primarily attributable to a 44.9% decrease in shipments, in addition to an 18.0% decrease in average realized prices for the nine months ended September 30, 2009 compared to the nine months ended September 30, 2008.
Operating costs and expenses decreased $329.2 million, or 43.3%, from $760.1 million for the nine months ended September 30, 2008 to $430.9 million for the nine months ended September 30, 2009. The decrease was primarily attributable to a 44.9% decrease in shipments for the nine months ended September 30, 2009 compared to the nine months ended September 30, 2008. This segment recorded a $37.2 million write-down for inventory lower of cost or market adjustments during the first nine months of 2009.
Operating income (loss) decreased by $172.8 million, or 111.5%, from operating income of $155.0 million for the nine months ended September 30, 2008 to operating loss of $17.8 million for the nine months ended September 30, 2009. The decrease primarily resulted from lower net sales which were driven by a decrease in shipments, in addition to the charges incurred to write-down the segment’s inventories for the nine months ended September 30, 2009. Operating income (loss) as a percentage of net sales was (4.3%) for the nine months ended September 30, 2009 compared to 16.9% for the nine months ended September 30, 2008.
Flat Rolled and Non-Ferrous. Net sales decreased $321.0 million, or 46.2%, from $695.0 million for the nine months ended September 30, 2008 to $374.0 million for the nine months ended September 30, 2009. The decrease was primarily attributable to a 31.7% decrease in shipments, in addition to a 21.2% decrease in average realized prices, for the nine months ended September 30, 2009 compared to the nine months ended September 30, 2008. Sales of non-ferrous metals accounted for 38.5% of the segment’s sales product mix for the first nine months of 2009, compared to 41.9% for the first nine months of 2008.
Operating costs and expenses decreased $258.6 million, or 41.5%, from $622.9 million for the nine months ended September 30, 2008 to $364.3 million for the nine months ended September 30, 2009. The decrease was primarily attributable to a decrease in shipments of 31.7% in addition to a decrease in the average cost per ton of 17.6%. This segment recorded a $9.5 million write-down for inventory lower of cost or market adjustments during the first nine months of 2009. Operating costs and expenses as a percentage of net sales increased from 89.6% for the nine months ended September 30, 2008 to 97.4% for the nine months ended September 30, 2009.
Operating income decreased by $62.4 million, or 86.5%, from $72.1 million for the nine months ended September 30, 2008 to $9.7 million for the nine months ended September 30, 2009. The decrease was primarily attributable to the decrease in sales discussed above, which were primarily a function of lower shipments. Operating income as a percentage of net sales decreased from 10.4% for the nine months ended September 30, 2008 to 2.6% for the nine months ended September 30, 2009.
Building Products. Net sales decreased $27.3 million, or 27.2%, from $100.3 million for the nine months ended September 30, 2008 to $73.0 million for the nine months ended September 30, 2009. Softness in the residential remodeling market continued to produce period-over-period net sales decreases for our Building Products Group.
Operating costs and expenses decreased $31.1 million, or 29.1%, from $106.7 million for the nine months ended September 30, 2008 to $75.6 million for the nine months ended September 30, 2009. The decrease was primarily due to lower sales volume and a decrease in variable costs related to
53
Table of Contents
lower market demand, in addition to certain initiatives the segment has taken in response to the downturn in the housing and remodeling markets. Management has continued to focus on cost reduction in order to mitigate the impact of lower operating levels resulting from the market downturn. Operating costs and expenses as a percentage of net sales decreased from 106.4% for the nine months ended September 30, 2008 to 103.6% for the nine months ended September 30, 2009.
Operating loss decreased by $3.8 million, or 59.4%, from $6.4 million for the nine months ended September 30, 2008 to $2.6 million for the nine months ended September 30, 2009. The decrease was primarily attributable to lower operating costs, which decreased at a rate greater than the decline in sales discussed above. Operating loss as a percentage of net sales decreased from 6.4% for the nine months ended September 30, 2008 to 3.6% for the nine months ended September 30, 2009.
Corporate and other. This category reflects certain administrative costs and expenses management has not allocated to its industry segments. These costs include compensation for executive officers, insurance, professional fees for audit, tax and legal services and data processing expenses. The negative net sales amount represents the elimination of intercompany sales. The operating loss decreased $5.1 million, or 23.5%, from $21.7 million for the nine months ended September 30, 2008 to $16.6 million for the nine months ended September 30, 2009. Lower variable costs of $3.3 million associated with decreased incentive compensation were the primary component of the decrease.
Segment Results—Year Ended December 31, 2008 Compared to 2007
Plates and Shapes. Net sales increased $271.5 million, or 30.5%, from $889.7 million for the year ended December 31, 2007 to $1,161.2 million for the year ended December 31, 2008. The increase was primarily attributable to a 28.8% increase in average realized prices, in addition to a 1.3% increase in shipments for the year ended December 31, 2008 compared to the year ended December 31, 2007.
Operating costs and expenses increased $193.6 million, or 24.3%, from $796.9 million for the year ended December 31, 2007 to $990.5 million for the year ended December 31, 2008. The increase was primarily attributable to a 25.2% increase in the average cost per ton, in addition to a 1.3% increase in shipments for the year ended December 31, 2008, compared to the year ended December 31, 2007. In addition, this segment recorded a $5.8 million write-down for inventory lower of cost or market adjustments during the fourth quarter of 2008 due to a decline in replacement costs of certain inventory items below their carrying costs as of December 31, 2008. Operating costs and expenses as a percentage of net sales decreased from 89.6% for the year ended December 31, 2007 to 85.3% for the year ended December 31, 2008.
Operating income increased by $77.9 million, or 83.9%, from $92.8 million for the year ended December 31, 2007 to $170.7 million for the year ended December 31, 2008. The increase was primarily attributable to the increase in net sales and the decrease in operating costs and expenses as a percentage of net sales, as discussed above. Operating income as a percentage of net sales increased from 10.4% for the year ended December 31, 2007 to 14.7% for the year ended December 31, 2008.
Flat Rolled and Non-Ferrous. Net sales increased $65.2 million, or 8.0%, from $817.7 million for the year ended December 31, 2007 to $882.9 million for the year ended December 31, 2008. Results of operations for the Lynch Metals acquisition, which closed in July 2007, were included for the entire year ended December 31, 2008, and as a result, contributed $17.2 million of additional net sales
54
Table of Contents
for the year ended December 31, 2008. The remaining increase was primarily due to an 8.7% increase in average realized prices, partially offset by a 2.5% decrease in shipments for the year ended December 31, 2008 compared to the year ended December 31, 2007. Sales of non-ferrous metals accounted for 41% of the segment’s sales product mix for the year ended December 31, 2008, compared to 48% for the same period of 2007.
Operating costs and expenses increased $37.1 million, or 4.8%, from $767.6 million for the year ended December 31, 2007 to $804.7 million for the year ended December 31, 2008. The acquisition of Lynch Metals accounted for $19.4 million of additional operating costs and expenses for the year ended December 31, 2008. The remaining increase of $17.7 million was attributable to an increase in the cost of raw materials of 5.9%, partially offset by a 2.5% decrease in shipments for the year ended December 31, 2008 compared to the year ended December 31, 2007. In addition, this segment recorded a $1.0 million write-down for inventory lower of cost or market adjustments during the fourth quarter of 2008 due to a decline in replacement costs of certain inventory items below their carrying costs as of December 31, 2008. Operating costs and expenses as a percentage of net sales decreased from 93.9% for the year ended December 31, 2007 to 91.1% for the year ended December 31, 2008.
Operating income increased by $28.1 million, or 56.1%, from $50.1 million for the year ended December 31, 2007 to $78.2 million for the year ended December 31, 2008. The Lynch Metals acquisition resulted in a decrease of $2.2 million of operating income for the year. The balance of the increase was primarily attributable to the increase in net sales discussed above. Operating income as a percentage of net sales increased from 6.1% for the year ended December 31, 2007 to 8.9% for the year ended December 31, 2008.
Building Products. Net sales decreased $26.4 million, or 17.3%, from $152.4 million for the year ended December 31, 2007 to $126.0 million for the year ended December 31, 2008. Declines in the home improvement remodeling market, which were impacted by the continued downturn in the housing sector, contributed to the period-over-period net sales decrease for our Building Products Group.
Operating costs and expenses decreased $17.6 million, or 11.5%, from $152.7 million for the year ended December 31, 2007 to $135.1 million for the year ended December 31, 2008. The decrease was due to lower operating costs and expenses associated with lower sales volumes, in addition to certain initiatives the segment has taken in response to the downturn in the housing and home improvement remodeling markets, including reductions in square footage under lease, standardization of sales center layouts, and manufacturing consolidation. Despite the decrease in sales volumes, operating costs and expenses as a percentage of net sales increased from 100.2% for the year ended December 31, 2007 to 107.2% for the year ended December 31, 2008. The increase in operating costs as a percentage of net sales is due in part to additional costs incurred during 2008 related to the closure of underperforming sales center locations and the discontinuance of certain product lines, as management has continued to focus on cost reduction in order to mitigate the impact of lower operating levels resulting from the market downturn. In July 2008, we sold our Houston, Texas manufacturing facility for $4.9 million in cash. We recognized a gain of $0.7 million in the third quarter of 2008 related to this sale. Total facility closure costs charged to operating expense during the year ended December 31, 2008, net of the gain on the sale of the Houston plant, amounted to $4.0 million.
Operating loss increased by $8.8 million from a loss of $0.3 million for the year ended December 31, 2007 to a loss of $9.1 million for the year ended December 31, 2008. The increase was primarily attributable to the decline in net sales discussed above, which exceeded the rate of decline in operating costs and expenses. Operating loss as a percentage of net sales increased from 0.2% for the year ended December 31, 2007 to 7.2% for the year ended December 31, 2008.
55
Table of Contents
Corporate and other. This category reflects certain administrative costs and expenses management has not allocated to its industry segments. These costs include compensation for executive officers, insurance, professional fees for audit, tax and legal services and data processing expenses. The negative net sales amount represents the elimination of intercompany sales. The operating loss increased $4.2 million, or 14.4%, from $29.2 million for the year ended December 31, 2007 to $33.4 million for the year ended December 31, 2008. This increase was primarily attributable to a $5.1 million charge we recognized in the fourth quarter of 2008 related to the impairment of goodwill and customer list intangible assets associated with our building products business, which was recorded at the corporate segment. Goodwill and customer list intangible assets resulting from the Merger are assigned to reporting units solely for testing for impairment. Consequently, any impairment charges associated with these assets is recorded at the corporate segment. Increased incentive compensation accounted for an additional $2.4 million of selling, general and administrative expenses recorded at the corporate segment for the year.
Segment Results—Year Ended December 31, 2007 Compared to 2006
Plates and Shapes. Net sales increased $33.1 million, or 3.9%, from $856.6 million for the year ended December 31, 2006 to $889.7 million for the year ended December 31, 2007. Results of operations for the May 2006 acquisition of Port City, which closed in May 2006, were included for the entire year ended December 31, 2007, and as a result, accounted for $25.9 million of increased sales for the year ended December 31, 2007 versus the same period of 2006. Apart from the increase attributable to Port City, net sales for the remainder of the segment increased $7.2 million, or 0.9%, primarily due to a 5.8% increase in average realized prices, partially offset by a 4.6% decrease in shipments, for the year ended December 31, 2007 compared to the year ended December 31, 2006.
Operating costs and expenses increased $36.2 million, or 4.8%, from $760.7 million for the year ended December 31, 2006 to $796.9 million for the year ended December 31, 2007. The May 2006 acquisition of Port City accounted for $22.7 million of the increase. In addition, average cost per ton increased by 7.1%, which was partially offset by a 4.6% decrease in shipments for the year ended December 31, 2007. Operating costs and expenses as a percentage of segment net sales increased from 88.8% for the year ended December 31, 2006 to 89.6% for the year ended December 31, 2007.
Operating income decreased by $3.1 million, or 3.2%, from $95.9 million for the year ended December 31, 2006 to $92.8 million for the year ended December 31, 2007. The May 2006 acquisition of Port City accounted for $3.2 million of increased operating income for the year ended December 31, 2007 versus the same period of 2006. The remaining decrease of $6.3 million was primarily attributable to the increase in operating costs and expenses discussed above. Operating income as a percentage of segment net sales decreased from 11.2% for the year ended December 31, 2006 to 10.4% for the year ended December 31, 2007.
Flat Rolled and Non-Ferrous. Net sales increased $41.7 million, or 5.4%, from $776.0 million for the year ended December 31, 2006 to $817.7 million for the year ended December 31, 2007. The acquisition of Lynch Metals contributed $15.6 million of additional net sales for the year ended December 31, 2007. The remaining increase of $26.1 million was primarily due to a 15.0% increase in the average sales price per ton, partially offset by a 10.1% decrease in shipments for the year ended December 31, 2007 compared to the year ended December 31, 2006, as we elected to reduce sales volume to maintain our level of profitability. Sales of non-ferrous products accounted for 48% of the segment’s sales product mix for the year ended December 31, 2007, compared to 39% for the same period of 2006.
Operating costs and expenses increased $35.9 million, or 4.9%, from $731.7 million for the year ended December 31, 2006 to $767.6 million for the year ended December 31, 2007. The acquisition of Lynch Metals accounted for $13.4 million of additional operating costs and expenses for the year
56
Table of Contents
ended December 31, 2007. The remaining increase of $22.5 million was mostly attributable to an increase in the cost of raw materials of 16.0%, partially offset by a 10.1% decrease in shipments for the year ended December 31, 2007. Operating costs and expenses as a percentage of segment net sales decreased from 94.3% for the year ended December 31, 2006 to 93.9% for the year ended December 31, 2007.
Operating income increased by $5.8 million, or 13.1%, from $44.3 million for the year ended December 31, 2006 to $50.1 million for the year ended December 31, 2007. The acquisition of Lynch Metals contributed $2.2 million of operating income for the year ended December 31, 2007. The balance of the increase was primarily attributable to the increase in net sales discussed above, which, despite the decrease in shipments, produced higher margins due to the shift in product mix to more non-ferrous products. Operating income as a percentage of segment net sales increased from 5.7% for the year ended December 31, 2006 to 6.1% for the year ended December 31, 2007.
Building Products. Net sales decreased $37.4 million, or 19.7%, from $189.8 million for the year ended December 31, 2006 to $152.4 million for the year ended December 31, 2007. Results of operations for the 2006 Acquisition of Allmet, which was acquired in May 2006, were included for the entire year ended December 31, 2007, and as a result, accounted for $0.2 million of decreased sales for the year ended December 31, 2007 versus the same period of 2006. New house production and existing home sales, both of which are primary drivers of residential remodeling activity, were down for the year ended December 31, 2007 versus the same period of 2006. The softness in the residential remodeling market, which was affected by declines in existing home sales and new house production, contributed to the period-over-period net sales decrease for our Building Products Group.
Operating costs and expenses decreased $27.4 million, or 15.2%, from $180.1 million for the year ended December 31, 2006 to $152.7 million for the year ended December 31, 2007. The 2006 Acquisition of Allmet accounted for $1.2 million of increased costs, which was offset by lower operating costs and expenses associated with lower sales volumes, in addition to certain initiatives the segment has taken in response to the downturn in the housing and residential remodeling markets, including reductions in square footage under lease, standardization of metal sales center layouts, and manufacturing consolidation. Operating costs and expenses as a percentage of segment net sales increased from 94.9% for the year ended December 31, 2006 to 100.2% for the year ended December 31, 2007.
Operating income decreased by $10.0 million, or 103.1%, from operating income of $9.7 million for the year ended December 31, 2006 to an operating loss of $0.3 million for the year ended December 31, 2007. The 2006 Acquisition of Allmet accounted for $1.4 million of the year-over-year decrease. The remainder of the decrease was primarily attributable to the reductions in sales volumes discussed above.
Corporate and other. This category reflects certain administrative costs and expenses management has not allocated to its industry segments. These costs include compensation for executive officers, insurance, professional fees for audit, tax and legal services and data processing expenses. The negative net sales amount represents the elimination of intercompany sales. The operating loss decreased $1.7 million, or 5.5%, from $30.9 million for the year ended December 31, 2006 to $29.2 million for the year ended December 31, 2007. This decrease was primarily attributable to lower insurance expense due to favorable trends in workers compensation claims, lower amortization of the customer list intangible asset recorded in connection with the Merger, which decreases over the useful life and economic value of the intangible asset, in addition to lower employee benefit costs and lower incentive compensation. The decrease was partially offset by $3.6 million of higher stock-based compensation expense due to the accelerated vesting of stock options and partial settlement of existing stock option awards in connection with the January 2007 dividend and July 2007 dividends paid by Metals USA Holdings to its stockholders.
57
Table of Contents
Liquidity and Capital Resources
Our primary sources of short-term liquidity are borrowings under the ABL facility and our cash flow from operations. We believe these resources will be sufficient to meet our working capital and capital expenditure requirements for the next year. At September 30, 2009, we had $90.0 million drawn on the ABL facility, our borrowing availability was $128.9 million and we had cash and cash equivalents of $20.1 million. We anticipate that in connection with our offer to repurchase the 2007 Notes with the net proceeds of this offering, our interest expense will reduced by approximately $ per year. We, however, cannot assure you that our offer will be accepted. To the extent not accepted, the net proceeds of this offering will be available for general corporate purposes. Our borrowing availability fluctuates daily with changes in eligible accounts receivables and inventory, less outstanding borrowings and letters of credit. See “—Financing Activities” below. At November 16, 2009, we had $75.0 million drawn on the ABL facility, our borrowing availability was $135.9 million and we had cash and cash equivalents of $8.4 million.
We generally meet long-term liquidity requirements, the repayment of debt and investment funding needs, through additional borrowings under the ABL facility and the issuance of debt securities. At September 30, 2009, our long-term debt consisted of $90.0 million of outstanding borrowings on the ABL facility, $226.3 million principal amount of the Metals USA Notes, $178.9 million principal amount of the 2007 Notes, an IRB with $5.7 million principal amount outstanding and $0.1 million in vendor financing and purchase money notes.
With respect to long-term liquidity, we believe that we will be able to meet our working capital, capital expenditures and debt service obligations. Our ability to meet long-term liquidity requirements is subject to obtaining additional debt and/or equity financing. Decisions by lenders and investors to enter into such transactions with us will depend upon a number of factors, such as our historical and projected financial performance, compliance with the terms of our current credit agreements, industry and market trends, the availability of capital, and the relative attractiveness of alternative lending or investment opportunities.
Operating and Investing Activities
Although we do not produce any metal, our financial performance is affected by changes in metal prices. When metal prices rise, the prices at which we are able to sell our products generally increase over their historical costs; accordingly, our working capital (which consists primarily of accounts receivable and inventory) tends to increase in a rising price environment. Conversely, when metal prices fall, our working capital tends to decrease. Our working capital (current assets less current liabilities) decreased from $699.0 million at December 31, 2008 to $303.9 million at September 30, 2009.
Changes in metal prices also affect our liquidity because of the time difference between our payment for our raw materials and our collection of cash from our customers. We sell our products and typically collect our accounts receivable within 45 days after the sale; however, we tend to pay for replacement materials (which are more expensive when metal prices are rising) over a much shorter period, primarily to benefit from early-payment discounts that are substantially higher than our cost of incremental debt. As a result, when metal prices are rising, we tend to draw more on the ABL facility to cover the cash flow cycle from material purchase to cash collection. When metal prices fall, we can replace our inventory at lower cost and, thus, generally do not need to access the ABL facility as much to cover the cash flow cycle. We believe our cash flow from operations, supplemented with the cash available under the ABL facility, will provide sufficient liquidity to meet the challenges and obligations we face during the current metal price environment. Additionally, we intend to look for value-added businesses that we can acquire at reasonable prices. We intend to use cash flows from operations and excess cash available under the ABL facility to fund future acquisitions.
58
Table of Contents
The following discussion of the principal sources and uses of cash should be read in conjunction with our Unaudited Condensed Consolidated Statements of Cash Flows which are set forth under “Consolidated Financial Statements.”
Cash Flows
Nine Months Ended September 30, 2009 and September 30, 2008
During the nine months ended September 30, 2009, net cash provided by operating activities was $228.4 million. This amount represents net income, adjusted for gains on extinguishment of debt and costs that did not involve cash flows for the period, of negative $18.1 million, in addition to changes in operating assets and liabilities that resulted in a cash inflow of $246.5 million for the period, an amount that was primarily attributable to decreases in accounts receivable and inventories. During the nine months ended September 30, 2008, net cash used in operating activities was $97.7 million. This amount represents net income, adjusted for costs that did not involve cash flows for the period and gains on the sale of property and equipment, of $101.0 million, in addition to changes in operating assets and liabilities that resulted in a cash outflow of $198.7 million for the period, an amount that was primarily attributable to increases in accounts receivable and inventories, partially offset by increases in accounts payable and accrued liabilities.
Net cash used in investing activities was $7.6 million for the nine months ended September 30, 2009, and consisted primarily of $4.2 million for the acquisition of Philadelphia Plate and $3.6 million of capital expenditures. Net cash provided by investing activities was $0.6 million for the nine months ended September 30, 2008, and consisted of proceeds from sales of assets of $9.5 million partially offset by $8.9 million of purchases of assets.
Net cash used in financing activities was $367.4 million for the nine months ended September 30, 2009, and consisted primarily of net repayments on the ABL facility of $278.0 million, in addition to repayments of other long-term debt of $89.4 million. Net cash provided by financing activities was $256.6 million for the nine months ended September 30, 2008, and consisted primarily of net borrowings on the ABL facility of $261.5 million, partially offset by $2.3 million of repayments of long-term debt and $2.6 million of deferred financing costs.
Year Ended December 31, 2008
During the year ended December 31, 2008, net cash provided by operating activities was $78.4 million. This amount represents net income, adjusted for costs that did not involve cash flows for the period and gains on the sale of property and equipment, of $106.0 million, in addition to changes in operating assets and liabilities that resulted in a cash outflow of $27.6 million for the year, an amount that was primarily attributable to increases in inventories and a decrease in accounts payable, partially offset by a decrease in accounts receivable.
Net cash used in investing activities was $7.7 million for the year ended December 31, 2008, and consisted of proceeds from sales of assets of $9.5 million offset by $12.2 million of purchases of assets and $5.0 million of contingent consideration paid during 2008 in connection with the May 2006 acquisition of Port City. For the year ended December 31, 2008, the most significant internal capital project was the expansion of our New Orleans Plates and Shapes facility.
Net cash provided by financing activities was $82.4 million for the year ended December 31, 2008, and consisted primarily of net borrowings on the ABL facility of $87.5 million, partially offset by $2.4 million of repayments of long-term debt and $2.7 million of deferred financing costs.
59
Table of Contents
Year Ended December 31, 2007
During the year ended December 31, 2007, net cash provided by operating activities was $119.2 million. This amount represents net income, adjusted for costs that did not involve cash flows for the period, of $54.1 million, plus changes in operating assets and liabilities that resulted in a cash inflow of $65.1 million for the period, an amount that was primarily attributable to decreases in inventories and accounts receivable.
Net cash used in investing activities was $58.5 million for the year ended December 31, 2007, and consisted primarily of $21.5 million of purchases of assets and $38.2 million for the acquisition of Lynch Metals. For the year ended December 31, 2007, the most significant internal capital project was the expansion of our Plates and Shapes facility in Waggaman, Louisiana.
Net cash used in financing activities was $202.9 million for the year ended December 31, 2007, and consisted primarily of dividends paid to our stockholders of $288.5 million, in addition to repayments of long-term debt of $150.7 million ($150.0 million in connection with the repayment of the 2006 Notes) and net repayments on the ABL facility of $48.5 million, partially offset by $291.0 million of proceeds received from the issuance of the 2007 Notes.
Year Ended December 31, 2006
During the year ended December 31, 2006, net cash used in operating activities was $45.7 million. This amount represents net income, adjusted for costs that did not involve cash flows for the period, of $63.2 million, offset by changes in operating assets and liabilities that resulted in a cash outflow of $108.9 million for the period, an amount that was primarily attributable to increases in accounts receivable and inventories, partially offset by a decrease in prepaid expenses and increases in accounts payable and accrued liabilities.
Net cash used in investing activities was $61.0 million for the year ended December 31, 2006, and consisted of $1.6 million of proceeds from the sale of assets, offset by $16.9 million of purchases of assets and the $45.7 million for the purchase of Port City and Dura-Loc. These purchases were strategic acquisitions in our Plates and Shapes and Building Products segments. For the year ended December 31, 2006, the most significant internal capital projects included the expansion of our non-ferrous Germantown, Wisconsin facility and the installation of new processing equipment in our facility in Waggaman, Louisiana.
Net cash provided by financing activities was $251.2 million for the year ended December 31, 2006 and consisted primarily of $144.8 million of proceeds from the issuance of the 2006 Notes, in addition to net borrowings on the ABL facility of $137.6 million, offset by the $25.0 million payment of a cash dividend to our stockholders.
EBITDA and Adjusted EBITDA
EBITDA is defined as net income (loss) before interest, income taxes, depreciation and amortization. Adjusted EBITDA (as defined by the loan and security agreement governing the ABL facility and the indentures governing the Metals USA Notes and the 2007 Notes) is defined as EBITDA further adjusted to exclude certain non-cash, non-recurring and realized (or in the case of the indentures, expected) future cost savings directly related to prior acquisitions. EBITDA and adjusted EBITDA are not defined terms under GAAP. Neither EBITDA nor adjusted EBITDA should be considered an alternative to operating income or net income as a measure of operating results or an alternative to cash flow as a measure of liquidity. There are material limitations associated with making the adjustments to our earnings to calculate EBITDA and adjusted EBITDA and using these non-GAAP
60
Table of Contents
financial measures as compared to the most directly comparable GAAP financial measures. For instance, EBITDA and adjusted EBITDA do not include:
| Ÿ | interest expense, and, because we have borrowed money in order to finance our operations, interest expense is a necessary element of our costs and ability to generate revenue; |
| Ÿ | depreciation and amortization expense, and, because we use capital assets, depreciation and amortization expense is a necessary element of our costs and ability to generate revenue; and |
| Ÿ | income tax expense, and because the payment of taxes is part of our operations, tax expense is a necessary element of our costs and ability to operate. |
Fixed charges should not be considered an alternative to interest expense.
Our use of EBITDA. While EBITDA is frequently used as a measure of operations and the ability to meet debt service requirements, it is not necessarily comparable to other similarly titled captions of other companies due to potential inconsistencies in the method of calculation. We present EBITDA because we consider it an important supplemental measure of our performance and believe it is frequently used by our investors and other interested parties, as well as by our management, in the evaluation of companies in our industry, many of which present EBITDA when reporting their results. In addition, EBITDA provides additional information used by our management and our board of directors to facilitate internal comparisons to historical operating performance of prior periods. Further, management believes EBITDA facilitates their operating performance comparisons from period to period because it excludes potential differences caused by variations in capital structure (affecting interest expense), tax positions (such as the impact of changes in effective tax rates or net operating losses) and the age and book depreciation of facilities and equipment (affecting depreciation expense).
Our use of Adjusted EBITDA. We believe that the inclusion of supplementary adjustments to EBITDA applied in presenting adjusted EBITDA are appropriate to provide additional information to investors about the performance of the business and it provides investors the same information that we use internally for the following reasons.
Similarly to the reasons explained above for EBITDA, we present adjusted EBITDA because we consider it an important supplemental measure of our performance and believe it is frequently used by our investors and other interested parties, as well as by our management, in the evaluation of companies in our industry, many of which present adjusted EBITDA when reporting their results. In addition, similarly to the reasons explained above for EBITDA, adjusted EBITDA also provides additional information used by our management and board of directors to facilitate internal comparisons to historical operating performance of prior periods. Further, management believes that, like EBITDA, adjusted EBITDA facilitates their operating performance comparisons from period to period because it excludes potential differences caused by variations in capital structure (affecting interest expense), tax positions (such as the impact of changes in effective tax rates or net operating losses) and the age and book depreciation of facilities and equipment (affecting depreciation expense).
In addition, management uses adjusted EBITDA as a measure for certain performance-based bonus plans.
Because access to debt capital is currently and in the future will continue to be important to us, we believe that the inclusion of supplementary adjustments to EBITDA applied in presenting adjusted EBITDA are appropriate to provide additional information to investors to demonstrate compliance with the covenants in our debt agreements. Our FCCR, as defined by the ABL facility is calculated based on a numerator consisting of adjusted EBITDA less cash taxes and capital expenditures and a denominator consisting of interest expense and certain distributions, and is calculated based on such amounts for the most recent period of four consecutive fiscal quarters. Failure to comply with the FCCR covenant of the ABL facility can result in limiting our long-term growth prospects by hindering
61
Table of Contents
our ability to incur future indebtedness or grow through acquisitions. As of September 30, 2009, our FCCR was 0.14. As of September 30, 2009, we had $128.9 million of additional borrowing capacity under the ABL facility.
The indentures governing the Metals USA Notes and the 2007 Notes contain covenants that restrict our ability to take certain actions, such as incurring additional debt and making certain acquisitions, if we are unable to meet defined adjusted EBITDA to fixed charge coverage and consolidated total debt ratios (each, as defined). The covenants in the indentures require us to have an adjusted EBITDA to fixed charge coverage ratio (measured on a trailing four-quarter basis and calculated differently from the fixed charge coverage ratio as defined by the ABL facility) of 2.0 to 1.0 to incur “ratio” indebtedness and a consolidated total debt ratio of no greater than 4.75 to 1.0 to incur “ratio” indebtedness in connection with acquisitions. Based on the calculations for the trailing four quarters, we are not able to satisfy these covenants and incur additional indebtedness under these ratios, including for acquisition purposes, under our indentures. The most restrictive of the covenants in all of our debt agreements is the FCCR in our ABL facility; accordingly, we have presented adjusted EBITDA in the table below on that basis.
| Years Ended December 31, | Nine Months Ended September 30, |
||||||||||||||||||
| 2006 | 2007 | 2008 | 2008 | 2009 | |||||||||||||||
| (in millions, except ratios) | |||||||||||||||||||
| Net income |
$ | 39.3 | $ | 13.9 | $ | 72.6 | $ | 79.6 | $ | 7.9 | |||||||||
| Depreciation and amortization(1) |
22.6 | 23.7 | 23.6 | 18.2 | 15.9 | ||||||||||||||
| Interest expense |
54.6 | 87.0 | 87.9 | 65.4 | 50.5 | ||||||||||||||
| (Gain) loss on extinguishment of debt |
— | 8.4 | — | — | (89.1 | ) | |||||||||||||
| Provision (benefit) for income taxes |
25.8 | 4.8 | 46.1 | 53.8 | 3.7 | ||||||||||||||
| Other (income) expense |
(0.7 | ) | (0.7 | ) | (0.2 | ) | 0.2 | (0.3 | ) | ||||||||||
| EBITDA |
141.6 | 137.1 | 230.0 | 217.2 | (11.4 | ) | |||||||||||||
| Covenant defined adjustments: |
|||||||||||||||||||
| Inventory purchase adjustments(2) |
10.8 | — | — | — | — | ||||||||||||||
| Stock options and grant expense(3) |
1.2 | 4.8 | 1.1 | 0.9 | 0.3 | ||||||||||||||
| Facilities closure(4) |
1.4 | 0.7 | 4.0 | 4.0 | 1.5 | ||||||||||||||
| Pension withdrawal liability(5) |
— | 2.0 | — | — | — | ||||||||||||||
| Management fees and other costs(6) |
1.2 | 1.5 | 1.9 | 0.9 | 0.9 | ||||||||||||||
| Impairment of assets(7) |
— | — | 5.1 | — | — | ||||||||||||||
| Adjusted EBITDA(8) |
$ | 156.2 | $ | 146.1 | $ | 242.1 | $ | 223.0 | $ | (8.7 | ) | ||||||||
| Fixed charge coverage ratio numerator(9) |
$ | 115.6 | $ | 103.2 | $ | 197.9 | $ | 210.1 | $ | 16.1 | |||||||||
| Fixed charge coverage ratio denominator(9) |
$ | 76.7 | $ | 78.6 | $ | 68.1 | $ | 65.4 | $ | 117.3 | |||||||||
| FCCR(9) |
1.51 | 1.31 | 1.43 | 3.21 | 0.14 | ||||||||||||||
| (1) | Includes depreciation for Building Products that is included in cost of sales. |
| (2) | As a result of management’s analysis and evaluation of the replacement cost of inventory as of the closing of the Apollo Transactions, a purchase accounting increase in the fair value of inventory of $14.9 million was recorded as of December 1, 2005 with $4.1 million of that amount charged to cost of sales in December 2005 and $10.8 million charged to cost of sales in the first quarter of 2006. |
| (3) | Non-cash stock option and stock grant expense. |
| (4) | The amount for 2006 represents charges incurred in connection with the closure of two locations within our metal service center business and three locations within our building products business. The amount for 2007 represents charges in the building products business for the closure of three facilities. The amounts for 2008 represent charges incurred for the closure of six facilities within our building products business during the first nine months of 2008. The amount |
62
Table of Contents
| for the nine months ended September 30, 2009, represents charges to our Building Products Group for severance costs and the closure of one facility during such period, in addition to charges for the closure of one facility in our Plates and Shapes Group. |
| (5) | This amount represents accrued expenses incurred in connection with the withdrawal of two of our operating facilities from a multi-employer pension fund. |
| (6) | Includes accrued expenses related to the management agreement we have with Apollo, pursuant to which Apollo provides us with management services, which will be terminated upon consummation of this offering. See “Certain Relationships and Related Party Transactions—Related Party Transactions—Apollo Agreements.” |
| (7) | This amount represents non-cash impairment charges related to goodwill and customer list intangible assets associated with our building products business. |
| (8) | As defined by the loan and security agreement governing the ABL facility and the indentures governing the Metals USA Notes and the 2007 Notes. |
Under the ABL facility, the FCCR is determined on a rolling four-quarter period, often referred to as a last-twelve month period, by dividing (1) the sum of adjusted EBITDA (as defined in the loan and security agreement governing the ABL facility) of Metals USA minus income taxes paid in cash minus non-financed capital expenditures by (2) the sum of certain distributions paid in cash, cash interest expense and scheduled principal reductions on debt paid by Metals USA. The interest rate in respect of borrowings under the ABL facility is determined in reference to the FCCR, and should borrowing availability under the ABL facility fall below $45.0 million, we must maintain a FCCR of at least 1.0 to 1.0, measured on a trailing four-quarter basis. As of September 30, 2009, our borrowing availability under the ABL facility was $128.9 million. In addition, the FCCR also is an important measure of our liquidity and affects our ability to take certain actions, including paying dividends to stockholders and making acquisitions.
Although the indentures governing the Metals USA Notes and the 2007 Notes also contain covenants that restrict our ability to incur indebtedness and pay dividends based on our FCCR, the definition and application of the FCCR contained in the indentures differ from the definition and application of the FCCR in the ABL facility in that the numerator of the FCCR as defined in the indentures does not include cash income taxes or non-financed capital expenditures and the denominator of the FCCR as defined in the indentures does not include the sum of certain distributions paid in cash and scheduled principal reductions on debt, and separate FCCRs are required under certain circumstances. See “—Financing Activities.”
Assuming an initial public offering price of $ per share, which represents the midpoint of the range set forth on the cover page of this prospectus, and the subsequent purchase of the maximum principal amount of the 2007 Notes out of the net proceeds of this offering (assuming the exercise of the underwriters’ option to purchase additional shares in full), the FCCR under our ABL facility on a pro forma basis for the year ended December 31, 2008 and the twelve months ended September 30, 2009 would have been and , respectively.
| (9) | As defined by the ABL facility. For more information about the FCCR, see “Covenant Compliance.” |
Financing Activities
The ABL Facility
The ABL facility permits us to borrow on a revolving basis through November 30, 2011. Substantially all of our subsidiaries are borrowers under the ABL facility.
On July 1, 2008, we executed our option to increase the Tranche A Commitments by $100.0 million, which increased the total commitment from $525.0 million to $625.0 million. All other existing terms under the ABL facility remained unchanged. Costs incurred to exercise the option to increase the ABL facility totaled $2.4 million, and are being amortized over the existing term of the ABL facility.
63
Table of Contents
On June 8, 2007, we executed the June 2007 amendment to the ABL facility, which increased the commitment from $450.0 million to $525.0 million, comprised of $500.0 million of Tranche A Commitments and $25.0 million of Tranche A-1 Commitments. Additionally, the June 2007 amendment reduced the borrowing cost on the Tranche A facility by 25 basis points, reduced the borrowing cost on the Tranche A-1 facility by 75 basis points and gave us the option to increase the Tranche A Commitments by $100.0 million. Costs incurred in connection with the June 2007 amendment totaled $1.6 million, and are being amortized over the existing term of the ABL facility, which expires November 30, 2011.
Borrowing Base. The maximum availability under the ABL facility is based on eligible receivables and eligible inventory, subject to certain reserves. Our borrowing availability fluctuates daily with changes in eligible receivables and inventory, less outstanding borrowings and letters of credit. The borrowing base is equal to the lesser of (a) the aggregate amount of the Tranche A Commitments and the Tranche A-1 Commitments and (b) the sum of:
| Ÿ | 85% of the net amount of eligible accounts receivable; |
| Ÿ | the lesser of (x) 70% of the lesser of the original cost or market value of eligible inventory and (y) 90% of the net orderly liquidation value of eligible inventory; and |
| Ÿ | at all times prior to the termination of the Tranche A-1 Commitments, the sum of 5% of the net amount of eligible accounts receivable and 5% of the net orderly liquidation value of eligible inventory. |
Initial borrowings under the ABL facility were used to repay the outstanding amounts drawn under our existing revolving credit facility and to fund other costs and expenses related to the Merger. The loan and security agreement governing the ABL facility provides for up to $15.0 million of swing-line loans and up to $100.0 million for the issuance of letters of credit. Both the face amount of any outstanding letters of credit and any swing-line loans will reduce borrowing availability under the ABL facility on a dollar-for-dollar basis.
As of September 30, 2009, we had $234.3 million of eligible collateral, $90.0 million in outstanding advances, $15.4 million in open letters of credit and $128.9 million of additional borrowing capacity. As of September 30, 2009, we had $20.1 million of cash and cash equivalents.
At November 16, 2009, we had $226.0 million of eligible collateral, $75.0 million in outstanding advances, $15.1 million in open letters of credit and $135.9 million of additional borrowing capacity. As of November 16, 2009, we had approximately $8.4 million of cash and cash equivalents.
Guarantees and Security. Substantially all of our subsidiaries are defined as “borrowers” under the loan and security agreement governing the ABL facility. The obligations under the ABL facility are guaranteed by Flag Intermediate and certain of our domestic subsidiaries and are secured (i) on a first-priority lien basis by our, the other borrowers’ and the guarantors’ accounts, inventory, cash and proceeds and products of the foregoing and certain assets related thereto and (ii) on a second-priority lien basis by substantially all of our, the other borrowers’ and the guarantors’ other assets, subject to certain exceptions and permitted liens. Metals USA Holdings is not a party to the ABL facility, and indebtedness under the ABL facility is not guaranteed by Metals USA Holdings.
Interest Rate and Fees. Interest is calculated based upon a margin (established within a specific pricing grid for loans utilizing Tranche A Commitments) over reference rates. The marginal rates vary with our financial performance as measured by the FCCR. The FCCR is determined by dividing (i) the sum of adjusted EBITDA (as defined by the loan and security agreement governing the ABL facility) minus income taxes paid in cash minus non-financed capital expenditures by (ii) the sum of certain distributions paid in cash, cash interest expense and scheduled principal reductions on debt, and is calculated based on such amounts for the three immediately preceding fiscal periods.
64
Table of Contents
The interest rates with respect to loans utilizing the Tranche A Commitments are, at our option, (i) the higher of (a) the prime rate of Credit Suisse in effect at its principal office in New York City and (b) the federal funds effective rate plus 0.5%; plus, in each case, an applicable margin ranging between -0.25% and -0.50% as determined in accordance with the loan and security agreement governing the ABL facility or (ii) the rate (as adjusted for statutory reserves) for Eurodollar deposits for one, two, three, six or, if agreed to by all lenders under the loan and security agreement, nine or twelve months, as selected by us, by reference to the British Bankers’ Association Interest Settlement Rates, plus an applicable margin ranging between 1.00% and 1.75% as determined in accordance with the loan and security agreement governing the ABL facility. The interest rates with respect to loans utilizing the Tranche A-1 Commitments are, at our option, (i) the higher of (a) the prime rate of Credit Suisse in effect at its principal office in New York City and (b) the federal funds effective rate plus 0.5%; in each case plus an applicable margin of 0.75% or (ii) the rate (as adjusted for statutory reserves) for Eurodollar deposits for one, two, three, six or, if agreed to by all lenders under the loan and security agreement, nine or twelve months, as selected by us, by reference to the British Bankers’ Association Interest Settlement Rates, plus an applicable margin of 2.75%.
A commitment fee is payable on any unused commitments under the ABL facility of 0.25% per annum. The applicable base rate and the effective LIBOR rate for the Tranche A Commitments and Tranche A-1 Commitments were 3.25% and 0.287%, respectively, as of September 30, 2009.
Certain Covenants. The ABL facility contains customary representations, warranties and covenants as a precondition to lending, including a material adverse change in the business, limitations on our ability to incur or guarantee additional debt, subject to certain exceptions, pay dividends, or make redemptions and repurchases, with respect to capital stock, repay debt, create or incur certain liens, make certain loans or investments, make acquisitions or investments, engage in mergers, acquisitions, asset sales and sale lease-back transactions, and engage in certain transactions with affiliates. In addition, the ABL facility requires a lock-box arrangement, which, as long as borrowing availability is greater or equal to $45.0 million and in the absence of default, is controlled by Metals USA. As long as our borrowing availability is greater than or equal to $45.0 million, we do not have to maintain a minimum FCCR. Should borrowing availability fall below $45.0 million, we must maintain an FCCR of at least 1.0 to 1.0. For purposes of determining covenant compliance, the FCCR is determined by dividing (i) the sum of adjusted EBITDA (as defined by the loan and security agreement governing the ABL facility) minus income taxes paid in cash minus non-financed capital expenditures by (ii) the sum of certain distributions paid in cash, cash interest expense and scheduled principal reductions on debt, and is calculated based on such amounts for the most recent period of four consecutive fiscal quarters. As of September 30, 2009, our FCCR was 0.14.
Additionally, payments of management and consulting fees are limited to the greater of $3.0 million or 3% of adjusted EBITDA (as defined in the loan and security agreement governing the ABL facility) provided borrowing availability equals at least $25.0 million. Further, distributions in respect of capital stock are limited to the payment of up to $25.0 million, plus $5.0 million for each full fiscal quarter (with any amount not used in any fiscal quarter being permitted to be used in succeeding fiscal quarters), plus 50% of cumulative consolidated net income or, if a loss, minus 100% of the amount thereof, plus 100% of the aggregate net proceeds received by us from certain sales and issuances of capital stock or from certain capital contributions, of dividends in any fiscal quarter provided that borrowing availability is greater than or equal to $50.0 million and the FCCR is at least 1.0 to 1.0.
The ABL facility contains events of default with respect to: default in payment of principal when due, default in the payment of interest, fees or other amounts after a specified grace period, material breach of the representations or warranties, default in the performance of specified covenants, failure to make any payment when due under any indebtedness with a principal amount in excess of a specified amount, certain bankruptcy events, certain ERISA violations, invalidity of certain security agreements or guarantees, material judgments or a change of control. In the event of default the agreement may permit the lenders to: (i) restrict the account or refuse to make revolving loans; (ii)
65
Table of Contents
cause customer receipts to be applied against borrowings under the ABL facility causing the Company to suffer a rapid loss of liquidity and the ability to operate on a day-to-day basis; (iii) restrict or refuse to provide letters of credit; or ultimately: (iv) terminate the commitments and the agreement; or (v) declare any or all obligations to be immediately due and payable if such default is not cured in the specified period required. Any payment default or acceleration under the ABL facility on amounts in excess of $15.0 million would also result in a default under the Metals USA Notes and the 2007 Notes that would provide the holders of the Metals USA Notes and the 2007 Notes with the right to demand immediate repayment.
Interest Rate Swaps. In February 2008, $250.0 million notional amount of outstanding borrowings under the ABL facility were swapped from a floating LIBOR-based rate to a fixed rate. The swaps entitle us to receive quarterly payments of interest at a floating rate indexed to the three-month LIBOR and pay a fixed rate that ranges from 2.686% to 2.997%, converting a portion of the outstanding borrowings on our ABL facility from a floating rate obligation to a fixed rate obligation. Pretax realized gains and losses from derivatives which were recognized in earnings during the nine months ended September 30, 2009 amounted to $5.2 million of additional interest expense, consisting of $3.2 million of gains and losses that effectively offset changes in the cost of the Company’s hedged exposure, and $2.0 million of changes in the fair value of derivatives, an amount that was excluded from the Company’s assessment of hedge effectiveness. The fair value of the Company’s interest rate swaps was $6.4 million at September 30, 2009, with $4.4 million classified as accrued liabilities and $2.0 million classified as other long-term liabilities in the consolidated balance sheet.
See “Description of Certain Indebtedness—The ABL Facility.”
The Metals USA Notes
On the closing date of the Merger, we received approximately $268.0 million of net cash proceeds from the sale of $275.0 million in aggregate principal amount of the Metals USA Notes, after deducting expenses of the offering. Interest on the Metals USA Notes accrues at the rate of 11 1/8% per annum and is payable semiannually in arrears on June 1 and December 1 and commenced on June 1, 2006. The Metals USA Notes will mature on December 1, 2015. We may redeem some or all of the Metals USA Notes at any time on or after December 1, 2010, at a predetermined redemption price plus accrued and unpaid interest and additional interest, if any, to the applicable redemption date. If we experience a change of control and we do not redeem the Metals USA Notes, we will be required to make an offer to repurchase the Metals USA Notes at a price equal to 101% of the principal amount, plus accrued and unpaid interest and additional interest, if any, to the date of repurchase.
Under the indenture governing the Metals USA Notes, we are required to pay interest on overdue principal at 1% per annum in excess of the above rate and are required to pay interest on overdue installments of interest at such higher rate to the extent lawful. The indenture governing the Metals USA Notes contains the covenants described under “—Covenant Compliance” below.
The Metals USA Notes indenture contains certain customary events of default, including (subject, in some cases, to customary cure periods thresholds) defaults based on (1) the failure to make payments under the Metals USA indenture when due, (2) breach of covenants, (3) cross-defaults to other material indebtedness, (4) bankruptcy events and (5) material judgments. We were in compliance with all covenants as of September 30, 2009.
During the nine months ended September 30, 2009, we purchased $48.7 million principal amount of the Metals USA Notes in the open market, resulting in a pretax gain of $13.6 million (net of unamortized deferred financing costs) on debt extinguishment.
See “Description of Certain Indebtedness—The Metals USA Notes.”
66
Table of Contents
2007 Notes
On July 10, 2007, we issued $300.0 million initial aggregate principal amount of the 2007 Notes due July 1, 2012. The 2007 Notes were issued at an initial issue price of 97% of the principal amount thereof, and original issue discount is being amortized to interest expense over the life of the 2007 Notes. The 2007 Notes are senior unsecured obligations that are not guaranteed by any of Metals USA Holdings’ subsidiaries. As such, the 2007 Notes are structurally subordinated to all indebtedness and other liabilities (including trade payables) of Metals USA Holdings’ subsidiaries.
Metals USA Holdings must make an election regarding whether interest payments on the 2007 Notes will be made in cash or through PIK Interest prior to the start of the applicable interest period. Metals USA Holdings may elect to pay (1) interest entirely in cash or (2) PIK Interest, or (3) Partial PIK Interest. Cash interest on the 2007 Notes will accrue at a rate per annum, reset quarterly, equal to LIBOR plus a spread of 6.00%, which increases by 0.25% to 6.25% in the second year of the issuance of the 2007 Notes, by 0.50% to 6.50% in the third year of the issuance of the 2007 Notes, and by 0.75% to 6.75% in the fourth year of the issuance of the 2007 Notes. In the event PIK Interest is paid on the 2007 Notes after the first four interest periods, the then-applicable margin over LIBOR on the 2007 Notes would increase by 0.75% for each period in which PIK Interest is paid. If Metals USA Holdings elects to pay any PIK Interest, Metals USA Holdings will increase the principal amount on the 2007 Notes or issue new 2007 Notes in an amount equal to the amount of PIK Interest for the applicable interest payment period to holders of the 2007 Notes on the relevant record date. Interest is payable quarterly in arrears on January 1, April 1, July 1 and October 1. PIK Interest notes, resulting from the conversion of interest into PIK notes, when paid will be treated as an operating activity in the Consolidated Statements of Cash Flows in accordance with ASC 230.
The initial five interest payments on the 2007 Notes were paid solely in cash. Flag Intermediate provided funds to Metals USA Holdings to fund the initial five quarterly interest payments on the 2007 Notes, which were paid on October 1, 2007, January 2, 2008, April 1, 2008, July 1, 2008 and October 1, 2008 and which totaled $7.7 million, $8.4 million, $8.1 million, $6.5 million and $6.6 million, respectively.
On September 26, 2008, we made a permitted election under the indenture governing the 2007 Notes to pay all interest that is due on January 1, 2009, for the interest period beginning on October 1, 2008, and ending on December 31, 2008, entirely through PIK Interest. The January 1, 2009 PIK Interest payment amounted to $8.2 million. We have continued to make PIK Interest payments subsequent to January 1, 2009. The April 1, 2009 PIK Interest payment amounted to $5.6 million, the July 1, 2009 PIK Interest payment amounted to $3.8 million and the October 1, 2009 PIK Interest payment amounted to $3.5 million. The Company must make an election regarding whether subsequent interest payments will be made in cash, through PIK Interest, or Partial PIK Interest, prior to the start of the applicable interest period. In the absence of such an election for any interest period, interest on the 2007 Notes will be payable according to the election for the previous interest period. As a result, the PIK Interest election is now the default election for future interest periods unless we elect otherwise not later than the commencement of an interest period.
The terms of the ABL facility, as well as the indenture governing the Metals USA Notes, restrict Flag Intermediate and certain of its subsidiaries from making payments or transferring assets to Metals USA Holdings, including dividends, loans, or distributions. Such restrictions include prohibition of dividends in an event of default and limitations on the total amount of dividends paid to Metals USA Holdings. In the event these agreements do not permit Flag Intermediate to provide Metals USA Holdings with sufficient distributions to fund interest and principal payments on the 2007 Notes when due, Metals USA Holdings may default on the 2007 Notes unless other sources of funding are available. The amount available under the restricted payment provision contained in the loan and security agreement governing the ABL facility was $63.1 million as of September 30, 2009. No amount was available under the restricted payment provision contained in the indenture governing the Metals USA Notes as of September 30, 2009.
67
Table of Contents
On or after January 15, 2008, Metals USA Holdings may redeem some or all of the 2007 Notes at certain redemption prices, plus accrued and unpaid interest and additional interest, if any, to the redemption date. If Metals USA Holdings makes certain public offerings, sales or issuances of common stock, and does not redeem the 2007 Notes, it will be required to make an offer to repurchase the maximum principal amount of the 2007 Notes that may be purchased out of the proceeds thereof, at a price equal to 100% of the principal amount, plus accrued and unpaid interest and additional interest, if any, to the date of repurchase.
As described in “Use of Proceeds,” no later than 60 days following our receipt of the proceeds of this offering, we will make an offer to all holders of the 2007 Notes to repurchase the maximum principal amount of the 2007 Notes, of which $178.9 million aggregate principal amount were outstanding as of September 30, 2009, that may be purchased out of the net proceeds of this offering, estimated to be approximately $ million, at a price equal to 100% of the principal amount, plus accrued and unpaid interest to the date of the closing of the repurchase offer. Our affiliates that are holders of the 2007 Notes may participate in the repurchase offer. See “Certain Relationships and Related Party Transactions—Related Party Transactions—Repurchase Offer.” We cannot assure you that holders of the 2007 Notes will accept our offer. We will also continue to be subject to the covenants in the indenture governing the 2007 Notes if any 2007 Notes remain outstanding after the offer.
If Metals USA Holdings experiences a change of control and does not redeem the 2007 Notes, it will be required to make an offer to repurchase the 2007 Notes at a price equal to 101% of the principal amount, plus accrued interest and unpaid interest and additional interest, if any, to the date of repurchase.
Under the indenture governing the 2007 Notes, we are required to pay interest on overdue principal at 1% per annum in excess of the rates discussed above and are required to pay interest on overdue installments of interest at such higher rate to the extent lawful. The indenture governing the 2007 Notes contains covenants described under “—Covenant Compliance” below.
The indenture governing the 2007 Notes contains covenants that, among other things, limit Metals USA Holdings’ ability and the ability of certain of its subsidiaries to incur or guarantee additional indebtedness or issue disqualified or preferred stock, repurchase or redeem capital stock or subordinated indebtedness, pay dividends or make distributions to its stockholders, incur restrictions on the ability of its subsidiaries to pay dividends or to make other payments to Metals USA Holdings, transfer or sell assets, create liens, enter into transactions with affiliates, make investments or acquisitions, and merge or consolidate with other companies or transfer all or substantially all of its assets.
Our affiliates, which include Apollo, as well as our Chief Executive Officer and our Chief Financial Officer, have purchased a portion of our 2007 Notes in the market. For the nine months ended September 30, 2009, interest paid on the 2007 Notes held by affiliates amounted to $9.0 million, and was paid entirely by PIK Interest. From time to time, depending upon market, pricing and other conditions, as well on cash balances and liquidity, we, our subsidiaries or affiliates may seek to purchase or sell some amount of the Metals USA Notes or additional amounts of the 2007 Notes. Any such purchases or sales may be made in the open market, privately negotiated transactions, tender offers or otherwise. The amounts of any such purchases or sales may be material.
During the nine months ended September 30, 2009, we purchased $130.1 million principal amount of the 2007 Notes in the open market, resulting in a pretax gain of $75.5 million (net of unamortized deferred financing costs and original issue discount) on debt extinguishment.
See “Description of Certain Indebtedness—The 2007 Notes.”
68
Table of Contents
Covenant Compliance
Our FCCR as defined by the ABL facility is calculated based on a numerator consisting of adjusted EBITDA less cash taxes and capital expenditures and a denominator consisting of interest expense and certain distributions, and is calculated based on such amounts for the most recent period of four consecutive fiscal quarters. As of September 30, 2009, our FCCR was 0.14. As of September 30, 2009, we had $128.9 million of additional borrowing capacity under the ABL facility. Failure to comply with the FCCR covenant of the ABL facility can result in limiting our long-term growth prospects by hindering our ability to incur future indebtedness or grow through acquisitions.
The indentures governing the Metals USA Notes and the 2007 Notes contain covenants that restrict our ability to take certain actions, such as incurring additional debt and making certain acquisitions, if we are unable to meet defined Adjusted EBITDA to Fixed Charges and consolidated total debt ratios (each, as defined). The covenants in the indenture requires us to have an adjusted EBITDA to fixed charge coverage ratio (measured on a trailing four-quarter basis and calculated differently from the fixed charge coverage ratio as defined by the ABL facility) of 2.0 to 1.0 to incur “ratio” indebtedness and a consolidated total debt ratio of no greater than 4.75 to 1.0 to incur “ratio” indebtedness in connection with acquisitions. Based on the calculations for the trailing four quarters, we are not able to satisfy these covenants and incur additional indebtedness under these ratios, including for acquisition purposes, under our indentures. The most restrictive of the covenants in all of our debt agreements is the FCCR in our ABL facility; accordingly, we have presented our covenant compliance on that basis.
The FCCR (as defined in the loan and security agreement governing the ABL facility) is determined by dividing (i) the sum of adjusted EBITDA (as defined by the loan and security agreement governing the ABL facility) minus income taxes paid in cash minus non-financed capital expenditures by (ii) the sum of certain distributions paid in cash, cash interest expense and scheduled principal reductions on debt, and is calculated based on such amounts for the most recent period of four consecutive fiscal quarters. Adjusted EBITDA is defined as EBITDA further adjusted to exclude certain non-cash, non-recurring and realized or expected future cost savings directly related to prior acquisitions. We believe that the inclusion of the supplemental adjustments applied in calculating Adjusted EBITDA is appropriate to provide additional information to investors to demonstrate compliance with our financial covenants and assess our ability to incur additional indebtedness in the future. EBITDA, adjusted EBITDA and fixed charges are not defined terms under GAAP. Adjusted EBITDA should not be considered an alternative to operating income or net income as a measure of operating results or an alternative to cash flows as a measure of liquidity. Fixed charges should not be considered an alternative to interest expense.
We believe that the inclusion of supplementary adjustments to EBITDA applied in presenting Adjusted EBITDA are appropriate to provide additional information to investors about the performance of the business. Because we are highly leveraged, we believe that the inclusion of supplementary adjustments to EBITDA applied in presenting Adjusted EBITDA are appropriate to provide additional information to investors to demonstrate compliance with the covenants in our debt agreements. Management uses Adjusted EBITDA as a key indicator to evaluate performance of certain employees.
Both the loan and security agreement governing the ABL facility and the indentures governing the Metals USA Notes and the 2007 Notes contain restrictions as to the payment of dividends. The amount available under the restricted payment provision contained in the loan and security agreement governing the ABL facility was $63.1 million as of September 30, 2009. No amount was available under the restricted payment provision contained in the indenture governing the Metals USA Notes as of September 30, 2009. As of September 30, 2009, Flag Intermediate and its wholly-owned subsidiary, Metals USA, had $146.2 million of total stockholder’s equity.
69
Table of Contents
We believe the cash flow from operations, supplemented by the cash available under the ABL facility, will be sufficient to enable us to meet our debt service and operational obligations as they come due for at least the next twelve months.
Off-Balance Sheet Arrangements
We were not engaged in off-balance sheet arrangements through any unconsolidated, limited purpose entities and no material guarantees of debt or other commitments to third parties existed at September 30, 2009.
Contractual Obligations
We enter into operating leases for many of our facility, vehicle and equipment needs. These leases allow us to conserve cash by paying a monthly lease rental fee for the use of, rather than purchasing, facilities, vehicles and equipment. At the end of the lease, we have no further obligation to the lessor. We have varying amounts of open purchase orders that are subject to renegotiation/cancellation by either party as to quantity or price. Generally, the amounts outstanding relate to delivery periods of up to 12 weeks from the date of the purchase order.
Our future contractual obligations as of December 31, 2008 include the following:
| Total | For the Fiscal Years Ended December 31, | ||||||||||||||||||||
| 2009 | 2010 | 2011 | 2012 | 2013 | Beyond | ||||||||||||||||
| (in millions) | |||||||||||||||||||||
| ABL facility(1) |
$ | 368.0 | $ | — | $ | — | $ | 368.0 | $ | — | $ | — | $ | — | |||||||
| Purchase Orders |
97.4 | 97.4 | — | — | — | — | — | ||||||||||||||
| 11 1/8 Senior Secured Notes Due 2015 (Metals USA Notes). |
489.2 | 30.6 | 30.6 | 30.6 | 30.6 | 30.6 | 336.2 | ||||||||||||||
| Senior Floating Rate Toggle Notes Due 2012 (2007 Notes)(2) |
300.0 | — | — | — | 300.0 | — | — | ||||||||||||||
| IRB(3) |
5.7 | — | — | — | — | — | 5.7 | ||||||||||||||
| Other obligations(4) |
9.7 | 2.2 | 0.7 | 0.7 | 0.6 | 0.6 | 4.9 | ||||||||||||||
| Operating lease obligations |
64.9 | 15.1 | 13.1 | 11.7 | 7.3 | 4.9 | 12.8 | ||||||||||||||
| Total |
$ | 1,334.9 | $ | 145.3 | $ | 44.4 | $ | 411.0 | $ | 338.5 | $ | 36.1 | $ | 359.6 | |||||||
| (1) | The amounts stated do not include interest costs. The ABL facility bears interest based upon a margin over reference rates established within a specific pricing grid. The marginal rates will vary with our financial performance as measured by the FCCR. The applicable base rate and the effective LIBOR rate were 3.25% and 1.425%, respectively, on the December 31, 2008. |
| (2) | The 2007 Notes bear cash interest at LIBOR plus a spread of 6.00%, which increases by 0.25% to 6.25% in the second year of the issuance of the 2007 Notes, by 0.50% to 6.50% in the third year of the issuance of the 2007 Notes and by 0.75% to 6.75% in the fourth year of the issuance of the 2007 Notes. In the event PIK Interest is paid, the then-applicable margin over LIBOR on the 2007 Notes would increase by 0.75% for each period in which PIK Interest is paid. The effective LIBOR rate was 1.425% at December 31, 2008. Contractual obligations reflect estimated cash interest expense. In the event a PIK Interest election is made, PIK Interest associated with additional notes issued as a result of a PIK Interest election will be reflected in future periods once those notes have been issued. Estimated interest was calculated using a 3-month LIBOR forward curve, with the initial spread and increases to the initial spread for the applicable periods as discussed above. See “Use of Proceeds.” |
| (3) | The amounts stated do not include interest costs. The interest rate assessed on the IRB varies from month to month based on an index of mutual bonds, which was 1.30% on December 31, 2008. |
70
Table of Contents
| (4) | Consists of junior indebtedness of approximately $1.8 million and a multiemployer pension fund withdrawal liability of approximately $7.9 million. Excludes payments for unrecognized tax benefits. Based on the contingent and uncertain nature of our liability for unrecognized tax benefits, we are unable to make an estimate of the period of potential settlement, if any, with respective taxing authorities. |
Critical Accounting Policies and Estimates
The discussion and analysis of our financial condition and results of operations is based upon our consolidated financial statements, which have been prepared in accordance with GAAP. The preparation of these consolidated financial statements requires us to make estimates and judgments that affect the reported amounts of assets, liabilities, revenues and expenses, and related disclosures of contingent assets and liabilities. Estimates are based on historical experience and on various other assumptions that are believed to be reasonable under the circumstances. The result of this process forms the basis for making judgments about the carrying value of assets and liabilities that are not readily apparent from other sources. We review our estimates and judgments on a regular, ongoing basis. Actual results may differ from these estimates due to changed circumstances and conditions.
The following accounting policies and estimates are considered critical in light of the potentially material impact that the estimates, judgments and uncertainties affecting the application of these policies might have on our reported financial information.
Accounts Receivable. We generally recognize revenue as product is shipped (risk of loss for our products generally passes at time of shipment), net of provisions for estimated returns. Financial instruments, which potentially subject us to concentrations of credit risk, consist principally of trade accounts and notes receivable. Collections on our accounts receivable are made through several lockboxes maintained by our lenders. Credit risk associated with concentration of cash deposits is low as we have the right of offset with our lenders for the substantial portion of our cash balances. Concentrations of credit risk with respect to trade accounts receivable are within several industries. Generally, credit is extended once appropriate credit history and references have been obtained. We perform ongoing credit evaluations of customers and set credit limits based upon reviews of customers’ current credit information and payment history. We monitor customer payments and maintain a provision for estimated credit losses based on historical experience and specific customer collection issues that we have identified. Provisions to the allowance for doubtful accounts are made monthly and adjustments are made periodically based upon our expected ability to collect all such accounts. Generally we do not require collateral for the extension of credit.
Each month we consider all available information when assessing the adequacy of the provision for allowances, claims and doubtful accounts. Adjustments made with respect to the allowance for doubtful accounts often relate to improved information not previously available. Uncertainties with respect to the allowance for doubtful accounts are inherent in the preparation of financial statements. The rate of future credit losses may not be similar to past experience.
Inventories. Inventories are stated at the lower of cost or market. Our inventories are accounted for using a variety of methods including specific identification, average cost and the first-in first-out method of accounting. We regularly review inventory on hand and record provisions for damaged and slow-moving inventory based on historical and current sales trends. Changes in product demand and our customer base may affect the value of inventory on hand which may require higher provisions for damaged and slow-moving inventory.
Adjustments made with respect to the allowance for damaged and slow-moving inventory often relate to improved information not previously available. Uncertainties with respect to the allowance for
71
Table of Contents
damaged and slow-moving inventory are inherent in the preparation of financial statements. The rate of future losses associated with damaged or slow moving inventory may not be similar to past experience.
New Accounting Pronouncements
In June 2009, the FASB issued guidance now codified as ASC Topic 105, “Generally Accepted Accounting Principles” (“ASC 105”), which establishes the FASB Accounting Standards Codification as the source of GAAP to be applied to nongovernmental agencies. ASC 105 explicitly recognizes rules and interpretive releases of the SEC under authority of federal securities laws as authoritative GAAP for SEC registrants. ASC 105 became effective for interim or annual periods ending after September 15, 2009. ASC 105 did not have a material impact on the Company’s consolidated financial statements.
In May 2009, the FASB issued guidance now codified as ASC Topic 855, “Subsequent Events” (“ASC 855”). The pronouncement modifies the definition of what qualifies as a subsequent event—those events or transactions that occur following the balance sheet date, but before the financial statements are issued, or are available to be issued—and requires companies to disclose the date through which it has evaluated subsequent events and the basis for determining that date. The Company adopted the provisions of ASC 855 in the second quarter of 2009, in accordance with the effective date.
In April 2009, the FASB issued guidance now codified as ASC Topic 825, “Financial Instruments” (“ASC 825”). The pronouncement amends previous ASC 825 guidance to require disclosures about the fair value of financial instruments in all interim as well as annual financial statements. This pronouncement was effective for interim periods ending after June 15, 2009 and the Company adopted its provisions in the second quarter of 2009.
In April 2008, the FASB issued guidance now codified as ASC Topic 350, “Intangibles—Goodwill and Other” (“ASC 350”). This pronouncement amends the factors that should be considered in developing renewal or extension assumptions used to determine the useful life of a recognized intangible asset under previous ASC 350 guidance, thereby improving the consistency between the useful life of a recognized intangible asset under ASC 350 and the period of expected cash flows used to measure the fair value of the asset under ASC Topic 805, “Business Combinations” (“ASC 805”). This pronouncement was effective for financial statements issued for fiscal years beginning after December 15, 2008 and must be applied prospectively to intangible assets acquired after the effective date. The Company has not acquired any intangible assets since adopting this pronouncement. As such, there has been no impact to the Company’s financial statements since the January 1, 2009 adoption date.
In March 2008, the FASB issued guidance now codified as ASC Topic 815 “Derivatives and Hedging” (“ASC 815”), which expands the disclosure requirements in previous ASC 815 guidance about an entity’s derivative instruments and hedging activities. This pronouncement’s disclosure provisions apply to all entities with derivative instruments subject to the previous ASC 815 guidance. The provisions also apply to related hedged items, bifurcated derivatives, and nonderivative instruments that are designated and qualify as hedging instruments. Entities with instruments subject to this pronouncement must provide more robust qualitative disclosures and expanded quantitative disclosures. Such disclosures, as well as existing required disclosures, generally will need to be presented for every annual and interim reporting period. This pronouncement was effective for financial statements issued for fiscal years and interim periods beginning after November 15, 2008. For the nine months ended September 30, 2009, we have included the expanded disclosures about derivative instruments and hedging activities within the Company’s financial statements.
In December 2007, the FASB issued guidance now codified as ASC Topic 805, “Business Combinations” (“ASC 805”), which replaces previous ASC 805 guidance. This pronouncement
72
Table of Contents
establishes principles and requirements for how an acquirer recognizes and measures in its financial statements the identifiable assets acquired, the liabilities assumed, any non-controlling interest in the acquiree and the goodwill acquired in connection with a business combination. This pronouncement also establishes disclosure requirements that will enable users to evaluate the nature and financial effect of the business combination. This pronouncement applies prospectively to business combinations for which the acquisition date is on or after the beginning of an entity’s first fiscal year that begins after December 15, 2008. The Company applied the provisions of ASC 805 in connection with the acquisition that closed during the first quarter of 2009. The adoption of this pronouncement did not have a material impact on the Company’s consolidated financial statements.
Quantitative and Qualitative Disclosures About Market Risk
In the normal course of our business, we are exposed to market risk, primarily from changes in interest rates and the cost of metal we hold in inventory. We continually monitor exposure to market risk and develop appropriate strategies to manage this risk. With respect to our metal purchases, there is no recognized market to purchase derivative financial instruments to reduce the inventory exposure risks. See “Management’s Discussion and Analysis of Financial Condition and Results of Operations—Liquidity and Capital Resources” for a discussion of market risk relative to steel prices.
Our exposure to market risk for changes in interest rates relates primarily to the ABL facility and the 2007 Notes, both of which are subject to variable interest rates. As of September 30, 2009, outstanding borrowings under the ABL facility were $90.0 million. Based on the weighted average borrowings outstanding on the ABL facility during the nine months ended September 30, 2009, a one percent increase or decrease in the weighted average facility rate would have resulted in a change to pretax interest expense of approximately $1.6 million for the period.
As of September 30, 2009, the outstanding principal amount of the 2007 Notes was $178.9 million. Based on this amount, a one percent increase or decrease in the base rate would have resulted in a change to pretax interest expense of $1.3 million for the nine months ended September 30, 2009. At November 13, 2009, the 2007 Notes were traded at approximately 80.625% of face value, based on quoted market prices.
In February 2008, $250.0 million notional amount of outstanding borrowings under the ABL facility were swapped from a floating LIBOR-based rate to a fixed rate. The swaps entitle us to receive quarterly payments of interest at a floating rate indexed to the three-month LIBOR and pay a fixed rate that ranges from 2.686% to 2.997%, converting a portion of the outstanding borrowings on our ABL facility from a floating rate obligation to a fixed rate obligation. Pretax realized gains and losses from derivatives which were recognized in earnings during the nine months ended September 30, 2009 amounted to $5.2 million of additional interest expense, consisting of $3.2 million of gains and losses that effectively offset changes in the cost of the Company’s hedged exposure, and $2.0 million of changes in the fair value of derivatives, an amount that was excluded from the Company’s assessment of hedge effectiveness. The fair value of the Company’s interest rate swaps was $6.4 million at September 30, 2009, with $4.4 million classified as accrued liabilities and $2.0 million classified as other long-term liabilities in the consolidated balance sheet.
$226.3 million aggregate principal amount of Metals USA Notes were outstanding at September 30, 2009, with a fixed interest rate of 11 1/8%. Changes in market interest rates will not impact cash interest payable on the Metals USA Notes. At November 13, 2009, the Metals USA Notes were traded at approximately 96.0% of face value, based on quoted market prices.
73
Table of Contents
Description of the Apollo Transactions
On May 18, 2005, Metals USA Holdings, Flag Acquisition and Metals USA entered into the Merger Agreement. On November 30, 2005, Flag Acquisition, which was a wholly-owned subsidiary of Flag Intermediate, merged with and into Metals USA, with Metals USA being the surviving corporation. Flag Intermediate and Flag Acquisition conducted no operations during the period from May 9, 2005 (date of inception) to November 30, 2005. As a result of the Merger, all of Metals USA Inc.’s issued and outstanding common stock is held indirectly by Metals USA Holdings through Flag Intermediate, its wholly-owned subsidiary. Metals USA Holdings is a holding company and it has no assets, obligations, employees or operations other than those resulting from the Merger, the 2007 Notes and this offering. All of Metals USA Holdings’ operations are conducted by Metals USA. Metals USA Holdings was formed by Apollo. Investment funds associated with Apollo own approximately 97% of the capital stock of Metals USA Holdings (or approximately 91% on a fully diluted basis) as of September 30, 2009, and will beneficially own approximately % of our common stock, assuming the underwriters do not exercise their over-allotment option. The remainder of the capital stock of Metals USA Holdings is held by members of our management. See “Principal Stockholders and Selling Stockholders.”
In connection with the Merger, (a) Metals USA entered into the ABL facility and (b) Flag Acquisition completed a private placement of $275.0 million aggregate principal amount of the Metals USA Notes, which Metals USA assumed pursuant to the Merger. In September 2006, Metals USA exchanged $275.0 million aggregate principal amount of the Metals USA Notes that were registered under the Securities Act for an equal principal amount of the Metals USA Notes issued in connection with the Merger.
In addition, at the effective time of the Merger, Apollo and certain members of management of Metals USA contributed $140.0 million to Metals USA Holdings Corp., in exchange for common stock of Metals USA Holdings Corp. The proceeds from the issuance of the Metals USA Notes, borrowings under the ABL facility and the equity investment by Apollo and our management members were used to pay the merger consideration to the previous equity holders of Metals USA to pay down certain existing debt of Metals USA and to pay transaction expenses related to the Merger, including $6.0 million of transaction fees paid to Apollo. For a more complete description of the indebtedness see “Description of Certain Indebtedness.”
74
Table of Contents
Ownership and Corporate Structure
The following diagram sets forth our ownership and organizational structure as of immediately following the completion of this offering (ownership percentages are given assuming the underwriters do not exercise their option to purchase additional shares). The diagram below does not display all of our subsidiaries or indicate the amounts outstanding under the IRB.
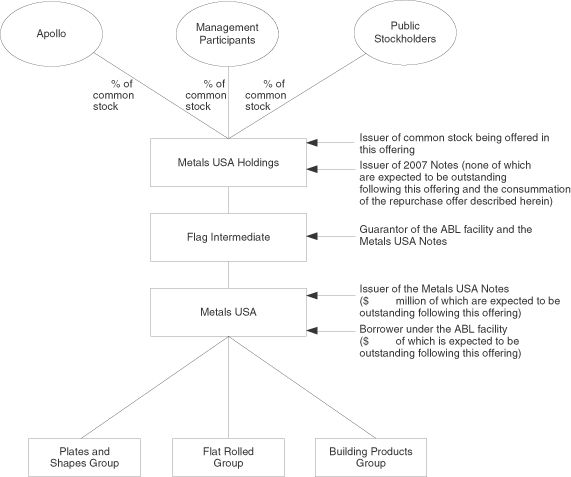
75
Table of Contents
Company Overview
Metals USA, Inc. was incorporated in Delaware on July 3, 1996, and began operations upon completion of an initial public offering on July 11, 1997. On May 18, 2005, Metals USA Holdings, Flag Acquisition, and Metals USA entered into the Merger Agreement. On November 30, 2005, Flag Acquisition, which was a wholly-owned subsidiary of Flag Intermediate, merged with and into Metals USA, with Metals USA being the surviving corporation. Flag Intermediate and Flag Acquisition conducted no operations during the period from May 9, 2005 (date of inception) to November 30, 2005. As a result of the Merger, all of Metals USA Inc.’s issued and outstanding common stock is held indirectly by Metals USA Holdings through Flag Intermediate, its wholly owned subsidiary. Metals USA Holdings was formed by Apollo. Investment funds associated with Apollo own approximately 97% of the capital stock of Metals USA Holdings (or approximately 91% on a fully-diluted basis) as of September 30, 2009, and will beneficially own approximately % of our common stock, assuming the underwriters do not exercise their over-allotment option. The remainder of the capital stock of Metals USA Holdings is held by members of our management. See “Principal Stockholders and Selling Stockholders.”
As one of the largest metal service center businesses in the United States, we believe that we are a leading provider of value-added processed carbon steel, stainless steel, aluminum, red metals and manufactured metal components. We believe that we serve an important function as an intermediary between primary metal producers that generally sell large volumes in limited sizes and configurations and end-users that generally require more services and smaller quantities of customized products. Operating 35 facilities comprising almost 5 million square feet of industrial space, our metal service center business sold more than 1.4 million tons of metal products in 2008. We sell our products and services to a diverse customer base and broad range of end markets, including the land and marine transportation, energy, aerospace, defense, electrical and appliance manufacturing, fabrication, furniture, commercial construction, and machinery and equipment industries, among several others, throughout the United States. We strive to earn a margin over the cost of metal. Management’s strategy, manifested through organic growth initiatives and our acquisitions of Port City, Lynch Metals, and Philadelphia Plate, focuses on maximizing the margin we earn over the cost of metal by offering additional value-added processing services and diversifying our product mix. We believe our growth and acquisition strategy, in combination with management’s demonstrated ability to manage metal purchasing and inventories to consistently meet our customers’ high expectations for service and reliability, serves as a foundation for future revenue growth and stable operating profit per ton through the economic cycle.
Our Plates and Shapes and Flat Rolled and Non-Ferrous Groups perform customized, value-added processing services to unimproved steel and other metals required to meet specifications provided by our customers in addition to offering inventory management and just-in-time delivery services, among others. These services enable our customers to reduce material costs, decrease capital required for raw materials inventory and processing equipment, and save time, labor, warehouse space and other expenses. The customers of our Plates and Shapes and Flat Rolled and Non-Ferrous Groups are in the electrical and appliance manufacturing, fabrication, furniture, commercial construction, machinery and equipment, land and marine transportation, and energy and aerospace industries. Our Building Products Group manufactures high-value finished building products for distributors and contractors engaged in the residential remodeling industry.
76
Table of Contents
Competitive Strengths
Premium Margins Over Metal. Metal service centers generally earn a margin over the cost of metal, which provides stability to metal service centers’ cash flows relative to primary metal producers through pricing cycles. In addition, we earn a premium margin over the cost of metal by providing inventory management services and performing certain value-added processing services before shipping product to customers. We also sell an enhanced product mix across our metal service center business by supplementing our core carbon offerings with non-ferrous volumes. Over the last several years, we have invested in our facilities and completed acquisitions to expand our service offerings and improve our ability to continue earning premium margins on a broad and diverse range of products and services.
Platform for Strong Growth. Over the five years ended December 31, 2008, we have spent approximately $134.8 million on growth initiatives, including $45.9 million to grow our business organically and $88.9 million for acquisitions. In addition to selectively pursuing growth projects, from December 31, 2008 to September 30, 2009 we repurchased $178.8 million face value of our debt at a substantial discount to par value, which generated attractive returns for us and improved our balance sheet flexibility going forward. Our growth initiatives have focused on increasing and diversifying our mix of higher-margin products and services, such as value-added processing, inventory management services, and non-ferrous volumes. Our largest organic growth project during the last three years was a $17.5 million investment in our Plates and Shapes metal service center in Waggaman, Louisiana to capitalize upon the strong gulf coast marine market. This investment equipped this facility with additional value-added processing capabilities, such as blast, paint, laser and plasma cutting (the cutting of metals to produce shapes under strict tolerance requirements) and press brake services. In late 2005, we established and trained a dedicated acquisitions team that is responsible for identifying, evaluating, executing, integrating and monitoring acquisitions. This team has completed three strategic acquisitions for our metal service center business: (1) Port City in our Plates and Shapes Group that increased our plate processing capabilities to customers serving the oil field, construction equipment and refining industries, (2) Lynch Metals in our Flat Rolled and Non-Ferrous Group that provides value-added, specialized aluminum products to customers who are predominantly manufacturers of air/heat transfer products specifically focused on aerospace, industrial and automotive applications and (3) Philadelphia Plate in our Plates and Shapes Group that further expanded our existing processing capabilities into the northeast region of the United States and to the marine and defense industries.
Skilled Inventory Management. Inventory management is critical to metal service centers’ ability to balance investment in working capital, maintain cost competitiveness and meet customer needs for timely and often just-in-time delivery. The Company’s purchasing practices follow a market driven inventory management framework that is designed to generate attractive returns on our inventory investment while reliably meeting customer demands irrespective of steel prices. Our Chief Executive Officer monitors and adjusts this framework on at least a weekly basis. Within this framework, inventory and processing services are tailored to the needs of each individual metal service center location’s particular customers. We believe our inventory management framework and flexible capital structure allow us to quickly react to changing metal prices and customer needs. Our information technology systems facilitate sharing inventory among our facilities, which helps us maximize returns and reliably satisfy our customers’ needs. In addition, our inventory management framework enhances our ability to generate earnings during rising metal price environments and free cash flow in declining metal price environments, which we demonstrated by generating record earnings in 2008 and record operating free cash flow in the first nine months of 2009. After dramatically reducing inventories in 2009 which included changing the way we work with our suppliers, we believe that we will continue to operate our business at substantially lower inventory levels.
77
Table of Contents
Streamlined Cost Structure: Because we operate our business on a lean basis relative to our competitors, we have one of the lowest relative non-metal cost structures in our industry. For example, we had a lower ratio of selling, general and administrative expenses compared to revenues for the six months ended June 30, 2009 than a similarly situated peer group of public companies. Since the fourth quarter of 2008, we have implemented $50 million of annualized cost savings, a vast majority of which we believe are permanent reductions that further reduce what we believe to be the lowest cost structure in the industry. The cost savings have come primarily as a result of various actions including reducing our headcount by approximately 30%, modifying employee benefits, closing 7 facilities primarily in our Building Products Group, reducing work hours for our employees and streamlining our delivery fleet. The combination of our lean cost structure and skilled inventory management has allowed us to convert a high percentage of our earnings into free cash flow, resulting in $404.5 million of cash flow from operations over the twelve months ended September 30, 2009. We have used this cash to deleverage our balance sheet by $463.7 million over the same period and complete the acquisition of Philadelphia Plate in early 2009.
Strong Relationships with Key Suppliers. We are one of the largest domestic purchasers of steel, and we have established strong relationships with large domestic and international metal suppliers. Because we are a significant customer of our major suppliers, we obtain volume discounts and historically have been able to obtain sufficient access to feedstock in periods of tight supply. We believe that access to feedstock during these periods enhances our standing with end users relative to our competitors, particularly those competitors that do not have such access. Our relationships with our metal suppliers also help us to optimize our inventory management because we believe that we can often purchase inventory with significantly shorter lead times relative to our competitors.
Diversified Customer Base, Products and End-Markets. Our business supplies a broad range of products to a large and diversified customer base (over 471,095 transactions to 11,900 customers in 2008) in a wide variety of end-markets and industries. For the twelve months ended December 31, 2008, our average transaction size was approximately $4,162. However, we have sought to enhance our position in stable growth industries that demand additional value-added services and reduce our exposure to more cyclical sectors. As a result of our organic growth projects and acquisitions, we have capitalized on growth opportunities with products such as aluminum brazing sheet, armor plate, marine grade aluminum plate, and pressure vessel plate to service the aerospace, marine, defense, and oil and gas industries. Our broad range of high-quality product and customized value-added service offerings allows us to offer one-stop shopping to our customers. We believe one-stop shopping provides a significant competitive advantage over smaller metal service centers, which generally stock fewer products and offer fewer services than we do. Moreover, many products and services in our broad range of offerings exhibit diverse and distinct cyclical trends. For example, many of the products and services we sell through our Plates and Shapes Group tend to trail the economic cycle, which provides an attractive balance to our Flat Rolled and Non-Ferrous Group product and service offerings that tend to lead the economic cycle. We believe that this diversity helps provide stability to our results during economic downturns and positions us well for an economic and volume recovery.
78
Table of Contents
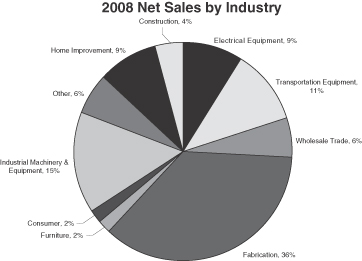
Experienced and Proven Management Team. Our senior management team has on average over 27 years of metals industry experience and is supported by, in our opinion, considerable management talent, including our division vice presidents and facility general managers, amongst others. Our President, Chief Executive Officer and Chairman, C. Lourenco Goncalves, has 29 years of experience in the metals industry, including his terms as Chief Executive Officer of CSI, which had many of the same value chain dynamics as a metal service center, and as managing director, among other positions, of CSN. Under Mr. Goncalves’ leadership our management team has executed a strategy that has significantly improved our earnings growth, cash flow stability, and competitiveness.
Strategy
Expand Value-Added Services. We intend to continue expanding our value-added services, which enhance our relationships with existing customers and help us build new customer relationships. Customers increasingly demand and are willing to pay a premium margin for additional value-added services to facilitate more efficient inventory management and reduce total production costs. In addition, we experience an increased level of repeat business from customers who utilize our value-added services. Demand for these services generally remains strong through most economic cycles. We intend to continue to identify and invest in capital projects that provide attractive returns to fulfill this growing demand. We believe that our operating expertise, organizational structure, high-quality facilities, size, and our low cost and flexible capital structure enable us to reliably provide a full range of value-added services to our customers relative to our competitors, particularly smaller metal service centers.
Increase Sales of Higher Margin Products and Services. The sale of higher margin products and services, which tend to have higher growth prospects and are more stable, will continue to be one of our core strategies. We intend to continue executing on this strategy by increasing our attractive core carbon offerings, non-ferrous volumes, and our sales of processed products. Focusing on this strategy has historically increased our margins, stabilized our earnings, and optimized our investment in working capital, and we expect this strategy will continue benefiting us in these areas. We anticipate that we will continue investing in and acquiring companies to maintain and expand our processing facilities, which will enable us to increase market share.
Execute Strategic Acquisitions to Improve Our Business. The North American metal service center industry is highly fragmented, which we believe provides us with opportunities to execute our core strategies through synergistic “bolt-on” acquisitions. We completed three accretive
79
Table of Contents
and strategic acquisitions, Port City and Philadelphia Plate for our Plates and Shapes Group and Lynch Metals for our Flat-Rolled and Non-Ferrous Group, all of which have benefited us financially, operationally and strategically through realization of cost synergies, increased value-added processing capabilities, reduced inventory levels, and increased cross selling opportunities. The combination of our track record of acquiring and successfully integrating acquisitions and our internal acquisition team’s industry relationships has resulted in proprietary deal flow being brought to us and has helped us maintain an active pipeline of opportunities. We intend to continue to pursue our acquisition strategy, and we will generally target one to two “bolt-on” acquisitions per year that will enhance our metal service center strategy. We believe that we are well positioned to take advantage of acquisition opportunities in the fragmented service center industry because of our flexible capital structure, which we have significantly improved over the twelve months ending September 30, 2009 by generating cash flow from operations of $404.5 million and from December 31, 2008 through September 30, 2009 by repurchasing $178.8 million face value of debt at a substantial discount in open market transactions.
Maintain and Strengthen Our Strong Relationships with Suppliers and Customers. As one of the largest metal service center businesses in the United States, we intend to use our relationships to leverage the opportunities presented by the consolidation of steel producers and the changing needs of our customers. Steel producers continue to seek long-term relationships with metal service centers that have access to numerous customers, while customers are seeking relationships with metal service centers that can provide a one stop, reliable source of both high-quality products and value-added services.
Continue Strong Focus on Inventory Management. We will continue managing our inventory to maximize our returns, profitability and cash flow while maintaining sufficient inventory to respond to customer demands. During the recent economic downturn we reinforced and strengthened our long-standing relationships with key suppliers, and as a result, we believe we will benefit from shorter lead times allowing us to operate with a lower investment in working capital going forward. In addition, we intend to further integrate our salespeople and operating employees into the operations of our customers to enhance our visibility into in-process orders and further improve our just-in-time delivery and customer service. Constant evaluation of our inventory management framework will allow us to continue supplying our customers reliably, even during periods of tight metal supply. We expect our inventory management framework will continue generating strong earnings during periods of rising metal prices and strong cash flow during periods of declining metal prices. Moreover, since industry wide service center inventories are near record low levels, we believe our inventory management framework will enable us to benefit disproportionately as compared to our competitors when end market demand begins to recover.
Maintain High Free Cash Flow Generation and Conversion. Senior management has implemented a strategy designed to maximize our profitability and cash flow. Part of this strategy included a $50 million annualized cost savings program we implemented over the twelve months ended September 30, 2009 that permanently reduces our cost structure. We believe this program will improve our ability to generate attractive margins and free cash flow throughout future economic cycles. We believe that we are a reliable supplier, especially of higher margin products and services, to our customers even in periods of tight supply. We believe that our reliability allows us to generate higher margins and more stable operating income through the business cycle. Moreover, we believe our inventory management framework, bolstered by our relationships with our metals suppliers, will stabilize earnings during periods of weakness. Our core business also requires minimal maintenance capital investment. We believe these strengths taken together underscore our ability to generate high levels of free cash flow, which will enable us to reinvest in our business, consummate future acquisitions, pay down debt, and achieve other corporate and financial objectives.
80
Table of Contents
Segment Information
Our product groups are led by members of our senior management teams, who, on average, have over 27 years of experience and are supported by finance, purchasing and sales and marketing staff. This product-oriented organizational structure facilitates the efficient advancement of our goals and objectives to achieve operational synergies and focused capital investment. For additional industry segment information, see “Management’s Discussion and Analysis of Financial Condition and Results of Operations—Results of Operations by Segment,” Note 13 to our consolidated financial statements for the year ended December 31, 2008 and Note 12 to our unaudited condensed consolidated financial statements for the nine months ended September 30, 2009, each included elsewhere in this prospectus.
Metal Processing/Metal Service Center Businesses: Plates and Shapes and Flat Rolled and Non-Ferrous Groups
Overview. Companies operating in the metals industry can generally be characterized as primary metal producers, metal processors/metal service centers or end-users. Our Plates and Shapes and Flat Rolled and Non-Ferrous Groups are metals processors/metal service centers. As such, we purchase carbon steel, stainless steel, aluminum, brass, copper and other metals from producing mills and then sell our metal processing services and the metal to our customers, who are generally end-users. We believe that both primary metals producers and end-users increasingly seek to have their metals processing and inventory management requirement met by value-added oriented metals processors/metal service centers like us.
Metal service centers function as key intermediaries between the primary metals producers that produce and sell larger volumes of metals in a limited number of sizes and configurations and end-users, such as fabricators, contractors and OEMs, that require smaller quantities of more customized products delivered on a just-in-time basis. End-users incorporate processed metals into finished products, in some cases with little further modification.
In our Plates and Shapes and Flat Rolled and Non-Ferrous Groups, we engage in pre-production processing of carbon steel, stainless steel, red metals and aluminum. We purchase metals from primary producers, maintain an inventory of various metals to allow rapid fulfillment of customer orders and perform customized processing services to the specifications provided by end-users and other customers. By providing these services, as well as offering inventory management and just-in-time delivery services, we enable our customers to reduce overall production costs and decrease capital required for raw materials inventory and metals processing equipment. The Plates and Shapes and Flat Rolled and Non-Ferrous Groups contributed approximately 94% of our 2008 net sales and the substantial majority of our 2008 operating income.
Plates and Shapes Group. The Plates and Shapes Group processes and sells steel plates and structural beams, bars, angles and tubes. We believe we are one of the largest distributors of steel plates and structural beams in the United States. In 2008, we sold approximately 837 thousand tons of products through 21 metal service centers located primarily in the southern and eastern regions of the United States. Our metal service centers are generally equipped to provide additional value-added processing, and a substantial portion of our volume is processed prior to being delivered to the end-user. These processing services include burning, blasting and painting (the process of cleaning steel plate by shot-blasting, then immediately applying a paint or primer), tee-splitting (the cutting of metal beams along the length to form separate pieces), cambering (the bending of structural shapes to improve load-bearing capabilities), leveling (the flattening of metals to uniform tolerances for proper machining), cutting, sawing, punching, drilling, beveling, surface grinding, braking (bending), shearing and cutting-to-length (the cutting of metals into pieces and along the width of a coil to create sheets or plates). We sell our products to a diversified customer base, including a large number of small
81
Table of Contents
customers who purchase products in small order sizes. We generally earn additional margin from our customers by providing services such as product marking, item sequencing, just-in-time delivery and kitting. The customers who require these products and services are primarily in the fabrication, commercial construction, machinery and equipment, land and marine transportation, and energy industries. Because our metal service centers are generally located in close proximity to our metal suppliers and our customers, we are able to meet our customers’ product and service needs reliably and consistently. In May 2006, we completed the acquisition of Port City, a higher value-added plate facility located in Tulsa, Oklahoma, which has bolstered our presence in the construction and oil-field services sectors. More recently in February 2009, we acquired substantially all of the operating assets of VR Laser, a metal processor of carbon plate products located in Philadelphia, PA, which has expanded our presence in the northeast region of the United States and augmented our presence in the marine and defense sectors.
Flat Rolled and Non-Ferrous Group. The Flat Rolled and Non-Ferrous Group processes and sells flat rolled carbon and stainless steel, aluminum, brass and copper in a number of alloy grades and sizes through 14 metal service centers located primarily in the mid-western and southern regions of the United States. We sold approximately 601 thousand tons of these products in 2008 split approximately 59% and 41% between ferrous products and non-ferrous products, respectively. Substantially all of the products from this group that are sold undergo value-added processing prior to shipment to our customers. These processing services include precision blanking (the process in which metal is cut into precise two-dimensional shapes), slitting (the cutting of coiled metals to specified widths along the length of the coil), shearing and cutting-to-length, punching and leveling. We sell our products and services to customers in the electrical and appliance manufacturing, fabrication, furniture, machinery and equipment, transportation and aerospace industries. Many of our large customers purchase through pricing arrangements or contractual agreements that specify the margin over the cost of metal and we generally earn additional margin from these customers by providing services such as product marking and labeling, just-in-time delivery and kitting. We are able to provide these services reliably because our metal service centers are generally located in close proximity to our metal suppliers and our customers. In July 2007, we acquired Lynch Metals, a metal service center business that provides additional value-added, specialized aluminum products to customers who are predominantly manufacturers of air/heat transfer products specifically focused on aerospace, industrial and automotive applications.
Industry Overview. Metal service centers and processors purchase approximately 35% of all the metals used in the U.S. and Canada and play an important intermediary role between the production mills and the end-users. Over the last several years primary metal producers have consolidated and focused on optimizing throughput and operating efficiencies of their production facilities. This has expanded the demand for metal service centers and processors to perform value-added services for end-users. As a result of the industry consolidation, most end-users cannot obtain processed products directly from primary metals producers, and therefore, over 300,000 OEMs, contractors and fabricators nationwide rely on metal service centers for their primary supply of metal products and services. End-users generally buy metal products and services from metal service centers on a margin over the base cost of the metal. When customers require additional processing or specific services, value-added metal service centers, including ours, earn an additional premium margin for the value-added processing elements they perform on base metal prior to delivering it to end-users.
OEMs and other end-users have also recognized the economic advantages associated with outsourcing their customized metals processing needs, which include (1) permitting end-users to reduce total production costs by shifting the responsibility of pre-production processing to metal service centers and (2) allowing OEMs and end-users to reduce inventories and focus on realizing value from additional inventory management measures. These supply-chain services, which are not normally provided by primary metals producers, enable end-users to reduce input costs, decrease inventory and equipment capital requirements and save time, labor and other expenses.
82
Table of Contents
We believe that long-term growth opportunities for metal service centers will continue to expand as both primary metal producers and end-users increasingly seek to have their metal processing and inventory management requirements met by value-added metal service centers. Although the service center industry remains fragmented with approximately 1,200 companies competing in North America, we believe larger and financially flexible companies, like ours, enjoy significant advantages over smaller companies such as obtaining higher discounts associated with volume purchases, servicing customers with operations in multiple locations, offering a broader range of products and services and utilizing more sophisticated information systems.
The metals production and distribution industries have experienced an increase in demand for steel and other metals in recent years driven largely by new market development in China, Brazil, India, Russia and Eastern Europe. Through the first half of 2008, demand growth outpaced supply inputs creating upward cost pressure on commodity inputs such as ores, energy and transportation. In early 2008, global steel prices were at record highs.
United States steel consumption has remained relatively constant from 2000 through 2007, averaging approximately 130 million tons annually. The global financial crisis that started during the third quarter of 2008 has caused a significant reduction in the consumption of steel world-wide (excluding China). In the United States, domestic steel demand has declined by almost half and is now expected to be approximately 60 million tons in 2009. Similar volume declines have occurred in virtually all developed economies. Service centers, distributors, and the rest of the supply chain have responded by aggressively reducing inventories. Through the first eight months of 2009, industry-based inventory metrics reported lowest-ever inventory levels during the 32 years that this data has been collected. Consequently, domestic steel producers have been reported as operating at levels below 50 percent capacity utilization.
Steel pricing dropped during the first six months of 2009 as steel producers continually reduced prices in the face of shrinking order backlogs. Since late June 2009, prices have been trending upwards as signs indicated an increase in global demand for steel and raw material inputs. Domestic demand also benefited from the government’s “Cash for Clunkers” program. We have seen a modestly improving trend in our order inquiry activity during the third quarter of 2009 and it appears, with the exception of non-residential construction, that steel demand may be entering a slow recovery stage. Even in a historically low demand environment, we believe rising price trends are sustainable if producers generate product commensurate with demand. The impact from federal stimulus legislation has not yet had a meaningful impact on the industry as actual spending continues to work through governmental channels. We believe that stimulus spending should have a meaningful impact on 2010 steel consumption and, in combination with basic economic recovery, domestic steel consumption should experience a year over year increase.
Products and Services. We purchase our raw materials in anticipation of projected customer requirements based on interaction with and feedback from customers, market conditions, historical usage and industry research. Primary producers typically find it more cost effective to focus on large volume production and sale of metals in standard sizes and configurations to large volume purchasers. We process the metals to the precise length, width, shape and surface quality specified by our customers. Our value-added processes include:
| Ÿ | Precision blanking—the process in which metal is cut into precise two-dimensional shapes. |
| Ÿ | Flame cutting—the cutting of metals to produce various shapes according to customer-supplied drawings. |
| Ÿ | Laser and plasma cutting—the cutting of metals to produce shapes under strict tolerance requirements. |
83
Table of Contents
| Ÿ | Slitting—the cutting of coiled metals to specified widths along the length of the coil. |
| Ÿ | Blasting and painting—the process of cleaning steel plate by shot-blasting, then immediately applying a paint or primer. |
| Ÿ | Plate forming and rolling—the forming and bending of plates to cylindrical or required specifications. |
| Ÿ | Shearing and cutting to length—the cutting of metals into pieces and along the width of a coil to create sheets or plates. |
| Ÿ | Tee-splitting—the cutting of metal beams along the length to form separate pieces. |
| Ÿ | Cambering—the bending of structural shapes to improve load-bearing capabilities. |
| Ÿ | Sawing—the cutting to length of bars, tubular goods and beams. |
| Ÿ | Leveling—the flattening of metals to uniform tolerances for proper machining. |
| Ÿ | Edge trimming—a process that removes a specified portion of the outside edges of coiled metal to produce uniform width and round or smooth edges. |
| Ÿ | Metallurgy—the analysis and testing of the physical and chemical composition of metals. |
Our additional capabilities include applications engineering and other value-added processes such as custom machining. Using these capabilities, we use processed metals to manufacture higher-value components.
Once we receive an order, we select the appropriate inventory and schedule it for processing in accordance with the customer’s requirements and specified delivery date. Orders are monitored by our computer systems, including, in certain locations, the use of bar coding to aid in and reduce the cost of tracking material. We record the source of all metal shipped to customers. This enables us to identify the source of any metal which may later be shown to not meet industry standards or that fails during or after manufacture. This capability is important to our customers as it allows them to assign responsibility for non-conforming or defective metal to the mill that produced the metal. Many of the products and services we provide can be ordered and tracked through a web-based electronic network that directly connects our computer system to those of our customers.
We cooperate with our customers and tailor our deliveries to support their needs, which in many instances consist of short lead times, multiple daily deliveries, staged deliveries, or deliveries timed for immediate production. These “just-in-time” deliveries are defined by our customers and are generally intended to minimize their inventory investment and handling requirements.
While we ship products throughout the United States, most of our customers are located within a 250-mile radius of our facilities, thus enabling an efficient delivery system capable of handling a large number of short lead-time orders. We transport most of our products directly to our customers either with our own trucks for short-distance and/or multi-stop deliveries or through common or contract trucking companies.
We have quality control systems to ensure product quality and traceability throughout processing. Quality controls include periodic supplier audits, customer-approved quality standards, inspection criteria and metals source traceability. Nineteen of our 35 metal service center facilities have International Standards Organization, or “ISO”, 9002 certification.
Building Products Group
Overview. The Building Products Group manufactures and sells roofing and patio products. We generally sell these products through a network of independent distributors and home improvement contractors. Our roofing products business manufactures and sells a high performance roofing product
84
Table of Contents
consisting of a pressed and stone-coated steel panel that mimics the appearance of traditional shake and tile roofing. Our roofing product is well suited for all areas subject to threats of high winds, fires and hail storms. In May 2006, we acquired Duraloc Roofing Systems, Ltd., a Canadian-based competitor which we have re-branded as Allmet Roofing Products. This acquisition provided us with manufacturing capabilities on both the east and west coasts of North America. Our patio products business manufactures and sells building components used primarily for the erection of residential shade structures such as patio covers and enclosures. With facilities located throughout the southern and western regions of the United States, we believe we are one of only a few suppliers of patio products with national scale.
Notwithstanding recent conditions in the United States housing sector, we believe some signs, such as increases in sales of new and existing homes, indicate an improving outlook for the housing sector. Moreover, we believe that factors including an historically low interest rate environment and an aging American housing stock are generating significant pent-up demand for remodeling that should manifest itself when the housing sector rebounds. We believe that these factors support a strong long-term outlook for residential remodeling as a cost-effective alternative to new housing construction.
Raw Materials and Supply
In recent years, steel, aluminum, copper and other metals production in the United States has fluctuated from period to period as mills attempt to match production to projected demand. Periodically, this has resulted in shortages of, or increased ordering lead-times for, some products, as well as fluctuations in price. Typically, metals producers announce price changes with sufficient advance notice to allow us to order additional products prior to the effective date of a price increase, or to defer purchases until a price decrease becomes effective. Our purchasing decisions are based on our forecast of the availability of metal products, ordering lead-times and pricing, as well as our prediction of customer demand for specific products.
We obtain the overwhelming majority of our metals from domestic suppliers, which include Nucor Corp., North American Stainless, AK Steel, Arcelor Mittal, Steel Dynamics, and Gerdau Ameristeel. Although we have historically purchased approximately 10% to 15% of our raw material supplies from foreign producers, domestic suppliers have always been, and we believe will continue to be, our principal source of raw material.
Although most forms of steel and aluminum produced by mills can be obtained from a number of integrated mills or mini-mills, both domestically and internationally, there are a few products that are available from only a limited number of producers. Since most metals are shipped free-on-board and the transportation of metals is a significant cost factor, we generally seek to purchase metals, to the extent possible, from the nearest mill.
Steel producers have been undergoing rapid consolidation over the past four years. U.S. Steel, Nucor Corp. and Arcelor Mittal have acquired several of their domestic competitors, and international integrated producers have merged and consolidated operations. The result of this trend will be fewer integrated producers from which we can purchase our raw materials. We believe that global consolidation of the metals industry is beneficial to the metals industry as a whole by enhancing efficiency.
Sales and Marketing; Customers
We employ a sales force consisting of internal and external salespeople. Internal salespeople are primarily responsible for maintaining customer relationships, receiving and soliciting individual orders and responding to service and other inquiries by customers. Our external sales force is primarily
85
Table of Contents
responsible for identifying potential customers and calling on them to explain our services. We believe that our sales force is trained and knowledgeable about the characteristics and applications of various metals, as well as the manufacturing methods employed by our customers.
Our sales and marketing focus is on the identification of OEMs and other metals end-users that could achieve significant cost savings through the use of our inventory management, value-added processing, just-in-time delivery and other services. We use a variety of methods to identify potential customers, including the use of databases, direct mail and participation in manufacturers’ trade shows. Customer referrals and the knowledge of our sales force about regional end-users also result in the identification of potential customers. Once a potential customer is identified, our outside salespeople assume responsibility for visiting the appropriate contact, typically the purchasing manager or manager of operations.
Nearly all sales are on a negotiated price basis. In some cases, sales are the result of a competitive bid process where a customer provides a list of products, along with requirements, to us and several competitors and we submit a bid on each product. We have a diverse customer base, with no single customer accounting for more than 4% of our net sales in each of the last three years. Our ten largest customers represented less than 13% of our net sales in 2008.
Competition
We are engaged in a highly fragmented and competitive industry. The United States and Canadian metal service center industry generated approximately $153 billion in 2008 revenues from approximately 1,200 different companies. Based on 2008 revenues the top 100 competitors represent approximately 47% of industry revenue. Metals USA is ranked ninth among this group based on 2008 revenues. Based on monthly shipment data as reported by the Metals Service Center Institute (“MSCI”), we believe we gained market share during 2008. According to MSCI data, industry shipments declined approximately 6.3% during 2008, whereas our volumes for 2008 remained in line with our shipments for the prior year.
Markets are generally oriented on a regional and local basis. We have numerous competitors in each of our product lines and geographic locations. In every market we service we compete with various combinations of other large, value-added oriented metals processor/metal service centers some of which may have greater financial resources than we have, smaller metals processors/metal service centers and, to a much lesser extent, with primary metals producers, who typically sell to very large customers requiring regular shipments of large volumes of metals.
We compete with other companies on price, service, quality and availability of products. Our sales and services decisions are decentralized, providing local management the flexibility to quickly address local market conditions. Historically, we believe we have been able to compete effectively because of our high levels of service, broad-based inventory, knowledgeable and trained sales force, integrated computer systems, modern equipment, numerous locations, geographic dispersion, operational economies of scale and combined purchasing volume. Furthermore, we believe our liquidity and overall financial position affords us a good platform with which to compete with our peers in the industry.
Government Regulation and Environmental Matters
Our operations are subject to a number of federal, state and local regulations relating to the protection of the environment and to workplace health and safety. In particular, our operations are subject to extensive federal, state and local laws and regulations governing waste disposal, air and water emissions, the handling of hazardous substances, environmental protection, remediation, workplace exposure and other matters. Hazardous materials we use in our operations include general
86
Table of Contents
commercial lubricants and cleaning solvents. Among the more significant regulated activities that occur at some of our facilities are: the accumulation of scrap metal, which is sold for recycling; the generation of plant trash and other solid wastes and wastewaters, such as water from burning tables operated at some of our facilities, which wastes are disposed of in accordance with the Federal Water Pollution Control Act and the Resource Conservation and Recovery Act using third-party commercial waste handlers; and the storage, handling, and use of lubricating and cutting oils and small quantities of maintenance-related products and chemicals, the health hazards of which are communicated to employees pursuant to Occupational Safety and Health Act-prescribed hazard communication efforts and the disposal or recycling of which are performed pursuant to the Resource Conservation and Recovery Act.
Generally speaking, our facilities’ operations do not involve the types of emissions of air pollutants, discharges of pollutants to land or surface water, or treatment, storage, or disposal of hazardous waste which would ordinarily require federal or state environmental permits. Some of our facilities possess authorizations for air emissions from paints and coatings, hazardous materials permits under local fire codes or ordinances for the storage and use of small quantities of combustible materials such as oils or paints, and state or local permits for on-site septic systems. Our cost of obtaining and complying with such permits has not been and is not anticipated to be material. Our operations are such that environmental regulations typically have not required us to make significant capital expenditures for environmental compliance activities.
We believe that we are in substantial compliance with all applicable environmental and workplace health and safety laws and do not currently anticipate that we will be required to expend any substantial amounts in the foreseeable future in order to meet such requirements. However, some of the properties we own or lease are located in areas with a history of heavy industrial use, and are near sites listed on the CERCLA National Priority List. CERCLA establishes joint and several responsibility for clean-up without regard to fault for persons who have arranged for disposal of hazardous substances at sites that have become contaminated and for persons who own or operate contaminated facilities. We have a number of properties located in or near industrial or light industrial use areas; accordingly, these properties may have been contaminated by pollutants which would have migrated from neighboring facilities or have been deposited by prior occupants. Some of our properties are affected by contamination from leaks and drips of cutting oils and similar materials. The costs of clean-ups to date have not been material. We are not currently subject to any claims or notices with respect to clean-up or remediation under CERCLA or similar laws for contamination at our leased or owned properties or at any off-site location. However, we cannot rule out the possibility that we could be notified of such claims in the future. It is also possible that we could be identified by the Environmental Protection Agency, a state agency or one or more third parties as a potentially responsible party under CERCLA or under analogous state laws.
Management Information Systems
Both the Plates and Shapes Group and Flat Rolled and Non-Ferrous Group metal service centers use a system marketed and distributed specifically for the metal service center industry. During 2003, we completed a similar common-platform initiative in the Building Products Group. Some of our subsidiaries currently use electronic data interchange, through which they offer customers a paperless process with respect to order entry, shipment tracking, billing, remittance processing and other routine activities. Additionally, several of our subsidiaries also use computer-aided drafting systems to directly interface with computer-controlled metals processing, resulting in more efficient use of material and time.
We believe investment in uniform management information systems and computer-aided manufacturing technology permits us to respond quickly and proactively to our customers’ needs and service expectations. These systems are able to share data regarding inventory status, order backlog, and other critical operational information on a real-time basis.
87
Table of Contents
Employees
As of September 30, 2009, we employed approximately 1,850 persons. As of September 30, 2009, approximately 176, or approximately 10% of our employees, at various sites were members of unions: the United Steelworkers of America; the Sheet Metals Workers Union; the International Association of Bridge, Structural, and Ornamental Ironworkers of America; and the International Brotherhood of Teamsters. Our relationship with these unions generally has been satisfactory. Within the last five years, we have not experienced any work stoppages at any of our facilities. We are currently a party to seven collective-bargaining agreements. One expires in 2009, five expire in 2010 and one expires in 2011. Presently, we do not anticipate any problems or issues with respect to renewing these agreements upon acceptable terms. Historically, we have succeeded in negotiating new collective bargaining agreements without a strike and we expect to succeed in negotiating new collective bargaining agreements with respect to the agreements that expire in 2009.
From time to time, there are shortages of qualified operators of metals processing equipment. In addition, during periods of low unemployment, turnover among less-skilled workers can be relatively high. We believe that our relations with our employees are satisfactory.
See “Risk Factors—Risks Related to Our Business—Our ability to retain our key employees is critical to the success of our business, and failure to do so may adversely affect our revenues and as a result could materially adversely affect our business, financial condition, results of operations and cash flows” and “Risk Factors—Risks Related to Our Business—Adverse developments in our relationship with our unionized employees could adversely affect our business.”
Vehicles
We operate a fleet of owned or leased trucks and trailers, as well as forklifts and support vehicles. We believe these vehicles are generally well maintained and adequate for our current operations.
Risk Management and Insurance
The primary risks in our operations are bodily injury, property damage and vehicle liability. We maintain general and vehicle liability insurance and liability insurance for bodily injury and property damage and workers’ compensation coverage, which we consider sufficient to protect us against a catastrophic loss due to claims associated with these risks.
Safety
Our goal is to provide an accident-free workplace. We are committed to continuing and improving upon each facility’s focus and emphasis on safety in the workplace. Our safety program includes regular weekly or monthly field safety meetings and training sessions to teach proper safety procedures. A comprehensive “best practices” safety program which has been implemented throughout our operations ensures that all employees comply with our safety standards, as well as those established by our insurance carriers, and federal, state and local laws and regulations. This program is led by the corporate office, with the assistance of each of our product group presidents, executive officers and industry consultants with expertise in workplace safety. We have experienced improvements in our safety record in three of the last four years. Furthermore, our annual bonus plan for our Chief Executive Officer, officers and managers is tied directly in part to our safety record.
Financial Information about Segments
For information regarding revenues from external customers, measures of profit or loss and total assets for the last three years for each segment, see “Management’s Discussion and Analysis of Financial Condition and Results of Operations—Results of Operations by Segment,” Note 13 to our
88
Table of Contents
consolidated financial statements for the year ended December 31, 2008 and Note 12 to our unaudited consolidated financial statements for the nine months ended September 30, 2009.
Patents, Trademarks and Other Intellectual Property Rights
We own several U.S. patents, trademarks, service marks and copyrights. Certain of the trademarks and patents are registered with the U.S. Patent and Trademark Office and, in some cases, with trademark offices of foreign countries. We consider other information owned by us to be trade secrets. We protect our trade secrets by, among other things, entering into confidentiality agreements with our employees and implementing security measures to restrict access to such information. We believe that our safeguards provide adequate protection to our proprietary rights. While we consider all of our intellectual property to be important, we do not consider any single intellectual property right to be essential to our operations as a whole.
Seasonal Aspects, Renegotiation and Backlog
There is a slight decrease in our business during the winter months because of inclement weather conditions and the impact on the construction industry. No material portion of our business is subject to renegotiation of profits or termination of contracts at the election of the government. Because of the just-in-time delivery policy and the short lead-time nature of our business, we do not believe the information on backlog of orders is material to an understanding of our business.
Foreign Operations
We do not derive any material revenue from foreign countries and do not have any material long-term assets or customer relationships outside of the United States. We have no material foreign operations or subsidiaries.
Research and Development
We do not incur material expenses in research and development activities but do participate in various research and development programs. We address research and development requirements and product enhancement by maintaining a staff of technical support, quality assurance and engineering personnel.
Legal Proceedings
From time to time, we are involved in a variety of claims, lawsuits and other disputes arising in the ordinary course of business. We believe the resolution of these matters and the incurrence of their related costs and expenses should not have a material adverse effect on our consolidated financial position, results of operations, liquidity or cash flows. While it is not feasible to predict the outcome of all pending suits and claims, the ultimate resolution of these matters as well as future lawsuits could have a material adverse effect on our business, financial condition, results of operations, cash flows or reputation.
Manufacturing and Facilities
Properties
As of September 30, 2009, we operated 20 metal service centers in the Plates and Shapes Group and 14 facilities in the Flat Rolled and Non-Ferrous Group. These facilities use various metals processing and materials handling machinery and equipment. As of the same date, our Building Products Group operated four manufacturing plants where we process metals into various building products and 23 sales centers. During the first quarter of 2009, we closed five facilities in our Building
89
Table of Contents
Products Group. We continue to serve the marketing areas of the closed facilities with our existing sales force by expanding the responsible territories of our other facilities, and through the use of common carriers for product delivery.
Many of our facilities are capable of being used at higher capacities, if necessary. We believe that our facilities will be adequate for the expected needs of our existing businesses over the next several years. Our metal service center facilities, Building Products sales centers and manufacturing plants, and administrative offices are located and described as follows:
OPERATING FACILITIES AS OF SEPTEMBER 30, 2009
| Location |
Square Footage |
Owned/Leased | ||||
| Plates and Shapes Group: |
||||||
| Northeast Plates and Shapes |
Baltimore, Maryland | 65,000 | Leased | |||
| Seekonk, Massachusetts | 115,000 | Owned | ||||
| Newark, New Jersey | 81,000 | Owned | ||||
| Langhorne, Pennsylvania | 235,000 | Leased | ||||
| Philadelphia, Pennsylvania | 85,000 | Owned | ||||
| Philadelphia, Pennsylvania | 109,000 | Leased | ||||
| York, Pennsylvania | 109,000 | Owned | ||||
| South Central Plates and Shapes |
Enid, Oklahoma | 112,000 | Owned | |||
| Tulsa, Oklahoma | 533,000 | Leased | ||||
| Muskogee, Oklahoma(1) | 229,000 | Owned | ||||
| Cedar Hill, Texas | 150,000 | Owned | ||||
| Mid-Atlantic Plates and Shapes |
Oakwood, Georgia | 206,000 | Owned | |||
| Greensboro, North Carolina | 180,000 | Owned | ||||
| Ohio Valley Plates and Shapes |
Canton, Ohio | 110,000 | Owned | |||
| Ambridge, Pennsylvania | 200,000 | Leased | ||||
| Southeast Plates and Shapes |
Mobile, Alabama | 246,000 | Owned | |||
| Jacksonville, Florida | 60,000 | Owned | ||||
| Waggaman, Louisiana | 371,000 | Owned | ||||
| Columbus, Mississippi | 45,000 | Owned | ||||
| Southwest Plates and Shapes |
Hayward, California | 64,000 | Leased | |||
| Flat Rolled and Non-Ferrous Group: |
||||||
| Anaheim, California | 22,000 | Leased | ||||
| Madison, Illinois | 100,000 | Owned | ||||
| Northbrook, Illinois | 187,000 | Owned | ||||
| Jeffersonville, Indiana | 90,000 | Owned | ||||
| Wichita, Kansas | 43,000 | Leased | ||||
| Walker, Michigan | 50,000 | Owned | ||||
| Liberty, Missouri | 117,000 | Leased | ||||
| Union, New Jersey | 39,000 | Leased | ||||
| Randleman, North Carolina | 154,000 | Owned | ||||
| Springfield, Ohio | 105,000 | Owned | ||||
| Wooster, Ohio | 140,000 | Owned | ||||
| Mesquite, Texas | 200,000 | Leased | ||||
| Germantown, Wisconsin | 102,000 | Owned | ||||
| Horicon, Wisconsin | 120,000 | Leased | ||||
90
Table of Contents
| Location |
Square Footage |
Owned/Leased | ||||
| Building Products Group: |
||||||
| Sales Centers |
Birmingham, Alabama |
12,000 | Leased | |||
| Phoenix, Arizona |
111,000 | Leased | ||||
| Hayward, California |
24,000 | Leased | ||||
| Ontario, California |
28,000 | Leased | ||||
| Rancho Cordova, California |
41,000 | Leased | ||||
| Clearwater, Florida |
20,000 | Leased | ||||
| Jacksonville, Florida |
17,000 | Leased | ||||
| Leesburg, Florida |
61,000 | Leased | ||||
| Pensacola, Florida |
48,000 | Leased | ||||
| Stone Mountain, Georgia |
14,000 | Leased | ||||
| Louisville, Kentucky |
22,000 | Leased | ||||
| Kansas City, Missouri |
16,000 | Leased | ||||
| Las Vegas, Nevada |
133,000 | Leased | ||||
| Oklahoma City, Oklahoma |
40,000 | Leased | ||||
| Irmo, South Carolina |
38,000 | Leased | ||||
| Nashville, Tennessee |
44,000 | Leased | ||||
| Dallas, Texas |
26,000 | Leased | ||||
| Houston, Texas |
155,000 | Leased | ||||
| Longview, Texas |
15,000 | Leased | ||||
| Mesquite, Texas |
55,000 | Leased | ||||
| Weslaco, Texas |
21,000 | Leased | ||||
| Salt Lake City, Utah |
23,000 | Leased | ||||
| Kent, Washington |
57,000 | Leased | ||||
| Manufacturing Plants |
Brea, California |
43,000 | Leased | |||
| Buena Park, California |
168,000 | Leased | ||||
| Groveland, Florida |
247,000 | Leased | ||||
| Courtland, Ontario |
32,000 | Owned | ||||
| Administrative Locations: |
||||||
| Corporate Headquarters |
Houston, Texas |
13,000 | Leased | |||
| Corporate Administration |
Fort Lauderdale, Florida |
4,500 | Leased | |||
| Building Products Group |
Houston, Texas |
13,000 | Leased | |||
| i-Solutions |
Ft. Washington, Pennsylvania |
4,000 | Leased | |||
| (1) | This facility is subject to liens with respect to specific debt obligations, including IRBs. |
91
Table of Contents
Our executive officers and directors as of the date of this prospectus are as follows. Each is a citizen of the U.S. unless otherwise indicated.
| Name |
Age | Position | ||
| Executive Officers: |
||||
| C. Lourenco Goncalves |
51 | President and Chief Executive Officer | ||
| Robert C. McPherson, III |
46 | Senior Vice President and Chief Financial Officer | ||
| Keith Koci |
45 | Senior Vice President—Business Development | ||
| Roger Krohn |
56 | President of the Flat Rolled and Non-Ferrous Group | ||
| David A. Martens |
57 | President of the Plates and Shapes Group—West | ||
| William A. Smith II |
41 | Vice President, General Counsel and Secretary | ||
| Directors: |
||||
| C. Lourenco Goncalves |
51 | Director, Chairman of the Board of Directors | ||
| Eric L. Press |
44 | Director | ||
| M. Ali Rashid |
33 | Director(1) | ||
| Matthew R. Michelini |
28 | Director | ||
| John T. Baldwin |
52 | Director(1) | ||
| (1) | Member of the Audit Committee of Metals USA. |
C. Lourenco Goncalves, 51, has been President and Chief Executive Officer and one of Metals USA’s directors since February 2003 and President, Chief Executive Officer and Chairman of Metals USA Holdings since May 1, 2006. Mr. Goncalves served as President and Chief Executive Officer of California Steel Industries, Inc. (“CSI”) from March 1998 to February 2003. From 1981 to 1998, he was employed by Companhia Siderúrgica Nacional (“CSN”), where he held positions as a managing director, general superintendent of Volta Redonda Works, hot rolling general manager, cold rolling and coated products general manager, hot strip mill superintendent, continuous casting superintendent and quality control manager. Mr. Goncalves earned a masters of science degree in metallurgical engineering from the Federal University of Minas Gerais and a bachelor’s degree in engineering from the Military Institute of Engineering in Rio de Janeiro, Brazil.
Robert C. McPherson, III, 46, became Senior Vice President of Metals USA on March 31, 2003, Chief Financial Officer of Metals USA on December 1, 2005 and Senior Vice President and Chief Financial Officer of Metals USA Holdings on May 1, 2006. From August 2004 through November 2005, Mr. McPherson was President of the Building Products Group of Metals USA and from March 2003 to August 2004, Mr. McPherson was Senior Vice President, Business Development of Metals USA. Prior to joining us, Mr. McPherson was employed at CSI from 1989 until March 2003. Mr. McPherson served in a number of capacities at CSI, most recently having served as Treasurer and Controller from 1996 until 2003, Assistant Treasurer from 1992 until 1996, and as Cash Management Administrator from 1989 until 1992.
Keith Koci, 45 became Senior Vice President of Business Development of Metals USA on December 1, 2005 and of Metals USA Holdings on May 1, 2006. Mr. Koci joined us in August 1998 as a regional controller in the Flat Rolled and Non-Ferrous Group, subsequently served as Corporate Director of Budgeting from August 2003 through May 2004, and then served as Vice President and Corporate Controller from May 2004 through November 2005. Mr. Koci is a certified public accountant licensed in the State of Texas. Prior to joining us, Mr. Koci was CFO and Controller for Optimum Nutrition Inc. from 1996 until 1998.
Roger Krohn, 56, became President of the Flat Rolled and Non-Ferrous Group of Metals USA in November of 2003 and is responsible for the operations of our Flat Rolled and Non-Ferrous Group.
92
Table of Contents
Mr. Krohn served as President of Krohn Steel Service Center from 1982 until 1998. After we acquired Krohn Steel Service Center in 1998, Mr. Krohn remained as President and General Manager of Metals USA until becoming President of the Flat Rolled and Non-Ferrous Group in November 2003. After attending college, Mr. Krohn served seven years as a pilot in the U.S. Air Force, commissioned as an officer in 1975.
David A. Martens, 57, became President of the Plates and Shapes Group—West of Metals USA in 2005 and is responsible for the operations of our Plates and Shapes Western Region. From 1999 through 2005, Mr. Martens was Vice President of Metals USA’s Plates and Shapes South Central Region. Mr. Martens was employed at Singer Steel, Inc. from 1978 until it was acquired by Uni-Steel, Inc. in 1987. Mr. Martens served in a number of capacities at Uni-Steel, a company later purchased by Metals USA, including Executive Vice President from 1992 to 1997, and President from 1997 to 1999.
William A. Smith II, 41, became Vice President and General Counsel of Metals USA Holdings Corp. on August 10, 2009, and Secretary of Metals USA Holdings Corp. on August 17, 2009. Prior to joining the Company, Mr. Smith was employed at Cross Match Technologies, Inc., where he served as Senior Vice President, General Counsel and Secretary from July 2005 to August 2008 and as Director of Corporate Development from September 2006 to August 2008. From June 1999 until June 2005, Mr. Smith was an associate and then a partner of the international law firm DLA Piper, where he specialized in corporate law. Prior to joining DLA Piper, Mr. Smith practiced law in Seoul, Korea, where he represented and counseled multinational corporations engaged in a variety of domestic and international commercial transactions. While in law school, Mr. Smith served as a legal intern with the Committee on Ways and Means of the U.S. House of Representatives. Mr. Smith received a JD from Georgetown University Law Center and an AB from Georgetown University. He is admitted to the bar in Maryland, Virginia and the District of Columbia.
Eric L. Press, 44, became a director of Metals USA Holdings on May 9, 2005 and a director of Metals USA on November 30, 2005. Mr. Press is a partner of Apollo. Prior to joining Apollo in 1998, Mr. Press was associated with the law firm of Wachtell, Lipton, Rosen & Katz, specializing in mergers, acquisitions, restructurings and related financing transactions. From 1987 to 1989, Mr. Press was a consultant with The Boston Consulting Group (BCG), a management consulting firm focused on corporate strategy. Mr. Press has been engaged in all aspects of Apollo’s lodging, leisure and entertainment investment activities, as well as Apollo’s investments in basic industries and financial services. Mr. Press serves on the boards of directors of Prestige Cruise Holdings, Affinion Group, Harrah’s Entertainment, Inc., Innkeepers USA Trust, Noranda Aluminum Holding Corporation, Apollo Commercial Real Estate Finance, Inc. and Athene Re. Mr. Press is a member of the Audit Committee and the Corporate Governance and Nominating Committee for Verso Paper Corp. He also serves on the Board of Trustees of the Rodeph Sholom School in New York City. Mr. Press graduated magna cum laude from Harvard College with an AB in Economics, and from Yale Law School, where he was a Senior Editor of the Yale Law Review.
M. Ali Rashid, 33, became a director of Metals USA Holdings on May 9, 2005 and of Metals USA on November 30, 2005. Mr. Rashid is a partner of Apollo. He has been employed with Apollo since 2000. Prior to that time, Mr. Rashid was employed by the Goldman Sachs Group in the Financial Institutions Group of its Investment Banking Division. Mr. Rashid serves on the board of directors of Noranda Aluminum Holdings Corporation, Quality Distribution and Realogy Corporation. Mr. Rashid received an MBA from the Stanford Graduate School of Business and graduated Magna Cum Laude and Beta Gamma Sigma from Georgetown University with a BS in Business Administration.
Matthew R. Michelini, 28, became a director of Metals USA Holdings on November 21, 2008. Mr. Michelini is an associate at Apollo. He joined Apollo in 2006. Prior to joining Apollo, Mr. Michelini was a member of the Mergers & Acquisitions group at Lazard Frères & Co. Mr. Michelini also serves on the Board of Directors of Noranda Aluminum Holding Corporation. Mr. Michelini graduated from Princeton University with a BS in Mathematics and a Certificate in Finance.
93
Table of Contents
John T. Baldwin, 52, became a director and Chairman of the Audit Committee of Metals USA Holdings on May 1, 2006 and a director of Metals USA on January 18, 2006. Mr. Baldwin served as Senior Vice President and Chief Financial Officer of Graphic Packaging Corporation from September 2003 to August 2005, and as Vice President and Chief Financial Officer of Worthington Industries, Inc. from December 1998 to September 2003. He joined Worthington, a steel processor, in 1997 as Treasurer. Prior to Worthington, Mr. Baldwin served in various financial capacities at Tenneco Inc. in Greenwich, Connecticut, London, England and Houston, Texas. Mr. Baldwin is a graduate of the University of Houston and the University of Texas School of Law. Mr. Baldwin served on the Board of The Genlyte Group Incorporated, a lighting manufacturer, from March 2003 through January 2008 at which time he resigned from such Board upon the company’s purchase by Koninklijke Philips Electronics N.V. in January, 2008, and was Chairman of the Audit Committee of The Genlyte Group Incorporated from April 2006 through January 2008.
There are no family relationships between any of our executive officers or directors.
The amended and restated investors rights agreement Metals USA Holdings expects to enter into with Apollo and each of our management members will provide that, within 180 days of the consummation of this offering, Apollo may nominate two additional members to our board of directors, and we will be required to increase the size of our board of directors at such time to nine and appoint such nominees to our board of directors. The amended and restated investors rights agreement will also provide that, except as otherwise required by applicable law, Apollo will have the right to nominate (a) four directors as long as Apollo owns (including shares of common stock issuable under the terms of any exchangeable securities issued by us) at least 30% but less than 50% of our outstanding common stock, (b) three directors as long as Apollo owns (including shares of common stock issuable under the terms of any exchangeable securities issued by us) at least 20% but less than 30% of our outstanding common stock and (c) two directors as long as Apollo owns (including shares of common stock issuable under the terms of any exchangeable securities issued by us) at least 10% but less than 20% of our outstanding common stock. In the event that the board of directors increases its size beyond nine members, Apollo’s nomination rights will be proportionately increased, rounded up to the nearest whole number. The amended and restated investors rights agreement will provide that, except as otherwise required by applicable law, we and the management members will take all action within their respective power to cause all such nominees to be included in the slate of nominees recommended by the board of directors to our stockholders for election as directors at each annual meeting of our stockholders and we will use all reasonable efforts to cause the election of each such nominee, including soliciting proxies in favor of the election of such nominees and appointing such nominees to fill vacancies. See “Certain Relationships and Related Party Transactions—Related Party Transactions—Amended and Restated Investors Rights Agreement” and “Description of Capital Stock—Composition of Board of Directors; Election and Removal of Directors.”
Code of Ethics
The Board has adopted a “code of ethics” as defined by the applicable rules of the SEC, which has been posted on our Internet website, http://www.metalsusa.com.
Director Independence
The board of directors under current New York Stock Exchange listing standards and taking into account any applicable committee standards, has determined that Mr. Baldwin is an independent director, including as a member of our audit committee. Under current New York Stock Exchange listing standards, Mr. Goncalves would not be considered independent under any general listing standards or those applicable to any particular committee due to his employment relationship with us, and Messrs. Rashid, Press and Michelini may not be considered independent under any general listing
94
Table of Contents
standards or those applicable to any particular committee, due to their relationship with Apollo, our largest stockholder. Upon completion of this offering Apollo will continue to own 50% or more of our common stock. Under New York Stock Exchange listing standards, we would qualify as a “controlled company” and, accordingly, be exempt from its requirements to have a majority of independent directors and a corporate governance and compensation committee composed of a majority of independent directors.
Audit Committee of the Board of Directors
Upon consummation of this offering, our audit committee will consist of Messrs. Baldwin, and . Our board of directors has determined that Mr. Baldwin qualifies as an “audit committee financial expert” as such term is defined in Item 407(d)(5) of Regulation S-K and that each of Messrs. Baldwin, and are independent as independence is defined in Rule 10A-3 of the Exchange Act and under the New York Stock Exchange listing standards.
The principal duties and responsibilities of our audit committee are to oversee and monitor the following:
| Ÿ | our financial reporting process and internal control system; |
| Ÿ | the integrity of our financial statements; |
| Ÿ | the independence, qualifications and performance of our independent auditor; |
| Ÿ | the performance of our internal audit function; and |
| Ÿ | our compliance with legal, ethical and regulatory matters. |
Compensation Committee
The current members of the compensation committee are Messrs. Press and Rashid. The principal duties and responsibilities of the compensation committee are as follows:
| Ÿ | to review, evaluate and make recommendations to our full board of directors regarding our compensation policies and establish performance-based incentives that support our long-term goals, objectives and interests; |
| Ÿ | to review and approve the compensation of our Chief Executive Officer, all employees who report directly to our Chief Executive Officer and other members of our senior management; |
| Ÿ | to review and make recommendations to our board of directors with respect to our incentive compensation plans and equity-based compensation plans; |
| Ÿ | to set and review the compensation of and reimbursement policies for members of our board of directors; |
| Ÿ | to provide oversight concerning selection of officers, expense accounts, indemnification and insurance matters, and separation packages; and |
| Ÿ | to prepare an annual compensation committee report, provide regular reports to our board of directors, and take such other actions as are necessary and consistent with the governing law and our organizational documents. |
We intend to avail ourselves of the “controlled company” exception under The New York Stock Exchange rules which exempts us from the requirement that we have a compensation committee composed entirely of independent directors.
95
Table of Contents
Nominating/Governance Committee
The current members of the nominating/corporate governance committee are Messrs. Rashid and Press. The principal duties and responsibilities of the nominating/corporate governance committee are as follows:
| Ÿ | to establish criteria for board and committee membership and recommend to our board of directors proposed nominees for election to the board of directors and for membership on committees of our board of directors; and |
| Ÿ | to make recommendations to our board of directors regarding board governance matters and practices. |
We intend to avail ourselves of the “controlled company” exception under The New York Stock Exchange rules which exempts us from the requirement that we have a nominating/governance committee composed entirely of independent directors.
Executive Committee
The current members of the executive committee are Messrs. Goncalves and Rashid. The principal duties and responsibilities of the executive committee are as follows:
| Ÿ | subject to applicable law, to exercise the powers and the duties of our board of directors between board meetings and while the board of directors is not in session; and |
| Ÿ | to implement the policy decisions of our board of directors. |
Compensation Discussion and Analysis
Overview of compensation program. Prior to February 9, 2007, including the entire year of 2006, the board of directors of Metals USA Holdings (currently consisting of the directors of Metals USA and Flag Intermediate), excluding Mr. Goncalves, made all compensation decisions, and as such had the responsibility of establishing and implementing, and monitoring compliance with the Company’s compensation philosophy. On February 9, 2007, the board of directors of Metals USA Holdings established a compensation committee to ensure that the total compensation and benefits paid to or provided to executives is reasonable, fair, and competitive (hereafter, said board of directors, excluding Mr. Goncalves, and the compensation committee (together with our board of directors where appropriate) are referred to as the “Compensation Committee”). We have also generally continued the compensation arrangements applicable to our executives that were entered into in connection with the Merger.
Compensation philosophy and objectives. The Compensation Committee believes an effective compensation program should be one that is designed to: attract and retain the best possible executive talent; tie annual and long-term cash and equity incentives to the achievement of measurable corporate, business unit and individual performance objectives; and align executives’ incentives with the creation of stockholder value. To achieve these objectives, the Compensation Committee implements, maintains and monitors compensation plans which tie a substantial portion of the executives’ overall compensation to the achievement of established objective goals, including profitability, workplace safety and the efficient use of capital.
Role of executive officers in compensation decisions. The Compensation Committee makes all compensation decisions for the Chief Executive Officer and all decisions relating to equity-based compensation awards. The Compensation Committee, together with recommendations and input from the Chief Executive Officer, makes non-equity compensation decisions with respect to the other executives.
96
Table of Contents
On an annual basis, the Compensation Committee reviews the performance of the Chief Executive Officer as compared with the achievement of the Company’s objective goals with respect to profitability, workplace safety and the efficient use of capital. The Compensation Committee, together with the Chief Executive Officer, annually reviews the performance of each individual executive as compared with the achievement of Company or operating division goals, as the case may be, together with each executive’s individual goals. The Compensation Committee can then exercise its discretion in making any adjustments or awards to the executives recommended by the Chief Executive Officer. Since 2006, the objective goals for each of the executive officers have paralleled those of the Chief Executive Officer.
Setting executive compensation. Based on the above objectives and philosophies, the Compensation Committee has established annual and long-term cash and equity compensation components to motivate the executives to achieve, and hopefully exceed, the business goals established by the Company and to fairly reward such executives for achieving such goals. The Compensation Committee has not retained a compensation consultant to review our policies and procedures with respect to executive compensation and has not engaged in any type of compensation benchmarking.
Components of Executive Compensation
For fiscal year ended December 31, 2008, the principal components of compensation for our executives are described below:
Base salary. We provide executives and other employees with base salary to compensate them for services rendered during the fiscal year. Base salaries are set to recognize the experience, skills, knowledge and responsibilities required of the executives in their respective roles. The executives’ current levels of base salary reflect their arms-length negotiations and agreements with the Company. Base salaries are reviewed annually and are adjusted from time to time to realign salaries to take into account individual responsibilities, performance and experience, including the terms of any agreements we have in place with such executive officers.
Performance-based executive incentive compensation plans. An Executive Incentive Compensation Plan (the “EICP”) was established by the board of directors of Metals USA Holdings in early 2006. The EICP establishes objectives for the calculation of annual cash bonuses for each executive, subject to Compensation Committee oversight and modification. The EICP provides for annual incentive bonuses which are intended to compensate officers for achieving or exceeding company and/or operating group financial and operational goals and for achieving individual annual performance goals. Incentives under the EICP are paid in cash and are typically paid in a single installment in the first quarter following the completion of a given fiscal year.
Target bonuses are 110% of base salary for Mr. Goncalves and 70% of base salary for each of Messrs. Hageman, McPherson, Krohn and Martens. The EICP uses a sliding scale applied to objective performance targets with corresponding achievement levels. For Messrs. Krohn and Martens, these performance metrics are split between the Company’s achievement and that of the operating group which they lead.
The performance metrics and target performance levels that were established under the EICP in respect of fiscal 2008 for each executive were based on the achievement of certain EBITDA and safety targets. Each executive was eligible to receive a bonus from zero to 1.8 times his target bonus. Target bonus as to 55% of each executive’s base salary (or 95%, in the case of Mr. Goncalves) was dependent on the achievement of EBITDA targets. For Messrs. Goncalves, McPherson and Hageman, those EBITDA targets were measured by Company performance, and for Messrs. Martens and Krohn those targets were measured in approximately equal parts by Company performance and by the
97
Table of Contents
performance of the Company’s Plates and Shapes Group and Flat Rolled and Non-Ferrous Group, respectively, which we refer to as the “Group EBITDA.” Target bonus as to 15% of each executive’s base salary was dependent on the achievement of safety goals (as measured by the Company’s Total Recordable Incident Rate calculated in accordance with Occupational Safety and Health Administration guidelines, which we refer to as “TRIR”), which, for Messrs. Martens and Krohn included the safety records of their respective Groups. The TRIR for a given period of time is equal to the total man hours worked during such period divided by 200,000 divided by the total number of “OSHA Recordable Injuries” (as defined by the Occupational Safety and Health Administration guidelines) incurred. Under the terms of the EICP, for purposes of the portion of annual bonus payable in respect of the safety metric, TRIR of 3 would result in a bonus of 100% of the safety metric target. For purposes of the portion of the annual bonus payable under the EICP in respect of EBITDA targets, Company EBITDA of $153.0 million (and, in the case of Messrs. Martens and Krohn, Group EBITDA of $30.7 million and $61.4 million) would have resulted in payment of 100% of the bonus target dependent on that metric. No bonus in respect of the safety or EBITDA performance metric was payable if minimum performance levels were not achieved. The Company paid bonuses under the EICP in respect of fiscal 2008 to each of Messrs. Goncalves, McPherson, Hageman, Martens and Krohn, the amounts of which are disclosed below in column (g) of the Summary Compensation Table.
For the Company’s fiscal year 2009, target annual bonus amounts continue to be 110% of base salary for Mr. Goncalves and 70% of base salary for Messrs. McPherson, Hageman, Martens and Krohn. The performance metrics under the EICP continue to be based as to 15% of base salary on achievement of TRIR safety targets and as to 55% of base salary (95%, in the case of Mr. Goncalves) on the achievement of Company EBITDA targets (and, in the case of Messrs. Martens and Krohn, Group EBITDA targets). Bonus potentials range from a low of zero with no upper limit. Two-thirds of the 2009 incentive payment attributable to achievement of Company EBITDA targets in fiscal 2009 will be paid in a single cash installment in the first quarter following completion of the fiscal year. The remaining one-third of the 2009 incentive payment attributable to achievement of Company EBITDA targets in fiscal 2009 is subject to achievement of additional Company EBITDA targets during the first six months of 2010. The Company expects that the target EBITDA level in respect of fiscal 2009 will be substantially more difficult to achieve than those in place under the EICP for fiscal 2008.
The Compensation Committee has reserved the right under the EICP to also pay “discretionary” bonuses. Such discretionary bonuses are paid if the Compensation Committee determines that a particular executive has exceeded the objectives and/or goals established for such executive or made a unique contribution to the Company during the year. In February 2009, a Supplemental Executive Incentive Compensation Plan (“Supplemental EICP”) was established for certain executive officers at the discretion of the Compensation Committee. The Supplemental EICP provides for a cash incentive bonus payable in February 2011, based upon the achievement of a cumulative EBITDA target for fiscal years 2009 and 2010. The maximum amount that can be earned collectively by all executive officers in the plan is $498,750 (consisting of a maximum of $150,000 for Mr. Goncalves, $75,000 for Mr. McPherson, $37,500 for Mr. Hageman, $56,250 for Mr. Krohn, $67,500 for Mr. Martens, and $112,500 for others). The maximum amounts were determined by the Compensation Committee on a discretionary basis. In order for any participant to achieve the maximum amount, cumulative EBITDA targets must be achieved for fiscal 2009 and 2010. If minimum cumulative EBITDA targets for fiscal years 2009 and 2010 are not achieved, there will be no cash payout.
Equity program; stock options and restricted stock. Under the 2005 Plan, the Compensation Committee may make various types of awards with respect to Metals USA Holdings’ common stock. Metals USA Holdings is a privately held company and its common stock, including any stock issued or obtained pursuant to the 2005 Plan, has transfer restrictions. The maximum amount of common stock that can be issued (or in respect of which awards can be issued) under the 2005 Plan is 1.4 million shares. Among other things, the Compensation Committee decides which of our executives, employees, directors or, with the consent of the Chief Executive Officer, consultants will receive
98
Table of Contents
awards under the 2005 Plan and the type of award made. In the case of stock options granted under the 2005 Plan, the Compensation Committee determines the strike price, vesting terms, and other applicable terms or conditions it may determine, in its sole discretion, provided such terms and conditions are allowed under the 2005 Plan. The 2005 Plan has two tranches of options: Tranche A and Tranche B. Tranche A options vest on a pro-rata basis over five years, have a term of ten years from date of grant, and expire if not exercised. Tranche B options, which include both a service and a performance condition, vest on the eighth anniversary of the date of grant or earlier depending on the achievement of certain performance targets, have a term of ten years from date of grant, and expire if not exercised. All of the awards of stock options and restricted stock granted to management under the 2005 Plan were granted on the effective date of the Merger, except for one. A March 17, 2006 award of stock options and restricted stock was received by Mr. Goncalves in connection with his exercise of certain of his options granted at the effective date of the Merger pursuant to the terms of such options. Awards granted to our board of directors were made in January 2006, at which time they were granted 40,000 non-qualified options to purchase shares of Metals USA Holdings’ common stock at fair market value which vest ratably over five years.
We do not have any program, plan or practice in place for selecting grant dates for awards under the 2005 Plan in coordination with the release of material non-public information. The exercise price for the option awards is the fair market value of the stock of Metals USA Holdings on the date of grant, subject to certain adjustments after the grant date to preserve the proportional interests of the awards in the event of a change in capitalization. The fair market value is determined using a combination of discounted cash flows and financial metrics from companies with similar characteristics of Metals USA Holdings. The Compensation Committee is not prohibited from granting awards at times when they are in possession of material non-public information. However, no inside information was taken into account in determining the number of options previously awarded or the exercise price for those awards, and we did not “time” the release of any material non-public information to affect the value of those awards.
The Compensation Committee believes that the granting of awards under the 2005 Plan promotes, on a short-term and long-term basis, an enhanced personal interest and alignment of interests of those executives receiving equity awards with the goals and strategies of the Company. The Compensation Committee also believes that the equity grants provide not only financial rewards to such executives for achieving Company goals but also provide additional incentives for executives to remain with the Company. While we do not have any formal policies regarding executive security ownership requirements or recovery of performance-based awards, our equity awards are generally subject to the restrictions set forth in the Investor Rights Agreement as described in “Certain Relationships and Related Party Transactions—Related Party Transactions—Investors Rights Agreement.”
In connection with the dividend of $25 million paid to our stockholders of record as of May 23, 2006, which we paid on May 24, 2006, which we refer to as the “May 2006 dividend,” and pursuant to the 2005 Plan’s provisions of rights preservation, the Compensation Committee modified the outstanding employee stock options by reducing the per share exercise price by $1.78 to $8.22 (to $8.89, in the case of Mr. Goncalves’ March 17, 2006 grant) in order to retain the participants’ rights proportionate with those prior to the dividend payment. In connection with the dividend paid to Metals USA Holdings’ stockholders in January 2007, the outstanding employee stock options under the 2005 Plan were adjusted a second time. The per share exercise price of the options granted on the effective date of the Merger was decreased by $4.22 to $4.00 and the per share exercise price of the options granted on March 17, 2006, to Mr. Goncalves was reduced by $4.89 to $4.00. Option holders received an amount equal to the excess of the per share amount of the dividend over the amount of such exercise price reduction as a cash payment with respect to shares underlying vested options and as a contribution to a non-qualified deferred compensation plan with respect to shares underlying unvested options, as more fully described below in the section entitled “—Non-qualified deferred compensation plan.” Because the payment of the second special dividend discussed above resulted in the 25%
99
Table of Contents
achievement of certain other performance targets, the Compensation Committee exercised its discretion under the 2005 Plan to vest all of the outstanding Tranche B options.
In connection with the dividend paid to Metals USA Holdings’ stockholders in July 2007, option holders received a cash payment equal to the per share amount of the dividend, approximately $9.25 per share subject to options, on all vested and unvested options held by the option holders.
Non-qualified deferred compensation plan. As discussed above in the section entitled “—Equity program; stock options and restricted stock,” in connection with the January 2007 dividend and vesting of certain Metals USA Holdings’ options, the reduction in the exercise price for outstanding options was less than the amount of the dividend per share. Accordingly, a deferred compensation plan was created and an amount approximately equal to the excess of the amount of the dividend per share over $4.22 (in the case of Mr. Goncalves, $4.89) was credited to a deferred compensation account under the plan for holders of unvested options in respect of each share underlying such options. Holders of vested options received such amount in cash. Payment of a total of $2.3 million to our senior management under the deferred compensation plan was subject to continued employment for two years following the modification date (January 3, 2007). Such amount was paid in January 2009, in accordance with the terms of the deferred compensation plan.
The Compensation Committee made contributions to the deferred compensation accounts of certain executive officers in 2008. The contributions were for the purpose of rewarding individual executive officers for their 2008 performance and for retention purposes. Total contributions amounted to $166,250, and are subject to continued employment through January 1, 2010. The Company contributed to the accounts of Messrs. Goncalves, McPherson, Hageman, Krohn, and Martens, the amounts of which are disclosed in column (d) of the Nonqualified Deferred Compensation Table. The amounts were determined by the Compensation Committee on a discretionary basis.
401(k) plan. Our executive officers are eligible to participate in our companywide 401(k) plan for salaried employees. The Company matches the first 2% of annual compensation contributed by the employees.
Perquisites and other personal benefits. We provide the executives, including other employees generally, with perquisites and other personal benefits that we and the Compensation Committee believe are reasonable, competitive and which are consistent with the overall compensation program to enable us to attract and retain qualified employees for key positions. The Compensation Committee periodically reviews the perquisites and other benefits provided to the executives, as well as the other employees.
Tax treatment. We consider the anticipated tax treatment of our executive compensation program when setting levels and types of compensation. Section 162(m) of the Internal Revenue Code of 1986, as amended, which we refer to as the “Code,” generally disallows a tax deduction to public companies for compensation paid to a company’s chief executive officer or any of its other four most highly compensated executive officers in excess of $1 million in any year, with certain performance-based compensation being specifically exempt from this deduction limit. Compensation received under the EICP is performance-based, and therefore qualifies for the exemption from the deduction limit. In addition, compensation received in connection with stock and stock option awards granted under the 2005 Plan is also performance-based, and qualifies for the exemption from the deduction limit. As such, during 2008, none of our employees subject to this limit received Section 162(m) of the Code compensation in excess of $1 million. Consequently, the requirements of Section 162(m) of the Code did not affect the tax deductions available to us in connection with our senior executive compensation program for 2008, and we do not expect such requirements to affect the tax deductions available to us in connection with our senior executive compensation program for 2009.
Conclusion. We believe that our compensation policies are designed to reasonably and fairly motivate, retain and reward our executives for achieving our objectives and goals.
100
Table of Contents
We have reviewed the Compensation Discussion and Analysis included in this Registration Statement on Form S-1, and we met and held discussions with the company’s management with respect to that portion of this Registration Statement on Form S-1. Based upon our review and discussions with management, we recommended to its Board of Directors the inclusion of the Compensation Discussion and Analysis appearing in this Registration Statement on Form S-1.
Respectfully submitted,
The Compensation Committee of the Board of Directors
M. Ali Rashid, Chairman
Eric L. Press
Compensation Tables
Summary Compensation Table
The table below summarizes the total compensation paid or earned by each of the named executive officers for the fiscal years ended December 31, 2008, 2007 and 2006. Amounts listed under the columns entitled “Bonus,” “Non-Equity Incentive Plan Compensation,” and “All Other Compensation” were determined and approved by the Board of Directors.
| (a) | (b) | (c) | (d) | (e) | (f) | (g) | (h) | (i) | |||||||||||||||
| Name and Principal Position |
Year | Salary | Bonus (1) |
Stock Awards (2) |
Option Awards (3) |
Non-Equity Incentive Plan Compensation (4) |
All Other Compensation (5) |
Total | |||||||||||||||
| C. Lourenco Goncalves |
2008 | $ | 625,000 | $ | 112,750 | $ | — | $ | 308,270 | $ | 1,172,250 | $ | 42,572 | $ | 2,260,842 | ||||||||
| President and Chief Executive Officer |
2007 | 600,000 | — | — | 1,649,989 | 540,916 | 5,918,878 | 8,709,783 | |||||||||||||||
| 2006 | 585,000 | 27,329 | 36,000 | 493,169 | 828,656 | 105,091 | 2,075,245 | ||||||||||||||||
| Robert C. McPherson, III |
2008 | 310,000 | — | — | 34,936 | 358,236 | 19,116 | 722,288 | |||||||||||||||
| Senior Vice President and Chief Financial Officer |
2007 | 300,000 | — | 25,208 | 185,900 | 178,295 | 804,514 | 1,493,917 | |||||||||||||||
| 2006 | 300,000 | — | 27,500 | 56,763 | 262,178 | 15,507 | 661,948 | ||||||||||||||||
| John A. Hageman(6) |
2008 | 300,000 | — | — | 50,558 | 346,680 | 36,022 | 733,260 | |||||||||||||||
| Senior Vice President and Chief Legal Officer |
2007 | 300,000 | — | — | 269,177 | 178,295 | 992,073 | 1,739,545 | |||||||||||||||
| 2006 | 290,000 | — | — | 82,191 | 253,438 | 37,017 | 662,646 | ||||||||||||||||
| Roger Krohn |
2008 | 280,000 | — | — | 32,744 | 327,497 | 18,762 | 659,003 | |||||||||||||||
| President Flat Rolled and Non-Ferrous Group |
2007 | 280,000 | — | 22,458 | 174,228 | 206,302 | 746,276 | 1,429,264 | |||||||||||||||
| 2006 | 280,000 | — | 24,500 | 53,199 | 247,848 | 15,612 | 621,159 | ||||||||||||||||
| David A. Martens |
2008 | 270,000 | 138,974 | — | 9,096 | 311,026 | 15,979 | 745,075 | |||||||||||||||
| President Plates and Shapes Group—West |
2007 | 260,000 | — | 7,333 | 48,400 | 213,082 | 227,227 | 756,042 | |||||||||||||||
| 2006 | 250,000 | 35,000 | 8,000 | 14,779 | 251,062 | 14,300 | 573,141 | ||||||||||||||||
| (1) | The amounts in column (d) reflect the amount attributable to annual bonus paid to the named executive officers based on the discretion of the Compensation Committee, which is discussed further under “—Compensation Discussion and Analysis” above. |
| (2) | The amounts in column (e) reflect the dollar amount recognized for financial reporting purposes for the fiscal years ended December 31, 2008, 2007 and 2006, in accordance with SFAS 123(R) of awards pursuant to our 2005 Plan, and thus, include amounts from awards granted in and prior to 2006. See Note 12 to our Consolidated Financial Statements for the fiscal year ended December 31, 2008 for further discussion of restricted stock awards. |
| (3) | The amounts in column (f) reflect the dollar amount recognized for financial reporting purposes for the fiscal year ended December 31, 2008, 2007 and 2006, in accordance with SFAS 123(R) of awards pursuant to our 2005 Plan, and thus, include amounts from awards granted in and prior to 2006. Assumptions used in the calculation of this amount for the fiscal year ended December 31, 2007 are included in Note 12 to our Consolidated Financial Statements. |
| (4) | The amounts in column (g) reflect the cash awards to the named executive officers under the EICP, which is discussed further under “—Compensation Discussion and Analysis” above. |
| (5) | The amounts in column (h) reflect the following for each named executive officer for the fiscal year ended December 31, 2008: |
| Name |
Total Perquisites and Personal Benefits | ||
| C. Lourenco Goncalves |
$ | 37,972 | |
| Robert C. McPherson, III |
14,516 | ||
| John A. Hageman |
31,422 | ||
| Roger Krohn |
14,162 | ||
| David A. Martens |
11,379 | ||
101
Table of Contents
Perquisites and personal benefits consist of the following:
| Ÿ | the amount attributable to company payments for personal use of automobiles; |
| Ÿ | the amounts attributable to company reimbursements for club dues payable by the named executive officer; |
| Ÿ | the amount of income taxes paid by the company on behalf of the named executive officer for automobile allowances and club dues; and |
| Ÿ | the amounts attributable to company reimbursements for medical insurance premiums and life insurance premiums. |
| None of the individual amounts attributable to each such perquisites or benefits exceeds the greater of $25,000 or 10% of the total amount of perquisites for each named executive officer. |
| (6) | On May 14, 2009, John A. Hageman resigned from his position as Senior Vice President and Chief Legal Officer of Metals USA Holdings Corp. effective as of the same date. |
Grants of Plan-Based Awards
| (a) | (b) | (c) | (d) | (e) | (f) | (g) | (h) | (i) | |||||||||||
| Grant Date |
Estimated Possible Payouts Under Non-Equity Incentive Plan Awards(1) |
All Other Stock Awards: Number of Shares of Stock or Units |
All Other Option Awards: Number of Securities Underlying Options |
Exercise or Base Price of Option Awards |
Grant Date Fair Value of Stock and Option Awards | ||||||||||||||
| Name |
Threshold | Target | Maximum | ||||||||||||||||
| C. Lourenco Goncalves |
— | $ | — | $ | 687,500 | $ | 1,218,750 | — | — | — | — | ||||||||
| Robert C. McPherson, III |
— | — | 217,000 | 381,300 | — | — | — | — | |||||||||||
| John A. Hageman |
— | — | 210,000 | 369,000 | — | — | — | — | |||||||||||
| Roger Krohn |
— | — | 196,000 | 344,400 | — | — | — | — | |||||||||||
| David A. Martens |
— | — | 189,000 | 332,100 | — | — | — | — | |||||||||||
| (1) | The amounts shown in column (c) reflect the minimum payment level under the Metals USA Holdings’s EICP for 2008, which was zero. The EICP did not have a maximum limit with respect to profitability objectives. For purposes of calculating the maximum presented in column (e), a 200% achievement level was assumed. It was not likely that a 200% achievement level would have been met, and for 2008, it was not met. These amounts are based on the individual’s current salary and position. See “Compensation Discussion and Analysis” above for further discussion. |
The 2005 Plan
In connection with the Merger, Metals USA Holdings adopted the 2005 Plan, which was amended and restated by Metals USA Holdings on January 18, 2006, under which Messrs. Goncalves, McPherson, Hageman, Krohn, Martens and other management participants are eligible to receive awards of stock options for common stock of Metals USA Holdings. Pursuant to option agreements entered into that are subject to the terms of the 2005 Plan, Messrs. Goncalves, McPherson, Hageman, Krohn and Martens have been granted options under the 2005 Plan, effective at the effective time of the Merger, and Mr. Goncalves was granted additional options under the 2005 Plan on March 17, 2006. The number of options to be granted to each of Messrs. Goncalves, McPherson, Hageman, Krohn and Martens and the date of vesting and pricing of such options are more fully described below under “—Management Agreements with Metals USA and Related Stock Option Grants from Metals USA Holdings.” Under the 2005 Plan, awards may be granted to employees or directors of, or consultants to, us, or any of our subsidiaries, except that consultants may only receive awards with the consent of our Chief Executive Officer. The 2005 Plan has a term of ten years. The date of grant, vesting and pricing of options granted under the 2005 Plan are subject to the discretion of the Compensation Committee. In addition, Messrs. Goncalves, McPherson, Hageman, Krohn and Martens and a limited number of other management participants have also received awards of restricted shares of common stock of Metals USA Holdings granted under the 2005 Plan. Messrs. Goncalves, McPherson, Hageman, Krohn and Martens have been granted 39,600, 5,500, 8,000, 4,900 and 1,600 restricted shares, respectively, pursuant to restricted stock agreements entered into at the effective time of the Merger that are subject to the terms of the 2005 Plan, all of which were fully vested as of December 31, 2008.
102
Table of Contents
See “—Compensation Discussion and Analysis” above and Note 12 to our Consolidated Financial Statements for a discussion of the 2005 Plan.
Management Agreements with Metals USA and Related Stock Option Grants from Metals USA Holdings
Each of Messrs. Goncalves, Hageman and McPherson has an employment agreement and each of Messrs. Krohn and Martens has a severance agreement with Metals USA.
Mr. Goncalves’ employment agreement. Under his employment agreement, Mr. Goncalves serves as Metals USA’s President and Chief Executive Officer for an initial term of five years following the effective date of the Merger. The initial term will automatically be renewed for successive one-year periods unless 90 days’ prior notice is given by either party. In addition, Mr. Goncalves is a member of our board of directors. He receives an annual base salary of $625,000.
In addition, pursuant to his employment agreement, Mr. Goncalves received two stock option grants at the effective time of the Merger to purchase shares of Metals USA Holdings’ common stock at an exercise price of $10.00 per share. The first grant was for options to purchase 407,960 shares of Metals USA Holdings’ common stock and expires ten years after the grant date. Pursuant to his stock option agreements, the options were classified as Tranche A options or Tranche B options. The Tranche A options cover 203,980 of the shares subject to the options, and 20% of these options vest and become exercisable on each of the first five anniversaries of the grant date, except that vesting will accelerate on the earlier of the one-year anniversary of a sale of the Company and a termination without “cause,” a resignation for “good reason” (in each case as defined in the employment agreement) or Mr. Goncalves’ death or disability after a sale of the Company. Tranche B includes the remaining 203,980 shares subject to this first grant of options and is currently fully vested. The second grant was for options to purchase 18,800 shares of Metals USA Holdings’ common stock and was fully vested as of the grant date and exercisable on or before March 30, 2006. Mr. Goncalves exercised his options subject to the second grant on March 17, 2006. Pursuant to his option agreement, upon the exercise of the second grant on March 17, 2006, Mr. Goncalves received an additional grant of options to purchase 40,790 shares of Metals USA Holdings’ common stock at an exercise price of $10.67 per share. These additional options are allocated equally into Tranches A and B. The Tranche A options are subject to similar vesting specifications as the first grant of Tranche A options to purchase 407,960 shares of Metals USA Holdings discussed above, and the second grant of Tranche B options is fully vested.
In connection with the May 2006 dividend, the exercise price of the employee stock options granted on the effective time of the Merger was reduced to $8.22 and the exercise price of the options granted on March 17, 2006 was reduced to $8.89. In connection with the January 2007 dividend, the exercise price of the outstanding employee stock options under the 2005 Plan was adjusted a second time. The per share exercise price of the options granted on the effective time of the Merger was decreased by $4.22 to $4.00 and the per share exercise price of the options granted on March 17, 2006, was reduced by $4.89 to $4.00. With respect to his vested options, a cash payment was made to Mr. Goncalves approximating the excess of the dividend amount over the amount of such exercise price reduction (including as to all Tranche B options, which were vested in our board of directors’ discretion based on the achievement of the related performance metrics). With respect to his unvested options, an amount approximating the balance of the dividend was credited to a deferred compensation account, distribution of which was subject to continued employment through January 3, 2009, and which amount was paid in January 2009. In connection with the July 2007 dividend, Mr. Goncalves received on all of his vested and unvested options a cash payment of $9.25 per share underlying such options, an amount equal to the per share amount of the dividend. In addition, Mr. Goncalves received a grant of 36,000 restricted shares at the effective time of the Merger and an
103
Table of Contents
additional 3,600 upon the exercise of the options to purchase 18,800 shares discussed above, which vested immediately. Under the employment agreement, Mr. Goncalves is provided employee benefits equal to or greater than those provided to him by us prior to the Merger. Upon Mr. Goncalves’ termination of employment by us “without cause” or by Mr. Goncalves for “good reason” (in each case, as defined in the award agreement) or upon our election not to renew his employment, Mr. Goncalves will be entitled to receive the following severance payments and benefits: all accrued salary and bonus earned but not yet paid, a pro rata bonus for the year in which the termination occurs based on actual performance, a lump sum payment equal to twelve months of his base salary, monthly payments equal to one-twelfth of his annual base salary beginning with the thirteenth month following the date of his termination of employment, until the twenty-fourth month following his date of termination of employment (or on the earlier date in the event of material violation of the terms of his employment agreement by Mr. Goncalves), and the reimbursement for the cost of COBRA Continuation coverage for a period of up to eighteen months. Additionally, Mr. Goncalves will be subject to certain restrictions on his ability to compete with us or solicit our customers or employees for two years after his termination. Mr. Goncalves’ employment agreement may also be terminated for cause.
Mr. Hageman’s employment agreement. Under his employment agreement, Mr. Hageman served as our Senior Vice President and Chief Legal Officer and administrative officer for an initial term of two years following the effective time of the Merger, which initial term was automatically renewed for successive one-year periods pursuant to the employment agreement. Under the employment agreement, Mr. Hageman received an annual base salary of $300,000 and was eligible for an annual bonus of 70% of his base salary if we achieved specified performance objectives.
In addition, at the effective time of the Merger, Mr. Hageman received a stock option grant to purchase 73,000 shares of Metals USA Holdings’ common stock at an exercise price of $10.00 per share that expires ten years after the grant date. Pursuant to his non-qualified stock option agreement, 36,500 of these options were classified as Tranche A Options and 20% of these options were to vest and become exercisable on each of the first five anniversaries of the grant date, except that vesting would accelerate on the earlier of the one year anniversary of our sale and a termination “without cause”, a resignation for “good reason” (in each case, as defined in the award agreement) or Mr. Hageman’s death or disability after our sale. The remaining 36,500 options were classified as Tranche B Options and are currently fully vested.
In connection with the May 2006 dividend, the exercise price of the employee stock options was reduced to $8.22. In connection with the January 2007 dividend, the exercise price of the outstanding employee stock options under the 2005 Plan was adjusted a second time. The per share exercise price of the options granted on the effective time of the Merger was decreased by $4.22 to $4.00. With respect to his vested options, a cash payment was made to Mr. Hageman approximating the balance of the dividend (including all Tranche B options, which were vested in the board of directors’ discretion based on the achievement of the related performance metrics). With respect to his unvested options, an amount approximating the excess of the amount of the dividend over the amount of such exercise price reduction was credited to a deferred compensation account, distribution of which was subject to continued employment through January 3, 2009, and which amount was paid in January 2009. In connection with the July 2007 dividend, Mr. Hageman received on all of his vested and unvested options a cash payment of $9.25 per share underlying such options, an amount equal to the per share amount of the dividend. In addition, Mr. Hageman received a grant of 8,000 restricted shares on the effective date of the Merger, which vested immediately.
Under the employment agreement, Mr. Hageman was provided employee benefits equal to those provided to him by us prior to the Merger. Upon his termination of employment by us without “cause” or by Mr. Hageman for “good reason” (each as defined in the employment agreement), or upon our election not to renew his employment, the employment agreement provided that Mr. Hageman would be entitled to the following severance payments and benefits: all accrued salary and bonus earned but not paid, a pro rata bonus for the year in which the termination occurs, his annual base salary for a
104
Table of Contents
period of eighteen months following his termination of employment or, at our election, a lump sum payment equal to eighteen months of annual base salary (such payments to cease (or be repaid by Mr. Hageman on a pro rata basis in the case of a lump sum payment) if he violates the terms of his employment agreement prior to such time), and the reimbursement for the cost of COBRA Continuation coverage for a period of up to eighteen months. Additionally, the employment agreement provided Mr. Hageman will be subject to certain restrictions on his ability to compete with us for eighteen months or solicit our customers or employees for two years after his termination of employment.
Mr. Hageman’s separation agreement and general release. On May 14, 2009, Mr. Hageman resigned from his position as Senior Vice President and Chief Legal Officer of Metals USA Holdings Corp. effective as of the same date. In connection with his resignation, Mr. Hageman entered into a separation agreement and general release. Pursuant to such separation agreement and general release, Mr. Hageman is receiving 18 months of base salary, a pro-rata portion of his 2009 annual bonus, if any, based on actual performance, and reimbursement of the cost of COBRA continuation coverage for up to 18 months. In addition, the separation agreement provides that Mr. Hageman’s unvested stock options will be forfeited as of his resignation date pursuant to their terms. Under the separation agreement, Mr. Hageman will be subject to certain restrictions on his ability to compete with us for eighteen months or solicit our customers or employees for two years after his termination of employment.
Mr. McPherson’s employment agreement. Under his employment agreement, Mr. McPherson serves as our Senior Vice President and Chief Financial Officer for an initial term of two years following the effective time of the Merger. The initial term will automatically be renewed for successive one-year periods unless 90 days’ prior notice is given by either party. Mr. McPherson receives an annual base salary of $310,000 and is eligible for an annual bonus of 70% of his base salary if we achieve specified performance objectives.
In addition, at the effective date of the Merger, Mr. McPherson received a stock option grant to purchase 50,415 shares of Metals USA Holdings’ common stock at an exercise price of $10.00 per share that expires ten years after the grant date. Pursuant to his non-qualified stock option agreement, 25,207 of these options are classified as Tranche A Options, and 20% of these options will vest and become exercisable on each of the first five anniversaries of the grant date, except that vesting will accelerate on the earlier of the one year anniversary of our sale and a termination “without cause”, a resignation for “good reason” or (in each case, as defined in the award agreement) Mr. McPherson’s death or disability after our sale. The remaining 25,208 options are classified as Tranche B Options and are currently fully vested.
In connection with the May 2006 dividend, the exercise price of the employee stock options was reduced to $8.22. In connection with the January 2007 dividend, the exercise price of the outstanding employee stock options under the 2005 Plan was adjusted a second time. The per share exercise price of the options granted on the effective time of the Merger was decreased by $4.22 to $4.00. With respect to his vested options, a cash payment was made to Mr. McPherson approximating the excess of the amount of the dividend over the amount of such exercise price reduction (including all Tranche B options, which were vested in the board of directors’ discretion based on the achievement of the related performance metrics). With respect to his unvested options, an amount approximating the balance of the dividend was credited to a deferred compensation account, distribution of which was subject to continued employment through January 3, 2009, and which amount was paid in January 2009. In connection with the July 2007 dividend, Mr. McPherson received on all of his vested and unvested options a cash payment of $9.25 per share underlying such options, an amount equal to the per share amount of the dividend.
105
Table of Contents
In addition, on the effective date of the Merger, Mr. McPherson received a grant of 5,500 restricted shares, which shares vested on the second anniversary of the Merger. Mr. McPherson is provided employee benefits equal to those provided to him by us prior to the Merger.
Upon Mr. McPherson’s termination of employment by us without “cause” or by Mr. McPherson for “good reason” (each as defined in the employment agreement) or upon our election not to renew his employment, Mr. McPherson will be entitled to receive the same severance payments as set forth in Mr. Hageman’s employment agreement and described above. Additionally, Mr. McPherson will be subject to certain restrictions on his ability to compete with us for eighteen months or solicit our customers or employees for two years after his termination of employment. Mr. McPherson’s employment agreement may also be terminated for cause.
Mr. Krohn’s severance agreement. Under his severance agreement, upon his termination of employment by us without “cause” or by Mr. Krohn for “good reason” (in each case, as defined in the severance agreement), Mr. Krohn will be entitled to the following severance payments and benefits: his annual base salary for a period of twelve months following his termination of employment (such payments to cease if he violates any material terms of his severance agreement prior to such time) and the reimbursement for the cost of COBRA Continuation coverage for a period of up to twelve months. Additionally, Mr. Krohn will be subject to certain restrictions on his ability to compete with us for one year (two years if his employment is terminated for cause or he resigns without good reason) and to solicit our customers or employees for two years after his termination.
In addition, pursuant to a stock option agreement with Metals USA Holdings, Mr. Krohn received a stock option grant on the effective time of the Merger at the effective time of the Merger, to purchase 47,250 shares of Metals USA Holdings’ common stock at an exercise price of $10.00 per share that expires ten years after the grant date. Pursuant to his non-qualified stock option agreement, 23,625 of these options are classified as Tranche A Options, 20% of which vest and become exercisable on each of the first five anniversaries of the grant date, except that vesting will accelerate upon our sale. The remaining 23,625 options are classified as Tranche B Options and are currently fully vested.
In connection with the May 2006 dividend, the exercise price of the stock options was reduced to $8.22. In connection with the January 2007 dividend, the exercise price of the outstanding employee stock options under the 2005 Plan was adjusted a second time. The per share exercise price of the options granted on the effective time of the Merger was decreased by $4.22 to $4.00. With respect to his vested options, a cash payment was made to Mr. Krohn approximating the excess of the amount of the dividend over the amount of such exercise price reduction (including all Tranche B options, which were vested in the Board’s discretion based on the achievement of the related performance metrics). With respect to his unvested options, an amount approximating the balance of the dividend was credited to a deferred compensation account, distribution of which was subject to continued employment through January 3, 2009, and which amount was paid in January 2009. In connection with the July 2007 dividend, Mr. Krohn received on all of his vested and unvested options a cash payment of $9.25 per share underlying such options, an amount equal to the per share amount of the dividend.
Further, pursuant to a restricted stock agreement with Metals USA Holdings, on the effective date of the Merger, Mr. Krohn received a grant of 4,900 restricted shares, which shares vested on the second anniversary of the Merger.
Mr. Martens’ severance agreement. Under his severance agreement, upon his termination of employment by us without “cause” or by Mr. Martens for “good reason” as those terms are defined in the severance agreement, Mr. Martens will be entitled to the following severance payments and benefits: his annual base salary for a period of twelve months following his termination of employment (such payments to cease if he violates any material terms of his severance agreement prior to such time) and the reimbursement for the cost of COBRA Continuation coverage for a period of up to twelve
106
Table of Contents
months. Additionally, Mr. Martens will be subject to certain restrictions on his ability to compete with us for one year (two years if his employment is terminated for cause or he resigns without good reason) and to solicit our customers or employees for two years after his termination.
In addition, pursuant to a stock option agreement with Metals USA Holdings, Mr. Martens received a stock option grant, at the effective time of the Merger, to purchase 13,126 shares of Metals USA Holdings’ common stock at an exercise price of $10.00 per share that will expire ten years after the grant date. Pursuant to his non-qualified stock option agreement, 6,563 of these options are classified as Tranche A Options, 20% of which will vest and become exercisable on each of the first five anniversaries of the grant date, except that vesting will accelerate upon our sale. The remaining 6,563 options are classified as Tranche B Options and are currently fully vested.
In connection with the May 2006 dividend, the exercise price of the employee stock options was reduced to $8.22. In connection with the January 2007 dividend, the exercise price of the outstanding employee stock options under the 2005 Plan was adjusted a second time. The per share exercise price of the options granted on the effective time of the Merger was decreased by $4.22 to $4.00. With respect to his vested options, a cash payment was made to Mr. Martens approximating the excess of the amount of the dividend over the amount of such exercise price reduction (including all Tranche B options, which were vested in the Board’s discretion based on the achievement of the related performance metrics). With respect to his unvested options, an amount approximating the balance of the dividend was credited to a deferred compensation account, distribution of which was subject to continued employment through January 3, 2009, and which amount was paid in January 2009. In connection with the July 2007 dividend, Mr. Martens received on all of his vested and unvested options a cash payment of $9.25 per share underlying such options, an amount equal to the per share amount of the dividend.
Further, pursuant to a restricted stock agreement with Metals USA Holdings, on the effective date of the Merger, Mr. Martens received a grant of 1,600 restricted shares, which shares vested on the second anniversary of the Merger.
Bonus Plan
See “—Compensation Discussion and Analysis” for a discussion of our EICP.
Outstanding Equity Awards at Fiscal Year-End
| (a) | (b) | (c) | (d) | (e) | (f) | (g) | ||||||
| Option Awards(1) | Stock Awards | |||||||||||
| Name |
Number of Securities Underlying Unexercised Options— Exercisable |
Number of Securities Underlying Unexercised Options— Unexercisable |
Option Exercise Price |
Option Expiration Date |
Number of Shares or Units of Stock That Have Not Vested |
Market Value of Shares or Units of Stock That Have Not Vested | ||||||
| C. Lourenco Goncalves |
354,921 | 93,829 | 4.00 | 11/30/2015 | — | — | ||||||
| Robert C. McPherson, III |
40,333 | 10,082 | 4.00 | 11/30/2015 | — | — | ||||||
| John A. Hageman |
58,400 | 14,600 | 4.00 | 11/30/2015 | — | — | ||||||
| Roger Krohn |
37,800 | 9,450 | 4.00 | 11/30/2015 | — | — | ||||||
| David A. Martens |
10,502 | 2,624 | 4.00 | 11/30/2015 | — | — | ||||||
| (1) | See Note 12 to our Consolidated Financial Statements for the fiscal year ended December 31, 2008 for a description of Metals USA Holdings’ share option and restricted stock plans, including the vesting schedule. |
107
Table of Contents
Option Exercises and Stock Vesting
| (a) | (b) | (c) | (d) | (e) | ||||||
| Option Awards(1) | Stock Awards(1) | |||||||||
| Name |
Number of Shares Acquired on Exercise |
Value Realized on Exercise |
Number of Shares Acquired on Vesting |
Value Realized on Vesting | ||||||
| C. Lourenco Goncalves |
— | $ | — | — | $ | — | ||||
| Robert C. McPherson, III |
— | — | — | — | ||||||
| John A. Hageman |
— | — | — | — | ||||||
| Roger Krohn |
— | — | — | — | ||||||
| David A. Martens |
— | — | — | — | ||||||
| (1) | There were no stock option exercises by the named executive officers during the fiscal year ended December 31, 2008. There were no shares of restricted stock outstanding during the fiscal year ended December 31, 2008. |
Nonqualified Deferred Compensation
The table below sets forth, for each named executive officer, such officer’s participation levels and account balance in our non-qualified deferred compensation plan for 2008.
| (a) | (b) | (c) | (d) | (e) | (f) | (g) | ||||||||||||
| Name |
Aggregate Balance at 2007 Fiscal Year End |
Executive Contributions in Fiscal 2008 |
Registrant Contributions in Fiscal 2008(1) |
Aggregate Earnings in Fiscal 2008 |
Aggregate Withdrawals/ Distributions in Fiscal 2008(2) |
Aggregate Balance at 2008 Fiscal Year End | ||||||||||||
| C. Lourenco Goncalves |
$ | 1,190,614 | $ | — | $ | 50,000 | $ | — | $ | — | $ | 1,240,614 | ||||||
| Robert C. McPherson, III |
132,282 | — | $ | 25,000 | — | — | $ | 157,282 | ||||||||||
| John A. Hageman |
191,552 | — | $ | 12,500 | — | — | $ | 204,052 | ||||||||||
| Roger Krohn |
123,984 | — | $ | 18,750 | — | — | $ | 142,734 | ||||||||||
| David A. Martens |
34,440 | — | $ | 22,500 | — | — | $ | 56,940 | ||||||||||
| (1) | 2008 contributions are subject to continued employment through January 1, 2010. |
| (2) | The amounts in column (b) were paid to each of the named executives in January 2009 pursuant to the distribution of the January 2007 deferred dividend amounts. |
108
Table of Contents
Potential Payments Upon Termination or Change in Control
Our employment and severance agreements are described under the “Grants of Plan-Based Awards” table above.
If (1) each of our named executive officers terminated his employment for “good reason” or was terminated other than for “cause,” death or disability, or (with respect to those executives with employment agreements) if we elected not to renew their employment agreements, or (2) each of our named executive officers was terminated as a result of death or disability, as of December 31, 2008, our named executive officers would be paid the following amounts, respectively:
| Good
Reason Termination or Involuntary without Cause Termination on December 31, 2008 |
Death or Disability on December 31, 2008 | |||||
| C. Lourenco Goncalves: |
||||||
| Compensation |
||||||
| Accrued Salary |
$ | 7,212 | $ | 7,212 | ||
| Accrued Bonus (EICP) |
1,285,000 | 1,285,000 | ||||
| Lump Sum Salary (12 months) |
625,000 | 625,000 | ||||
| Lump Sum Salary—Death (24 months) |
— | 1,250,000 | ||||
| Monthly Salary (12 months) |
625,000 | — | ||||
| Benefits and Perquisites |
||||||
| 401(k) Savings Plan |
15,933 | 15,933 | ||||
| Health and Welfare Benefits |
24,084 | 24,084 | ||||
| Disability Income(1) |
— | 1,966,774 | ||||
| Life Insurance Benefits(2) |
— | 400,000 | ||||
| Accrued Vacation Pay |
31,310 | 31,310 | ||||
| Robert C. McPherson, III: |
||||||
| Compensation |
||||||
| Accrued Salary |
$ | 3,577 | $ | 3,577 | ||
| Accrued Bonus (EICP) |
358,236 | 358,236 | ||||
| Lump Sum Salary (12 months) |
— | 310,000 | ||||
| Monthly Salary (18 months) |
465,000 | — | ||||
| Benefits and Perquisites |
||||||
| 401(k) Savings Plan |
332 | 332 | ||||
| Health and Welfare Benefits |
24,084 | 24,084 | ||||
| Disability Income(1) |
— | 2,392,986 | ||||
| Life Insurance Benefits(2) |
— | 400,000 | ||||
| Accrued Vacation Pay |
7,184 | 7,184 | ||||
| John A. Hageman: |
||||||
| Compensation |
||||||
| Accrued Salary |
$ | 3,462 | $ | 3,462 | ||
| Accrued Bonus (EICP) |
346,680 | 346,680 | ||||
| Lump Sum Salary (12 months) |
— | 300,000 | ||||
| Monthly Salary (18 months) |
450,000 | — | ||||
| Benefits and Perquisites |
||||||
| 401(k) Savings Plan |
26,175 | — | ||||
| Health and Welfare Benefits |
24,084 | 24,084 | ||||
| Disability Income(1) |
— | 1,555,837 | ||||
| Life Insurance Benefits(2) |
— | 400,000 | ||||
| Accrued Vacation Pay |
9,260 | 9,260 | ||||
109
Table of Contents
| Voluntary Termination or Involuntary without Cause Termination on December 31, 2008 |
Death or Disability on December 31, 2008 | |||||
| Roger Krohn: |
||||||
| Compensation |
||||||
| Accrued Salary |
$ | 5,385 | $ | 5,385 | ||
| Accrued Bonus (EICP) |
327,497 | 327,497 | ||||
| Monthly Salary (12 months) |
280,000 | — | ||||
| Benefits and Perquisites |
||||||
| 401(k) Savings Plan |
166,225 | 166,225 | ||||
| Health and Welfare Benefits |
15,538 | 15,538 | ||||
| Disability Income(1) |
— | 1,345,829 | ||||
| Life Insurance Benefits(2) |
— | 400,000 | ||||
| Accrued Vacation Pay |
— | — | ||||
| David A. Martens: |
||||||
| Compensation |
||||||
| Accrued Salary |
$ | 8,308 | $ | 8,308 | ||
| Accrued Bonus (EICP) |
450,000 | 450,000 | ||||
| Monthly Salary (12 months) |
270,000 | — | ||||
| Benefits and Perquisites |
||||||
| 401(k) Savings Plan |
314,289 | 314,289 | ||||
| Health and Welfare Benefits |
15,538 | 15,538 | ||||
| Disability Income(1) |
— | 1,249,698 | ||||
| Life Insurance Benefits(2) |
— | 400,000 | ||||
| Accrued Vacation Pay |
18,474 | 18,474 | ||||
| (1) | Reflects the maximum lump-sum present value of all future payments each named executive would be entitled to receive under the Company’s disability program. Each named executive would be entitled to receive benefits until he reaches age 65. |
| (2) | Reflects the maximum lump-sum amount of $200,000 payable to each named executive’s beneficiaries upon his death plus the maximum lump-sum amount of $200,000 payable in the event of accidental death under the Company’s life insurance program. |
No payments are made under any employment agreement or severance agreement if an executive terminates his employment without “good reason” or we terminate his employment for “cause”.
With respect to the employment and severance agreements:
| Ÿ | “cause” generally means (1) the commission of a felony or a crime of moral turpitude; (2) a willful and material act of dishonesty involving Metals USA; (3) a material non-curable breach of the executive’s obligations under the agreement; (4) material breaches of Metals USA’s policies or procedures; (5) any other willful misconduct which causes material harm to Metals USA or its business reputation; (6) a failure to cure a material breach of the executive’s obligations under the agreement, the investors rights agreement among the stockholders of Metals USA Holdings and certain other agreements related to the executive’s equity participation in Metals USA Holdings, within 30 days after written notice of such breach; or (7) breaches of any of the executive’s representations contained in the agreement; and |
| Ÿ | “good reason” generally means (1) a reduction in the executive’s annual base salary or bonus potential described in the agreement (but not including any diminution related to a broader compensation reduction that is not limited to any particular employee or executive); (2) a |
110
Table of Contents
| material diminution of the executive’s responsibilities or, with respect to Mr. Goncalves, prior to an initial public offering, the failure to re-elect him to the Board of Directors of Metals USA or Metals USA Holdings; (3) relocation of the executive’s primary work place, as assigned to him by Metals USA, beyond a fifty mile radius; or (4) a material breach by the employer of the agreement. |
On May 14, 2009, Mr. Hageman resigned from his position as Senior Vice President and Chief Legal Officer of Metals USA Holdings effective as of the same date. In connection with his resignation, Mr. Hageman entered into separation agreement and general release. Pursuant to such separation agreement and general release, and in accordance with Mr. Hageman’s employment agreement, Mr. Hageman will receive 18 months of base salary, a pro-rata portion of his 2009 annual bonus, if any, based on actual performance, and reimbursement of the cost of COBRA continuation coverage for up to 18 months. In addition, the separation agreement provides that Mr. Hageman’s unvested stock options will be forfeited as of his resignation date pursuant to their terms.
Director Compensation
The table below summarizes the compensation paid by the Company to non-employee Directors for the fiscal year ended December 31, 2008.
| (a)(1) | (b) | (c) | (d) | (e) | (f) | ||||||||||
| Name |
Fees Earned or Paid in Cash |
Stock Awards |
Option Awards(2) |
All Other Compensation |
Total | ||||||||||
| Joshua J. Harris(3) |
$ | 79,125 | $ | — | $ | — | $ | — | $ | 79,125 | |||||
| Eric L. Press |
90,000 | — | $ | — | — | $ | 90,000 | ||||||||
| M. Ali Rashid |
169,750 | — | $ | — | — | $ | 169,750 | ||||||||
| Matthew R. Michelini |
17,000 | — | $ | — | — | $ | 17,000 | ||||||||
| John T. Baldwin |
124,500 | — | $ | 46,592 | — | $ | 171,092 | ||||||||
| (1) | C. Lourenco Goncalves, the Company’s Chairman of the Board and Chief Executive Officer, is not included in this table as he is an employee of the Company and thus receives no compensation for his services as a Director. The compensation received by Mr. Goncalves as an employee of the Company is shown in the “Summary Compensation Table” above. |
| (2) | Reflects the dollar amount recognized for financial reporting purposes for the fiscal year ended December 31, 2008, in accordance with SFAS 123(R) of awards pursuant to the 2005 Plan. Assumptions used in the calculation of this amount for the fiscal year ended December 31, 2008 are included in Note 12 to our Consolidated Financial Statements. As of December 31, 2008, each Director had the following number of options outstanding: M. Ali Rashid: 40,000; Eric L. Press: 40,000; John T. Baldwin: 40,000. |
| (3) | Joshua J. Harris resigned his position as a Director of the Company effective November 21, 2008. Amounts reflected in the table above are for the period from January 1, 2008 through November 21, 2008. |
Compensation of Directors
We currently compensate our directors with an annual retainer of $60,000, paid quarterly in advance of each fiscal quarter of service. During 2008, each director also received a fee of $2,000 per board meeting attended and $2,000 for each regularly scheduled committee meeting. Effective January 1, 2009, each director receives a fee of $2,500 per board meeting attended and $2,500 for each regularly scheduled committee meeting. The annual fees for the audit committee members are $10,000, and for the Chairman and member of any other committee, the annual fees are $7,500 and
111
Table of Contents
$3,000, respectively. The Chairman of the audit committee receives an annual fee of $12,500. All reasonable out-of-pocket expenses are reimbursed upon submission of support documentation. With the exception of Mr. Michelini, each non-employee director of Metals USA received a grant of 40,000 non-qualified options under the 2005 Plan. Such options have a 10-year term, vest ratably over 5 years and have an exercise price of $10.00. The exercise price was reduced to $8.22 per share in connection with a special dividend paid to Metals USA Holdings’ stockholders on May 12, 2006. In connection with a special dividend paid to Metals USA Holdings’ stockholders on January 3, 2007, the exercise price was adjusted a second time and a cash payment was made to vested option holders. Accordingly, the per share exercise price of the options granted at the effective time of the Merger was decreased by $4.22 to $4.00. Additionally, the Company has accelerated the vesting of unvested stock options held by non-employee directors other than Mr. Baldwin. In connection with the July 2007 dividend, each director received on his options a cash payment of $9.25 per share subject to an option, an amount equal to the per share amount of the dividend. Newly elected directors will receive the same fees as described above.
Compensation Committee Interlocks and Insider Participation
Prior to February 9, 2007, including the entire year of 2006, the board of directors of Metals USA Holdings, excluding Mr. Goncalves, made all compensation decisions, and as such, had the responsibility for establishing and implementing, and monitoring compliance with, the Company’s compensation philosophy. On February 9, 2007, our board of directors established a compensation committee comprised of Messrs. Press and Rashid. Other than Mr. Goncalves, none of our directors has ever been one of our officers or employees. With the exception of those matters described below under “Certain Relationships and Related Party Transactions” pertaining to Mr. Goncalves with respect to his employment agreement and the investors rights agreement described in that section, none of our directors during 2008 had any relationship that requires disclosure in this prospectus as a transaction with a related person. During 2008, none of our executive officers served as a member of the compensation committee of another entity, one of whose executive officers served on our board of directors, and none of our executive officers served as a director of another entity, one of whose executive officers served on our board of directors.
112
Table of Contents
PRINCIPAL STOCKHOLDERS AND SELLING STOCKHOLDERS
The following table sets forth information with respect to the ownership of Metals USA Holdings as of November 17, 2009 for:
| Ÿ | each person who owns beneficially more than a 5% equity interest in Metals USA Holdings, |
| Ÿ | each of the selling stockholders in this offering; |
| Ÿ | each member of our board of directors, |
| Ÿ | each of our named executive officers, and |
| Ÿ | all of our executive officers and directors as a group. |
| Metals USA Holdings(1) | Immediately after this offering | ||||||||||
| Prior to this offering |
|||||||||||
| Name and Address of Owner(2) |
Number of Shares Beneficially Owned |
Equity Interest |
Common Stock Sold in this Offering |
Number of Shares Beneficially Owned |
Equity Interest | ||||||
| Apollo Management V, L.P.(3) |
13,612,900 | 96.7 | % | ||||||||
| C. Lourenco Goncalves |
646,196 | 4.5 | % | ||||||||
| Robert C. McPherson, III |
78,375 | * | |||||||||
| John A. Hageman |
58,400 | * | |||||||||
| Roger Krohn |
74,425 | * | |||||||||
| Joe Longo |
12,600 | * | |||||||||
| Keith A. Koci |
20,240 | * | |||||||||
| David A. Martens |
20,914 | * | |||||||||
| William A. Smith, II |
— | * | |||||||||
| Eric L. Press |
40,000 | * | |||||||||
| M. Ali Rashid |
40,000 | * | |||||||||
| John T. Baldwin |
32,000 | * | |||||||||
| Matthew R. Michelini |
— | * | |||||||||
| All executive officers and directors as a group (12 persons) |
1,063,150 | 7.2 | % | ||||||||
| * | Less than 1% |
| (1) | The amounts and percentages of interests beneficially owned are reported on the basis of regulations of the SEC governing the determination of beneficial ownership of securities. Under the rules of the SEC, a person is deemed to be a “beneficial owner” of a security if that person has or shares voting power, which includes the power to vote or direct the voting of such security, or investment power, which includes the power to dispose of or to direct the disposition of such security. A person is also deemed to be a beneficial owner of any securities of which that person has a right to acquire beneficial ownership within 60 days. Securities that can be so acquired are deemed to be outstanding for purposes of computing such person’s ownership percentage, but not for purposes of computing any other person’s percentage. Under these rules, more than one person may be deemed beneficial owner of the same securities and a person may be deemed to be a beneficial owner of securities as to which such person has no economic interest. Except as otherwise indicated in these footnotes, each of the beneficial owners has, to our knowledge, sole voting and investment power with respect to the indicated ownership interests. |
| (2) | Unless otherwise indicated, the address of each person listed is c/o Metals USA, One Riverway, Suite 1100, Houston, TX 77056. |
| (3) | Represents all equity interest of Metals USA Holdings held of record by affiliates of Apollo Management V, L.P. Apollo Management V, L.P. has the voting and investment power over the shares on behalf of Apollo. The general partner of Apollo Management V, L.P. is AIF V Management, LLC. The sole member of AIF V Management, LLC is Apollo Management, L.P. The general partner of Apollo Management, L.P. is Apollo Management GP, LLC. The sole |
113
Table of Contents
| member of Apollo Management GP, LLC is Apollo Management Holdings, L.P. The general partner of Apollo Management Holdings, L.P. is Apollo Management Holdings GP, LLC. Messrs. Leon Black, Joshua Harris and Marc Rowan, are the executive officers and the members of the board of managers Apollo Management Holdings GP, LLC. Each of Messrs. Black, Harris and Rowan disclaim beneficial ownership of these shares, except to the extent of any pecuniary interest therein. Each of Messrs. Press, Rashid and Michelini, who have relationships with Apollo, disclaim beneficial ownership of any shares of Metals USA Holdings that may be deemed beneficially owned by Apollo Management V, L.P., except to the extent of any pecuniary interest therein. Each of Apollo Management V, L.P. and its affiliated investment funds disclaims beneficial ownership of any such shares in which it does not have a pecuniary interest. The address of Messrs. Press, Rashid and Michelini and Apollo Management V, L.P. is c/o Apollo Management, L.P., 9 West 57th Street, New York, New York 10019. |
For more information regarding our selling stockholders and the relationships, positions and offices they have with us, see “Certain Relationships and Related Party Transactions” and “Management.”
114
Table of Contents
CERTAIN RELATIONSHIPS AND RELATED PARTY TRANSACTIONS
The following is a description of certain relationships and related party transactions.
This section of the prospectus includes descriptions of the material terms of the amended and restated investors rights agreement, the investors rights agreement, the Apollo Management Agreements, and the 2007 Notes Indenture and the other relationships and related transactions, but does not purport to describe all of the terms of such agreements or transactions or relationships. The following summary is qualified in its entirety by reference to the complete text of the Apollo Management Agreements and the 2007 Notes Indenture, which are attached as exhibits to the registration statement of which this prospectus is a part, and the amended and restated investors rights agreement, which will be attached as an exhibit to the registration statement of which this prospectus is a part. We urge you to read the full text of these agreements.
Related Party Transactions
Amended and Restated Investors Rights Agreement
Metals USA Holdings, Apollo and each of our management members who currently own our common stock expect to enter into an amended and restated investors rights agreement prior to the completion of this offering, which will provide for, among other things, a restriction on the transferability of each management member’s equity ownership in Metals USA Holdings, demand registration rights for Apollo, piggyback registration rights, repurchase rights by Metals USA Holdings and Apollo with respect to management’s equity in certain circumstances, demand registration rights for Apollo, certain restrictions on each such person’s ability to compete with us or solicit our employees or customers and board termination rights for Apollo.
The amended and restated investors rights agreement will provide that, within 180 days of the consummation of this offering, Apollo may nominate two additional members to our board of directors, and we will be required to increase the size of our board of directors at such time to nine and appoint such nominees to our board of directors. The amended and restated investors rights agreement will also provide that, except as otherwise required by applicable law, Apollo will have the right to nominate (a) four directors as long as Apollo owns (including shares of common stock issuable under the terms of any exchangeable securities issued by us) at least 30% but less than 50% of our outstanding common stock, (b) three directors as long as Apollo owns (including shares of common stock issuable under the terms of any exchangeable securities issued by us) at least 20% but less than 30% of our outstanding common stock and (c) two directors as long as Apollo owns (including shares of common stock issuable under the terms of any exchangeable securities issued by us) at least 10% but less than 20% of our outstanding common stock. In the event that the board of directors increases its size beyond nine members, Apollo’s nomination rights will be proportionately increased, rounded up to the nearest whole number. The amended and restated investors rights agreement will provide that, except as otherwise required by applicable law, we and the management members will take all action within their respective power to cause all such nominees to be included in the slate of nominees recommended by the board of directors to our stockholders for election as directors at each annual meeting of our stockholders and we will use all reasonable efforts to cause the election of each such nominee, including soliciting proxies in favor of the election of such nominees.
The amended and restated investors rights agreement will provide that, except as otherwise required by applicable law, Apollo will have the right to designate a replacement to fill a vacancy on Metal USA Holdings’ board of directors that was nominated by Apollo, and will provide that, except as otherwise required by applicable law, we will take all action within our power to cause such vacancy to be filled by the replacement designated by Apollo (including by promptly appointing such designee to the board of directors). See “Description of Capital Stock—Composition of Board of Directors; Election and Removal of Directors.”
115
Table of Contents
The amended and restated investor rights agreement will provide that Apollo may make one or more written demands of us to require us to register the shares of our common stock owned by Apollo. In addition, Apollo and our management members will have piggyback rights entitling them to require us to register shares of our common stock owned by them in connection with any registration statements filed by us after the completion of this offering, subject to certain exceptions. We have agreed to indemnify Apollo and the management members (to the extent they are selling stockholders in any such registration) against losses suffered by them in connection with any untrue or alleged untrue statement of a material fact contained in any registration statement, prospectus or preliminary prospectus or any omission or alleged omission to state therein a material fact required to be stated therein or necessary to make the statement therein not misleading, except insofar as the same may be caused by or contained in any information furnished in writing to us by such selling holder for use therein.
The amended and restated investors rights agreement was negotiated among management, Metals USA Holdings and Apollo, and Metals USA Holdings believes the amended and restated investors rights agreement is on arm’s-length terms.
Investors Rights Agreement
Metals USA Holdings and each of the management participants have entered into an investors rights agreement which provides for, among other things, a restriction on the transferability of each such management member’s equity ownership in Metals USA Holdings, tag-along rights, come-along rights, piggyback registration rights, repurchase rights by Metals USA Holdings and Apollo in certain circumstances, and the grant of an irrevocable proxy to Apollo with respect to the voting rights associated with his respective ownership, and certain restrictions on each such person’s ability to compete with or solicit our employees or customers. The investors rights agreement was negotiated among management, us and Apollo, and we believe it is on arm’s-length terms.
We expect to amend and restate the current investors rights agreement in connection with this offering. See “—Amended and Restated Investors Rights Agreement.”
Apollo Agreements
Metals USA Holdings entered into a management agreement with Apollo on November 30, 2005, pursuant to which Apollo provides us with management services. Pursuant to such agreement, Apollo receives an annual management fee equal to $2.0 million, payable on March 15 of every year, starting on March 15, 2006. $500,000 of this fee has been waived by Apollo, subject to revocation. The management agreement will terminate on December 31, 2012, unless earlier terminated by Apollo. Upon a termination of the management agreement prior to December 31, 2012, Apollo will be entitled to receive the present value of (a) $14.0 million, less (b) the aggregate amount of management fees that were paid to it under the agreement prior to such termination and less (c) management fees waived. Finally, Apollo is entitled to receive a transaction fee in connection with certain subsequent financing, acquisition, disposition and change of control transactions with a value of $25 million or more, equal to 1% of the gross transaction value of any such transaction.
Upon consummation of this offering, Apollo intends to terminate the management agreement, and as a result will receive $ million. Apollo intends not to receive a transaction fee in connection with this offering.
In addition, pursuant to a transaction fee agreement between us and Apollo dated as of November 30, 2005, we paid Apollo $6.0 million at the consummation of the Merger for various services performed by it and its affiliates in connection with the Transactions.
116
Table of Contents
The terms and fees payable to Apollo under the management agreement and the transaction fee agreement were determined through arm’s-length negotiations between us and Apollo, and reflect the understanding of Apollo and us of the fair value for such services, based in part on market conditions and what similarly-situated companies have paid for similar services.
Both the management agreement and transaction fee agreement contain customary indemnification provisions in favor of Apollo, as well as expense reimbursement provisions with respect to expenses incurred by Apollo in connection with its performance of services thereunder.
Repurchase Offer
No later than 60 days following our receipt of the proceeds of this offering, we are required to make an offer to all holders of the 2007 Notes to repurchase the maximum principal amount of the 2007 Notes that may be purchased out of the net proceeds of this offering, estimated to be approximately $ million, or $ million if the option to purchase additional shares is exercised in full, at a price equal to 100% of the principal amount, plus accrued and unpaid interest to the date of the closing of the repurchase offer. Under the terms of the indenture governing the 2007 Notes, we must offer to repurchase all of a tendering holder’s 2007 Notes or a pro rata portion thereof. Our affiliates, including Apollo, that are holders of the 2007 Notes may participate in the repurchase offer. Our affiliates, which include Apollo, as well as our Chief Executive Officer and our Chief Financial Officer, have purchased a portion of our 2007 Notes in the market. For the nine months ended September 30, 2009, interest paid on the 2007 Notes held by affiliates amounted to $9.0 million, and was paid entirely by PIK Interest. From time to time, depending upon market, pricing and other conditions, as well on cash balances and liquidity, we, our subsidiaries or affiliates may seek to purchase or sell some amount of the Metals USA Notes or additional amounts of the 2007 Notes. Any such purchases or sales may be made in the open market, privately negotiated transactions, tender offers or otherwise. The amounts of any such purchases or sales may be material. At November 13, 2009, the 2007 Notes traded at 80.625% of face value, based on quoted market prices.
Review and Approval of Related Party Transactions
It is our intention that generally transactions with our directors, executive officers, principal stockholders or affiliates must be at terms that are no less than favorable to us than those available from third parties and must be approved in advance by a majority of disinterested members of the board of directors.
117
Table of Contents
DESCRIPTION OF CERTAIN INDEBTEDNESS
This section of the prospectus includes descriptions of the material terms of the ABL facility, the IRB, the 2007 Notes and the Metals USA Notes but does not purport to describe all of the terms of such agreements or transactions. The following summary is qualified in its entirety by reference to the complete text of the loan and security agreement, including the amendments thereto, the 2007 Notes Indenture and the Metals USA Notes Indenture, including the amendments thereto, which are exhibits to the registration statement of which this prospectus is a part. We urge you to read the full text of these agreements. See also “Management’s Discussion and Analysis of Financial Condition and Results of Operations—Financing Activities.”
The ABL Facility
On November 30, 2005 Flag Intermediate and certain of its subsidiaries entered into the ABL facility arranged by Credit Suisse, as sole bookrunner and joint lead arranger, and Banc of America Securities LLC, as joint lead arranger.
The ABL facility is available to us on a revolving basis during the period beginning on November 30, 2005 and ending on November 30, 2011. Substantially all of our subsidiaries are also borrowers under the ABL facility. The maximum availability under the ABL facility is based on eligible receivables and eligible inventory, subject to certain reserves, to be determined in accordance with the loan and security agreement. The commitments under the ABL facility are comprised of $500.0 million of Tranche A Commitments and $25.0 million of Tranche A-1 Commitments. Subject to certain conditions, the Tranche A-1 Commitments may be reduced or terminated at any time. Subject to certain conditions, upon the reduction or termination of the Tranche A-1 Commitments, the Tranche A Commitments will be increased on a dollar-for-dollar basis in an amount equal to such reduction or termination. Up to $15.0 million of the ABL facility is available for swingline loans and up to $100.0 million is available for the issuance of letters of credit. Both the face amount of any outstanding letters of credit and any swingline loans will reduce availability under the ABL facility on a dollar-for-dollar basis.
On July 1, 2008, we exercised our option to increase the Tranche A Commitments by $100.0 million, which increased the total commitment from $525.0 million to $625.0 million. All other existing terms under the ABL facility remained unchanged. Costs incurred to exercise the option to increase the ABL facility totaled $2.4 million, and will be amortized over the remaining term of the existing ABL facility.
The interest rates with respect to loans made utilizing the Tranche A Commitments are, at our option, (i) the higher of (a) the prime rate of Credit Suisse in effect at its principal office in New York City and (b) the federal funds effective rate plus 0.5%, in each case plus an applicable margin ranging between -0.25% and -0.50% as determined in accordance with the loan and security agreement governing the ABL facility or (ii) the rate (as adjusted for statutory reserves) for Eurodollar deposits for one, two, three, six or, if agreed to by all leaders under the loan and security agreement, nine or twelve months, as selected by us, determined by reference to the British Bankers’ Association Interest Settlement Rates, plus an applicable margin ranging between 1.00% and 1.75% as determined in accordance with the loan and security agreement governing the ABL facility.
The interest rates with respect to loans utilizing the Tranche A-1 Commitments are, at our option, (i) the higher of (a) the prime rate of Credit Suisse in effect at its principal office in New York City and (b) the federal funds effective rate plus 0.5%, in each case plus an applicable margin of 0.75% or (ii) the rate (as adjusted for statutory reserves) for Eurodollar deposits for one, two, three, six or, if agreed to by all leaders under the loan and security agreement, nine or twelve months, as selected by us, determined by reference to the British Bankers’ Association Interest Settlement Rates, plus an applicable margin of 2.75%.
118
Table of Contents
Substantially all of our subsidiaries are defined as “borrowers” under the loan and security agreement. The obligations of the borrowers under the ABL facility are guaranteed by Flag Intermediate and certain of our domestic subsidiaries whether now owned or hereinafter acquired or organized and are secured (i) on a first-priority lien basis by our, the other borrowers’ and the guarantors’ accounts, inventory, cash and proceeds and products of the foregoing and certain assets related thereto and (ii) on a second-priority lien basis by substantially all of our, the other borrowers’ and the guarantors’ other assets, subject to certain exceptions and permitted liens.
Covenants
The ABL facility contains customary representations, warranties and covenants as a precondition to lending, including a material adverse change to the business, limitations on our ability to incur or guarantee additional debt, subject to certain exceptions, pay dividends, or make redemptions and repurchases, with respect to capital stock, repay debt, create or incur certain liens, make certain loans or investments, make acquisitions or investments, engage in mergers, acquisitions, asset sales and sale lease-back transactions, and engage in certain transactions with affiliates. In addition, the ABL facility requires a lock-box arrangement, which, as long as borrowing availability is greater than or equal to $45.0 million and in the absence of default, is controlled by Metals USA. As long as our borrowing availability is $45.0 million or greater, we do not have to maintain a minimum FCCR. Should borrowing availability fall below $45.0 million, we must maintain an FCCR of at least 1.0 to 1.0.
Additionally, payments of management and consulting fees are limited to the greater of $3.0 million or 3% of adjusted EBITDA per fiscal year provided borrowing availability exceeds $25.0 million. Further, distributions in respect of capital stock are generally limited to the payment of up to $25.0 million, plus $5.0 million for each full fiscal quarter (with any amount not used in any fiscal quarter being permitted to be used in succeeding fiscal quarters), plus 50% of cumulative consolidated net income, or if a loss, minus 100% of the amount thereof, plus 100% of the aggregate net proceeds received by us from certain sales and issuances of capital stock or from certain capital contributions, of dividends in any fiscal quarter, provided that borrowing availability is greater than or equal to $50.0 million and our FCCR is at least 1.0 to 1.0.
Events of Default
The ABL facility contains events of default with respect to: default in payment of principal when due, default in the payment of interest, fees or other amounts after a specified grace period, material breach of the representations or warranties, default in the performance of specified covenants, failure to make any payments when due under any indebtedness with a principal amount in excess of a specified amount, certain bankruptcy events, certain ERISA violations, invalidity of certain security agreements or guarantees, material judgments, or a change of control. In the event of default the agreement may permit the lenders to: (1) restrict the account or refuse to make revolving loans; (2) cause customer receipts to be applied against borrowings under the ABL facility causing the Company to suffer a rapid loss of liquidity and the ability to operate on a day-to-day basis; (3) restrict or refuse to provide letters of credit; or ultimately (4) terminate the commitments and the agreement; and/or (5) declare any or all obligations to be payable if such default is not cured in the specified period required. Any payment default or acceleration under the ABL facility on amounts in excess of $15.0 million would also result in a default under the Metals USA Notes and the 2007 Notes that would provide the holders of the Metals USA Notes and the 2007 Notes with the right to demand immediate repayment.
IRB
As of September 30, 2008 and as of September 30, 2009, the aggregate principal amount outstanding under the IRB was $5.7 million for both periods. The IRB is payable on May 1, 2016 in one lump sum payment. The interest rate assessed on the IRB varies from month to month and was 1.30% and 0.62% at December 31, 2008 and September 30, 2009, respectively. The IRB is secured by a
119
Table of Contents
letter of credit under the ABL facility. The IRB places various restrictions on certain of our subsidiaries, including maintenance of required insurance coverage, maintenance of certain financial ratios, limits on capital expenditures and maintenance of tangible net worth and is supported by a letter of credit. We were in compliance with all of the covenants as of September 30, 2009.
The 2007 Notes
On July 10, 2007, Metals USA Holdings completed a private placement of $300.0 million aggregate principal amount of the 2007 Notes due July 1, 2012. In February 2008, Metals USA Holdings exchanged $216.0 million aggregate principal amount of senior floating rate toggle notes due 2012 that were registered under the Securities Act for an equal principal amount of 2007 Notes issued in the private placement.
The initial five interest payments on the 2007 Notes were paid solely in cash. Metals USA Holdings must make an election regarding whether subsequent interest payments on the 2007 Notes will be made in cash or through PIK Interest prior to the start of the applicable interest period. Metals USA Holdings may elect to pay (1) interest entirely in cash or (2) PIK Interest, or (3) Partial PIK Interest. Cash interest on the 2007 Notes will accrue at a rate per annum, reset quarterly, equal to LIBOR plus a spread of 6.00%, which increases by 0.25% to 6.25% in the second year of the issuance of the 2007 Notes, by 0.50% to 6.50% in the third year of the issuance of the 2007 Notes, and by 0.75% to 6.75% in the fourth year of the issuance of the 2007 Notes. In the event PIK Interest is paid on the 2007 Notes after the first four interest periods, the then-applicable margin over LIBOR on the 2007 Notes would increase by 0.75% for each period in which PIK Interest is paid. If Metals USA Holdings elects to pay any PIK Interest, Metals USA Holdings will increase the principal amount on the 2007 Notes or issue new 2007 Notes in an amount equal to the amount of PIK Interest for the applicable interest payment period to holders of the 2007 Notes on the relevant record date. Interest is payable quarterly in arrears on January 1, April 1, July 1 and October 1. PIK Interest notes, resulting from the conversion of interest into PIK notes, when paid will be treated as an operating activity in the Consolidated Statements of Cash Flows in accordance with ASC 230.
On September 26, 2008, we made a permitted election under the indenture governing the 2007 Notes to pay all interest that is due on January 1, 2009, for the interest period beginning on October 1, 2008, and ending on December 31, 2008, entirely through PIK Interest. The Company must make an election regarding whether subsequent interest payments will be made in cash, through PIK Interest, or Partial PIK Interest, prior to the start of the applicable interest period. In the absence of such an election for any interest period, interest on the 2007 Notes will be payable according to the election for the previous interest period. As a result, the PIK Interest election is now the default election for future interest periods unless we elect otherwise not later than the commencement of an interest period.
The 2007 Notes include the word “toggle” in their title to highlight to investors that we have the ability to “toggle,” or switch back and forth, among paying interest in cash, PIK Interest or Partial PIK Interest pursuant to the terms and conditions described in more detail above.
Offers to Purchase
If Metals USA Holdings makes certain public offerings, asset sales or issuances of common stock, including this offering, and does not redeem the 2007 Notes, it will be required to make an offer to repurchase the maximum principal amount of the 2007 Notes that may be purchased out of the proceeds thereof, at a price equal to 100% of the principal amount, plus accrued and unpaid interest and additional interest, if any, to the date of repurchase. See “Use of Proceeds” for further information about the repurchase offer associated with this offering.
120
Table of Contents
If Metals USA Holdings experiences a change of control and does not redeem the 2007 Notes, it will be required to make an offer to repurchase the 2007 Notes at a price equal to 101% of the principal amount, plus accrued interest and unpaid interest and additional interest, if any, to the date of repurchase.
Optional Redemption
Metals USA Holdings may redeem some or all of the 2007 Notes at any time on or after January 15, 2008 at a redemption price equal to 102% of the principal amount, declining to 101% on or after January 15, 2009 and declining to par on or after January 15, 2010, plus accrued and unpaid interest and additional interest, if any, to the redemption date.
Guarantees; Ranking; Collateral
The 2007 Notes are senior unsecured obligations that are not guaranteed by any of Metals USA Holdings’ subsidiaries. As such, the 2007 Notes are structurally subordinated to all indebtedness and other liabilities (including trade payables) of Metals USA Holdings’ subsidiaries.
Covenants
The 2007 Notes indenture contains certain limitations and restrictions on Metals USA Holdings and certain of its subsidiaries’ ability to, among other things:
| Ÿ | incur additional indebtedness; |
| Ÿ | issue preferred and disqualified stock; |
| Ÿ | make certain investments; |
| Ÿ | limit dividends or other payments or transfer of property by restricted subsidiaries to Metals USA Holdings; |
| Ÿ | make asset sales; |
| Ÿ | enter into certain types of transactions with affiliates; |
| Ÿ | incur liens; and |
| Ÿ | sell all or substantially all of Metals USA Holdings’ assets or merge with or into another company. |
The 2007 Notes indenture restricts Metals USA Holdings’ ability to pay dividends or make other distributions on its capital stock or repurchase or redeem its capital stock. Specifically, Metals USA Holdings may not make any such payments if a default under the indenture has occurred and is continuing. In addition, the aggregate amount of such payments generally cannot exceed 50% of the cumulative consolidated net income of Metals USA Holdings and its subsidiaries since September 30, 2005 plus 100% of certain cash contributions to Metals USA’s Holdings’ capital and amounts received from the sale of certain equity interests and investments. As a condition to making such payments, each of Metals USA Holdings and Metals USA must also be able to incur $1.00 of additional indebtedness under the FCCR test as defined in the indenture. Notwithstanding the foregoing, Metals USA Holdings is permitted to pay dividends to any direct or indirect parent to allow such direct or indirect parent to pay dividends on its common stock, following the first public offering of such direct or indirect parent’s common stock, in an amount up to 6.0% per annum of the amount contributed to Metals USA Holdings from the proceeds received by such direct or indirect parent in such offering. The indenture also contains a provision allowing Metals USA Holdings to make up to an aggregate amount of $20.0 million of restricted payments generally, which it could use to pay dividends.
These covenants are subject to important exceptions and qualifications.
121
Table of Contents
Events of Default
The 2007 Notes indenture contains certain customary events of default, including (subject, in some cases, to customary cure periods) defaults based on (1) the failure to make payments under the 2007 Notes indenture when due, (2) breach of covenants, (3) cross-defaults to other material indebtedness, (4) bankruptcy events and (5) material judgments.
The Metals USA Notes
On November 30, 2005, Flag Acquisition completed a private placement of $275.0 million aggregate principal amount of the Metals USA Notes, and Metals USA subsequently assumed all liabilities of Flag Acquisition pursuant to the Metals USA Notes. In September 2006, Metals USA exchanged $275.0 million aggregate principal amount of 11 1/8% senior secured notes due 2015 that were registered under the Securities Act for an equal principal amount of notes issued in connection with the Merger.
Interest on the Metals USA Notes accrues at a rate of 11 1/8% per annum and is payable semi-annually in arrears on June 1 and December 1.
Optional Redemption
Metals USA may redeem some or all of the Metals USA Notes at any time on or after December 1, 2010 at a redemption price equal to 100% of the principal amount plus a premium declining ratably to par, plus accrued and unpaid interest and additional interest, if any, to the redemption date.
At any time prior to December 1, 2010, Metals USA may redeem some or all of the Metals USA notes at a redemption price equal to 100% of the principal amount plus a make-whole premium, plus accrued and unpaid interest and additional interest, if any, to the redemption date.
Guarantees; Ranking; Collateral
The Metals USA Notes are guaranteed on a secured basis by Flag Intermediate and certain of Metals USA’s subsidiaries. The Metals USA Notes and the related guarantees are secured obligations of Metals USA and the guarantors and rank pari passu in right of payment with all existing and future senior indebtedness of Metals USA, Flag Intermediate and the subsidiary guarantors, as the case may be, and are and will be secured by the collateral, as described below.
The Metals USA Notes and the related guarantees are secured on a first-priority lien basis by substantially all of the assets (other than accounts, inventory, cash and proceeds and products of the foregoing and certain assets related thereto) of Metals USA and the guarantors and on a second-priority lien basis by the accounts, inventory, cash and proceeds and products of the foregoing and certain assets related thereto of Metals USA and the guarantors.
Covenants
The Metals Notes USA indenture contains certain limitations and restrictions on Metals USA and certain of its subsidiaries’ ability to, among other things:
| Ÿ | incur additional indebtedness; |
| Ÿ | issue preferred and disqualified stock; |
| Ÿ | make certain investments; |
122
Table of Contents
| Ÿ | limit dividends or other payments or transfer of property by restricted subsidiaries to Metals USA; |
| Ÿ | make asset sales; |
| Ÿ | enter into certain types of transactions with affiliates; |
| Ÿ | incur liens; and |
| Ÿ | sell all or substantially all of Metals USA’s assets or merge with or into another company. |
The Metals USA Notes indenture restricts Metals USA’s ability to pay dividends or make other distributions on its capital stock or repurchase or redeem its capital stock. Specifically, Metals USA may not make any such payments if a default under the Metals USA Notes indenture has occurred and is continuing. In addition, the aggregate amount of such payments generally cannot exceed 50% of the cumulative consolidated net income of Metals USA and its subsidiaries since September 30, 2005 plus 100% of certain cash contributions to Metals USA’s capital and amounts received from the sale of certain equity interests and investments. As a condition to making such payments, Metals USA must also be able to incur $1.00 of additional indebtedness under the FCCR test as defined in the Metals USA Notes indenture. Notwithstanding the foregoing, Metals USA is permitted to pay dividends to any direct or indirect parent to allow such direct or indirect parent to pay dividends on its common stock, following the first public offering of such direct or indirect parent’s common stock, in an amount up to 6.0% per annum of the amount contributed to Metals USA from the proceeds received by such direct or indirect parent in such offering. The Metals USA Notes indenture also contains a provision allowing Metals USA to make up to an aggregate amount of $20.0 million of restricted payments generally, which it could use to pay dividends.
These covenants are subject to important exceptions and qualifications.
Events of Default
The Metals USA Notes indenture contains certain customary events of default, including (subject, in some cases, to customary cure periods) defaults based on (1) the failure to make payments under the Metals USA Notes indenture when due, (2) breach of covenants, (3) cross-defaults to other material indebtedness, (4) bankruptcy events and (5) material judgments.
123
Table of Contents
This section of the prospectus includes a description of the material terms of our amended and restated certificate of incorporation and bylaws as each will be in effect as of the consummation of this offering, and of specific provisions of Delaware law. The following summary is qualified in its entirety by reference to the complete text of our amended and restated certificate of incorporation and bylaws, which will be attached as exhibits to the registration statement of which this prospectus is a part. We urge you to read the full text of these documents.
The following description is intended as a summary only and is qualified in its entirety by reference to our amended and restated certificate of incorporation, our amended and restated bylaws and the Delaware General Corporation Law, which we refer to as the “DGCL.”
Common Stock
Pursuant to our amended and restated certificate of incorporation, we will be authorized to issue up to shares of common stock, $0.01 par value per share. Holders of common stock will be entitled to one vote for each share held on all matters submitted to a vote of stockholders and will not have cumulative voting rights. Accordingly, holders of a majority of the shares of common stock entitled to vote in any election of directors may elect all of the directors standing for election. Holders of common stock are entitled to receive ratably such dividends, if any, as may be declared by our board of directors out of funds legally available therefor, subject to any preferential dividend rights of outstanding preferred stock. Upon our liquidation, dissolution or winding up, the holders of common stock are entitled to receive ratably our net assets available after the payment of all debts and other liabilities and subject to the prior rights of any outstanding preferred stock. Holders of our common stock have no preemptive, subscription, redemption or conversion rights. The outstanding shares of common stock are, and the shares offered by us hereby will be, when issued and paid for, fully paid and nonassessable. If we issue any preferred stock, the rights, preferences and privileges of holders of common stock will be subject to, and may be adversely affected by, the rights of the holders of our preferred stock. See “—Preferred Stock.”
Preferred Stock
Pursuant to the terms of our amended and restated certificate of incorporation, we will be authorized to issue up to shares of preferred stock, $0.01 par value per share. Our board of directors will be authorized, subject to any limitations prescribed by law, without further stockholder approval, to issue such shares of preferred stock in one or more series. Each such series of preferred stock will have such rights, preferences, privileges and restrictions, including voting rights, dividend rights, conversion rights, redemption privileges and liquidation preferences, as will be determined by our board of directors. The purpose of authorizing our board of directors to issue preferred stock and determine its rights and preferences is to eliminate delays associated with a stockholder vote on specific issuances. The issuance of preferred stock, while providing desirable flexibility in connection with possible acquisitions and other corporate purposes, could have the effect of making it more difficult for a third party to acquire, or of discouraging a third party from attempting to acquire, a majority of our outstanding voting stock. The existence of the authorized but undesignated preferred stock may have a depressive effect on the market price of our common stock.
Composition of Board of Directors; Election and Removal of Directors
In accordance with our amended and restated certificate of incorporation and our amended and restated bylaws, the number of directors comprising our board of directors will be as determined from time to time by our board of directors, and only a majority of the board of directors may fix the number
124
Table of Contents
of directors. We intend to avail ourselves of the “controlled company” exception under The New York Stock Exchange rules which exempts us from certain of the requirements, including that we have a majority of independent directors on our board of directors and that we have compensation and nominating committees composed entirely of independent directors. We will, however, remain subject to the requirement that we have an audit committee composed entirely of independent members. Upon the closing of this offering, it is anticipated that we will have seven directors, and within 180 days thereafter, it is anticipated that we may have nine directors if Apollo exercises its designation rights described below. Each director is to hold office until his or her successor is duly elected and qualified or until his or her earlier death, resignation or removal. At any meeting of our board of directors, except as otherwise required by law, a majority of the total number of directors then in office will constitute a quorum for all purposes.
The amended and restated investors rights agreement Metals USA Holdings’ expects to enter into with Apollo and each of our management members will provide that, within 180 days of the consummation of this offering, Apollo may nominate two additional members to our board of directors, and we will be required to increase the size of our board of directors at such time to nine and appoint such nominees to our board of directors. The amended and restated investors rights agreement will also provide that, except as otherwise required by applicable law, Apollo will have the right to nominate (a) four directors as long as Apollo owns (including shares of common stock issuable under the terms of any exchangeable securities issued by us) at least 30% but less than 50% of our outstanding common stock, (b) three directors as long as Apollo owns (including shares of common stock issuable under the terms of any exchangeable securities issued by us) at least 20% but less than 30% of our outstanding common stock and (c) two directors as long as Apollo owns (including shares of common stock issuable under the terms of any exchangeable securities issued by us) at least 10% but less than 20% of our outstanding common stock. In the event that the board of directors increases its size beyond nine members, Apollo’s nomination rights will be proportionately increased, rounded up to the nearest whole number. The amended and restated investors rights agreement will provide that, except as otherwise required by applicable law, we and the management members will take all action within their respective power to cause all such nominees to be included in the slate of nominees recommended by the board of directors to our stockholders for election as directors at each annual meeting of our stockholders and we will use all reasonable efforts to cause the election of each such nominee, including soliciting proxies in favor of the election of such nominees. See “Certain Relationships and Related Party Transactions—Related Party Transactions—Amended and Restated Investors Rights Agreement.”
Certain Corporate Anti-Takeover Provisions
Our amended and restated certificate of incorporation and bylaws will contain a number of provisions relating to corporate governance and to the rights of stockholders. Certain of these provisions may be deemed to have a potential “anti-takeover” effect in that such provisions may delay, defer or prevent a change of control of the Company. These provisions include:
Preferred Stock
Our board of directors has authority to issue series of preferred stock with such voting rights and other powers as the board of directors may determine, as described above.
Classified Board
Our board of directors will be classified into three classes. Each director will serve a three year term and will stand for re-election once every three years.
125
Table of Contents
Removal of Directors, Vacancies
Our stockholders will be able to remove directors only for cause and only by the affirmative vote of the holders of a majority of the outstanding shares of our capital stock entitled to vote in the election of directors. Vacancies on our board of directors may be filled only by a majority of our board of directors. Except as otherwise required by applicable law, the amended and restated investors rights agreement will provide that Apollo will have the right to designate a replacement to fill a vacancy on Metals USA Holdings’ board of directors that was designated by Apollo. See “Certain Relationships and Related Party Transactions—Related Party Transactions—Amended and Restated Investors Rights Agreement.”
No Cumulative Voting
Our amended and restated certificate of incorporation will provide that stockholders do not have the right to cumulative votes in the election of directors.
Calling of Special Meetings of Stockholders
Our amended and restated certificate of incorporation and bylaws will provide that special meetings of our stockholders may be called only by our board of directors or the chairman of our board of directors.
Advance Notice Requirements for Stockholder Proposals and Director Nominations
Our amended and restated bylaws will provide that stockholders seeking to nominate candidates for election as directors or to bring business before an annual meeting of stockholders must provide timely notice of their proposal in writing to the corporate secretary.
Stockholders at an annual meeting may only consider proposals or nominations specified in the notice of meeting or brought before the meeting by or at the direction of our board of directors or by a stockholder of record on the record date for the meeting, who is entitled to vote at the meeting and who has delivered timely written notice in proper form to our secretary of the stockholder’s intention to bring such business before the meeting.
Delaware Takeover Statute
Our amended and restated certificate of incorporation will provide that we are not governed by Section 203 of the DGCL which, in the absence of such provisions, would have imposed additional requirements regarding mergers and other business combinations.
All of the foregoing proposed provisions of our amended and restated certificate of incorporation and amended and restated bylaws could discourage potential acquisition proposals and could delay or prevent a change in control. These provisions are intended to enhance the likelihood of continuity and stability in the composition of the board of directors and in the policies formulated by the board of directors and to discourage certain types of transactions that may involve an actual or threatened change of control. In addition, these provisions are designed to reduce our vulnerability to an unsolicited acquisition proposal and discourage certain tactics that may be used in proxy fights. The protective nature of these provisions, however, may also delay, deter or prevent a tender offer or takeover attempt that a stockholder might consider to be in its best interest. In addition, such provisions could have the effect of discouraging others from making tender offers for our shares and, as a consequence, they also may inhibit fluctuations in the market price of our common stock that could result from actual or rumored takeover attempts. Such provisions also may have the effect of preventing changes in our management.
126
Table of Contents
Corporate Opportunity
Our amended and restated certificate of incorporation will provide that no officer or director of us who is also an officer, director, employee, managing director or other affiliate of Apollo will be liable to us or our stockholders for breach of any fiduciary duty by reason of the fact that any such individual directs a corporate opportunity to Apollo instead of us, or does not communicate information regarding a corporate opportunity to us that the officer, director, employee, managing director or other affiliate has directed to Apollo.
Amendment of Our Certificate of Incorporation
Under applicable law, our amended and restated certificate of incorporation will provide that it may be amended only with the affirmative vote of a majority of the outstanding stock entitled to vote thereon. See “—Corporate Opportunity.”
Amendment of Our Bylaws
Our amended and restated bylaws will provide that they can be amended by the vote of the holders of a majority of the shares then entitled to vote or by the vote of a majority of the board of directors.
Limitation of Liability and Indemnification
Our amended and restated certificate of incorporation will provide that no director will be personally liable for monetary damages for breach of any fiduciary duty as a director, except with respect to liability:
| Ÿ | for any breach of the director’s duty of loyalty to us or our stockholders; |
| Ÿ | for acts or omissions not in good faith or that involve intentional misconduct or a knowing violation of law; |
| Ÿ | under Section 174 of the DGCL (governing distributions to stockholders); or |
| Ÿ | for any transaction from which the director derived any improper personal benefit. |
However, if the DGCL is amended to authorize corporate action further eliminating or limiting the personal liability of directors, then the liability of our directors will be eliminated or limited to the fullest extent permitted by the DGCL, as so amended. The modification or repeal of this provision of our amended and restated certificate of incorporation will not adversely affect any right or protection of a director existing at the time of such modification or repeal.
Our amended and restated certificate of incorporation will provide that we will, to the fullest extent from time to time permitted by law, indemnify our directors and officers against all liabilities and expenses in any suit or proceeding or arising out of their status as an officer or director or their activities in these capacities. We will also indemnify any person who, at our request, is or was serving as a director, officer or employee of another corporation, partnership, joint venture, trust or other enterprise. We may, by action of our board of directors, provide indemnification to our employees and agents within the same scope and effect as the foregoing indemnification of directors and officers.
The right to be indemnified will include the right of an officer or a director to be paid expenses in advance of the final disposition of any proceeding, provided that, if required by law, we receive an undertaking to repay such amount if it will be determined that he or she is not entitled to be indemnified.
127
Table of Contents
Our board of directors may take such action as it deems necessary to carry out these indemnification provisions, including adopting procedures for determining and enforcing indemnification rights and purchasing insurance policies. Our board of directors may also adopt bylaws, resolutions or contracts implementing indemnification arrangements as may be permitted by law. Neither the amendment or repeal of these indemnification provisions, nor the adoption of any provision of our amended and restated certificate of incorporation inconsistent with these indemnification provisions, will eliminate or reduce any rights to indemnification relating to their status or any activities prior to such amendment, repeal or adoption.
We believe these provisions will assist in attracting and retaining qualified individuals to serve as directors.
Investors Rights Agreement
Metals USA Holdings and each of the management participants have entered into an investors rights agreement which provides for, among other things, a restriction on the transferability of each such management member’s equity ownership in Metals USA Holdings, tag-along rights, come-along rights, piggyback registration rights, repurchase rights by Metals USA Holdings and Apollo in certain circumstances, and the grant of an irrevocable proxy to Apollo with respect to the voting rights associated with his respective ownership, and certain restrictions on each such person’s ability to compete with or solicit our employees or customers. The investors rights agreement was negotiated among management, us and Apollo and we believe it is on arm’s-length terms.
We expect to amend and restate the current investors rights agreement in connection with this offering.
See “Certain Relationships and Related Party Transactions—Related Party Transactions—Amended and Restated Investors Rights Agreement” and “Certain Relationships and Related Party Transactions—Related Party Transactions—Investors Rights Agreement.”
Transfer Agent and Registrar
The transfer agent and registrar for the common stock will be Computershare Trust Company, N.A.
Exchange Listing
We have applied for listing of our common stock on The New York Stock Exchange under the symbol “MUSA.”
128
Table of Contents
SHARES ELIGIBLE FOR FUTURE SALE
Prior to this offering, there has been no public market for our common stock, and no predictions can be made about the effect, if any, that market sales of shares of our common stock or the availability of such shares for sale will have on the market price prevailing from time to time. Nevertheless, the actual sale of, or the perceived potential for the sale of, our common stock in the public market may have an adverse effect on the market price for the common stock and could impair our ability to raise capital through future sales of our securities. See “Risk Factors—Risks Related to an Investment in Our Common Stock and This Offering—Future sales or the possibility of future sales of a substantial amount of our common stock may depress the price of shares of our common stock.”
Upon the closing of this offering, we will have outstanding an aggregate of approximately shares of common stock. Of the outstanding shares, the shares sold in this offering will be freely tradable without restriction or further registration under the Securities Act, except that any shares held by our “affiliates,” as that term is defined under Rule 144 of the Securities Act, may be sold only in compliance with the limitations described below. The remaining outstanding shares of common stock will be deemed “restricted securities” as that term is defined under Rule 144. Restricted securities may be sold in the public market only if registered or if they qualify for an exemption from registration under Rule 144 under the Securities Act, which are summarized below.
We expect to grant Apollo, our equity sponsor, demand and incidental registration rights with respect to the shares of our common stock owned by it after this offering, and have granted our management members incidental registration rights with respect to the shares of our common stock owned by them after this offering ( shares of our common stock if the underwriters exercise the over-allotment option in full). See “Certain Relationships and Related Party Transactions—Related Party Transactions—Amended and Restated Investors Rights Agreement.”
Rule 144
The availability of Rule 144 will vary depending on whether restricted shares are held by an affiliate or a non-affiliate. Under Rule 144 as in effect on the date of this prospectus an affiliate who has beneficially owned restricted shares of our common stock for at least six months would be entitled to sell within any three-month period a number of shares that does not exceed the greater of either of the following:
| Ÿ | 1% of the number of shares of common stock then outstanding, which will equal shares immediately after this offering (or if the underwriters’ over-allotment option is exercised in full); and |
| Ÿ | the average weekly trading volume of our common stock during the four calendar weeks preceding the filing of a notice on Form 144 with respect to the sale. |
Any sales by affiliates under Rule 144 are also limited by manner of sale provisions and notice requirements and the availability of current public information about us.
The volume limitation, manner of sale and notice provisions described above will not apply to sales by non-affiliates. For purposes of Rule 144, a non-affiliate is any person or entity who is not our affiliate at the time of sale and has not been our affiliate during the preceding three months. A non-affiliate who has beneficially owned restricted shares of our common stock for six months may rely on Rule 144 provided that certain public information regarding us is available. A non-affiliate who has beneficially owned the restricted shares proposed to be sold for at least one year will not be subject to any restrictions under Rule 144.
129
Table of Contents
Rule 701
Under Rule 701, common stock acquired upon the exercise of certain currently outstanding options or pursuant to other rights granted under our stock plans may be resold, to the extent not subject to lock-up agreements, (1) by persons other than affiliates, subject only to the manner-of-sale provisions of Rule 144, and (2) by affiliates, subject to the manner-of-sale, current public information and filing requirements of Rule 144, in each case, without compliance with the one-year holding period requirement of Rule 144.
Form S-8 Registration Statements
We intend to file one or more registration statements on Form S-8 under the Securities Act following this offering to register our shares of common stock that are issuable pursuant to the 2005 Plan. These registration statements are expected to become effective upon filing. Shares covered by these registration statements will then be eligible for sale in the public markets, subject to any applicable lock-up agreements and to Rule 144 limitations applicable to affiliates.
Lock-Up Agreements
We, our executive officers, directors and certain of our existing security holders will agree with the underwriters not to sell, dispose of or hedge any of their common stock or securities convertible into or exchangeable for shares of common stock, during the period from the date of this prospectus continuing through the date 180 days after the date of this prospectus, subject to certain exceptions. See “Underwriting” for a description of these lock-up provisions.
130
Table of Contents
MATERIAL UNITED STATES FEDERAL INCOME TAX
CONSEQUENCES FOR NON-U.S. HOLDERS
The following discussion describes material U.S. federal income and estate tax consequences associated with the purchase, ownership, and disposition of our common stock as of the date hereof by Non-U.S. Holders (as defined below). It is assumed in this discussion that a Non-U.S. Holder holds shares of our common stock as a capital asset within the meaning of Section 1221 of the Code (generally, property held for investment). This discussion does not address special situations, such as those of:
| Ÿ | dealers in securities or currencies; |
| Ÿ | financial institutions; |
| Ÿ | regulated investment companies; |
| Ÿ | real estate investment trusts; |
| Ÿ | tax-exempt entities; |
| Ÿ | current or former owners, directly, indirectly or constructively, of five percent or more of our common stock; |
| Ÿ | insurance companies; |
| Ÿ | persons holding common stock as a part of a hedging, integrated, conversion or constructive sale transaction or a straddle; |
| Ÿ | traders in securities that elect to use a mark-to-market method of accounting for their securities holdings; |
| Ÿ | persons liable for alternative minimum tax; |
| Ÿ | persons whose “functional currency” is not the U.S. dollar; |
| Ÿ | investors in pass-through entities; |
| Ÿ | entities or arrangements treated as partnerships for U.S. federal income tax purposes; or |
| Ÿ | persons who acquired our common stock through the exercise of employee stock options or otherwise as compensation. |
This discussion does not address all aspects of U.S. federal income taxation. Furthermore, the discussion below is based upon the provisions of the Code, the existing and proposed Treasury regulations promulgated thereunder and administrative and judicial interpretations thereof, all as of the date hereof, and such authorities may be repealed, revoked, modified or subject to differing interpretations, possibly with retroactive effect, so as to result in U.S. federal income tax consequences different from those discussed below. This discussion does not discuss any state, local or foreign tax consequences, nor any federal tax consequences, other than federal income and estate tax consequences. Persons considering the purchase, ownership or disposition of our common stock should consult their own tax advisors concerning the U.S. federal tax consequences in light of their particular situations as well as any consequences arising under the laws of any other jurisdiction.
A “U.S. Holder” of our common stock means a holder that is for U.S. federal income tax purposes:
| Ÿ | an individual citizen or resident of the United States; |
| Ÿ | a corporation (or other entity taxable as a corporation) created or organized in or under the laws of the United States or any state thereof or the District of Columbia; |
131
Table of Contents
| Ÿ | an estate the income of which is subject to U.S. federal income taxation regardless of its source; or |
| Ÿ | a trust if it (1) is subject to the primary supervision of a court within the United States and one or more U.S. persons have the authority to control all substantial decisions of the trust or (2) has a valid election in effect under applicable Treasury regulations to be treated as a U.S. person. |
If a partnership or other entity or arrangement treated as a partnership for U.S. federal income tax purposes holds our common stock, the tax treatment of a partner will generally depend upon the status of the partner and the activities of the partnership. If you are a partner in a partnership purchasing common stock, we urge you to consult your own tax advisor.
A “Non-U.S. Holder” is a beneficial owner of our common stock, other than an entity or arrangement classified as a partnership for U.S. federal income tax purposes, that is not a U.S. Holder. Special rules may apply to certain Non-U.S. Holders, such as:
| Ÿ | U.S. expatriates; |
| Ÿ | “controlled foreign corporations”; |
| Ÿ | “passive foreign investment companies”; and |
| Ÿ | investors in pass-through entities that are subject to special treatment under the Code. |
Non-U.S. Holders are urged to consult their own tax advisors to determine the U.S. federal, state, local and other tax consequences that may be relevant to them.
Dividends. Dividends paid to you, if any, generally will be subject to withholding of U.S. federal income tax at a 30% rate or such lower rate as may be specified by an applicable income tax treaty. However, dividends that are effectively connected with your conduct of a trade or business within the United States and, if certain tax treaties apply, are attributable to your U.S. permanent establishment, are not subject to the withholding tax, but instead are subject to U.S. federal income tax on a net income basis in the same manner as if you were a U.S. Holder. Special certification and disclosure requirements, including the completion of Internal Revenue Service Form W-8ECI (or any successor form), must be satisfied for effectively connected income to be exempt from withholding. If you are a foreign corporation, any such effectively connected dividends received by you may be subject to an additional branch profits tax at a 30% rate or such lower rate as may be specified by an applicable income tax treaty.
If you wish to claim the benefit of an applicable treaty for dividends, you will be required to complete Internal Revenue Service Form W-8BEN (or other applicable form) and certify under penalties of perjury that you are not a U.S. person and that you are entitled to the benefits of the applicable treaty.
Special certification and other requirements apply to certain Non-U.S. Holders that are entities rather than individuals.
If you are eligible for a reduced rate of U.S. withholding tax pursuant to an income tax treaty, you may obtain a refund of any excess amounts withheld by filing an appropriate claim for refund with the Internal Revenue Service.
Sale or Exchange of Common Stock. You generally will not be subject to U.S. federal income tax with respect to gain recognized on a sale or other disposition of shares of our common stock unless:
| Ÿ | the gain is effectively connected with your conduct of a trade or business in the United States, and if certain tax treaties apply, is attributable to your U.S. permanent establishment; |
132
Table of Contents
| Ÿ | if you are an individual and hold shares of our common stock as a capital asset, you are present in the United States for 183 days or more in the taxable year of the sale or other disposition, and certain other conditions are met; or |
| Ÿ | we are or have been a “U.S. real property holding corporation” for U.S. federal income tax purposes. |
If you are an individual and are described in the first bullet above, you will be subject to tax on the net gain derived from the sale under regular graduated U.S. federal income tax rates in the same manner as if you were a U.S. Holder. If you are an individual and are described in the second bullet above, you will be subject to a flat 30% tax on the gain derived from the sale, which may be offset by U.S. source capital losses (even though you are not considered a resident of the United States). If you are a foreign corporation and are described in the first bullet above, you will be subject to tax on your gain under regular graduated U.S. federal income tax rates in the same manner as if you were a U.S. Holder and, in addition, may be subject to the branch profits tax on your effectively connected earnings and profits at a rate of 30% or at such lower rate as may be specified by an applicable income tax treaty.
We believe we are not and do not anticipate becoming a “U.S. real property holding corporation” for U.S. federal income tax purposes.
U.S. Federal Estate Tax. Shares of our common stock owned or treated as owned by an individual who is not a citizen or resident (as specially defined for U.S. federal estate tax purposes) of the United States at the time of death will be includible in the individual’s gross estate for U.S. federal estate tax purposes, unless an applicable estate tax treaty provides otherwise, and therefore may be subject to U.S. federal estate tax.
Information Reporting and Backup Withholding. Under certain circumstances, Treasury regulations require information reporting and backup withholding on certain payments on common stock.
U.S. backup withholding tax (currently at a rate of 28%) is imposed on certain payments to persons that fail to furnish the information required under the U.S. information reporting requirements. Dividends on common stock paid to a Non-U.S. Holder will generally be exempt from backup withholding, provided the Non-U.S. Holder meets applicable certification requirements, including providing a correct and properly executed Internal Revenue Service Form W-8BEN or otherwise establishes an exemption. We must report annually to the Internal Revenue Service and to each Non-U.S. Holder the amount of dividends paid to that holder and the U.S. federal withholding tax withheld with respect to those dividends, regardless of whether withholding is reduced or eliminated by an applicable tax treaty.
Under United States Treasury regulations, payments of proceeds from the sale of our common stock effected through a foreign office of a broker to its customer generally are not subject to information reporting or backup withholding. However, if the broker is a U.S. person, a controlled foreign corporation for U.S. federal income tax purposes, a foreign person 50% or more of whose gross income is effectively connected with a United States trade or business for a specified three-year period or a foreign partnership with significant United States ownership or engaged in a United States trade or business, then information reporting (but not backup withholding) will be required, unless the broker has in its records documentary evidence that the beneficial owner of the payment is a Non-U.S. Holder or is otherwise entitled to an exemption (and the broker has no knowledge or reason to know to the contrary), and other applicable certification requirements are met. Backup withholding will apply if the sale is subject to information reporting and the broker has actual knowledge that you are a United
133
Table of Contents
States person. Information reporting and backup withholding generally will apply to payments of proceeds from the sale of our common stock effected through a United States office of any United States or foreign broker, unless the beneficial owner, under penalties of perjury, certifies, among other things, its status as a Non-U.S. Holder or otherwise establishes an exemption.
Backup withholding does not represent an additional income tax. Any amounts withheld from a payment to a holder under the backup withholding rules will be allowed as a credit against the holder’s United States federal income tax liability and may entitle the holder to a refund, provided that the required information or returns are timely furnished by the holder to the Internal Revenue Service.
134
Table of Contents
Metals USA Holdings, the selling stockholders and the underwriters named below have entered into an underwriting agreement with respect to the shares being offered. Subject to certain conditions, each underwriter has severally agreed to purchase the number of shares indicated in the following table. will act as the representative of the underwriters.
| Underwriters |
Number of Shares | |
| Total |
||
The underwriters are committed to take and pay for all of the shares being offered, if any are taken, other than the shares covered by the option described below unless and until this option is exercised.
If the underwriters sell more shares than the total number set forth in the table above, the underwriters have an option to buy up to an additional shares from us and shares from the selling stockholders to cover such sales. They may exercise that option for 30 days. If any shares are purchased pursuant to this option, the underwriters will severally purchase shares in approximately the same proportion as set forth in the table above.
The following table shows the per share and total underwriting discounts and commissions to be paid to the underwriters by us and the selling stockholders. Such amounts are shown assuming both no exercise and full exercise of the underwriters’ option to purchase additional shares.
| Paid by Selling Stockholders | Paid by Metals USA Holdings | |||||||
| No Exercise | Full Exercise | No Exercise | Full Exercise | |||||
| Per Share |
$ | $ | $ | $ | ||||
| Total |
$ | $ | $ | $ | ||||
Shares sold by the underwriters to the public will initially be offered at the initial public offering price set forth on the cover of this prospectus. Any shares sold by the underwriters to securities dealers may be sold at a discount of up to $ per share from the initial public offering price. Any such securities dealers may resell any shares purchased from the underwriters to certain other brokers or dealers at a discount of up to $ per share from the initial public offering price. If all the shares are not sold at the initial public offering price, the representative may change the offering price and the other selling terms. The offering of the shares by the underwriters is subject to receipt and acceptance and subject to the underwriters’ right to reject any order in whole or in part.
The selling stockholders may be deemed to be underwriters within the meaning of the Securities Act.
There is no established trading market for the shares and a liquid trading market may not develop.
We and our executive officers, directors, and holders of substantially all of our common stock have agreed with the underwriters, subject to certain exceptions, not to dispose of or hedge any of our common stock or securities convertible into or exchangeable for shares of common stock during the period from the date of this prospectus continuing through the date 180 days after the date of this prospectus, except with the prior written consent of the representative. This agreement does not apply to any existing employee benefit plans. See “Shares Eligible for Future Sale” for a discussion of certain transfer restrictions.
The 180-day restricted period described in the preceding paragraph will be automatically extended if: (1) during the last 17 days of the 180-day restricted period we issue an earnings release or
135
Table of Contents
announce material news or a material event; or (2) prior to the expiration of the 180-day restricted period, we announce that we will release earnings results during the 15-day period following the last day of the 180-day restricted period, in which case the restrictions described in the preceding paragraph will continue to apply until the expiration of the 18-day period beginning on the issuance of the earnings release or the announcement of the material news or material event.
Prior to the offering, there has been no public market for the shares. The initial public offering price will be negotiated among Metals USA Holdings and the representative of the underwriters. The primary factors to be considered in determining the initial public offering price of the shares, in addition to prevailing market conditions, will be our historical performance, estimates of our business potential and earnings prospects, an assessment of our management and the consideration of the above factors in relation to market valuation of companies in related businesses.
We have applied to list the common stock on The New York Stock Exchange under the symbol “MUSA.” In order to meet one of the requirements for listing the common stock on The New York Stock Exchange, the underwriters have undertaken to sell lots of 100 or more shares to a minimum of 400 beneficial holders.
In connection with the offering, the underwriters may purchase and sell shares of common stock in the open market. These transactions may include short sales, stabilizing transactions and purchases to cover positions created by short sales. Short sales involve the sale by the underwriters of a greater number of shares than they are required to purchase in the offering. “Covered” short sales are sales made in an amount not greater than the underwriters’ option to purchase additional shares from us in the offering. The underwriters may close out any covered short position by either exercising their option to purchase additional shares or purchasing shares in the open market. In determining the source of shares to close out the covered short position, the underwriters will consider, among other things, the price of shares available for purchase in the open market as compared to the price at which they may purchase additional shares pursuant to the option granted to them. “Naked” short sales are any sales in excess of such option. The underwriters must close out any naked short position by purchasing shares in the open market. A naked short position is more likely to be created if the underwriters are concerned that there may be downward pressure on the price of the common stock in the open market after pricing that could adversely affect investors who purchase in the offering. Stabilizing transactions consist of various bids for or purchases of common stock made by the underwriters in the open market prior to the completion of the offering.
The underwriters may also impose a penalty bid. This occurs when a particular underwriter repays to the underwriters a portion of the underwriting discount received by it because the representative has repurchased shares sold by or for the account of such underwriter in stabilizing or short covering transactions.
Purchases to cover a short position and stabilizing transactions, as well as other purchases by the underwriters for their own accounts, may have the effect of preventing or retarding a decline in the market price of the common stock, and together with the imposition of the penalty bid, may stabilize, maintain or otherwise affect the market price of the common stock. As a result, the price of the common stock may be higher than the price that otherwise might exist in the open market. If these activities are commenced, they may be discontinued at any time. These transactions may be effected on The New York Stock Exchange, in the over-the-counter market or otherwise.
European Economic Area
In relation to each Member State of the European Economic Area which has implemented the Prospectus Directive (each, a “Relevant Member State”), each underwriter has represented and
136
Table of Contents
agreed that with effect from and including the date on which the Prospectus Directive is implemented in that Relevant Member State (the “Relevant Implementation Date”) it has not made and will not make an offer of shares to the public in that Relevant Member State prior to the publication of a prospectus in relation to the shares which has been approved by the competent authority in that Relevant Member State or, where appropriate, approved in another Relevant Member State and notified to the competent authority in that Relevant Member State, all in accordance with the Prospectus Directive, except that it may, with effect from and including the Relevant Implementation Date, make an offer of shares to the public in that Relevant Member State at any time:
| (a) | to legal entities which are authorized or regulated to operate in the financial markets or, if not so authorized or regulated, whose corporate purpose is solely to invest in securities; |
| (b) | to any legal entity which has two or more of (1) an average of at least 250 employees during the last financial year; (2) a total balance sheet of more than €43,000,000 and (3) an annual net turnover of more than €50,000,000, as shown in its last annual or consolidated accounts; |
| (c) | to fewer than 100 natural or legal persons (other than qualified investors as defined in the Prospectus Directive) subject to obtaining the prior consent of the representatives for any such offer; or |
| (d) | in any other circumstances which do not require the publication by the Issuer of a prospectus pursuant to Article 3 of the Prospectus Directive. |
For the purposes of this provision, the expression an “offer of shares to the public” in relation to any shares in any Relevant Member State means the communication in any form and by any means of sufficient information on the terms of the offer and the shares to be offered so as to enable an investor to decide to purchase or subscribe the shares, as the same may be varied in that Relevant Member State by any measure implementing the Prospectus Directive in that Relevant Member State and the expression Prospectus Directive means Directive 2003/71/EC and includes any relevant implementing measure in each Relevant Member State.
Each underwriter has represented and agreed that:
| (a) | it has only communicated or caused to be communicated and will only communicate or cause to be communicated an invitation or inducement to engage in investment activity (within the meaning of Section 21 of the FSMA) received by it in connection with the issue or sale of the shares in circumstances in which Section 21(1) of the FSMA does not apply to the Issuer; and |
| (b) | it has complied and will comply with all applicable provisions of the FSMA with respect to anything done by it in relation to the shares in, from or otherwise involving the United Kingdom. |
The shares may not be offered or sold by means of any document other than (i) in circumstances which do not constitute an offer to the public within the meaning of the Companies Ordinance (Cap.32, Laws of Hong Kong), or (ii) to “professional investors” within the meaning of the Securities and Futures Ordinance (Cap.571, Laws of Hong Kong) and any rules made thereunder, or (iii) in other circumstances which do not result in the document being a “prospectus” within the meaning of the Companies Ordinance (Cap.32, Laws of Hong Kong), and no advertisement, invitation or document relating to the shares may be issued or may be in the possession of any person for the purpose of issue (in each case whether in Hong Kong or elsewhere), which is directed at, or the contents of which are likely to be accessed or read by, the public in Hong Kong (except if permitted to do so under the laws of Hong Kong) other than with respect to shares which are or are intended to be disposed of only to persons outside Hong Kong or only to “professional investors” within the meaning of the Securities and Futures Ordinance (Cap. 571, Laws of Hong Kong) and any rules made thereunder.
137
Table of Contents
This prospectus has not been registered as a prospectus with the Monetary Authority of Singapore. Accordingly, this prospectus and any other document or material in connection with the offer or sale, or invitation for subscription or purchase, of the shares may not be circulated or distributed, nor may the shares be offered or sold, or be made the subject of an invitation for subscription or purchase, whether directly or indirectly, to persons in Singapore other than (i) to an institutional investor under Section 274 of the Securities and Futures Act, Chapter 289 of Singapore (the “SFA”), (ii) to a relevant person, or any person pursuant to Section 275(1A), and in accordance with the conditions, specified in Section 275 of the SFA or (iii) otherwise pursuant to, and in accordance with the conditions of, any other applicable provision of the SFA.
Where the shares are subscribed or purchased under Section 275 by a relevant person which is: (a) a corporation (which is not an accredited investor) the sole business of which is to hold investments and the entire share capital of which is owned by one or more individuals, each of whom is an accredited investor; or (b) a trust (where the trustee is not an accredited investor) whose sole purpose is to hold investments and each beneficiary is an accredited investor, shares, debentures and units of shares and debentures of that corporation or the beneficiaries’ rights and interest in that trust shall not be transferable for 6 months after that corporation or that trust has acquired the shares under Section 275 except: (1) to an institutional investor under Section 274 of the SFA or to a relevant person, or any person pursuant to Section 275(1A), and in accordance with the conditions, specified in Section 275 of the SFA; (2) where no consideration is given for the transfer; or (3) by operation of law.
The securities have not been and will not be registered under the Financial Instruments and Exchange Law of Japan (the Securities and Exchange Law) and each underwriter has agreed that it will not offer or sell any securities, directly or indirectly, in Japan or to, or for the benefit of, any resident of Japan (which term as used herein means any person resident in Japan, including any corporation or other entity organized under the laws of Japan), or to others for re-offering or resale, directly or indirectly, in Japan or to a resident of Japan, except pursuant to an exemption from the registration requirements of, and otherwise in compliance with, the Financial Instruments and Exchange Law and any other applicable laws, regulations and ministerial guidelines of Japan.
We currently anticipate that we will undertake a directed share program pursuant to which we will request that the underwriters reserve up to 5% of the shares of our common stock offered for sale in this offering, at the initial public offering price, to be sold to certain directors, officers, employees, persons having relationships with us, or other persons designated by us through a directed share program. The number of shares of common stock available for sale to the general public will be reduced to the extent such persons purchase such reserved shares in this offering. Any reserved shares which are not orally confirmed for purchase by 9:00 a.m. Eastern Time on the first day of trading will be sold by the underwriters to the general public on the same terms as the other shares offered in this offering.
The underwriters do not expect sales to discretionary accounts to exceed five percent of the total number of shares offered.
We estimate that our share of the total expenses of the offering, excluding underwriting discounts and commissions, will be approximately $ .
We have agreed to indemnify the several underwriters against certain liabilities, including liabilities under the Securities Act.
Certain of the underwriters and their respective affiliates have, from time to time, performed, and may in the future perform, various financial advisory and investment banking services for us, for which they received or will receive customary fees and expenses.
138
Table of Contents
Wachtell, Lipton, Rosen & Katz will pass upon for us the validity of the shares of our common stock offered hereby. The underwriters have been represented by Cravath, Swaine & Moore LLP.
The consolidated balance sheets of Metals USA Holdings Corp. and subsidiaries as of December 31, 2008 and 2007 and the related consolidated statements of operations, stockholders’ equity (deficit) and comprehensive income, and cash flows for the years ended December 31, 2008, 2007 and 2006 included in this Prospectus and the related financial statement schedule included elsewhere in the Registration Statement have been audited by Deloitte & Touche LLP, independent registered public accounting firm, as stated in their reports appearing herein and elsewhere in the Registration Statement. Such financial statements and financial statement schedule are included in reliance upon the reports of such firm given upon their authority as experts in accounting and auditing.
We have filed with the SEC a registration statement on Form S-1 under the Securities Act relating to this offering. This prospectus, which is part of the registration statement, does not contain all of the information set forth in the registration statement and the exhibits to the registration statement. For further information with respect to us and this offering, you should refer to the registration statement and the exhibits filed as a part of the registration statement. If we have made references in this prospectus to any contracts, agreements or other documents and also filed any of those contracts, agreements or other documents as exhibits to the registration statement, you should read the relevant exhibit for a more complete understanding of the document or the matter involved.
Both Metals USA Holdings Corp. and Metals USA are subject to the informational requirements of the Exchange Act. We fulfill our obligations with respect to such requirements by filing periodic reports and other information with the SEC. We intend to furnish our stockholders with annual reports containing consolidated financial statements certified by an independent public accounting firm. The other information we file with the SEC is not part of the registration statement of which this prospectus forms a part. Our reports and other information that we have filed, or may in the future file, with the SEC are not incorporated by reference into and do not constitute part of this prospectus.
You may read and copy any document we have or will file with the SEC at the SEC’s internet website (http://www.sec.gov) or at the Public Reference Room of the SEC located at Room 1580, 100 F Street, N.E., Washington, D.C. 20549. Copies of such materials, including copies of all or any portion of the registration statement, can be obtained from the Public Reference Room of the SEC at prescribed rates. You can call the SEC at 1-800-SEC-0330 to obtain information on the operation of the Public Reference Room.
139
Table of Contents
You may obtain copies of this information, including the documents referenced in this prospectus and filed as exhibits to the registration statement of which this prospectus is a part, at no charge by writing or telephoning us at the following address and telephone numbers:
Investor Relations
Metals USA Holdings Corp.
One Riverway, Suite 1100
Houston, Texas 77506
(713) 965-0990
(888) 871-8701
We also maintain an internet site at http://www.metalsusa.com. Our website and the information contained therein or connected thereto will not be deemed to be incorporated into this prospectus or the registration statement of which this prospectus forms a part, and you should not rely on any such information in making your decision whether to purchase our securities.
140
Table of Contents
INDEX TO CONSOLIDATED FINANCIAL STATEMENTS
| Consolidated Financial Statements |
||
| F-2 | ||
| F-3 | ||
| Consolidated Statements of Operations—For the Years Ended December 31, 2008, 2007 and 2006 |
F-4 | |
| F-5 | ||
| Consolidated Statements of Cash Flows—For the Years Ended December 31, 2008, 2007 and 2006 |
F-6 | |
| F-7 | ||
| Unaudited Consolidated Financial Statements |
||
| Unaudited Condensed Consolidated Balance Sheets at September 30, 2009 and December 31, 2008 |
F-39 | |
| F-40 | ||
| F-41 | ||
| Notes to Unaudited Condensed Consolidated Financial Statements |
F-42 | |
F-1
Table of Contents
REPORT OF INDEPENDENT REGISTERED PUBLIC ACCOUNTING FIRM
The Board of Directors and Stockholders
Metals USA Holdings Corp.
We have audited the accompanying consolidated balance sheets of Metals USA Holdings Corp. and subsidiaries (the “Company”) as of December 31, 2008 and 2007, and the related consolidated statements of operations, stockholders’ equity (deficit) and comprehensive income, and cash flows for each of the three years in the period ended December 31, 2008. Our audits also included the financial statement schedule listed in the Index at Item 16. These consolidated financial statements and financial statement schedule are the responsibility of the Company’s management. Our responsibility is to express an opinion on these consolidated financial statements and financial statement schedule based on our audits.
We conducted our audits in accordance with the standards of the Public Company Accounting Oversight Board (United States). Those standards require that we plan and perform the audit to obtain reasonable assurance about whether the financial statements are free of material misstatement. The Company is not required to have, nor were we engaged to perform, an audit of its internal control over financial reporting. Our audits included consideration of internal control over financial reporting as a basis for designing audit procedures that are appropriate in the circumstances, but not for the purpose of expressing an opinion on the effectiveness of the Company’s internal control over financial reporting. Accordingly, we express no such opinion. An audit also includes examining, on a test basis, evidence supporting the amounts and disclosures in the financial statements, assessing the accounting principles used and significant estimates made by management, as well as evaluating the overall financial statement presentation. We believe that our audits provide a reasonable basis for our opinion.
In our opinion, such consolidated financial statements present fairly, in all material respects, the financial position of the Company as of December 31, 2008 and 2007, and the results of its operations and its cash flows for each of the three years in the period ended December 31, 2008, in conformity with accounting principles generally accepted in the United States of America. Also, in our opinion, such financial statement schedule, when considered in relation to the basic consolidated financial statements taken as a whole, presents fairly in all material respects the information set forth therein.
/s/ DELOITTE & TOUCHE LLP
Houston, Texas
February 24, 2009
F-2
Table of Contents
METALS USA HOLDINGS CORP. AND SUBSIDIARIES
CONSOLIDATED BALANCE SHEETS
(in millions, except share amounts)
| December 31, | ||||||||
| 2008 | 2007 | |||||||
| Assets |
||||||||
| Current assets: |
||||||||
| Cash |
$ | 166.7 | $ | 13.6 | ||||
| Accounts receivable, net of allowance of $8.8 and $8.3, respectively |
189.3 | 196.8 | ||||||
| Inventories |
422.6 | 409.8 | ||||||
| Deferred income tax asset |
23.6 | 19.7 | ||||||
| Prepayments and other |
6.5 | 7.5 | ||||||
| Total current assets |
808.7 | 647.4 | ||||||
| Property and equipment, net |
190.1 | 202.1 | ||||||
| Assets held for sale |
1.8 | — | ||||||
| Intangible assets, net |
13.6 | 23.3 | ||||||
| Goodwill |
49.9 | 60.2 | ||||||
| Other assets |
24.1 | 26.0 | ||||||
| Total assets |
$ | 1,088.2 | $ | 959.0 | ||||
| Liabilities and Stockholders’ Deficit |
||||||||
| Current liabilities: |
||||||||
| Accounts payable |
$ | 47.2 | $ | 75.5 | ||||
| Accrued liabilities |
60.9 | 63.3 | ||||||
| Current portion of long-term debt |
1.6 | 2.3 | ||||||
| Total current liabilities |
109.7 | 141.1 | ||||||
| Long-term debt, less current portion |
942.6 | 855.0 | ||||||
| Deferred income tax liability |
62.2 | 67.4 | ||||||
| Other long-term liabilities |
24.7 | 21.1 | ||||||
| Total liabilities |
1,139.2 | 1,084.6 | ||||||
| Commitments and contingencies |
||||||||
| Stockholders’ Deficit: |
||||||||
| Common stock, $.01 par value, 30,000,000 shares authorized, 14,077,500 issued and outstanding at December 31, 2008 and 2007, respectively |
0.1 | 0.1 | ||||||
| Additional paid-in capital |
6.4 | 0.7 | ||||||
| Retained deficit |
(54.5 | ) | (127.1 | ) | ||||
| Accumulated other comprehensive income (loss) |
(3.0 | ) | 0.7 | |||||
| Total stockholders’ deficit |
(51.0 | ) | (125.6 | ) | ||||
| Total liabilities and stockholders’ deficit |
$ | 1,088.2 | $ | 959.0 | ||||
The accompanying notes are an integral part of these consolidated financial statements.
F-3
Table of Contents
METALS USA HOLDINGS CORP. AND SUBSIDIARIES
CONSOLIDATED STATEMENTS OF OPERATIONS
(in millions, except per share amounts)
| Years Ended December 31, | ||||||||||||
| 2008 | 2007 | 2006 | ||||||||||
| Net Sales |
$ | 2,156.2 | $ | 1,845.3 | $ | 1,802.9 | ||||||
| Operating costs and expenses: |
||||||||||||
| Cost of sales (exclusive of operating and delivery, and depreciation and amortization shown below) |
1,612.9 | 1,418.8 | 1,371.8 | |||||||||
| Operating and delivery |
186.1 | 178.4 | 175.5 | |||||||||
| Selling, general and administrative |
126.8 | 112.3 | 115.1 | |||||||||
| Depreciation and amortization |
21.3 | 22.1 | 21.4 | |||||||||
| (Gain) loss on sale of property and equipment |
(2.4 | ) | 0.1 | 0.1 | ||||||||
| Impairment of assets |
5.1 | 0.2 | — | |||||||||
| Operating income |
206.4 | 113.4 | 119.0 | |||||||||
| Other (income) expense: |
||||||||||||
| Interest expense |
87.9 | 87.0 | 54.6 | |||||||||
| Loss on extinguishment of debt |
— | 8.4 | — | |||||||||
| Other (income) expense, net |
(0.2 | ) | (0.7 | ) | (0.7 | ) | ||||||
| Income before income taxes |
118.7 | 18.7 | 65.1 | |||||||||
| Provision for income taxes |
46.1 | 4.8 | 25.8 | |||||||||
| Net income |
$ | 72.6 | $ | 13.9 | $ | 39.3 | ||||||
| Income per share: |
||||||||||||
| Income per share—basic |
$ | 5.16 | $ | 0.99 | $ | 2.80 | ||||||
| Income per share—diluted |
$ | 4.99 | $ | 0.96 | $ | 2.79 | ||||||
| Number of common shares used in the per share calculation: |
||||||||||||
| Basic |
14.1 | 14.1 | 14.1 | |||||||||
| Diluted |
14.5 | 14.4 | 14.1 | |||||||||
The accompanying notes are an integral part of these consolidated financial statements.
F-4
Table of Contents
METALS USA HOLDINGS CORP. AND SUBSIDIARIES
CONSOLIDATED STATEMENTS OF STOCKHOLDERS’ EQUITY (DEFICIT)
AND COMPREHENSIVE INCOME
(in millions)
| Years Ended December 31, | ||||||||||||
| 2008 | 2007 | 2006 | ||||||||||
| Common Stock ($.01 Par) |
||||||||||||
| Balance at beginning and end of period |
$ | 0.1 | $ | 0.1 | $ | 0.1 | ||||||
| Additional Capital |
||||||||||||
| Balance at beginning of period |
$ | 0.7 | $ | 118.1 | $ | 134.4 | ||||||
| Stock-based compensation |
0.4 | 4.1 | 1.2 | |||||||||
| Deferred compensation |
— | (0.9 | ) | — | ||||||||
| Dividends paid |
— | (120.6 | ) | (17.7 | ) | |||||||
| Other |
5.3 | — | 0.2 | |||||||||
| Balance at end of period |
$ | 6.4 | $ | 0.7 | $ | 118.1 | ||||||
| Deferred Compensation |
||||||||||||
| Balance at beginning of period |
$ | — | $ | — | $ | (0.1 | ) | |||||
| Stock option exercises, grants and other adjustments |
— | — | 0.1 | |||||||||
| Balance at end of period |
$ | — | $ | — | $ | — | ||||||
| Retained Earnings (Deficit) |
||||||||||||
| Balance at beginning of period |
$ | (127.1 | ) | $ | 30.0 | $ | (2.0 | ) | ||||
| Net income |
72.6 | 13.9 | 39.3 | |||||||||
| Dividends paid |
— | (167.9 | ) | (7.3 | ) | |||||||
| Cumulative effect of adoption of new accounting principle |
— | (3.1 | ) | — | ||||||||
| Balance at end of period |
$ | (54.5 | ) | $ | (127.1 | ) | $ | 30.0 | ||||
| Accumulated Other Comprehensive Income (Loss) |
||||||||||||
| Foreign currency translation adjustments |
$ | (1.1 | ) | $ | 1.3 | $ | (0.6 | ) | ||||
| Deferred hedging gains (losses) |
(2.4 | ) | — | — | ||||||||
| Deferred securities valuation gains (losses) |
(0.2 | ) | — | — | ||||||||
| Other comprehensive income (loss), net of deferred income taxes |
(3.7 | ) | 1.3 | (0.6 | ) | |||||||
| Accumulated other comprehensive income (loss) at beginning of period |
0.7 | (0.6 | ) | — | ||||||||
| Accumulated other comprehensive income (loss) at end of period |
$ | (3.0 | ) | $ | 0.7 | $ | (0.6 | ) | ||||
| Comprehensive Income |
||||||||||||
| Net income |
$ | 72.6 | $ | 13.9 | $ | 39.3 | ||||||
| Other comprehensive income (loss) |
(3.7 | ) | 1.3 | (0.6 | ) | |||||||
| Total comprehensive income |
$ | 68.9 | $ | 15.2 | $ | 38.7 | ||||||
The accompanying notes are an integral part of these consolidated financial statements.
F-5
Table of Contents
METALS USA HOLDINGS CORP. AND SUBSIDIARIES
CONSOLIDATED STATEMENTS OF CASH FLOWS
(in millions)
| Years Ended December 31, | ||||||||||||
| 2008 | 2007 | 2006 | ||||||||||
| Cash flows from operating activities: |
||||||||||||
| Net income |
$ | 72.6 | $ | 13.9 | $ | 39.3 | ||||||
| Adjustments to reconcile net income to net cash provided by (used in) operating activities: |
||||||||||||
| (Gain) loss on sale of property and equipment |
(2.4 | ) | 0.1 | 0.1 | ||||||||
| Impairment of assets |
5.1 | 0.2 | — | |||||||||
| Provision for bad debts |
3.1 | 1.7 | 4.1 | |||||||||
| Depreciation and amortization |
23.6 | 23.7 | 22.6 | |||||||||
| Loss on extinguishment of debt |
— | 8.4 | — | |||||||||
| Amortization of bond discounts and debt issuance costs |
6.0 | 5.0 | 2.5 | |||||||||
| Deferred income taxes |
(3.1 | ) | (3.7 | ) | (6.6 | ) | ||||||
| Stock-based compensation |
1.1 | 4.8 | 1.2 | |||||||||
| Changes in operating assets and liabilities, net of acquisitions: |
||||||||||||
| Accounts receivable |
4.4 | 17.9 | (35.0 | ) | ||||||||
| Inventories |
(12.8 | ) | 41.7 | (91.2 | ) | |||||||
| Prepayments and other |
0.4 | 0.3 | 9.3 | |||||||||
| Accounts payable and accrued liabilities |
(27.9 | ) | 2.1 | 11.6 | ||||||||
| Other |
8.3 | 3.1 | (3.6 | ) | ||||||||
| Net cash provided by (used in) operations |
78.4 | 119.2 | (45.7 | ) | ||||||||
| Cash flows from investing activities: |
||||||||||||
| Sale of assets |
9.5 | 1.2 | 1.6 | |||||||||
| Purchases of assets |
(12.2 | ) | (21.5 | ) | (16.9 | ) | ||||||
| Port City Metal Services contingent earn-out payment |
(5.0 | ) | — | — | ||||||||
| Acquisition costs, net of cash acquired |
— | (38.2 | ) | (45.7 | ) | |||||||
| Net cash used in investing activities |
(7.7 | ) | (58.5 | ) | (61.0 | ) | ||||||
| Cash flows from financing activities: |
||||||||||||
| Borrowings on ABL facility |
1,056.0 | 574.5 | 441.6 | |||||||||
| Repayments on ABL facility |
(968.5 | ) | (623.0 | ) | (304.0 | ) | ||||||
| Issuances of long-term debt |
— | 291.0 | 144.8 | |||||||||
| Repayments of long-term debt |
(2.4 | ) | (150.7 | ) | (0.5 | ) | ||||||
| Deferred financing costs |
(2.7 | ) | (6.2 | ) | (5.9 | ) | ||||||
| Issuance of common stock |
— | — | 0.2 | |||||||||
| Dividends paid |
— | (288.5 | ) | (25.0 | ) | |||||||
| Net cash (used in) provided by financing activities |
82.4 | (202.9 | ) | 251.2 | ||||||||
| Net increase (decrease) in cash and cash equivalents |
153.1 | (142.2 | ) | 144.5 | ||||||||
| Cash and cash equivalents, beginning of period |
13.6 | 155.8 | 11.3 | |||||||||
| Cash and cash equivalents, end of period |
$ | 166.7 | $ | 13.6 | $ | 155.8 | ||||||
| Supplemental Cash Flow Information: |
||||||||||||
| Cash paid for interest |
$ | 78.2 | $ | 54.5 | $ | 49.8 | ||||||
| Cash paid for income taxes |
$ | 32.2 | $ | 21.9 | $ | 23.2 | ||||||
| Investments in property, plant and equipment not paid |
$ | 0.9 | $ | 0.5 | $ | 0.8 | ||||||
The accompanying notes are an integral part of these consolidated financial statements.
F-6
Table of Contents
METALS USA HOLDINGS CORP. AND SUBSIDIARIES
NOTES TO CONSOLIDATED FINANCIAL STATEMENTS
(dollars in millions)
1. Organization and Significant Accounting Policies
Description of the Business
On May 18, 2005, Metals USA Holdings Corp. (formerly named Flag Holdings Corporation), a Delaware corporation (“Metals USA Holdings”), and its wholly owned subsidiary, Flag Acquisition Corporation, a Delaware corporation (“Flag Acquisition”), entered into an Agreement and Plan of Merger (the “Merger Agreement”) with Metals USA, Inc. (“Metals USA”). On November 30, 2005, Flag Acquisition, then a wholly owned subsidiary of Flag Intermediate Holdings Corporation (“Flag Intermediate”) merged with and into Metals USA (the “Merger”), with Metals USA being the surviving corporation. Metals USA Holdings and its wholly owned subsidiaries, Flag Intermediate and Metals USA, are referred to collectively herein as the “Company.” Metals USA prior to the Merger is referred to herein as the “Predecessor Company.”
We believe that we are a leading provider of value-added processed carbon steel, stainless steel, aluminum and specialty metals, as well as manufactured metal components. For the year ended December 31, 2008, approximately 94% of our revenue was derived from our metals service center and processing activities, which are segmented into two groups: Flat Rolled and Non-Ferrous Group and Plates and Shapes Group. The remaining portion of our revenue was derived from our Building Products Group, which principally manufactures and sells aluminum products related to the residential remodeling industry. We purchase metal from primary producers that generally focus on large volume sales of unprocessed metals in standard configurations and sizes. In most cases, we perform the customized, value-added processing services required to meet the specifications provided by end-use customers. Our Plates and Shapes Group and Flat Rolled and Non-Ferrous Group customers are in the land and marine transportation, energy, aerospace, defense, electrical and appliance manufacturing, fabrication, furniture, commercial construction, and machinery and equipment industries. Our Building Products Group customers are primarily distributors and contractors engaged in the residential remodeling industry.
Summary of Significant Accounting Policies
Principles of Consolidation—The consolidated financial statements include the accounts of Metals USA Holdings, Flag Intermediate, and Metals USA and its subsidiaries. Intercompany accounts and transactions have been eliminated in the consolidated financial statements.
Use of Estimates and Assumptions—The preparation of financial statements in conformity with accounting principles generally accepted in the United States (“GAAP”) requires management to make estimates and assumptions that affect (i) the reported amounts of assets and liabilities, (ii) the disclosure of contingent assets and liabilities known to exist as of the date the financial statements are published, and (iii) the reported amount of net sales and expenses recognized during the periods presented. Adjustments made with respect to the use of estimates often relate to improved information not previously available. Uncertainties with respect to such estimates and assumptions are inherent in the preparation of financial statements; accordingly, actual results could differ from these estimates.
Allowance for Doubtful Accounts—The determination of collectability of the Company’s accounts receivable requires management to make frequent judgments and estimates in order to determine the appropriate amount of allowance needed for doubtful accounts. The Company’s allowance for doubtful accounts is estimated to cover the risk of loss related to accounts receivable. This allowance is maintained at a level we consider appropriate based on historical and other factors that affect
F-7
Table of Contents
METALS USA HOLDINGS CORP. AND SUBSIDIARIES
NOTES TO CONSOLIDATED FINANCIAL STATEMENTS—Continued
(dollars in millions)
collectibility. These factors include historical trends of write-offs, recoveries and credit losses, the careful monitoring of customer credit quality, and projected economic and market conditions. Different assumptions or changes in economic circumstances could result in changes to the allowance.
Inventories—Inventories are stated at the lower of cost or market. Our inventories are accounted for using a variety of methods including specific identification, average cost and the first-in first-out method of accounting. Inventory quantities are regularly reviewed and provisions for excess or obsolete inventory are recorded primarily based on our forecast of future demand and market conditions.
Valuation and qualifying accounts—We provide reserves for accounts receivable and inventory. The reserves for these accounts for the years ended December 31, 2008, 2007 and 2006 are summarized below:
| Balance at Beginning of Period |
Amount Charged to Expense |
Utilization of Reserve |
Balance at End of Period | ||||||||||
| Year Ended December 31, 2008: |
|||||||||||||
| Allowance for doubtful accounts |
$ | 8.3 | $ | 3.1 | $ | (2.6 | ) | $ | 8.8 | ||||
| Inventory valuation allowance |
6.0 | 2.2 | (0.8 | ) | $ | 7.4 | |||||||
| Year Ended December 31, 2007: |
|||||||||||||
| Allowance for doubtful accounts |
$ | 8.4 | $ | 1.7 | $ | (1.8 | ) | $ | 8.3 | ||||
| Inventory valuation allowance |
5.9 | 1.0 | (0.9 | ) | $ | 6.0 | |||||||
| Year Ended December 31, 2006: |
|||||||||||||
| Allowance for doubtful accounts |
$ | 7.8 | $ | 4.1 | $ | (3.5 | ) | $ | 8.4 | ||||
| Inventory valuation allowance |
6.9 | 1.3 | (2.3 | ) | $ | 5.9 | |||||||
Financial Derivatives—We use financial derivatives to mitigate the Company’s exposure to volatility in interest rates. The Company hedges only exposures in the ordinary course of business. The Company accounts for its derivative instruments in accordance with Statement of Financial Accounting Standards (“SFAS”) No. 133, “Accounting for Derivative Instruments and Hedging Activity” (“SFAS 133”), which requires all derivatives to be carried on the balance sheet at fair value and meet certain documentary and analytical requirements to qualify for hedge accounting treatment. Hedge accounting creates the potential for a statement of operations match between the changes in fair values of derivatives and the changes in cost of the associated underlying transactions, in this case interest expense. Derivatives held by the Company are designated as hedges of specific exposures at inception, with an expectation that changes in the fair value will essentially offset the change in cost for the underlying exposure. Fair values of derivatives are determined from market observation or dealer quotations. Interest rate swap derivatives outstanding at December 31, 2008, all have remaining terms of approximately three years or less and the associated underlying transactions are expected to occur within that time frame.
The effective portion of the change in fair value of derivatives is reported in other comprehensive income, a component of stockholders’ deficit, until the underlying transaction occurs. Any determination that an underlying transaction is not probable of occurring will result in the recognition in earnings of gains and losses deferred in other comprehensive income. Amounts due from counterparties (unrealized hedge gains) or owed to counterparties (unrealized hedge losses) are included in other assets and accrued liabilities, respectively.
F-8
Table of Contents
METALS USA HOLDINGS CORP. AND SUBSIDIARIES
NOTES TO CONSOLIDATED FINANCIAL STATEMENTS—Continued
(dollars in millions)
See Note 6 for additional information on underlying hedge categories, notional and fair values of derivatives, types and classifications of derivatives used, and gains and losses from hedging activity.
Property and equipment—Property and equipment is stated at cost, and depreciation is computed using the straight-line method, net of estimated salvage values, over the estimated useful lives of the assets. Expenditures for repairs and maintenance are charged to expense when incurred. Expenditures which extend the useful lives of existing equipment are capitalized and depreciated. Upon retirement or disposition of property and equipment, the cost and related accumulated depreciation are removed from the accounts and any resulting gain or loss is recognized. Leasehold improvements are capitalized and amortized over the lesser of the life of the lease or the estimated useful life of the asset.
Impairment of long-lived assets—Long-lived assets are comprised principally of property and equipment. We review long-lived assets for impairment whenever events or changes in circumstances indicate that the carrying amount may not be recoverable. Impairment losses are recorded on assets used in operations when indicators of impairment are present and the undiscounted cash flows to be generated by those assets are less than the carrying amount.
Goodwill—Goodwill represents the excess of the purchase price paid over the fair value of the net assets acquired in connection with business acquisitions plus cost of acquisition. We test for the impairment of goodwill on at least an annual basis. Our goodwill impairment test involves a comparison of the fair value of each reporting unit with its carrying amount. If the fair value is less than the carrying amount, goodwill is considered impaired.
Intangible Assets—We evaluate the recoverability of identifiable intangible assets whenever events or changes in circumstances indicate that an intangible asset’s carrying amount may not be recoverable. Such circumstances could include, but are not limited to: (1) a significant decrease in the market value of an asset, (2) a significant adverse change in the extent or manner in which an asset is used, or (3) an accumulation of costs significantly in excess of the amount originally expected for the acquisition of an asset. We measure the carrying amount of the asset against the estimated undiscounted future cash flows associated with it. Should the sum of the expected future net cash flows be less than the carrying value of the asset being evaluated, an impairment loss would be recognized. The impairment loss would be calculated as the amount by which the carrying value of the asset exceeds its fair value. The estimate of fair value is based on various valuation techniques, including the discounted value of estimated future cash flows over the life of the asset being evaluated. These assumptions require significant judgment and actual results may differ from assumed and estimated amounts.
Debt issuance costs—We defer certain expenses incurred to obtain debt financing and amortize these costs to interest expense over the term of the respective agreements.
Fair Value of Financial Assets and Liabilities—Statement of Financial Accounting Standard No. 157 “Fair Value Measurements” (“SFAS 157”) defines fair value as the exchange price that would be received for an asset or paid to transfer a liability (an exit price) in the principal or most advantageous market for the asset or liability in an orderly transaction between market participants on the measurement date. SFAS 157 classifies the inputs used to measure fair value into the following hierarchy:
Level 1—Quoted prices in active markets for identical assets or liabilities. The Company uses stock quotes from an active, established stock market for the valuation of its short-term investments, which are reported in other current assets in the Company’s consolidated balance sheet.
F-9
Table of Contents
METALS USA HOLDINGS CORP. AND SUBSIDIARIES
NOTES TO CONSOLIDATED FINANCIAL STATEMENTS—Continued
(dollars in millions)
Level 2—Observable inputs other than Level 1 prices such as quoted prices for similar assets or liabilities; quoted prices in markets that are not active; or other inputs that are observable or can be corroborated by observable market data for substantially the full term of the assets or liabilities. The Company’s interest rate swap derivatives are valued using market data which is derived by combining certain inputs with quantitative models and processes to generate interest rate forward curves and discount factors (see Note 6).
Level 3—Unobservable inputs that are supported by little or no market activity, but which are significant to the fair value of the assets or liabilities as determined by market participants.
Assets and liabilities measured at fair value on a recurring basis are summarized below:
| Fair Value Measurements as of December 31, 2008 | ||||||||||||||
| Total | Level 1 | Level 2 | Level 3 | |||||||||||
| Short-term investments |
$ | 0.1 | $ | 0.1 | $ | — | $ | — | ||||||
| Interest rate swaps |
(6.6 | ) | — | (6.6 | ) | — | ||||||||
| Total |
(6.5 | ) | 0.1 | (6.6 | ) | — | ||||||||
Unrealized gains or losses on short-term investments and derivatives are recorded in accumulated other comprehensive income (loss) at each measurement date.
Our receivables, payables, prepayments and accrued liabilities are current assets and obligations and on normal terms and, accordingly, the recorded values are believed by management to approximate fair value. The amount outstanding under the Company’s Senior Secured Asset-Based Revolving Credit Facility (the “ABL facility”) approximated its fair value as of December 31, 2007. The estimated fair value of the Company’s debt at December 31, 2008 excludes an amount for the ABL facility due to the global tightening of credit conditions, which would make a hypothetical bank refinancing unlikely as of December 31, 2008. Our Senior Floating Rate Toggle Notes due 2012 (the “2007 Notes”) and our 11 1/8% Senior Secured Notes due 2015 (the “Metals USA Notes”) are thinly traded public debt instruments; accordingly, their market prices at any balance sheet date may not be representative of the prices which would be derived from a more active market. The fair value of publicly traded debt is determined based on quoted market prices. The fair value of debt which is not publicly traded is estimated using cash flows discounted at current borrowing rates. The estimated fair value of current and long-term debt at December 31, 2008 and 2007 was $252.1 and $809.2, respectively.
Foreign Currency Translation—The functional currency for our Canadian subsidiary, Allmet (see Note 2, Acquisitions), is the Canadian dollar. We translate the functional currency into U.S. dollars based on the current exchange rate at the end of the period for the balance sheet and a weighted average rate for the period on the statement of operations. The resulting translation adjustments are recorded in Accumulated Other Comprehensive Income (Loss), a component of Stockholders’ Equity.
Revenue recognition—We recognize revenues generally when products are shipped and our significant obligations have been satisfied. Shipping and handling costs billed to our customers are accounted for as revenues. Risk of loss for products shipped generally passes at the time of shipment. Provisions are made currently for estimated returns.
F-10
Table of Contents
METALS USA HOLDINGS CORP. AND SUBSIDIARIES
NOTES TO CONSOLIDATED FINANCIAL STATEMENTS—Continued
(dollars in millions)
Cost of sales—Our Plates and Shapes and Flat Rolled and Non-Ferrous Groups classify, within cost of sales, the underlying commodity cost of metal purchased in mill form, the cost of inbound freight charges together with third-party processing cost, if any.
Cost of sales with respect to our Building Products Group includes the cost of raw materials, manufacturing labor and overhead costs, together with depreciation and amortization expense associated with property, buildings and equipment used in the manufacturing process.
Operating and delivery expenses—Our operating and delivery expense reflects the cost incurred by our Plates and Shapes and Flat Rolled and Non-Ferrous Groups for labor and facility costs associated with the value-added metal processing services that we provide. With respect to our Building Products Group, operating costs are associated with the labor and facility costs attributable to the warehousing of our finished goods at our service center facilities. Delivery expense reflects labor, material handling and other third-party costs incurred with the delivery of product to customers.
Delivery expense totaled $50.8, $46.8, and $48.1 for the years ended December 31, 2008, 2007, and 2006, respectively.
Selling, general and administrative expenses—Selling, general and administrative expenses include sales and marketing expenses, executive officers’ compensation, office and administrative salaries, insurance, accounting, legal, computer systems, and professional services costs not directly associated with the processing, manufacturing, operating or delivery costs of our products.
Depreciation and amortization—Depreciation and amortization expense represents the costs associated with property, buildings and equipment used throughout the Company except for depreciation and amortization expense associated with the manufacturing assets employed by our Building Products Group, which is included within cost of sales. This caption also includes amortization of intangible assets.
Income taxes—Deferred income taxes are recognized for the future tax consequences of differences between the tax bases of assets and liabilities and their financial reporting amounts based on enacted tax laws and statutory tax rates applicable to the periods in which the differences are expected to affect taxable income. Valuation allowances are established when necessary to reduce deferred tax assets to the amount that is more likely than not to be realized. We consider future taxable income and ongoing tax planning strategies in assessing the need for a valuation allowance.
New Accounting Pronouncements
In May 2008, the FASB issued SFAS No. 162, “Hierarchy of Generally Accepted Accounting Principles” (“SFAS 162”). This statement is intended to improve financial reporting by identifying a consistent framework, or hierarchy, for selecting accounting principles to be used in preparing financial statements of nongovernmental entities that are presented in conformity with GAAP. This statement will be effective 60 days following the U.S. Securities and Exchange Commission’s approval of the Public Company Accounting Oversight Board amendment to AU Section 411, “The Meaning of Present Fairly in Conformity with Generally Accepted Accounting Principles.” The Company is currently evaluating the potential impact, if any, of the adoption of SFAS 162 on its consolidated financial statements.
F-11
Table of Contents
METALS USA HOLDINGS CORP. AND SUBSIDIARIES
NOTES TO CONSOLIDATED FINANCIAL STATEMENTS—Continued
(dollars in millions)
In April 2008, the FASB issued FASB Staff Position (“FSP”) No. SFAS 142-3, “Determination of the Useful Life of Intangible Assets” (“FSP SFAS 142-3”). FSP SFAS 142-3 amends the factors that should be considered in developing renewal or extension assumptions used to determine the useful life of a recognized intangible asset under SFAS No. 142, “Goodwill and Other Intangible Assets” (“SFAS 142”). The intent of FSP SFAS 142-3 is to improve the consistency between the useful life of a recognized intangible asset under SFAS 142 and the period of expected cash flows used to measure the fair value of the asset under SFAS No. 141R (revised 2007), “Business Combinations” (“SFAS 141R”) and other applicable accounting literature. FSP SFAS 142-3 is effective for financial statements issued for fiscal years beginning after December 15, 2008 and must be applied prospectively to intangible assets acquired after the effective date. The Company is currently evaluating the potential impact, if any, of FSP SFAS 142-3 on its consolidated financial statements.
In March 2008, the FASB issued SFAS No. 161, “Disclosures About Derivative Instruments and Hedging Activities—an amendment of FASB Statement No. 133” (“SFAS 161”), which expands the disclosure requirements in SFAS 133 about an entity’s derivative instruments and hedging activities. SFAS 161’s disclosure provisions apply to all entities with derivative instruments subject to SFAS 133 and its related interpretations. The provisions also apply to related hedged items, bifurcated derivatives, and nonderivative instruments that are designated and qualify as hedging instruments. Entities with instruments subject to SFAS 161 must provide more robust qualitative disclosures and expanded quantitative disclosures. Such disclosures, as well as existing SFAS 133 required disclosures, generally will need to be presented for every annual and interim reporting period. SFAS 161 is effective for financial statements issued for fiscal years and interim periods beginning after November 15, 2008. The Company is currently evaluating the potential impact of adopting SFAS 161, if any, on its consolidated financial statements.
In December 2007, the FASB issued SFAS No. 141 (revised 2007), “Business Combinations” (“SFAS 141R”), which replaces SFAS 141. SFAS 141R establishes principles and requirements for how an acquirer recognizes and measures in its financial statements the identifiable assets acquired, the liabilities assumed, any non-controlling interest in the acquiree and the goodwill acquired in connection with a business combination. The Statement also establishes disclosure requirements that will enable users to evaluate the nature and financial effect of the business combination. SFAS 141R applies prospectively to business combinations for which the acquisition date is on or after the beginning of an entity’s first fiscal year that begins after December 15, 2008. The Company is currently evaluating the potential impact, if any, of the adoption of SFAS 141R on the Company’s financial statements.
In December 2007, the FASB issued SFAS No. 160, “Noncontrolling Interests in Consolidated Financial Statements—an amendment of ARB No. 51” (“SFAS 160”). SFAS 160 requires that accounting and reporting for minority interests will be recharacterized as noncontrolling interests and classified as a component of equity. SFAS 160 also establishes reporting requirements that provide sufficient disclosures that clearly identify and distinguish between the interests of the parent and the interests of the noncontrolling owners. This Statement is effective as of the beginning of an entity’s first fiscal year beginning after December 15, 2008. The Company has not yet determined the impact, if any, that SFAS 160 will have on its financial statements.
In September 2006, the FASB issued SFAS No. 158, “Employers’ Accounting for Defined Benefit Pension and Other Postretirement Plans—an amendment of FASB Statements No. 87, 88, 106, and 132(R) (“SFAS 158”), which requires the recognition of the funded status of benefit plans in the
F-12
Table of Contents
METALS USA HOLDINGS CORP. AND SUBSIDIARIES
NOTES TO CONSOLIDATED FINANCIAL STATEMENTS—Continued
(dollars in millions)
balance sheet. SFAS 158 also requires certain gains and losses that are deferred under current pension accounting rules to be recognized in accumulated other comprehensive income, net of tax effects. These deferred costs (or income) will continue to be recognized as a component of net periodic pension cost, consistent with current recognition rules. For entities with no publicly traded equity securities, the effective date for the recognition of the funded status is for fiscal years ending after June 15, 2007. In addition, the ability to measure the plans’ benefit obligations, assets and net periodic cost at a date prior to the fiscal year-end date is eliminated for fiscal years ending after December 15, 2008. The adoption of SFAS 158 did not have a material impact on the Company’s financial statements.
In September 2006, the FASB issued SFAS 157, which enhances existing guidance for measuring assets and liabilities using fair value. SFAS 157 provides a single definition of fair value, together with a framework for measuring it, and requires additional disclosure about the use of fair value to measure assets and liabilities. SFAS 157 also emphasizes that fair value is a market-based measurement, not an entity-specific measurement, and sets out a fair value hierarchy with the highest priority being quoted market prices in active markets. Under the standard, fair value measurements would be separately disclosed by level within the fair value hierarchy. SFAS 157, as it relates to financial assets and financial liabilities, was effective for the Company as of January 1, 2008. SFAS 157 does not require any new fair value measurements for existing assets and liabilities on the Company’s balance sheet as of the date of adoption. Rather, the provisions of SFAS 157 are to be applied prospectively. As such, there was no impact to the Company’s financial statements as of the January 1, 2008 adoption date, and for the year ended December 31, 2008, we have included the Statement’s expanded disclosures about the use of fair value to measure assets and liabilities within the Company’s financial statements.
In February 2008, the FASB issued FASB Staff Position (“FSP”) No. FAS 157-2, “Effective Date of FASB Statement No. 157” (“FSP FAS 157-2”), which delays the effective date of SFAS 157 for all nonfinancial assets and nonfinancial liabilities, except those that are recognized or disclosed at fair value in the financial statements on at least an annual basis, until fiscal years beginning after November 15, 2008. The Company is currently evaluating the potential impact of adopting FSP FAS 157-2, if any, on its consolidated financial statements.
2. Acquisitions
2007 Acquisition
On July 2, 2007, we purchased the business operations of Lynch Metals (“Lynch Metals”), for approximately $42.4. The purchase price was funded by borrowings under the ABL facility, $38.4 of which was paid at closing, and approximately $4.0 of which was deferred and is being paid in various installments over a period of two years from the closing date. The excess of the aggregate purchase price over the estimated fair value of net assets acquired was approximately $20.5, which was allocated to goodwill. The estimated fair value of accounts receivable, inventories, and property and equipment acquired were $4.4, $4.2 and $1.8, respectively. The estimated fair value of customer list and trade name intangible assets was $10.1 and $3.3, respectively. The estimated fair value of accounts payable and accrued liabilities assumed was $2.3. In connection with the completion of the valuation of property and equipment in the second quarter of 2008, $0.4 was reclassified from goodwill to property and equipment. The results of operations for the Lynch Metals acquisition are included in the Company’s consolidated results of operations beginning July 2, 2007.
F-13
Table of Contents
METALS USA HOLDINGS CORP. AND SUBSIDIARIES
NOTES TO CONSOLIDATED FINANCIAL STATEMENTS—Continued
(dollars in millions)
Lynch Metals is a value-added, metal service center that focuses on specialty aluminum, with locations in New Jersey and California. Lynch Metals uses enhanced technologies in slitting, shearing, and cut-to-length to service the just-in-time requirements of its customers, who are predominately manufacturers of air/heat transfer products specifically focused on aerospace, automotive and industrial applications. This acquisition is an important strategic addition to our Flat Rolled and Non-Ferrous Group because it supports our increased presence in the strategic Northeast and Southern California regions. Lynch Metals’ product line and processing capabilities are highly complementary to our Flat Rolled and Non-Ferrous segment, and we expect to expand sales of Lynch Metals’ non-ferrous products into our existing geographic base, as well as expand sales of non-ferrous and stainless products into Lynch Metals’ geographic base.
2006 Acquisitions
In May 2006, the Company completed two acquisitions for an aggregate purchase price of $50.7 (referred to collectively as the “2006 Acquisitions”). The excess of aggregate purchase price over the fair value of net assets acquired of $19.5 was allocated to goodwill. In addition, the fair values of intangible assets, inventories and property and equipment were increased by $9.4, $5.7 and $18.1, respectively. These acquisitions are described in more detail below.
On May 17, 2006, we purchased all of the assets and business operations of Port City Metal Services (“Port City”), located in Tulsa, Oklahoma, for approximately $41.3, which includes a $5.0 contingent payout provision that was made in 2008, subject to certain performance criteria.
On May 12, 2006, we purchased all of the assets and operations of Allmet (effective June 30, 2007, we changed the trade name from Dura-Loc Roofing Systems Limited to Allmet to better facilitate our marketing objectives) (“Allmet”) for approximately $10.4 Canadian dollars (approximately U.S. $9.4). Allmet has one manufacturing facility located near Toronto, Ontario, Canada. The results of operations of the 2006 Acquisitions are included in the Company’s consolidated results of operations beginning May 1, 2006 (Port City) and May 13, 2006 (Allmet).
Pro Forma Results
The following unaudited pro forma information presents the Company’s consolidated results of operations for the years ended December 31, 2007 and 2006 as if the Lynch Metals acquisition and the 2006 Acquisitions had occurred on January 1, 2006:
| Years Ended December 31, | ||||||
| 2007 | 2006 | |||||
| Revenues |
$ | 1,860.9 | $ | 1,857.4 | ||
| Net income |
14.4 | 73.9 | ||||
F-14
Table of Contents
METALS USA HOLDINGS CORP. AND SUBSIDIARIES
NOTES TO CONSOLIDATED FINANCIAL STATEMENTS—Continued
(dollars in millions)
3. Inventories
Inventories consist of the following:
| December 31, | ||||||
| 2008 | 2007 | |||||
| Raw materials— |
||||||
| Plates and Shapes |
$ | 254.8 | $ | 222.9 | ||
| Flat Rolled and Non-Ferrous |
111.7 | 117.0 | ||||
| Building Products |
10.9 | 13.6 | ||||
| Total raw materials |
377.4 | 353.5 | ||||
| Work-in-process and finished goods— |
||||||
| Plates and Shapes |
— | — | ||||
| Flat Rolled and Non-Ferrous |
29.2 | 35.8 | ||||
| Building Products |
16.0 | 20.5 | ||||
| Total work-in-process and finished goods |
45.2 | 56.3 | ||||
| Total inventories |
$ | 422.6 | $ | 409.8 | ||
4. Property and Equipment
Property and equipment consists of the following:
| Estimated Useful Lives |
December 31, | |||||||||
| 2008 | 2007 | |||||||||
| Land |
— | $ | 10.5 | $ | 11.5 | |||||
| Buildings and improvements |
3-40 years | 71.1 | 71.4 | |||||||
| Machinery and equipment |
2-25 years | 142.3 | 136.8 | |||||||
| Automobiles and trucks |
3-10 years | 3.3 | 3.0 | |||||||
| Construction in progress |
— | 1.7 | 4.4 | |||||||
| Total property and equipment |
228.9 | 227.1 | ||||||||
| Less: Accumulated depreciation |
(38.8 | ) | (25.0 | ) | ||||||
| Total property and equipment, net |
$ | 190.1 | $ | 202.1 | ||||||
Depreciation expense for the years ended December 31, 2008, 2007 and 2006 was $12.8, $11.7 and $11.2, respectively.
5. Intangible Assets
The fair values of identifiable intangibles recorded as a result of the Merger, the 2006 Acquisitions and the Lynch acquisition were determined using valuation techniques and other studies. We are amortizing customer lists over five years using an accelerated amortization method which approximates their estimated useful lives. We are amortizing the Lynch trade name on a straight-line basis over fifteen years.
F-15
Table of Contents
METALS USA HOLDINGS CORP. AND SUBSIDIARIES
NOTES TO CONSOLIDATED FINANCIAL STATEMENTS—Continued
(dollars in millions)
The carrying amounts of the Company’s intangible assets are as follows:
| December 31, | ||||||||
| 2008 | 2007 | |||||||
| Customer lists |
$ | 40.7 | $ | 41.6 | ||||
| Effect of foreign currency |
0.1 | 0.5 | ||||||
| Less: Accumulated amortization |
(30.3 | ) | (22.2 | ) | ||||
| $ | 10.5 | $ | 19.9 | |||||
| Trade name |
$ | 3.3 | $ | 3.3 | ||||
| Less: Accumulated amortization |
(0.3 | ) | (0.1 | ) | ||||
| $ | 3.0 | $ | 3.2 | |||||
| Patents |
$ | 0.6 | $ | 0.6 | ||||
| Less: Accumulated amortization |
(0.5 | ) | (0.4 | ) | ||||
| $ | 0.1 | $ | 0.2 | |||||
Aggregate amortization expense for the years ended December 31, 2008, 2007 and 2006 was $8.5, $10.4 and $11.3, respectively. In addition, we recognized a $0.9 impairment charge in the fourth quarter of 2008 in connection with the write-off of customer list intangible assets associated with the Patio Division of our building products business, which reduced the cost basis of such assets as of December 31, 2008.
The following table represents the total estimated amortization of customer list intangible assets, excluding the effect of foreign currency, for the five succeeding years:
| For the Year Ending |
Estimated Amortization Expense | ||
| 2009 |
$ | 4.8 | |
| 2010 |
$ | 3.4 | |
| 2011 |
$ | 1.6 | |
| 2012 |
$ | 0.5 | |
6. Derivatives
In February 2008, we entered into a series of interest rate swap agreements that entitle us to receive quarterly payments of interest at a floating rate indexed to the three-month London Interbank Offered Rate (“LIBOR”) and pay a fixed rate that ranges from 2.686% to 2.997%, thereby converting a portion of the outstanding borrowings on our ABL facility from a floating rate obligation to a fixed rate obligation. The interest rate swap agreements all have initial terms of approximately three years or less and the associated underlying transactions are expected to occur within that time frame.
We have designated the interest rate swaps as cash flow hedges for accounting purposes. We account for these hedges in accordance with SFAS 133, and therefore defer in accumulated other comprehensive income (loss), a component of stockholders’ deficit, the effective portion of cash flow hedging gains and losses that equal the change in cost of the underlying hedged transactions. As the underlying hedged transactions occur, the associated deferred hedging gains and losses are reclassified into earnings to match the change in cost of the transaction.
F-16
Table of Contents
METALS USA HOLDINGS CORP. AND SUBSIDIARIES
NOTES TO CONSOLIDATED FINANCIAL STATEMENTS—Continued
(dollars in millions)
Below are the notional transaction amounts and fair value for the Company’s outstanding derivatives at December 31, 2008. Because we hedge only with derivatives that have high correlation with the underlying transaction cost, changes in derivatives fair value and the underlying cost are expected to largely offset.
| December 31, 2008 | |||||||
| Notional Amount | Fair Value | ||||||
| Interest rate swaps |
$ | 250.0 | $ | (6.6 | ) | ||
We recognized a pretax loss of $2.4 in earnings (interest expense) during the year ended December 31, 2008, which was due to the change in fair value of the interest rate swap derivatives previous to their qualification for hedge accounting treatment. Other pretax realized gains and losses from derivatives which were recognized in earnings during the year ended December 31, 2008, subsequent to qualification for hedge accounting treatment, were not material. These gains and losses effectively offset changes in the cost of the Company’s hedged exposure, and no component of these gains and losses was excluded from the Company’s assessment of hedge effectiveness. The fair value of the Company’s interest rate swaps was $6.6 at December 31, 2008, with $1.7 classified as other current liabilities and $4.8 classified as other noncurrent liabilities in the consolidated balance sheet.
7. Other Assets
Other assets consist of the following:
| December 31, | ||||||
| 2008 | 2007 | |||||
| Deferred financing costs |
$ | 8.0 | $ | 7.9 | ||
| Deferred debt offering costs |
9.6 | 11.3 | ||||
| Deferred management fees |
4.9 | 6.1 | ||||
| Other |
1.6 | 0.7 | ||||
| Total other assets |
$ | 24.1 | $ | 26.0 | ||
Debt issuance costs incurred for the years ended December 31, 2008, 2007 and 2006 were $2.7, $6.2, and $5.9, respectively. Amortization of debt issuance costs for the years ended December 31, 2008, 2007 and 2006 was $4.2, $7.4, and $2.5, respectively. Amortization for the year ended December 31, 2007 includes $3.8 of accelerated amortization of the remaining debt issuance costs incurred in connection with the issuance of Metals USA Holdings’ $150.0 initial aggregate principal amount of Senior Floating Rate Toggle Notes due 2012 (the “2006 Notes”), which were redeemed in August 2007.
F-17
Table of Contents
METALS USA HOLDINGS CORP. AND SUBSIDIARIES
NOTES TO CONSOLIDATED FINANCIAL STATEMENTS—Continued
(dollars in millions)
8. Accrued Liabilities
Accrued liabilities consist of the following:
| December 31, | ||||||
| 2008 | 2007 | |||||
| Accrued salaries and employee benefits |
$ | 19.3 | $ | 15.2 | ||
| Accrued taxes, other than income |
3.1 | 4.4 | ||||
| Accrued interest |
14.6 | 13.8 | ||||
| Accrued insurance |
5.2 | 5.1 | ||||
| Accrued audit and tax fees |
0.8 | 0.6 | ||||
| Accrued warranty liability |
0.5 | 0.5 | ||||
| Accrued lease terminations |
0.2 | 0.5 | ||||
| Accrued management fees |
5.4 | 6.6 | ||||
| Accrued Merger consideration—Predecessor common shares outstanding |
6.0 | 8.1 | ||||
| Current portion of interest rate swap liability |
1.7 | — | ||||
| Other |
4.1 | 8.5 | ||||
| Total accrued liabilities |
$ | 60.9 | $ | 63.3 | ||
9. Debt
Debt consists of the following:
| December 31, | ||||||
| 2008 | 2007 | |||||
| Senior Secured Asset-Based Revolving Credit Facility (ABL facility) |
$ | 368.0 | $ | 280.5 | ||
| 11 1/8% Senior Secured Notes due 2015 (Metals USA Notes) |
275.0 | 275.0 | ||||
| Senior Floating Rate Toggle Notes due 2012 (2007 Notes) |
293.7 | 291.9 | ||||
| Industrial Revenue Bond |
5.7 | 5.7 | ||||
| Other |
1.8 | 4.2 | ||||
| Total debt |
944.2 | 857.3 | ||||
| Less—current portion of debt |
1.6 | 2.3 | ||||
| Total long-term portion of debt |
$ | 942.6 | $ | 855.0 | ||
The weighted average interest rate under the ABL facility for the years ended December 31, 2008 and 2007 was 4.31% and 7.06%, respectively.
Senior Secured Asset-Based Revolving Credit Facility
The ABL facility permits us to borrow on a revolving basis through November 30, 2011. Substantially all of our subsidiaries are borrowers under the ABL facility.
On June 8, 2007, we executed an amendment to the ABL facility (the “June 2007 amendment”), which increased the commitment from $450.0 to $525.0, comprised of $500.0 of Tranche A Commitments and $25.0 of Tranche A-1 Commitments. Additionally, the June 2007 amendment reduced the borrowing cost on the Tranche A facility by 25 basis points, reduced the borrowing cost on
F-18
Table of Contents
METALS USA HOLDINGS CORP. AND SUBSIDIARIES
NOTES TO CONSOLIDATED FINANCIAL STATEMENTS—Continued
(dollars in millions)
the Tranche A-1 facility by 75 basis points and gave us the option to increase the Tranche A Commitments by $100.0. The June 2007 amendment did not have any impact on our covenant compliance. Costs incurred in connection with the June 2007 amendment totaled $1.6, and are being amortized over the existing term of the ABL facility, which expires November 30, 2011.
On July 1, 2008, we executed our option to increase the Tranche A Commitments by $100.0, which increased the total commitment from $525.0 to $625.0. All other existing terms under the ABL facility remained unchanged. Costs incurred to exercise the option to increase the ABL facility totaled $2.4, and are being amortized over the existing term of the ABL facility.
The maximum availability under the ABL facility is based on eligible receivables and eligible inventory, subject to certain reserves. During September 2008, we borrowed approximately $160.0 on the ABL facility in response to concerns about credit markets. As of December 31, 2008, we had eligible collateral of $453.7, $368.0 in outstanding advances, $15.1 in open letters of credit and $70.7 of additional borrowing capacity. As of December 31, 2008, we had $166.7 of available cash and cash equivalents.
The obligations under the ABL facility are guaranteed by the Company and certain of our domestic subsidiaries and are secured (i) on a first-priority lien basis by accounts receivable and inventory and (ii) on a second-priority lien basis by other assets, subject to certain exceptions and permitted liens.
The ABL facility bears interest with respect to loans utilizing the Tranche A Commitments at the bank’s base rate plus an applicable margin ranging between -0.25% and -0.50%, or LIBOR, at our option, plus an applicable margin ranging between 1.00% and 1.75% as determined in accordance with the amended loan and security agreement governing the ABL facility. The ABL facility bears interest with respect to the Tranche A-1 Commitments at the bank’s base rate plus an applicable margin of 0.75%, or LIBOR, at our option, plus an applicable margin of 2.75% under the June 2007 amendment. The marginal rates related to the Tranche A Commitments will vary with our financial performance as measured by the fixed charge coverage ratio (the “FCCR”). The FCCR is determined by dividing (i) the sum of Adjusted EBITDA (as defined by the loan and security agreement governing the ABL facility) minus income taxes paid in cash minus non-financed capital expenditures by (ii) the sum of certain distributions paid in cash, cash interest expense and scheduled principal reductions on debt, and is calculated based on such amounts for the three immediately preceding months.
For purposes of determining covenant compliance, the FCCR is calculated based on the most recent period of four consecutive fiscal quarters. As long as our borrowing availability is greater than or equal to $45.0, we do not have to maintain a minimum fixed charge coverage ratio. Should borrowing availability fall below $45.0, we must maintain a fixed charge coverage ratio of at least 1.0 to 1.0. As of December 31, 2008, our FCCR was 2.91.
Interest on base rate loans is payable on the last day of each quarter. Interest on LIBOR loans is payable on maturity of the LIBOR loan or on the last day of the quarter if the term of the LIBOR loan exceeds 90 days. A commitment fee of 0.25% per annum is payable on any unused commitments under the ABL facility. The applicable base rate and the effective LIBOR rate for the Tranche A Commitments and Tranche A-1 Commitments were 3.25% and 1.425%, respectively, as of December 31, 2008.
F-19
Table of Contents
METALS USA HOLDINGS CORP. AND SUBSIDIARIES
NOTES TO CONSOLIDATED FINANCIAL STATEMENTS—Continued
(dollars in millions)
The loan and security agreement governing the ABL facility requires us to comply with limited affirmative, negative and subjective covenants, the most significant of which are: (i) the maintenance of a borrowing base availability of at least $45.0, or, if such required borrowing base availability is not maintained, the maintenance of the FCCR, (ii) restrictions on additional indebtedness and (iii) restrictions on liens, guarantees and quarterly dividends. There are no limitations with respect to capital expenditures.
The loan and security agreement governing the ABL facility provides for up to $15.0 of swingline loans and up to $100.0 for the issuance of letters of credit. Both the face amount of any outstanding letters of credit and any swingline loans will reduce borrowing availability under the ABL facility on a dollar-for-dollar basis.
The ABL facility contains customary representations, warranties and covenants as a precondition to lending, which includes a material adverse change in the business, limitations on our ability to incur or guarantee additional debt, subject to certain exceptions, pay dividends, or make redemptions and repurchases with respect to capital stock, repay debt, create or incur certain liens, make certain loans or investments, make acquisitions or investments, engage in mergers, acquisitions, asset sales and sale lease-back transactions, and engage in certain transactions with affiliates. In addition, the ABL facility requires a lock-box arrangement, which as long as borrowing availability is greater or equal to $45.0 and in the absence of default, is controlled by the Company.
The ABL facility contains events of default with respect to: default in payment of principal when due, default in the payment of interest, fees or other amounts after a specified grace period, material breach of the representations or warranties, default in the performance of specified covenants, failure to make any payment when due under any indebtedness with a principal amount in excess of a specified amount, certain bankruptcy events, certain ERISA violations, invalidity of certain security agreements or guarantees, material judgments or a change of control. In the event of default the agreement may permit the lenders to: (i) restrict the account or refuse to make revolving loans; (ii) cause customer receipts to be applied against borrowings under the ABL facility causing the Company to suffer a rapid loss of liquidity and the ability to operate on a day-to-day basis; (iii) restrict or refuse to provide letters of credit; or ultimately: (iv) terminate the commitments and the agreement; or (v) declare any or all obligations to be immediately due and payable if such default is not cured in the specified period required. Any payment default or acceleration under the ABL facility on amounts in excess of $15.0 million would also result in a default under the Metals USA Notes and the 2007 Notes that would provide the holders of the Metals USA Notes and the 2007 Notes with the right to demand immediate repayment. We are in compliance with all covenants as of December 31, 2008.
In February 2008, $250.0 notional amount of outstanding borrowings under the ABL facility was swapped from a floating LIBOR-based rate to a fixed rate (see Note 6).
Costs related to the establishment of the ABL facility, in addition to subsequent amendments to the ABL facility, were capitalized and are being charged to interest expense over the life of the ABL facility. Unamortized issuance costs of $8.0 as of December 31, 2008, are included in other non-current assets.
F-20
Table of Contents
METALS USA HOLDINGS CORP. AND SUBSIDIARIES
NOTES TO CONSOLIDATED FINANCIAL STATEMENTS—Continued
(dollars in millions)
Senior Floating Rate Toggle Notes due 2012
On July 10, 2007, Metals USA Holdings issued $300.0 initial aggregate principal amount of Senior Floating Rate Toggle Notes due 2012 (the “2007 Notes”). The 2007 Notes were issued at an initial issue price of 97% of the principal amount thereof, and the original issue discount is being amortized to interest expense over the life of the 2007 Notes. The 2007 Notes are senior unsecured obligations that are not guaranteed by any of Metals USA Holdings’ subsidiaries. As such, the 2007 Notes are structurally subordinated to all indebtedness and other liabilities (including trade payables) of Metals USA Holdings’ subsidiaries.
Metals USA Holdings must make an election regarding whether interest payments on the 2007 Notes will be made in cash or through PIK Interest prior to the start of the applicable interest period. Metals USA Holdings may elect to pay interest (1) entirely in cash or (2) entirely by increasing the principal amount of the 2007 Notes or issuing new 2007 Notes (“PIK Interest”), or (3) on 50% of the outstanding principal amount of the 2007 Notes in cash and on 50% of the outstanding principal amount of the 2007 Notes by increasing the principal amount of the outstanding 2007 Notes or by issuing new 2007 Notes (“Partial PIK Interest”). Cash interest on the 2007 Notes will accrue at a rate per annum, reset quarterly, equal to LIBOR plus a spread of 6.00%, which increases by 0.25% to 6.25% in year 2, by 0.50% to 6.50% in year 3, and by 0.75% to 6.75% in year 4. In the event PIK Interest is paid on the 2007 Notes after the first four interest periods, the then-applicable margin over LIBOR on the 2007 Notes would increase by 0.75% for each period in which PIK Interest is paid. If Metals USA Holdings elects to pay any PIK Interest, Metals USA Holdings will increase the principal amount on the 2007 Notes or issue new 2007 Notes in an amount equal to the amount of PIK Interest for the applicable interest payment period to holders of the 2007 Notes on the relevant record date. Interest is payable quarterly in arrears on January 1, April 1, July 1 and October 1. PIK Interest notes, resulting from the conversion of interest into PIK notes, when paid will be treated as an operating activity in the Consolidated Statements of Cash Flows in accordance with SFAS 95.
The initial five interest payments on the 2007 Notes were paid solely in cash. Flag Intermediate provided funds to Metals USA Holdings to fund the initial five quarterly interest payments on the 2007 Notes, which were paid on October 1, 2007, January 2, 2008, April 1, 2008, July 1, 2008, and October 1, 2008 and which totaled $7.7, $8.4, $8.1, $6.5 and $6.6, respectively.
On September 26, 2008, we made a permitted election under the indenture governing the 2007 Notes to pay all interest that is due on January 1, 2009, for the interest period beginning on October 1, 2008, and ending on December 31, 2008, entirely through PIK Interest. The Company must make an election regarding whether subsequent interest payments will be made in cash, through PIK Interest, or Partial PIK Interest, prior to the start of the applicable interest period. In the absence of such an election for any interest period, interest on the 2007 Notes will be payable according to the election for the previous interest period. As a result, the PIK Interest election is now the default election for future interest periods unless we elect otherwise not later than the commencement of an interest period.
The terms of the ABL facility, as well as the indenture governing the Metals USA Notes, restrict Flag Intermediate and certain of its subsidiaries from making payments or transferring assets to Metals USA Holdings, including dividends, loans, or distributions. Such restrictions include prohibition of dividends in an event of default and limitations on the total amount of dividends paid to Metals USA Holdings. In the event these agreements do not permit Flag Intermediate to provide Metals USA Holdings with sufficient distributions to fund interest and principal payments on the 2007 Notes when
F-21
Table of Contents
METALS USA HOLDINGS CORP. AND SUBSIDIARIES
NOTES TO CONSOLIDATED FINANCIAL STATEMENTS—Continued
(dollars in millions)
due, Metals USA Holdings may default on the 2007 Notes unless other sources of funding are available. Amounts available under these restricted payment provisions amounted to $2.0 under the indenture governing the Metals USA Notes and $62.1 under the loan and security agreement governing the ABL facility as of December 31, 2008. As of December 31, 2008, Metals USA Holdings had $166.7 of available cash and cash equivalents.
On or after January 15, 2008, Metals USA Holdings may redeem some or all of the 2007 Notes at certain redemption prices, plus accrued and unpaid interest and additional interest, if any, to the redemption date. If Metals USA Holdings makes certain public offerings, sales or issuances of common stock, and does not redeem the 2007 Notes, it will be required to make an offer to repurchase the maximum principal amount of the 2007 Notes that may be purchased out of the proceeds thereof, at a price equal to 100% of the principal amount, plus accrued and unpaid interest and additional interest, if any, to the date of repurchase.
If Metals USA Holdings experiences a change of control and does not redeem the 2007 Notes, it will be required to make an offer to repurchase the 2007 Notes at a price equal to 101% of the principal amount, plus accrued interest and unpaid interest and additional interest, if any, to the date of repurchase.
We will pay interest on overdue principal at 1% per annum in excess of the rates discussed above and will pay interest on overdue installments of interest at such higher rate to the extent lawful. The indenture governing the 2007 Notes contains covenants described under “Covenant Compliance” below.
The indenture governing the 2007 Notes contains covenants that, among other things, limit Metals USA Holdings’ ability and the ability of certain of its subsidiaries to incur or guarantee additional indebtedness or issue disqualified or preferred stock, repurchase or redeem capital stock or subordinated indebtedness, pay dividends or make distributions to its stockholders, incur restrictions on the ability of its subsidiaries to pay dividends or to make other payments to Metals USA Holdings, transfer or sell assets, create liens, enter into transactions with affiliates, make investments or acquisitions, and merge or consolidate with other companies or transfer all or substantially all of its assets.
Our affiliates, which include investment funds affiliated with, or co-investment vehicles managed indirectly by, Apollo Management L.P., including Apollo Investment Fund V, L.P., along with its parallel investment funds (“Apollo Management” and together with its affiliated investment entities “Apollo”), as well as our Chief Executive Officer and our Chief Financial Officer, have purchased a portion of our 2007 Notes in the market. For the year ended December 31, 2008, interest paid on the 2007 Notes held by affiliates amounted to $8.4. From time to time, depending upon market, pricing and other conditions, as well on cash balances and liquidity, we, our subsidiaries or affiliates may seek to purchase or sell some amount of the Metals USA Notes or additional amounts of the 2007 Notes. Any such purchases or sales may be made in the open market, privately negotiated transactions, tender offers or otherwise. The amounts of any such purchases or sales may be material.
On February 26, 2008, we exchanged $216.0 aggregate principal amount of the $300.0 aggregate principal amount privately placed 2007 Notes for substantially identical 2007 Notes registered under the Securities Act of 1933, as amended.
F-22
Table of Contents
METALS USA HOLDINGS CORP. AND SUBSIDIARIES
NOTES TO CONSOLIDATED FINANCIAL STATEMENTS—Continued
(dollars in millions)
Costs related to the issuance of the 2007 Notes were capitalized and are being charged to interest expense over the life of the 2007 Notes. Unamortized issuance costs of $3.5 as of December 31, 2008, are included in other non-current assets.
11 1/8% Senior Secured Notes Due 2015
On November 30, 2005, Flag Acquisition sold $275.0 aggregate principal amount of the Metals USA Notes. The Metals USA Notes bear interest at a rate per annum equal to 11 1/8%, payable semi-annually in arrears, on June 1 and December 1 of each year, commencing on June 1, 2006. The Metals USA Notes will mature on December 1, 2015. We may redeem some or all of the Metals USA Notes at any time on or after December 1, 2010 at a predetermined redemption price plus accrued and unpaid interest and additional interest, if any, to the applicable redemption date. In addition, on or prior to December 1, 2008, we may redeem up to 35% of the aggregate principal amount of the Metals USA Notes with the net proceeds of certain equity offerings. If we experience a change of control and we do not redeem the Metals USA Notes, we will be required to make an offer to repurchase the Metals USA Notes at a price equal to 101% of the principal amount, plus accrued and unpaid interest and additional interest, if any, to the date of repurchase.
As a result of the Merger, Metals USA assumed the obligations of Flag Acquisition including the Metals USA Notes. All domestic operating subsidiaries of Metals USA have agreed, jointly and severally with Flag Intermediate (“Guarantors”), to unconditionally and irrevocably guarantee Metals USA’s obligations under the Metals USA Notes and Indenture dated as of November 30, 2005. Additionally, Flag Intermediate has unconditionally guaranteed to be a primary obligor of the due and punctual payment and performance of the obligations under the Indenture.
Metals USA Holdings is not a guarantor of the Metals USA Notes. There is a limitation on the amount of funds which can be transferred by the Guarantors to Metals USA Holdings in the form of dividends. The amount of dividends available for distribution to Metals USA Holdings was $2.0 as of December 31, 2008. Such amount available for distribution shall be increased by an amount equal to 50% of Consolidated Net Income, as defined, or reduced by an amount equal to 100% of Consolidated Net Loss, as defined.
The indebtedness evidenced by the Metals USA Notes and the guarantees will rank: equally with all of our and the Guarantors’ existing and future senior indebtedness; junior in priority as to collateral that secures the ABL facility on a first-priority lien basis with respect to our and the Guarantors’ obligations under the ABL facility, any other debt incurred after December 1, 2005 that has a priority security interest relative to the Metals USA Notes in the collateral that secures the ABL facility, any hedging obligations related to the foregoing debt and all cash management obligations incurred with any lender under the ABL facility; equal in priority as to collateral that secures the Metals USA Notes and the guarantees on a first-priority lien basis with respect to our and the Guarantors’ obligations under any other equivalent priority lien obligations incurred after December 1, 2005; and senior to all of our and the Guarantors’ existing and future subordinated indebtedness. The Metals USA Notes will also be effectively junior to the liabilities of the non-guarantor subsidiaries.
The Metals USA Notes contain covenants that are customary for debt instruments, including limitations on our or the guarantors’ ability to incur or guarantee additional debt, subject to certain exceptions, pay dividends, or make redemptions and repurchases with respect to capital stock, create
F-23
Table of Contents
METALS USA HOLDINGS CORP. AND SUBSIDIARIES
NOTES TO CONSOLIDATED FINANCIAL STATEMENTS—Continued
(dollars in millions)
or incur certain liens, make certain loans or investments, make acquisitions or investments, engage in mergers, acquisitions, asset sales and sale lease-back transactions, and engage in certain transactions with affiliates.
The Metals USA Notes indenture contains certain customary events of default, including (subject, in some cases, to customary cure periods thresholds) defaults based on (1) the failure to make payments under the Metals USA indenture when due, (2) breach of covenants, (3) cross-defaults to other material indebtedness, (4) bankruptcy events and (5) material judgments. We were in compliance with all covenants as of December 31, 2008.
Costs related to the establishment of the Metals USA Notes were capitalized and are being charged to interest expense over the life of the Metals USA Notes. Unamortized issuance costs of $6.1 as of December 31, 2008, are included in other non-current assets.
Industrial Revenue Bond
The Industrial Revenue Bond (“IRB”) is payable on May 1, 2016 in one lump sum payment. The interest rate assessed on the IRB varies from month to month and was 1.30% at December 31, 2008. The IRB is secured by real estate and equipment acquired with proceeds from the IRB. The IRB places various restrictions on certain of our subsidiaries, including but not limited to maintenance of required insurance coverage, maintenance of certain financial ratios, limits on capital expenditures and maintenance of tangible net worth and is supported by a letter of credit. We were in compliance with all covenants as of December 31, 2008.
Maturities
Scheduled maturities of long-term debt outstanding at December 31, 2008, are as follows:
| Years Ended December 31, | ||||||||||||||||||
| 2009 | 2010 | 2011 | 2012 | 2013 | Beyond | |||||||||||||
| (in millions) | ||||||||||||||||||
| ABL facility |
$ | — | $ | — | $ | 368.0 | $ | — | $ | — | $ | — | ||||||
| 11 1/8% Senior Secured Notes Due 2015 (Metals USA Notes) |
— | — | — | — | — | 275.0 | ||||||||||||
| Senior Floating Rate Toggle Notes Due 2012 (2007 Notes) |
— | — | — | 300.0 | — | — | ||||||||||||
| IRB |
— | — | — | — | — | 5.7 | ||||||||||||
| Other obligations |
1.6 | 0.1 | 0.1 | — | — | — | ||||||||||||
| Total |
$ | 1.6 | $ | 0.1 | $ | 368.1 | $ | 300.0 | $ | — | $ | 280.7 | ||||||
F-24
Table of Contents
METALS USA HOLDINGS CORP. AND SUBSIDIARIES
NOTES TO CONSOLIDATED FINANCIAL STATEMENTS—Continued
(dollars in millions)
10. Income Taxes
The components of the provision (benefit) for income taxes are as follows:
| Years Ended December 31, | ||||||||||||
| 2008 | 2007 | 2006 | ||||||||||
| Current provision: |
||||||||||||
| Federal |
$ | 38.5 | $ | 9.5 | $ | 27.6 | ||||||
| State |
10.2 | (0.6 | ) | 4.9 | ||||||||
| Foreign |
0.5 | (0.4 | ) | (0.1 | ) | |||||||
| $ | 49.2 | $ | 8.5 | $ | 32.4 | |||||||
| Deferred provision (benefit): |
||||||||||||
| Federal |
(2.4 | ) | (3.2 | ) | (6.1 | ) | ||||||
| State |
(0.7 | ) | (0.5 | ) | (0.5 | ) | ||||||
| (3.1 | ) | (3.7 | ) | (6.6 | ) | |||||||
| Total provision (benefit) |
$ | 46.1 | $ | 4.8 | $ | 25.8 | ||||||
The components of earnings (loss) from continuing operations before income taxes were as follows:
| Years Ended December 31, | ||||||||||||
| 2008 | 2007 | 2006 | ||||||||||
| United States |
$ | 119.9 | $ | 18.8 | $ | 65.3 | ||||||
| Foreign |
(1.2 | ) | (0.1 | ) | (0.2 | ) | ||||||
| Earnings (loss) from continuing operations before income taxes |
$ | 118.7 | $ | 18.7 | $ | 65.1 | ||||||
The provision (benefit) differs from an amount computed at the statutory rates as follows:
| Years Ended December 31, | |||||||||||
| 2008 | 2007 | 2006 | |||||||||
| Federal income tax at statutory rates |
$ | 41.5 | $ | 6.5 | $ | 22.7 | |||||
| State taxes, net of federal income tax benefit |
4.6 | 0.7 | 3.1 | ||||||||
| Nondeductible expenses and other: |
|||||||||||
| Valuation allowance |
— | 0.9 | — | ||||||||
| Revision of prior years’ tax estimates |
(1.4 | ) | (2.6 | ) | — | ||||||
| Other |
1.4 | (0.7 | ) | — | |||||||
| Total provision (benefit) |
$ | 46.1 | $ | 4.8 | $ | 25.8 | |||||
F-25
Table of Contents
METALS USA HOLDINGS CORP. AND SUBSIDIARIES
NOTES TO CONSOLIDATED FINANCIAL STATEMENTS—Continued
(dollars in millions)
The significant items giving rise to the deferred tax assets (liabilities) are as follows:
| December 31, | ||||||||
| 2008 | 2007 | |||||||
| Deferred tax assets: |
||||||||
| Accounts receivable and inventories |
$ | 14.0 | $ | 10.6 | ||||
| Accrued liabilities |
8.6 | 8.6 | ||||||
| Tax attributes and carry forwards |
17.1 | 21.4 | ||||||
| Property and equipment |
7.0 | 7.4 | ||||||
| Other |
3.3 | 2.3 | ||||||
| Total deferred tax assets |
50.0 | 50.3 | ||||||
| Deferred tax liabilities: |
||||||||
| Foreign DISC |
(0.6 | ) | (0.8 | ) | ||||
| Property and equipment |
(83.4 | ) | (69.9 | ) | ||||
| Intangible assets |
2.5 | (1.5 | ) | |||||
| Other comprehensive income |
2.8 | (0.4 | ) | |||||
| Other |
(1.3 | ) | (2.1 | ) | ||||
| Total deferred tax liabilities |
(80.0 | ) | (74.7 | ) | ||||
| Valuation allowance |
(8.6 | ) | (23.3 | ) | ||||
| Deferred tax assets (liabilities), net |
$ | (38.6 | ) | $ | (47.7 | ) | ||
As of December 31, 2008, we had recorded both federal and state current net deferred tax assets of $23.6, and we had recorded both federal and state non-current deferred tax liabilities of $62.2. As of December 31, 2007, we had recorded both federal and state current net deferred tax assets of $19.7, and we had recorded both federal and state non-current deferred tax liabilities of $67.4.
As of December 31, 2008 and 2007, we had net operating loss (“NOL”) carry forwards for U.S. federal income taxes of approximately $20.6 and $29.4, respectively, which begin to expire in 2023. Such NOLs and other tax attributes are subject to the Internal Revenue Code Section 382 related to changes in ownership from our 2002 bankruptcy reorganization and the Merger. The lowest applicable annual limitation is approximately $5.7. The NOL carry forwards are based on returns as currently filed. Our tax returns are subject to periodic audit by the various taxing jurisdictions in which we operate. These audits can result in adjustments to taxes due or adjustments to the NOLs which are available to offset future taxable income.
Effective December 1, 2005, and in conjunction with the Merger, deferred tax liabilities of $61.2 were recorded as a result of purchase price adjustments to property and equipment, as well as intangible assets and inventories. Deferred tax assets of $1.2 were recorded as a result of purchase price adjustments to accrued and other long- term liabilities. As of November 30, 2005, the Predecessor Company had tax assets related to pre-bankruptcy goodwill of $16.5. The tax benefits of goodwill amortization will be available to the Company. Under purchase accounting, we have not recorded a deferred tax asset for the future benefit of tax amortization; however, we will apply the tax benefits first as a reduction to goodwill related to the Merger (to zero), then as a reduction of non-current intangible assets related to the Merger as the benefits are realized. In the periods December 31, 2008 and 2007, goodwill was reduced by $1.8 and $1.8, respectively, in connection with the recognition of such tax benefits.
F-26
Table of Contents
METALS USA HOLDINGS CORP. AND SUBSIDIARIES
NOTES TO CONSOLIDATED FINANCIAL STATEMENTS—Continued
(dollars in millions)
SFAS No. 109 “Accounting for Income Taxes,” requires that deferred tax assets be reduced by a valuation allowance, if based on the weight of available evidence, it is more likely than not that some portion or all of the deferred tax assets will not be realized. The valuation allowance is adjusted in the periods that we determine the more likely than not standard will or will not be met. A valuation allowance of $8.6 and $23.3 was recorded at December 31, 2008 and at December 31, 2007, respectively. The $14.7 net decrease in the valuation allowance was primarily due to the reduction of valuation allowances related to federal and state NOLs by $13.1 and $2.2, respectively, which we expect to utilize before the carry forward statutes expire, partially offset by additional valuation allowances of $0.6 recognized as a result of an increase in Canadian NOLs that we do not expect to utilize.
FIN 48
We adopted the provisions of FASB Interpretation No. 48, “Accounting for Uncertainty in Income Taxes” (“FIN 48”), on January 1, 2007. As a result of the implementation of FIN 48, we recognized a decrease of $3.1 to the January 1, 2007 balance of retained earnings. As of the date of adoption, our unrecognized tax benefits totaled $10.8. The total amount of unrecognized tax benefits that, if recognized, would impact the effective tax rate was $3.2 at the date of adoption. As of December 31, 2008 and December 31, 2007, our unrecognized tax benefits totaled $7.1 and $6.4 respectively, and based on the contingent and uncertain nature of our liability, we are unable to make an estimate of the period of potential cash settlement, if any, with respective taxing authorities.
We file numerous consolidated and separate income tax returns in the United States and various foreign jurisdictions. We are no longer subject to U.S. Federal income tax examinations for years before 2002 and are no longer subject to state and local, or foreign income tax examinations for years before 2000.
A reconciliation of the opening and ending balances of the consolidated liability for unrecognized income tax benefits for the year ended December 31, 2008 is as follows:
| Years Ended December 31, |
||||||||
| 2008 | 2007 | |||||||
| Balance at beginning of period |
$ | 7.4 | $ | 12.5 | ||||
| Gross increases due to tax positions in prior periods |
1.7 | 0.2 | ||||||
| Gross decreases due to tax positions in prior periods |
(0.7 | ) | (2.5 | ) | ||||
| Gross increases due to tax positions in current period |
1.2 | 0.8 | ||||||
| Settlements |
— | (0.4 | ) | |||||
| Decreases due to lapses of statutes of limitations |
(1.1 | ) | (3.2 | ) | ||||
| Balance at end of period |
$ | 8.5 | $ | 7.4 | ||||
At December 31, 2008, unrecognized tax benefits affected the Company’s effective income tax rate and goodwill (of the Predecessor Company) by $2.3 and ($1.6), respectively. At December 31, 2007, unrecognized tax benefits affected the Company’s effective income tax rate and goodwill (of the Predecessor Company) by ($0.1) and ($4.3), respectively. The Company accounts for any applicable interest and penalties on uncertain tax positions as a component of income tax expense. The liability
F-27
Table of Contents
METALS USA HOLDINGS CORP. AND SUBSIDIARIES
NOTES TO CONSOLIDATED FINANCIAL STATEMENTS—Continued
(dollars in millions)
for uncertain income taxes as of December 31, 2008, December 31, 2007 and the date of adoption (January 1, 2007) includes interest and penalties of $1.4, $1.0 and $1.7, respectively. Goodwill (of the Predecessor Company) for the periods ended December 31, 2008 and December 31, 2007 included a decrease in interest and penalties associated with uncertain tax positions of $0.6 and $0.7, respectively.
Unrecognized benefits were decreased by $1.1 due to the expiration of the statute of limitation for a filing position.
11. Stockholders’ Equity
Common Stock—In accordance with its Certificate of Incorporation dated May 9, 2005 and as amended on November 28, 2005, Metals USA Holdings was authorized to issue 30,000,000 shares of capital stock, all of which were shares of common stock, $.01 par value. At December 31, 2008, 14,077,500 shares were issued and outstanding.
May 2006 Dividend—On May 23, 2006, Flag Intermediate declared a $25.0 dividend (the “May 2006 Dividend”) payable to Metals USA Holdings. The dividend was paid on May 24, 2006. Concurrently, on May 23, 2006, Metals USA Holdings declared a $25.0 dividend ($1.78 per share) to its stockholders of record as of that date. The dividend was paid on May 24, 2006.
January 2007 Dividend—On January 3, 2007, Metals USA Holdings used the net proceeds from the issuance of the 2006 Notes, as well as $8.2 of additional borrowings under the ABL facility, to pay a cash dividend of approximately $144.8 ($10.28 per share) to its stockholders, which include Apollo and certain members of our management, to make a cash payment (partially in lieu of the cash dividend) of $4.2 to its vested stock option holders (the cash payment and the cash dividend are referred to collectively as the “January 2007 Dividend”), which include certain members of our management, and to pay fees and expenses related to the issuance of the 2006 Notes, including a $1.5 non-recurring transaction fee to Apollo.
In connection with the January 2007 Dividend, the outstanding employee stock options under the Amended and Restated 2005 Stock Incentive Plan were adjusted a second time (see Note 12 for a discussion of the adjustments to the stock options). The combination of the reduction of the per share exercise price of the stock options and the cash payment to vested stock option holders was, on a per share basis, approximately equal to the per share amount of the dividend.
July 2007 Dividend—On July 10, 2007, Metals USA Holdings used the net proceeds from the issuance of the 2007 Notes, as well as approximately $8.3 of additional borrowings under the ABL facility, to redeem the 2006 Notes (for approximately $150.0 plus accrued and unpaid interest of approximately $5.4), to pay a cash dividend of approximately $130.3 (approximately $9.25 per share) to its stockholders, which include Apollo and certain members of management, to make a cash payment (partially in lieu of the cash dividend) of approximately $9.2 to its stock option holders (the cash payment and the cash dividend are referred to collectively as the “July 2007 Dividend”), which include certain members of our management, and to pay fees and expenses related to the offering of the 2007 Notes.
F-28
Table of Contents
METALS USA HOLDINGS CORP. AND SUBSIDIARIES
NOTES TO CONSOLIDATED FINANCIAL STATEMENTS—Continued
(dollars in millions)
12. Stock Based Compensation
Metals USA Holdings’ Amended and Restated 2005 Stock and Incentive Plan (the “Plan”) permits the issuance of options and restricted stock awards on Metals USA Holding’s stock to employees and directors of, or consultants to, the Company, except that consultants may only receive awards with the consent of the president of Metals USA. As a result of the options and restricted stock awards being issued to employees and directors of the Company, we are required to reflect the stock-based compensation expense related to these options and restricted stock awards within its consolidated statements of operations. A total of $0.4 and $4.1 was recorded as stock-based employee compensation during the years ended December 31, 2008 and 2007, respectively.
On January 3, 2007, the Board of Directors of Metals USA Holdings adopted the Metals USA Holdings Corp. 2006 Deferred Compensation Plan (the “Deferred Compensation Plan”). The Deferred Compensation Plan was adopted in connection with the January 2007 Dividend, and credits to individual accounts established for stock option holders an amount equal to $6.56 per share on certain unvested options, for a total of approximately $2.3. Payment of this liability was subject to continued employment for two years following the adoption date. The entire amount was paid in one lump sum on January 5, 2009, upon completion of such period. This modification of the Company’s stock-based compensation resulted in incremental expense of $1.4 related to the Deferred Compensation Plan, which was recognized over a two-year vesting period beginning on the date of adoption of the Deferred Compensation Plan. A total of $0.7 and $0.7 was recorded as compensation expense during the years ended December 31, 2008 and 2007, respectively.
Description of Share Option Plan
The Plan has reserved for issuance up to 1.4 million shares of Metals USA Holdings’ common stock. Metals USA Holdings believes that the granting of such awards promotes an increasing personal interest in furthering the growth and success of Metals USA Holdings, and to provide a means of rewarding outstanding performance by such persons to the Company and/or its subsidiaries. The Plan has two tranches of options, Tranche A and Tranche B. Tranche A options vest on a pro rata basis over five years, have a term of ten years, and expire if not exercised. Tranche B options, which include both a service and a performance condition, vest on the eighth anniversary of the date of grant or earlier dependent on the satisfaction of an internal rate of return on capital invested, have a term of ten years from date of grant, and expire if not exercised. Awards are generally granted with an exercise price equal to the fair value of Metals USA Holdings’ stock at the date of grant. The fair value of the stock is a calculated value based on the date of each of the respective grants using a combination of discounted cash flows and financial metrics from companies with similar characteristics of Metals USA Holdings. Certain option and share awards provide for accelerated vesting if there is a change in control (as defined in the Plan).
In connection with the May 2006 Dividend and pursuant to the Plan’s provisions of rights preservation, the Board of Directors modified the outstanding options by reducing the per share exercise price by $1.78 in order to retain the participants’ rights proportionate with those prior to the dividend payment. This reduction did not result in additional compensation expense.
In connection with the January 2007 Dividend, the outstanding employee stock options under the Amended and Restated 2005 Stock Incentive Plan were adjusted a second time by an amount approximately equal to the per share amount of this dividend. The per share exercise price of the
F-29
Table of Contents
METALS USA HOLDINGS CORP. AND SUBSIDIARIES
NOTES TO CONSOLIDATED FINANCIAL STATEMENTS—Continued
(dollars in millions)
options granted on November 30, 2005, was decreased by $4.22 to $4.00 and the per share exercise price of the options granted on March 17, 2006, was reduced by $4.89 to $4.00.
Because the payment of the January 2007 Dividend resulted in the internal rate of return of the funds managed by Apollo with respect to its investment in Metals USA Holdings to be near 25%, the Board of Directors exercised its discretion under the Amended and Restated 2005 Stock Incentive Plan to vest all of the outstanding Tranche B options. In addition, the Board of Directors exercised its discretion to vest all Tranche A options granted to directors affiliated with Apollo. In connection with the accelerated vesting of these options, we recognized $1.8 of non-cash stock-based compensation expense, net of related tax effects, in the first quarter of 2007.
In connection with the July 2007 Dividend, stock option holders were paid approximately $9.25 per share on outstanding options (an amount equal to the per-share amount of the July 2007 Dividend), for a total of approximately $9.2. The cash payment to holders of outstanding options to acquire shares of Metals USA Holdings’ common stock was made to equitably adjust such option holders by the Metals USA Holdings Board of Directors pursuant to the exercise of its discretion to preserve the rights of options holders under the Metals USA Holdings Amended and Restated 2005 Stock Incentive Plan. As a result of the cash payment on outstanding options, we were required to recognize $0.3 of non-cash stock-based compensation expense, net of related tax effects, in the third quarter of 2007.
Tranche A Options
The fair value of option awards are estimated on the date of grant using a black-scholes option valuation model. Estimates of expected long-term volatilities are based on the historical volatilities of four comparable companies’ publicly traded stock, with financial characteristics similar to Metals USA Holdings, for a period that approximates the expected term of the options being valued. The historical volatilities of comparable companies were used because Metals USA Holdings’ stock is not publicly traded, and it has no historical volatility data. The volatilities were calculated by averaging the four companies’ historical volatilities over the expected term of the options through the date of the option grant. Because the Company did not have sufficient historical exercise data on which to estimate future experience, we used the simplified measure to establish the expected term of the options, which is a term equal to the average of the vesting term and the contractual term. A forfeiture rate of five percent was established based on management’s expectations. The risk-free rate for periods within the expected term of the option is based on daily U.S. Treasury securities at 7-year constant maturity rates.
No Tranche A options were granted during the years ended December 31, 2008 and 2007. The weighted-average grant date fair value of Tranche A options granted during the year ended December 31, 2006 was $5.87 based on the following assumptions:
| Year Ended December 31, 2006 | ||
| Expected dividend yield |
0.0% | |
| Expected stock price volatility |
54.9% | |
| Risk free interest rate |
4.3-4.6% | |
| Expected life of options (in years) |
6.5 |
F-30
Table of Contents
METALS USA HOLDINGS CORP. AND SUBSIDIARIES
NOTES TO CONSOLIDATED FINANCIAL STATEMENTS—Continued
(dollars in millions)
The following is a summary of stock option activity for Tranche A options for the year ended December 31, 2008:
| Weighted Average Grant Date Fair Value |
Weighted Average Exercise Price |
Weighted Average Remaining Contractual Life (Years) |
Number of Options |
||||||||
| Balance, December 31, 2007 |
$ | 6.58 | $ | 4.00 | 595,630 | ||||||
| Granted |
— | — | — | ||||||||
| Exercised |
— | — | — | ||||||||
| Canceled or expired |
5.82 | 4.00 | (40,000 | ) | |||||||
| Balance, December 31, 2008 |
$ | 6.63 | $ | 4.00 | 7.0 | 555,630 | |||||
| Vested and Exercisable as of: |
|||||||||||
| December 31, 2008 |
$ | 4.00 | 7.0 | 377,301 | |||||||
A summary of Tranche A nonvested stock options for the year ended December 31, 2008 is presented below:
| Weighted Average Grant-Date Fair Value |
Number of Options |
|||||
| Nonvested at December 31, 2007 |
$ | 6.58 | 265,455 | |||
| Granted |
— | — | ||||
| Vested |
6.58 | (87,126 | ) | |||
| Exercised |
— | — | ||||
| Canceled or expired |
— | — | ||||
| Nonvested at December 31, 2008 |
$ | 6.80 | 178,329 | |||
As of December 31, 2008, there was $0.8 of total unrecognized compensation cost related to nonvested share-based compensation arrangements granted under the Tranche A options, which will be amortized over a remaining period of 1.9 years.
Tranche B Options
Tranche B options, which include both a service and a performance condition, vest on the eighth anniversary of the date of grant or earlier dependent on the satisfaction of an internal rate of return on capital invested, and have a term of ten years from the date of grant. Awards are generally granted with an exercise price equal to the fair value of Metals USA Holdings’ stock at the date of grant.
The performance condition of the Tranche B options is satisfied when the Investor Internal Rate of Return (“IRR”) on the funds managed by Apollo with respect to its investment in us equals or exceeds 25% prior to the eighth anniversary.
The fair value of the Tranche B options was estimated on the date of grant using the same option valuation model used for the Tranche A options. If the performance condition is satisfied, the options will vest immediately at the date of satisfaction and all related expense will concurrently be recognized.
F-31
Table of Contents
METALS USA HOLDINGS CORP. AND SUBSIDIARIES
NOTES TO CONSOLIDATED FINANCIAL STATEMENTS—Continued
(dollars in millions)
As discussed above, the Board of Directors exercised its discretion under the Amended and Restated 2005 Stock Incentive Plan to vest all of the outstanding Tranche B options in January 2007.
The input assumptions used to determine the fair value of the Tranche B options were essentially the same as those used to value the Tranche A options discussed above, except that the expected term was established at 8 years. The risk-free rate for periods within expected term of the option is based on daily U.S. Treasury securities at 10-year constant maturity rates.
No Tranche B options were granted during the years ended December 31, 2008 and 2007. The weighted-average grant date fair value of Tranche B options granted during the year ended December 31, 2006 was $6.80 based on the following assumptions:
| Year Ended December 31, 2006 | ||
| Expected dividend yield |
0.0% | |
| Expected stock price volatility |
54.3% | |
| Risk free interest rate |
5% | |
| Expected life of options (in years) |
8.0 |
The following is a summary of stock option activity for Tranche B options for the year ended December 31, 2008:
| Weighted Average Grant Date Fair Value |
Weighted Average Exercise Price |
Weighted Average Remaining Contractual Life (Years) |
Number of Options | |||||||
| Balance, December 31, 2007 |
$ | 6.92 | $ | 4.00 | 395,631 | |||||
| Granted |
— | — | — | |||||||
| Exercised |
— | — | — | |||||||
| Canceled or expired |
— | — | — | |||||||
| Balance, December 31, 2008 |
$ | 6.92 | $ | 4.00 | 6.9 | 395,631 | ||||
| Vested and Exercisable as of: |
||||||||||
| December 31, 2008 |
$ | 4.00 | 6.9 | 395,631 | ||||||
All Tranche B stock options outstanding as of December 31, 2008 are fully vested and exercisable.
Restricted Stock
The Plan allows for grants of restricted stock as long-term compensation for directors and employees of, or consultants to, the Company or any of its subsidiaries. Grants of restricted stock have a vesting period that is determined at the discretion of the Board of Directors. The Company amortizes stock-based compensation expense associated with restricted stock ratably over the vesting period. For the year ended December 31, 2008, there were no shares of nonvested restricted stock outstanding.
F-32
Table of Contents
METALS USA HOLDINGS CORP. AND SUBSIDIARIES
NOTES TO CONSOLIDATED FINANCIAL STATEMENTS—Continued
(dollars in millions)
13. Segment and Related Information
We follow the provisions of SFAS No. 131, “Disclosure about Segments of an Enterprise and Related Information” (“SFAS 131”). SFAS 131 requires the utilization of a “management approach” to define and report the financial results of operating segments. The management approach defines operating segments along the lines used by the Company’s chief operating decision maker (“CODM”) to assess performance and make operating and resource allocation decisions. Our CODM evaluates performance and allocates resources based on operating income (loss). The accounting policies of the reportable segments are the same as those described in the summary of significant accounting policies in Note 1.
Our operating segments are based on internal management reporting, which disaggregates business units by product group and geographic region. Certain geographic regions and product groups with similar economic and other basic characteristics are aggregated for reporting purposes. Our operating segments are organized into three product group reportable segments. Each segment is described as follows:
| Ÿ | Plates and Shapes consists of operating facilities that maintain an inventory focusing on carbon products such as structural plate, beams, bars and tubing. This segment provides processing services such as cutting, cambering/leveling, punching, bending, shearing, cut-to-length, blast and paint, and tee-splitting. |
| Ÿ | Flat Rolled and Non-Ferrous consists of operating facilities that maintain an inventory of cold rolled, coated, and hot rolled steel products and various non-ferrous flat rolled products including aluminum, stainless steel, copper and brass. This segment provides processing services such as slitting, precision blanking, leveling, cut-to-length, punching, and shearing. |
| Ÿ | Building Products consists of manufacturing plant locations and sales centers that produce and distribute aluminum and steel building products consisting of covered canopies and walkways, awnings, sunrooms, solariums and other products primarily for the commercial and residential building products industries. |
The following tables summarize financial information regarding segments:
| Plates and Shapes |
Flat Rolled and Non-Ferrous |
Building Products |
Corporate and Other |
Total | |||||||||||||
| Year Ended December 31, 2008: |
|||||||||||||||||
| Net sales |
$ | 1,161.2 | $ | 882.9 | $ | 126.0 | $ | (13.9 | ) | $ | 2,156.2 | ||||||
| Operating income (loss) |
170.7 | 78.2 | (9.1 | ) | (33.4 | ) | 206.4 | ||||||||||
| Capital expenditures |
8.6 | 2.2 | 0.7 | 0.7 | 12.2 | ||||||||||||
| Depreciation and amortization(1) |
9.2 | 7.1 | 2.9 | 4.4 | 23.6 | ||||||||||||
| Year Ended December 31, 2007: |
|||||||||||||||||
| Net sales |
$ | 889.7 | $ | 817.7 | $ | 152.4 | $ | (14.5 | ) | $ | 1,845.3 | ||||||
| Operating income (loss) |
92.8 | 50.1 | (0.3 | ) | (29.2 | ) | 113.4 | ||||||||||
| Capital expenditures |
16.6 | 2.9 | 1.6 | 0.4 | 21.5 | ||||||||||||
| Depreciation and amortization(1) |
8.9 | 5.5 | 2.3 | 7.0 | 23.7 | ||||||||||||
| Year Ended December 31, 2006: |
|||||||||||||||||
| Net sales |
$ | 856.6 | $ | 776.0 | $ | 189.8 | $ | (19.5 | ) | $ | 1,802.9 | ||||||
| Operating income (loss) |
95.9 | 44.3 | 9.7 | (30.9 | ) | 119.0 | |||||||||||
| Capital expenditures |
11.1 | 2.8 | 2.7 | 0.3 | 16.9 | ||||||||||||
| Depreciation and amortization(1) |
7.1 | 3.8 | 1.7 | 10.0 | 22.6 | ||||||||||||
| (1) | Includes depreciation expense reflected in cost of goods sold for the Building Products Group. |
F-33
Table of Contents
METALS USA HOLDINGS CORP. AND SUBSIDIARIES
NOTES TO CONSOLIDATED FINANCIAL STATEMENTS—Continued
(dollars in millions)
| December 31, | ||||||
| 2008 | 2007 | |||||
| Total Assets: |
||||||
| Plates and Shapes |
$ | 483.3 | $ | 449.1 | ||
| Flat Rolled and Non-Ferrous |
309.2 | 330.3 | ||||
| Building Products |
62.0 | 80.7 | ||||
| Corporate and Other |
233.7 | 98.9 | ||||
| Consolidated |
$ | 1,088.2 | $ | 959.0 | ||
| Goodwill: |
||||||
| Plates and Shapes |
$ | 15.5 | $ | 16.4 | ||
| Flat Rolled and Non-Ferrous |
20.5 | 20.9 | ||||
| Building Products |
1.8 | 2.4 | ||||
| Corporate and Other |
12.1 | 20.5 | ||||
| Consolidated |
$ | 49.9 | $ | 60.2 | ||
The amounts shown as an operating loss under the column heading “Corporate and Other” consist primarily of general and administrative costs that are not allocated to the segments. The reconciliation of operating income (loss) to income (loss) before taxes and discontinued operations is shown within the Consolidated Statements of Operations and therefore is not separately presented.
Changes in goodwill for the year ended December 31, 2008 were attributable to the following:
| Ÿ | We recognized a $4.2 charge in the fourth quarter of 2008 related to the impairment of goodwill associated with our building products business, which was recorded at the Corporate Segment. Goodwill and customer list intangible assets resulting from the Merger are assigned to reporting units solely for testing for impairment. Consequently, any impairment charges associated with these assets is recorded at the Corporate Segment. |
| Ÿ | Goodwill recorded at the Corporate Segment was also reduced approximately $2.6 primarily due to the recognition of tax benefits in excess of tax liabilities attributable to the Merger and post bankruptcy tax attribute elections. Other reductions in corporate goodwill of approximately $1.6 were primarily attributable to changes in FIN 48 measurement and recognition criteria. |
| Ÿ | Goodwill recorded at the Plates and Shapes Segment was reduced approximately $0.9 due to the recognition of tax benefits attributable to the Port City acquisition. |
| Ÿ | Goodwill recorded at the Flat Rolled and Non-Ferrous Group was reduced approximately $0.4 in connection with purchase price adjustments attributable to the Lynch Metals acquisition. |
| Ÿ | Goodwill recorded at the Building Products Group was reduced by $0.6 due to the effect of foreign currency. |
We recorded write-downs of $5.8 and $1.0 in our Plates and Shapes Group and Flat Rolled and Non-Ferrous Groups, respectively, for inventory lower of cost or market adjustments during the fourth quarter of 2008.
We have implemented certain initiatives within our Building Products segment in response to the downturn in the housing and residential remodeling markets, including reductions in square footage under lease, standardization of sales center layouts, and manufacturing consolidation. During 2008, we
F-34
Table of Contents
METALS USA HOLDINGS CORP. AND SUBSIDIARIES
NOTES TO CONSOLIDATED FINANCIAL STATEMENTS—Continued
(dollars in millions)
closed five sales centers (Memphis, Tennessee, Overland, Missouri, Holly Hill, Florida, Harrisburg, Pennsylvania and Corona, California), in addition to our Houston, Texas manufacturing facility. In July 2008, we sold our Houston, Texas manufacturing facility for $4.9 in cash. We recognized a gain of $0.7 in the third quarter of 2008 related to this sale. Total facility closure costs charged to operating expense during the year ended December 31, 2008, net of the gain on the sale of the Houston plant, amounted to $4.0. In addition, we recognized a $0.9 impairment charge in the fourth quarter of 2008 in connection with the write-off of customer list intangible assets associated with the Patio Division of our building products business, which were recorded as a result of the Merger. We continue to evaluate various alternative strategies for our building products business.
Assets classified as held for sale as of December 31, 2008 are associated with two facilities within our metals service center business that were closed during the first quarter of 2007. We continue to serve the marketing areas of the closed facilities with our existing sales force by expanding the responsible territories of other facilities, and through the use of common carrier for product delivery.
Our areas of operations are solely in the U.S. and Canada. No geographic area is significant to the consolidated operations. Export sales were $30.9, $20.9 and $10.1 for the years ended December 31, 2008, 2007 and 2006, respectively.
We have a broad customer base within the U.S. with no single customer being significant to consolidated operations. For the years ended December 31, 2008, 2007, and 2006, sales to any one customer did not exceed 10% of consolidated revenues.
14. Employee Benefit Plans
The Metals USA 401(k) Plan (the “401(k) Plan”) was established on June 1, 1998. Effective January 1, 2004, participants are eligible to join the 401(k) Plan on hire date. Employee contributions are limited to the Internal Revenue Service established annual dollar limits.
Employees become 50% vested in Company matching contributions and earnings after completing one year of service and fully vested after completing two years of service. We match 100% of the first 2% of each employee’s contributions.
The Metals USA Union 401(k) Plan was established on October 1, 1998 to provide a standard defined contribution savings plan for all employees covered under the terms of a collective bargaining agreement (the “Union Plan”). Metals USA is not obligated by the Union Plan to make contributions, unless required by the operative collective bargaining agreement. The Union Plan allows the employee to contribute up to 25% of their eligible compensation. The Metals USA match for the Union Plan is 1/2% up to the first 6% of an employee’s contribution.
The Company’s matching contributions for both plans for the years ended December 31, 2008, 2007 and 2006 were $1.9, $1.9 and $1.7, respectively.
F-35
Table of Contents
METALS USA HOLDINGS CORP. AND SUBSIDIARIES
NOTES TO CONSOLIDATED FINANCIAL STATEMENTS—Continued
(dollars in millions)
15. Commitments and Contingencies
Operating Lease Agreements
We lease certain office space, warehouse space and equipment under operating leases. Minimum rental commitments under operating leases at December 31, 2008 are as follows:
| Years Ended December 31, |
Minimum Rental Commitments | ||
| 2009 |
$ | 15.1 | |
| 2010 |
13.1 | ||
| 2011 |
11.7 | ||
| 2012 |
7.3 | ||
| 2013 |
4.9 | ||
| Thereafter |
12.8 | ||
| Total minimum lease payments |
$ | 64.9 | |
Rental expense for operating leases was $16.8, $17.8 and $15.7 for the years ended December 31, 2008, 2007 and 2006, respectively.
Pension Fund Withdrawal Obligation
During 2007, we discontinued our participation in a multiemployer pension fund. In connection with our cessation of contributions to the plan, we were assessed a withdrawal liability of approximately $5.6, which we are paying in monthly installments through 2021. As of December 31, 2008, our total withdrawal liability, including interest and amortization charges, amounted to approximately $7.9.
Letters of Credit
Letters of credit outstanding at December 31, 2008 consist of a letter of credit in the amount of $5.8 in conjunction with the IRB (see Note 9) and other letters of credit aggregating $9.3 (total letters of credit of $15.1 at December 31, 2008). Other letters of credit consist primarily of collateral support for our property and casualty insurance program. All letters of credit reduce the amount available to borrow under the ABL facility.
Dividends Relating to 2007 Notes
See Note 9 for a discussion of the extent to which Metals USA Holdings is dependent on Flag Intermediate’s cash flows to service its debt.
Contingencies
From time to time, we are involved in a variety of claims, lawsuits and other disputes arising in the ordinary course of business. We believe the resolution of these matters and the incurrence of their related costs and expenses should not have a material adverse effect on our consolidated financial position, results of operations or liquidity.
F-36
Table of Contents
METALS USA HOLDINGS CORP. AND SUBSIDIARIES
NOTES TO CONSOLIDATED FINANCIAL STATEMENTS—Continued
(dollars in millions)
16. Related Party Transactions
Upon completion of the Merger, Metals USA Holdings entered into a management agreement with Apollo under which Apollo or its affiliates provide us with management services. Pursuant to the agreement, Apollo receives an annual management fee equal to $2.0, payable on March 15 of every year, starting on March 15, 2006. The management agreement will terminate on December 31, 2012, unless terminated earlier by Apollo. Apollo elected to waive $0.5 of the annual management fee indefinitely, but reserved the right to revoke this waiver. The payment obligation has been recorded as a current liability (see Note 8) at the present value of minimum future annual payments of $1.5. A discount rate of 6.1% was used in the determination of present value, which approximated our incremental borrowing rate at the inception of the agreement. Deferred management fees of $8.6 have been recorded as a non-current asset, and are being amortized on a straight-line basis over the term of the agreement. For the year ended December 31, 2008, amortization of deferred management fees was $1.6, with $1.2 and $0.4 recorded as administrative expense and interest expense, respectively. For the year ended December 31, 2007, amortization of deferred management fees was $1.6, with $1.2 and $0.4 recorded as administrative expense and interest expense, respectively. For the year ended December 31, 2006, amortization of deferred management fees was $1.2, with $0.7 and $0.5 recorded as administrative and interest expense, respectively.
The management agreement also provides that affiliates of Apollo will be entitled to receive a fee in connection with certain subsequent financing, acquisition, disposition and change of control transactions with a value of $25.0 or more, with such fee to be equal to 1% of the gross transaction value of any such transaction. In connection with the issuance of the 2006 Notes, Apollo was paid a fee of $1.5. In accordance with their rights under the management agreement, Apollo elected to waive a transaction fee of $3.0 payable in connection with the issuance of the 2007 Notes.
Upon a termination of the management agreement prior to December 31, 2012, Apollo will be entitled to receive the present value of (a) $14.0, less (b) the aggregate amount of management fees that were paid to it under the agreement prior to such termination, and less (c) management fees waived. Both the management agreement and transaction fee agreement contain customary indemnification provisions in favor of Apollo and its affiliates, as well as expense reimbursement provisions with respect to expenses incurred by Apollo and its affiliates in connection with its performance of services thereunder.
Our affiliates, which include Apollo, as well as our Chief Executive Officer and our Chief Financial Officer, have purchased a portion of our 2007 Notes in the market. For the year ended December 31, 2008, interest paid on the 2007 Notes held by affiliates amounted to $8.4. From time to time, depending upon market, pricing and other conditions, as well on cash balances and liquidity, we, our subsidiaries or affiliates may seek to purchase or sell some amount of the Metals USA Notes or additional amounts of the 2007 Notes. Any such purchases or sales may be made in the open market, privately negotiated transactions, tender offers or otherwise. The amounts of any such purchases or sales may be material.
F-37
Table of Contents
METALS USA HOLDINGS CORP. AND SUBSIDIARIES
NOTES TO CONSOLIDATED FINANCIAL STATEMENTS—Continued
(dollars in millions)
17. Quarterly Financial Information (Unaudited)
Selected unaudited quarterly financial information for the years ended December 31, 2008 and 2007 is as follows:
| 2008 Quarter Ended | 2007 Quarter Ended | |||||||||||||||||||||||||||
| Dec. 31 | Sept. 30 | June 30 | Mar. 31 | Dec. 31 | Sept. 30 | June 30 | Mar. 31 | |||||||||||||||||||||
| Net sales |
$ | 456.4 | $ | 617.7 | $ | 593.1 | $ | 489.0 | $ | 432.2 | $ | 469.6 | $ | 480.9 | $ | 462.6 | ||||||||||||
| Operating income |
7.4 | 84.4 | 83.4 | 31.2 | 19.3 | 29.2 | 39.4 | 25.5 | ||||||||||||||||||||
| Net income (loss) |
(7.0 | ) | 36.0 | 39.8 | 3.8 | 1.8 | (3.4 | ) | 11.7 | 3.8 | ||||||||||||||||||
We recorded a $6.8 write-down for inventory lower of cost or market adjustments during the fourth quarter of 2008 in our metal service center businesses. In addition, we recorded a $5.1 charge in the fourth quarter of 2008 related to the impairment of goodwill and customer list intangible assets associated with our building products business.
18. Earnings Per Share
Basic earnings per share is calculated by dividing net income by the weighted average number of common shares outstanding during the period, including the weighted average impact of any shares issued during the year. Diluted earnings per share calculations also include the dilutive effect of stock options and non-vested restricted stock.
The weighted average number of shares used to determine basic and diluted earnings per share was:
| Years Ended December 31, | ||||||
| 2008 | 2007 | 2006 | ||||
| Weighted average shares outstanding—basic |
14,077,500 | 14,067,631 | 14,061,797 | |||
| Effect of dilution: |
||||||
| Stock options and restricted stock |
457,559 | 327,480 | 13,448 | |||
| Weighted average shares outstanding—diluted |
14,535,059 | 14,395,111 | 14,075,245 | |||
F-38
Table of Contents
METALS USA HOLDINGS CORP. AND SUBSIDIARIES
UNAUDITED CONDENSED CONSOLIDATED BALANCE SHEETS
(in millions, except share amounts)
| September 30, 2009 |
December 31, 2008 |
|||||||
| Assets |
||||||||
| Current Assets: |
||||||||
| Cash |
$ | 20.1 | $ | 166.7 | ||||
| Accounts receivable, net of allowance of $8.9 and $8.8, respectively |
127.5 | 189.3 | ||||||
| Inventories |
226.0 | 422.6 | ||||||
| Deferred income tax asset |
22.6 | 23.6 | ||||||
| Prepayments and other |
3.4 | 6.5 | ||||||
| Total current assets |
399.6 | 808.7 | ||||||
| Property and equipment, net |
187.0 | 190.1 | ||||||
| Assets held for sale, net |
— | 1.8 | ||||||
| Intangible assets, net |
9.6 | 13.6 | ||||||
| Goodwill |
49.0 | 49.9 | ||||||
| Other assets |
17.3 | 24.1 | ||||||
| Total assets |
$ | 662.5 | $ | 1,088.2 | ||||
| Liabilities and Stockholders’ Deficit |
||||||||
| Current liabilities: |
||||||||
| Accounts payable |
$ | 45.5 | $ | 47.2 | ||||
| Accrued liabilities |
50.1 | 60.9 | ||||||
| Current portion of long-term debt |
0.1 | 1.6 | ||||||
| Total current liabilities |
95.7 | 109.7 | ||||||
| Long-term debt, less current portion |
501.0 | 942.6 | ||||||
| Deferred income tax liability |
84.7 | 62.2 | ||||||
| Other long-term liabilities |
22.0 | 24.7 | ||||||
| Total liabilities |
703.4 | 1,139.2 | ||||||
| Commitments and contingencies |
||||||||
| Stockholders’ Deficit: |
||||||||
| Common stock, $.01 par value, 30,000,000 shares authorized, 14,077,500 issued and outstanding at September 30, 2009 and December 31, 2008 |
0.1 | 0.1 | ||||||
| Additional paid-in capital |
6.7 | 6.4 | ||||||
| Retained deficit |
(46.6 | ) | (54.5 | ) | ||||
| Accumulated other comprehensive loss |
(1.1 | ) | (3.0 | ) | ||||
| Total stockholders’ deficit |
(40.9 | ) | (51.0 | ) | ||||
| Total liabilities and stockholders’ deficit |
$ | 662.5 | $ | 1,088.2 | ||||
See notes to unaudited condensed consolidated financial statements.
F-39
Table of Contents
METALS USA HOLDINGS CORP. AND SUBSIDIARIES
UNAUDITED CONDENSED CONSOLIDATED STATEMENTS OF OPERATIONS
(in millions, except per share amounts)
| Nine Months Ended September 30, |
||||||||
| 2009 | 2008 | |||||||
| Net Sales |
$ | 853.4 | $ | 1,699.8 | ||||
| Operating costs and expenses: |
||||||||
| Cost of sales (exclusive of operating and delivery, and depreciation and amortization shown below) |
702.4 | 1,245.9 | ||||||
| Operating and delivery |
97.5 | 144.6 | ||||||
| Selling, general and administrative |
66.6 | 96.5 | ||||||
| Depreciation and amortization |
14.2 | 16.2 | ||||||
| Gain on sale of property and equipment |
— | (2.4 | ) | |||||
| Operating income (loss) |
(27.3 | ) | 199.0 | |||||
| Other (income) expense: |
||||||||
| Interest expense |
50.5 | 65.4 | ||||||
| Gain on extinguishment of debt |
(89.1 | ) | — | |||||
| Other (income) expense, net |
(0.3 | ) | 0.2 | |||||
| Income (loss) before income taxes |
11.6 | 133.4 | ||||||
| Provision for income taxes |
3.7 | 53.8 | ||||||
| Net income (loss) |
$ | 7.9 | $ | 79.6 | ||||
| Income (loss) per share: |
||||||||
| Income (loss) per share—basic |
$ | 0.56 | $ | 5.66 | ||||
| Income (loss) per share—diluted |
$ | 0.56 | $ | 5.47 | ||||
| Number of common shares used in the per share calculation: |
||||||||
| Basic |
14.1 | 14.1 | ||||||
| Diluted |
14.1 | 14.6 | ||||||
See notes to unaudited condensed consolidated financial statements.
F-40
Table of Contents
METALS USA HOLDINGS CORP. AND SUBSIDIARIES
UNAUDITED CONDENSED CONSOLIDATED STATEMENTS OF CASH FLOWS
(in millions)
| Nine Months Ended September 30, |
||||||||
| 2009 | 2008 | |||||||
| Cash flows from operating activities: |
||||||||
| Net income |
$ | 7.9 | $ | 79.6 | ||||
| Adjustments to reconcile net income to net cash provided by (used in) operating activities: |
||||||||
| Gain on sale of property and equipment |
— | (2.4 | ) | |||||
| Provision for bad debts |
2.7 | 2.3 | ||||||
| Depreciation and amortization |
15.9 | 18.2 | ||||||
| Gain on extinguishment of debt |
(89.1 | ) | — | |||||
| Amortization of debt issuance costs and discounts on long-term debt |
4.1 | 4.4 | ||||||
| Deferred income taxes |
22.5 | (1.9 | ) | |||||
| Stock-based compensation |
0.3 | 0.8 | ||||||
| Non-cash interest on PIK option |
17.6 | — | ||||||
| Changes in operating assets and liabilities, net of acquisitions: |
||||||||
| Accounts receivable |
59.1 | (81.8 | ) | |||||
| Inventories |
196.6 | (152.7 | ) | |||||
| Prepayments and other |
3.1 | (0.6 | ) | |||||
| Accounts payable and accrued liabilities |
(11.0 | ) | 26.9 | |||||
| Other |
(1.3 | ) | 9.5 | |||||
| Net cash provided by (used in) operating activities |
228.4 | (97.7 | ) | |||||
| Cash flows from investing activities: |
||||||||
| Sales of assets |
0.2 | 9.5 | ||||||
| Purchases of assets |
(3.6 | ) | (8.9 | ) | ||||
| Acquisition costs, net of cash acquired |
(4.2 | ) | — | |||||
| Net cash (used in) provided by investing activities |
(7.6 | ) | 0.6 | |||||
| Cash flows from financing activities: |
||||||||
| Borrowings on credit facility |
79.0 | 959.5 | ||||||
| Repayments on credit facility |
(357.0 | ) | (698.0 | ) | ||||
| Repayments of long-term debt |
(89.4 | ) | (2.3 | ) | ||||
| Deferred financing costs |
— | (2.6 | ) | |||||
| Net cash (used in) provided by financing activities |
(367.4 | ) | 256.6 | |||||
| Net (decrease) increase in cash and cash equivalents |
(146.6 | ) | 159.5 | |||||
| Cash and cash equivalents, beginning of period |
166.7 | 13.6 | ||||||
| Cash and cash equivalents, end of period |
$ | 20.1 | $ | 173.1 | ||||
| Supplemental Cash Flow Information: |
||||||||
| Cash paid for interest |
$ | 25.8 | $ | 58.1 | ||||
| Cash paid (received) for income taxes |
$ | (16.4 | ) | $ | 28.1 | |||
| Investments in property, plant and equipment not paid |
$ | — | $ | 0.2 | ||||
See notes to unaudited condensed consolidated financial statements.
F-41
Table of Contents
METALS USA HOLDINGS CORP. AND SUBSIDIARIES
NOTES TO UNAUDITED CONDENSED CONSOLIDATED FINANCIAL STATEMENTS
(dollars in millions)
1. Organization and Basis of Presentation
Organization
On May 18, 2005, Metals USA Holdings Corp. (formerly named Flag Holdings Corporation), a Delaware corporation (“Metals USA Holdings”), and its wholly owned subsidiary, Flag Acquisition Corporation, a Delaware corporation (“Flag Acquisition”), entered into an Agreement and Plan of Merger (the “Merger Agreement”) with Metals USA, Inc. (“Metals USA”). On November 30, 2005, Flag Acquisition, then a wholly owned subsidiary of Flag Intermediate Holdings Corporation (“Flag Intermediate”) merged with and into Metals USA (the “Merger”), with Metals USA being the surviving corporation. Metals USA Holdings and its wholly owned subsidiaries, Flag Intermediate and Metals USA, are referred to collectively herein as the “Company.” Metals USA prior to the Merger is referred to herein as the “Predecessor Company.”
We believe that we are a leading provider of value-added processed carbon steel, stainless steel, aluminum and specialty metals, as well as manufactured metal components. For the nine months ended September 30, 2009, approximately 91% of our revenue was derived from our metals service center and processing activities, which are segmented into two groups: Flat Rolled and Non-Ferrous Group and Plates and Shapes Group. The remaining portion of our revenue was derived from our Building Products Group, which principally manufactures and sells aluminum products related to the residential remodeling industry. We purchase metal from primary producers that generally focus on large volume sales of unprocessed metals in standard configurations and sizes. In most cases, we perform the customized, value-added processing services required to meet the specifications provided by end-use customers. Our Plates and Shapes Group and Flat Rolled and Non-Ferrous Group customers are in the land and marine transportation, energy, aerospace, defense, electrical and appliance manufacturing, fabrication, furniture, commercial construction, and machinery and equipment industries. Our Building Products Group customers are primarily distributors and contractors engaged in the residential remodeling industry.
Basis of Presentation
Principles of Consolidation—The condensed consolidated financial statements include the accounts of Metals USA Holdings, Flag Intermediate, and Metals USA and its subsidiaries. Intercompany accounts and transactions have been eliminated in the consolidated financial statements.
Interim Financial Information—The interim consolidated financial statements included herein are unaudited; however, they include adjustments of a normal recurring nature which, in our opinion, are necessary to present fairly the interim consolidated financial information as of and for the periods indicated. Accounting measurements at interim dates inherently involve greater reliance on estimates than at year-end. The results of operations for the interim periods presented are not necessarily indicative of the results to be expected for the entire year. These statements should be read in conjunction with the consolidated financial statements and notes thereto included in the Company’s Annual Report on Form 10-K for the fiscal year ended December 31, 2008.
Use of Estimates and Assumptions—The preparation of financial statements in conformity with accounting principles generally accepted in the United States (“GAAP”) requires management to make estimates and assumptions that affect (i) the reported amounts of assets and liabilities, (ii) the disclosure of contingent assets and liabilities known to exist as of the date the financial statements are
F-42
Table of Contents
METALS USA HOLDINGS CORP. AND SUBSIDIARIES
NOTES TO UNAUDITED CONDENSED CONSOLIDATED FINANCIAL STATEMENTS—(Continued)
(dollars in millions)
published, and (iii) the reported amount of net sales and expenses recognized during the periods presented. Adjustments made with respect to the use of estimates often relate to improved information not previously available. Uncertainties with respect to such estimates and assumptions are inherent in the preparation of financial statements; accordingly, actual results could differ from these estimates.
Subsequent Events—In preparing the accompanying unaudited consolidated financial statements, the Company has reviewed, as determined necessary by the Company’s management, events that have occurred after September 30, 2009, up until November 16, 2009.
Allowance for Doubtful Accounts—The determination of collectibility of the Company’s accounts receivable requires management to make frequent judgments and estimates in order to determine the appropriate amount of allowance needed for doubtful accounts. The Company’s allowance for doubtful accounts is estimated to cover the risk of loss related to accounts receivable. This allowance is maintained at a level we consider appropriate based on historical and other factors that affect collectibility. These factors include historical trends of write-offs, recoveries and credit losses, the careful monitoring of customer credit quality, and projected economic and market conditions. Different assumptions or changes in economic circumstances could result in changes to the allowance.
Inventories—Inventories are stated at the lower of cost or market. Our inventories are accounted for using a variety of methods including specific identification, average cost and the first-in first-out method of accounting. Inventory quantities are regularly reviewed and provisions for excess or obsolete inventory are recorded primarily based on our forecast of future demand and market conditions.
Financial Derivatives—We use financial derivatives to mitigate the Company’s exposure to volatility in interest rates. The Company hedges only exposures in the ordinary course of business. The Company accounts for its derivative instruments in accordance with Financial Accounting Standards Board (“FASB”) Accounting Standards Codification (“ASC”) Topic 815 “Derivatives and Hedging” (“ASC 815”), which requires all derivatives to be carried on the balance sheet at fair value and meet certain documentary and analytical requirements to qualify for hedge accounting treatment. Hedge accounting creates the potential for a statement of operations match between the changes in fair values of derivatives and the changes in cost of the associated underlying transactions, in this case interest expense. Derivatives held by the Company are designated as hedges of specific exposures at inception, with an expectation that changes in the fair value will essentially offset the change in cost for the underlying exposure. Fair values of derivatives are determined from market observation or dealer quotations. Interest rate swap derivatives outstanding at September 30, 2009, all have remaining terms of approximately two years or less.
The effective portion of the change in fair value of derivatives is reported in other comprehensive income, a component of stockholders’ deficit, until the underlying transaction occurs. Any determination that an underlying transaction is not probable of occurring will result in the recognition in earnings of gains and losses deferred in other comprehensive income. Amounts due from counterparties (unrealized hedge gains) or owed to counterparties (unrealized hedge losses) are included in other assets and accrued liabilities, respectively.
See Note 5 for additional information on underlying hedge categories, notional and fair values of derivatives, types and classifications of derivatives used, and gains and losses from hedging activity.
F-43
Table of Contents
METALS USA HOLDINGS CORP. AND SUBSIDIARIES
NOTES TO UNAUDITED CONDENSED CONSOLIDATED FINANCIAL STATEMENTS—(Continued)
(dollars in millions)
Goodwill—Goodwill represents the residual between the consideration transferred in a business combination and the net of the acquisition-date amounts of identifiable assets acquired and liabilities assumed measured at fair value. We use estimates and judgments to measure the fair value of identifiable assets acquired and liabilities assumed.
Intangible Assets—Intangible assets consist primarily of customer lists. We are amortizing the customer lists over five years using an accelerated amortization method which approximates their useful life and economic value to us.
Debt Issuance Costs—We defer certain expenses incurred to obtain debt financing and amortize these costs to interest expense over the terms of the respective agreements. See Note 6 for additional information on debt issuance costs.
Fair Value of Financial Assets and Liabilities—ASC Topic 820 “Fair Value Measurements and Disclosures” (“ASC 820”) defines fair value as the exchange price that would be received for an asset or paid to transfer a liability (an exit price) in the principal or most advantageous market for the asset or liability in an orderly transaction between market participants on the measurement date. ASC 820 classifies the inputs used to measure fair value into the following hierarchy:
Level 1—Quoted prices in active markets for identical assets or liabilities. The Company uses stock quotes from an active, established stock market for the valuation of its short-term investments, which are reported in other current assets in the Company’s consolidated balance sheet.
Level 2—Observable inputs other than Level 1 prices such as quoted prices for similar assets or liabilities; quoted prices in markets that are not active; or other inputs that are observable or can be corroborated by observable market data for substantially the full term of the assets or liabilities. The Company’s interest rate swap derivatives are valued using market data which is derived by combining certain inputs with quantitative models and processes to generate interest rate forward curves and discount factors (see Note 5).
Level 3—Unobservable inputs that are supported by little or no market activity, but which are significant to the fair value of the assets or liabilities as determined by market participants.
Assets and liabilities measured at fair value on a recurring basis are summarized below:
| Fair Value Measurements as of September 30, 2009 | ||||||||||||||
| Total | Level 1 | Level 2 | Level 3 | |||||||||||
| Short-term investments |
$ | 0.2 | $ | 0.2 | $ | — | $ | — | ||||||
| Interest rate swaps |
(6.4 | ) | — | (6.4 | ) | — | ||||||||
| Total |
(6.2 | ) | 0.2 | (6.4 | ) | — | ||||||||
Unrealized gains or losses on short-term investments and derivatives are recorded in accumulated other comprehensive income (loss) at each measurement date.
Our receivables, payables, prepayments and accrued liabilities are current assets and obligations and on normal terms and, accordingly, the recorded values are believed by management to
F-44
Table of Contents
METALS USA HOLDINGS CORP. AND SUBSIDIARIES
NOTES TO UNAUDITED CONDENSED CONSOLIDATED FINANCIAL STATEMENTS—(Continued)
(dollars in millions)
approximate fair value. The estimated fair value of the Company’s debt at December 31, 2008 excludes an amount for the Company’s Senior Secured Asset-Based Revolving Credit Facility (the “ABL facility”) due to the global tightening of credit conditions, which would have made a hypothetical bank refinancing unlikely as of that date. Our Senior Floating Rate Toggle Notes due 2012 (the “2007 Notes”) and our 11 1/8% Senior Secured Notes due 2015 (the “Metals USA Notes”) are thinly traded public debt instruments; accordingly, their market prices at any balance sheet date may not be representative of the prices which would be derived from a more active market. The fair value of publicly traded debt is determined based on quoted market prices. The fair value of debt which is not publicly traded is estimated using cash flows discounted at current borrowing rates. The estimated fair value of current and long-term debt at December 31, 2008 and September 30, 2009 was $252.1 and $429.3, respectively.
Revenue recognition—We recognize revenues generally when products are shipped and our significant obligations have been satisfied. Shipping and handling costs billed to our customers are accounted for as revenues. Risk of loss for products shipped passes at the time of shipment. Provisions are made currently for estimated returns.
Cost of sales—Our Plates and Shapes and Flat Rolled and Non-Ferrous Groups classify, within cost of sales, the underlying commodity cost of metal purchased in mill form, the cost of inbound freight charges together with third-party processing cost, if any.
Cost of sales for our Building Products Group includes the cost of raw materials, manufacturing labor and overhead costs, together with depreciation and amortization expense associated with property, buildings and equipment used in the manufacturing process.
Operating and delivery expense—Our operating and delivery expense reflects the cost incurred by our Plates and Shapes and Flat Rolled and Non-Ferrous Groups for labor and facility costs associated with the value- added metal processing services that we provide. With respect to our Building Products Group, operating costs are associated with the labor and facility costs attributable to the warehousing of our finished goods at our sales center facilities. Delivery expense reflects labor, material handling and other third party costs incurred with the delivery of product to customers.
Delivery expense totaled $24.7 and $39.8 for the nine months ended September 30, 2009 and 2008, respectively.
Selling, general and administrative expenses—Selling, general and administrative expenses include sales and marketing expenses, executive officers’ compensation, office and administrative salaries, insurance, accounting, legal, computer systems and professional services costs not directly associated with the processing, manufacturing, operating or delivery costs of our products.
Depreciation and amortization—Depreciation and amortization expense represents the costs associated with property, buildings and equipment used throughout the Company except for depreciation and amortization expense associated with the manufacturing assets employed by our Building Products Group, which is included within cost of sales. This caption also includes amortization of intangible assets.
Foreign Currency Translation—The functional currency for our Canadian subsidiary, Allmet, is the Canadian dollar. We translate the functional currency into U.S. dollars based on the current exchange
F-45
Table of Contents
METALS USA HOLDINGS CORP. AND SUBSIDIARIES
NOTES TO UNAUDITED CONDENSED CONSOLIDATED FINANCIAL STATEMENTS—(Continued)
(dollars in millions)
rate at the end of the period for the balance sheet and a weighted average rate for the period on the statement of operations. The resulting translation adjustments are recorded in accumulated other comprehensive income (loss), a component of stockholders’ deficit.
New Accounting Pronouncements
In June 2009, the FASB issued guidance now codified as ASC Topic 105, “Generally Accepted Accounting Principles” (“ASC 105”), which establishes the FASB Accounting Standards Codification as the source of GAAP to be applied to nongovernmental agencies. ASC 105 explicitly recognizes rules and interpretive releases of the Securities and Exchange Commission (“SEC”) under authority of federal securities laws as authoritative GAAP for SEC registrants. ASC 105 became effective for interim or annual periods ending after September 15, 2009. ASC 105 did not have a material impact on the Company’s consolidated financial statements.
In May 2009, the FASB issued guidance now codified as ASC Topic 855, “Subsequent Events” (“ASC 855”). The pronouncement modifies the definition of what qualifies as a subsequent event—those events or transactions that occur following the balance sheet date, but before the financial statements are issued, or are available to be issued—and requires companies to disclose the date through which it has evaluated subsequent events and the basis for determining that date. The Company adopted the provisions of ASC 855 in the second quarter of 2009, in accordance with the effective date.
In April 2009, The FASB issued guidance now codified as ASC Topic 825, “Financial Instruments” (“ASC 825”). The pronouncement amends previous ASC 825 guidance to require disclosures about the fair value of financial instruments in all interim as well as annual financial statements. This pronouncement was effective for interim periods ending after June 15, 2009 and the Company adopted its provisions in the second quarter of 2009.
In April 2008, the FASB issued guidance now codified as ASC Topic 350, “Intangibles—Goodwill and Other” (“ASC 350”). This pronouncement amends the factors that should be considered in developing renewal or extension assumptions used to determine the useful life of a recognized intangible asset under previous ASC 350 guidance, thereby improving the consistency between the useful life of a recognized intangible asset under ASC 350 and the period of expected cash flows used to measure the fair value of the asset under ASC Topic 805, “Business Combinations” (“ASC 805”). This pronouncement was effective for financial statements issued for fiscal years beginning after December 15, 2008 and must be applied prospectively to intangible assets acquired after the effective date. The Company has not acquired any intangible assets since adopting this pronouncement. As such, there has been no impact to the Company’s financial statements since the January 1, 2009 adoption date.
In March 2008, the FASB issued guidance now codified as ASC Topic 815 “Derivatives and Hedging” (“ASC 815”), which expands the disclosure requirements in previous ASC 815 guidance about an entity’s derivative instruments and hedging activities. This pronouncement’s disclosure provisions apply to all entities with derivative instruments subject to the previous ASC 815 guidance. The provisions also apply to related hedged items, bifurcated derivatives, and nonderivative instruments that are designated and qualify as hedging instruments. Entities with instruments subject to this pronouncement must provide more robust qualitative disclosures and expanded quantitative
F-46
Table of Contents
METALS USA HOLDINGS CORP. AND SUBSIDIARIES
NOTES TO UNAUDITED CONDENSED CONSOLIDATED FINANCIAL STATEMENTS—(Continued)
(dollars in millions)
disclosures. Such disclosures, as well as existing required disclosures, generally will need to be presented for every annual and interim reporting period. This pronouncement was effective for financial statements issued for fiscal years and interim periods beginning after November 15, 2008. For the nine months ended September 30, 2009, we have included the expanded disclosures about derivative instruments and hedging activities within the Company’s financial statements.
In December 2007, the FASB issued guidance now codified as ASC Topic 805, “Business Combinations” (“ASC 805”), which replaces previous ASC 805 guidance. This pronouncement establishes principles and requirements for how an acquirer recognizes and measures in its financial statements the identifiable assets acquired, the liabilities assumed, any non-controlling interest in the acquiree and the goodwill acquired in connection with a business combination. This pronouncement also establishes disclosure requirements that will enable users to evaluate the nature and financial effect of the business combination. This pronouncement applies prospectively to business combinations for which the acquisition date is on or after the beginning of an entity’s first fiscal year that begins after December 15, 2008. The Company applied the provisions of ASC 805 in connection with the acquisition that closed during the first quarter of 2009 (see Note 2 below). The adoption of this pronouncement did not have a material impact on the Company’s consolidated financial statements.
2. Acquisitions
VR Laser Acquisition
On February 20, 2009, we purchased substantially all of the operating assets of VR Laser Services USA, Inc. (“VR Laser”) for approximately $4.2. The purchase price was funded by borrowings under our ABL facility. VR Laser was a metal processor of carbon steel plate products located in Philadelphia, Pennsylvania. The total purchase price represents the acquisition-date fair value of the individual assets acquired, which consist entirely of plant and equipment. The VR Laser acquisition replicates much of our existing processing capabilities in our Plates and Shapes Southeast geographic region and expands our service offerings in the marine and defense industries.
3. Inventories
Inventories consist of the following:
| September 30, 2009 |
December 31, 2008 | |||||
| Raw materials— |
||||||
| Plates and Shapes |
$ | 128.2 | $ | 254.8 | ||
| Flat Rolled and Non-Ferrous |
63.4 | 111.7 | ||||
| Building Products |
7.6 | 10.9 | ||||
| Total raw materials |
199.2 | 377.4 | ||||
| Work-in-process and finished goods— |
||||||
| Plates and Shapes |
— | — | ||||
| Flat Rolled and Non-Ferrous |
14.7 | 29.2 | ||||
| Building Products |
12.1 | 16.0 | ||||
| Total work-in-process and finished goods |
26.8 | 45.2 | ||||
| Total inventories |
$ | 226.0 | $ | 422.6 | ||
F-47
Table of Contents
METALS USA HOLDINGS CORP. AND SUBSIDIARIES
NOTES TO UNAUDITED CONDENSED CONSOLIDATED FINANCIAL STATEMENTS—(Continued)
(dollars in millions)
We recorded write-downs of $46.7 for inventory lower of cost or market adjustments during the nine months ended September 30, 2009 in our metals service center business.
4. Intangible Assets
The carrying amounts of the Company’s intangible assets are as follows:
| September 30, 2009 |
December 31, 2008 |
|||||||
| Customer lists |
$ | 40.7 | $ | 40.7 | ||||
| Effect of foreign currency |
0.1 | 0.1 | ||||||
| Less: Accumulated amortization |
(34.1 | ) | (30.3 | ) | ||||
| $ | 6.7 | $ | 10.5 | |||||
| Trade name |
$ | 3.3 | $ | 3.3 | ||||
| Less: Accumulated amortization |
(0.5 | ) | (0.3 | ) | ||||
| $ | 2.8 | $ | 3.0 | |||||
| Patents |
$ | 0.6 | $ | 0.6 | ||||
| Less: Accumulated amortization |
(0.5 | ) | (0.5 | ) | ||||
| $ | 0.1 | $ | 0.1 | |||||
Aggregate amortization expense for the nine months ended September 30, 2009 and 2008 was $4.0, and $6.6, respectively.
The following table represents the total estimated amortization of customer list intangible assets, excluding the effect of foreign currency, for the remaining lives of the assets:
| For the Year Ending |
Estimated Amortization Expense | ||
| 2009 (remaining three months) |
$ | 1.2 | |
| 2010 |
$ | 3.4 | |
| 2011 |
$ | 1.6 | |
| 2012 |
$ | 0.5 | |
5. Derivatives
In February 2008, we entered into a series of interest rate swap agreements that entitle us to receive quarterly payments of interest at a floating rate indexed to the three-month London Interbank Offered Rate (“LIBOR”) and pay a fixed rate that ranges from 2.686% to 2.997%, thereby converting a combined $250.0 notional amount of the outstanding borrowings on our ABL facility from a floating rate obligation to a fixed rate obligation. The interest rate swap agreements all have initial terms of approximately three years or less.
The primary objective for our use of these interest rate hedges is to reduce our exposure to changes in interest rates on the ABL facility. The Company endeavors to finance its investment in working capital at the lowest possible cost and to manage variable interest rate exposure to achieve greater flexibility in meeting overall financial objectives.
F-48
Table of Contents
METALS USA HOLDINGS CORP. AND SUBSIDIARIES
NOTES TO UNAUDITED CONDENSED CONSOLIDATED FINANCIAL STATEMENTS—(Continued)
(dollars in millions)
In April 2009, we repaid outstanding borrowings on our ABL facility such that the outstanding balance on the ABL facility was less than the $250.0 notional amount associated with our series of interest rate swap agreements. In connection with the debt repayment, we removed the designation of cash flow hedge from a portion of our interest rate swaps. As a result of the removal of the cash flow hedge designation, we reclassified into earnings $1.7 of cumulative net losses associated with the derivative contract in other comprehensive income (loss) (“OCI”), a component of stockholders’ deficit, during the second quarter of 2009. The underlying derivative instrument will not expire until April 15, 2011, and all subsequent changes in the fair value of this instrument will be prospectively recognized in earnings.
As of September 30, 2009, and in connection with additional repayments of outstanding borrowings on the ABL facility, we removed the designation of cash flow hedge from the remaining portion of our interest rate swaps. As a result of the removal of the cash flow hedge designations, we will discontinue prospectively the use of hedge accounting on our remaining interest rate swaps. For the amount associated with the forecasted transactions still expected to occur, the net derivative instrument losses at the date of de-designation associated with these discontinued cash flow hedges will continue to be reported in OCI, and will be reclassified from OCI into earnings in the same periods during which the hedged forecasted transactions affect earnings. All subsequent changes in the fair value of these instruments will be prospectively recognized in earnings.
The following table presents the location within the consolidated balance sheet of all assets and liabilities associated with the Company’s outstanding derivatives at September 30, 2009.
| Balance Sheet Location |
Asset Derivatives | Liability Derivatives | ||||||||||||
| Derivatives designated as hedging instruments under ASC 815 |
Fair Value at September 30, 2009 |
Fair Value at December 31, 2008 |
Fair Value at September 30, 2009 |
Fair Value at December 31, 2008 | ||||||||||
| Interest rate swaps |
Accrued liabilities | $ | — | $ | — | $ | — | $ | 1.8 | |||||
| Other long-term liabilities | — | — | — | 4.8 | ||||||||||
| Total derivatives designated as hedging instruments under ASC 815 |
$ | — | $ | — | $ | — | $ | 6.6 | ||||||
| Derivatives not designated as hedging instruments under ASC 815 |
||||||||||||||
| Interest rate swaps |
Accrued liabilities | $ | — | $ | — | $ | 4.4 | $ | — | |||||
| Other long-term liabilities | — | — | 2.0 | — | ||||||||||
| Total derivatives not designated as hedging instruments under ASC 815 |
$ | — | $ | — | $ | 6.4 | $ | — | ||||||
| Total derivatives |
$ | — | $ | — | $ | 6.4 | $ | 6.6 | ||||||
F-49
Table of Contents
METALS USA HOLDINGS CORP. AND SUBSIDIARIES
NOTES TO UNAUDITED CONDENSED CONSOLIDATED FINANCIAL STATEMENTS—(Continued)
(dollars in millions)
The following tables present the pretax impact of the Company’s derivative instruments within the consolidated statements of operations for the nine months ended September 30, 2009 and 2008. Pretax realized gains and losses from derivatives which are recognized in earnings are included in interest expense in the consolidated statements of operations.
| Derivatives Designated as Cash Flow Hedges | |||||||||||||||||||||
| Amount of Gain (Loss) Recognized in OCI on Derivatives (Effective Portion) |
Amount of Gain (Loss) Reclassified from OCI into Income (Effective Portion) |
Amount of Gain (Loss) Recognized in Income on Derivatives (Ineffective Portion) | |||||||||||||||||||
| Nine months ended September 30, |
Nine months ended September 30, |
Nine months ended September 30, | |||||||||||||||||||
| 2009 | 2008 | 2009 | 2008 | 2009 | 2008 | ||||||||||||||||
| Interest rate swaps |
$ | (1.3 | ) | $ | 5.1 | $ | (3.2 | ) | $ | (0.2 | ) | $ | — | $ | — | ||||||
| Derivatives Not Designated as Cash Flow Hedges | ||||||||
| Amount of Gain (Loss) Recognized in Income on Derivatives |
||||||||
| Nine months ended September 30, |
||||||||
| 2009 | 2008 | |||||||
| Interest rate swaps |
$ | (2.0 | ) | $ | (2.4 | ) | ||
The Company’s credit exposure related to interest rate swaps is represented by the fair value of swap agreements with a net positive fair value (asset position) to the Company at the reporting date. At such times, the outstanding instruments expose the Company to credit loss in the event of nonperformance by the counterparty to the agreements. However, we have not experienced any credit loss as a result of counterparty nonperformance in the past. Our credit risk exposure with respect to our interest rate swaps is limited to a single counterparty, which we monitor based on credit ratings.
6. Other Assets
Other assets consist of the following:
| September 30, 2009 |
December 31, 2008 | |||||
| Deferred financing costs |
$ | 6.0 | $ | 8.0 | ||
| Deferred debt offering costs |
6.0 | 9.6 | ||||
| Deferred management fees |
4.0 | 4.9 | ||||
| Other |
1.3 | 1.6 | ||||
| Total other assets |
$ | 17.3 | $ | 24.1 | ||
Aggregate amortization of debt issuance costs for the nine months ended September 30, 2009 and 2008 was $3.2, and $3.1, respectively. For the nine months ended September 30, 2009, $2.4 of deferred debt issuance costs were accelerated in connection with the extinguishment of debt during the period.
F-50
Table of Contents
METALS USA HOLDINGS CORP. AND SUBSIDIARIES
NOTES TO UNAUDITED CONDENSED CONSOLIDATED FINANCIAL STATEMENTS—(Continued)
(dollars in millions)
7. Accrued Liabilities
Accrued liabilities consist of the following:
| September 30, 2009 |
December 31, 2008 | |||||
| Accrued salaries and employee benefits |
$ | 11.1 | $ | 19.3 | ||
| Accrued taxes, other than income |
4.0 | 3.1 | ||||
| Accrued interest |
14.3 | 14.6 | ||||
| Accrued insurance |
4.8 | 5.2 | ||||
| Accrued audit and tax fees |
1.3 | 0.8 | ||||
| Accrued warranty liability |
0.5 | 0.5 | ||||
| Accrued lease terminations |
1.0 | 0.2 | ||||
| Accrued management fees |
4.1 | 5.4 | ||||
| Accrued Merger consideration—Predecessor common shares outstanding |
3.0 | 6.0 | ||||
| Current portion of interest rate swap liability |
4.4 | 1.7 | ||||
| Other |
1.6 | 4.1 | ||||
| Total accrued liabilities |
$ | 50.1 | $ | 60.9 | ||
8. Debt
Debt consists of the following:
| September 30, 2009 |
December 31, 2008 | |||||
| Senior Secured Asset-Based Revolving Credit Facility (ABL facility) |
$ | 90.0 | $ | 368.0 | ||
| 11 1/8% Senior Secured Notes due 2015 (Metals USA Notes) |
226.3 | 275.0 | ||||
| Senior Floating Rate Toggle Notes due 2012 (2007 Notes) |
178.9 | 293.7 | ||||
| Industrial Revenue Bond |
5.7 | 5.7 | ||||
| Other |
0.2 | 1.8 | ||||
| Total debt |
501.1 | 944.2 | ||||
| Less—current portion of debt |
0.1 | 1.6 | ||||
| Total long-term portion of debt |
$ | 501.0 | $ | 942.6 | ||
The weighted average interest rates under the ABL facility for the nine months ended September 30, 2009 and 2008 were 3.05%, and 4.59%, respectively.
Senior Secured Asset-Based Revolving Credit Facility
The ABL facility permits us to borrow on a revolving basis through November 30, 2011. Substantially all of our subsidiaries are borrowers under the ABL facility.
On June 8, 2007, we executed an amendment to the ABL facility (the “June 2007 amendment”), which increased the commitment from $450.0 to $525.0, comprised of $500.0 of Tranche A Commitments and $25.0 of Tranche A-1 Commitments. Additionally, the June 2007 amendment
F-51
Table of Contents
METALS USA HOLDINGS CORP. AND SUBSIDIARIES
NOTES TO UNAUDITED CONDENSED CONSOLIDATED FINANCIAL STATEMENTS—(Continued)
(dollars in millions)
reduced the borrowing cost on the Tranche A facility by 25 basis points, reduced the borrowing cost on the Tranche A-1 facility by 75 basis points and gave us the option to increase the Tranche A Commitments by $100.0. Costs incurred in connection with the June 2007 amendment totaled $1.6, and are being amortized over the existing term of the ABL facility, which expires November 30, 2011.
On July 1, 2008, we executed our option to increase the Tranche A Commitments by $100.0, which increased the total commitment from $525.0 to $625.0. All other existing terms under the ABL facility remained unchanged. Costs incurred to exercise the option to increase the ABL facility totaled $2.4, and are being amortized over the existing term of the ABL facility.
The maximum availability under the ABL facility is based on eligible receivables and eligible inventory, subject to certain reserves. As of September 30, 2009, we had $234.3 of eligible collateral, $90.0 in outstanding advances, $15.4 in open letters of credit and $128.9 of additional borrowing capacity. As of September 30, 2009, we had $20.1 of cash and cash equivalents.
At November 16, 2009, we had $226.0 of eligible collateral, $75.0 in outstanding advances, $15.1 in open letters of credit and $135.9 of additional borrowing capacity. As of November 16, 2009, we had approximately $8.4 of cash and cash equivalents.
The obligations under the ABL facility are guaranteed by the Company and certain of our domestic subsidiaries and are secured (i) on a first-priority lien basis by accounts receivable and inventory and (ii) on a second-priority lien basis by other assets, subject to certain exceptions and permitted liens.
The ABL facility bears interest with respect to loans utilizing the Tranche A Commitments at the bank’s base rate plus an applicable margin ranging between -0.25% and -0.50%, or LIBOR, at our option, plus an applicable margin ranging between 1.00% and 1.75% as determined in accordance with the amended loan and security agreement governing the ABL facility. The ABL facility bears interest with respect to the Tranche A-1 Commitments at the bank’s base rate plus an applicable margin of 0.75%, or LIBOR, at our option, plus an applicable margin of 2.75% under the June 2007 amendment. The marginal rates related to the Tranche A Commitments will vary with our financial performance as measured by the fixed charge coverage ratio (the “FCCR”). The FCCR is determined by dividing (i) the sum of Adjusted EBITDA (as defined by the loan and security agreement governing the ABL facility) minus income taxes paid in cash minus non-financed capital expenditures by (ii) the sum of certain distributions paid in cash, cash interest expense and scheduled principal reductions on debt, and is calculated based on such amounts for the three immediately preceding months.
For purposes of determining covenant compliance, the FCCR is calculated based on the most recent period of four consecutive fiscal quarters. As long as our borrowing availability is greater than or equal to $45.0, we do not have to maintain a minimum fixed charge coverage ratio. Should borrowing availability fall below $45.0, we must maintain a fixed charge coverage ratio of at least 1.0 to 1.0. As of September 30, 2009, our FCCR was 0.14.
Interest on base rate loans is payable on the last day of each quarter. Interest on LIBOR loans is payable on maturity of the LIBOR loan or on the last day of the quarter if the term of the LIBOR loan exceeds 90 days. A commitment fee of 0.25% per annum is payable on any unused commitments under the ABL facility. The applicable base rate and the effective LIBOR rate for the Tranche A Commitments and Tranche A-1 Commitments were 3.25% and 0.287%, respectively, as of September 30, 2009.
F-52
Table of Contents
METALS USA HOLDINGS CORP. AND SUBSIDIARIES
NOTES TO UNAUDITED CONDENSED CONSOLIDATED FINANCIAL STATEMENTS—(Continued)
(dollars in millions)
The loan and security agreement governing the ABL facility requires us to comply with limited maintenance, negative and subjective covenants, the most significant of which are: (i) the maintenance of a borrowing base availability of at least $45.0, or, if such required borrowing base availability is not maintained, the maintenance of the FCCR, (ii) restrictions on additional indebtedness and (iii) restrictions on liens, guarantees and quarterly dividends. There are no limitations with respect to capital expenditures.
The loan and security agreement governing the ABL facility provides for up to $15.0 of swingline loans and up to $100.0 for the issuance of letters of credit. Both the face amount of any outstanding letters of credit and any swingline loans will reduce borrowing availability under the ABL facility on a dollar-for-dollar basis.
The ABL facility contains customary representations, warranties and covenants as a precondition to lending, which includes a material adverse change in the business, limitations on our ability to incur or guarantee additional debt, subject to certain exceptions, pay dividends, or make redemptions and repurchases with respect to capital stock, repay debt, create or incur certain liens, make certain loans or investments, make acquisitions or investments, engage in mergers, acquisitions, asset sales and sale lease-back transactions, and engage in certain transactions with affiliates. In addition, the ABL facility requires a lock-box arrangement, which as long as borrowing availability is greater or equal to $45.0 and in the absence of default, is controlled by the Company.
The ABL facility contains events of default with respect to: default in payment of principal when due, default in the payment of interest, fees or other amounts after a specified grace period, material breach of the representations or warranties, default in the performance of specified covenants, failure to make any payment when due under any indebtedness with a principal amount in excess of a specified amount, certain bankruptcy events, certain ERISA violations, invalidity of certain security agreements or guarantees, material judgments or a change of control. In the event of default the agreement may permit the lenders to: (i) restrict the account or refuse to make revolving loans; (ii) cause customer receipts to be applied against borrowings under the ABL facility causing the Company to suffer a rapid loss of liquidity and the ability to operate on a day-to-day basis; (iii) restrict or refuse to provide letters of credit; or ultimately: (iv) terminate the commitments and the agreement; or (v) declare any or all obligations to be immediately due and payable if such default is not cured in the specified period required. Any payment default or acceleration under the ABL facility on amounts in excess of $15.0 million would also result in a default under the Metals USA Notes and the 2007 Notes that would provide the holders of the Metals USA Notes and the 2007 Notes with the right to demand immediate repayment. We are in compliance with all covenants as of September 30, 2009.
In February 2008, $250.0 notional amount of outstanding borrowings under the ABL facility was swapped from a floating LIBOR-based rate to a fixed rate (see Note 5).
Costs related to the establishment of the ABL facility, in addition to subsequent amendments to the ABL facility, were capitalized and are being charged to interest expense over the life of the ABL facility. Unamortized issuance costs of $6.0 as of September 30, 2009, are included in other non-current assets.
F-53
Table of Contents
METALS USA HOLDINGS CORP. AND SUBSIDIARIES
NOTES TO UNAUDITED CONDENSED CONSOLIDATED FINANCIAL STATEMENTS—(Continued)
(dollars in millions)
Senior Floating Rate Toggle Notes due 2012
On July 10, 2007, Metals USA Holdings issued $300.0 initial aggregate principal amount of Senior Floating Rate Toggle Notes due 2012 (the “2007 Notes”). The 2007 Notes were issued at an initial issue price of 97% of the principal amount thereof, and the original issue discount is being amortized to interest expense over the life of the 2007 Notes. The 2007 Notes are senior unsecured obligations that are not guaranteed by any of Metals USA Holdings’ subsidiaries. As such, the 2007 Notes are structurally subordinated to all indebtedness and other liabilities (including trade payables) of Metals USA Holdings’ subsidiaries.
Metals USA Holdings must make an election regarding whether interest payments on the 2007 Notes will be made in cash or through PIK Interest prior to the start of the applicable interest period. Metals USA Holdings may elect to pay interest (1) entirely in cash or (2) entirely by increasing the principal amount of the 2007 Notes or issuing new 2007 Notes (“PIK Interest”), or (3) on 50% of the outstanding principal amount of the 2007 Notes in cash and on 50% of the outstanding principal amount of the 2007 Notes by increasing the principal amount of the outstanding 2007 Notes or by issuing new 2007 Notes (“Partial PIK Interest”). Cash interest on the 2007 Notes will accrue at a rate per annum, reset quarterly, equal to LIBOR plus a spread of 6.00%, which increases by 0.25% to 6.25% in year 2, by 0.50% to 6.50% in year 3, and by 0.75% to 6.75% in year 4. In the event PIK Interest is paid on the 2007 Notes after the first four interest periods, the then-applicable margin over LIBOR on the 2007 Notes would increase by 0.75% for each period in which PIK Interest is paid. If Metals USA Holdings elects to pay any PIK Interest, Metals USA Holdings will increase the principal amount on the 2007 Notes or issue new 2007 Notes in an amount equal to the amount of PIK Interest for the applicable interest payment period to holders of the 2007 Notes on the relevant record date. Interest is payable quarterly in arrears on January 1, April 1, July 1 and October 1. PIK Interest notes, resulting from the conversion of interest into PIK notes, when paid will be treated as an operating activity in the Consolidated Statements of Cash Flows in accordance with ASC 230.
The initial five interest payments on the 2007 Notes were paid solely in cash. Flag Intermediate provided funds to Metals USA Holdings to fund the initial five quarterly interest payments on the 2007 Notes, which were paid on October 1, 2007, January 2, 2008, April 1, 2008, July 1, 2008, and October 1, 2008 and which totaled $7.7, $8.4, $8.1, $6.5 and $6.6, respectively.
On September 26, 2008, we made a permitted election under the indenture governing the 2007 Notes to pay all interest that is due on January 1, 2009, for the interest period beginning on October 1, 2008, and ending on December 31, 2008, entirely through PIK Interest. The January 1, 2009 PIK Interest payment amounted to $8.2. We have continued to make PIK Interest payments subsequent to January 1, 2009. The April 1, 2009 PIK Interest payment amounted to $5.6, and the July 1, 2009 PIK Interest payment amounted to $3.8. The Company must make an election regarding whether subsequent interest payments will be made in cash, through PIK Interest, or Partial PIK Interest, prior to the start of the applicable interest period. In the absence of such an election for any interest period, interest on the 2007 Notes will be payable according to the election for the previous interest period. As a result, the PIK Interest election is now the default election for future interest periods unless we elect otherwise not later than the commencement of an interest period.
The terms of the ABL facility, as well as the indenture governing the Metals USA Notes, restrict Flag Intermediate and certain of its subsidiaries from making payments or transferring assets to Metals USA Holdings, including dividends, loans, or distributions. Such restrictions include prohibition of
F-54
Table of Contents
METALS USA HOLDINGS CORP. AND SUBSIDIARIES
NOTES TO UNAUDITED CONDENSED CONSOLIDATED FINANCIAL STATEMENTS—(Continued)
(dollars in millions)
dividends in an event of default and limitations on the total amount of dividends paid to Metals USA Holdings. In the event these agreements do not permit Flag Intermediate to provide Metals USA Holdings with sufficient distributions to fund interest and principal payments on the 2007 Notes when due, Metals USA Holdings may default on the 2007 Notes unless other sources of funding are available. The amount available under the restricted payment provision contained in the loan and security agreement governing the ABL facility was $63.1 as of September 30, 2009. No amount was available under the restricted payment provision contained in the indenture governing the Metals USA Notes as of September 30, 2009.
On or after January 15, 2008, Metals USA Holdings may redeem some or all of the 2007 Notes at certain redemption prices, plus accrued and unpaid interest and additional interest, if any, to the redemption date. If Metals USA Holdings makes certain public offerings, sales or issuances of common stock, and does not redeem the 2007 Notes, it will be required to make an offer to repurchase the maximum principal amount of the 2007 Notes that may be purchased out of the proceeds thereof, at a price equal to 100% of the principal amount, plus accrued and unpaid interest and additional interest, if any, to the date of repurchase.
If Metals USA Holdings experiences a change of control and does not redeem the 2007 Notes, it will be required to make an offer to repurchase the 2007 Notes at a price equal to 101% of the principal amount, plus accrued interest and unpaid interest and additional interest, if any, to the date of repurchase.
Under the indenture governing the 2007 Notes, we are required to pay interest on overdue principal at 1% per annum in excess of the rates discussed above and are required to pay interest on overdue installments of interest at such higher rate to the extent lawful.
The indenture governing the 2007 Notes contains covenants that, among other things, limit Metals USA Holdings’ ability and the ability of certain of its subsidiaries to incur or guarantee additional indebtedness or issue disqualified or preferred stock, repurchase or redeem capital stock or subordinated indebtedness, pay dividends or make distributions to its stockholders, incur restrictions on the ability of its subsidiaries to pay dividends or to make other payments to Metals USA Holdings, transfer or sell assets, create liens, enter into transactions with affiliates, make investments or acquisitions, and merge or consolidate with other companies or transfer all or substantially all of its assets.
Our affiliates, which include investment funds affiliated with, or co-investment vehicles managed indirectly by, Apollo Management L.P., including Apollo Investment Fund V, L.P., along with its parallel investment funds (“Apollo Management” and together with its affiliated investment entities “Apollo”), as well as our Chief Executive Officer and our Chief Financial Officer, have purchased a portion of our 2007 Notes in the market. For the nine months ended September 30, 2009, interest paid on the 2007 Notes held by affiliates amounted to $9.0, and was paid entirely by PIK Interest. From time to time, depending upon market, pricing and other conditions, as well on cash balances and liquidity, we, our subsidiaries or affiliates may seek to purchase or sell some amount of the Metals USA Notes or additional amounts of the 2007 Notes. Any such purchases or sales may be made in the open market, privately negotiated transactions, tender offers or otherwise. The amounts of any such purchases or sales may be material.
During the nine months ended September 30, 2009, we purchased $130.1 principal amount of the 2007 Notes in the open market, resulting in a pretax gain of $75.5 (net of unamortized deferred financing costs and original issue discount) on debt extinguishment.
F-55
Table of Contents
METALS USA HOLDINGS CORP. AND SUBSIDIARIES
NOTES TO UNAUDITED CONDENSED CONSOLIDATED FINANCIAL STATEMENTS—(Continued)
(dollars in millions)
Costs related to the issuance of the 2007 Notes were capitalized and are being charged to interest expense over the life of the 2007 Notes. Unamortized issuance costs of $1.5 as of September 30, 2009, are included in other non-current assets.
11 1/8% Senior Secured Notes Due 2015
On November 30, 2005, Flag Acquisition sold $275.0 aggregate principal amount of the Metals USA Notes. The Metals USA Notes bear interest at a rate per annum equal to 11 1/8%, payable semi-annually in arrears, on June 1 and December 1 of each year, commencing on June 1, 2006. The Metals USA Notes will mature on December 1, 2015. We may redeem some or all of the Metals USA Notes at any time on or after December 1, 2010 at a predetermined redemption price plus accrued and unpaid interest and additional interest, if any, to the applicable redemption date. If we experience a change of control and we do not redeem the Metals USA Notes, we will be required to make an offer to repurchase the Metals USA Notes at a price equal to 101% of the principal amount, plus accrued and unpaid interest and additional interest, if any, to the date of repurchase.
As a result of the Merger, Metals USA assumed the obligations of Flag Acquisition including the Metals USA Notes. All domestic operating subsidiaries of Metals USA have agreed, jointly and severally with Flag Intermediate (“Guarantors”), to unconditionally and irrevocably guarantee Metals USA’s obligations under the Metals USA Notes and Indenture dated as of November 30, 2005. Additionally, Flag Intermediate has unconditionally guaranteed to be a primary obligor of the due and punctual payment and performance of the obligations under the Indenture.
Metals USA Holdings is not a guarantor of the Metals USA Notes. There is a limitation on the amount of funds which can be transferred by the Guarantors to Metals USA Holdings in the form of dividends. Such amount available for distribution shall be increased by an amount equal to 50% of Consolidated Net Income, as defined, or reduced by an amount equal to 100% of Consolidated Net Loss, as defined. No amount was available under the restricted payment provision contained in the indenture governing the Metals USA Notes as of September 30, 2009.
The indebtedness evidenced by the Metals USA Notes and the guarantees will rank: equally with all of our and the Guarantors’ existing and future senior indebtedness; junior in priority as to collateral that secures the ABL facility on a first-priority lien basis with respect to our and the Guarantors’ obligations under the ABL facility, any other debt incurred after December 1, 2005 that has a priority security interest relative to the Metals USA Notes in the collateral that secures the ABL facility, any hedging obligations related to the foregoing debt and all cash management obligations incurred with any lender under the ABL facility; equal in priority as to collateral that secures the Metals USA Notes and the guarantees on a first-priority lien basis with respect to our and the Guarantors’ obligations under any other equivalent priority lien obligations incurred after December 1, 2005; and senior to all of our and the Guarantors’ existing and future subordinated indebtedness. The Metals USA Notes will also be effectively junior to the liabilities of any non-guarantor subsidiaries.
The Metals USA Notes contain covenants that are customary for debt instruments, including limitations on our or the guarantors’ ability to incur or guarantee additional debt, subject to certain exceptions, pay dividends, or make redemptions and repurchases with respect to capital stock, create or incur certain liens, make certain loans or investments, make acquisitions or investments, engage in mergers, acquisitions, asset sales and sale lease-back transactions, and engage in certain transactions with affiliates.
F-56
Table of Contents
METALS USA HOLDINGS CORP. AND SUBSIDIARIES
NOTES TO UNAUDITED CONDENSED CONSOLIDATED FINANCIAL STATEMENTS—(Continued)
(dollars in millions)
The Metals USA Notes indenture contains certain customary events of default, including (subject, in some cases, to customary cure periods thresholds) defaults based on (1) the failure to make payments under the Metals USA indenture when due, (2) breach of covenants, (3) cross-defaults to other material indebtedness, (4) bankruptcy events and (5) material judgments. We were in compliance with all covenants as of September 30, 2009.
During the nine months ended September 30, 2009, we purchased $48.7 principal amount of the Metals USA Notes in the open market, resulting in a pretax gain of $13.6 (net of unamortized deferred financing costs) on debt extinguishment.
Costs related to the establishment of the Metals USA Notes were capitalized and are being charged to interest expense over the life of the Metals USA Notes. Unamortized issuance costs of $4.5 as of September 30, 2009, are included in other non-current assets.
Industrial Revenue Bond
The Industrial Revenue Bond (“IRB”) is payable on May 1, 2016 in one lump sum payment. The interest rate assessed on the IRB varies from month to month and was 0.62% at September 30, 2009. The IRB is secured by real estate and equipment acquired with proceeds from the IRB. The IRB places various restrictions on certain of our subsidiaries, including but not limited to maintenance of required insurance coverage, maintenance of certain financial ratios, limits on capital expenditures and maintenance of tangible net worth and is supported by a letter of credit. We were in compliance with all covenants as of September 30, 2009.
9. Stockholders’ Deficit
Common Stock—In accordance with its Certificate of Incorporation dated May 9, 2005, and as amended on November 28, 2005, Metals USA Holdings was authorized to issue 30,000,000 shares of capital stock, all of which were shares of common stock, $.01 par value. At September 30, 2009, 14,077,500 shares were issued and outstanding.
10. Stock-Based Compensation
Metals USA Holdings’ Amended and Restated 2005 Stock and Incentive Plan (the “Plan”) permits the issuance of options and restricted stock awards on Metals USA Holdings’ stock to employees and directors of, or consultants to, the Company, except that consultants may only receive awards with the consent of the president of Metals USA. A total of $0.3 was recorded as stock-based employee compensation during each of the nine month periods ended September 30, 2009 and 2008, respectively.
On January 3, 2007, the Board of Directors of Metals USA Holdings adopted the Metals USA Holdings Corp. 2006 Deferred Compensation Plan (the “Deferred Compensation Plan”). The Deferred Compensation Plan was adopted in connection with the payment by Metals USA Holdings of a cash dividend of approximately $149.0 to its stockholders on January 3, 2007 (the “January 2007 Dividend”), and credited to individual accounts established for stock option holders an amount equal to $6.56 per share on certain unvested options, for a total of approximately $2.3. Payment of this liability was subject to continued employment for two years following the adoption date. The entire amount was
F-57
Table of Contents
METALS USA HOLDINGS CORP. AND SUBSIDIARIES
NOTES TO UNAUDITED CONDENSED CONSOLIDATED FINANCIAL STATEMENTS—(Continued)
(dollars in millions)
paid in one lump sum on January 5, 2009, upon completion of such period. This modification of the Company’s stock-based compensation resulted in incremental expense of $1.4 related to the Deferred Compensation Plan, which was recognized over a two-year vesting period beginning on the date of adoption of the Deferred Compensation Plan.
Description of Share Option Plan
The Plan has reserved for issuance up to 1.4 million shares of common stock. The Plan has two tranches of options, Tranche A and Tranche B. Tranche A options vest on a pro-rata basis over five years, have a term of ten years, and expire if not exercised. Tranche B options, which include both a service and a performance condition, vest on the eighth anniversary of the date of grant or earlier dependent on the satisfaction of an internal rate of return on capital invested, have a term of ten years from date of grant, and expire if not exercised. Awards are generally granted with an exercise price equal to the fair value of Metals USA Holdings’ stock at the date of grant. The fair value of the stock is a calculated value based on the date of each of the respective grants using a combination of discounted cash flows and financial metrics from companies with similar characteristics of Metals USA Holdings. Certain option and share awards provide for accelerated vesting if there is a change in control (as defined in the Plan).
In connection with a $25.0 dividend paid to our stockholders in May 2006 (the “May 2006 Dividend”) and pursuant to the Plan’s provisions of rights preservation, the Board of Directors modified the outstanding options by reducing the per share exercise price by $1.78 in order to retain the participants’ rights proportionate with those prior to the dividend payment.
In connection with the January 2007 Dividend, the outstanding employee stock options under the Plan were adjusted a second time by an amount approximately equal to the per share amount of this dividend. The per share exercise price of the options granted on November 30, 2005, was decreased by $4.22 to $4.00 and the per share exercise price of the options granted on March 17, 2006, was reduced by $4.89 to $4.00.
Because the payment of the January 2007 Dividend resulted in the internal rate of return of the funds managed by Apollo with respect to its investment in Metals USA Holdings to be near 25%, the Board of Directors exercised its discretion under the Plan to vest all of the outstanding Tranche B options. In addition, the Board of Directors exercised its discretion to vest all Tranche A options granted to directors affiliated with Apollo. In connection with the accelerated vesting of these options, we recognized $1.8 of non-cash stock-based compensation expense, net of related tax effects, in the first quarter of 2007.
In connection with the payment by Metals USA Holdings of a cash dividend of approximately $139.5 to its stockholders on July 10, 2007 (the “July 2007 Dividend”), stock option holders were paid approximately $9.25 per share on outstanding options (an amount equal to the per-share amount of the July 2007 Dividend), for a total of approximately $9.2. The cash payment to holders of outstanding options to acquire shares of Metals USA Holdings’ common stock was made to equitably adjust such option holders by the Metals USA Holdings Board of Directors pursuant to the exercise of its discretion to preserve the rights of options holders under the Plan. As a result of the cash payment on outstanding options, we were required to recognize $0.3 of non-cash stock-based compensation expense, net of related tax effects, in the third quarter of 2007.
F-58
Table of Contents
METALS USA HOLDINGS CORP. AND SUBSIDIARIES
NOTES TO UNAUDITED CONDENSED CONSOLIDATED FINANCIAL STATEMENTS—(Continued)
(dollars in millions)
Tranche A Options
The fair value of Tranche A option awards was estimated on the date of grant using a black-scholes option valuation model. No options have been granted since the first quarter of 2006. The following is a summary of valuation assumptions for Tranche A option grants outstanding as of September 30, 2009:
| Expected dividend yield |
0% | |
| Expected stock price volatility |
54.7%-54.9% | |
| Risk free interest rate |
4.0%-4.6% | |
| Expected life of options (in years) |
6.5-10.0 |
The following is a summary of stock option activity for Tranche A options for the nine-month period ended September 30, 2009:
| Weighted Average Fair Value |
Weighted Average Exercise Price |
Weighted Average Remaining Contractual Life (Years) |
Number of Options |
||||||||
| Balance, December 31, 2008 |
$ | 6.63 | $ | 4.00 | 555,630 | ||||||
| Granted |
— | — | — | ||||||||
| Exercised |
— | — | — | ||||||||
| Canceled or expired |
$ | 6.93 | $ | 4.00 | (18,974 | ) | |||||
| Balance, September 30, 2009 |
$ | 6.61 | $ | 4.00 | 6.2 | 536,656 | |||||
| Vested and Exercisable as of: |
|||||||||||
| September 30, 2009 |
$ | 4.00 | 6.2 | 381,380 | |||||||
A summary of nonvested Tranche A stock options for the nine-month period ended September 30, 2009, is presented below:
| Weighted Average Grant-Date Fair Value |
Number of Options |
|||||
| Nonvested at December 31, 2008 |
$ | 6.80 | 178,329 | |||
| Granted |
— | — | ||||
| Vested |
6.27 | (4,079 | ) | |||
| Exercised |
— | — | ||||
| Canceled or expired |
6.93 | (18,974 | ) | |||
| Nonvested at September 30, 2009 |
$ | 6.80 | 155,276 | |||
As of September 30, 2009, there was $0.5 of total unrecognized compensation cost related to nonvested share-based compensation arrangements granted under the Tranche A options, which will be amortized over a remaining period of 1.2 years.
F-59
Table of Contents
METALS USA HOLDINGS CORP. AND SUBSIDIARIES
NOTES TO UNAUDITED CONDENSED CONSOLIDATED FINANCIAL STATEMENTS—(Continued)
(dollars in millions)
Tranche B Options
The fair value of the Tranche B options was also estimated on the date of grant using the same option valuation model used for the Tranche A options. No options have been granted since the first quarter of 2006. The following is a summary of valuation assumptions for Tranche B option grants outstanding as of September 30, 2009:
| Expected dividend yield |
0% | |
| Expected stock price volatility |
54.3%-54.7% | |
| Risk free interest rate |
4.0%-5.0% | |
| Expected life of options (in years) |
8.0-10.0 |
The following is a summary of stock option activity for Tranche B options for the nine-month period ended September 30, 2009:
| Weighted Average Fair Value |
Weighted Average Exercise Price |
Weighted Average Remaining Contractual Life (Years) |
Number of Options | |||||||
| Balance, December 31, 2008 |
$ | 6.92 | $ | 4.00 | 395,631 | |||||
| Granted |
— | — | — | |||||||
| Exercised |
— | — | — | |||||||
| Canceled or expired |
— | — | — | |||||||
| Balance, September 30, 2009 |
$ | 6.92 | $ | 4.00 | 6.2 | 395,631 | ||||
| Vested and Exercisable as of: |
||||||||||
| September 30, 2009 |
$ | 4.00 | 6.2 | 395,631 | ||||||
All Tranche B stock options outstanding as of September 30, 2009 are fully vested and exercisable.
Restricted Stock
The Plan allows for grants of restricted stock as long-term compensation for directors and employees of, or consultants to, the Company or any of its subsidiaries. Grants of restricted stock have a vesting period that is determined at the discretion of the Board of Directors. The Company amortizes stock-based compensation expense associated with restricted stock ratably over the vesting period. For the nine-month period ending September 30, 2009, there were no shares of nonvested restricted stock outstanding.
11. Income Taxes
For the nine months ended September 30, 2009, the Company’s effective income tax rate was 32.2%, compared to the applicable U.S. federal and state statutory income tax rate of 38.8%. Differences between the effective tax rate and U.S. statutory tax rate primarily arise from the domestic production activities deduction, recording of tax expense for the cancellation of debt income as a discreet item, and accounting method changes incorporated in the Company’s federal tax return filed during the third quarter of 2009.
F-60
Table of Contents
METALS USA HOLDINGS CORP. AND SUBSIDIARIES
NOTES TO UNAUDITED CONDENSED CONSOLIDATED FINANCIAL STATEMENTS—(Continued)
(dollars in millions)
As of September 30, 2009, our unrecognized tax benefits totaled $7.2, and based on the contingent and uncertain nature of our liability, we are unable to make an estimate of the period of potential cash settlement, if any, with respective taxing authorities. The total amount of unrecognized tax benefits that, if recognized, would impact the Company’s effective tax rate is $0.1 for the nine months ended September 30, 2009.
We file numerous consolidated and separate income tax returns in the United States and various foreign jurisdictions. We are no longer subject to U.S. federal income tax examinations for years before 2002 and are no longer subject to state and local, or foreign income tax examinations for years before 2000.
We account for any applicable interest and penalties on uncertain tax positions as a component of income tax expense. As of September 30, 2009, the liability for uncertain income taxes includes interest and penalties of $1.5, of which $0.1 is included in our statement of operations and impacted the Company’s effective income tax rate for the nine months ended September 30, 2009.
12. Segment and Related Information
The following tables show summarized financial information for our reportable segments. The amounts shown as an operating loss under the column heading “Corporate and Other” consist primarily of general and administrative costs that are not allocated to the segments. Goodwill and customer list intangible assets resulting from the Merger are assigned to reporting units solely for testing for impairment. The reconciliation of operating income to net income before income taxes is shown within the Consolidated Statements of Operations and therefore is not separately presented.
| Nine Months Ended September 30, | |||||||||||||||||||
| Plates and Shapes |
Flat Rolled and Non-Ferrous |
Building Products |
Corporate and Other |
Total | |||||||||||||||
| 2009: |
|||||||||||||||||||
| Net sales |
$ | 413.1 | $ | 374.0 | $ | 73.0 | $ | (6.7 | ) | $ | 853.4 | ||||||||
| Operating income (loss) |
(17.8 | ) | 9.7 | (2.6 | ) | (16.6 | ) | (27.3 | ) | ||||||||||
| Capital expenditures |
2.8 | 0.5 | — | 0.3 | 3.6 | ||||||||||||||
| Depreciation and amortization(1) |
7.2 | 5.3 | 2.1 | 1.3 | 15.9 | ||||||||||||||
| 2008: |
|||||||||||||||||||
| Net sales |
$ | 915.1 | $ | 695.0 | $ | 100.3 | $ | (10.6 | ) | $ | 1,699.8 | ||||||||
| Operating income (loss) |
155.0 | 72.1 | (6.4 | ) | (21.7 | ) | 199.0 | ||||||||||||
| Capital expenditures |
6.0 | 1.8 | 0.6 | 0.5 | 8.9 | ||||||||||||||
| Depreciation and amortization(1) |
6.9 | 5.4 | 2.5 | 3.4 | 18.2 | ||||||||||||||
| (1) | Includes depreciation expense reflected in cost of goods sold for the Building Products Group. |
F-61
Table of Contents
METALS USA HOLDINGS CORP. AND SUBSIDIARIES
NOTES TO UNAUDITED CONDENSED CONSOLIDATED FINANCIAL STATEMENTS—(Continued)
(dollars in millions)
| September 30, 2009 |
December 31, 2008 | |||||
| Total Assets: |
||||||
| Plates and Shapes |
$ | 312.2 | $ | 483.3 | ||
| Flat Rolled and Non-Ferrous |
223.4 | 309.2 | ||||
| Building Products |
49.4 | 62.0 | ||||
| Corporate and Other |
77.5 | 233.7 | ||||
| Consolidated |
$ | 662.5 | $ | 1,088.2 | ||
| Goodwill: |
||||||
| Plates and Shapes |
$ | 15.5 | $ | 15.5 | ||
| Flat Rolled and Non-Ferrous |
20.5 | 20.5 | ||||
| Building Products |
2.0 | 1.8 | ||||
| Corporate and Other |
11.0 | 12.1 | ||||
| Consolidated |
$ | 49.0 | $ | 49.9 | ||
Changes in goodwill for the nine months ended September 30, 2009 are attributable to accounting for tax benefits associated with tax-deductible goodwill recognized in connection with the Merger, which was a taxable business combination.
We recorded write-downs of $46.7 for inventory lower of cost or market adjustments during the nine months ended September 30, 2009 in our metals service center businesses.
13. Commitments and Contingencies
Letters of Credit
Letters of credit outstanding at September 30, 2009 consist of a letter of credit in the amount of $5.8 in conjunction with the IRB (see Note 8) and other letters of credit aggregating $9.6 (total letters of credit of $15.4 at September 30, 2009). Other letters of credit consist primarily of collateral support for our property and casualty insurance program. All letters of credit reduce the amount available to borrow under the ABL Facility.
Pension Fund Withdrawal Obligation
During 2007, we discontinued our participation in a multiemployer pension fund. In connection with our cessation of contributions to the plan, we were assessed a withdrawal liability of approximately $5.6, which we are paying in monthly installments through 2021. As of September 30, 2009, our total withdrawal liability, including interest and amortization charges, amounted to approximately $7.5.
Dividends Relating to 2007 Notes
See Note 8 for a discussion of the extent to which Metals USA Holdings is dependent on Flag Intermediate’s cash flows to service its debt.
Contingencies
From time to time, we are involved in a variety of claims, lawsuits and other disputes arising in the ordinary course of business. We believe the resolution of these matters and the incurrence of their related costs and expenses should not have a material adverse effect on our consolidated financial position, results of operations, cash flows or liquidity.
F-62
Table of Contents
METALS USA HOLDINGS CORP. AND SUBSIDIARIES
NOTES TO UNAUDITED CONDENSED CONSOLIDATED FINANCIAL STATEMENTS—(Continued)
(dollars in millions)
14. Related Party Transactions
Upon completion of the Merger, Metals USA Holdings entered into a management agreement with Apollo under which Apollo or its affiliates provide us with management services. Pursuant to the agreement, Apollo receives an annual management fee equal to $2.0, payable on March 15 of every year, starting on March 15, 2006. The management agreement will terminate on December 31, 2012, unless terminated earlier by Apollo. Apollo elected to waive $0.5 of the annual management fee indefinitely, but reserved the right to revoke this waiver. The payment obligation has been recorded as a current liability (see Note 7) at the present value of minimum future annual payments of $1.5. A discount rate of 6.1% was used in the determination of present value, which approximated our incremental borrowing rate at the inception of the agreement. Deferred management fees of $8.6 are being amortized on a straight-line basis over the term of the agreement. For the nine months ended September 30, 2009, amortization of deferred management fees was $1.1, with $0.9 recorded as administrative expense and $0.2 recorded as interest expense during the period. For the nine months ended September 30, 2008, amortization of deferred management fees was $0.9, with $0.6 recorded as administrative expense and $0.3 recorded as interest expense during the period.
The management agreement also provides that affiliates of Apollo will be entitled to receive a fee in connection with certain subsequent financing, acquisition, disposition and change of control transactions with a value of $25.0 or more, with such fee to be equal to 1% of the gross transaction value of any such transaction.
Upon a termination of the management agreement prior to December 31, 2012, Apollo will be entitled to receive the present value of (a) $14.0, less (b) the aggregate amount of management fees that were paid to it under the agreement prior to such termination, and less (c) management fees waived. Both the management agreement and transaction fee agreement contain customary indemnification provisions in favor of Apollo and its affiliates, as well as expense reimbursement provisions with respect to expenses incurred by Apollo and its affiliates in connection with its performance of services thereunder.
Our affiliates, which include Apollo, as well as our Chief Executive Officer and our Chief Financial Officer, have purchased a portion of our 2007 Notes in the market. For the nine months ended September 30, 2009, interest paid on the 2007 Notes held by affiliates amounted to $9.0, and was paid entirely by PIK Interest. From time to time, depending upon market, pricing and other conditions, as well on cash balances and liquidity, we, our subsidiaries or affiliates may seek to purchase or sell some amount of the Metals USA Notes or additional amounts of the 2007 Notes. Any such purchases or sales may be made in the open market, privately negotiated transactions, tender offers or otherwise. The amounts of any such purchases or sales may be material.
F-63
Table of Contents
METALS USA HOLDINGS CORP. AND SUBSIDIARIES
NOTES TO UNAUDITED CONDENSED CONSOLIDATED FINANCIAL STATEMENTS—(Continued)
(dollars in millions)
15. Comprehensive Income
The following table sets forth comprehensive income, net of applicable taxes, for the nine months ended September 30, 2009 and 2008.
| Nine Months Ended September 30, |
|||||||
| 2009 | 2008 | ||||||
| Net income |
$ | 7.9 | $ | 79.6 | |||
| Other comprehensive income (loss): |
|||||||
| Foreign currency translation adjustments |
0.5 | (0.4 | ) | ||||
| Unrealized gains (losses) on derivatives |
1.3 | 3.2 | |||||
| Unrealized gains (losses) on investment securities |
— | (0.2 | ) | ||||
| Total comprehensive income |
$ | 9.7 | $ | 82.2 | |||
16. Earnings (Loss) Per Share
Basic earnings (loss) per share is calculated by dividing net income (loss) by the weighted average number of common shares outstanding during the period, including the weighted average impact of any shares issued during the period. Diluted earnings per share calculations also include the dilutive effect of stock options.
The weighted average number of shares used to determine basic and diluted earnings (loss) per share was:
| Nine Months Ended September 30, | ||||
| 2009 | 2008 | |||
| Weighted average shares outstanding—basic |
14,077,500 | 14,077,500 | ||
| Effect of dilution: |
||||
| Stock options |
— | 490,455 | ||
| Weighted average shares outstanding—diluted |
14,077,500 | 14,567,955 | ||
F-64
Table of Contents
Shares
Metals USA Holdings Corp.
Common Stock
Metals USA Holdings Corp.
Table of Contents
PART II
INFORMATION NOT REQUIRED IN PROSPECTUS
| Item 13. | Other Expenses of Issuance and Distribution. |
The following table sets forth the costs and expenses, other than underwriting discounts and commissions, payable by Metals USA Holdings Corp. (the “Registrant”) in connection with the issuance and distribution of the securities being registered. All amounts are estimates except the SEC registration, Financial Industry Regulatory Authority (“FINRA”) and The New York Stock Exchange filing fees.
| SEC Registration fee |
$ | 7,860 | |
| The New York Stock Exchange filing fee and listing fee |
* | ||
| Transfer agent’s fee |
* | ||
| Printing and engraving expenses |
* | ||
| Legal and accounting fees and expenses |
* | ||
| FINRA filing fee |
20,500 | ||
| Miscellaneous |
* | ||
| Total |
$ | * | |
| * | To be filed by amendment. |
| Item 14. | Indemnification of Directors and Officers. |
Metals USA Holdings Corp. (the “Registrant”) is a Delaware corporation. Section 145(a) of the General Corporation Law of the State of Delaware (the “DGCL”) provides that a Delaware corporation may indemnify any person who was or is a party or is threatened to be made a party to any threatened, pending or completed action, suit or proceeding, whether civil, criminal, administrative or investigative (other than an action by or in the right of the corporation) by reason of the fact that he is or was a director, officer, employee or agent of the corporation or is or was serving at the request of the corporation as a director, officer, employee or agent of another corporation, partnership, joint venture, trust or other enterprise, against expenses, judgments, fines and amounts paid in settlement actually and reasonably incurred by him in connection with such action, suit or proceeding if he acted in good faith and in a manner he reasonably believed to be in or not opposed to the best interests of the corporation, and, with respect to any criminal action or proceeding, had no cause to believe his conduct was unlawful.
Section 145(b) of the DGCL provides that a Delaware corporation may indemnify any person who was or is a party or is threatened to be made a party to any threatened, pending or completed action or suit by or in the right of the corporation to procure a judgment in its favor by reason of the fact that such person acted in any of the capacities set forth above, against expenses actually and reasonably incurred by him in connection with the defense or settlement of such action or suit if he acted under similar standards, except that no indemnification may be made in respect of any claim, issue or matter as to which such person shall have been adjudged to be liable to the corporation unless and only to the extent that the court in which such action or suit was brought shall determine that despite the adjudication of liability, such person is fairly and reasonably entitled to be indemnified for such expenses which the court shall deem proper.
Section 145 of the DGCL further provides that to the extent a director or officer of a corporation has been successful in the defense of any action, suit or proceeding referred to in subsections (a) and (b) or in the defense of any claim, issue, or matter therein, he shall be indemnified against any expenses, including attorneys’ fees, actually and reasonably incurred by him in connection therewith;
II-1
Table of Contents
that indemnification provided for by Section 145 shall not be deemed exclusive of any other rights to which the indemnified party may be entitled; and that the corporation may purchase and maintain insurance on behalf of a director, officer, employee or agent of the corporation against any liability asserted against him or incurred by him in any such capacity or arising out of his status as such whether or not the corporation would have the power to indemnify him against such liabilities under Section 145.
Section 102(b)(7) of the DGCL provides that a corporation in its original certificate of incorporation or an amendment thereto validly approved by stockholders may eliminate or limit personal liability of members of its board of directors or governing body for breach of a director’s fiduciary duty. However, no such provision may eliminate or limit the liability of a director for breaching his duty of loyalty, failing to act on good faith, engaging in intentional misconduct or knowingly violating a law, paying a dividend or approving a stock repurchase which was illegal or obtaining an improper personal benefit. A provision of this type has no effect on the availability of equitable remedies, such as injunction or rescission, for breach of fiduciary duty. Our Amended and Restated Certificate of Incorporation (as amended and restated, the “Certificate of Incorporation”) provides for such limitation of liability.
Our Certificate of Incorporation contains a provision which eliminates the personal liability of our directors to us or our stockholders for monetary damages for breach of fiduciary duty as a director to the fullest extent permitted by the DGCL. In addition, our Certificate of Incorporation and our Amended and Restated Bylaws (as amended and restated, the “Bylaws”), subject to certain exemptions and conditions, require us to indemnify to the full extent permitted by the laws of the State of Delaware in the event each person who is involved in legal proceedings by reason of the fact that he is or was a director, officer, employee or agent of the Company, or is or was serving at our request as a director, officer, employee or agent of another corporation, partnership or other enterprise against expenses (including attorneys’ fees) actually and reasonably incurred by the person in connection with the defense or settlement of such action or suit if the person acted in good faith and in a manner the person reasonably believed to be in or not opposed to our best interests and except that no indemnification shall be made in respect of any claim, issue, or matter as to which such person shall have been adjudged to be liable to us unless and only to the extent that the Delaware Court of Chancery or the court in which such action or suit was brought shall determine that, despite the adjudication of liability but in view of all the circumstances of the case, such person is fairly and reasonably entitled to indemnity for such expenses which the Delaware Court of Chancery or such other court shall deem proper. We are also required to advance to such persons expenses incurred in defending a proceeding to which indemnification might apply, provided the recipient provides an undertaking agreeing to repay all such advanced amounts if it is ultimately determined that he is not entitled to be indemnified. In addition, the Bylaws specifically provide that the indemnification rights granted thereunder are non-exclusive.
The foregoing statements are subject to the detailed provisions of Sections 102(b)(7) and 145 of the DGCL, the full text of our Certificate of Incorporation, the form of which will be filed as an exhibit to this registration statement, and the full text of our Bylaws, the form of which will be filed as an exhibit to this registration statement. The proposed form of underwriting agreement which we will file as an exhibit to this registration statement provides for indemnification to our directors and officers by the underwriters against certain liabilities.
We currently have an insurance policy covering our directors and officers to insure against certain losses incurred by them.
II-2
Table of Contents
| Item 15. | Recent Sales of Unregistered Securities |
Set forth below in chronological order is certain information regarding securities issued by the Registrant during the last three years. In transactions that were not registered under the Securities Act of 1933, as amended (the “Securities Act”), including the consideration, if any, received by the Registrant for such issuances. During the past three years, we have issued unregistered securities to a limited number of persons, as described below. None of these transactions involved any underwriters or any public offerings. Each of these transactions was exempt from registration under the Securities Act pursuant to Section 4(2) of the Securities Act or Regulation D or Rule 701 promulgated thereunder, as transactions by an issuer not involving a public offering. With respect to each transaction, no general solicitation was made by either the Registrant or any person acting on its behalf; the securities sold are subject to transfer restrictions; and the certificates for the shares contained an appropriate legend stating such securities have not been registered under the Securities Act and may not be offered or sold absent, registration or pursuant to an exemption therefrom.
On November 20, 2009, the Registrant issued 40,000 shares of Common Stock to Joshua J. Harris pursuant to his exercise of options granted to him on January 18, 2006 at an adjusted exercise price of $4.00 per share. The Registrant received aggregate cash consideration of $160,000.00 upon the exercise.
On November 10, 2009, the Registrant issued 58,400 shares of Common Stock to John A. Hageman pursuant to his exercise of options granted to him on September 29, 2005 at an adjusted exercise price of $4.00 per share. The Registrant received aggregate cash consideration of $233,600.00 upon the exercise.
On June 29, 2007, the Registrant issued $300,000,000 aggregate principal amount of the Registrant’s Senior Floating Rate Toggle Notes due 2012 (the “2007 Notes”) to UBS Securities LLC, as the initial purchaser, who subsequently resold the 2007 Notes to qualified institutional buyers pursuant to Rule 144A under the Securities Act and to non-U.S. persons outside of the United States in reliance on Regulation S under the Securities Act. The 2007 Notes were sold to the initial purchasers at a price of 97% of par value. Pursuant to the Registration Rights Agreement governing the issuance of the 2007 Notes, we completed an exchange offer to register $216,000,000 aggregate principal amount of the 2007 Notes on February 26, 2008.
II-3
Table of Contents
| Item 16. | Exhibits and Financial Statement Schedules. |
(a) Exhibits
| Exhibit |
Description | |
| 1.1 | Form of Underwriting Agreement* | |
| 2.1 | Agreement and Plan of Merger, dated May 18, 2005 between Metals USA, Inc., Flag Acquisition Corporation and Flag Intermediate Corporation (incorporated by reference to Exhibit 2.1 to Metals USA, Inc.’s Registration Statement (File No. 333-132918-26) on Form S-4 filed on March 31, 2006) | |
| 3.1 | Form of Amended and Restated Certificate of Incorporation of Metals USA Holdings Corp.** | |
| 3.2 | Form of Amended and Restated Bylaws of Metals USA Holdings Corp.** | |
| 4.1 | Form of Common Stock Certificate of Metals USA Holdings Corp.* | |
| 5.1 | Form of Opinion of Wachtell, Lipton, Rosen & Katz** | |
| 10.1 | Employment Agreement, dated September 29, 2005, between Metals USA, Inc. and C. Lourenco Goncalves (incorporated by reference to Exhibit 10.1 to Metals USA, Inc.’s Registration Statement (File No. 333-132918-26) on Form S-4 filed on March 31, 2006) | |
| 10.2 | Employment Agreement, dated September 29, 2005, between Metals USA, Inc. and John A. Hageman (incorporated by reference to Exhibit 10.2 to Metals USA, Inc.’s Registration Statement (File No. 333-132918-26) on Form S-4 filed on March 31, 2006) | |
| 10.3 | Employment Agreement, dated September 29, 2005, between Metals USA, Inc. and Robert C. McPherson, III (incorporated by reference to Exhibit 10.3 to Metals USA, Inc.’s Registration Statement (File No. 333-132918-26) on Form S-4 filed on March 31, 2006) | |
| 10.4 | Severance Agreement, dated September 29, 2005, between Metals USA, Inc. and Roger Krohn (incorporated by reference to Exhibit 10.4 to Metals USA, Inc.’s Registration Statement (File No. 333-132918-26) on Form S-4 filed on March 31, 2006) | |
| 10.5 | Severance Agreement, dated September 29, 2005, between Metals USA, Inc. and David Martens (incorporated by reference to Exhibit 10.5 to Metals USA, Inc.’s Registration Statement (File No. 333-132918-26) on Form S-4 filed on March 31, 2006) | |
| 10.6 | Severance Agreement, dated September 29, 2005, between Metals USA, Inc. and Joe Longo (incorporated by reference to Exhibit 10.6 to Metals USA, Inc.’s Registration Statement (File No. 333-132918-26) on Form S-4 filed on March 31, 2006) | |
| 10.7 | Amended and Restated 2005 Stock Incentive Plan of Metals USA Holdings Corp. (incorporated by reference to Exhibit 10.7 to Metals USA, Inc.’s Registration Statement (File No. 333-132918-26) on Form S-4/A filed on May 26, 2006) | |
| 10.8 | Management Agreement, dated as of November 30, 2005, between Metals USA, Inc., Metals USA Holdings Corp. and Apollo Management V, L.P. (incorporated by reference to Exhibit 10.8 to Metals USA, Inc.’s Registration Statement (File No. 333-132918-26) on Form S-4 filed on March 31, 2006) | |
| 10.9 | Director Compensation Plan of Metals USA Holdings Corp. (incorporated by reference to Exhibit 10.9 to Metals USA, Inc.’s Registration Statement (File No. 333-132918-26) on Form S-4 filed on March 31, 2006) | |
| 10.10 | Management Deferred Compensation Plan (incorporated by reference to Exhibit 10.11 to Metals USA, Inc.’s report on Form 10-K filed on March 12, 2007) | |
| 10.11 | Form of Amended and Restated Investors Rights Agreement* | |
II-4
Table of Contents
| Exhibit |
Description | |
| 10.12 | Loan and Security Agreement, dated as of November 30, 2005, among Credit Suisse, as the Administrative Agent, Bank of America, N.A., as the Collateral Agent, Flag Intermediate Holdings Corporation, Metals USA, Inc. (formerly Flag Acquisition Corporation) and certain Subsidiaries of Metals USA, Inc. party thereto (incorporated by reference to Exhibit 4.5 to Metals USA, Inc.’s Registration Statement (File No. 333-132918-26) on Form S-4 filed on March 31, 2006) | |
| 10.13 | Indenture, dated November 30, 2005, by and among Metals USA, Inc. (formerly Flag Acquisition Corporation), Flag Intermediate Holdings Corporation, the Subsidiary Guarantors and Wells Fargo Bank, N.A., as Trustee, and the Notes Collateral Agent (incorporated by reference to Exhibit 4.6 to Metals USA, Inc.’s Registration Statement (File No. 333-132918-26) on Form S-4 filed on March 31, 2006) | |
| 10.14 | Supplemental Indenture, dated as of November 30, 2005, among Metals USA, Inc., Flag Intermediate Holdings Corporation, the Subsidiary Guarantors and Wells Fargo Bank, N.A., as Trustee and Notes Collateral Agent (incorporated by reference to Exhibit 4.9 to Metals USA, Inc.’s Registration Statement (File No. 333-132918-26) on Form S-4 filed on March 31, 2006) | |
| 10.15 | Second Supplemental Indenture, dated as of March 31, 2005, among MUSA Newark, LLC, Metals USA, Inc., Flag Intermediate Holdings Corporation, and Wells Fargo Bank, N.A. (incorporated by reference to Exhibit 4.10 to Metals USA, Inc.’s Registration Statement (File No. 333-132918-26) on Form S-4 filed on March 31, 2006) | |
| 10.16 | Third Supplemental Indenture, dated as of June 20, 2006, among Metals USA International Holdings, Inc., Flag Intermediate Holdings Corporation, and Wells Fargo Bank, N.A., as Trustee and Notes Collateral Agent (incorporated by reference to Exhibit 4.11 of Amendment No. 3 to Metals USA, Inc.’s Registration Statement (File No. 333-132918) on Form S-4 filed on August 2, 2006) | |
| 10.17 | Amendment No. 1, dated as of July 18, 2006, to the Loan and Security Agreement dated as of November 30, 2005, among each of the Lenders party thereto, Credit Suisse, as the Administrative Agent, Bank of America, N.A., as the Collateral Agent, Flag Intermediate Holdings Corporation, Metals USA, Inc. (formerly Flag Acquisition Corporation) and certain Subsidiaries of Metals USA, Inc. party thereto (incorporated by reference to Exhibit 4.12 of Amendment No. 3 to Metals USA, Inc.’s Registration Statement (File No. 333-132918) on Form S-4 filed on August 2, 2006) | |
| 10.18 | Amendment No. 2, dated as of June 8, 2007, to the Loan and Security Agreement dated as of November 30, 2005, as amended by Amendment No. 1, dated as of July 18, 2006, among Flag Intermediate Holdings Corporation, Metals USA, Inc., and certain Subsidiaries of Metals USA, Inc. party thereto, Credit Suisse, as administrative agent, and Bank of America, N.A. (incorporated herein by reference to Exhibit 4.1 to Flag Intermediate Holdings Corporation’s Quarterly Report on Form 10-Q for the quarterly period ended June 30, 2007 (File No. 333-132918) filed on August 6, 2007) | |
| 10.19 | Transaction Fee Agreement, dated as of November 30, 2005, between Metals USA, Inc. and Apollo Management V, L.P. (incorporated herein by reference to Exhibit 10.10 to Amendment No. 1 to Flag Intermediate Holdings Corporation’s Registration Statement on Form S-4 (File No. 333-132918) filed on May 26, 2006) | |
| 10.20 | Indenture, dated July 10, 2007, between Metals USA Holdings Corp. and Wells Fargo Bank, N.A., as trustee (incorporated by reference to Exhibit 4.1 to Metals USA Holdings Corp.’s Registration Statement (File No. 333-146181) on Form S-4 filed on September 19, 2007) | |
II-5
Table of Contents
| Exhibit |
Description | |
| 10.21 | Registration Rights Agreement, dated as of July 10, 2007, by and among Metals USA Holdings Corp. and UBS Securities LLC (incorporated by reference to Exhibit 4.1 to Metals USA Holdings Corp.’s Registration Statement (File No. 333-146181) on Form S-4 filed on September 19, 2007) | |
| 10.22 | Form of Senior Floating Rate Toggle Note Due 2012 (included in Exhibit 10.20) | |
| 21.1 | List of Subsidiaries of Metals USA Holdings Corp. (incorporated by reference to Exhibit 21.1 of Metals USA Holdings Corp.’s Annual Report for the fiscal year ended December 31, 2008 on Form 10-K filed on February 24, 2009) | |
| 23.1 | Consent of Wachtell, Lipton, Rosen & Katz (included in Exhibit 5.1) | |
| 23.2 | Consent of Deloitte & Touche LLP | |
| 24.1 | Power of Attorney (included in signature page) |
| * | To be filed by amendment. |
| ** | Previously filed. |
(b) Financial Statement Schedules
| Page | ||
| S-1 |
See Metals USA Holdings Corp.’s Consolidated Financial Statements on page F-1. All other schedules for which provision is made in the applicable accounting regulations of the SEC are not required, are inapplicable or the information is included in the consolidated financial statements, and have therefore been omitted.
| Item 17. | Undertakings. |
The undersigned Registrant hereby undertakes the following:
(1) Insofar as indemnification for liabilities arising under the Securities Act may be permitted to directors, officers and controlling persons of the Registrant pursuant to the foregoing provisions, or otherwise, the Registrant has been advised that in the opinion of the U.S. Securities and Exchange Commission such indemnification is against public policy as expressed in the Securities Act and is, therefore, unenforceable. In the event that a claim for indemnification against such liabilities (other than the payment by the Registrant of expenses incurred or paid by a director, officer or controlling person of the Registrant in the successful defense of any action, suit or proceeding) is asserted by such director, officer or controlling person in connection with the securities being registered, the Registrant will, unless in the opinion of its counsel the matter has been settled by controlling precedent, submit to a court of appropriate jurisdiction the question whether such indemnification by it is against public policy as expressed in the Securities Act and will be governed by the final adjudication of such issue.
(2) (a) For purposes of determining any liability under the Securities Act, the information omitted from the form of prospectus filed as part of this Registration Statement in reliance upon Rule 430A and contained in the form of prospectus filed by the Registrant pursuant to Rule 424(b)(1) or (4) or 497(h) under the Securities Act shall be deemed to be part of this Registration Statement as of the time it was declared effective; and
(b) For the purpose of determining any liability under the Securities Act, each post-effective amendment that contains a form of prospectus shall be deemed to be a new registration
statement relating to the securities offered therein, and the offering of such securities at that time shall be deemed to be the initial bona fide offering thereof.
II-6
Table of Contents
SIGNATURES
Pursuant to the requirements of the Securities Act of 1933, as amended, the registrant has duly caused this registration statement to be signed on its behalf by the undersigned, thereunto duly authorized, in the City of Houston, State of Texas, on the 20th day of November, 2009.
| METALS USA HOLDINGS CORP. | ||
| By: |
/s/ C. Lourenco Goncalves | |
| Name: | C. Lourenco Goncalves | |
| Title: | President, Chief Executive Officer and Director (Principal Executive Officer) | |
Each person whose signature appears below hereby constitutes and appoints C. Lourenco Goncalves and Robert C. McPherson, III and each of them, as his or her true and lawful attorneys-in-fact and agents, with full power of substitution and resubstitution for him and in his name, place and stead, in any and all capacities, to sign any or all amendments or supplements to this registration statement, whether pre-effective or post-effective, including any subsequent registration statement for the same offering which may be filed under Rule 462(b) under the Securities Act of 1933, as amended, and to file the same with all exhibits thereto and other documents in connection therewith, with the Securities and Exchange Commission, granting unto said attorneys-in-fact and agents, and each of them, full power and authority to do and perform each and every act and thing necessary or appropriate to be done with respect to this registration statement or any amendments or supplements hereto in the premises, as fully to all intents and purposes as he might or could do in person, hereby ratifying and confirming all that said attorneys-in-fact and agents, or either of them, or their or his substitute or substitutes, may lawfully do or cause to be done by virtue thereof. Each person whose signature appears below hereby revokes any and all powers of attorney previously given by such person with respect to said registration statement, provided that this revocation shall not affect the exercise of such power prior to the date hereof.
Pursuant to the requirements of the Securities Act of 1933, as amended, this registration statement has been signed below by the following persons in the capacities and on the dates indicated below.
| Name |
Title |
Date | ||
| /s/ C. Lourenco Goncalves C. Lourenco Goncalves |
President, Chief Executive Officer and Director (Principal Executive Officer) |
November 20, 2009 | ||
| /s/ Robert C. McPherson, III Robert C. McPherson, III |
Senior Vice President and Chief Financial Officer (Principal Financial) |
November 20, 2009 | ||
| /s/ Dan Henneke Dan Henneke |
Vice President, Corporate Controller (Principal Accounting Officer) |
November 20, 2009 | ||
| /s/ John T. Baldwin John T. Baldwin |
Director |
November 20, 2009 | ||
II-7
Table of Contents
| Name |
Title |
Date | ||
| /s/ Eric L. Press Eric L. Press |
Director |
November 20, 2009 | ||
| /s/ M. Ali Rashid M. Ali Rashid |
Director |
November 20, 2009 | ||
| /s/ Matthew R. Michelini Matthew R. Michelini |
Director |
November 20, 2009 | ||
II-8
Table of Contents
SCHEDULE I—CONDENSED FINANCIAL INFORMATION OF REGISTRANT
METALS USA HOLDINGS CORP.
BALANCE SHEETS (Unconsolidated)
(in millions, except share amounts)
| December 31, | ||||||||
| 2008 | 2007 | |||||||
| Assets |
||||||||
| Current Assets: |
||||||||
| Cash and cash equivalents |
$ | 73.7 | $ | — | ||||
| Income taxes receivable |
— | 3.8 | ||||||
| Total current assets |
73.7 | 3.8 | ||||||
| Other assets, net |
3.5 | 4.4 | ||||||
| Investment in Flag Intermediate Holdings Corporation |
175.4 | 167.5 | ||||||
| Total assets |
$ | 252.6 | $ | 175.7 | ||||
| Liabilities and Stockholders’ Deficit |
||||||||
| Current liabilities: |
||||||||
| Accounts payable |
$ | — | $ | 0.2 | ||||
| Accrued liabilities |
9.9 | 9.1 | ||||||
| Total current liabilities |
9.9 | 9.3 | ||||||
| Long-term debt |
293.7 | 291.9 | ||||||
| Payable to subsidiaries |
— | 0.1 | ||||||
| Total liabilities |
303.6 | 301.3 | ||||||
| Stockholders’ Deficit: |
||||||||
| Common stock, $.01 par value, 30,000,000 shares authorized, 14,077,500 issued and outstanding at December 31, 2008 and 2007, respectively |
0.1 | 0.1 | ||||||
| Additional paid-in capital |
6.4 | 0.7 | ||||||
| Accumulated other comprehensive income (loss) |
(3.0 | ) | 0.7 | |||||
| Retained deficit |
(54.5 | ) | (127.1 | ) | ||||
| Total stockholders’ deficit |
(51.0 | ) | (125.6 | ) | ||||
| Total liabilities and stockholders’ deficit |
$ | 252.6 | $ | 175.7 | ||||
S-1
Table of Contents
SCHEDULE I—CONDENSED FINANCIAL INFORMATION OF REGISTRANT
METALS USA HOLDINGS CORP.
STATEMENTS OF OPERATIONS (Unconsolidated)
(in millions)
| Years Ended December 31, | ||||||||||||
| 2008 | 2007 | 2006 | ||||||||||
| Interest and other income (expense), net |
$ | (0.6 | ) | $ | 0.5 | $ | 0.2 | |||||
| Interest expense |
33.4 | 29.3 | 0.5 | |||||||||
| Loss on extinguishment of debt |
— | 8.4 | — | |||||||||
| Equity in earnings (loss) of subsidiaries |
93.4 | 36.6 | 39.5 | |||||||||
| Income (loss) before income taxes |
59.4 | (0.6 | ) | 39.2 | ||||||||
| Provision (benefit) for income taxes |
(13.2 | ) | (14.5 | ) | (0.1 | ) | ||||||
| Net income |
$ | 72.6 | $ | 13.9 | $ | 39.3 | ||||||
S-2
Table of Contents
SCHEDULE I—CONDENSED FINANCIAL INFORMATION OF REGISTRANT
METALS USA HOLDINGS CORP.
STATEMENTS OF CASH FLOWS (Unconsolidated)
(in millions)
| Years Ended December 31, | ||||||||||||
| 2008 | 2007 | 2006 | ||||||||||
| Cash flows from operating activities: |
||||||||||||
| Net income |
$ | 72.6 | $ | 13.9 | $ | 39.3 | ||||||
| Adjustments to reconcile net income to net cash provided by operating activities: |
||||||||||||
| Equity in (earnings) loss of subsidiaries |
(93.4 | ) | (36.6 | ) | (39.5 | ) | ||||||
| Loss on extinguishment of debt |
— | 8.4 | — | |||||||||
| Amortization of debt issuance costs |
2.8 | 0.9 | — | |||||||||
| Dividends received from subsidiaries |
87.5 | 18.1 | 25.0 | |||||||||
| Decrease in receivables from subsidiaries |
— | — | 0.4 | |||||||||
| Decrease (increase) in income taxes receivable and other assets |
3.8 | (4.1 | ) | — | ||||||||
| Increase (decrease) in payable to subsidiaries |
— | (0.5 | ) | 0.6 | ||||||||
| Increase in accounts payable and accrued liabilities |
0.6 | 9.0 | 0.3 | |||||||||
| Net cash provided by operations |
73.9 | 9.1 | 26.1 | |||||||||
| Cash flows from investing activities: |
||||||||||||
| Investments in and net advances from (to) subsidiaries |
— | 1.7 | (0.4 | ) | ||||||||
| Net cash provided by (used in) investing activities |
— | 1.7 | (0.4 | ) | ||||||||
| Cash flows from financing activities: |
||||||||||||
| Proceeds from issuance of Senior Unsecured Notes |
— | 291.0 | 144.8 | |||||||||
| Repayments of Senior Unsecured Notes |
— | (150.0 | ) | — | ||||||||
| Issuance of common stock |
— | — | 0.2 | |||||||||
| Dividends paid |
— | (288.5 | ) | (25.0 | ) | |||||||
| Deferred financing costs |
(0.2 | ) | (4.9 | ) | (4.1 | ) | ||||||
| Net cash (used in) provided by financing activities |
(0.2 | ) | (152.4 | ) | 115.9 | |||||||
| Net increase (decrease) in cash and cash equivalents |
73.7 | (141.6 | ) | 141.6 | ||||||||
| Cash and cash equivalents, beginning of period |
— | 141.6 | — | |||||||||
| Cash and cash equivalents, end of period |
$ | 73.7 | $ | — | $ | 141.6 | ||||||
S-3
Table of Contents
SCHEDULE I—CONDENSED FINANCIAL INFORMATION OF REGISTRANT
METALS USA HOLDINGS CORP.
NOTES TO FINANCIAL STATEMENTS
(dollars in millions)
1. Investment in Flag Intermediate Holdings Corporation
On May 18, 2005, Metals USA Holdings Corp. (formerly Flag Holdings Corporation), a Delaware corporation (“Metals USA Holdings”) and its wholly owned subsidiary, Flag Acquisition Corporation, a Delaware corporation (“Flag Acquisition”), entered into an Agreement and Plan of Merger (the “Merger Agreement”) with Metals USA, Inc. On November 30, 2005, Flag Acquisition, then a wholly owned subsidiary of Flag Intermediate Holdings Corporation (“Flag Intermediate”), merged with and into Metals USA, Inc. (“Metals USA”) with Metals USA being the surviving corporation (the “Merger”). Flag Intermediate and Flag Acquisition conducted no operations during the period May 9, 2005 (date of inception) to November 30, 2005.
2. Debt
Debt consists of the following:
| December 31, | ||||||
| 2008 | 2007 | |||||
| Senior Floating Rate Toggle Notes due 2012 (2007 Notes) |
$ | 293.7 | $ | 291.9 | ||
| Total debt |
$ | 293.7 | $ | 291.9 | ||
Senior Floating Rate Toggle Notes due 2012
On July 10, 2007, Metals USA Holdings issued $300.0 initial aggregate principal amount of Senior Floating Rate Toggle Notes due 2012 (the “2007 Notes”). The 2007 Notes were issued at an initial issue price of 97% of the principal amount thereof, and the original issue discount is being amortized to interest expense over the life of the 2007 Notes. The 2007 Notes are senior unsecured obligations that are not guaranteed by any of Metals USA Holdings’ subsidiaries. As such, the 2007 Notes are structurally subordinated to all indebtedness and other liabilities (including trade payables) of Metals USA Holdings’ subsidiaries.
Metals USA Holdings must make an election regarding whether interest payments on the 2007 Notes will be made in cash or through PIK Interest prior to the start of the applicable interest period. Metals USA Holdings may elect to pay interest (1) entirely in cash or (2) entirely by increasing the principal amount of the 2007 Notes or issuing new 2007 Notes (“PIK Interest”), or (3) on 50% of the outstanding principal amount of the 2007 Notes in cash and on 50% of the outstanding principal amount of the 2007 Notes by increasing the principal amount of the outstanding 2007 Notes or by issuing new 2007 Notes (“Partial PIK Interest”). Cash interest on the 2007 Notes will accrue at a rate per annum, reset quarterly, equal to LIBOR plus a spread of 6.00%, which increases by 0.25% to 6.25% in year 2, by 0.50% to 6.50% in year 3, and by 0.75% to 6.75% in year 4. In the event PIK Interest is paid on the 2007 Notes after the first four interest periods, the then-applicable margin over LIBOR on the 2007 Notes would increase by 0.75% for each period in which PIK Interest is paid. If Metals USA Holdings elects to pay any PIK Interest, Metals USA Holdings will increase the principal amount on the 2007 Notes or issue new 2007 Notes in an amount equal to the amount of PIK Interest for the applicable interest payment period to holders of the 2007 Notes on the relevant record date. Interest is payable quarterly in arrears on January 1, April 1, July 1 and October 1. PIK Interest notes, resulting from the conversion of interest into PIK notes, when paid will be treated as an operating activity in the Consolidated Statements of Cash Flows in accordance with SFAS 95.
S-4
Table of Contents
The initial five interest payments on the 2007 Notes were paid solely in cash. Flag Intermediate provided funds to Metals USA Holdings to fund the initial five quarterly interest payments on the 2007 Notes, which were paid on October 1, 2007, January 2, 2008, April 1, 2008, July 1, 2008 and October 1, 2008 and which totaled $7.7, $8.4, $8.1, $6.5 and $6.6, respectively.
On September 26, 2008, we made a permitted election under the indenture governing the 2007 Notes to pay all interest that is due on January 1, 2009, for the interest period beginning on October 1, 2008, and ending on December 31, 2008, entirely through PIK Interest. The Company must make an election regarding whether subsequent interest payments will be made in cash, through PIK Interest, or Partial PIK Interest, prior to the start of the applicable interest period. In the absence of such an election for any interest period, interest on the 2007 Notes will be payable according to the election for the previous interest period. As a result, the PIK Interest election is now the default election for future interest periods unless we elect otherwise not later than the commencement of an interest period.
The terms of the ABL facility, as well as the indenture governing the Metals USA Notes, restrict Flag Intermediate and certain of its subsidiaries from making payments or transferring assets to Metals USA Holdings, including dividends, loans, or distributions. Such restrictions include prohibition of dividends in an event of default and limitations on the total amount of dividends paid to Metals USA Holdings. In the event these agreements do not permit Flag Intermediate to provide Metals USA Holdings with sufficient distributions to fund interest and principal payments on the 2007 Notes when due, Metals USA Holdings may default on the 2007 Notes unless other sources of funding are available. Amounts available under these restricted payment provisions amounted to $2.0 under the indenture governing the Metals USA Notes and $62.1 under the loan and security agreement governing the ABL facility as of December 31, 2008.
On or after January 15, 2008, Metals USA Holdings may redeem some or all of the 2007 Notes at certain redemption prices, plus accrued and unpaid interest and additional interest, if any, to the redemption date. If Metals USA Holdings makes certain public offerings, sales or issuances of common stock, and does not redeem the 2007 Notes, it will be required to make an offer to repurchase the maximum principal amount of the 2007 Notes that may be purchased out of the proceeds thereof, at a price equal to 100% of the principal amount, plus accrued and unpaid interest and additional interest, if any, to the date of repurchase.
If Metals USA Holdings experiences a change of control and does not redeem the 2007 Notes, it will be required to make an offer to repurchase the 2007 Notes at a price equal to 101% of the principal amount, plus accrued interest and unpaid interest and additional interest, if any, to the date of repurchase.
We will pay interest on overdue principal at 1% per annum in excess of the rates discussed above and will pay interest on overdue installments of interest at such higher rate to the extent lawful.
The indenture governing the 2007 Notes contains covenants that, among other things, limit Metals USA Holdings’ ability and the ability of certain of its subsidiaries to incur or guarantee additional indebtedness or issue disqualified or preferred stock, repurchase or redeem capital stock or subordinated indebtedness, pay dividends or make distributions to its stockholders, incur restrictions on the ability of its subsidiaries to pay dividends or to make other payments to Metals USA Holdings, transfer or sell assets, create liens, enter into transactions with affiliates, make investments or acquisitions and merge or consolidate with other companies or transfer all or substantially all of its assets.
Our affiliates, which include investment funds affiliated with, or co-investment vehicles managed indirectly by, Apollo Management L.P., including Apollo Investment Fund V, L.P., along with its parallel investment funds (“Apollo Management” and together with its affiliated investment entities “Apollo”), as well as our Chief Executive Officer and our Chief Financial Officer, have purchased a portion of our 2007 Notes in the market. For the year ended December 31, 2008, interest paid on the 2007 Notes
S-5
Table of Contents
held by affiliates amounted to $8.4. From time to time, depending upon market, pricing and other conditions, as well on cash balances and liquidity, we, our subsidiaries or affiliates may seek to purchase or sell some amount of the Metals USA Notes or additional amounts of the 2007 Notes. Any such purchases or sales may be made in the open market, privately negotiated transactions, tender offers or otherwise. The amounts of any such purchases or sales may be material.
On February 26, 2008, we exchanged $216.0 aggregate principal amount of the $300.0 aggregate principal amount privately placed 2007 Notes for substantially identical 2007 Notes registered under the Securities Act of 1933, as amended.
Costs related to the issuance of the 2007 Notes were capitalized and are being charged to interest expense over the life of the 2007 Notes. Unamortized issuance costs of $3.5 as of December 31, 2008, are included in other non-current assets.
Maturities
Scheduled maturities of long-term debt outstanding at December 31, 2008, are as follows:
| Years Ended December 31, | ||||||||||||||||||
| 2009 | 2010 | 2011 | 2012 | 2013 | Beyond | |||||||||||||
| (in millions) | ||||||||||||||||||
| Senior Floating Rate Toggle Notes Due 2012 (2007 Notes) |
$ | — | $ | — | $ | — | $ | 300.0 | $ | — | $ | — | ||||||
| Total |
$ | — | $ | — | $ | — | $ | 300.0 | $ | — | $ | — | ||||||
3. Stockholders’ Equity
Common Stock—In accordance with its Certificate of Incorporation dated May 9, 2005 and as amended on November 28, 2005, Metals USA Holdings was authorized to issue 30,000,000 shares of capital stock, all of which were shares of common stock, $.01 par value. At December 31, 2008, 14,077,500 shares were issued and outstanding.
May 2006 Dividend—On May 23, 2006, Flag Intermediate declared a $25.0 dividend (the “May 2006 Dividend”) payable to Metals USA Holdings. The dividend was paid on May 24, 2006. Concurrently, on May 23, 2006, Metals USA Holdings declared a $25.0 dividend ($1.78 per share) to its stockholders of record as of that date. The dividend was paid on May 24, 2006.
January 2007 Dividend—On January 3, 2007, Metals USA Holdings used the net proceeds from the issuance of the 2006 Notes, as well as $8.2 of additional borrowings under the ABL facility, to pay a cash dividend of approximately $144.8 ($10.28 per share) to its stockholders, which include Apollo and certain members of our management, to make a cash payment (partially in lieu of the cash dividend) of $4.2 to its vested stock option holders (the cash payment and the cash dividend are referred to collectively as the “January 2007 Dividend”), which include certain members of our management, and to pay fees and expenses related to the issuance of the 2006 Notes, including a $1.5 non-recurring transaction fee to Apollo.
July 2007 Dividend—On July 10, 2007, Metals USA Holdings used the net proceeds from the issuance of the 2007 Notes, as well as approximately $8.3 of additional borrowings under the ABL facility, to redeem the 2006 Notes (for approximately $150.0 plus accrued and unpaid interest of approximately $5.4, to pay a cash dividend of approximately $130.3 (approximately $9.25 per share) to its stockholders, which include Apollo and certain members of management, to make a cash payment (partially in lieu of the cash dividend) of approximately $9.2 to its stock option holders (the cash payment and the cash dividend are referred to collectively as the “July 2007 Dividend”), which include certain members of our management, and to pay fees and expenses related to the offering of the 2007 Notes.
S-6
Table of Contents
EXHIBITS
| Exhibit |
Description | |
| 1.1 | Form of Underwriting Agreement* | |
| 2.1 | Agreement and Plan of Merger, dated May 18, 2005 between Metals USA, Inc., Flag Acquisition Corporation and Flag Intermediate Corporation (incorporated by reference to Exhibit 2.1 to Metals USA, Inc.’s Registration Statement (File No. 333-132918-26) on Form S-4 filed on March 31, 2006) | |
| 3.1 | Form of Amended and Restated Certificate of Incorporation of Metals USA Holdings Corp.** | |
| 3.2 | Form of Amended and Restated Bylaws of Metals USA Holdings Corp.** | |
| 4.1 | Form of Common Stock Certificate of Metals USA Holdings Corp.* | |
| 5.1 | Form of Opinion of Wachtell, Lipton, Rosen & Katz** | |
| 10.1 | Employment Agreement, dated September 29, 2005, between Metals USA, Inc. and C. Lourenco Goncalves (incorporated by reference to Exhibit 10.1 to Metals USA, Inc.’s Registration Statement (File No. 333-132918-26) on Form S-4 filed on March 31, 2006) | |
| 10.2 | Employment Agreement, dated September 29, 2005, between Metals USA, Inc. and John A. Hageman (incorporated by reference to Exhibit 10.2 to Metals USA, Inc.’s Registration Statement (File No. 333-132918-26) on Form S-4 filed on March 31, 2006) | |
| 10.3 | Employment Agreement, dated September 29, 2005, between Metals USA, Inc. and Robert C. McPherson, III (incorporated by reference to Exhibit 10.3 to Metals USA, Inc.’s Registration Statement (File No. 333-132918-26) on Form S-4 filed on March 31, 2006) | |
| 10.4 | Severance Agreement, dated September 29, 2005, between Metals USA, Inc. and Roger Krohn (incorporated by reference to Exhibit 10.4 to Metals USA, Inc.’s Registration Statement (File No. 333-132918-26) on Form S-4 filed on March 31, 2006) | |
| 10.5 | Severance Agreement, dated September 29, 2005, between Metals USA, Inc. and David Martens (incorporated by reference to Exhibit 10.5 to Metals USA, Inc.’s Registration Statement (File No. 333-132918-26) on Form S-4 filed on March 31, 2006) | |
| 10.6 | Severance Agreement, dated September 29, 2005, between Metals USA, Inc. and Joe Longo (incorporated by reference to Exhibit 10.6 to Metals USA, Inc.’s Registration Statement (File No. 333-132918-26) on Form S-4 filed on March 31, 2006) | |
| 10.7 | Amended and Restated 2005 Stock Incentive Plan of Metals USA Holdings Corp. (incorporated by reference to Exhibit 10.7 to Metals USA, Inc.’s Registration Statement (File No. 333-132918-26) on Form S-4/A filed on May 26, 2006) | |
| 10.8 | Management Agreement, dated as of November 30, 2005, between Metals USA, Inc., Metals USA Holdings Corp. and Apollo Management V, L.P. (incorporated by reference to Exhibit 10.8 to Metals USA, Inc.’s Registration Statement (File No. 333-132918-26) on Form S-4 filed on March 31, 2006) | |
| 10.9 | Director Compensation Plan of Metals USA Holdings Corp. (incorporated by reference to Exhibit 10.9 to Metals USA, Inc.’s Registration Statement (File No. 333-132918-26) on Form S-4 filed on March 31, 2006) | |
| 10.10 | Management Deferred Compensation Plan (incorporated by reference to Exhibit 10.11 to Metals USA, Inc.’s report on Form 10-K filed on March 12, 2007) | |
| 10.11 | Form of Amended and Restated Investors Rights Agreement* | |
Table of Contents
| Exhibit |
Description | |
| 10.12 | Loan and Security Agreement, dated as of November 30, 2005, among Credit Suisse, as the Administrative Agent, Bank of America, N.A., as the Collateral Agent, Flag Intermediate Holdings Corporation, Metals USA, Inc. (formerly Flag Acquisition Corporation) and certain Subsidiaries of Metals USA, Inc. party thereto (incorporated by reference to Exhibit 4.5 to Metals USA, Inc.’s Registration Statement (File No. 333-132918-26) on Form S-4 filed on March 31, 2006) | |
| 10.13 | Indenture, dated November 30, 2005, by and among Metals USA, Inc. (formerly Flag Acquisition Corporation), Flag Intermediate Holdings Corporation, the Subsidiary Guarantors and Wells Fargo Bank, N.A., as Trustee, and the Notes Collateral Agent (incorporated by reference to Exhibit 4.6 to Metals USA, Inc.’s Registration Statement (File No. 333-132918-26) on Form S-4 filed on March 31, 2006) | |
| 10.14 | Supplemental Indenture, dated as of November 30, 2005, among Metals USA, Inc., Flag Intermediate Holdings Corporation, the Subsidiary Guarantors and Wells Fargo Bank, N.A., as Trustee and Notes Collateral Agent (incorporated by reference to Exhibit 4.9 to Metals USA, Inc.’s Registration Statement (File No. 333-132918-26) on Form S-4 filed on March 31, 2006) | |
| 10.15 | Second Supplemental Indenture, dated as of March 31, 2005, among MUSA Newark, LLC, Metals USA, Inc., Flag Intermediate Holdings Corporation, and Wells Fargo Bank, N.A. (incorporated by reference to Exhibit 4.10 to Metals USA, Inc.’s Registration Statement (File No. 333-132918-26) on Form S-4 filed on March 31, 2006) | |
| 10.16 | Third Supplemental Indenture, dated as of June 20, 2006, among Metals USA International Holdings, Inc., Flag Intermediate Holdings Corporation, and Wells Fargo Bank, N.A., as Trustee and Notes Collateral Agent (incorporated by reference to Exhibit 4.11 of Amendment No. 3 to Metals USA, Inc.’s Registration Statement (File No. 333-132918) on Form S-4 filed on August 2, 2006) | |
| 10.17 | Amendment No. 1, dated as of July 18, 2006, to the Loan and Security Agreement dated as of November 30, 2005, among each of the Lenders party thereto, Credit Suisse, as the Administrative Agent, Bank of America, N.A., as the Collateral Agent, Flag Intermediate Holdings Corporation, Metals USA, Inc. (formerly Flag Acquisition Corporation) and certain Subsidiaries of Metals USA, Inc. party thereto (incorporated by reference to Exhibit 4.12 of Amendment No. 3 to Metals USA, Inc.’s Registration Statement (File No. 333-132918) on Form S-4 filed on August 2, 2006) | |
| 10.18 | Amendment No. 2, dated as of June 8, 2007, to the Loan and Security Agreement dated as of November 30, 2005, as amended by Amendment No. 1, dated as of July 18, 2006, among Flag Intermediate Holdings Corporation, Metals USA, Inc., and certain Subsidiaries of Metals USA, Inc. party thereto, Credit Suisse, as administrative agent, and Bank of America, N.A. (incorporated herein by reference to Exhibit 4.1 to Flag Intermediate Holdings Corporation’s Quarterly Report on Form 10-Q for the quarterly period ended June 30, 2007 (File No. 333-132918) filed on August 6, 2007) | |
| 10.19 | Transaction Fee Agreement, dated as of November 30, 2005, between Metals USA, Inc. and Apollo Management V, L.P. (incorporated herein by reference to Exhibit 10.10 to Amendment No. 1 to Flag Intermediate Holdings Corporation’s Registration Statement on Form S-4 (File No. 333-132918) filed on May 26, 2006) | |
| 10.20 | Indenture, dated July 10, 2007, between Metals USA Holdings Corp. and Wells Fargo Bank, N.A., as trustee (incorporated by reference to Exhibit 4.1 to Metals USA Holdings Corp.’s Registration Statement (File No. 333-146181) on Form S-4 filed on September 19, 2007) | |
Table of Contents
| Exhibit |
Description | |
| 10.21 | Registration Rights Agreement, dated as of July 10, 2007, by and among Metals USA Holdings Corp. and UBS Securities LLC (incorporated by reference to Exhibit 4.1 to Metals USA Holdings Corp.’s Registration Statement (File No. 333-146181) on Form S-4 filed on September 19, 2007) | |
| 10.22 | Form of Senior Floating Rate Toggle Note Due 2012 (included in Exhibit 10.20) | |
| 21.1 | List of Subsidiaries of Metals USA Holdings Corp. (incorporated by reference to Exhibit 21.1 of Metals USA Holding Corp.’s Annual Report for the fiscal year ended December 31, 2008 on Form 10-K filed on February 24, 2009) | |
| 23.1 | Consent of Wachtell, Lipton, Rosen & Katz (included in Exhibit 5.1) | |
| 23.2 | Consent of Deloitte & Touche LLP | |
| 24.1 | Power of Attorney (included in signature page) | |
| * | To be filed by amendment. |
| ** | Previously filed. |