Attached files
Table of Contents
UNITED STATES
SECURITIES AND EXCHANGE COMMISSION
Washington, D.C. 20549
FORM 10-K
| x | ANNUAL REPORT PURSUANT TO SECTION 13 OR 15(d) OF THE SECURITIES EXCHANGE ACT OF 1934 |
For the fiscal year ended September 30, 2009,
or
| ¨ | TRANSITION REPORT PURSUANT TO SECTION 13 OR 15(d) OF THE SECURITIES EXCHANGE ACT OF 1934 |
For the transition period from to
Commission file number 1-32459
HEADWATERS INCORPORATED
(Exact name of registrant as specified in its charter)
| Delaware | 87-0547337 | |
| (State or other jurisdiction of incorporation or organization) | (I.R.S. Employer Identification No.) | |
| 10653 South River Front Parkway, Suite 300 South Jordan, Utah |
84095 | |
| (Address of principal executive offices) | (Zip Code) | |
(801) 984-9400
(Registrant’s telephone number, including area code)
Securities registered pursuant to Section 12(b) of the Act:
None
Securities registered pursuant to Section 12(g) of the Act:
Common Stock, $.001 par value
Indicate by check mark if the registrant is a well-known seasoned issuer, as defined in Rule 405 of the Securities Act. Yes ¨ No x
Indicate by check mark if the registrant is not required to file reports pursuant to Section 13 or Section 15(d) of the Act. Yes ¨ No x
Indicate by check mark whether the registrant (1) has filed all reports required to be filed by Section 13 or 15(d) of the Securities Exchange Act of 1934 during the preceding 12 months (or for such shorter period that the registrant was required to file such reports), and (2) has been subject to such filing requirements for the past 90 days. Yes x No ¨
Indicate by check mark whether the registrant has submitted electronically and posted on its corporate Web site, if any, every Interactive Data File required to be submitted and posted pursuant to Rule 405 of Regulation S-T during the preceding 12 months (or for such shorter period that the registrant was required to submit and post such files). Yes ¨ No ¨
Indicate by check mark if disclosure of delinquent filers pursuant to Item 405 of Regulation S-K is not contained herein, and will not be contained, to the best of registrant’s knowledge, in definitive proxy or information statements incorporated by reference in Part III of this Form 10-K or any amendment to this Form 10-K. ¨
Indicate by check mark whether the registrant is a large accelerated filer, an accelerated filer, a non-accelerated filer, or a smaller reporting company.
Large accelerated filer x Accelerated filer ¨ Non-accelerated filer ¨ Smaller reporting company ¨
Indicate by check mark whether the registrant is a shell company (as defined in Rule 12b-2 of the Act). Yes ¨ No x
The aggregate market value of the voting stock held by non-affiliates of the registrant as of March 31, 2009 was $126,613,856, based upon the closing price on the New York Stock Exchange reported for such date. This calculation does not reflect a determination that persons whose shares are excluded from the computation are affiliates for any other purpose.
The number of shares outstanding of the registrant’s common stock as of October 31, 2009 was 60,245,207.
DOCUMENTS INCORPORATED BY REFERENCE
Portions of the registrant’s definitive proxy statement to be issued in connection with registrant’s annual meeting of stockholders to be held in 2010 are incorporated by reference into Part III of this Report on Form 10-K.
Table of Contents
| Page | ||||
| PART I |
||||
| ITEM 1. |
3 | |||
| ITEM 1A. |
17 | |||
| ITEM 1B. |
36 | |||
| ITEM 2. |
36 | |||
| ITEM 3. |
36 | |||
| ITEM 4. |
36 | |||
| PART II |
||||
| ITEM 5. |
37 | |||
| ITEM 6. |
39 | |||
| ITEM 7. |
MANAGEMENT’S DISCUSSION AND ANALYSIS OF FINANCIAL CONDITION AND RESULTS OF OPERATIONS |
40 | ||
| ITEM 7A. |
60 | |||
| ITEM 8. |
61 | |||
| ITEM 9. |
CHANGES IN AND DISAGREEMENTS WITH ACCOUNTANTS ON ACCOUNTING AND FINANCIAL DISCLOSURE |
61 | ||
| ITEM 9A. |
61 | |||
| ITEM 9B. |
63 | |||
| PART III |
||||
| ITEM 10. |
64 | |||
| ITEM 11. |
64 | |||
| ITEM 12. |
SECURITY OWNERSHIP OF CERTAIN BENEFICIAL OWNERS AND MANAGEMENT AND RELATED STOCKHOLDER MATTERS |
64 | ||
| ITEM 13. |
CERTAIN RELATIONSHIPS AND RELATED TRANSACTIONS, AND DIRECTOR INDEPENDENCE |
64 | ||
| ITEM 14. |
64 | |||
| PART IV |
||||
| ITEM 15. |
65 | |||
| 69 | ||||
Forward-looking Statements
This Annual Report on Form 10-K contains forward-looking statements within the meaning of the Private Securities Litigation Reform Act of 1995 regarding future events and our future results that are based on current expectations, estimates, forecasts, and projections about the industries in which we operate and the beliefs and assumptions of our management. Actual results may vary materially from such expectations. In some cases, words such as “may,” “should,” “intends,” “plans,” “expects,” “anticipates,” “targets,” “goals,” “projects,” “believes,” “seeks,” “estimates,” or variations of such words and similar expressions, or the negative of such terms, may help to help identify such forward-looking statements. In addition, any statements that refer to projections of our future financial performance, our anticipated growth and trends in our businesses, and other characterizations of future events or circumstances, are forward-looking. For a discussion of the factors that could cause actual results to differ from expectations, please see the risk factors described in Item 1A hereof. There can be no assurance that our results of operations will not be adversely affected by such factors. Unless legally required, we undertake no obligation to revise or update any forward-looking statements for any reason. Readers are cautioned not to place undue reliance on these forward-looking statements, which speak only as of the date of this report.
Our internet address is www.headwaters.com. There we make available, free of charge, our annual report on Form 10-K, quarterly reports on Form 10-Q, current reports on Form 8-K and any amendments to those reports, as soon as reasonably practicable after we electronically file such material with, or furnish it to, the Securities and Exchange Commission (SEC). Our reports can be accessed through the investor relations section of our web site. The information found on our web site is not part of this or any report we file with or furnish to the SEC.
2
Table of Contents
PART I
| ITEM 1. | BUSINESS |
General Development of Business
Headwaters Incorporated (“Headwaters”) provides products, technologies and services in the building products, construction materials and energy industries. We generate revenue by selling building products such as manufactured architectural stone, siding accessory products and concrete blocks; managing and marketing coal combustion products (“CCPs”), which are used as a replacement for cement in concrete; and reclaiming waste coal. We intend to continue expanding our business through growth of existing operations and commercialization of new technologies and products.
We conduct our business primarily through the following three reporting segments: light building products (“Headwaters Building Products”, or “HBP”); heavy construction materials (“Headwaters Resources”, or “HRI”); and energy technology (“Headwaters Energy Services”, or “HES”).
Headwaters Building Products. HBP competes in the light building products industry and is currently our largest reporting segment based on revenue. HBP has leading positions in several light building products categories and is comprised of the following key businesses: Tapco, Eldorado Stone and Southwest Concrete Products (“SCP”).
Tapco is a leading designer, manufacturer and marketer of siding accessories as well as professional tools used in residential home improvement and construction. Tapco’s siding accessories include decorative window shutters, gable vents, and mounting blocks for exterior fixtures, roof ventilation, window and door trim products. Tapco also markets functional shutters and storm protection systems, specialty siding products, specialty roofing products and window wells. In addition, Tapco recently introduced an innovative cellular foam polyvinyl chloride, or PVC, trim board product. Tapco’s sales are primarily driven by the residential repair and remodeling construction market and, to a lesser extent, by the new residential construction market.
Eldorado Stone is a leading producer of manufactured architectural stone. Our Eldorado Stone product line is designed and manufactured to be one of the most realistic manufactured architectural stone products in the world. We utilize two additional brands to segment the manufactured architectural stone market and sell at lower price points than the Eldorado Stone product line, allowing us to compete across a broad spectrum of customer profiles. Eldorado Stone’s sales are primarily driven by new residential construction demand and, to a lesser extent, by the residential repair and remodeling, as well as commercial construction markets.
SCP is the largest manufacturer of concrete block in the Texas market, which we believe to be one of the largest concrete block markets in the United States. We offer a variety of concrete based masonry unit products and employ a regional branding and distribution strategy. A large portion of SCP’s sales are generated from the institutional construction markets in Texas, including school construction, allowing SCP to benefit from positive demographic trends.
We have a large customer base for our building products, represented by approximately 4,000 non-retail ship-to locations and approximately 4,600 retail ship-to locations across the country. Sales are broadly diversified by serving a large variety of customers in various distribution channels. We believe we attract a large base of customers because we continually upgrade our product offerings through product extensions and new products and brands.
Headwaters Resources. HRI competes in the heavy construction materials industry. HRI is the national leader in the management and marketing of CCPs, procuring CCPs from coal-fueled electric generating utilities and supplying them to our customers in a variety of concrete infrastructure and building projects. CCPs, such as fly ash and bottom ash, are the non-carbon components of coal that remain after coal is burned. CCPs have traditionally been an environmental and economic burden for power generators but can be a source of value when properly managed.
3
Table of Contents
Fly ash is principally used as a substitute for a portion of the portland cement used in concrete. Concrete made with fly ash has better performance characteristics than concrete made only from portland cement, including improved durability, decreased permeability and enhanced corrosion-resistance. Further, concrete made with CCPs is easier to work with than concrete made only with portland cement, due in part to its better pumping and forming properties. Because fly ash is generally less expensive per ton than portland cement, the manufacturing cost of concrete made with fly ash can be lower than the manufacturing cost of concrete made with portland cement.
In order to ensure a steady and reliable supply of CCPs, we enter into long-term and exclusive management contracts with coal-fueled electric generating utilities, maintain 22 stand-alone CCP distribution terminals across North America and support approximately 100 plant-site supply facilities. We own or lease approximately 1,300 rail cars and more than 200 trucks, in addition to contracting with other carriers in order to meet transportation needs for the marketing and disposal of CCPs. Our extensive distribution network allows us to transport CCPs across the nation, including into states that represent important construction markets but that have a low production of CCPs.
HRI has grown with the expanded commercial use of CCPs and continues to support market recognition of the performance, economic and environmental benefits of CCPs. According to American Coal Ash Association 2008 estimates, fly ash replaced approximately 15.5% of the portland cement that otherwise would have been used in concrete manufactured in the United States.
Headwaters Energy Services. HES is a leader in coal cleaning and coal upgrading. HES primarily owns and operates coal cleaning facilities that separate ash from waste coal to provide a refined coal product that is higher in Btu value and lower in impurities than the feedstock coal. The cleaned coal is sold primarily to electric power plants and other industrial users. This clean coal technology allows mining companies to reclaim waste coal sites and return them to a state of beneficial use. By December 2008, we had completed construction and operation of eleven coal cleaning facilities. In response to current market conditions, we are currently operating seven of these facilities. These facilities produce coal that results in reduced sulfur oxides, nitrogen oxides and mercury emissions during the combustion process, greatly increasing cleanliness and usability. The cleaned coal product is comparable in energy content and ash to run-of-mine coal products. We believe that our sales of cleaned coal products generate refined coal tax credits under IRS Code Section 45 when coal is sold into the steam market. In addition to coal cleaning, we are also involved in heavy oil upgrading processes, liquefaction of coal into liquid fuels as well as production of hydrogen peroxide and ethanol.
Headwaters was incorporated in Delaware in 1995. Our stock trades under the New York Stock Exchange symbol “HW.”
As used herein, “Headwaters,” “combined company,” “we,” “our” and “us” refer to Headwaters Incorporated and its consolidated subsidiaries, including Headwaters Energy Services Corp. and its subsidiaries; Headwaters Resources, Inc. and its subsidiaries; Headwaters Construction Materials, Inc. and its subsidiaries (including Eldorado Stone LLC, Tapco International Corporation and SCP and their subsidiaries and affiliates); Headwaters Heavy Oil, LLC; and Headwaters Technology Innovation, LLC (“HTI”); unless the context otherwise requires. As used in this report, “HES” refers to Headwaters Energy Services Corp., together with its consolidated subsidiaries and affiliates; “HRI” refers to Headwaters Resources, Inc. and its consolidated subsidiaries; Headwaters Building Products or “HBP” refers to Headwaters Construction Materials, Inc., together with its consolidated subsidiaries and affiliates (including “Eldorado”, which refers to Eldorado Stone LLC and its subsidiaries and affiliates; and “Tapco,” which refers to Tapco International Corporation and its subsidiaries); and “HTI” refers to Headwaters Technology Innovation Group, Inc. unless the context otherwise requires.
Light Building Products (“HBP”)
HBP produces light building products that minimize waste, conserve natural resources, and/or use less energy in manufacturing or application. We operate leading businesses in siding accessories, manufactured architectural stone and concrete blocks. We manufacture and distribute nationally siding accessories (such as
4
Table of Contents
window shutters, gable vents, mounting blocks, simulated wood shake siding, and composite roofing), and professional tools used in exterior residential remodeling and construction. Our manufactured architectural stone and building accessories products have a national presence in commercial, residential and remodeling markets. HBP is also a leading supplier of concrete blocks and specialty blocks in Texas. We believe our traditional building products and new product offerings position HBP for significant growth after the end of the current downturn in residential construction.
Principal Products and their Markets
Siding and Exterior Siding Accessories. We are a leading designer, manufacturer and marketer of resin-based siding accessories and professional tools used in exterior residential home improvement and construction under the Tapco brands. These products, which are either injection-molded or extruded, enhance the appearance of homes and include decorative window shutters, gable vents, and mounting blocks for exterior fixtures, roof ventilation, window and door trim products, specialty siding products, synthetic roofing tiles, and window well systems. Professional tools include portable cutting and shaping tools used by contractors, on-site, to fabricate customized aluminum shapes that complement the installation of exterior siding.
Brands include “Tapco Integrated Tool Systems,” “Mid-America Siding Components,” “Builders Edge,” “Atlantic Premium Shutters,” “Vantage,” “The Foundry,” “InSpire,” and “WellCraft.” We market our injection-molded building product accessories to retailers and mass merchandisers through our Builders Edge and Vantage brands and to the manufactured housing market through the MHP brand. In addition, we market tools through the Tapco brand, functional shutters and storm protection systems through the Atlantic Premium Shutters brand, specialty siding product through the Foundry brand, specialty roofing products through the InSpire brand, and window wells under the WellCraft brand. Recently we introduced IQM, an innovative cellular foam trimboard product, into our distribution system.
These building products serve the needs of the siding, roofing, and window and door installation industries. Our injection-molded products are designed to enhance the exterior appearance of the home while delivering durability at a lower cost compared to similar aluminum, wood and plastic products while the functional shutters enhance the exterior appearance of the home and can be manufactured to meet certain hurricane codes.
Manufactured Architectural Stone. Under the Eldorado Stone, StoneCraft and Dutch Quality Stone brands, we offer a wide variety of high-quality manufactured architectural stone products to meet a variety of design needs. Our manufactured architectural stone siding incorporates several key features, including high aesthetic quality, ease of installation, durability, low maintenance, attractive cost relative to other siding materials and widespread availability in the marketplace. The Eldorado Stone product line is designed and manufactured to be one of the most realistic manufactured architectural stone products in the world. Our manufactured architectural stone siding is a lightweight, adhered siding product used by national, regional and local architectural firms, real estate developers, contractors, builders and homeowners. Our stone products are used in construction projects ranging from large-scale residential housing developments and commercial projects to do-it-yourself home improvement jobs. In addition, the Eldorado Stone product line is used in a variety of external and internal home applications such as walls, archways, fireplaces and landscaping. We continually introduce new products in order to improve our offering, such as our new volcanic stone for the Hawaii market. We believe that our focus on product quality, breadth and innovation, combined with a geographically diversified manufacturing platform, provides us with significant marketing advantages over traditional materials such as natural stone, brick or stucco.
Concrete Block. Through SCP, we are one of the largest manufacturers and sellers of concrete block in the Texas market, one of America’s fastest growing states. We offer a variety of concrete-based masonry products and employ a regional branding and distribution strategy. A large portion of SCP’s sales are generated from institutional construction markets in Texas, including school construction, allowing SCP to benefit from positive demographic trends. Fly ash is used in the manufacturing process for concrete block, brick and foundation blocks.
5
Table of Contents
Manufacturing
We conduct manufacturing, distribution and sales operations for resin-based siding accessories and ancillary products through five facilities. Manufacturing assets include more than 100 injection molding presses, almost all of which are automated through robotics or conveyor systems which have reduced cycle times and have helped to reduce waste. Any nonconforming output is reused as raw material, further minimizing waste.
Our manufactured architectural stone brands are currently manufactured through a network of five plants strategically situated in proximity to customers. We also have a production contract with a facility near Tijuana, Mexico. These siding accessory and architectural stone manufacturing locations allow for a high level of customer service, shorter lead times and lower freight costs.
We operate six of the most modern concrete block and brick manufacturing facilities in the industry. Our block and brick operations are located to provide coverage of all the key metropolitan areas in Texas.
Distribution
Resin-based siding accessories and our ancillary products are distributed throughout the United States and Canada through four primary distribution channels: one-step distributors that sell directly to contractors, two-step distributors that sell our products to lumberyards and one-step distributors, retail home centers/mass merchandisers, and manufactured housing.
Manufactured architectural stone is distributed throughout the United States and Canada primarily on a wholesale basis through a network of distributors, including masonry and stone suppliers, roofing and siding materials distributors, fireplace suppliers and other contractor specialty stores. Distribution for Eldorado Stone branded products is conducted at its manufacturing facilities and at three distribution centers.
We seek to be a leader in each meaningful distribution channel for our products by providing the broadest selection coupled with high levels of customer service. HBP has and plans to continue to introduce new products which can be incorporated into our national distribution system supply chain. New products and brands represented over $67 million or 20% of our total building products sales in 2009, and we expect the ongoing introduction of new products and brands to allow for entry into and increased presence in new markets.
Sales and Marketing
Our resin-based siding products’ sales and marketing organization supports the one-step, two-step distribution, and retail channels through various networks of sales support that include over 100 independent sales representatives and a group of business development managers, regional sales managers and sales executives.
We have a small direct sales force for manufactured architectural stone products. This sales force works closely with architects and contractors to provide information concerning the attributes and ease of installation of our manufactured product and to promote market acceptance over traditional building materials.
We maintain relationships with local contractors, professional builders, and other end-users by participating in over 2,000 local shows and seven national shows annually. Local shows, sponsored by local distributors, enable us to promote our products through hands-on comparisons to competing products. These shows enable us to receive useful feedback from local contractors, which leads to new product ideas as well as significant goodwill within the trade.
Major Customers
We have a large customer base for our light building products. Because primarily all of the one- and two-step distributors have multiple locations and each individual location generally has autonomy to stock
6
Table of Contents
various products from different suppliers, the number of ship-to locations is a better measure of the breadth of sales than is the total number of customers. In the residential home improvement and building products market, we have approximately 4,000 non-retail ship-to locations and approximately 4,600 retail ship-to locations for our products. Sales are broadly diversified across customers and ship-to locations, mitigating the impact of regional economic circumstances, which helps us maintain industry share in a shrinking market. For fiscal 2009, three large customers totaling more than 3,000 locations together represented approximately 26% of total sales of the Tapco division. None of our other building products divisions had a customer representing over 10% of product sales.
Sources of Available Raw Materials
The raw materials purchased for resin-based siding products include polypropylene and styrene pellets as well as PVC. Polypropylene and styrene are purchased primarily from two different single source suppliers. From time to time, prices for some of the raw materials used in production/assembly processes fluctuate significantly. Although we do not have any contracts with suppliers and we purchase supplies on a purchase order basis, we occasionally make volume purchases of materials at fixed prices.
We purchase cement, sand and aggregates as primary raw materials for our concrete-based products. We do not have long-term contracts for the supply of these materials. Worldwide demand for these materials and our costs to purchase raw materials rose in recent years. However, we have not suffered from any long-term shortages and believe that supplies will be adequate in the future.
Competition
There are positive and negative factors pertaining to HBP’s competitive position. We have a leading market position in our siding accessories business because of our strong ability to manufacture and distribute a broad range of products economically and rapidly. However, our resin-based siding accessory business’ strong market position suggests that its future growth will come largely from finding new products to put into our manufacturing and distribution channels, not from increasing market share in the siding accessories industry. We have developed a recognized name in the manufactured architectural stone industry and a strong market share. Our products have excellent authenticity and broad selection alternatives. Our architectural stone business has a limited, albeit growing, distribution network, strong competition from regional producers that do not have long shipping routes and financial limitations that may not be shared by the largest national competitor. Our block business is not national in breadth, although it enjoys a strong regional market position in Texas.
Our primary competition for resin-based siding products includes Ply Gem and Pinckney in the siding accessories market, and CertainTeed in the specialty siding market. Notwithstanding our national position as a leading producer of manufactured architectural stone, we face significant competition from other national and regional producers of similar products, and in particular from Owens Corning. With respect to concrete masonry units, national and regional competition includes Featherlite, IPC Building Products, Revels Block & Brick and Jewell Concrete Products, some of which are larger manufacturers of concrete masonry units than is SCP. Many of our competitors have greater financial, management and other resources and may be able to take advantage of acquisitions and other opportunities more readily.
Heavy Construction Materials—Coal Combustion Products (HRI)
HRI is the nation’s largest manager and marketer of CCPs, which includes fly ash as a construction material replacement for portland cement. In order to ensure a steady and reliable supply of CCPs, we have formed numerous long-term exclusive management contracts with coal-fueled electric generating utilities throughout the United States and maintain 22 stand-alone CCP distribution terminals across North America, as well as approximately 100 plant-site supply facilities. With our extensive distribution network, we can transport CCPs significant distances to states that have limited coal-fueled electric utilities producing CCPs yet have historically been high CCP volume markets.
7
Table of Contents
Principal Products and their Markets
CCPs are varying types of inorganic remnants left over from burned coal. CCPs have been an environmental and economic burden for power generators; however, when properly managed CCPs can be valuable products. Of the different CCPs, we sell fly ash (captured from the flue gas) as a replacement for portland cement in a wide variety of concrete uses, including infrastructure, commercial, and residential construction. We believe we are currently the largest manager and marketer of CCPs in the United States as well as conducting business in Canada. We have a number of long-term, exclusive management contracts with coal-fueled, electric generating utilities throughout the United States and provide CCP management services at more than 100 locations.
Utilities produce CCPs year-round, especially in the winter when demand for electricity increases. In comparison, sales of CCPs and building products produced using CCPs are seasonal, with construction market demands following a relatively more predictable trend. CCPs must be stored in terminals, during the off-peak sales periods as well as transported to where they are needed for use. Due to transportation costs, the CCP market is generally regional, with product transportation to states like California and Florida that have scarce supply of coal-fueled electric utilities producing high quality CCPs. As the largest manager and marketer of CCPs in the United States, we benefit from contractual control of supply and our extensive distribution system. We maintain 22 stand-alone CCP distribution terminals across North America, as well as approximately 100 plant-site supply facilities. We own or lease approximately 1,300 rail cars and more than 200 trucks and contract with other carriers to meet our transportation needs for the marketing and disposal of CCPs. In addition, we have more than 40 area managers and technical sales representatives nationwide to manage CCP customer relations.
The benefits of CCP use in construction applications include improved product performance, cost savings and positive environmental impact. Fly ash improves both the chemical and physical performance of concrete, decreasing permeability and enhancing durability while providing environmental benefits. Fly ash utilization conserves landfill space as well as conserves energy and reduces green house gas emissions. According to the U.S. Environmental Protection Agency (“EPA”), one ton of fly ash used as a replacement for portland cement eliminates approximately one ton of carbon dioxide emissions associated with cement production. The value of utilizing fly ash in concrete has been recognized by numerous federal agencies, including the U.S. Department of Energy (“DOE”) and the EPA, which issued comprehensive procurement guidelines encouraging federal agencies to utilize fly ash. The EPA also created the Coal Combustion Products Partnership (“C2P2”) to promote national CCP utilization. Today almost all states specify or recommend the use of fly ash in state and federal transportation projects.
Higher-quality fly ash and other high-caliber CCPs possess the greatest value because of their diverse, higher-margin commercial uses. The quality of fly ash produced by the combustion process at coal-fueled facilities varies widely and is affected by the type of coal feedstock used and the boilers maintained by the utilities. We assist our utility clients in their efforts to improve the production of high-value CCPs at their facilities. Our quality control system ensures customers receive their specified quality of CCPs while our transportation equipment and terminal facilities provide stable and reliable supply.
Sales and Marketing
Expansion of Market Awareness of CCPs’ Benefits. Customer demands for quality and reliability drive our CCP marketing and sales program. Our marketing efforts emphasize the performance value and environmental benefits of CCP usage. We participate in a variety of marketing activities to increase fly ash sales, including professional outreach, technical publications, relationships with industry organizations, and involvement in legislative initiatives leading to greater use of CCPs. In addition, we developed several specialty products for road bases, structural fills, and industrial fillers that increase market penetration of CCPs and brand recognition for Headwaters’ products.
New Technologies for CCP Utilization. Our research and development activities focus on expanding the use of CCPs by developing new products utilizing high volumes of CCPs in order to increase usage and decrease
8
Table of Contents
landfill disposal. For example, although generally unsuitable for use in traditional concrete applications, we developed two products that utilize the type of fly ash generated at fluidized bed combustion (“FBC”) power plants. Stabil-Mix, a mixture of fly ash and lime used for roadbed stabilization, may be custom blended for optimum results in varying soil conditions. Pozzalime takes advantage of the lower SO3 and free lime content of some sources of FBC ash to create a product ideally suited for use as a cement replacement in the manufacture of concrete masonry units.
Technologies to Improve Fly Ash Quality. We have also developed technologies that maintain and improve the quality of CCPs, further enhancing their marketability. Today, many utilities are switching fuel sources, changing boiler operations and introducing activated carbon and ammonia into the exhaust gas stream in an effort to decrease costs and to meet increasingly stringent emissions control regulations. While these factors may negatively affect fly ash quality, we are attempting to address these challenges with the development and commercialization of two technologies—carbon fixation, which pre-treats unburned carbon particles in fly ash to minimize the particles’ adverse effects; and ammonia slip mitigation, which counteracts the impact of ammonia contaminants in fly ash.
Sources of Available Raw Materials
Coal is the largest indigenous fossil fuel resource in the United States. The DOE estimates 2007 annual coal production was in excess of 1.15 billion tons, while about 93% of all coal consumed in the United States was for the use of electrical power generation. A primary resource for baseline electricity production in the United States, coal is used to produce approximately half of the electricity generated in the United States. The combustion of coal results in a high percentage of residual materials which serve as the “raw material” for the CCP industry. According to the American Coal Ash Association, in 2007 about 56 million tons of the approximately 131 million tons of U.S. CCPs generated were efficiently utilized. With less than 50% utilized, there is a clear opportunity for further increases in CCP usage. As long as electricity is created using coal-fueled generation, we believe there will be significant supplies of CCP raw materials. However, as Clean Air Act, Resource Conservation and Recovery Act (“RCRA”) and other environmental rules are implemented, the efforts of coal-fueled electric power producers to comply with tighter regulatory requirements may have a serious adverse effect on the supply and use of fly ash as a substitute for portland cement (see “Business—Regulation” and “Risk Factors”).
Competition
The business of marketing traditional CCPs is highly competitive. Our competitive position has positive factors of a leading market position and long-term contracts. In addition, we have built a nationwide CCP distribution system not enjoyed by our competition. However, our CCP business is sometimes adversely affected by inclement weather slowing construction using concrete, the largest market for CCPs. We also face increasingly aggressive competition in marketing and sales of CCPs.
HRI has substantial competition in two main areas: obtaining CCP management contracts with utility and other industrial companies and marketing CCPs and related industrial materials. HRI has a presence in every region in the United States but, because the market for the management of CCPs is highly fragmented and because the costs of transportation are high relative to sales prices, most of the competition in the CCP management industry is regional. There are many local, regional and national companies that compete for market share in these areas with similar products and with numerous other substitute products. Although HRI has a number of long-term CCP management contracts with our clients, some of these contracts allow for the termination of the contract at the convenience of the utility company upon a minimum 90-day notice. Moreover, certain of HRI’s most significant regional CCP competitors appear to be seeking a broader national presence. These competitors include Lafarge North America Inc., Boral Material Technologies Inc. and Cemex. Building products are produced and sold regionally by the numerous owners and operators of concrete ready-mix plants.
9
Table of Contents
Producers with sand and gravel sources near growing metropolitan areas have important transportation advantages. Many of our competitors have greater financial, management and other resources and may be able to take advantage of potential acquisitions and other opportunities more readily.
Energy Technology (“HES”)
In our energy technology segment, HES is focused on reducing waste and increasing the value of energy feedstocks, primarily in the areas of low-value coal, oil and liquid fuels such as ethanol. HES uses coal cleaning processes that upgrade low value or waste coal by separating ash from the carbon. The resultant coal product is lower in ash, including sulfur, mercury and other impurities, and higher in Btu value. Additionally, HES owns 51% of and operates a 50 million gallon per year corn-to-ethanol facility near Underwood, North Dakota and owns 50% of a 75,000 ton per year hydrogen peroxide facility in South Korea. We also develop and commercialize technologies to convert or upgrade fossil fuels into higher-value products, including direct coal liquefaction, the conversion of gas-to-liquid fuels, and heavy oil upgrading.
Principal Products and their Markets
Coal Cleaning. HES primarily participates in the ownership and operation of coal cleaning facilities. We own eleven coal cleaning facilities of which seven are currently in operation. These facilities provide HES with an opportunity to reduce SO2, NOx and mercury emissions from coal, significantly increasing low value and waste coal’s cleanliness and usability. The cleaned coal product is comparable in energy content and ash to run-of-mine coal products. We believe that our sales of cleaned coal products generate refined coal tax credits under Section 45 of the Internal Revenue Code in circumstances where the requirements of Section 45 can be met.
Sales and Marketing
Cleaned coal is sold primarily to electric power plants; however, it can also be sold to other industrial users of coal and as a metallurgical grade coal to coke producers. A number of our facilities are located adjacent to active coal mine operations. In these cases, we rely upon the host coal company to assist us with the marketing and sales of our finished product in order to take advantage of their marketing experience, existing contracts and knowledge of coal sales opportunities. In addition, HES has its own small group of regionally based coal marketing employees.
Sources of Available Raw Materials
The source of feedstock has been an important consideration in developing our coal cleaning facilities. Facilities are generally located near waste coal impoundments or active coal mines. We have contracts that provide us access to an estimated 175 million tons of waste and low value coal feedstock material in various regions around the country. We are actively pursuing additional waste coal sites where carbon product can be recovered and altered beneficially using HES’s processes.
New Business Opportunities
As part of our energy strategy, we are developing the following businesses and technologies:
Heavy Oil Upgrading Technology. HTI purchased the patents and know-how related to the HCAT Technology in 2008 from the Alberta Research Council. Prior to purchase, HTI held an exclusive, worldwide license to develop, market and sublicense the technology. HCAT is a unique heavy oil upgrading technology for the addition of hydrogen to heavy residual oils such as petroleum vacuum residue (so-called “bottom of the barrel”) and tar sand bitumen into lighter, more valuable petroleum materials. The proprietary HCAT process uses a highly active, molecular-scale catalyst to efficiently convert heavy oils, including the asphaltenic components, which are generally considered the most difficult to process. In early 2006, we announced the
10
Table of Contents
completion of the first commercial scale demonstration of the heavy oil upgrading technology at a large commercial refinery. We have completed four runs at three different refineries and we continue to work with the refineries, anticipating additional use of HCAT over the next six months.
Hydrogen Peroxide. In September 2004 we entered into a joint venture with Evonik Industries (formerly Degussa AG and located in Essen, Germany) to develop and commercialize a direct synthesis process for hydrogen peroxide or H 2O2 . The venture aims to develop facilities to produce hydrogen peroxide for sale to manufacturers for the production of chemical intermediates such as propylene oxide (PO). Subject to terms and conditions of the agreement, the joint venture is responsible for development of hydrogen peroxide production facilities. In October 2005, the joint venture announced the success of pilot plant operations. In October 2007, a demonstration plant in Germany was completed and began startup operations. Based on results of the initial demonstration runs, modifications to the demonstration plant will be made and are expected to be completed during 2010. This plant is intended to provide performance data relative to large scale operations, a prerequisite for engineering a commercial scale H2O2 project. EvonikHeadwaters plans to continue developing technology related to direct synthesis of hydrogen peroxide at its German demonstration plant. The joint venture’s goal is to develop plans and explore markets to build additional hydrogen peroxide production facilities in other strategic locations to meet the expected world-wide growth in demand for H2O2 as a chemical intermediate.
In September 2006, Evonik and Headwaters acquired a Korean plant that employed a traditional process to produce and sell hydrogen peroxide to SKC Chemical for use in SKC’s manufacture of PO. The joint venture expanded the hydrogen peroxide facility to nearly double the original capacity, which is now approximately 75,000 tons of annual production. The expansion was completed in early 2008 and delivery of hydrogen peroxide to SKC Chemical for the manufacture of propylene oxide commenced during 2008.
Coal Liquefaction. Our technology for producing liquid fuels from coal was licensed in 2004 to the Shenhua Group, China’s largest coal company, for a direct coal liquefaction (“DCL”) project in Majiata, China. We have also entered into several development agreements for coal liquefaction. HES completed a phase II feasibility study for Oil India during 2008 and updated the conceptual design, economic analysis, and product upgrading study during 2009. Additionally, HES completed a study for an affiliate of Reliance Industries and worked with Reliance to obtain a grant from the United States Trade and Development Agency to conduct feedstock evaluation of their coal resources in India.
Ethanol. In 2006 we entered into a joint venture with Great River Energy (“GRE”) of Maple Grove, Minnesota to develop and construct a 50 million gallon-per-year ethanol production facility. Blue Flint Ethanol, LLC, the joint venture (“BFE”), is 51% owned by HES and 49% by GRE (however both partners have equal voting rights and control). The BFE production facility is operated by HES and is located at GRE’s Coal Creek Station, near Underwood, North Dakota, which supplies steam, water and other services to BFE. BFE purchases waste energy from GRE to use in its production process, resulting in what we believe to be one of the most energy efficient facilities in the ethanol industry.
Competition
Each of our energy businesses experience competition. With respect to our coal cleaning activities, HES faces competition from numerous operators of run-of-mine coal preparation facilities, some of which also co-produce product from waste or low value coal streams. Our coal-based solid fuel business also competes with other technology providers and manufacturers of chemical reagents, as well as traditional coal and fuel suppliers. Further, many industrial coal users are limited in the amount of cleaned coal product they can purchase from HES because they have committed to purchase a substantial portion of their coal requirements through long-term contracts for run-of-mine coal.
Our BFE facility is a low-cost producer of ethanol due to its unique process configuration. However, BFE experiences significant competition not only from many producers of ethanol and other biofuels throughout the United States, but also from producers of traditional petroleum fuels.
11
Table of Contents
Our heavy oil upgrading, coal liquefaction and catalyst technologies also experience competition from many of the world’s major petroleum, chemical and energy companies. Those companies are actively engaged in research and development activities. Many of our competitors have greater financial, management and other resources and may be able to take advantage of acquisitions and other opportunities more readily.
Segments and Major Customers
We operate in three business segments, light building products, heavy construction materials and energy technology. Additional information about segments is presented in Note 3 to the consolidated financial statements. No customer accounted for more than 10% of total revenue from 2007 through 2009.
Research and Development
We maintain a staff of engineers, scientists and technicians with expertise in the design and operation of high-pressure and temperature process plants at our Lawrenceville, New Jersey pilot plant and laboratory facilities. Among other technologies under development, we have the capability to work at the molecular level in the composition, aligning, spacing and adhering of nano-sized crystals of precious and transition metals on substrate materials for use as catalysts. The net effect can be higher performance with lower metal content, high selectivity for certain chemical reactions (i.e., the desired reaction is maximized with byproducts and waste minimized), long life and custom designed nanocatalysts. Potential applications for this nanotechnology include new processes to improve existing catalysts for chemical and refining processes. For example, during 2008 we began conducting a trial run of a nanocatalyst developed for naphtha reforming at a small refinery. We are also conducting laboratory testing on the application of the technology to the production of nanomaterials and nanofillers such as carbon nanospheres. In 2007 we formed a strategic partnership with Sumitomo Chemical to identify and further develop applications for these materials.
The following table presents our approximate research and development expenses for the past three fiscal years:
| 2007 |
$17.7 million | |
| 2008 |
$15.0 million | |
| 2009 |
$ 9.8 million |
Intellectual Property
As of September 30, 2009, we had approximately 222 U.S. and foreign counterpart patents and approximately 319 U.S. and foreign counterpart patents pending. Additionally, we have approximately 188 U.S. and foreign trademarks and approximately 61 U.S. and foreign trademark applications pending.
Collectively, the intellectual property is important to us, although there is no single patent or trademark that is itself material to us at the present time.
There can be no assurance as to the scope of protection afforded by the patents. In addition, there are other technologies in use and others may subsequently be developed, which do not, or will not, utilize processes covered by the patents. There can be no assurance that our patents will not be infringed or challenged by other parties or that we will not infringe on patents held by other parties. Because many of these patents represent new technology, the importance of the patents to our business will depend on our ability to commercialize these technologies successfully, as well as our ability to protect our technology from infringement or challenge by other parties.
In addition to patent protection, we also rely on trade secrets, know-how and confidentiality agreements to protect technologies. Despite these safeguards, such methods may not afford complete protection and there can
12
Table of Contents
be no assurance that others will not either independently develop such know-how or unlawfully obtain access to our know-how, concepts, ideas, and documentation. Since our proprietary information is important to our business, failure to protect ownership of our proprietary information would likely have a material adverse effect on us.
Regulation
Environmental. Our operations and those of our suppliers and customers involved in coal-based energy generation, primarily utilities, are subject to federal, state and local environmental regulation. Our coal-based operations and those of our customers are subject to federal, state and local environmental regulations that impose limitations on the discharge of pollutants into the air and water and establish standards for the treatment, storage and disposal of waste products, which add to the cost of doing business and expose us to potential fines for non-compliance. Moreover, in order to establish and operate the coal cleaning plants, power plants and operations to collect and transport CCPs, we and our customers have obtained various state and local permits and must comply with processes and procedures that have been approved by regulatory authorities. Compliance with permits, regulations and the approved processes and procedures help protect against pollution and contamination and are critical to our business. Any failure to comply could result in the issuance of substantial fines and penalties and cause us to incur environmental liabilities.
We believe that all required permits to construct and operate facilities where we operate have been or will be obtained and believe the facilities are in substantial compliance with all relevant laws and regulations governing our coal-based operations.
In spite of safeguards, our operations entail risks of regulatory noncompliance or accidental discharge that could create an environmental liability because regulated materials are used or stored during normal business operations. For example, we use and share chemicals in order to conduct operations involving distillation to purify products, analysis, packaging of chemicals and the selling, warehousing and manufacturing of organic chemicals in small research volumes. We also use facilities to perform research and development activities involving coal, oil, chemicals and industrial gases such as hydrogen. As a result, petroleum and other hazardous materials have been and are present in and on their properties. We generally hire independent contractors to transport and dispose of any wastes we generate and send them to approved facilities for disposal.
We own 51% of and operate an ethanol production facility, Blue Flint Ethanol, LLC (“BFE”), located at GRE’s Coal Creek Station near Underwood, North Dakota. The ethanol industry sector manufactures ethanol, principally from corn. Because Blue Flint obtains its thermal energy requirements in the form of steam from GRE’s Coal Creek Station and because our plant design includes other emission controlling devices, the BFE plant is permitted as a Synthetic Minor Source under the Clean Air Act. Our ethanol production facility is subject to air pollution emission control regulatory requirements and, as such, is subject to rule changes and/or additions that may be promulgated in the future.
Our HRI business is dependent upon the recovery and processing of CCPs from our customers, typically coal-burning power plants. These entities are highly regulated under federal and state law, including the federal Clean Air Act of 1970 and subsequent amendments, particularly the Clean Air Act Amendments of 1990, and corresponding state laws and EPA rules, which regulate the emissions of materials, such as SOx and NOx, into the air. The coal industry is directly affected by Clean Air Act permitting requirements and/or emissions control requirements, including requirements relating to particulate matter, such as fugitive dust. The EPA has adopted National Ambient Air Quality Standards, or NAAQS, for particulate matter and ozone, and states will ultimately be required to revise their existing state implementation plans to attain and maintain compliance with the NAAQS. Because electric utilities emit NOx, a precursor to ozone and particulate matter, our utility customers are likely to be affected when the NAAQS are implemented by the states.
In addition, the 1990 Clean Air Act Amendments require a study of utility power plant emissions of certain toxic substances, including mercury, and direct the EPA to regulate emissions of these substances, if warranted.
13
Table of Contents
In 2005, the EPA published (1) a finding determining not to regulate electric utility steam generating units under the hazardous air pollutants provisions; (2) the final Clean Air Mercury Rule, for reducing mercury emissions from new or reconstructed coal-burning power plants; and (3) the Clean Air Interstate Rule, which would require coal-burning power plants to upgrade their facilities to reduce emissions of sulfur dioxide and NOx and which, the EPA determined, would also contribute to reduction of mercury emissions as a co-benefit. However, both the Clean Air Mercury Rule and the Clean Air Interstate Rule have been vacated by the courts. The EPA is expected to replace these regulations within the next few years with new emission control requirements which could result in reduced use of coal if utilities switch to other sources of fuel.
Coal-fueled boilers have been impacted by regulations under the 1990 Clean Air Act Amendments, which established specific emissions levels for SOx and NOx in order to reduce acid rain. These emissions levels have required utilities to undertake many of the following changes: change their fuel source(s), add scrubbers to capture SOx, add new boiler burner systems to control NOx, add or modify fuel pulverizers/air handling systems to control NOx, introduce flue gas conditioning materials to control particulate emissions in conjunction with meeting SOx emissions targets and in some very isolated cases shut down a plant. All of these requirements can impact the quantity and quality of CCPs produced at a power plant, can add to the costs of operating a power plant and, depending on the requirements of individual state implementation plans, could make coal a less attractive fuel alternative in the planning and building of utility power plants in the future. When the EPA adopts expected new regulations to control mercury emissions, it could result in implementation of additional technologies at power plants that could negatively affect fly ash quality. For example, were power plants required to inject activated carbon into power plant exhaust gas to capture mercury emissions, it could lead to carbon being collected with the fly ash as a result of this emissions treatment process and thus may make the fly ash undesirable for concrete. Carbon removal processes are technically challenging and expensive.
In 2007, the United States Supreme Court found that the EPA has authority under the Clean Air Act to regulate greenhouse gases (“GHG”) that can contribute to global climate change, and that carbon dioxide qualifies as an “air pollutant” as defined in that Act. This decision may lead to EPA establishment of a national ambient air quality standard for CO2. In addition, Congress and the Obama administration are currently developing federal legislation to reduce GHG which, among other things, could establish a cap and trade system for GHG and requirements for electric utilities to increase their use of renewable energy such as solar and wind power. Also, EPA has taken several recent steps toward regulatory efforts to reduce GHG emissions, including its April 2009 proposed finding of “endangerment” to public health and welfare from GHG in the atmosphere (forwarded to the Office of Management and Budget on November 9, 2009 for final review prior to expected promulgation), its issuance on September 22, 2009 of the Final Mandatory Reporting of Greenhouse gases Rule, and publication in the Federal Register on October 27, 2009 of its proposed Prevention of Significant Deterioration and Title V Greenhouse Gas Tailoring Rule. These developments, as well as similar efforts by some states, may lead to further regulation of coal-fired boilers to reduce emissions of GHG, with unknown impacts on the cost and availability of CCPs.
HRI manages, stores, transports and sells coal ash. Also, some products manufactured and sold by HRI contain coal ash. Currently, coal ash is not regulated as “hazardous waste” under subtitle C of the Resource Conservation and Recovery Act (“RCRA”). However, EPA has announced its intention, by the end of 2009, to propose new regulations governing the handling, storage, transportation and disposal of coal ash and to determine whether to regulate coal ash as a non-hazardous solid waste (under RCRA Subtitle D) or as a hazardous solid waste (under RCRA Subtitle C), or to adopt a “hybrid approach” in which coal ash would be covered under Subtitle C in some circumstances and Subtitle D in others. For example, two hybrid approaches EPA is considering are (i) to treat coal ash as a hazardous waste when it is disposed of, but as non-hazardous when recycled for beneficial use; or (ii) to treat wet storage of coal ash waste in ponds as hazardous, but dry ash for beneficial use or landfill disposal as non-hazardous. If EPA determines to regulate coal ash as a hazardous waste or adopts a hybrid approach, coal ash would become subject to a variety of hazardous waste regulations, thus increasing the compliance obligations and costs of coal ash management for the utility industry and Headwaters. Depending on the approach EPA decides to take, its regulations could require modifications to facilities and
14
Table of Contents
equipment used to handle, store and transport coal ash, additional training for personnel and increased recordkeeping and reporting, as well as resulting in increased disposal costs at landfills. Potential changes to these rules could make coal burning more expensive or less attractive to HRI’s utility clients and management and use of coal ash more costly for HRI, if available for beneficial use at all.
In addition, EPA’s regulations could directly or indirectly limit, as well as impose regulatory requirements for, existing and proposed beneficial uses of coal ash. For example, a hazardous waste designation could have serious negative effects for the beneficial use of coal ash because of new uncertainties and perceived risks, destabilizing markets for the re-use of coal ash and other CCPs. New regulations could also provide for exemptions for certain uses. Existing RCRA exemptions may also remain available for products produced for beneficial use by the general public that meet certain qualifying conditions. State and other regulators responsible for approving beneficial uses of coal ash also may restrict its use, and potential users of products containing coal ash may seek alternatives if those products are required to be labeled as hazardous waste. The scope and details of any final EPA regulations are uncertain at this time.
HRI manages a number of landfill and pond operations that may be affected by the EPA’s impending RCRA regulations, in particular if EPA chooses to regulate coal ash stored in ponds as hazardous waste. In addition, environmental groups have filed a notice of intent to sue the EPA for failing to update effluent limitation guidelines under the Clean Water Act for coal-fired power plants, to limit discharges of toxic metals from handling of coal combustion waste. The EPA has announced its intention to revise its existing effluent limitation guidelines before 2012 to address toxic pollutants discharged from power plants, including discharges from coal ash ponds. In October 2009, EPA released a report concluding that wet coal ash storage and wastewater discharges from coal-fired power plans have caused a wide range of environmental effects to aquatic life. If EPA adopts new Clean Water Act requirements, compliance obligations would increase. However, in light of the early stage of EPA’s consideration of Clean Water Act regulations, their effect on HRI cannot be completely ascertained at this time.
Environmental groups have raised concerns regarding pollution from coal mining operations. On October 5, 2009, the Sierra Club and others filed a petition with EPA, alleging that mountaintop coal mining impacts the rural poor in Appalachia and demanding that EPA incorporate environmental justice considerations into its review of mining permits under the Clean Water Act. EPA has announced that, based on its preliminary review of mountaintop mine permits, heightened scrutiny and stronger regulatory provisions will likely be necessary. More stringent regulation of coal mining operations could increase the cost of coal for utilities and thus indirectly impact the availability and cost of coal ash for HRI’s CCP activities.
Certain environmental laws, including the Comprehensive Environmental Response, Compensation and Liability Act (“CERCLA”), impose strict, and under certain circumstances joint and several, liability on designated responsible parties for investigation and remediation of regulated materials at contaminated sites. CCPs may contain materials such as metals that are considered regulated materials under these laws. Land application of CCPs as a beneficial use is regulated by a variety of federal and state statutes, which impose testing and management requirements to ensure environmental protection. However, mismanagement of CCPs can give rise to liability under CERCLA and similar laws.
We work at the molecular level in the composition, aligning, spacing and adhering of nano-sized crystals of precious and transition metals on substrate materials for use as long life and custom designed nanocatalysts. Potential applications for this nanotechnology include new processes to improve existing catalysts for chemical and refining processes. We are also conducting laboratory testing on the application of the technology to the production of nanomaterials and nanofillers such as carbon nanospheres. A number of agencies are studying the issue of nanotechnology, including the National Toxicology Program, the National Institute for Safety and Health, and the EPA. Many of these efforts are being coordinated through the interagency Nanoscale Science, Engineering and Technology subcommittee of the White House Office of Science and Technology Policy, National Science and Technology Council. Nanoscale materials have been nominated to the National Toxicology
15
Table of Contents
Program for toxicological evaluation. The National Institute for Safety and Health, the EPA and the National Science Foundation are seeking applications for research proposals on the potential implications of nanotechnology and manufactured nanomaterials on human health and the environment. The Agency for Toxic Substances and Disease Registry has proposed to evaluate nanomaterials for development of a toxicological profile pursuant to CERCLA. In addition, the EPA recently announced it is developing two new rules under the Toxic Substances Control Act (“TSCA”) regarding nanoscale materials. The first rule, slated for 2010, will be developed under section 8 of TSCA to require companies to report a range of information on nanoscale materials, including data on existing uses, production volumes, specific physical properties, chemical and structural characteristics, methods of manufacture and processing, exposure and release information, and available health and safety data. The EPA is also developing a rule under section 4 of TSCA requiring companies to test several manufactured nanomaterials for health and environmental effects. Finally, the EPA is initiating a Science Advisory Panel review to consider whether the agency is adequately considering the risks surrounding nanomaterials regulated under the Federal Insecticide, Fungicide & Rodenticide Act, which are often in household products utilizing nanosilver as an antimicrobial agent. While these developments demonstrate increasing interest in this area, at this time, it is not possible to say more precisely whether and what form of nanotechnology regulations may be adopted and how they may affect our business.
Section 45. Our coal cleaning business is subject to compliance with the terms of Section 45 for the production and sale of refined coal. For facilities placed in service before January 1, 2009, the term “refined coal” means a fuel which (i) is a liquid, gaseous, or solid fuel produced from coal (including lignite) or high carbon fly ash, including such fuel used as a feedstock, (ii) is sold by the taxpayer with the reasonable expectation that it will be used for purpose of producing steam, (iii) is certified by the taxpayer as resulting (when used in the production of steam) in a reduction of at least 20% of the emissions of NOx and either SO2 or mercury released when burning the refined coal (excluding any dilution caused by materials combined or added during the production process), as compared to the emissions released when burning the feedstock coal or comparable coal predominantly available in the marketplace as of January 1, 2003, and (iv) is produced in such a manner as to result in an increase of at least 50% in the market value of the refined coal (excluding any increase caused by materials combined or added during the production process), as compared to the value of the feedstock coal. In order to qualify for the Section 45 tax credits using the foregoing criteria, the refined coal facility must have been placed in service after October 22, 2004 and before January 1, 2009. In addition, a refined coal production facility does not include any facility the production from which was allowed as a credit under Section 45K.
Section 45 currently provides a tax credit of $6.20 per ton of refined coal produced by the taxpayer at a refined coal facility during the 10-year period beginning on the date the facility was originally placed in service and sold by a taxpayer to an unrelated party during such 10-year period. The credit amount is adjusted each year for inflation. The tax credit is also subject to phase out to the extent that the “reference price” of the fuel used as feedstock exceeds the reference price for fuel in 2002 ($31.90) multiplied by the inflation adjustment factor for the applicable calendar year times 1.7. The reference price for fuel used as feedstock for refined coal for 2008 is $45.56. Because this amount did not exceed $31.90 times 1.3854 times 1.7 ($75.13), no phase out of the credit is applicable for calendar year 2008.
In the Energy Improvement and Extension Act of 2008, Congress extended the benefits of Section 45 tax credits to refined coal facilities placed in service after December 31, 2008 and before January 1, 2010. For refined coal facilities placed in service in calendar year 2009, Congress also eliminated the Section 45 requirement that there be a 50% increase in market value but increased the emissions reduction required of either SO2 or mercury to 40% from 20%.
We expect to be audited by the IRS with respect to Section 45 tax credits we claim.
Section 45K. Our former coal-based solid alternative (or synthetic) fuel business has been subject to compliance with the terms of Section 45K. By law, Section 45K tax credits for alternative fuel produced from
16
Table of Contents
coal expired on December 31, 2007. We have been audited by the IRS with respect to Section 45K tax credits. The IRS has challenged whether we satisfied the requirements of Section 45K, including placed-in-service requirements.
The IRS recently concluded its field review of our 2005-2006 tax years, and asserted objections to approximately $21.5 million in tax credits relating to synthetic coal facilities owned by us, which, if sustained in full, could result in payment of up to $15.1 million of additional taxes, excluding penalties and interest. Should the IRS prevail with respect to its assertions relating to the 2005-2006 tax years, it is also possible that Section 45K tax credits that we have claimed for our 2007-2008 tax years will also be disallowed, which could result in a payment of $4.2 million of additional taxes for the 2007-2008 tax years, excluding penalties and interest.
Employees
As of September 30, 2009, we employed approximately 2,740 full-time employees. There are approximately 35 employees in our corporate administration. Approximately 95 of our employees work under collective bargaining agreements.
The following table lists the approximate number of employees by business unit at September 30, 2007, 2008 and 2009:
| 2007 | 2008 | 2009 | ||||
| HBP |
2,840 | 2,175 | 1,665 | |||
| HRI |
740 | 775 | 800 | |||
| HES |
130 | 300 | 155 | |||
| HTI |
70 | 70 | 85 |
| ITEM 1A. | RISK FACTORS |
Risks Relating to Our Business
The building products industry is experiencing a severe downturn that may continue for an indefinite period into the future. Because the markets for our building products are heavily dependent on the residential construction and remodeling market, our revenues could decrease as a result of events outside our control that impact home construction and home improvement activity, including economic factors specific to the building products industry.
Since 2006, there has been a severe slowing of new housing starts and in home sales generally. Bank foreclosures have put a large number of homes into the market for sale, effectively limiting some of the incentives to build new homes. The homebuilding industry continues to experience a significant and sustained decrease in demand for new homes and an oversupply of new and existing homes available for sale since 2006. While our residential building products business relies upon the home improvement and remodeling markets as well as new construction, we have experienced a slowdown in sales activity beginning in fiscal 2007, and continuing in 2008 and 2009. Interest rate increases, limits on credit availability, further foreclosures, home price depreciation, and an oversupply of homes for sale in the market may adversely affect homeowners’ and/or homebuilders’ ability or desire to engage in construction or remodeling, resulting in a continued or further slowdown in new construction or remodeling and repair activities. The federal government’s program to provide an $8,000 credit for certain new home buyers, which encouraged home purchases, has been extended for home purchase contracts entered into before April 30, 2010. Termination of this program in 2010 may have an adverse effect on home sales generally and negatively affect our building products business.
We, like many others in the building products industry, experienced a large drop in orders and a reduction in our margins in 2008 and 2009, relative to prior years. For the past three years, we have recorded significant
17
Table of Contents
goodwill impairments associated with our building products business. We can provide no assurances that the building products market will improve in the near future. To the extent weakness continues into 2010, it will have an adverse effect on our business and our results of operations.
The construction markets are seasonal. The majority of our building products sales are in the residential construction market, which tends to slow down in the winter months. If there is more severe weather than normal, or other events outside of our control, there may be a negative effect on our revenues if we are not able to increase market share. For the winter months of 2009 and 2010, we expect that our decreased seasonal revenues from HBP and HRI will result in negative cash flow.
The recent financial crisis could negatively affect our business, results of operations, and financial condition. Market conditions in the mortgage lending and mortgage finance industries deteriorated significantly in 2008 and 2009, which adversely affected the availability of credit for home purchasers and remodelers.
The recent financial crisis affecting the banking system and financial markets and the going concern threats to banks and other financial institutions have resulted in a tightening in the credit markets, a low level of liquidity in many financial markets, including mortgages and home equity loans, and extreme volatility in credit and equity markets. Further tightening of mortgage lending or mortgage financing requirements could adversely affect the availability of credit for purchasers of our products and thereby reduce our sales.
There could be a number of follow-on effects from the credit crisis on our business, including the inability of prospective homebuyers or remodelers to obtain credit to finance the purchase of our building products. These and other similar factors could:
| • | cause delay or decisions to not undertake new home construction or improvement projects, |
| • | cause our customers to delay or decide not to purchase our building products, |
| • | lead to a decline in customer transactions and our financial performance. |
Our building products business has been strengthened by the sales growth of new products. If we are unable to continue to successfully expand our new product sales, our revenue growth may be adversely affected.
Our growth strategy includes the introduction of new building products by our light building products business. Part of our revenues has come from sales in new product categories. New products require capital for development, manufacturing, and acquisition activities. If we are unable to sustain new product sales growth, whether for lack of access to adequate capital or for other reasons, sales will follow the general industry slowdown in new residential construction and remodeling activity, which will negatively affect our revenue and growth.
Demand for our building products may decrease because of changes in customer preferences or because competing products gain price advantages. If demand for our products declines, our revenues will decrease.
Our building products are subject to reductions in customer demand for reasons such as changes in preferred home styles and appearances. Many of our resin-based siding accessory products are complementary to an owner’s choice of vinyl as a siding material. If sales of vinyl siding decrease, sale of our accessories will also decrease. Similarly, sales of our manufactured architectural stone products are dependent on the continuing popularity of stone finishes.
Demand for our building products can also decline if competing products become relatively less expensive. For example, if costs of petroleum-based resins that are used to make vinyl siding and accessories increase faster than the costs of stucco, then stucco products, which we do not sell, will become more attractive from a price standpoint, and our vinyl siding and accessory sales may decrease. If demand for our building products declines because of changes in the popularity or price advantages of our products, our revenues will be adversely affected.
18
Table of Contents
A significant increase in the price of materials used in the production of our building products that cannot be passed on to customers could have a significant adverse effect on our operating income. Furthermore, we depend upon limited sources for certain key production materials, the interruption of which would materially disrupt our ability to manufacture and supply products, resulting in lost revenues and the potential loss of customers.
Our manufactured architectural stone and concrete block manufacturing processes require key production materials including cement, man made and natural aggregates, oxides, packaging materials, and certain types of rubber-based products. The suppliers of these materials may experience capacity or supply constraints in meeting market demand that limit our ability to obtain needed production materials on a timely basis or at expected prices. We have no long-term contracts with such suppliers. We do not currently maintain large inventories of production materials and alternative sources meeting our requirements could be difficult to arrange in the short term. A significant increase in the price of these materials that cannot be passed on to customers could have a significant adverse effect on our cost of sales and operating income. Additionally, our manufacturing and ability to provide products to its customers could be materially disrupted if this supply of materials was interrupted for any reason. Such an interruption and the resulting inability to supply our manufactured architectural stone customers with products could adversely impact our revenues and our relationships with our customers.
Certain of our home siding accessory products are manufactured from polypropylene, which material is sold to us by a single supplier. The price of polypropylene is primarily a function of manufacturing capacity, demand and the prices of petrochemical feedstocks, crude oil and natural gas liquids. Historically, the market price of polypropylene has fluctuated, and significantly increased in 2008. A significant increase in the price of polypropylene that cannot be passed on to customers could have a significant adverse effect on our cost of sales and operating income. We do not have a long-term contract with our polypropylene supplier. We do not maintain large inventories of polypropylene and alternative sources of polypropylene could be difficult to arrange in the short term. Therefore, our manufacturing and ability to provide products to our customers could be materially disrupted if this supply of polypropylene was interrupted for any reason. Such an interruption and the resulting inability to supply our resin-based siding accessory customers with products could adversely impact our revenues and potentially our relationships with our customers.
Interruption of our ability to immediately ship individual or custom product orders could harm our reputation and result in lost revenues if customers turn to other sources for products.
Our building products business is highly dependent upon rapid shipments to contractors and distributors throughout the United States of individual orders, a large portion of which orders are manufactured upon demand to meet customer specifications. If there is significant interruption of business at any of our manufacturing plants or with our computer systems that track customer orders and production, we are at risk of harming its reputation for speed and reliability with important customers and losing short-term and long-term revenues if these customers turn to other sources.
Tapco’s revenues would be materially adversely affected if it lost one or more of its three major customers.
Three customers of our resin-based siding accessory products together accounted for approximately 26% of Tapco’s revenues for such products in the fiscal year ended September 30, 2009, and approximately 6% of our total revenues as of such date. There are no long-term contracts in place with these customers. Accordingly, a loss of or significant decrease in demand from these customers would have a material adverse effect on our business.
Our construction materials business has been severely affected by recent downturns in governmental infrastructure spending.
Our fly ash and concrete block products, and to a much lesser extent, our other building products, are used in public infrastructure projects, which include the construction, maintenance, and improvement of highways,
19
Table of Contents
bridges, schools, prisons and similar projects. Our business is dependent on the level of federal, state, and local spending on these projects. We cannot be assured of the existence, amount, and timing of appropriations for government spending on these projects.
Federal and state budget limitations may continue to decrease severely the funding available for infrastructure spending. The lack of available credit has limited the ability of states to issue bonds to finance construction projects. In addition, infrastructure spending continues to be adversely affected by the overall weakness in the economy, which leads to lower tax revenues and state government budget deficits. Shortages in state tax revenues can reduce the amounts spent on state infrastructure projects, even below amounts awarded by the legislatures. Delays in state infrastructure spending can hurt our business. Further, rising construction and material prices constrain infrastructure construction budgets.
The American Recovery and Reinvestment Act (“ARRA”) enacted in early 2009 provided billions of dollars in new stimulus funding for transportation infrastructure. However, there has been a time delay in Congressional appropriation of such funds and each state’s actions to take advantage of such funding. In addition, each state must approve various infrastructure projects to be funded through the new federal stimulus plan. So while management believes the ARRA will increase our sales in fiscal 2010, we cannot be assured of the amount of funds to be expended and the timing of expenditures under the stimulus plan.
If HRI’s coal-fueled electric utility industry suppliers fail to provide it with high-value coal combustion products (“CCPs”) due to environmental regulations or otherwise, HRI’s costs could increase and supply could fail to meet production needs, potentially negatively impacting our profitability or hindering growth.
Headwaters Resources relies on the production of CCPs by coal-fueled electric utilities. HRI has occasionally experienced delays and other problems in obtaining high-value CCPs from its suppliers and may in the future be unable to obtain high-value CCPs on the scale and within the time frames required by HRI to meet customers’ needs. Following the judicial invalidation in 2008 of the EPA’s Clean Air Mercury Rule under the 1990 Clean Air Act Amendments, additional technologies at power plants may be required by future regulation or legislation, in order to achieve reductions in mercury emissions that could negatively affect fly ash quality. For example, future regulations could require activated carbon to be injected into power plant exhaust gases to capture mercury. This process may increase the carbon collected with the fly ash and may make the fly ash undesirable for concrete. Carbon removal processes for fly ash are technically challenging and expensive. The EPA has announced that new regulations to control mercury emissions from power plants may be proposed in 2010. Further, as the price of natural gas has decreased to current prices, coal-fueled electric utilities have in some instances switched from coal to natural gas. A reduction in the use of coal as fuel causes a decline in the production and availability of fly ash. To the extent the price of natural gas continues to decrease, more coal-fueled electric utilities may explore the feasibility of switching from coal to natural gas.
Increasing concerns about greenhouse gases (“GHG”) or other emissions from burning coal at electricity generation plants could lead to federal or state regulations that encourage or require utilities to burn less or eliminate coal in the production of electricity. Congress and the Obama administration are currently engaged in developing federal legislation to reduce GHG emissions which, among other things, could establish a cap and trade system for GHG, including carbon dioxide emitted by coal burning power plants and requirements for electric utilities to increase their use of renewable energy, such as wind and solar power. Also, the EPA has taken several recent actions toward regulatory efforts to reduce GHG emissions, including its April 2009 proposed finding of “endangerment” to public health and welfare from GHG (forwarded to the Office of Management and Budget on November 9, 2009 for final review prior to expected promulgation), its issuance on September 22, 2009 of the Final Mandatory Reporting of Greenhouse Gases Rule which requires large sources, including coal burning power plants, to report GHG emissions to the EPA annually starting in 2011, and publication in the Federal Register on October 27, 2009, of its proposed Prevention of Significant Deterioration and Title V Greenhouse Gas Tailoring Rule, which would require large industrial facilities, including coal burning power plants, to obtain permits to emit, and to use best available control technology to control GHG. Some states have also adopted or are developing climate change legislation and/or regulations as well. Such legislation and/or
20
Table of Contents
regulations could reduce the supply of fly ash and other CCPs. If HRI is unable to obtain CCPs or if it experiences a delay in the delivery of high-value or quality CCPs, HRI will have a reduced supply of CCPs to sell or may be forced to incur significant unanticipated expenses to secure alternative sources or to otherwise maintain supply to customers. Moreover, revenues could be adversely affected if CCP sales volumes cannot be maintained or if customers choose to find alternatives to HRI’s products.
If the EPA adopts more stringent regulations governing coal and coal ash management and use, this action would likely have an adverse effect on the cost, beneficial use and sales of CCPs.
Headwaters’ coal ash business is dependent upon the management, recovery, processing, transport and beneficial use of coal combustion products and coal combustion wastes received from its clients, typically coal-burning power plants. Following a major spill of coal ash from a surface impoundment at a coal burning power plant in Tennessee in December 2008 from a facility owned by the Tennessee Valley Authority, a corporate agency of the U.S. government not affiliated with HRI, there is mounting pressure on the EPA to regulate coal ash as a hazardous waste. The EPA has announced its intention, by the end of 2009, to propose new regulations governing the handling, storage, transportation and disposal of coal ash wastes, and to determine whether to designate coal ash as a non-hazardous solid waste under Subtitle D of the Resource Conservation and Recovery Act (“RCRA”) or as a hazardous solid waste under RCRA Subtitle C, or to adopt a “hybrid approach” in which coal ash would be covered under Subtitle C in some circumstances and Subtitle D in others. For example, two hybrid approaches EPA is considering are (i) to treat coal ash as a hazardous waste when it is disposed of, but as non-hazardous when recycled for beneficial use; or (ii) to treat wet storage of coal ash waste in ponds as hazardous, but dry ash for beneficial use or landfill disposal as non-hazardous. If the EPA determines to regulate coal ash as a hazardous waste or adopts a hybrid approach, coal ash would become subject to a variety of hazardous waste regulations and the cost of handling, transporting, storing and disposing of the material would increase, thus increasing regulatory obligations and costs of coal ash management for the utility industry and for Headwaters. Depending on the approach EPA decides to take, its regulations could require modifications to facilities and equipment used to handle, store and transport coal ash, additional training for personnel and increased recordkeeping and reporting, as well as resulting in increased disposal costs at landfills; however, in general, HRI’s contracts with utility clients contain provisions that would allow for increased costs related to regulatory changes to be recovered from the utilities.
EPA’s regulations also could directly or indirectly limit, as well as impose regulatory requirements for, existing or proposed beneficial uses of coal ash, including its use as a substitute for portland cement. In addition, state and other regulators responsible for approving beneficial uses of coal ash may restrict its use. These potential increased regulatory obligations and costs, limitations on beneficial uses, and potential increased liabilities could result in reduced or completely eliminated use of coal ash in products. For example, it is possible that there may be restrictions on incorporating coal ash in products that are placed in contact with the ground owing to a risk of potential leaching of metals into the environment. In addition, the stigma associated with products labeled as “hazardous” may lead potential users of products containing coal ash to seek alternatives, resulting in a risk of lost opportunities to market CCPs. However, it is also possible that the EPA could exempt from regulation certain coal combustion wastes used for beneficial purposes, including certain construction applications such as use in concrete and concrete products, cement, road base and wall board. Existing RCRA exemptions may also remain available for products produced for use by the general public that meet certain qualifying conditions. In light of the current uncertainty concerning the scope and details of any final EPA regulations for coal ash, we are not in a position at this time to assess their impact, but there can be no guarantee that such regulation would not reduce or eliminate our supply or our ability to market coal ash and other CCPs which would have a material adverse impact on our operations and financial condition.
In addition, environmental groups have filed a notice of intent to sue the EPA for failing to update effluent limitation guidelines under the Clean Water Act for coal-fired power plants, to limit discharges of toxic metals in waste water from handling of coal combustion waste. The EPA subsequently announced its intention to revise its existing effluent limitation guidelines before 2012 to address toxic pollutants discharged from power plants,
21
Table of Contents
including discharges from coal ash ponds. In October 2009, EPA released a report concluding that wet coal ash storage and wastewater discharges from coal-fired power plans have caused a wide range of environmental effects to aquatic life. If the EPA adopts new Clean Water Act requirements and/or chooses to regulate coal ash stored in ponds as a hazardous waste, the regulatory obligations and cost of managing coal combustion waste would likely increase, which could make coal burning more expensive or less attractive to HRI’s utility clients and management and use of coal ash more costly for HRI.
Finally, environmental groups have raised concerns regarding pollution from coal mining operations. On October 5, 2009, the Sierra Club and others filed a petition with EPA, alleging that mountaintop coal mining impacts the rural poor in Appalachia and demanding that EPA incorporate environmental justice considerations into its review of mining permits under the Clean Water Act. EPA has announced that, based on its preliminary review of mountaintop mine permits, heightened scrutiny and stronger regulatory provisions will likely be necessary. More stringent regulation of coal mining operations could increase the cost of coal for utilities and thus indirectly impact the availability and cost of coal ash for HRI’s CCP activities.
HRI primarily sells fly ash for use in concrete; if use of fly ash does not increase, HRI may not grow.
HRI’s growth has been and continues to be dependent upon the increased use of fly ash in the production of concrete. HRI’s marketing initiatives emphasize the environmental, cost and performance advantages of replacing portland cement with fly ash in the production of concrete. If HRI’s marketing initiatives are not successful, HRI may not be able to sustain its growth.
Further, utilities are switching fuel sources, changing boiler operations and introducing activated carbon and ammonia into the exhaust gas stream in an effort to decrease costs and/or to meet increasingly stringent emissions control regulations. All of these factors can have a negative effect on fly ash quality, including an increase in the amount of unburned carbon in fly ash and the presence of ammonia slip. We are attempting to address these challenges with the development and/or commercialization of two technologies: carbon fixation, which pre-treats unburned carbon particles in fly ash in order to minimize the particles’ adverse effects, and ammonia slip mitigation, which counteracts the impact of ammonia contaminants in fly ash. Decreased quality of fly ash may impede the use of fly ash in the production of concrete, which would adversely affect HRI’s revenue.
If portland cement or competing replacement products are available at lower prices than fly ash, our sales of fly ash as a replacement for portland cement in concrete products could suffer, causing a decline in HRI’s revenues and net income.
An estimated 80% of HRI’s revenues for the fiscal year ended September 30, 2009 were derived from the sale of fly ash as a replacement for portland cement in concrete products. At times, there may be an overcapacity of cement in regional markets, causing potential price decreases. The markets for HRI’s products are regional, in part because of the costs of transporting CCPs, and HRI’s business is affected by the availability and cost of competing products in the specific regions where it conducts business. If competing products become available at prices equal to or less than fly ash, HRI’s revenues and net income could decrease.
Because demand for CCPs sold by HRI is affected by fluctuations in weather and construction cycles, HRI’s revenues and net income could decrease significantly as a result of unexpected or severe weather.
HRI manages and markets CCPs and uses CCPs to produce building products. Utilities produce CCPs year-round. In comparison, sales of CCPs are generally keyed to construction market demands that tend to follow national trends in construction with predictable increases during temperate seasons and decreases during periods of severe weather. HRI’s CCP sales have historically reflected these seasonal trends, with the largest percentage of total annual revenues being realized in the quarters ended June 30 and September 30. Low seasonal demand normally results in reduced shipments and revenues in the quarters ended December 31 and March 31. We expect the seasonal impact on HRI’s revenue, together with the seasonal impact on Tapco and HBP revenues to result in negative cash flows for the winter months of 2009 and 2010.
22
Table of Contents
The profitability of HES depends upon the operational success of our new coal cleaning business, which has been adversely affected by decreased demand for coal.
Because of the end of HES legacy alternative fuel licensing and chemical reagent sales business as of December 31, 2007, HES began development of its new coal cleaning business. By December 2008, HES had acquired or completed construction on eleven coal cleaning facilities. To successfully operate its facilities, HES must produce and market a quality fuel, addressing operational issues including feedstock availability and cost, construction and operability of equipment, successful separation of minerals including ash, sulfur, and mercury, product moisture and Btu content, overall costs of operations, as well as marketing and sales of the finished product, which is generally of smaller particle size (called fines) and which may be more difficult to sell than run-of-mine coal. This is a new business for HES, and we have experienced difficulty in receiving or extracting our full requirements of feedstock at some facilities and softness in the price of our products. Because of decreased demand for coal, we have curtailed operations at four facilities, leaving seven in operation at this time. The profitability of HES depends on the ability of HES to increase production and sales of cleaned coal. If these facilities operate at low production levels or cannot produce fuel satisfactory to customers, revenues will be materially adversely affected.
Regulatory changes could reduce the demand for coal which may decrease the price for which HES can sell its clean coal product. In addition, a slowing economy may reduce demand for coal, adversely affecting our revenues.
Our clean coal revenues are dependent upon the demand for coal, particularly as a fuel for the production of electricity. Increasing concerns about greenhouse gas or other air emissions, toxic materials in wastewater discharges and the hazardousness of coal combustion waste from burning coal at power generation plants could lead to federal or state regulations that encourage or require utilities to burn less or eliminate coal in the production of electricity. Such regulations could reduce the demand for coal, which would adversely affect the prices at which HES could sell its clean coal product and decrease our revenues.
Coal is a commodity that can be produced and shipped worldwide. As the U.S. and worldwide economies slow, demand for coal as an energy source may decrease. In addition, some of our clean coal revenues come from the sale of metallurgical grade coal used in steel making. As economic growth slows, so will the demand for steel. Slower economic growth can therefore reduce the overall demand for coal, including metallurgical grade coal. This could reduce the prices for which we can sell clean coal, adversely affecting our revenues.
HES may not qualify for tax credits under Section 45, which will adversely affect our profitability.
Section 45 provides a tax credit for the production and sale of refined coal. Based on the language of Section 45, HES believes that the coal cleaning facilities are eligible for Section 45 refined coal tax credits. However, the ability to claim tax credits is dependent upon a number of conditions, including, but not limited to:
| • | Placing facilities in service on or before December 31, 2008; |
| • | Producing a fuel from coal that is lower in NOx and either SO2 or mercury emissions by the specified amount as compared to the emissions of the feedstock; |
| • | Producing a fuel at least 50% more valuable than the feedstock; and |
| • | Sale of the fuel to a third-party for the purpose of producing steam. |
To date, the Internal Revenue Service (“IRS”) has issued very little public guidance about how this tax credit program will be administered and the restrictions on the availability of such credits. We understand that the IRS may be providing guidance in the near future, but we do not know how any such guidance will affect our ability to take tax credits.
23
Table of Contents
The IRS may challenge Section 45 tax credits claimed by HES, under which we have recognized a total benefit of approximately $10.3 million through September 30, 2009, based on any one of the above or other conditions. In addition, Congress may modify or repeal Section 45 so that these tax credits may not be available in the future. If HES is not successful in claiming Section 45 credits from our coal cleaning facilities, our profitability will be materially adversely affected.
If the IRS is successful in its challenges of Section 45K tax credits claimed by us, we may be subject to increased tax liabilities which will materially adversely affect our income and accounting reserves.
Section 45K (formerly Section 29) of the Internal Revenue Code (“Section 45K”) provides a tax credit for the production and sale of alternative fuels from coal. The IRS is challenging by audit whether HES satisfied the requirements of Section 45K, including placed-in-service requirements, and is seeking to disallow Section 45K tax credits claimed by us. The outcome of such audits, appeals, and any tax litigation is uncertain. In the event that the IRS is ultimately successful in sustaining its challenge to tax credits claimed by us, we will have an increased tax liability which will materially adversely affect our income and accounting reserves. The IRS has recently concluded its field review of our 2005-2006 tax years and issued a Revenue Agent’s report, or RAR, on September 9, 2009, disallowing approximately $21.5 million in tax credits relating to synthetic coal facilities owned by us, which, if sustained in full, could result in payment of up to $15.1 million of additional taxes, plus any penalties and interest. We have filed a protest letter challenging the proposed adjustments contained in the RAR. However, we may not be successful in our challenge, which, as noted above, could result in a material tax liability and could adversely affect our results of operation and financial condition. In addition, should the IRS prevail with respect to its assertions relating to the 2005-2006 tax years, it is also possible that Section 45K tax credits that we have claimed for our 2007-2008 tax years will also be disallowed, which could result in a payment of $4.2 million of additional taxes for the 2007-2008 tax years, plus any penalties and interest.
The availability and price of corn purchased by Blue Flint Ethanol, LLC (“BFE”) can be affected by weather, disease, demand from other users of corn, government programs and other factors beyond BFE’s control. In addition, fluctuations in ethanol prices could adversely affect BFE’s ethanol revenues.
The availability and price of corn, the primary feedstock for BFE’s ethanol production, is subject to wide fluctuations due to unpredictable factors such as weather, plantings, crop disease, demand for corn from other users, government farm programs and policies, changes in demand resulting from population growth, and production of similar and competitive crops. From time to time there are wide fluctuations in the pricing of ethanol and corn. Ethanol pricing tends to track corn pricing which may limit the upside price potential of ethanol. Increased demand and/or reduced supply of corn adversely affect our profitability by increasing the cost of raw materials used in BFE’s operations.
The ethanol and biodiesel industry in the U.S. has grown rapidly and our success will depend on whether demand for ethanol increases proportionately or if the increased production results in excess capacity. At times, the ethanol industry produces product in excess of the market’s ability to blend, store, transport, sell and deliver ethanol-based fuels. During periods of excess supply there is downward pressure on the sales prices for ethanol to producers, which adversely affects BFE’s revenues and operating results.
Environmental regulations aimed at reducing greenhouse gas emissions may also affect the market for ethanol-based fuel derived from corn. The EPA’s low carbon fuel standard proposal contains a new biofuel lifecycle emissions analysis that, if the proposal is finalized, could adversely impact the production of ethanol-based fuel derived from corn. In addition, California has adopted a new low carbon fuel standard with a lifecycle fuel analysis that could adversely impact the sources of ethanol in fuel distributed in California.
Our new businesses, processes and technologies may not be successfully developed, operated and marketed, which could affect our future profitability.
Although we have developed or acquired many new businesses, processes and technologies (e.g., ethanol, heavy oil upgrading and coal cleaning), commercialization of these businesses and technologies is in early
24
Table of Contents
stages. Commercial success of these new businesses and technologies will depend on our ability to enter into agreements with customers, licensees and/or joint ventures to further develop and provide adequate funding to commercialize the new businesses and technologies, as well as to develop markets for the products and technologies. We may not be able to enter into these agreements and adequate funding may not be available to fully develop and successfully commercialize our new businesses and technologies. Further, we may not be able to profitably operate our new businesses or market our technologies or products produced from them. These processes (e.g., heavy oil upgrading) and technologies also may become less competitive and more costly as a result of increasing efforts to reduce use of fossil fuels and more stringent environmental regulation, including efforts to control greenhouse gas emissions.
Our growth requires continued investment of capital. If we cannot invest additional capital into new and existing businesses, we may not be able to sustain or increase our growth.
Our operations require both maintenance and growth capital. A key part of our business strategy has been to expand through complementary acquisitions, which has required significant capital. In addition, commercialization of our energy technologies, such as coal cleaning and heavy oil upgrading, has required and will require significant debt and equity commitments. In 2008 and 2009, we made significant investments in coal cleaning facilities and to secure coal feedstocks, financed with equity, debt, and other arrangements, and we expect to make additional such investments in future years, although not to the extent of prior years. We estimate that our capital expenditure needs for fiscal 2010 will be $25 million to $30 million. Our building products and CCP businesses also require significant capital expenditures. If we do not have sufficient capital to make equity investments in new projects and/or are limited by financial covenants from doing so, our growth may suffer.
We are conducting business in China and other foreign countries where intellectual property and other laws, as well as business conditions, may leave our intellectual property, products and technologies vulnerable to duplication by competitors and create uncertainties as to our legal rights against such competitors’ actions.
We have and expect to continue to license or otherwise make our technology, including our nanotechnology, heavy oil upgrading and coal liquefaction technology, available to entities in China and other foreign countries. There is a risk that foreign intellectual property laws will not protect our intellectual property to the same extent as under United States laws, leaving us vulnerable to competitors who may attempt to copy our products, processes or technologies. Further, the legal system of China is based on statutory law. Under this system, prior court decisions may be cited as persuasive authority but do not have binding precedential effect. Since 1979, the Chinese government has been developing a comprehensive system of commercial laws and considerable progress has been made in the promulgation of laws and regulations dealing with economic matters, such as corporate organization and governance, foreign investment, commerce, taxation and trade. As these laws, regulations and legal requirements are relatively new and because of the limited volume of published case law and judicial interpretations and the non-binding nature of prior court decisions, the interpretation and enforcement of these laws, regulations and legal requirements involve some uncertainty. These uncertainties could limit the legal protection or recourse available to us. In addition, dependence on foreign licenses and conducting foreign operations may subject us to increased risk from political change, ownership issues or repatriation or currency exchange concerns.
We could face potential product liability claims relating to products we manufacture.
Our historical product liability claims have not been material and while management is not aware of any material product liability issues, we do face an inherent business risk of exposure to product liability claims in the event that the use of any of our products results in personal injury or property damage. For example, if the EPA decides to designate coal ash as a hazardous waste, we may face an increase in claims related to products which incorporate this material. In the event that any of our products proves to be defective, among other things, we may be responsible for damages related to any defective products and we may be required to recall or redesign such products. Because of the long useful life of our products, it is possible that latent defects might not
25
Table of Contents
appear for several years. Any insurance we maintain may not continue to be available on terms acceptable to us or such coverage may not be adequate for liabilities actually incurred. Further, any claim or product recall could result in adverse publicity against us, which could cause our sales to decline or increase our costs. Insurance for such product liability claims could become much more expensive or more difficult to obtain.
Inappropriate use of CCPs can result in faulty end products. In some cases, the products marketed by HRI consist of a mixture of client-supplied materials, including CCPs. HRI does not in all cases control the quality of the final end product, but may share such control with the manufacturer of the ingredient materials. Therefore, there is a risk of liability regarding the quality of the materials and end products marketed by HRI. In cases where HRI is responsible for end-product quality, such as a structural fill (where material is used to fill a cavity or designated area), HRI depends solely on its own quality assurance program.
Significant increases in energy and transportation costs that cannot be passed on to customers could have a significant adverse effect on operating income.
We purchase a significant amount of energy from various sources to conduct our operations, including fossil fuels and electricity for production of building products and diesel fuel for distribution of our products and for production-related vehicles. In addition, fuel cost increases have increased truck and rail carrier transportation costs for our products. Fuel cost increases have in the past and may in the future adversely affect the results of our operations and our financial condition. Prices and availability of all petroleum products are subject to political, economic and market factors that are generally outside of our control.
We may not realize the anticipated cost savings related to the cost reduction initiatives we have implemented.
We have specific initiatives under way to reduce our cost structure across all of our business segments. Our ability to successfully realize cost savings and the timing of any realization may be affected by a variety of factors including, without limitation, our ability to reduce headcount, reduce expenditures, improve our manufacturing capacity and processes and otherwise execute our plan and retain personnel necessary to execute our plan. We may not achieve the currently anticipated cost savings, and we may not achieve the cost savings within the timeframe we currently expect.
We operate in industries subject to significant environmental regulation, and compliance with and changes in regulation could add significantly to the costs of conducting business.
The coal-based operations of HES and the CCP operations of HRI and their respective customers and licensees, together with projects such as the ethanol plant and the operations of a hydrogen peroxide plant in Korea, are subject to federal, state, local and international environmental regulations that impose limitations on the discharge of pollutants into the air and water and establish standards for the treatment, storage and disposal of waste products, and impose liability for the costs of remediating contaminated sites, which add to the costs of doing business and expose us to potential fines for non-compliance. If the costs of environmental compliance increase for any reason, we may not be able to pass on these costs to customers. In order to establish and operate the alternative fuel plants, coal cleaning plants, power plants and operations to collect and transport CCPs, we and our customers have obtained various state and local permits and must comply with processes and procedures that have been approved by regulatory authorities. These environmental requirements and any failure to comply could give rise to environmental liabilities and to substantial fines and penalties.
Certain HBP manufacturing operations are also subject to environmental regulations and permit requirements. If HBP and its subsidiaries and affiliates cannot obtain or maintain required environmental permits for their existing and planned manufacturing facilities in a timely manner or at all, they may be subject to additional costs and/or fines.
The ethanol industry sector manufactures ethanol, principally from industrial corn. Ethanol production facilities can emit volatile organic compounds and carbon monoxide into the air. Our ethanol production facility
26
Table of Contents
located at the GRE Coal Creek pulverized coal electric power station near Underwood, North Dakota, is subject to air pollution permitting and emission control regulatory requirements, and has obtained all required permits. However, if this facility cannot maintain compliance with environmental regulations, it may be subject to additional costs and/or fines.
HTI’s ordinary course of business requires using its facilities to perform research and development activities involving coal, oil, chemicals and energy technologies, including liquefaction of coal. As a result, petroleum and other regulated materials have been and are present in and on HTI’s properties. Regulatory noncompliance or accidental discharges, fires, or explosions, in spite of safeguards, could create environmental or safety liabilities. Therefore, our operations entail risk of environmental damage and injury to people, and we could incur liabilities in the future arising from the discharge of pollutants into the environment, waste disposal practices, or accidents, as well as changes in enforcement policies or newly discovered conditions.
We are involved in litigation and claims for which we incur significant costs and are exposed to significant liability.
We are a party to some significant legal proceedings and are subject to potential claims regarding operation of our business. These proceedings will require that we incur substantial costs, including attorneys’ fees, managerial time and other personnel resources and costs in pursuing resolution, and adverse resolution of these proceedings could result in our payment of damages, materially adversely affect our income and reserves and damage our reputation. With respect to the cases referred to in Note 12 to the consolidated financial statements, the amount of damages described below is being sought by the counter parties. To date, we have reserved $1.0 million in the aggregate for potential damages in these matters.
Boynton. In October 1998, Headwaters entered into a technology purchase agreement with James G. Davidson and Adtech, Inc. The transaction transferred certain patent and royalty rights to Headwaters related to a synthetic fuel technology invented by Davidson. In June 2002, Headwaters received a summons and complaint from the United States District Court for the Western District of Tennessee filed by former stockholders of Adtech alleging, among other things, fraud, conspiracy, constructive trust, conversion, patent infringement and interference with contract arising out of the 1998 technology purchase agreement entered into between Davidson and Adtech on the one hand, and Headwaters on the other. All claims against Headwaters were dismissed in pretrial proceedings except claims of conspiracy and constructive trust. The District Court certified a class comprised of substantially all purported stockholders of Adtech, Inc. At trial, the plaintiffs sought compensatory damages from Headwaters in the approximate amount of $43.0 million plus prejudgment interest and punitive damages. On June 22, 2009, a jury reached a verdict in a trial in the amount of $8.7 million for eight named plaintiffs representing a portion of the class members. The jury also reached a verdict on certain legal liability issues and an advisory verdict on damages of $12.7 million on behalf of the balance of the class members. Fact discovery has begun with respect to unnamed class members. We expect that there will be further trial court proceedings to resolve an equitable claim as to all members of the class and the remaining legal issues as to the unnamed class members. It is not expected that a final judgment will be entered by the trial court until all issues are concluded following such further trial court proceedings which have not yet been scheduled. Once final judgment is entered, the parties may seek relief from judgment by motion to the trial court and by appeal from the final judgment. Because the resolution of the litigation is uncertain, legal counsel and management cannot express an opinion as to the ultimate amount, if any, of Headwaters’ liability.
Ecologica Carmelo. Headwaters Resources, Inc. (“HRI”), a subsidiary through which Headwaters conducts its CCP business, entered into a fly ash supply agreement with Ecologica Carmelo, Inc. (Carmelo) in February 2002 to supply fly ash to Carmelo for sale and use in the Caribbean basin region. The agreement guarantees first availability of fly ash to Carmelo from specific power generating plants and Carmelo agreed to purchase exclusively from HRI and to purchase a minimum tonnage of fly ash annually. In April 2008, HRI filed an arbitration demand against Carmelo in Atlanta, Georgia, alleging that Carmelo breached the fly ash supply agreement by failing to purchase the minimum annual volume of fly ash it was obligated to
27
Table of Contents
purchase under that agreement and for violation of Carmelo’s obligation to exclusively purchase fly ash from HRI. HRI is seeking approximately $3.9 million for lost profits on minimum fly ash purchases, plus other direct, incidental, and consequential damages relating to Carmelo’s failure to purchase from HRI exclusively.
In June 2008, Carmelo filed its response to HRI’s arbitration demand. Carmelo denied that it breached the fly ash supply agreement, alleged that it properly terminated the agreement, and filed a counterclaim against HRI. Carmelo has alleged that HRI failed to secure a cost-effective source of fly ash for Carmelo in violation of the fly ash supply agreement. Carmelo has asserted claims for breach of contract, breach of Puerto Rico Law No. 75, and breach of the covenant of good faith and fair dealing. Carmelo is seeking damages of at least $12.3 million which allegedly represents the lost value of its investment in a facility designed for the intake and storage of fly ash from HRI. HRI and Carmelo are attempting to reach a negotiated resolution of the matter. Because the resolution of the action is uncertain, legal counsel and management cannot express an opinion concerning the likely outcome of this matter or the liability of HRI, if any.
Mainland Laboratory. HRI entered into a license agreement for the use of a fly ash carbon treatment technology with Mainland Laboratory, LTD (Mainland) in April 2000. The agreement grants exclusive rights to the patented carbon treatment technology owned by Mainland. In 2006, HRI became aware of prior art relating to the Mainland patented technology which Headwaters believed invalidated the Mainland patent and HRI stopped paying royalties under the agreement. In September 2007, Mainland filed suit against HRI in the United States District Court for the Southern District of Texas with a demand for arbitration under the terms of the license agreement, for breach of contract and patent infringement. Mainland is seeking approximately $23.0 million in damages, enhancement of any damages award based on alleged willful infringement of its patent, and recovery of its costs associated with the litigation, including its attorneys’ fees. Additionally, Mainland is seeking an injunction to stop HRI from practicing the technology covered by the patent. The District Court has ruled that Mainland’s patent is invalid and remanded the case to arbitration for further proceedings. Because the resolution of remaining claims in arbitration is uncertain, legal counsel and management cannot express an opinion concerning the likely outcome of this matter or the liability of HRI, if any.
Coalco Corporation. Beginning in 1996, Headwaters entered into a series of agreements with Coalco Corporation by which Coalco would assist Headwaters in identifying financing sources for synthetic fuel manufacturing projects. Under these agreements, Headwaters agreed to pay certain fees to Coalco. Beginning in 1997, Pelletco Company, an affiliate of Coalco, entered into license agreements for the use of Headwaters’ synthetic fuel technology for which Pelletco agreed to pay certain license fees to Headwaters. As of December 31, 2008, trade receivables include $3.8 million which is due from Pelletco to Headwaters. The synthetic fuel businesses underlying all of these agreements ended during fiscal 2008. In January 2009, Coalco filed a complaint in state court which was removed to the United States District Court for the District of Massachusetts, alleging that Headwaters breached its agreements to pay certain fees to Coalco. Coalco seeks damages in the principal amount plus interest totaling approximately $27.4 million, plus attorneys’ fees, and other costs. Pelletco joined the complaint with Coalco, both seeking declaratory judgment as to their rights and obligations under the various agreements. Headwaters filed an answer denying the allegations of the complaint. Headwaters also filed a counterclaim against the plaintiffs and their principals claiming breach of contract and related claims for failure to pay the $3.8 million due from Pelletco to Headwaters. The parties have filed cross-motions for summary judgment which could be resolved in December 2009. Trial is scheduled to begin in March 2010. Because the resolution of the litigation is uncertain, legal counsel and management cannot express an opinion as to the ultimate amount, if any, of Headwaters’ liability. Although the merits of Coalco and Pelletco’s claims against Headwaters will be determined in due legal course, management currently believes that the $3.8 million owed to Headwaters from Pelletco is due and collectible.
J. Hall Inc. In June 2009, J. Hall, Inc. (Hall) and RC Trucking, Inc. (RC) filed a complaint against Covol Fuels No. 3, LLC (“Covol”) (a subsidiary of Headwaters), Yukon Coal Company, LLC, Suburban
28
Table of Contents
Coal Sales, LLC, and Century Coal, LLC (collectively, Yukon) in Bell County Circuit Court in the Commonwealth of Kentucky. The complaint alleges that Hall and RC obtained or brokered coal on behalf of Yukon which was then sold by Yukon to Covol. Allegedly, Yukon never paid Hall and RC for the coal. Hall and RC named Covol as a party to the suit claiming that Covol is an alter ego of Yukon and that Covol and Yukon are engaged in a joint venture or partnership in the operation of Covol’s coal cleaning facility located near Beverly, Kentucky. Hall and RC have asserted claims against Covol for breach of contract, unjust enrichment, and right of offset against Covol for monies owed by Hall and RC to Covol. Hall and RC are seeking damages of $0.7 million. Covol filed counterclaims against Hall and RC for breach of contract, or in the alternative, unjust enrichment for plaintiffs’ failure to pay for coal sold by Covol to Hall and RC in separate transactions. Covol seeks damages against Hall in the amount of $0.6 million. Covol also seeks monetary damages against RC for amounts less than $0.1 million. Although the merits of Hall’s and RC’s claims against Covol will be determined in due legal course, management currently believes that the $0.6 million owed to Covol from Hall and RC is due and collectible.
Fentress Families Trust. VFL Technology Corporation (VFL), acquired by HRI in 2004, provides services related to fly ash disposal to Virginia Electric and Power Company. Approximately 395 plaintiffs, most of whom are homeowners living in the City of Chesapeake, Virginia, filed a complaint in March 2009 in the State of Virginia Chesapeake Circuit Court against 16 named defendants, including Virginia Electric and Power Company, certain persons associated with the Battlefield Golf Course, including the owner, developer, and contractors, and others, including VFL and Headwaters. The complaint alleges that fly ash used to construct the golf course has contaminated area ground water exposing plaintiffs to toxic chemicals and causing property damage. The complaint alleges multiple causes of action and seeks a new water system, monitoring costs, site clean-up, and other damages totaling approximately $1.8 billion, including certain injunctive relief. A second lawsuit was filed in August 2009 and has been consolidated with the first action where approximately 62 plaintiffs have sued essentially the same defendants, alleging similar claims and requests for damages, in excess of $1.5 billion. The consolidated case is at an early stage of investigation and pleadings by the parties. Because resolution of the litigation is uncertain, legal counsel and management cannot express an opinion as to the ultimate amount, if any, of Headwaters’ liability.
Redbird Mountain Coal Company. In December 2008, Covol Fuels No. 3, LLC, one of our subsidiaries, and Yukon Coal Company, LLC, an affiliate of Redbird Mountain Coal Company, LLC, entered into an Amended and Restated Coal Purchase and Refuse Recovery Agreement (“Amended Purchase Agreement”), pursuant to which Covol spent in excess of $25.0 million to construct an on-site coal processing facility on land leased to Redbird by Asher Land and Mineral, LLP. Following a bankruptcy filing by Redbird in June 2009 in the United States Bankruptcy Court for the Eastern District of Kentucky, Redbird marketed the sale of its lease to the land that includes the on-site coal processing facility, claiming the leasehold interest included the coal processing facility. In July 2009, Covol filed an adversary proceeding before the bankruptcy court seeking declaratory judgment that it has exclusive ownership of the on-site coal processing facility, and in the alternative a claim for unjust enrichment against Redbird and Asher. Asher subsequently filed a counterclaim seeking a declaration that Covol has no right or interest in the coal processing facility or that Asher has a perfected security interest. Redbird filed a motion with the bankruptcy court seeking to reject the Amended Purchase Agreement. Trial is scheduled to begin in January 2010. Because resolution of the litigation is uncertain, legal counsel and management cannot express an opinion as to the ultimate amount, if any, of Headwaters’ liability.
Archstone. Archstone owns an apartment complex in Westbury, New York. Archstone alleges that moisture penetrated the building envelope and damaged moisture sensitive parts of the buildings which began to rot and grow mold. In 2008, Archstone evicted its tenants and began repairing the twenty-one apartment buildings. In January 2008, Archstone filed a complaint in the Nassau County Supreme Court of the State of New York against the prime contractor and its performance bond surety, the designer, and Eldorado Stone, LLC which supplied architectural stone that was installed by others during construction. The prime contractor then sued over a dozen subcontractors who in turn sued others. Archstone claims as damages approximately $36.0 million in repair costs, $15.0 million in lost lease payments, prejudgment
29
Table of Contents
interest, and an unknown amount for liabilities to tenants who have sued Archstone. Eldorado Stone answered denying liability and tendered the matter to its insurers who are paying for the defense of the case. Because the resolution of the action is uncertain, legal counsel and management cannot express an opinion concerning the likely outcome of this matter, the liability of Eldorado Stone, if any, or the insurers’ obligation to indemnify Eldorado Stone against loss, if any.
Headwaters Building Products Matters. There are litigation and pending and threatened claims made against certain subsidiaries of Headwaters Building Products (“HBP”), a division within our light building products segment, with respect to several types of exterior finish systems manufactured and sold by its subsidiaries for application by contractors on residential and commercial buildings. Typically, litigation and these claims are defended by such subsidiaries’ insurance carriers. The plaintiffs or claimants in these matters have alleged that the structures have suffered damage from latent or progressive water penetration due to some alleged failure of the building product or wall system. Some claims involve alleged defects associated with components of an Exterior Insulating and Finish System (“EIFS”) which was produced for a limited time (through 1997) by the HBP subsidiaries. There is a 10-year projected claim period following discontinuation of the product. Other claims involve alleged liabilities associated with certain stucco and architectural stone products which are produced and sold by certain subsidiaries of HBP.
Typically, the claims cite damages for alleged personal injuries and punitive damages for alleged unfair business practices in addition to asserting more conventional damage claims for alleged economic loss and damage to property. To date, claims made against such subsidiaries have been paid by their insurers, with the exception of minor deductibles or self-insured retentions, although such insurance carriers typically have issued “reservation of rights” letters. While, to date, none of these proceedings have required that HBP incur substantial costs, there is no guarantee of insurance coverage or continuing coverage. These and future proceedings may result in substantial costs to HBP, including attorneys’ fees, managerial time and other personnel resources and costs. Adverse resolution of these proceedings could have a materially negative effect on HBP’s business, financial condition, and results of operation, and its ability to meet its financial obligations. Although HBP carries general and product liability insurance, HBP cannot assure that such insurance coverage will remain available, that HBP’s insurance carrier will remain viable, or that the insured amounts will cover all future claims in excess of HBP’s uninsured retention. Future rate increases may also make such insurance uneconomical for HBP to maintain. In addition, the insurance policies maintained by HBP exclude claims for damages resulting from exterior insulating finish systems, or EIFS, that have manifested after March 2003. Because resolution of the litigation and claims is uncertain, legal counsel and management cannot express an opinion as to the ultimate amount, if any, of HBP’s liability.
Other. We have ongoing litigation and claims incurred during the normal course of business, including the items referred to above. We intend to vigorously defend and/or pursue our rights in these actions. We do not currently believe that the outcome of these actions will have a material adverse effect on our operations, cash flows or financial position; however, it is possible that a change in the estimates of probable liability could occur, and the change could be significant.
We have significant competition in our industries which may cause demand for our products and services to decrease.
We experience significant competition in all of our segments and geographic regions. A failure to compete effectively or increased competition could lead to price cuts, reduced gross margins and loss of market share, which could decrease our profitability. Many of our competitors have greater financial, management and other resources than we have and may be able to take advantage of acquisitions and other opportunities more readily. In certain instances we must compete on the basis of superior products and services rather than price, thereby increasing the costs of marketing our services to remain competitive. See “Business,” for more information on the competition faced by us in each of our segments.
30
Table of Contents
Our business strategy to diversify and grow through acquisitions may result in integration costs and poor performance.
An important aspect of our business strategy in the past has been diversification and growth through acquisitions of products or complementary businesses. While our October 2009 asset based revolving loan agreement (“ABL Revolver”) and our October 2009 11-3/8% senior secured notes (“Senior Notes”) will limit our ability to engage in acquisitions, to the extent we engage in acquisitions, our ability to successfully implement the transactions is subject to a number of risks, including difficulties in identifying acceptable acquisition candidates, consummating acquisitions on favorable terms and obtaining adequate financing, which may adversely affect our ability to develop new products and services and to compete in our markets.
If we do not successfully integrate newly acquired businesses with our existing businesses, we may not realize the expected benefits of the acquisitions, and the resources and attention required for successful integration may interrupt the business activities of acquired businesses and our existing businesses. Successful management and integration of acquisitions are subject to a number of risks, including difficulties in assimilating acquired operations, loss of key employees, diversion of management’s attention from core business operations, assumption of contingent liabilities, incurrence of potentially significant write-offs, and various employee issues, such as issues related to human resource benefit plans, and an increase in employment and discrimination claims and claims for workers’ compensation. Each business acquisition also requires us to expand our operational and financial systems, which increases the complexity of our information technology systems. Implementation of controls, systems and procedures may be costly and time-consuming and may not be effective.
If our internal controls over financial reporting under Section 404 of the Sarbanes-Oxley Act are not adequate, our reputation could be harmed and we could be subject to regulatory scrutiny, civil or criminal penalties or stockholder litigation.
Section 404 of the Sarbanes-Oxley Act of 2002 (the “Sarbanes-Oxley Act”) requires that we evaluate and report on our system of internal controls. If we fail to maintain the adequacy of our internal controls, we could be subject to regulatory scrutiny, civil or criminal penalties or stockholder litigation. Any inability to provide reliable financial reports could harm our business. Section 404 of the Sarbanes-Oxley Act also requires that our independent auditors report on our system of internal controls. We have documented and tested our system of internal controls to provide the basis for our reports in our relevant filings with the SEC. The growth and diversification of our business through acquisitions complicates the process of developing, documenting, maintaining and testing internal controls. No assurance can be given that in the future there may not be significant deficiencies or material weaknesses that would be required to be reported.
Unauthorized use of or infringement claims regarding our proprietary intellectual property could adversely affect our ability to conduct our business.
We rely primarily on a combination of trade secrets, patents, copyright and trademark laws and confidentiality procedures to protect our intellectual property. Despite these precautions, unauthorized third parties may misappropriate, infringe upon, copy or reverse engineer portions of our technology or products. We do not know if current or future patent applications will be issued with the scope of the claims sought, if at all, or whether any patents issued will be challenged or invalidated. Our business could be harmed if we infringe upon the intellectual property rights of others. We have been, and may be in the future, notified that we may be infringing intellectual property rights possessed by third parties. If any such claims are asserted against us, we may seek to enter into royalty or licensing arrangements. There is a risk in these situations that no license will be available or that a license will not be available on reasonable terms, precluding our use of the applicable technology. Alternatively, we may decide to litigate such claims or attempt to design around the patented technology. To date, while no single patent or trademark is material to our business and the issues described in this paragraph have not resulted in significant cost or had an adverse impact on our business, future actions could be costly and would divert the efforts and attention of our management and technical personnel.
31
Table of Contents
We are dependent on certain key personnel, the loss of whom could materially affect our financial performance and prospects.
Our continued success depends to a large extent upon the continued services of our senior management and certain key employees. Each member of our senior management team has substantial experience and expertise in our industry and has made significant contributions to our growth and success. We do face the risk, however, that members of our senior management may not continue in their current positions and the loss of the services of any of these individuals could cause us to lose customers and reduce our net sales, lead to employee morale problems and/or the loss of key employees, or cause disruptions to our production. Also, we may be unable to find qualified individuals to replace any of the senior executive officers who leave our company.
Fluctuations in the value of currency may negatively affect our revenue and earnings.
Doing business internationally exposes us to risks related to the value of one currency compared to another. For example, some of our revenues are generated by sales of goods produced in the U.S. to buyers in foreign countries, and we have a joint venture with a plant located in South Korea. If the U.S. dollar strengthens relative to the currency of foreign purchasers, the relative cost of our goods to such purchasers may go up, and the demand for our products may decrease, reducing our revenues. Also, in cases where our debt or other obligations are in currencies different than the currency in which we earn revenue, we may lose money as a result of fluctuations in the exchange rates, decreasing our earnings.
Risks Related to our Common Stock
The price of our common stock historically has been volatile. This volatility may affect the price at which you could sell your common stock, and the sale of substantial amounts of our common stock could adversely affect the price of our common stock.
The market price for our common stock has varied between a high of $10.75 in November 2008 and a low of $1.22 in March 2009 in the twelve month period ended October 31, 2009. This volatility may affect the price at which you could sell your common stock, and the sale of substantial amounts of our common stock could adversely affect the price of our common stock. Our stock price is likely to continue to be volatile and subject to significant price and volume fluctuations in response to market and other factors, including the other factors discussed in “Risks Relating to Our Business;” variations in our quarterly operating results from our expectations or those of securities analysts or investors; downward revisions in securities analysts’ estimates; and announcement by us or our competitors of significant acquisitions, strategic partnerships, joint ventures or capital commitments.
In the past, following periods of volatility in the market price of their stock, many companies have been the subject of securities class action litigation. If we became involved in securities class action litigation in the future, it could result in substantial costs and diversion of our management’s attention and resources and could harm our stock price, business, prospects, results of operations and financial condition.
In addition, the broader stock market has experienced significant price and volume fluctuations in recent months and years. This volatility has affected the market prices of securities issued by many companies for reasons unrelated to their operating performance and may adversely affect the price of our common stock. In addition, our announcements of our quarterly operating results, changes in general conditions in the economy or the financial markets and other developments affecting us, our affiliates or our competitors could cause the market price of our common stock to fluctuate substantially.
In addition, the sale of substantial amounts of our common stock could adversely impact our stock price. As of September 30, 2009, we had outstanding approximately 60.2 million shares of our common stock and options to purchase approximately 1.8 million shares of our common stock (of which approximately 1.8 million were exercisable as of that date). We also had outstanding approximately 1.9 million stock appreciation rights as of September 30, 2009, of which approximately 1.0 million were exercisable. The sale or the availability for sale of a large number of shares of our common stock in the public market could cause the price of our common stock to decline.
32
Table of Contents
We have never paid dividends and do not anticipate paying any dividends on our common stock in the future, so any short-term return on your investment will depend on the market price of our capital stock.
We currently intend to retain any earnings to finance our operations and growth. The terms and conditions of our senior secured credit facility restrict and limit payments or distributions in respect of our capital stock.
Delaware law and our charter documents may impede or discourage a takeover, which could cause the market price of our shares to decline.
We are a Delaware corporation, and the anti-takeover provisions of Delaware law impose various impediments to the ability of a third party to acquire control of us, even if a change in control would be beneficial to our existing stockholders. In addition, our board of directors has the power, without stockholder approval, to designate the terms of one or more series of preferred stock and issue shares of preferred stock, including the adoption of a “poison pill,” which could be used defensively if a takeover is threatened. The ability of our board of directors to create and issue a new series of preferred stock and certain provisions of Delaware law and our certificate of incorporation and bylaws could impede a merger, takeover or other business combination involving us or discourage a potential acquirer from making a tender offer for our common stock, which, under certain circumstances, could reduce the market price of our common stock.
Risks Relating to Our Indebtedness
We have a substantial amount of indebtedness, which could have a material adverse effect on our financial condition and our ability to obtain financing in the future and to react to changes in our business.
We have a substantial amount of debt, which requires significant principal and interest payments. As of October 31, 2009, we have approximately $524.8 million face value of debt outstanding, including $328.3 million outstanding principal amount under the Senior Notes issued by us in October 2009 and $196.5 million outstanding principal amount of our convertible subordinated notes. We also expect to have $70.0 million of undrawn availability, subject to a borrowing base limitation, under the ABL Revolver entered into in October 2009.
Our significant amount of debt could have important consequences. For example, it could:
| • | make it more difficult for us to satisfy our obligations under the notes and the ABL Revolver; |
| • | increase our vulnerability to adverse economic and general industry conditions, including interest rate fluctuations, because a portion of our borrowings, including those under the ABL Revolver, are and will continue to be at variable rates of interest; |
| • | require us to dedicate a substantial portion of our cash flow from operations to payments on our debt, which would reduce the availability of our cash flow from operations to fund working capital, capital expenditures or other general corporate purposes; |
| • | limit our flexibility in planning for, or reacting to, changes in our business and industry; |
| • | place us at a disadvantage compared to competitors that may have proportionately less debt; |
| • | limit our ability to obtain additional debt or equity financing due to applicable financial and restrictive covenants in our debt agreements; and |
| • | increase our cost of borrowing. |
Despite our current indebtedness levels, we and our subsidiaries may still incur significant additional indebtedness. Incurring more indebtedness could increase the risks associated with our substantial indebtedness.
We and our subsidiaries may be able to incur substantial additional indebtedness, including additional secured indebtedness, in the future. The terms of the Senior Notes indenture and our ABL Revolver will restrict,
33
Table of Contents
but will not completely prohibit, us from doing so. We have $70.0 million of undrawn availability under the ABL Revolver, subject to borrowing base limitations. In addition, the indenture will allow us to issue additional senior secured notes under certain circumstances which will also be guaranteed by our subsidiary guarantors. If new debt or other liabilities are added to our current debt levels, the related risks that we and our subsidiaries now face could intensify.
If we default under the ABL Revolver, Senior Notes or other indebtedness, we may not be able to service our debt obligations.
In the event of a default under the ABL Revolver, Senior Notes or other indebtedness, lenders could elect to declare amounts borrowed, together with accrued and unpaid interest and other fees, to be due and payable. If such acceleration occurs, thereby permitting an acceleration of amounts outstanding under other debt obligations, we may not be able to repay the amounts due. Events of default are separately defined in each loan agreement or indenture, but include events such as failure to make payments when due, breach of covenants, default under certain other indebtedness, failure to satisfy judgments, certain insolvency events and, in the case of the ABL Revolver, the occurrence of a material adverse effect. The occurrence of an event of default could have serious consequences to our financial condition and results of operations, and could cause us to become bankrupt or insolvent.
We may not be able to generate sufficient cash to service all of our indebtedness and may be forced to take other actions to satisfy our obligations under our indebtedness, which may not be successful.
Our ability to make scheduled payments on or to refinance our debt obligations depends on our financial condition and operating performance, which is subject to prevailing economic and competitive conditions and to certain financial, business and other factors beyond our control. We will also be required to obtain the consent of the lenders under the ABL Revolver to refinance material portions of our indebtedness. We cannot assure you that we will maintain a level of cash flows from operating activities sufficient to permit us to pay the principal, premium, if any, and interest on our indebtedness, including our notes.
If our cash flows and capital resources are insufficient to fund our debt service obligations, we may be forced to reduce or delay investments and capital expenditures, or to sell assets, seek additional capital or restructure or refinance our indebtedness. These alternative measures may not be successful and may not permit us to meet our scheduled debt service obligations. If our operating results and available cash are insufficient to meet our debt service obligations, we could face substantial liquidity problems and might be required to dispose of material assets or operations to meet our debt service and other obligations. We may not be able to consummate those dispositions or to obtain the proceeds that we could realize from them, and these proceeds may not be adequate to meet any debt service obligations then due. Additionally, our debt agreements limit the use of the proceeds from any disposition; as a result, we may not be allowed, under these documents, to use proceeds from such dispositions to satisfy all current debt service obligations.
We are a holding company with no independent operations or assets. Repayment of our indebtedness is dependent on cash flow generated by our subsidiaries.
Headwaters Incorporated is a holding company and repayment of our indebtedness will be dependent upon cash flow generated by our subsidiaries and their ability to make such cash available to us, by dividend, debt repayment or otherwise. Unless they are guarantors of the Senior Notes, our subsidiaries do not have any obligation to pay amounts due on the notes or to make funds available for that purpose. Our subsidiaries may not be able to, or be permitted to, make distributions to enable us to make payments in respect of our indebtedness. For instance, if there is a default under the ABL Revolver, the ABL Borrowers will not be permitted to transfer funds to us to pay our notes. Each of our subsidiaries is a distinct legal entity and, under certain circumstances, legal and contractual restrictions may limit our ability to obtain cash from our subsidiaries. While the indenture governing the Senior Notes limits the ability of our subsidiaries to restrict the payment of dividends or make
34
Table of Contents
other intercompany payments to us, these limitations are subject to certain qualifications and exceptions. In the event that we do not receive distributions from our subsidiaries, we may be unable to make required principal and interest payments on our indebtedness, including our notes.
The indenture governing the Senior Notes and the credit agreement governing the ABL Revolver impose significant operating and financial restrictions on us and our subsidiaries, which may prevent us from capitalizing on business opportunities.
The credit agreement governing the ABL Revolver and the indenture governing the Senior Notes impose significant operating and financial restrictions on us. These restrictions limit our ability, among other things, to:
| • | incur additional indebtedness or issue certain disqualified stock and preferred stock; |
| • | pay dividends or certain other distributions on our capital stock or repurchase our capital stock; |
| • | make certain investments or other restricted payments; |
| • | place restrictions on the ability of our restricted subsidiaries to pay dividends or make other payments to us; |
| • | engage in transactions with affiliates; |
| • | sell certain assets or merge with or into other companies; |
| • | guarantee indebtedness; and |
| • | create liens. |
When (and for as long as) the availability under the ABL Revolver is less than a specified amount for a certain period of time, funds deposited into deposit accounts used for collections will be transferred on a daily basis into a blocked account with the administrative agent and applied to prepay loans under the ABL Revolver.
As a result of these covenants and restrictions, we will be limited in how we conduct our business and we may be unable to raise additional debt or equity financing to compete effectively or to take advantage of new business opportunities. The terms of any future indebtedness we may incur could include more restrictive covenants. We cannot assure you that we will be able to maintain compliance with these covenants in the future and, if we fail to do so, that we will be able to obtain waivers from the lenders and/or amend the covenants.
There are limitations on our ability to incur the full $70.0 million of commitments under the ABL Revolver. Borrowings under our ABL Revolver will be limited by a specified borrowing base consisting of a percentage of eligible accounts receivable and inventory, less customary reserves. In addition, under the ABL Revolver, a monthly fixed charge maintenance covenant would become applicable if excess availability under the ABL Revolver is at any time less than a specified percentage not to exceed 50% of the total revolving loan commitments. If the covenant trigger were to occur, the ABL Borrowers would be required to satisfy and maintain on the last day of each month a fixed charge coverage ratio of at least (i) 1.0x for the last twelve-month period for each month ending on or prior to December 31, 2010 and (ii) 1.1x for the last twelve-month period for each month ending after December 31, 2010. Our ability to meet the required fixed charge coverage ratio can be affected by events beyond our control, and we cannot assure you that we will meet this ratio. A breach of any of these covenants could result in a default under the ABL Revolver.
Moreover, the ABL Revolver provides the lenders considerable discretion to impose reserves, which could materially impair the amount of borrowings that would otherwise be available to us. There can be no assurance that the lenders under the ABL Revolver will not impose such actions during the term of the ABL Revolver and further, were they to do so, the resulting impact of this action could materially and adversely impair our ability to make interest payments on our notes.
35
Table of Contents
| ITEM 1B. | UNRESOLVED STAFF COMMENTS |
None.
| ITEM 2. | PROPERTIES |
Our headquarters are located at 10653 South River Front Parkway, Suite 300, South Jordan, Utah 84095. The lease for this office space of approximately 39,000 square feet has a term expiring December 2013. The monthly rent is approximately $69,000, with certain adjustments for inflation plus expenses.
As of September 30, 2009, HBP owns or leases 28 properties nationwide for its building products manufacturing, distribution, and sales operations. HBP is headquartered in Wixom, Michigan and has major manufacturing facilities in Metamora, Michigan, Elkland, Pennsylvania, and Greencastle, Pennsylvania.
As of September 30, 2009, HRI owns or leases 14 properties nationwide for its fly ash storage and distribution operations with East, Central, and West regional divisions. HRI also conducts operations at more than 90 other sites via rights granted in various CCP through-put, handling and marketing contracts (for example, operating a storage or load-out facility located on utility-owned properties).
HES directs its operations primarily from our South Jordan, Utah offices. HES maintains coal cleaning facilities on properties near Wellington, Utah, Adger and Brookwood Alabama, Greenville and Beverly Kentucky, Pineville, West Virginia, Brazil, Indiana as well as an ethanol facility near Underwood, North Dakota pursuant to lease or processing agreements. HTI owns approximately six acres in Lawrenceville, New Jersey where it maintains its principal office and research facility.
| ITEM 3. | LEGAL PROCEEDINGS |
The information set forth under the caption “Legal Matters” in Note 12 to the consolidated financial statements in Item 8 of this Form 10-K is incorporated herein by reference.
| ITEM 4. | SUBMISSION OF MATTERS TO A VOTE OF SECURITY HOLDERS |
None.
36
Table of Contents
PART II
| ITEM 5. | MARKET FOR REGISTRANT’S COMMON EQUITY, RELATED STOCKHOLDER MATTERS AND ISSUER PURCHASES OF EQUITY SECURITIES |
The shares of our common stock trade on the New York Stock Exchange under the symbol HW. Options on our common stock are traded on the Chicago Board Options Exchange under the symbol HQK. The following table sets forth the low and high trading prices of our common stock as reported by the New York Stock Exchange for 2008 and 2009.
| Fiscal 2008 |
Low | High | ||||
| Quarter ended December 31, 2007 |
$ | 10.96 | $ | 15.85 | ||
| Quarter ended March 31, 2008 |
8.80 | 14.00 | ||||
| Quarter ended June 30, 2008 |
9.96 | 15.35 | ||||
| Quarter ended September 30, 2008 |
9.26 | 16.40 | ||||
| Fiscal 2009 |
||||||
| Quarter ended December 31, 2008 |
$ | 3.92 | $ | 13.48 | ||
| Quarter ended March 31, 2009 |
1.22 | 7.93 | ||||
| Quarter ended June 30, 2009 |
2.22 | 5.08 | ||||
| Quarter ended September 30, 2009 |
2.66 | 4.72 | ||||
37
Table of Contents
The following graph shows a comparison of the cumulative total stockholder return, calculated on a dividend reinvestment basis, for September 30, 2004 through September 30, 2009, on our Common Stock with the New York Stock Exchange Composite Index and the Dow Jones US Building Materials & Fixtures TSM Index. The comparison assumes $100 was invested on September 30, 2004. Historic stock price performance shown on the graph is not indicative of future price performance.
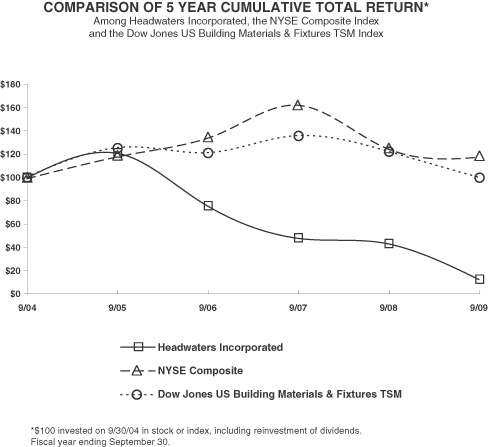
As of October 31, 2009 there were 478 stockholders of record of our common stock. We have not paid dividends on our common stock to date and do not intend to pay dividends in the foreseeable future. Pursuant to the terms of our debt agreements (see Note 6 to the consolidated financial statements), we are prohibited from paying cash dividends. We intend to retain earnings to finance the development and expansion of our business. Payment of common stock dividends in the future will depend upon our debt covenants, our ability to generate earnings, our need for capital, our investment opportunities and our overall financial condition, among other things.
The information required by this item regarding equity compensation plans is incorporated by reference to the information set forth in Item 12 of this Annual Report on Form 10-K. See Note 9 to the consolidated financial statements for a description of securities authorized for issuance under equity compensation plans.
We did not make any unregistered sales of our equity securities during the year ended September 30, 2009. We did not repurchase any shares of our equity securities during the fourth quarter of the year ended September 30, 2009.
38
Table of Contents
| ITEM 6. | SELECTED FINANCIAL DATA |
The following selected financial data are derived from our consolidated financial statements. This information should be read in conjunction with the consolidated financial statements, related notes and other financial information included in this Form 10-K. The selected financial data as of and for the years ended September 30, 2005 and 2006 and as of September 30, 2007 are derived from audited financial statements not included in this Form 10-K. The selected financial data as of September 30, 2008 and 2009 and for the years ended September 30, 2007, 2008, and 2009 were derived from our audited financial statements included in this Form 10-K.
As described in Note 11 to the consolidated financial statements, we acquired one company in each of 2007 and 2008. The results of operations for these companies for the periods from the acquisition dates through September 30, 2009 have been consolidated with our results. None of their results of operations up to the dates of acquisition have been included in our consolidated results.
In 2005, we successfully settled certain litigation which resulted in increased operating income, primarily related to prior periods, of approximately $52.4 million. Also in 2005, we early adopted the fair value method of accounting for stock-based compensation required by Accounting Standards Codification (ASC) Topic 718 Compensation—Stock Compensation (originally issued as SFAS No. 123 (revised 2004), “Share-Based Payment”) and recorded approximately $33.8 million of stock-based compensation expense, most of which was of a non-recurring nature. In 2007, we recognized tax credit-based license fee revenue totaling approximately $31.5 million, most of which related to prior periods (see Note 12 to the consolidated financial statements). In 2007, 2008 and 2009, we recorded impairments of goodwill of $98.0 million, $205.0 million and $465.7 million, respectively (see Note 5 to the consolidated financial statements).
| Year ended September 30, | |||||||||||||||||
| (in thousands, except per share data) |
2005 | 2006 | 2007 | 2008 | 2009 | ||||||||||||
| OPERATING DATA: |
|||||||||||||||||
| Total revenue |
$ | 1,064,639 | $ | 1,121,387 | $ | 1,207,844 | $ | 886,404 | $ | 666,676 | |||||||
| Net income (loss) |
121,278 | 102,058 | 20,054 | (169,680 | ) | (415,550 | ) | ||||||||||
| Diluted earnings (loss) per share |
2.79 | 2.19 | 0.47 | (4.10 | ) | (9.59 | ) | ||||||||||
| As of September 30, | |||||||||||||||||
| (in thousands) |
2005 | 2006 | 2007 | 2008 | 2009 | ||||||||||||
| BALANCE SHEET DATA: |
|||||||||||||||||
| Working capital |
$ | 117,336 | $ | 145,296 | $ | 163,394 | $ | 124,657 | $ | 98,441 | |||||||
| Net property, plant and equipment |
190,450 | 213,406 | 225,700 | 304,835 | 321,316 | ||||||||||||
| Total assets |
1,671,656 | 1,661,729 | 1,655,889 | 1,401,986 | 891,924 | ||||||||||||
| Long-term liabilities: |
|||||||||||||||||
| Long-term debt |
601,811 | 587,820 | 542,500 | 532,500 | 456,342 | ||||||||||||
| Deferred income taxes |
108,449 | 96,972 | 91,721 | 87,026 | 15,190 | ||||||||||||
| Other |
37,345 | 11,238 | 6,416 | 35,179 | 27,706 | ||||||||||||
| Total long-term liabilities |
747,605 | 696,030 | 640,637 | 654,705 | 499,238 | ||||||||||||
| Total stockholders’ equity |
686,313 | 800,958 | 830,250 | 631,552 | 304,431 | ||||||||||||
39
Table of Contents
| ITEM 7. | MANAGEMENT’S DISCUSSION AND ANALYSIS OF FINANCIAL CONDITION AND RESULTS OF OPERATIONS |
The following discussion and analysis should be read in conjunction with the information set forth under the caption entitled “ITEM 6. SELECTED FINANCIAL DATA” and the consolidated financial statements and related notes included in this Form 10-K. Our fiscal year ends on September 30 and unless otherwise noted, references to years refer to our fiscal year rather than a calendar year.
Overview
Consolidation and Segments. The consolidated financial statements include the accounts of Headwaters, all of our subsidiaries, and other entities in which we have a controlling interest. All significant intercompany transactions and accounts are eliminated in consolidation. We made one acquisition in 2007 and one acquisition in 2008. These entities’ results of operations for the periods from the acquisition dates through September 30, 2009 have been consolidated with our results; their operations prior to the dates of acquisition have not been included in the consolidated results for any period.
We currently operate in three industries: light building products (formerly referred to as building products), heavy construction materials (formerly referred to as coal combustion products, or CCPs) and energy technology (formerly referred to as energy). In the light building products segment, we design, manufacture, and sell manufactured architectural stone, exterior siding accessories (such as shutters, mounting blocks, and vents), concrete block and other building products. Revenues consist of product sales to wholesale and retail distributors, contractors and other users of building products. We are a nationwide leader in the management and marketing of CCPs, including fly ash used as a replacement for portland cement. Revenues in the heavy construction materials segment consist primarily of CCP product sales with a smaller amount of service revenue. In the energy technology segment, we are focused on reducing waste and increasing the value of energy-related feedstocks, primarily in the areas of low-value coal and oil. Revenues for the energy technology segment through December 31, 2007 consisted primarily of sales of chemical reagents and license fees related to our former Section 45K business. Beginning January 1, 2008, revenues for this segment consisted primarily of coal sales.
Operations and Strategy. During the past several years, we have executed our two-fold plan of maximizing cash flow from our existing operating business units and diversifying from significant reliance on the legacy energy technology segment Section 45K business. Our historical acquisition strategy has targeted businesses that are leading companies in their respective industries and that have strong operating margins, thus providing additional cash flow that complements the financial performance of our existing businesses. With the addition and expansion of our CCP management and marketing business through acquisitions beginning in 2002, and the growth of our light building products business through several acquisitions beginning in 2004, we have achieved revenue growth and diversification in three business segments. In 2005 and subsequent years, we focused on the integration of our large 2004 acquisitions, including the marketing of diverse kinds of building products through our national distribution network. In 2006, we began to acquire small companies in the light building products industry with innovative products that could be marketed using our existing distribution channels.
During 2008 and 2009, our primary focus has been on the development of our coal cleaning business and our primary use of cash consisted of maintenance and growth capital expenditures, a major portion of which related to our coal cleaning facilities in the energy technology segment. In late 2008 and in 2009, as the economy deteriorated, we focused on cost savings and strengthening our balance sheet. We engaged in significant cost savings in our light building products segment by reducing advertising, employee and transportation expenses. Our Continuous Improvement Initiative within our heavy construction materials segment has focused on reducing our cost structure through process improvements, headcount reductions, lower maintenance spending and improved terms on operating leases. We consolidated management of our heavy construction materials business and our coal cleaning business to reduce overhead. We also significantly reduced corporate and research and development spending. At the same time, we sought to reduce indebtedness by convertible note exchanges for new convertible debt at reduced principal amounts and for common stock, and repaid $34.5 million of our former senior secured debt from proceeds of the sale of common stock.
40
Table of Contents
In October 2009, we issued new senior secured notes aggregating approximately $328.3 million, for net proceeds of approximately $317.0 million. We used approximately $260.0 million of the proceeds to repay all of our obligations under the former senior secured credit facility and virtually all of our outstanding 2.875% convertible senior subordinated notes. Also in October 2009, we entered into a $70.0 million asset based revolving loan facility (ABL Revolver) that is currently undrawn.
Light Building Products Segment. The key strategic element of our building products strategy is to introduce new products into our extensive distribution system, providing us an outlet to rapidly increase geographic coverage for our products. Our light building products segment has been significantly affected by the depressed new housing and residential remodeling markets. Accordingly, we are significantly reducing operating costs to be positively positioned to take advantage of a future industry turnaround, which we believe could begin in 2010. We continue to develop new building products and to leverage our robust distribution system which we believe is a competitive advantage for us.
There has been a severe slowing in 2007 through 2009 of new housing starts and in home sales generally. Bank foreclosures have put a large number of homes into the market for sale, effectively limiting some of the incentives to build new homes. The homebuilding industry continues to experience a significant and sustained decrease in demand for new homes and an oversupply of new and existing homes available for sale. While our residential building products business relies upon the home improvement and remodeling markets as well as new construction, we experienced a further slowdown in sales activity in 2009. Interest rate increases, limits on credit availability, further foreclosures, home price depreciation, and an oversupply of homes for sale in the market may adversely affect homeowners’ and/or homebuilders’ ability or desire to engage in construction or remodeling, resulting in a continued or further slowdown in new construction or remodeling and repair activities.
We, like many others in the light building products industry, experienced a large drop in orders and a reduction in our margins in 2008 and 2009 relative to prior years. In 2007, 2008 and 2009, we have recorded significant goodwill impairments associated with our light building products business. None of the impairment charges in these years affected our cash position, cash flow from operating activities or debt covenant compliance. We can provide no assurances that the light building products market will improve in the near future. Some recent industry reports suggest that the national home construction trend may be at or near the end of its decline. However, we expect weakness to continue into the earlier part of 2010 and expect improved market conditions in the second half of 2010 based on current housing market forecasts showing the start of a housing recovery at such time.
The financial crisis affecting the banking system and financial markets and the going concern threats to banks and other financial institutions have resulted in a tightening in the credit markets, a low level of liquidity in many financial markets, including mortgages and home equity loans, and extreme volatility in credit and equity markets. Continued tightness of mortgage lending or mortgage financing requirements could adversely affect the availability of credit for purchasers of our products and thereby reduce our sales. There could be a number of follow-on effects from the credit crisis on our business, including the inability of prospective homebuyers or remodelers to obtain credit for financing the purchase of our building products. These and other similar factors could cause decisions to delay or forego new home construction or improvement projects, cause our customers to delay or decide not to purchase our building products, or lead to a decline in customer transactions and our financial performance.
Heavy Construction Materials Segment. Our business strategy in the heavy construction materials industry is to negotiate long-term contracts with suppliers, supported by investment in transportation and storage infrastructure for the marketing and sale of CCPs. We are also continuing our efforts to expand the use of high-value CCPs, develop more uses for lower-value CCPs, and expand our CCP disposal services. While all of our businesses have been affected by the current recession, the impact on our heavy construction materials segment has been less severe than on our other segments. We anticipate that if the federal government expands its funding
41
Table of Contents
of roads, bridges, and other infrastructure projects as a part of its economic stimulus program, this should improve the demand for CCPs in the future. Finally, a key element of our strategy is to increase our service revenue generated from CCP management.
Energy Technology Segment. We own and operate newly-constructed and recently-renovated coal cleaning facilities that remove impurities from waste and other low value coal, resulting in higher-value, marketable coal. Construction of these facilities is now complete, but it was our largest single investment of cash during 2008 and 2009. Capital expenditures in 2008 and 2009 were financed primarily with available cash from operations and lease financing. Capital expenditures in 2010 and future years are expected to be significantly lower than in 2008 and 2009.
For 2009, coal sales were $58.1 million, compared to $38.7 million for 2008. Despite this growth in coal sales from 2008 to 2009, there has been a rapid decline in demand and pricing for coal from 2008 to 2009, especially metallurgical grade coal. In addition, we have experienced high start-up costs and operational challenges as we have finished construction and renovation activities and commenced operations at many facilities in a short period of time. As of September 30, 2009, we have temporarily curtailed operations at four of our coal cleaning facilities and reduced staffing at other facilities to better match coal production with current demand. The site lessor and feedstock coal supplier for one of these facilities located in Kentucky has filed for bankruptcy. The disruption caused by this bankruptcy and lack of primary coal supply may cause reduced or curtailed production at this facility for an extended period of time.
We are also committed to continuing to invest in research and development activities that are focused on energy-related technologies and nanotechnology, but at decreased levels in the future as compared to earlier periods. We participate in joint ventures that operate an ethanol plant located in North Dakota and a hydrogen peroxide plant in South Korea. To a smaller degree, we are also investing in other energy projects such as the refining of heavy crude oils into lighter transportation fuels.
Seasonality and Weather. Both our light building products and our heavy construction materials segments are greatly impacted by seasonality. Revenues and EBITDA are highest in the June and September quarters. Further, both segments are affected by weather as it impacts construction activities.
Historical Section 45K Business. A material amount of our consolidated revenue and net income through December 31, 2007 was derived from license fees and sales of chemical reagents, both of which were dependent on the ability of licensees and other customers to manufacture and sell qualified synthetic fuel that generated tax credits under Section 45K of the Internal Revenue Code. We have also claimed Section 45K tax credits for synthetic fuel sales from facilities in which we owned an interest. The IRS has challenged these credits in audit. By law, Section 45K tax credits for synthetic fuel produced from coal expired for synthetic fuel sold after December 31, 2007. With the expiration of Section 45K at the end of calendar 2007, our licensees’ synthetic fuel facilities and the facilities we owned were closed because production of synthetic fuel was not profitable absent the tax credits. The closure of these synfuel facilities has had a negative effect on revenue, net income and cash flow comparing the periods prior to the closure with periods after the closure.
Section 45K tax credits were subject to phase-out after the average annual U.S. wellhead oil price (reference price) exceeded a beginning phase-out threshold price. The calendar 2007 reference price reached the phase-out range and the IRS announced adjustments to the credits in calendar 2008. Accordingly, in fiscal 2008 we adjusted previously recognized revenue and tax credits as required to reflect the finalized phase-out. The existence and unpredictability of phase-out negatively affected the amount and timing of revenue recognition, net income and cash flow beginning in 2006 and continuing into 2008. We do not believe there are any material residual contingencies related to phase-out.
Debt and Liquidity. We incurred indebtedness in prior years to make strategic acquisitions, but were also able to increase cash flows and utilize that cash to reduce debt levels. We became highly leveraged as a result of acquisitions, but reduced our outstanding debt significantly since that time through 2008 by using cash generated
42
Table of Contents
from operations, from underwritten public offerings of common stock and from proceeds from settlement of litigation. During 2005 through 2008, we made several early repayments of our long-term debt. In 2008 and 2009, early repayments of long-term debt decreased as compared to earlier periods primarily due to our investments of available cash in the development of our coal cleaning business in the energy technology segment. Cash needs for capital expenditures continued in 2009, so we were and continue to be highly focused on liquidity to enable us to continue implementing our overall operational strategy.
We lowered the aggregate amount of indebtedness under our convertible notes by $64.2 million in 2009 by engaging in several exchanges of our convertible notes for common stock and new series of convertible notes bearing a higher interest rate. We also sold common stock in a public offering in September 2009 and used net proceeds of approximately $34.5 million to repay part of our former senior secured debt. In October 2009, we issued new senior secured notes aggregating approximately $328.3 million, for net proceeds of approximately $317.0 million. We used most of the proceeds to repay all of our remaining obligations under the former senior secured credit facility and virtually all of our outstanding 2.875% convertible senior subordinated notes. Also in October 2009, we entered into a $70.0 million ABL Revolver. Upon completion of these financings, we now have no debt maturities prior to 2014, unless the holders of the 16% convertible senior subordinated notes, totaling approximately $48.3 million, exercise their put option in 2012. We currently have approximately $70.0 million of cash on hand and additional liquidity is expected to be generated from operations over the next 12 months.
In summary, our strategy for 2010 and subsequent years is to reduce capital expenditures to minimal levels, continue efforts to streamline operations and reduce operating and general overhead costs as much as possible, and to reduce our outstanding debt levels using cash on hand and cash flow from operations to the extent deemed prudent.
Critical Accounting Policies and Estimates
Our significant accounting policies are identified and described in Note 2 to the consolidated financial statements. The preparation of consolidated financial statements in conformity with U.S. generally accepted accounting principles requires us to make estimates and assumptions that affect i) the reported amounts of assets and liabilities and disclosures of contingent assets and liabilities at the date of the financial statements, and ii) the reported amounts of revenue and expenses during the reporting period. Actual results could differ materially from those estimates.
We continually evaluate our policies and estimation procedures. Estimates are often based on historical experience and on assumptions that are believed to be reasonable under the circumstances, but which could change in the future. Some of our accounting policies and estimation procedures require the use of substantial judgment, and actual results could differ materially from the estimates underlying the amounts reported in the consolidated financial statements. Such policies and estimation procedures have been reviewed with our Audit Committee. The following is a discussion of critical accounting policies and estimates.
Valuation of Long-Lived Assets, including Intangible Assets and Goodwill. Long-lived assets consist primarily of property, plant and equipment, intangible assets and goodwill. Intangible assets consist primarily of identifiable intangible assets obtained in connection with acquisitions. These intangible assets are being amortized using the straight-line method, our best estimate of the pattern of economic benefit, over their estimated useful lives.
Goodwill consists of the excess of the purchase price for businesses acquired over the fair value of identified assets acquired, net of liabilities assumed. In accordance with the requirements of ASC Topic 350 Intangibles—Goodwill and Other (originally issued as SFAS No. 142, “Accounting for Goodwill and Intangible Assets”), we do not amortize goodwill, all of which relates to acquisitions. ASC Topic 350 requires us to periodically test for goodwill impairment, at least annually, or sooner if indicators of possible impairment arise. We perform our annual goodwill impairment testing as of June 30, using the two-step process described in Note 5 to the consolidated financial statements.
43
Table of Contents
As disclosed in Note 5, through 2007, we had five reporting units with allocated goodwill, three of which were in the light building products segment. There was one reporting unit with goodwill in each of the heavy construction materials and energy technology segments. As a result of changes in the operations and management of the businesses in the light building products segment, and in accordance with the requirements contained in ASC Topics 350 and 280 (including the rules originally issued as EITF Topic D-101, “Clarification of Reporting Unit guidance in Paragraph 30 of SFAS No. 142”), commencing with our 2008 fiscal year we aggregated the three reporting units in the light building products segment into one reporting unit for the purpose of goodwill impairment testing.
The changes in the light building products segment resulting in aggregation of the reporting units included, among other things, consolidation under a single management team, consolidation of incentive compensation programs to be dependent upon combined segment operating results, consolidation of some sales chains such that these chains sell many of the segment’s products, and cross selling into other sales chains, collaboration on new products, and cash flow/resource allocation decisions being made on a combined basis.
As a result of the depressed new housing and residential repair and remodeling markets, we determined that the light building products reporting unit’s goodwill was impaired as of the June 30 test dates in 2007 and 2008, and non-cash impairment charges of $98.0 million and $205.0 million, respectively, were recorded in those years. Due to the continuing decline in the new housing and residential repair and remodeling markets, the continued downward revisions by market analysts of near-term projections in these markets, the collapse of the credit markets in 2009 and the significant decline in our stock price during the six months ended March 31, 2009, management determined that indicators of further goodwill impairment in the light building products reporting unit existed. In addition, the significant declines in coal and oil prices and in our stock price indicated potential goodwill impairment in the energy technology reporting unit as well. Accordingly, we performed goodwill impairment tests for both the light building products and energy technology reporting units during the quarter ended March 31, 2009. Upon completion of the impairment tests, we wrote off all remaining goodwill in the light building products and energy technology reporting units, totaling approximately $465.7 million. None of the impairment charges in 2007, 2008 or 2009 affected our cash position, cash flow from operating activities or senior debt covenant compliance. Changes in the credit markets in late 2008 and in 2009 increased our borrowing rate, which borrowing rate directly affects the discount rate used in the goodwill impairment calculations. This increase in the discount rate led to the majority of the goodwill impairment in 2009.
The heavy construction materials reporting unit had recorded goodwill of approximately $116.0 million as of September 30, 2008 and 2009. The goodwill impairment test was not failed for the heavy construction materials reporting unit for any test date, and accordingly, no impairment charges have been necessary for any period. The estimated fair value of the heavy construction materials reporting unit exceeded its carrying value as of the June 30, 2009 test date by approximately $120.0 million. The anticipated future cash flows for this reporting unit are not currently expected to change significantly from 2009 levels.
In determining the fair values of the reporting units, all three of the traditional valuation approaches, the income approach, the market approach and the asset-based approach, were considered. The fair values of the reporting units were calculated using the income approach, determined by discounting expected future cash flows. This method was chosen because it specifically considers the operations, opportunities and risks applicable to the reporting units. The market approach, specifically the guideline public company method, was also considered. However, the reporting units’ direct competitors are either subsets of large corporate entities or are privately held. Therefore, there is limited comparability between the reporting units and the potential guideline public companies. Accordingly, the guideline public company method was utilized only as a reasonableness test of the results from the income approach. Finally, the asset-based approach was also considered; however, it was not utilized because it does not consider the income producing/going concern nature of the reporting units’ assets.
As discussed above, the fair values of the reporting units are calculated primarily using discounted expected future cash flows. There are many estimates and assumptions involved in preparing these expected future cash
44
Table of Contents
flows, including most significantly the weighted average cost of capital used to discount future cash flows, anticipated long-term growth rates, future profit margins, working capital requirements and required capital expenditures. Management uses its best efforts to reasonably estimate all of these and other inputs in the cash flow models utilized; however, it is certain that actual results will differ from these estimates and the differences could be material. Materially different input estimates and assumptions would necessarily result in materially different calculations of discounted expected future cash flows and reporting unit fair values and materially different goodwill impairment estimates.
The most sensitive assumptions for the income approach were the discount rates (based on weighted average cost of capital), the expected long-term growth rate and expected future gross profit margins. For the light building products reporting unit, discount rates of 11.8% and 19.0% were used in 2008 and 2009, respectively. Each 1% change in the discount rate would have changed the fair value of the reporting unit by approximately $100.0 million in 2008 and $18.0 million in 2009. The long-term growth rate used was 3.2% in both 2008 and 2009. Each 1% change in the long-term growth rate would have changed the fair value by approximately $70.0 million in 2008 and $8.0 million in 2009. The expected future gross profit margins used ranged from 28%-34% in 2008 and 27%-32% in 2009. Each 1% change in the gross profit margins would have changed the fair value by approximately $47.0 million in 2008 and $19.0 million in 2009. The sensitivity to a 1% change in these assumptions was much less pronounced in 2009 because of the high discount rate used, thereby lessening the impact of other variables on the fair value calculation.
Our light building products segment gross margin percentage for the years 2005 through 2008 was 33%, 31%, 30% and 26%, respectively. The year-over-year revenue growth (decrease) was 10%, (5)%, and (16)% over the same period. The results for 2007 and 2008 reflect the recent dramatic slowing of the light building products industry; however, we did not believe that recent conditions were indicative of the long-term future of the housing market. The housing market is extremely cyclical and the cycles can vary materially in length and scope. Average housing starts reported by the U.S. National Association of Home Builders (NAHB) for the last seventeen years, including calendar 2008, were 1.6 million units per year. While the estimated housing starts for calendar 2009 were 0.6 million, the five-year average that included current estimates for calendar 2009 and 2010 indicated estimated average housing starts of more than 1.1 million units, which is nearly 20% higher than the calendar 2008 actual starts. We believe that the gross profit margins used in the cash flow forecast of 28%-34% in 2008 and 27%-32% in 2009, which are consistent with our actual 2005-2007 levels, were reasonable in the long term, especially given productivity improvements being implemented through application of lean manufacturing techniques. We also believe that the long-term revenue growth rate of 3.2% will be achieved as the housing market rebounds.
In addition to the annual review, we evaluate, based on current events and circumstances, the carrying value of all long-lived assets, including intangible assets and goodwill, as well as the related amortization periods, to determine whether adjustments to these amounts or to the estimated useful lives are required. Changes in circumstances such as technological advances, or changes in our business model or capital strategy could result in the actual useful lives differing from our current estimates. In those cases where we determine that the useful lives of property, plant and equipment or intangible assets should be changed, we amortize the net book value in excess of salvage value over the revised remaining useful lives, thereby prospectively adjusting depreciation or amortization expense as necessary. In connection with the goodwill impairment testing for the light building products and energy technology reporting units in 2009, we also performed an analysis for potential impairments of other long-lived assets in those reporting units, including all intangible assets and property, plant and equipment. The results of this analysis did not result in any significant impairment of any other long-lived assets.
The carrying value of a long-lived asset is considered impaired when the anticipated cumulative undiscounted cash flow from that asset is less than its carrying value. In that event, a loss is recognized based on the amount by which the carrying value exceeds the fair market value of the long-lived asset. Indicators of impairment include such things as a significant adverse change in legal factors or in the general business climate, a decline in operating performance, a significant change in competition, or an expectation that significant assets will be sold or otherwise disposed of. No significant changes have been made to estimated useful lives during the periods presented.
45
Table of Contents
It is possible that some of our tangible or intangible long-lived assets or goodwill could be impaired in the future and that resulting write-downs could be material.
Income Taxes. Significant estimates and judgments were required in the calculation of our income tax provisions for the years presented. For example, one of the estimates affecting our tax provisions for 2007 and 2008 was the amount of Section 45K tax credits that would ultimately be available related to our 19% interest in an entity that owned and operated a coal-based solid alternative fuel production facility, plus two other smaller alternative fuel facilities that we owned and operated (see Note 8 to the consolidated financial statements). The calendar 2007 phase-out percentage was not finalized until the quarter ended June 30, 2008. As of September 30, 2007, we used our best estimate of what the phase-out percentage for calendar 2007 would be, using available information as of that date. An adjustment to reflect the final phase-out percentages was reflected in 2008 as necessary. The IRS is currently auditing our tax credits claimed for synthetic fuel sold from the facilities in which we owned an interest. The tax credits which are under audit that we believe are more likely than not to be sustained, and are therefore not included in unrecognized income tax benefits in the balance sheet, total approximately $30.0 million.
In 2008 and 2009, Section 45 refined coal tax credits (which are different from the Section 45K tax credits discussed above and elsewhere) have been generated by coal cleaning facilities that we own and operate. We believe it is more likely than not that the refined coal produced at our coal cleaning facilities qualifies for tax credits pursuant to Section 45 of the Internal Revenue Code, notwithstanding the uncertainties and risks associated with the tax credits, as more fully described in Note 12 to the consolidated financial statements. The IRS will challenge Section 45 tax credits claimed by us. In addition, Congress may modify or repeal Section 45 so that these tax credits may not be available in the future. From 2007 through 2009, we have recognized a total benefit of approximately $10.3 million related to Section 45 tax credits.
As described in more detail in Note 5 to the consolidated financial statements, we recorded goodwill impairment charges of $98.0 million, $205.0 million and $465.7 million in 2007, 2008 and 2009, respectively. The impairment charge in 2007 was not deductible for tax purposes and most of the impairment charges in 2008 and 2009 were not tax deductible. Therefore, the goodwill impairment charges had a significant negative effect on our income tax provision for all of those years.
As described in Note 9 to the consolidated financial statements, approximately $3.9 million of stock-based compensation in 2007 resulted from the early voluntary cancellation of SARs and other stock-based awards, requiring an acceleration of expense recognition for unrecognized compensation cost that remained as of the cancellation dates. As a result of the cancellation of the stock-based awards, approximately $10.0 million of deferred tax assets were written off.
As described in more detail in Note 8 to the consolidated financial statements, we adopted the new rules for accounting for uncertain tax positions in ASC Topic 740 Income Taxes (originally issued as Interpretation No. 48, “Accounting for Uncertainty in Income Taxes—an Interpretation of FASB Statement No. 109,” or FIN 48) effective as of October 1, 2007, the beginning of our 2008 fiscal year. We made a cumulative adjustment to decrease retained earnings and increase income tax liabilities for unrecognized income tax benefits by approximately $19.8 million. As of September 30, 2009, we had approximately $12.1 million of unrecognized tax benefits. Approximately $11.2 million of gross unrecognized income tax benefits would affect the 2009 effective tax rate if released into income.
The calculation of tax liabilities involves uncertainties in the application of complex tax regulations in multiple jurisdictions. For example, we are currently under audit by the IRS for the years 2005 and 2006 and have open tax periods subject to examination by both federal and state taxing authorities for the years 2005 through 2008. We recognize potential liabilities for anticipated tax audit issues in the U.S. and state tax jurisdictions based on estimates of whether, and the extent to which, additional taxes and interest will be due. If events occur and the payment of these amounts ultimately proves to be unnecessary, the reversal of the liabilities
46
Table of Contents
would result in tax benefits being recognized in the period when it is determined the liabilities are no longer probable or necessary. If the estimate of tax liabilities proves to be less than the ultimate assessment, a further charge to expense would result. It is reasonably possible that the amount of our unrecognized income tax benefits will change significantly within the next 12 months. These changes could be the result of our ongoing tax audits or the settlement of outstanding audit issues. However, due to the number of years under audit and the matters being examined, at the current time, an estimate of the range of reasonably possible outcomes cannot be made, beyond amounts currently accrued.
In evaluating our ability to recover our recorded deferred tax assets, in full or in part, all available positive and negative evidence, including our past operating results and our forecast of future taxable income on a jurisdiction by jurisdiction basis, is considered and evaluated. In determining future taxable income, we are responsible for assumptions utilized including the amount of federal, state and international pre-tax operating income, the reversal of temporary differences and the implementation of feasible and prudent tax planning strategies. These assumptions require significant judgment about the forecasts of future taxable income and are consistent with the plans and estimates we are using to manage our underlying businesses.
Stock-Based Compensation. We use the fair value method of accounting for stock-based compensation required by ASC Topic 718 Compensation—Stock Compensation (originally issued as SFAS No. 123 (revised 2004), “Share-Based Payment”). We recognize compensation expense equal to the grant-date fair value of stock-based awards for all awards expected to vest, over the period during which the related service is rendered by grantees. The fair value of stock-based awards is determined primarily using the Black-Scholes-Merton option pricing model (B-S-M model), developed for use in estimating the fair value of traded options that have no vesting restrictions and that are fully transferable. Option valuation models require the input of certain subjective assumptions, including expected stock price volatility and expected term. For stock-based awards, we primarily use the “graded vesting” or accelerated method to allocate compensation expense over the requisite service periods. Estimated forfeiture rates are based largely on historical data and ranged from 1% to 5% from 2007 through 2009, depending on the type of award and the award recipients. As of September 30, 2009, the estimated forfeiture rate for most unvested awards was 5% per year.
The fair values of stock options and SARs have been estimated using the B-S-M model, adjusted where necessary to account for specific terms of awards that the B-S-M model does not have the capability to consider; for example, SARs which have a cap on allowed appreciation. For these SARs, the output determined by the B-S-M model has been reduced by an amount determined by a Quasi-Monte Carlo simulation to reflect the reduction in fair value associated with the appreciation cap.
The two most critical estimates in determining fair value are expected stock price volatility and expected lives. Expected stock price volatility was estimated using primarily historical volatilities of our common stock. Implied volatilities of traded options on our stock, volatility predicted by other models, and an analysis of volatilities used by other public companies in comparable lines of business were also considered. In estimating expected lives, we considered the contractual and vesting terms of awards, along with historical experience; however, due to insufficient historical data from which to reliably estimate expected lives, we used estimates based on the “simplified method” set forth by the SEC in Staff Accounting Bulletins No. 107 and 110, where expected life is estimated by summing the award’s vesting term and contractual term and dividing that result by two. Insufficient historical data from which to reliably estimate expected lives is expected to exist for the foreseeable future due to different terms associated with awards granted in recent years, along with other factors. Risk-free interest rates used were the U.S. Treasury bond yields with terms corresponding to the expected terms of the awards being valued.
As of September 30, 2009, there was approximately $4.5 million of total compensation cost related to unvested awards not yet recognized. This unrecognized compensation cost is expected to be recognized over a weighted-average period of approximately 1.5 years. Due to the grant of stock-based awards subsequent to September 30, 2009, the amount of total compensation cost related to nonvested awards has increased, and the weighted-average period over which compensation cost will be recognized has changed.
47
Table of Contents
Stock-based compensation expense was approximately $10.1 million, $5.3 million and $5.6 million in 2007, 2008 and 2009, respectively. Approximately $3.9 million of the 2007 stock-based compensation resulted from the early voluntary cancellation of SARs and other stock-based awards, requiring an acceleration of expense recognition for unrecognized compensation cost that remained as of the cancellation dates. The early voluntary cancellation of SARs and other stock-based awards was a direct result of our low stock price as compared to the exercise prices of the cancelled SARs.
Litigation. We have ongoing litigation and asserted claims which have been incurred during the normal course of business, including the specific matters discussed in Note 12 to the consolidated financial statements. We intend to vigorously defend or resolve these matters by settlement, as appropriate. Management does not currently believe that the outcome of these matters will have a material adverse effect on our operations, cash flow or financial position.
Historically, costs paid to outside legal counsel for litigation have comprised a majority of our litigation-related costs. During 2008 and 2009, we incurred approximately $1.8 million and $4.2 million, respectively, of expense for legal matters, which consisted primarily of costs for outside legal counsel. We currently believe the range of potential loss for all unresolved matters, excluding costs for outside counsel, is from $1.0 million up to the amounts sought by claimants and have recorded a total liability as of September 30, 2009 of $1.0 million. Claims and damages sought by claimants in excess of this amount are not deemed to be probable. Our outside counsel currently believe that unfavorable outcomes of outstanding litigation are neither probable nor remote and declined to express opinions concerning the likely outcomes or our liability. Accordingly, management cannot express an opinion as to the ultimate amount, if any, of our liability, nor is it possible to estimate what litigation-related costs will be in future periods.
The specific matters discussed in Note 12 raise difficult and complex legal and factual issues, and the resolution of these issues is subject to many uncertainties, including the facts and circumstances of each case, the jurisdiction in which each case is brought, and the future decisions of juries, judges, and arbitrators. Therefore, although management believes that the claims asserted against us in the named cases lack merit, there is a possibility of material losses in excess of the amounts accrued if one or more of the cases were to be determined adversely against us for a substantial amount of the damages asserted. It is possible that a change in the estimates of probable liability could occur, and the changes could be material. Additionally, as with any litigation, these proceedings require that we incur substantial costs, including attorneys’ fees, managerial time and other personnel resources, in pursuing resolution.
License Fee Revenue Recognition. Through December 31, 2007, we licensed our technologies to the owners of 28 coal-based solid alternative fuel facilities in the U.S. License agreements contained a quarterly earned royalty fee generally set at a prescribed dollar amount per ton or a percentage of the tax credits earned by the licensee. Recurring license fees or royalty payments were recognized in the period when earned, which coincided with the sale of alternative fuel by our licensees, provided standard revenue recognition criteria such as amounts being “fixed or determinable” were met. In most instances, we received timely reports from licensees notifying us of the amount of solid synthetic fuel sold and the royalty due us under the terms of the respective license fee agreements. Additionally, we experienced a regular pattern of payment by these licensees of the reported amounts.
Estimates of license fee revenue earned, where required, could be reliably made based upon historical experience and/or communications from licensees with whom an established pattern existed. In some cases, however, such as when a licensee was beginning to produce and sell synthetic fuel or when a synthetic fuel facility was sold by a licensee to another entity, and for which there was no pattern or knowledge of past or current production and sales activity, there may have been more limited information available to estimate the license fee revenue earned. In these situations, we used such information as was available and where possible, substantiated the information through such procedures as observing the levels of chemical reagents purchased by
48
Table of Contents
the licensee and used in the production of the solid synthetic fuel. In certain limited situations, we were unable to reliably estimate the license fee revenues earned during a period, and revenue recognition was delayed until a future date when sufficient information was known from which to make a reasonable estimation.
The amount of license fee revenue recognized in 2006 and 2007 was affected by reduced revenues for certain licensees whose license agreements called for us to be paid a portion of the tax credits earned by the licensee. Certain accounting rules limit revenue recognition to amounts that are “fixed or determinable” and as a result of uncertainties related to phase-out of Section 45K tax credits and other licensee-specific factors, the timing of revenue recognition was delayed for certain licensees during those years.
Due to publication of the Section 45K calendar 2006 reference price and the phase-out range, finalization of calendar 2006 phase-out was made possible during the quarter ended June 30, 2007. As a result of the availability of this information and the clarification of other licensee-specific factors, certain calendar 2006 and prior year license fee revenue totaling approximately $31.5 million was recognized in 2007. This amount related to periods ending on or prior to December 31, 2006 and was recognized in 2007 when it met the “fixed or determinable” recognition criterion and it was remote that any negative adjustment would be required in the future. We applied the same policy in 2007 and 2008 with regard to the recognition of revenue for calendar 2007 tax credit-based license fees. The final determination of revenue pertaining to fiscal and calendar 2007 occurred in 2008 when the calendar 2007 reference price and phase-out range were published and we adjusted previously recognized revenue and tax credits as required to reflect the finalized phase-out. The existence and unpredictability of phase-out materially affected both the amount and timing of recognition of revenue, net income and cash flow in 2007 and 2008. At the current time, we do not believe there are any material residual contingencies related to phase-out; however, we are involved in certain ongoing litigation related to our former Section 45K business, as described in Note 12 to the consolidated financial statements.
Year Ended September 30, 2009 Compared to Year Ended September 30, 2008
Summary. Our total revenue for 2009 was $666.7 million, down 25% from $886.4 million for 2008. Gross profit decreased 37%, from $232.8 million in 2008 to $146.5 million in 2009. Our operating loss increased from $(152.9) million in 2008 to $(468.1) million in 2009, and the net loss increased from $(169.7) million, or a diluted loss per share of $(4.10), in 2008, to a net loss of $(415.6) million, or $(9.59) per diluted share, in 2009. The most significant reason for the change in results from 2008 to 2009 was an increase in the goodwill impairment charge to $465.7 million in 2009, compared to $205.0 million in 2008.
In addition to the goodwill impairment charges in both years, our Section 45K business terminated in 2008. Excluding our Section 45K business for 2008, total revenue for 2009 was down 19%, from $818.9 million for 2008, and gross profit was down 30%, from $208.2 million in 2008. Excluding our Section 45K business and the goodwill impairment charges for both 2008 and 2009, operating income decreased from $27.6 million in 2008 to an operating loss of $(2.5) million in 2009, and net income decreased from $10.9 million with diluted earnings per share of $0.27, in 2008, to a net loss of $(17.0) million, or $(0.39) per diluted share, in 2008.
Revenue and Gross Margins. The major components of revenue, along with gross margins, are discussed in the sections below.
Light Building Products Segment. Sales of light building products during 2009 were $340.7 million with a corresponding gross profit of $81.9 million. Sales of light building products during 2008 were $457.0 million with a corresponding gross profit of $119.7 million. The decrease in our sales of light building products in 2009 was due primarily to the continuing effects of the depressed new housing and residential remodeling markets which impacted sales across most of our product lines. Also, in early 2008, we sold certain non-strategic mortar/stucco assets in this segment which accounted for approximately $9.7 million of the decrease in revenue from 2008 to 2009. The gross margin percentage declined from 2008 to 2009 due primarily to fewer fixed costs being absorbed as a result of lower sales. We believe our niche strategy and our focus in 2009 on productivity
49
Table of Contents
improvements and cost reductions tempered somewhat the impact of the severe slowdown in new residential construction; however, the recession has resulted in higher unemployment, adding to the high level of home foreclosures, putting additional homes on the market and further reducing the demand for new construction.
New housing starts according to the National Association of Home Builders were 1.3 million and 0.9 million units in calendar 2007 and 2008, respectively, compared to a 10-year average of 1.6 million units. Our light building products business relies on the home improvement and remodeling markets as well as new construction. The U.S. Census Bureau’s Value of Private Residential Construction Spending Put in Place data (as revised) on homeowner improvement activity shows that the four quarter moving average peaked at $146.2 billion in the second quarter of calendar 2007 and fell to approximately $118.1 billion by the second quarter of calendar 2009. The Leading Indicator of Remodeling Activity estimate issued by the Joint Center for Housing Studies at Harvard University has estimated that the four-quarter moving average will be only $105.0 billion in the fourth quarter of calendar 2009, which would be the lowest level since the first quarter of calendar 2004. Given our market leadership positions and reduced cost structure, we believe that we are positioned to benefit from a rebound in the housing market when it occurs. We believe the residential housing market is in the early stages of a broad recovery and that the long-term growth prospects in the industry are strong. According to the U.S. Census Bureau, seasonally-adjusted annualized housing starts in August 2009 were up 25% from their lows experienced earlier in the year, but current seasonally-adjusted annualized housing starts are still well below the 50-year average. According to the Harvard Joint Center for Housing Studies, the nation’s housing stock will have to accommodate approximately 12.5 million to 14.8 million additional households due to population growth over the next decade.
Heavy Construction Materials Segment. Heavy construction materials revenues for 2009 were $260.9 million with a corresponding gross profit of $74.9 million. Heavy construction materials revenues for 2008 were $313.4 million with a corresponding gross profit of $87.3 million. The decrease in heavy construction materials revenues in 2009 compared to 2008 was due primarily to significant reductions in concrete consumption, partially offset by increased revenue from service contracts. The gross margin percentage increased from 2008 to 2009 primarily due to declines in the costs of rail and truck transportation and improved productivity.
Energy Technology Segment. In 2008, our energy technology segment revenue consisted primarily of residual revenues related to our Section 45K business. In 2009, there was no Section 45K revenue and energy technology segment revenue consisted almost exclusively of coal sales related to our coal cleaning business. Cost of revenue exceeded revenue for this segment in 2009 due primarily to low coal prices and ongoing start-up and ramp-up costs for newly-constructed and renovated coal cleaning facilities that were placed in service in late 2008 and in the quarter ended December 31, 2008. As of September 30, 2009, we have temporarily idled four of our coal cleaning facilities to align production to sales and to concentrate production in fewer facilities. We have also reduced staffing at other facilities and cut costs at all locations to reduce the breakeven point for the coal cleaning business. The site lessor and feedstock coal supplier for one of the idled facilities located in Kentucky has filed for bankruptcy. The disruption caused by this bankruptcy and lack of primary coal supply may cause reduced or curtailed production at this facility for an extended period of time.
Operating Expenses. The increase in amortization expense of $1.0 million from 2008 to 2009 was due primarily to accelerated amortization of certain intangible assets and amortization of intangible assets that were acquired in a late 2008 acquisition. Research and development expense decreased by $5.2 million from 2008 to 2009, primarily because of decreased spending on our coal-to-liquids and hydrogen peroxide technologies. Selling, general and administrative expenses decreased $27.4 million, or 19%, to $115.9 million in 2009 from $143.3 million in 2008. The decrease in 2009 was due to reduced expenses in every significant category of expense except for professional services. The largest contributor of cost savings was personnel-related costs, including incentive pay, totaling $15.7 million. Incentive pay decreased due to reduced profitability of our operations, and other personnel-related costs decreased primarily because of headcount reductions. Professional services increased by approximately $1.1 million in 2009 due to significant litigation costs, which increased $2.4 million from 2008. Due to implemented and planned cost-cutting activities, we expect selling, general and administrative expenses for 2010 to be below comparable 2009 levels.
50
Table of Contents
Other Income and Expense. During 2009, we reported net other expense of $31.9 million, compared to net other expense of $17.3 million during 2008. The change in other income and expense of $14.6 million was comprised of an increase in net interest expense of approximately $15.2 million, combined with an increase in net other income of approximately $0.6 million.
Net interest expense increased from $23.8 million in 2008 to $39.0 million in 2009 due to several factors, most notably increased interest expense attributed to our convertible debt exchanges that occurred in 2009 that resulted in the extinguishment of $120.0 million of 2.875% and 2.50% convertible notes and the issuance of $90.7 million of 16% and 14.75% convertible notes (see Note 6 to the consolidated financial statements). In connection with these convertible debt exchanges, approximately $1.9 million of accelerated debt issue costs were amortized related to the extinguished convertible notes. In addition, we experienced higher interest rates on our senior debt as a result of two 2009 amendments to our former senior secured credit agreement and increased interest expense from higher utilization of our revolving credit facility in 2009. Due to the increased interest rates on our convertible debt, the October 2009 issuance of new high-rate senior secured notes, and the implementation of new accounting rules for convertible debt (see Note 2 to the consolidated financial statements), we expect interest expense for 2010 to significantly exceed the level for 2009.
The increase in net other income of $0.6 million consisted primarily of a $6.9 million net gain related to the 2009 exchanges of convertible debt (for both new convertible debt (gain of $29.3 million) and common stock (loss of $22.4 million)), substantially offset by a decrease of $6.7 million in gain on sale of property, plant and equipment in 2009 as compared to 2008. In 2008, we sold certain non-strategic mortar/stucco assets in the light building products segment on which a gain of approximately $7.6 million was recognized. A portion of the proceeds from this sale were used to acquire assets that have increased the capacity of our Texas-based concrete block business, which contributed to higher operating income of this business in 2009.
Income Tax Provision. We recorded income taxes with an effective tax rate of less than 1% in 2008 (29% exclusive of the $205.0 million goodwill impairment charge, most of which was not tax-deductible) and approximately 17% in 2009 (51% exclusive of the $465.7 million goodwill impairment charge, most of which was not tax-deductible).
The effective tax rates disregarding goodwill impairment differ from the statutory rate primarily due to Section 45 tax credits. The Section 45 refined coal tax credits (which are different from the Section 45K tax credits discussed elsewhere) have been generated by coal cleaning facilities that we own and operate. We believe it is more likely than not that the refined coal produced at the coal cleaning facilities qualify for tax credits pursuant to Section 45 of the Internal Revenue Code, notwithstanding the uncertainties and risks associated with the tax credits, as more fully described in Note 12 to the consolidated financial statements.
Excluding the effect of the tax credits and goodwill impairment charges in both years, our effective tax rate for 2008 and 2009 would have been approximately 35% and 27%, respectively.
Year Ended September 30, 2008 Compared to Year Ended September 30, 2007
Summary. Our total revenue for 2008 was $886.4 million, down 27% from $1.21 billion for 2007. Gross profit decreased 41%, from $394.6 million in 2007 to $232.8 million in 2008. Operating income decreased from $100.3 million in 2007 to an operating loss of $(152.9) million in 2008. Net income decreased from $20.1 million, with diluted earnings per share of $0.47, to a net loss of $(169.7) million, or $(4.10) per diluted share, in 2008.
Excluding our Section 45K business and the goodwill impairment charges for both 2007 and 2008, total revenue in 2008 was $818.9 million, down 5% from $857.6 million in 2007; gross profit was $208.2 million in 2008, down 16% from $248.5 million in 2007; and operating income decreased from $54.6 million to $27.6 million in 2008. Net income in 2008 was $10.9 million with diluted earnings per share of $0.27, compared to net income of $13.6 million, or $0.29 per diluted share, in 2007.
51
Table of Contents
Revenue and Gross Margins. The major components of revenue, along with gross margins, are discussed in the sections below.
Light Building Products Segment. Sales of light building products during 2008 were $457.0 million with a corresponding gross profit of $119.7 million. Sales of light building products during 2007 were $544.1 million with a corresponding gross profit of $160.6 million. The decrease in sales of light building products in 2008 was due primarily to the continuing effects of the depressed new housing and residential remodeling market which impacted sales across most of our product lines. Also, in early 2008, we sold certain non-strategic assets in the light building products segment which accounted for approximately $27.7 million of the decrease in revenue from 2007 to 2008. The gross margin percentage declined from 2007 to 2008 due primarily to fewer fixed costs being absorbed as a result of lower sales.
Heavy Construction Materials Segment. Heavy construction materials revenues for 2008 were $313.4 million with a corresponding gross profit of $87.3 million. Heavy construction materials revenues for 2007 were $306.4 million with a corresponding gross profit of $88.8 million. The increase in heavy construction materials revenues in 2008 was due primarily to more ash disposal contracts in 2008 compared to 2007. The gross margin percentage decreased from 2007 to 2008 primarily due to geographic and product mix changes.
Energy Technology Segment. In 2007, our energy technology segment revenue consisted almost exclusively of chemical reagent sales, license fee revenue related to our solid alternative fuel technologies and sales of synthetic fuel, all of which related to our Section 45K business. In 2008, approximately 57% of our energy technology segment revenue consisted of Section 45K revenue, the substantial majority of which was recognized in the quarter ended December 31, 2007, when our Section 45K business terminated. Coal sales revenue was $38.7 million in 2008, compared to $2.1 million in 2007. Other energy technology segment revenues were $10.7 million in 2008.
Operating Expenses. The decrease in amortization expense of $0.5 million from 2007 to 2008 was due primarily to intangible assets that have been fully amortized. Research and development expense decreased by $2.7 million from 2007 to 2008 primarily because of decreased spending on our coal-to-liquids and hydrogen peroxide technologies. Selling, general and administrative expenses decreased $12.3 million, or 8%, to $143.3 million in 2008 from $155.6 million in 2007. The decrease in 2008 was due primarily to reduced incentive pay expenses and stock based compensation, partially offset by increased spending in our energy technology segment on coal cleaning growth initiatives. Incentive pay decreased due to reduced profitability of our operations and stock based compensation decreased primarily due to approximately $3.9 million of accelerated expense related to the early voluntary cancellation of SARs and other stock-based awards in 2007.
Other Income and Expense. During 2008, we reported net other expense of $17.3 million compared to net other expense of $42.0 million during 2007. The decrease in net other expense of $24.7 million was comprised of a decrease in net interest expense of approximately $7.3 million and a net change in other income/expense items of approximately $17.4 million.
Net interest expense decreased from $31.1 million in 2007 to $23.8 million in 2008 due to lower variable interest rates and lower average levels of long-term debt in 2008 as compared to 2007.
The change in other income/expense items of $17.4 million consisted primarily of a $8.7 million decrease in costs related to our investment in the coal-based solid alternative fuel production facility described in Note 8 to the consolidated financial statements, plus $7.1 million of gain on the sale of property, plant and equipment in 2008 compared to a loss of $2.3 million in 2007. The majority of the property, plant and equipment sold in 2008 represented non-strategic assets in our light building products segment. A portion of the proceeds from this sale were used to acquire assets that increased the capacity of our Texas-based concrete block business.
Income Tax Provision. We recorded income tax provisions with an effective tax rate of approximately 66% in 2007 (24%, exclusive of the $98.0 million goodwill impairment charge, which was not tax-deductible) and less than
52
Table of Contents
1% in 2008 (29%, exclusive of the $205.0 million goodwill impairment charge, most of which was not tax-deductible). The effective tax rate for 2007 (disregarding the goodwill impairment charge) was lower than the statutory rate primarily due to Section 45K tax credits related to the two coal-based solid alternative fuel facilities that we owned and operated, plus our 19% interest in an entity that owned and operated another alternative fuel facility (see Note 8 to the consolidated financial statements). The alternative fuel produced at these three facilities through December 31, 2007 qualified for tax credits pursuant to Section 45K of the Internal Revenue Code.
The effective tax rate for 2008 (disregarding the goodwill impairment charge) was lower than the statutory rate primarily due to Section 45 refined coal tax credits.
Excluding the effect of the tax credits and goodwill impairment charges in both years, our effective tax rate for 2007 and 2008 would have been approximately 39% and 35%, respectively.
Impact of Inflation and Related Matters
In certain periods, some of our operations have been negatively impacted by increased raw materials costs for commodities, such as polypropylene and poly-vinyl chloride in the light building products segment; however, the negative impact has generally been less significant during 2009 than during 2008. We have been successful in passing on some, but not all, increased materials costs to customers. Additionally, recent decreases in fuel costs have benefited all of our business units during 2009. It is not possible to accurately predict the future trends of these costs, nor our ability to pass on any future price increases to customers.
Liquidity and Capital Resources
Summary of Cash Flow Activities. Net cash provided by operating activities for 2009 was $50.7 million, compared to $123.5 million for 2008. The 2009 net loss would have been approximately $(25.6) million instead of $(415.6) million if adjusted for goodwill impairment and the decrease in deferred taxes, nearly all of which related to the goodwill impairment. After adjusting for the effects of goodwill impairment in both 2008 and 2009, profitability decreased in 2009 compared to 2008 primarily due to the effects on our light building products business of the depressed new housing and residential remodeling markets, losses sustained by our coal cleaning business, and the absence of Section 45K-related operations in 2009. The termination of our Section 45K business was also one of the reasons for the higher cash flow from collection of trade receivables in 2008 than 2009 and was the cause of some of the other changes in operating assets and liabilities reflected in the operating activities section of the statements of cash flows.
In both 2008 and 2009, our primary investing activities consisted of the purchase of property, plant and equipment and payments for acquisitions. In 2008, our primary financing activities consisted of borrowings under our revolving credit arrangement and the purchase of treasury stock. In 2009, in addition to borrowings under the revolving credit arrangement, our financing activities consisted primarily of several non-cash convertible debt exchanges (for both new convertible debt and common stock), and the issuance of common stock, the net proceeds of which were used to repay long-term debt. More details about our investing and financing activities, including the significant transactions that occurred subsequent to September 30, 2009, are provided in the following paragraphs.
Investing Activities. Total expenditures for property, plant and equipment in 2009 were $64.2 million, a decrease of $52.0 million from 2008. In 2008, the majority of capital expenditures were for projects in the energy technology and light building products segments. The energy technology segment expenditures were for the construction and renovation of coal cleaning facilities and the light building products segment expenditures were for both expansion of operations (primarily our Texas block business) and maintenance of operating capacity. In 2009, the majority of capital expenditures were for coal cleaning facilities and expansion of operations in the heavy construction materials segment. Spending on coal cleaning facilities will comprise a much smaller portion of total expenditures in future years as compared to 2008 and 2009. Total 2010 capital expenditures are currently expected to be approximately $30.0 million.
53
Table of Contents
Capital expenditures are limited by the terms of our new ABL Revolver to $60.0 million in 2010, $55.0 million in 2011 and $60.0 million in 2012. As of September 30, 2009, we were committed to spend approximately $5.5 million on capital projects that were in various stages of completion. In 2008, we realized $13.2 million of proceeds from the sale of property, plant and equipment, most of which represented non-strategic assets in our light building products segment. A portion of the proceeds from this sale was used to acquire assets that increased the capacity of our Texas-based concrete block business, enabling us to meet current and projected demand in this line of business. In 2009, proceeds from disposition of property, plant and equipment of $3.2 million were closer to normal historical levels.
In 2007, we acquired 100% of the ownership interests of Dutch Quality Stone (DQS), a privately-held company in the light building products business. Total consideration paid at the date of acquisition was approximately $52.9 million. An additional $19.0 million was paid in 2008, based on earnings of DQS for the 12-month period ended September 30, 2007 that exceeded an agreed-upon threshold. In 2008, we acquired certain assets and assumed certain liabilities of a privately-held company in the light building products industry. Total consideration for this acquisition was approximately $16.1 million, of which approximately $5.0 million was paid at the date of acquisition and approximately $10.8 million was paid in 2009, with approximately $0.3 million of assumed liabilities.
We intend to continue to expand our business through growth of existing operations and commercialization of technologies currently being developed. Acquisitions have historically been an important part of our long-term business strategy; however, primarily because of debt covenant restrictions, but also due to cash flow considerations and current events affecting the debt and equity markets, we do not currently anticipate any significant acquisitions in the foreseeable future. We have also invested in several joint ventures, which are accounted for using the equity method of accounting, but we do not currently have plans to significantly increase our investments in those entities. Our new debt agreements significantly limit potential acquisitions and investments in joint ventures, with the ABL Revolver being the most restrictive. During the four-year term of the ABL Revolver, our acquisitions and investments in joint ventures and other less than 100%-owned entities are limited to a cumulative total of $3.0 million.
Financing Activities. In 2009, our primary financing activities consisted of i) the non-cash exchange of $120.0 million of convertible senior subordinated notes for $90.7 million of new convertible senior subordinated notes; ii) the non-cash exchange of approximately $34.8 million of convertible senior subordinated notes for approximately 8.3 million shares of common stock; iii) the issuance of 9.6 million shares of common stock for net cash proceeds of approximately $34.5 million; iv) the repayment of long-term debt; and v) borrowings under our revolving credit arrangement. In addition, in October 2009, we issued new senior secured notes aggregating approximately $328.3 million, for net proceeds of approximately $317.0 million. We used most of the proceeds to repay all of our obligations under the former senior secured credit facility and virtually all of the outstanding 2.875% convertible senior subordinated notes. Also in October 2009, we entered into a $70.0 million ABL Revolver.
In 2009, we exchanged approximately $80.9 million of our 2.875% convertible senior subordinated notes due 2016 for $63.3 million of new 16% convertible senior subordinated notes due 2016, and exchanged approximately $39.1 million of our 2.50% convertible senior subordinated notes due 2014 for approximately $27.4 million of new 14.75% convertible senior subordinated notes due 2014. Gains of approximately $29.3 million, recorded in other income (expense) in the accompanying consolidated statement of operations for 2009, were recognized on the extinguishments of debt. Additionally, approximately $1.9 million of unamortized debt issue costs related to the extinguished debt was charged to interest expense. New debt issue costs of approximately $1.3 million were incurred related to the new 16% and 14.75% convertible notes.
In 2009, we also exchanged approximately $15.0 million of our 16% convertible senior subordinated notes plus related accrued interest for approximately 3.5 million shares of common stock and we exchanged approximately $19.8 million of our 2.875% convertible senior subordinated notes plus accrued interest for
54
Table of Contents
approximately 4.8 million shares of common stock. In accordance with the provisions of ASC Topic 470 Debt (originally issued as SFAS No. 84, “Induced Conversions of Convertible Debt”), we recorded a non-cash expense of approximately $22.4 million in connection with these transactions, which amount represents the fair value of the shares issued in excess of the shares required to be issued pursuant to the original terms of conversion described in Note 6 to the consolidated financial statements.
Also in 2009, we issued 9.6 million shares of common stock for gross cash proceeds of approximately $37.4 million. After deducting offering costs totaling approximately $2.9 million, the net cash proceeds of $34.5 million were used to pay down our senior secured term debt.
In both 2008 and 2009, we had borrowings and repayments under our revolving credit arrangement, primarily related to seasonal financing needs and energy technology segment capital expenditures. As of September 30, 2009, we had $25.0 million outstanding under this arrangement, all of which was repaid with proceeds from the new senior secured debt issued in October 2009. In 2008, financing activities also included treasury stock purchases totaling $14.8 million.
In October 2009, we issued new senior secured notes aggregating approximately $328.3 million, for net proceeds of approximately $317.0 million. We used most of the proceeds to repay all of our obligations under the former senior secured credit facility and virtually all of the outstanding 2.875% convertible senior subordinated notes. Because the amount outstanding under the revolving credit arrangement as of September 30, 2009 was repaid with those proceeds, we classified it as long-term in the accompanying consolidated balance sheet. Also in October 2009, we entered into a $70.0 million ABL Revolver. Significant terms of our former senior secured credit facility and all of our convertible senior subordinated notes, as well as the new senior secured notes and the ABL Revolver are described in Note 6 to the consolidated financial statements.
Availability under the ABL Revolver can not exceed $70.0 million, which includes a $35.0 million sub-line for letters of credit and a $10.5 million swingline facility. Availability under the ABL Revolver is further limited by the borrowing base valuations of certain assets of our light building products and heavy construction materials segments, consisting of trade receivables and inventories, which secure the borrowings. In addition to the first lien position on these assets, the ABL Revolver lenders have a second priority position on substantially all other assets. The ABL Revolver matures in October 2013, at which time all amounts borrowed must be repaid and the lending commitment terminates.
Following the October 2009 issuance of the new senior secured notes and the repayments of outstanding debt with most of those proceeds, there are currently no maturities of debt prior to 2014, unless the holders of the 16% convertible senior subordinated notes exercise their put option in 2012. Following certain asset sales, as defined, we could be required to prepay a portion of the new outstanding notes.
We were in compliance with all debt covenants, as amended, as of September 30, 2009 and as of the October 2009 termination date of the former senior secured credit facility. We are currently in compliance with all covenants of the new senior secured notes and the ABL Revolver. The senior secured notes and ABL Revolver limit the incurrence of additional debt and liens on assets, prepayment of subordinated debt, merging or consolidating with another company, selling assets, making capital expenditures, making acquisitions and investments and the payment of dividends or distributions, among other things. In addition, if in the future the availability under the ABL Revolver is less than a specified percentage, we will be required at that time to maintain a monthly fixed charge coverage ratio of at least (i) 1.0x for the last twelve-month period for each month ending on or prior to December 31, 2010, and (ii) 1.1x for the last twelve-month period for each month ending after December 31, 2010. Currently, we do not meet that minimum fixed charge coverage ratio of 1.0x, but at the present time and for the foreseeable future, there is no requirement to comply with that ratio.
We filed with the SEC a universal shelf registration statement for the potential sale of a total of $250.0 million of debt or equity securities. This registration statement was declared effective in April 2009. Following
55
Table of Contents
the 2009 issuance of common stock described above, approximately $212.6 million remains available for future offerings of securities under the registration statement. A prospectus supplement describing the terms of any additional securities to be issued is required to be filed before any future offering could commence under the registration statement.
In both 2008 and 2009, cash proceeds from the exercise of options and employee stock purchases were not material. Option exercise activity is primarily dependent on our stock price and is not predictable. To the extent non-qualified stock options are exercised, or there are disqualifying dispositions of shares obtained upon the exercise of incentive stock options, we receive an income tax deduction generally equal to the income recognized by the optionee. Such amounts were not material in either 2008 or 2009.
Working Capital. As of September 30, 2009, our working capital was $73.4 million, compared to $124.7 million as of September 30, 2008. Notwithstanding the continuing decrease in light building products and heavy construction materials revenues as a result of existing economic conditions, we currently expect operations to produce positive cash flow in 2010 and in future years. In addition, following the October 2009 transactions described above, our working capital has increased by more than $75.0 million subsequent to September 30, 2009. We believe this level of working capital will be sufficient for operating needs for the next 12 months, and currently believe that it will not be necessary to utilize borrowing capacity under the ABL Revolver for our seasonal cash needs or otherwise in 2010.
Income Taxes. Historically, there has often been a lag in paying estimated taxes during a fiscal year due to the seasonality of our operations and because estimated income tax payments are typically based on annualizing a fiscal year’s taxable income based on year-to-date results. We currently expect this pattern to continue, but to have a less significant effect on our cash flow in future periods due to expected results of operations that are closer to break-even than what we have historically experienced. We currently expect our effective income tax rate in future years to be different from the statutory rate primarily due to the availability of Section 45 refined coal tax credits. These tax credits relate to the coal cleaning facilities that we currently own and operate. The tax credits are expected to reduce required cash payments for estimated taxes during the year they are earned.
As of September 30, 2009, we had approximately $12.1 million of unrecognized tax benefits and we have recorded approximately $11.2 million of gross unrecognized income tax benefits which would affect the 2009 effective tax rate if released into income. During 2009, we released approximately $2.1 million of liabilities for interest and penalties and as of September 30, 2009, approximately $4.9 million was accrued for the payment of interest and penalties. Changes to the estimated liability for unrecognized income tax benefits during 2009 were primarily the result of settlement of the IRS audit for the years 2003 and 2004.
The calculation of tax liabilities involves uncertainties in the application of complex tax regulations in multiple jurisdictions. For example, we are currently under audit by the IRS for the years 2005 and 2006 and have open tax periods subject to examination by both federal and state taxing authorities for the years 2005 through 2008. We recognize potential liabilities for anticipated tax audit issues in the U.S. and state tax jurisdictions based on estimates of whether, and the extent to which, additional taxes and interest will be due. If events occur and the payment of these amounts ultimately proves to be unnecessary, the reversal of the liabilities would result in tax benefits being recognized in the period when it is determined the liabilities are no longer probable or necessary. If the estimate of tax liabilities proves to be less than the ultimate assessment, a further charge to expense would result. It is reasonably possible that the amount of our unrecognized income tax benefits will change significantly within the next 12 months. These changes could be the result of our ongoing tax audits or the settlement of outstanding audit issues. However, due to the number of years under audit and the matters being examined, at the current time, an estimate of the range of reasonably possible outcomes cannot be made, beyond amounts currently accrued.
As discussed previously, cash payments for income taxes are reduced for tax deductions resulting from disqualifying dispositions of incentive stock options and from the exercise of non-qualified stock options, which
56
Table of Contents
amounts were not material in 2008 or 2009. Option exercise activity is primarily dependent on our stock price which is not predictable, and likewise, it is not possible to estimate what tax benefits may be realized from future option exercises.
Summary of Future Cash Requirements. Significant cash requirements for 2010, beyond seasonal operational working capital requirements, consist primarily of interest payments on long-term debt and capital expenditures. In years beyond 2010, significant cash requirements will also include the repayment of debt, but not prior to June 2012, when the 16% convertible senior subordinated notes can be put to us.
Debt Covenant Compliance and EBITDA. During 2009, we experienced potential debt covenant compliance risk related to certain leverage and fixed charge coverage ratios associated with our former senior secured credit facility. The potential risk was primarily the result of declining EBITDA combined with increased levels of capital expenditures. EBITDA is defined as net income (loss) plus net interest expense, income taxes (as defined), depreciation and amortization, stock-based compensation, foreign currency translation gain or loss and goodwill and other impairments. The three primary debt covenant ratios with which we were required to comply under our former senior secured credit facility were: i) a maximum total leverage ratio of 3.75:1 as of September 30, 2009; ii) a maximum ratio of consolidated funded indebtedness minus subordinated indebtedness to EBITDA, or senior leverage ratio, of 2.5:1 as of September 30, 2009; and iii) a minimum ratio of EBITDA plus rent payments (EBITDAR), less certain capital expenditures and taxes for the four preceding fiscal quarters, to scheduled rent payments and payments of principal and interest on all indebtedness for the next four fiscal quarters, or fixed charge coverage ratio, of 1.25:1 as of September 30, 2009. In connection with the amendment to the credit facility which was in effect as of September 30, 2009, the lenders agreed to waive the total leverage ratio requirement.
The following table summarizes the calculations of each of these three key ratios for the dates indicated.
| (in millions) |
September 30, 2007 |
September 30, 2008 |
September 30, 2009 |
|||||||||
| Senior debt, including revolver (A) |
$ | 210.0 | $ | 200.0 | $ | 188.0 | ||||||
| Convertible debt (B) |
332.5 | 332.5 | 268.3 | |||||||||
| Total long-term debt, including current portion |
542.5 | 532.5 | 456.3 | |||||||||
| Stand-by letters of credit |
6.0 | 9.7 | 0.0 | |||||||||
| Other long-term obligations |
— | 9.7 | 8.8 | |||||||||
| Total indebtedness, as defined (C) |
$ | 548.5 | $ | 551.9 | $ | 465.1 | ||||||
| TTM EBITDA, as defined (D) |
$ | 301.2 | $ | 142.1 | $ | 105.4 | ||||||
| Total leverage ratio (C ÷ D) |
1.82 | 3.88 | 4.41 | |||||||||
| Senior leverage ratio ((C – B) ÷ D) |
0.72 | 1.54 | 1.87 | |||||||||
| TTM EBITDA |
$ | 301.2 | $ | 142.1 | $ | 105.4 | ||||||
| Rent expense |
34.2 | 35.4 | 38.8 | |||||||||
| Less certain capital expenditures |
(55.0 | ) | (40.1 | ) | (27.3 | ) | ||||||
| Income taxes |
(60.9 | ) | (1.4 | ) | 76.2 | |||||||
| TTM EBITDAR, as defined (E) |
$ | 219.5 | $ | 136.0 | $ | 193.1 | ||||||
| Future twelve months’ scheduled interest payments |
$ | 24.4 | $ | 31.7 | $ | 37.6 | ||||||
| Future twelve months’ scheduled repayments of long-term debt and other obligations |
— | 1.0 | 26.1 | |||||||||
| Future twelve months’ scheduled rent payments |
38.5 | 36.0 | 40.7 | |||||||||
| Future fixed charges, as defined (F) |
$ | 62.9 | $ | 68.7 | $ | 104.4 | ||||||
| Fixed charge coverage ratio (E ÷ F) |
3.49 | 1.98 | 1.85 | |||||||||
57
Table of Contents
Trailing twelve months (TTM) EBITDA as used in the above table is calculated as follows, along with EBITDA by segment:
| (in thousands) |
September 30, 2007 |
September 30, 2008 |
September 30, 2009 |
|||||||||
| Net income (loss) |
$ | 20.1 | $ | (169.7 | ) | $ | (415.6 | ) | ||||
| Net interest expense |
31.1 | 23.8 | 39.0 | |||||||||
| Income taxes, as defined |
69.8 | 2.2 | (76.2 | ) | ||||||||
| Depreciation and amortization, as defined |
82.2 | 74.2 | 71.7 | |||||||||
| Impairments, as defined |
98.0 | 211.6 | 464.1 | |||||||||
| Inducement loss on debt to equity exchange |
— | — | 22.4 | |||||||||
| TTM EBITDA, as defined (D) |
$ | 301.2 | $ | 142.1 | $ | 105.4 | ||||||
| Light building products segment |
$ | 105.1 | $ | 73.6 | $ | 45.6 | ||||||
| Heavy construction materials segment |
72.8 | 72.8 | 60.4 | |||||||||
| Energy technology segment |
146.2 | 11.8 | (16.0 | ) | ||||||||
| Corporate |
(22.9 | ) | (16.1 | ) | 15.4 | |||||||
| TTM EBITDA, all segments |
$ | 301.2 | $ | 142.1 | $ | 105.4 | ||||||
EBITDA, in addition to being used to monitor compliance with debt covenants, is also used by management to measure operating performance, as a supplement to our consolidated financial statements presented in accordance with generally accepted accounting principles (GAAP). EBITDA is also used by investors to measure a company’s ability to service its debt and meet its other cash needs. The EBITDA calculation as reflected in the preceding table is consistent with the definitions of such items in our former senior secured credit facility and with the definitions management intends on using in future periods when measuring operating performance, but differs in certain respects with the definitions in our new October 2009 debt agreements.
Management believes EBITDA is helpful in highlighting trends, because EBITDA excludes the results of decisions that are outside the control of operating management and can differ significantly from company to company depending on long-term strategic decisions regarding capital structure, the tax jurisdictions in which companies operate and capital investments. Management compensates for the limitations of using non-GAAP financial measures by using them to supplement GAAP results to provide a more complete understanding of the factors and trends affecting the business than GAAP results alone.
EBITDA is not a measurement of our financial performance under GAAP and should not be considered as an alternative to net income, operating income or any other performance measure derived in accordance with GAAP or as a measure of our liquidity. Additionally, EBITDA is not intended to be a measure of free cash flow available for management’s discretionary use, as it does not consider certain cash requirements such as interest payments, tax payments and debt service requirements. Our presentation of EBITDA has limitations as an analytical tool, and should not be considered in isolation, or as a substitute for analysis of our results as reported under GAAP. Because the definitions of EBITDA vary among companies and industries, it may not be comparable to other similarly-titled measures used by other companies.
Legal Matters
We have ongoing litigation and asserted claims which have been incurred during the normal course of business. Reference is made to Note 12 to the consolidated financial statements for a description of our accounting for legal costs and for other information about legal matters.
Off-Balance Sheet Arrangements
We have operating leases for certain facilities and equipment, but otherwise do not have any off-balance sheet arrangements that have, or are reasonably likely to have, a current or future material effect on our financial condition, results of operations, liquidity, or capital resources.
58
Table of Contents
Contractual Obligations, Commitments and Contingent Liabilities
The following table presents a summary of our contractual obligations by period as of September 30, 2009.
| Payments due by Fiscal Year | |||||||||||||||
| (in millions) |
Total | 2010 | 2011 - 2012 |
2013 - 2014 |
After 2014 | ||||||||||
| Senior secured debt |
$ | 188.0 | $ | — | $ | 163.0 | $ | 25.0 | $ | — | |||||
| Convertible senior subordinated notes |
268.3 | — | — | 148.2 | 120.1 | ||||||||||
| Total long-term debt |
456.3 | — | 163.0 | 173.2 | 120.1 | ||||||||||
| Interest payments on long-term debt |
127.7 | 32.9 | 41.8 | 29.0 | 24.0 | ||||||||||
| Operating lease obligations |
104.1 | 31.5 | 41.9 | 22.4 | 8.3 | ||||||||||
| Unconditional purchase obligations |
46.8 | 14.3 | 14.7 | 6.3 | 11.5 | ||||||||||
| Capital expenditures |
5.5 | 5.5 | — | — | — | ||||||||||
| Other long-term obligations |
14.9 | 3.7 | 5.0 | 4.4 | 1.8 | ||||||||||
| Total contractual cash obligations |
$ | 755.3 | $ | 87.9 | $ | 266.4 | $ | 235.3 | $ | 165.7 | |||||
Future maturities of long-term debt as of September 30, 2009 are shown in the table above using debt that existed as of that date and considering the related contractually required repayment dates. As noted previously, all of the senior secured debt and virtually all of the 2.875% convertible senior subordinated notes were repaid in October 2009 with most of the net proceeds from the issuance of $328.3 million of new senior secured notes. Accordingly, the total amount of our contractual obligations and the timing of payment for our debt service obligations have changed significantly. Substituting the newly issued senior secured notes and related interest obligations for the extinguished former senior secured debt and 2.875% convertible debt would increase the total obligations in the above table to approximately $976.0 million.
The holders of the 16% convertible senior subordinated notes due June 2016, totaling $48.3 million, have the right to require us to repurchase all or a portion of the notes on June 1, 2012. If all of the holders of those notes required us to repurchase the notes in June 2012 instead of June 2016, the timing of payment of $48.3 million of debt obligations, along with the amount and timing of the related interest payments would be different.
Future interest payments on our variable rate former senior secured debt as shown in the table above were calculated based on the actual interest rate in effect as of September 30, 2009.
As described in Note 6 to the consolidated financial statements, our new ABL Revolver provides for potential borrowings of up to $70.0 million, which includes a $35.0 million sub-line for letters of credit and a $10.5 million swingline facility.
As of September 30, 2009, we had approximately $12.1 million of unrecognized tax benefits. Due to the number of years under audit and the matters being examined, at the current time, an estimate of the range of reasonably possible outcomes cannot be made beyond amounts currently accrued, nor can we reliably estimate the timing of any potential payments.
Reference is made to the caption “Compensation Arrangements” in Note 12 to the consolidated financial statements for a detailed discussion of potential commitments to certain officers and employees under employment agreements, long-term incentive cash bonus awards, executive change in control agreements, and performance unit awards. Amounts in addition to those included in the table above could become obligations under the terms of those agreements, depending upon the future events described in Note 12.
We have ongoing litigation and asserted claims which have been incurred during the normal course of business, including the specific matters discussed in Note 12 to the consolidated financial statements. We intend to vigorously defend or resolve these matters by settlement, as appropriate. We do not currently believe that the outcome of these matters will have a material adverse effect on our operations, cash flow or financial position.
59
Table of Contents
Historically, costs paid to outside legal counsel for litigation have comprised a majority of our litigation-related costs. During 2008 and 2009, we incurred approximately $1.8 million and $4.2 million, respectively, of expense for legal matters, which consisted primarily of costs for outside legal counsel. We currently believe the range of potential loss for all unresolved matters, excluding costs for outside counsel, is from $1.0 million up to the amounts sought by claimants and have recorded a total liability as of September 30, 2009 of $1.0 million. Claims and damages sought by claimants in excess of this amount are not deemed to be probable. Our outside counsel currently believe that unfavorable outcomes of outstanding litigation are neither probable nor remote and declined to express opinions concerning the likely outcomes or liability to us. Accordingly, management cannot express an opinion as to the ultimate amount, if any, of our liability, nor is it possible to estimate what litigation-related costs will be in future periods.
The specific matters discussed in Note 12 raise difficult and complex legal and factual issues, and the resolution of these issues is subject to many uncertainties, including the facts and circumstances of each case, the jurisdiction in which each case is brought, and the future decisions of juries, judges, and arbitrators. Therefore, although management believes that the claims asserted against us in the named cases lack merit, there is a possibility of material losses in excess of the amounts accrued if one or more of the cases were to be determined adversely against us for a substantial amount of the damages asserted. It is possible that a change in the estimates of probable liability could occur, and the changes could be material. Additionally, as with any litigation, these proceedings require that we incur substantial costs, including attorneys’ fees, managerial time and other personnel resources, in pursuing resolution.
Recent Accounting Pronouncements
Reference is made to Note 2 to the consolidated financial statements for a discussion of accounting pronouncements that have been recently issued which we have not yet adopted. In particular, the new rules related to accounting for our convertible debt must be applied retrospectively to all periods subsequent to January 2007.
| ITEM 7A. | QUANTITATIVE AND QUALITATIVE DISCLOSURE ABOUT MARKET RISK |
We are exposed to financial market risks, primarily related to certain foreign currencies and interest rates. We do not use derivative financial instruments for speculative or trading purposes. We have entered into certain hedge transactions in the past, primarily to limit variable interest rate exposure, but there are no such hedges outstanding as of September 30, 2009. The Blue Flint joint venture has derivatives in place related to variable interest rates and commodities.
We have limited operations in foreign jurisdictions. However, one of our joint ventures with Evonik Industries AG owns a hydrogen peroxide business located in South Korea. This joint venture has € 22.5 million (approximately $32.8 million at September 30, 2009) of long-term debt along with other obligations denominated in Euros. Because this debt and other obligations are repayable in a currency different from the Korean Won, the joint venture’s functional currency, they must be remeasured into Korean Won at the end of each reporting period based on period end exchange rates, with the impact recorded in earnings. As a result, the joint venture is subject to foreign currency exchange rate movements. During 2009, the joint venture recorded foreign currency exchange gains of which $1.1 million has been included in our results of operations. As of September 30, 2009, a change in the relationship between the Euro and Korean Won of 10% would result in a gain or loss of approximately $1.7 million for us.
As described in more detail in Note 6 to the consolidated financial statements, our senior debt totaling $188.0 million as of September 30, 2009 bore interest at a variable rate; however, all of this debt was repaid in October 2009 and currently, we have no variable rate debt outstanding. Future borrowings, if any, under our new ABL Revolver will bear interest at a variable rate, as described in Note 6.
60
Table of Contents
| ITEM 8. | FINANCIAL STATEMENTS AND SUPPLEMENTARY DATA |
The financial statements and supplementary financial data required by this Item 8 are set forth in Item 15 of this Form 10-K. All information that has been omitted is either inapplicable or not required.
| ITEM 9. | CHANGES IN AND DISAGREEMENTS WITH ACCOUNTANTS ON ACCOUNTING AND FINANCIAL DISCLOSURE |
On April 10, 2009, Headwaters Incorporated dismissed Ernst & Young LLP as its independent accountants. The Registrant’s Audit Committee participated in and approved the decision to change independent accountants. We notified Ernst & Young LLP of this decision on April 10, 2009.
The reports of Ernst & Young LLP on the consolidated financial statements for the past two fiscal years contained no adverse opinion or disclaimer of opinion and were not qualified or modified as to uncertainty, audit scope or accounting principle.
In connection with its audits for the two most recent fiscal years and through April 10, 2009, there have been no disagreements with Ernst & Young LLP on any matter of accounting principles or practices, financial statement disclosure, or auditing scope or procedure, which disagreements if not resolved to the satisfaction of Ernst & Young LLP would have caused them to make reference thereto in their reports on the consolidated financial statements for such years.
During the two most recent fiscal years and through April 10, 2009, there have been no reportable events (as defined in Regulation S-K Item 304(a)(1)(v)).
We requested that Ernst & Young LLP furnish us with a letter addressed to the Securities and Exchange Commission stating whether or not it agrees with the above statements. A copy of that letter was filed as Exhibit 16 to our Form 8-K filed on April 20, 2009.
On April 13, 2009, the Audit Committee appointed BDO Seidman, LLP as independent auditors of Headwaters Incorporated. During Headwaters’ two most recent fiscal years and in the subsequent period through April 13, 2009, neither Headwaters, nor anyone acting on its behalf, consulted with BDO regarding either: (i) the application of accounting principles to a specified transaction, either completed or proposed, or the type of audit opinion that might be rendered on Headwaters’ financial statements, and no written report nor oral advice was provided by BDO, or (ii) any matter that was either the subject of a disagreement, as that term is defined in Item 304(a)(1)(iv) of Regulation S-K, or a reportable event, as that term is defined in Item 304(a)(1)(v) of Regulation S-K. Headwaters engaged BDO Seidman, LLP in January 2005 to advise it on the application of FAS 109 and later that year concerning FAS 123R. In December 2005, Headwaters engaged BDO Seidman, LLP to prepare its federal and state income tax returns. Since that time, Headwaters has had normal consultation with BDO inherent with the services they have been engaged to provide. As part of the appointment and selection process, both BDO Seidman, LLP and the Audit Committee of Headwaters considered the timing and nature of these services and have concluded that such services do not impair BDO’s independence with respect to Headwaters.
| ITEM 9A. | CONTROLS AND PROCEDURES |
Disclosure Controls and Procedures—We maintain disclosure controls and procedures that are designed to ensure that information we are required to disclose in the reports that we file or submit under the Securities Exchange Act of 1934 (the Exchange Act), such as this Annual Report on Form 10-K, is recorded, processed, summarized and reported within the time periods specified by SEC rules and forms. Disclosure controls and procedures include, without limitation, controls and procedures designed to ensure that information we are required to disclose in the reports that we file or submit under the Exchange Act is accumulated and communicated to our management, including the Chief Executive Officer (CEO) and the Chief Financial Officer (CFO), to allow timely decisions regarding required disclosure.
61
Table of Contents
Our management evaluated, with the participation of our CEO and CFO, the effectiveness of our disclosure controls and procedures as of September 30, 2009, pursuant to paragraph (b) of Rules 13a-15 and 15d-15 under the Exchange Act. This evaluation included a review of the controls’ objectives and design, the operation of the controls, and the effect of the controls on the information presented in this Annual Report. Our management, including the CEO and CFO, do not expect that disclosure controls can or will prevent or detect all errors and all fraud, if any. A control system, no matter how well designed and operated, can provide only reasonable, not absolute, assurance that the objectives of the control system are met. Our disclosure controls and procedures are designed to provide such reasonable assurance of achieving their objectives. Also, the projection of any evaluation of the disclosure controls and procedures to future periods is subject to the risk that the disclosure controls and procedures may become inadequate because of changes in conditions, or that the degree of compliance with the policies or procedures may deteriorate.
Based on their review and evaluation, and subject to the inherent limitations described above, our CEO and CFO have concluded that our disclosure controls and procedures (as defined in Rules 13a-15(e) and 15d-15(e) under the Exchange Act) were effective as of September 30, 2009 at the above-described reasonable assurance level.
Internal Control over Financial Reporting—Management is responsible for establishing and maintaining adequate internal control over financial reporting, as defined in Rules 13a-15(f) and 15d-15(f) under the Exchange Act. Our internal control over financial reporting is designed to provide reasonable assurance regarding the reliability of financial reporting and the preparation of financial statements for external purposes in accordance with accounting principles generally accepted in the United States of America.
Because of inherent limitations, internal control over financial reporting may not prevent or detect misstatements. Therefore, even internal controls determined to be effective can provide only reasonable assurance with respect to financial statement preparation and presentation. The effectiveness of our internal control over financial reporting is subject to various inherent limitations, including cost limitations, judgments used in decision making, assumptions about the likelihood of future events, the possibility of human error, and the risk of fraud. The projection of any evaluation of effectiveness to future periods is subject to the risk that controls may become inadequate because of changes in conditions, or that the degree of compliance with policies may deteriorate. Because of these limitations, there can be no assurance that any system of internal control over financial reporting will be successful in preventing all errors or fraud or in making all material information known in a timely manner to the appropriate levels of management.
There has been no change in our internal control over financial reporting during the quarter ended September 30, 2009 that has materially affected, or is reasonably likely to materially affect, our internal control over financial reporting.
Management’s Report on Internal Control over Financial Reporting
Our management is responsible for establishing and maintaining adequate internal control over financial reporting. Our internal control system has been designed to provide reasonable assurance regarding the reliability of financial reporting and the preparation and presentation of our financial statements.
Our management has assessed the effectiveness of internal control over financial reporting as of September 30, 2009 using the criteria issued by the Committee of Sponsoring Organizations of the Treadway Commission in Internal Control—Integrated Framework. Based on that assessment, management believes that our internal control over financial reporting was effective as of September 30, 2009.
BDO Seidman, LLP, the independent registered public accounting firm which audits our consolidated financial statements, has issued the following attestation report on the effectiveness of our internal control over financial reporting.
62
Table of Contents
Report of Independent Registered Public Accounting Firm
The Board of Directors and Stockholders
Headwaters Incorporated
We have audited Headwaters Incorporated’s internal control over financial reporting as of September 30, 2009, based on criteria established in Internal Control—Integrated Framework issued by the Committee of Sponsoring Organizations of the Treadway Commission (the COSO criteria). Headwaters Incorporated’s management is responsible for maintaining effective internal control over financial reporting, and for its assessment of the effectiveness of internal control over financial reporting included in the accompanying Management’s Report on Internal Control over Financial Reporting. Our responsibility is to express an opinion on the Company’s internal control over financial reporting based on our audit.
We conducted our audit in accordance with the standards of the Public Company Accounting Oversight Board (United States). Those standards require that we plan and perform the audit to obtain reasonable assurance about whether effective internal control over financial reporting was maintained in all material respects. Our audit included obtaining an understanding of internal control over financial reporting, assessing the risk that a material weakness exists, testing and evaluating the design and operating effectiveness of internal control based on the assessed risk, and performing such other procedures as we considered necessary in the circumstances. We believe that our audit provides a reasonable basis for our opinion.
A company’s internal control over financial reporting is a process designed to provide reasonable assurance regarding the reliability of financial reporting and the preparation of financial statements for external purposes in accordance with generally accepted accounting principles. A company’s internal control over financial reporting includes those policies and procedures that (1) pertain to the maintenance of records that, in reasonable detail, accurately and fairly reflect the transactions and dispositions of the assets of the company; (2) provide reasonable assurance that transactions are recorded as necessary to permit preparation of financial statements in accordance with generally accepted accounting principles, and that receipts and expenditures of the company are being made only in accordance with authorizations of management and directors of the company; and (3) provide reasonable assurance regarding prevention or timely detection of unauthorized acquisition, use, or disposition of the company’s assets that could have a material effect on the financial statements.
Because of its inherent limitations, internal control over financial reporting may not prevent or detect misstatements. Also, projections of any evaluation of effectiveness to future periods are subject to the risk that controls may become inadequate because of changes in conditions, or that the degree of compliance with the policies or procedures may deteriorate.
In our opinion, Headwaters Incorporated maintained, in all material respects, effective internal control over financial reporting as of September 30, 2009, based on the COSO criteria.
We also have audited, in accordance with the standards of the Public Company Accounting Oversight Board (United States), the consolidated balance sheet of Headwaters Incorporated as of September 30, 2009, and the related consolidated statements of operations, changes in stockholders’ equity, and cash flows for the year then ended and our report dated November 20, 2009 expressed an unqualified opinion thereon.
| /s/ BDO Seidman, LLP |
| Costa Mesa, California November 20, 2009 |
| ITEM 9B. | OTHER INFORMATION |
None.
63
Table of Contents
PART III
| ITEM 10. | DIRECTORS AND EXECUTIVE OFFICERS OF THE REGISTRANT |
The applicable information to be set forth under the captions “Executive Officers,” “Corporate Governance,” “Section 16(a) Beneficial Ownership Reporting Compliance” and “Proposal No. 1—Election of Directors” in our Proxy Statement to be filed in January 2010 for the Annual Meeting of Stockholders to be held in 2010 (the “Proxy Statement”), is incorporated herein by reference.
| ITEM 11. | EXECUTIVE COMPENSATION |
The applicable information to be set forth under the captions “Executive Compensation” and “Corporate Governance” in the Proxy Statement is incorporated herein by reference.
| ITEM 12. | SECURITY OWNERSHIP OF CERTAIN BENEFICIAL OWNERS AND MANAGEMENT AND RELATED STOCKHOLDER MATTERS |
The information to be set forth under the captions “Summary Information about Equity Compensation Plans” and “Security Ownership of Certain Beneficial Owners and Management” in the Proxy Statement is incorporated herein by reference.
| ITEM 13. | CERTAIN RELATIONSHIPS AND RELATED TRANSACTIONS |
The information to be set forth under the caption “Transactions with Related Persons” in the Proxy Statement is incorporated herein by reference.
| ITEM 14. | PRINCIPAL ACCOUNTING FEES AND SERVICES |
The information to be set forth under the caption “Audit and Non-Audit Fees” in the Proxy Statement is incorporated herein by reference.
64
Table of Contents
PART IV
| ITEM 15. | EXHIBITS, FINANCIAL STATEMENT SCHEDULES |
| (a) | 1. Financial Statements |
| Consolidated Financial Statements of Headwaters Incorporated |
Page | |
| F-1 | ||
| Report of Ernst & Young LLP, Independent Registered Public Accounting Firm |
F-2 | |
| Consolidated Balance Sheets as of September 30, 2008 and 2009 |
F-3 | |
| Consolidated Statements of Operations for the years ended September 30, 2007, 2008 and 2009 |
F-4 | |
| F-5 | ||
| Consolidated Statements of Cash Flows for the years ended September 30, 2007, 2008 and 2009 |
F-6 | |
| F-7 |
| 2. Financial Statement Schedules |
All financial statement schedules for which provision is made in the applicable accounting regulations of the Securities and Exchange Commission are not required under the related instructions, are inapplicable, or the required information has been provided in the consolidated financial statements or notes thereto.
| 3. Listing of Exhibits |
For convenience, the name Headwaters is used throughout this listing although in some cases the name Covol was used in the original instrument.
| Exhibit No. |
Description |
Location | ||
| 1.1 | Placement Agency Agreement dated September 17, 2009, between Headwaters, Canaccord Adams Inc., Stephens Inc. and Avondale Partners, LLC | (25) | ||
| 3.1.9 | Amended and Restated Certificate of Incorporation of Headwaters dated 1 March 2005 | (8) | ||
| 3.2.5 | Amended and Restated By-Laws of Headwaters | (11) | ||
| 3.2.6 | Amendment of Amended and Restated By-Laws of Headwaters | (20) | ||
| 4.1 | Indenture dated as of January 22, 2007 between Headwaters and Wilmington Trust FSB, as Trustee, relating to 2.50% Convertible Senior Subordinated Notes due 2014 | (12) | ||
| 4.3 | Letter Agreement dated as of January 16, 2007 between Headwaters and JP Morgan Chase Bank | (12) | ||
| 4.4 | Letter Agreement dated as of January 16, 2007 between Headwaters and JP Morgan Chase Bank | (12) | ||
| 4.5 | Indenture dated as of December 19, 2008 between Headwaters and Wilmington Trust FSB, as Trustee, relating to 16% Convertible Senior Subordinated Notes due 2016 | (20) | ||
| 4.6 | Indenture dated as of March 30, 2009 between Headwaters and Wilmington Trust FSB, as Trustee, relating to 14.75% Convertible Senior Subordinated Notes due 2014 | (21) | ||
| 4.7 | Indenture dated as of October 27, 2009 among Headwaters, the guarantors named therein and Wilmington Trust FSB, as Trustee and Collateral Agent, relating to 11.375% Senior Secured Notes due 2014 (originally designated as Exhibit No. 4.1) | (26) | ||
| 4.8 | Registration Rights Agreement, dated as of October 27, 2009, among Headwaters and certain of its subsidiaries named therein, Deutsche Bank Securities Inc., Morgan Stanley & Co. Incorporated, Bank of America Securities LLC, U.S. Bancorp Investments, Inc., Canaccord Adams Inc. and Stephens Inc. (originally designated as Exhibit No. 4.2) | (26) | ||
65
Table of Contents
| Exhibit No. |
Description |
Location | ||
| 4.9 | Loan and Security Agreement dated as of October 27, 2009, among certain Headwaters subsidiaries and Bank of America, N.A. as the administrative agent, arranger and collateral agent, and the lenders named therein (originally designated as Exhibit No. 4.3) | (26) | ||
| 4.10 | Intercreditor Agreement dated October 27, 2009, among Bank of America, N.A. as Revolving Agent, Wilmington Trust FSB, as Notes Collateral Agent, and the Grantors (as defined in the Intercreditor Agreement) from time to time party thereto | * | ||
| 10.60 | Employment Agreement with Kirk A. Benson dated August 25, 2005 | (9) | ||
| 10.60.1 | First Amendment to Employment Agreement with Kirk A. Benson dated September 25, 2007 | (24) | ||
| 10.60.2 | Second Amendment to Employment Agreement with Kirk A. Benson dated November 3, 2008 (originally designated as Exhibit No. 10.60.1) | (16) | ||
| 10.86 | Securities Purchase Agreement by and among Eldorado Stone Holdings Co., LP, et al. and Headwaters dated April 21, 2004 | (4) | ||
| 10.89 | Agreement and Plan of Merger by and among Headwaters Incorporated, Headwaters T Acquisition Corp., and Tapco Holdings, Inc., dated as of September 8, 2004 | (5) | ||
| 10.96 | Employment agreement with Steven G. Stewart dated October 26, 2007 | (13) | ||
| 10.99 | Form of Exchange Agreement for 16% Convertible Senior Subordinated Notes due 2016 | (23) | ||
| 10.100 | Form of Exchange Agreement for 2.875% Convertible Senior Subordinated Notes due 2016 | (24) | ||
| 12 | Computation of ratio of earnings to combined fixed charges and preferred stock dividends | * | ||
| 14 | Code of Ethics | (7) | ||
| 16 | Letter re change in certifying accountant | (22) | ||
| 21 | List of Subsidiaries of Headwaters | * | ||
| 23.1 | Consent of BDO Seidman, LLP | * | ||
| 23.2 | Consent of Ernst & Young LLP, Independent Registered Accounting Firm | * | ||
| 31.1 | Rule 13a-14(a)/15d-14(a) Certification of Chief Executive Officer | * | ||
| 31.2 | Rule 13a-14(a)/15d-14(a) Certification of Chief Financial Officer | * | ||
| 32 | Section 1350 Certifications of Chief Executive Officer and Chief Financial Officer | * | ||
| 99.1 | 2000 Employee Stock Purchase Plan, as Amended and Restated Effective 20 November 2007 | (15) | ||
| 99.2 | 1995 Stock Option Plan (originally designated as Exhibit No. 10.5) | (1) | ||
| 99.2.1 | First Amendment to the 1995 Stock Option Plan (originally designated as Exhibit 10.5.1) | (1) | ||
| 99.2.2 | 1996 Stock Option Agreement | (2) | ||
| 99.2.3 | 1998 Stock Option Agreement | (2) | ||
| 99.2.4 | 2001 Stock Option Agreement | (2) | ||
| 99.2.5 | 2002 Stock Option Agreement | (2) | ||
| 99.4 | 2002 Stock Incentive Plan | (6) | ||
| 99.7 | 2003 Stock Incentive Plan | (3) | ||
66
Table of Contents
| Exhibit No. |
Description |
Location | ||
| 99.10 | Amended and Restated Long Term Incentive Compensation Plan (Effective March 3, 2009) | (19) | ||
| 99.11 | Nominating and Corporate Governance Committee Charter, dated December 19, 2008 | (18) | ||
| 99.12 | Audit Committee Charter, dated December 19, 2008 | (18) | ||
| 99.13 | Compensation Committee Charter, dated December 19, 2008 | (18) | ||
| 99.16 | Form of 2006 Long-Term Incentive Cash Bonus Agreement | (10) | ||
| 99.17 | Form of 2006 Executive Change in Control Agreement | (10) | ||
| 99.18 | Amended Deferred Compensation Plan | (14) | ||
| 99.20 | Stock Appreciation Right Agreement (November 2007) | (15) | ||
| 99.20.1 | Form of Notice of Stock Appreciation Right Grant (November 2007) | (15) | ||
| 99.21 | Restricted Stock Award Agreement (November 2007) | (15) | ||
| 99.21.1 | Form of Restricted Stock Award Grant Notice (November 2007) | (15) | ||
| 99.22 | Short-Term Incentive Bonus Plan, As Amended and Restated Effective 1 October 2007 | (15) | ||
| 99.23 | Broad-Based Management Bonus Plan, As Amended and Restated Effective 1 October 2007 | (15) | ||
| 99.24 | Form of Common Stock Certificate | (17) | ||
| 99.25 | Form of Performance Unit Award Agreement (October 2008) | (18) | ||
| 99.26 | Form of Director Restricted Stock Unit Award Agreement (January 2009) | (18) | ||
| 99.27 | Form of Subscription Agreement (originally designated as Exhibit No. 99.1) | (25) | ||
| 99.28 | Prospectus Supplement dated September 17, 2009 (originally designated as Exhibit No. 99.2) | (25) | ||
| * | Filed herewith. |
Unless another exhibit number is indicated as the exhibit number for the exhibit as “originally filed,” the exhibit number in the filing in which any exhibit was originally filed and to which reference is made hereby is the same as the exhibit number assigned herein to the exhibit.
| (1) | Incorporated by reference to the indicated exhibit filed with Headwaters’ Registration Statement on Form 10, filed February 26, 1996. |
| (2) | Incorporated by reference to the indicated exhibit filed with Headwaters’ Annual Report on Form 10-K, for the fiscal year ended September 30, 2002. |
| (3) | Incorporated by reference to the indicated exhibit filed with Headwaters’ Quarterly Report on Form 10-Q, for the quarter ended December 31, 2002. |
| (4) | Incorporated by reference to the indicated exhibit filed with Headwaters’ Current Report on Form 8-K/A, for the event dated April 21, 2004, filed December 7, 2004. |
| (5) | Incorporated by reference to the indicated exhibit filed with Headwaters’ Current Report on Form 8-K/A, for the event dated September 8, filed December 13, 2004. |
| (6) | Incorporated by reference to the indicated exhibit filed with Headwaters’ Annual Report on Form 10-K, for the fiscal year ended September 30, 2004. |
| (7) | Incorporated by reference to the indicated exhibit filed with Headwaters’ Quarterly Report on Form 10-Q, for the quarter ended March 31, 2005. |
| (8) | Incorporated by reference to the indicated exhibit filed with Headwaters’ Current Report on Form 8-K, for the event dated May 27, 2005, filed June 1, 2005. |
67
Table of Contents
| (9) | Incorporated by reference to the indicated exhibit filed with Headwaters’ Current Report on Form 8-K, for the event dated August 25, 2005, filed August 29, 2005. |
| (10) | Incorporated by reference to the indicated exhibit filed with Headwaters’ Quarterly Report on Form 10-Q, for the quarter ended June 30, 2006. |
| (11) | Incorporated by reference to the indicated exhibit filed with Headwaters’ Annual Report on Form 10-K, for the fiscal year ended September 30, 2006. |
| (12) | Incorporated by reference to the indicated exhibit filed with Headwaters’ Current Report on Form 8-K, for the event dated January 22, 2007, filed January 22, 2007. |
| (13) | Incorporated by reference to the indicated exhibit filed with Headwaters’ Current Report on Form 8-K, for the event dated October 26, 2007, filed October 30, 2007. |
| (14) | Incorporated by reference to the indicated exhibit filed with Headwaters’ Annual Report on Form 10-K, for the fiscal year ended September 30, 2007. |
| (15) | Incorporated by reference to the indicated exhibit filed with Headwaters’ Quarterly Report on Form 10-Q, for the quarter ended December 31, 2007. |
| (16) | Incorporated by reference to the indicated exhibit filed with Headwaters’ Current Report on Form 8-K, for the event dated November 3, 2008, filed November 4, 2008. |
| (17) | Incorporated by reference to the indicated exhibit filed with Headwaters’ Annual Report on Form 10-K, for the fiscal year ended September 30, 2008. |
| (18) | Incorporated by reference to the indicated exhibit filed with Headwaters’ Quarterly Report on Form 10-Q, for the quarter ended December 31, 2008. |
| (19) | Incorporated by reference to the indicated exhibit filed with Headwaters’ Quarterly Report on Form 10-Q, for the quarter ended March 31, 2009. |
| (20) | Incorporated by reference to the indicated exhibit filed with Headwaters’ Current Report on Form 8-K, for the event dated December 19, 2008, filed December 22, 2008. |
| (21) | Incorporated by reference to the indicated exhibit filed with Headwaters’ Current Report on Form 8-K, for the event dated March 30, 2009, filed April 3, 2009. |
| (22) | Incorporated by reference to the indicated exhibit filed with Headwaters’ Current Report on Form 8-K, for the event dated April 10, 2009, filed April 20, 2009. |
| (23) | Incorporated by reference to the indicated exhibit filed with Headwaters’ Current Report on Form 8-K, for the event dated July 23, filed July 24, 2009. |
| (24) | Incorporated by reference to the indicated exhibit filed with Headwaters’ Current Report on Form 8-K, for the event dated July 29, 2009, filed July 31, 2009. |
| (25) | Incorporated by reference to the indicated exhibit filed with Headwaters’ Current Report on Form 8-K, for the event dated September 17, 2009, filed September 17, 2009. |
| (26) | Incorporated by reference to the indicated exhibit filed with Headwaters’ Current Report on Form 8-K, for the event dated October 27, 2009, filed October 27, 2009. |
| (b) | Exhibits |
The response to this portion of Item 15 is submitted as a separate section of this report. See Item 15 (a) 3 above.
| (c) | Financial Statement Schedules |
The response to this portion of Item 15 is submitted as a separate section of this report. See Item 15 (a) 2 above.
68
Table of Contents
Pursuant to the requirements of Section 13 or 15(d) of the Securities Exchange Act of 1934, the Registrant has duly caused this report to be signed on its behalf by the undersigned, thereunto duly authorized.
| HEADWATERS INCORPORATED | ||
| By: | /S/ KIRK A. BENSON | |
| Kirk A. Benson Chief Executive Officer (Principal Executive Officer) | ||
| By: | /S/ STEVEN G. STEWART | |
| Steven G. Stewart Chief Financial Officer (Principal Financial and Accounting Officer) | ||
| Date: November 20, 2009 | ||
KNOW ALL PERSONS BY THESE PRESENTS, that each person whose signature appears below constitutes and appoints Harlan M. Hatfield and Steven G. Stewart, and each of them, his/her true and lawful attorneys-in-fact and agents, each with full power of substitution and resubstitution, for him/her and in his/her name, place and stead, in any and all capacities, to sign any and all amendments to this report on Form 10-K, and to file the same, with exhibits thereto and other documents in connection therewith, with the Securities and Exchange Commission, granting unto said attorneys-in-fact and agents, and each of them, full power and authority to do and perform each and every act and thing requisite and necessary to be done, as fully to all intents and purposes as he/she might or could do in person, hereby ratifying and confirming all that each of said attorneys-in-fact and agents or their substitute or substitutes may lawfully do or cause to be done by virtue hereof.
Pursuant to the requirements of the Securities Exchange Act of 1934, this report has been signed below by the following persons on behalf of the Registrant and in the capacities and on the dates indicated.
| SIGNATURE |
TITLE |
DATE | ||
| /S/ KIRK A. BENSON Kirk A. Benson |
Director and Chief Executive Officer (Principal Executive Officer) | November 20, 2009 | ||
| /S/ STEVEN G. STEWART Steven G. Stewart |
Chief Financial Officer (Principal Financial and Accounting Officer) | November 20, 2009 | ||
| /S/ JAMES A. HERICKHOFF James A. Herickhoff |
Director | November 20, 2009 | ||
| /S/ RAYMOND J. WELLER Raymond J. Weller |
Director | November 20, 2009 | ||
| /S/ E. J. “JAKE” GARN E. J. “Jake” Garn |
Director | November 20, 2009 | ||
| /S/ R SAM CHRISTENSEN R Sam Christensen |
Director | November 20, 2009 | ||
| /S/ WILLIAM S. DICKINSON William S. Dickinson |
Director | November 20, 2009 | ||
| /S/ MALYN K. MALQUIST Malyn K. Malquist |
Director | November 20, 2009 | ||
| /S/ BLAKE O. FISHER, JR. Blake O. Fisher, Jr. |
Director | November 20, 2009 | ||
69
Table of Contents
Report of Independent Registered Public Accounting Firm
The Board of Directors and Stockholders
Headwaters Incorporated
We have audited the accompanying consolidated balance sheet of Headwaters Incorporated as of September 30, 2009 and the related consolidated statements of operations, changes in stockholders’ equity, and cash flows for the year then ended. These financial statements are the responsibility of the Company’s management. Our responsibility is to express an opinion on these financial statements based on our audit.
We conducted our audit in accordance with the standards of the Public Company Accounting Oversight Board (United States). Those standards require that we plan and perform the audit to obtain reasonable assurance about whether the financial statements are free of material misstatement. An audit includes examining, on a test basis, evidence supporting the amounts and disclosures in the financial statements, assessing the accounting principles used and significant estimates made by management, as well as evaluating the overall financial statement presentation. We believe that our audit provides a reasonable basis for our opinion.
In our opinion, the financial statements referred to above present fairly, in all material respects, the consolidated financial position of Headwaters Incorporated at September 30, 2009, and the consolidated results of its operations and its cash flows for the year then ended, in conformity with accounting principles generally accepted in the United States of America.
We also have audited, in accordance with the standards of the Public Company Accounting Oversight Board (United States), the effectiveness of Headwaters Incorporated’s internal control over financial reporting as of September 30, 2009, based on criteria established in Internal Control—Integrated Framework issued by the Committee of Sponsoring Organizations of the Treadway Commission (COSO) and our report dated November 20, 2009 expressed an unqualified opinion thereon.
/s/ BDO Seidman, LLP
Costa Mesa, California
November 20, 2009
F-1
Table of Contents
Report of Ernst & Young LLP, Independent Registered Public Accounting Firm
The Board of Directors and Stockholders
Headwaters Incorporated
We have audited the accompanying consolidated balance sheet of Headwaters Incorporated as of September 30, 2008, and the related consolidated statements of operations, changes in stockholders’ equity, and cash flows for each of the two years in the period ended September 30, 2008. These financial statements are the responsibility of the Company’s management. Our responsibility is to express an opinion on these financial statements based on our audits.
We conducted our audits in accordance with the standards of the Public Company Accounting Oversight Board (United States). Those standards require that we plan and perform the audit to obtain reasonable assurance about whether the financial statements are free of material misstatement. An audit includes examining, on a test basis, evidence supporting the amounts and disclosures in the financial statements. An audit also includes assessing the accounting principles used and significant estimates made by management, as well as evaluating the overall financial statement presentation. We believe that our audits provide a reasonable basis for our opinion.
In our opinion, the financial statements referred to above present fairly, in all material respects, the consolidated financial position of Headwaters Incorporated at September 30, 2008, and the consolidated results of its operations and its cash flows for each of the two years in the period ended September 30, 2008, in conformity with U.S. generally accepted accounting principles.
As discussed in Note 8 to the consolidated financial statements, in 2007 the Company changed its method of accounting for income taxes.
/s/ Ernst & Young LLP
Salt Lake City, Utah
November 19, 2008
F-2
Table of Contents
CONSOLIDATED BALANCE SHEETS
| As of September 30, | ||||||||
| (in thousands, except par value) |
2008 | 2009 | ||||||
| ASSETS |
||||||||
| Current assets: |
||||||||
| Cash and cash equivalents |
$ | 21,637 | $ | 15,934 | ||||
| Trade receivables, net |
117,595 | 91,411 | ||||||
| Inventories |
53,068 | 38,729 | ||||||
| Current and deferred income taxes |
37,518 | 28,767 | ||||||
| Other |
10,568 | 11,855 | ||||||
| Total current assets |
240,386 | 186,696 | ||||||
| Property, plant and equipment, net |
304,835 | 321,316 | ||||||
| Other assets: |
||||||||
| Intangible assets, net |
226,168 | 203,632 | ||||||
| Goodwill |
582,111 | 115,999 | ||||||
| Other |
48,486 | 64,281 | ||||||
| Total other assets |
856,765 | 383,912 | ||||||
| Total assets |
$ | 1,401,986 | $ | 891,924 | ||||
| LIABILITIES AND STOCKHOLDERS’ EQUITY |
||||||||
| Current liabilities: |
||||||||
| Accounts payable |
$ | 27,688 | $ | 20,242 | ||||
| Accrued personnel costs |
29,873 | 20,338 | ||||||
| Other accrued liabilities |
58,168 | 47,675 | ||||||
| Total current liabilities |
115,729 | 88,255 | ||||||
| Long-term liabilities: |
||||||||
| Long-term debt |
532,500 | 456,342 | ||||||
| Deferred income taxes |
87,026 | 15,190 | ||||||
| Unrecognized income tax benefits |
18,441 | 12,140 | ||||||
| Other |
16,738 | 15,566 | ||||||
| Total long-term liabilities |
654,705 | 499,238 | ||||||
| Total liabilities |
770,434 | 587,493 | ||||||
| Commitments and contingencies |
||||||||
| Stockholders’ equity: |
||||||||
| Common stock, $0.001 par value; authorized 100,000 shares; issued and outstanding: 42,035 shares at September 30, 2008 (including 564 shares held in treasury) and 60,245 shares at September 30, 2009 (including 165 shares held in treasury) |
42 | 60 | ||||||
| Capital in excess of par value |
509,977 | 592,860 | ||||||
| Retained earnings (accumulated deficit) |
130,394 | (285,156 | ) | |||||
| Treasury stock and other |
(8,861 | ) | (3,333 | ) | ||||
| Total stockholders’ equity |
631,552 | 304,431 | ||||||
| Total liabilities and stockholders’ equity |
$ | 1,401,986 | $ | 891,924 | ||||
See accompanying notes.
F-3
Table of Contents
CONSOLIDATED STATEMENTS OF OPERATIONS
| Year ended September 30, | ||||||||||||
| (in thousands, except per-share data) |
2007 | 2008 | 2009 | |||||||||
| Revenue: |
||||||||||||
| Light building products |
$ | 544,087 | $ | 457,008 | $ | 340,688 | ||||||
| Heavy construction materials |
306,394 | 313,373 | 260,934 | |||||||||
| Energy technology |
357,363 | 116,023 | 65,054 | |||||||||
| Total revenue |
1,207,844 | 886,404 | 666,676 | |||||||||
| Cost of revenue: |
||||||||||||
| Light building products |
383,505 | 337,315 | 258,809 | |||||||||
| Heavy construction materials |
217,619 | 226,077 | 186,067 | |||||||||
| Energy technology |
212,152 | 90,201 | 75,252 | |||||||||
| Total cost of revenue |
813,276 | 653,593 | 520,128 | |||||||||
| Gross profit |
394,568 | 232,811 | 146,548 | |||||||||
| Operating expenses: |
||||||||||||
| Amortization |
22,885 | 22,396 | 23,358 | |||||||||
| Research and development |
17,744 | 14,996 | 9,774 | |||||||||
| Selling, general and administrative |
155,597 | 143,300 | 115,902 | |||||||||
| Goodwill impairment |
98,000 | 205,000 | 465,656 | |||||||||
| Total operating expenses |
294,226 | 385,692 | 614,690 | |||||||||
| Operating income (loss) |
100,342 | (152,881 | ) | (468,142 | ) | |||||||
| Other income (expense): |
||||||||||||
| Net interest expense |
(31,061 | ) | (23,801 | ) | (39,027 | ) | ||||||
| Other, net |
(10,940 | ) | 6,499 | 7,082 | ||||||||
| Total other income (expense), net |
(42,001 | ) | (17,302 | ) | (31,945 | ) | ||||||
| Income (loss) before income taxes |
58,341 | (170,183 | ) | (500,087 | ) | |||||||
| Income tax benefit (provision) |
(38,287 | ) | 503 | 84,537 | ||||||||
| Net income (loss) |
$ | 20,054 | $ | (169,680 | ) | $ | (415,550 | ) | ||||
| Basic earnings (loss) per share |
$ | 0.48 | $ | (4.10 | ) | $ | (9.59 | ) | ||||
| Diluted earnings (loss) per share |
$ | 0.47 | $ | (4.10 | ) | $ | (9.59 | ) | ||||
See accompanying notes.
F-4
Table of Contents
CONSOLIDATED STATEMENTS OF CHANGES IN STOCKHOLDERS’ EQUITY
| Common stock | Capital in excess of par value |
Retained earnings (accumulated deficit) |
Treasury stock, at cost |
Other | Total stockholders’ equity |
|||||||||||||||||||||
| (in thousands) |
Shares | Amount | ||||||||||||||||||||||||
| Balances as of September 30, 2006 |
42,306 | $ | 42 | $ | 502,265 | $ | 299,866 | $ | (2,155 | ) | $ | 940 | $ | 800,958 | ||||||||||||
| Exercise of stock options |
53 | — | 477 | 477 | ||||||||||||||||||||||
| 116 shares of treasury stock transferred to employee stock purchase plan, at cost |
1,152 | 932 | 2,084 | |||||||||||||||||||||||
| Stock-based compensation |
6 | — | 10,060 | 10,060 | ||||||||||||||||||||||
| Reduction of deferred tax assets related to cancellation of stock- based awards |
(6,815 | ) | (6,815 | ) | ||||||||||||||||||||||
| Convertible note hedge and related warrants, net |
(11,830 | ) | (11,830 | ) | ||||||||||||||||||||||
| Deferred taxes on convertible note hedge |
16,187 | 16,187 | ||||||||||||||||||||||||
| Other comprehensive income (loss), net of taxes—cash flow hedges and foreign currency translation adjustments |
(925 | ) | (925 | ) | ||||||||||||||||||||||
| Net income for the year ended September 30, 2007 |
20,054 | 20,054 | ||||||||||||||||||||||||
| Balances as of September 30, 2007 |
42,365 | 42 | 511,496 | 319,920 | (1,223 | ) | 15 | 830,250 | ||||||||||||||||||
| Purchase of 1,205 shares of treasury stock, at cost |
(14,841 | ) | (14,841 | ) | ||||||||||||||||||||||
| Cancellation of 623 shares of treasury stock |
(623 | ) | — | (7,335 | ) | 7,335 | — | |||||||||||||||||||
| 156 shares of treasury stock transferred to employee stock purchase plan, at cost |
177 | 1,448 | 1,625 | |||||||||||||||||||||||
| Issuance of restricted stock, net of cancellations |
206 | — | — | |||||||||||||||||||||||
| Exercise of stock options |
87 | — | 274 | 274 | ||||||||||||||||||||||
| Stock-based compensation |
5,365 | 5,365 | ||||||||||||||||||||||||
| Other comprehensive income (loss), net of taxes—cash flow hedge and foreign currency translation adjustments |
(1,595 | ) | (1,595 | ) | ||||||||||||||||||||||
| Cumulative effect of change in accounting for uncertain tax positions—adoption of FIN 48 |
(19,846 | ) | (19,846 | ) | ||||||||||||||||||||||
| Net loss for the year ended September 30, 2008 |
(169,680 | ) | (169,680 | ) | ||||||||||||||||||||||
| Balances as of September 30, 2008 |
42,035 | 42 | 509,977 | 130,394 | (7,281 | ) | (1,580 | ) | 631,552 | |||||||||||||||||
| Issuance of common stock, net of offering costs of $2,947 |
9,600 | 10 | 34,483 | 34,493 | ||||||||||||||||||||||
| Issuance of common stock in exchange for convertible senior subordinated notes, net of income tax effect of $11,237 |
8,350 | 8 | 46,497 | 46,505 | ||||||||||||||||||||||
| Issuance of restricted stock, net of cancellations |
187 | — | — | |||||||||||||||||||||||
| Exercise of stock options |
73 | — | 410 | 410 | ||||||||||||||||||||||
| Income tax benefit from exercise of stock options |
35 | 35 | ||||||||||||||||||||||||
| 399 shares of treasury stock transferred to employee stock purchase plan, at cost |
(4,152 | ) | 5,234 | 1,082 | ||||||||||||||||||||||
| Stock-based compensation |
5,610 | 5,610 | ||||||||||||||||||||||||
| Other comprehensive income, net of taxes—cash flow hedge and foreign currency translation adjustments |
294 | 294 | ||||||||||||||||||||||||
| Net loss for the year ended September 30, 2009 |
(415,550 | ) | (415,550 | ) | ||||||||||||||||||||||
| Balances as of September 30, 2009 |
60,245 | $ | 60 | $ | 592,860 | $ | (285,156 | ) | $ | (2,047 | ) | $ | (1,286 | ) | $ | 304,431 | ||||||||||
See accompanying notes.
F-5
Table of Contents
CONSOLIDATED STATEMENTS OF CASH FLOWS
| Year ended September 30, | ||||||||||||
| (in thousands) |
2007 | 2008 | 2009 | |||||||||
| Cash flows from operating activities: |
||||||||||||
| Net income (loss) |
$ | 20,054 | $ | (169,680 | ) | $ | (415,550 | ) | ||||
| Adjustments to reconcile net income (loss) to net cash provided by operating activities: |
||||||||||||
| Goodwill impairment |
98,000 | 205,000 | 465,656 | |||||||||
| Depreciation and amortization |
72,199 | 68,884 | 66,073 | |||||||||
| Stock-based compensation |
10,060 | 5,297 | 5,610 | |||||||||
| Interest expense related to amortization of debt issue costs |
5,318 | 2,773 | 6,385 | |||||||||
| Deferred income taxes |
691 | 6,168 | (75,726 | ) | ||||||||
| Net gain from convertible debt extinguishment and conversion transactions |
— | — | (6,865 | ) | ||||||||
| Net losses (gains) of unconsolidated joint ventures |
895 | 8,309 | (2,185 | ) | ||||||||
| Net loss (gain) on disposition of property, plant and equipment |
2,322 | (7,091 | ) | (357 | ) | |||||||
| Amortization of non-refundable license fees |
(22,067 | ) | (5,517 | ) | — | |||||||
| Decrease (increase) in trade receivables |
(54,401 | ) | 70,739 | 26,184 | ||||||||
| Decrease in inventories |
9,929 | 2,650 | 13,360 | |||||||||
| Increase (decrease) in accounts payable and accrued liabilities |
21,241 | (49,390 | ) | (16,233 | ) | |||||||
| Other changes in operating assets and liabilities, net |
(14,268 | ) | (14,654 | ) | (15,701 | ) | ||||||
| Net cash provided by operating activities |
149,973 | 123,488 | 50,651 | |||||||||
| Cash flows from investing activities: |
||||||||||||
| Purchase of property, plant and equipment |
(54,986 | ) | (116,201 | ) | (64,208 | ) | ||||||
| Proceeds from disposition of property, plant and equipment |
597 | 13,204 | 3,187 | |||||||||
| Payments for acquisitions, net of cash acquired |
(50,219 | ) | (24,000 | ) | (10,792 | ) | ||||||
| Investments in joint ventures |
(1,320 | ) | (247 | ) | (510 | ) | ||||||
| Net decrease (increase) in other assets |
23 | (5,827 | ) | (4,250 | ) | |||||||
| Net cash used in investing activities |
(105,905 | ) | (133,071 | ) | (76,573 | ) | ||||||
| Cash flows from financing activities: |
||||||||||||
| Net proceeds from issuance of common stock |
— | — | 34,493 | |||||||||
| Net proceeds from issuance of long-term debt |
154,424 | 33,375 | 42,659 | |||||||||
| Payments on long-term debt |
(212,587 | ) | (45,000 | ) | (54,659 | ) | ||||||
| Convertible debt and other debt issue costs |
— | — | (3,801 | ) | ||||||||
| Employee stock purchases |
2,084 | 1,625 | 1,082 | |||||||||
| Proceeds from exercise of stock options |
477 | 274 | 410 | |||||||||
| Income tax benefit from exercise of stock options |
— | — | 35 | |||||||||
| Treasury stock purchases |
— | (14,841 | ) | — | ||||||||
| Convertible note hedge and related warrants, net |
(11,830 | ) | — | — | ||||||||
| Net cash provided by (used in) financing activities |
(67,432 | ) | (24,567 | ) | 20,219 | |||||||
| Net decrease in cash and cash equivalents |
(23,364 | ) | (34,150 | ) | (5,703 | ) | ||||||
| Cash and cash equivalents, beginning of year |
79,151 | 55,787 | 21,637 | |||||||||
| Cash and cash equivalents, end of year |
$ | 55,787 | $ | 21,637 | $ | 15,934 | ||||||
| Supplemental schedule of non-cash investing and financing activities: |
||||||||||||
| Exchanges of convertible senior subordinated notes |
$ | — | $ | — | $ | 90,656 | ||||||
| Issuance of common stock in exchange for convertible debt |
— | — | 57,742 | |||||||||
| Purchase of assets in exchange for future obligations |
— | 9,967 | — | |||||||||
| Net increase in accrued liabilities for acquisition-related commitments |
24,639 | 8,250 | — | |||||||||
| Cancellation of treasury stock |
— | 7,335 | — | |||||||||
| Supplemental disclosure of cash flow information: |
||||||||||||
| Cash paid for interest |
$ | 31,430 | $ | 26,113 | $ | 31,808 | ||||||
| Cash paid (refunded) for income taxes |
48,251 | 16,496 | (3,731 | ) | ||||||||
See accompanying notes.
F-6
Table of Contents
NOTES TO CONSOLIDATED FINANCIAL STATEMENTS
September 30, 2009
| 1. | Description of Business and Organization |
Headwaters Incorporated (Headwaters) is a diversified company incorporated in Delaware, which provides products, technologies and services in three industries: light building products, heavy construction materials and energy technology. Headwaters’ vision is to improve sustainability by transforming underutilized resources into valuable products.
The light building products segment (formerly referred to as building products) designs, manufactures, and sells manufactured architectural stone, exterior siding accessories (such as shutters, mounting blocks, and vents), concrete block and other building products. Headwaters believes that many of its branded products have a leading market position. Revenue from Headwaters’ light building products businesses are diversified geographically and also by market, including the new housing and residential repair and remodeling markets, as well as commercial construction markets.
The heavy construction materials segment (formerly referred to as coal combustion products) is a nationwide leader in the management and marketing of coal combustion products (CCPs), including fly ash used as a replacement for portland cement. Headwaters’ heavy construction materials business is comprised of a nationwide storage and distribution network and also provides CCP disposal and other services. Revenue is diversified geographically and by market.
The energy technology segment (formerly referred to as energy) is focused on reducing waste and increasing the value of energy-related feedstocks, primarily in the areas of low-value coal and oil. In coal, Headwaters owns and operates coal cleaning facilities that separate ash from waste coal to provide a refined coal product that is higher in Btu value and lower in impurities than the feedstock coal. Headwaters also licensed technology and sold reagents to the coal-based solid alternative fuel industry through December 31, 2007. In oil, Headwaters believes that its heavy oil upgrading technology represents a substantial improvement over current refining technologies. Headwaters’ heavy oil upgrading process uses a liquid catalyst precursor to generate a highly active molecular catalyst to convert low-value residual oil from refining into higher-value distillates that can be further refined into gasoline, diesel and other products.
Headwaters’ fiscal year ends on September 30 and unless otherwise noted, references to years refer to a fiscal year rather than a calendar year.
| 2. | Summary of Significant Accounting Policies |
Accounting Standards—Headwaters applies the accounting standards set forth by the Financial Accounting Standards Board (FASB), which standards are commonly referred to as generally accepted accounting principles, or GAAP. In June 2009, the FASB issued Statement of Financial Accounting Standards (SFAS) No. 168 which established the FASB Accounting Standards Codification (ASC) as the source of authoritative accounting principles to be applied in the preparation of financial statements in conformity with GAAP. Accordingly, references to authoritative GAAP are now based on the Codification, which is organized broadly by subject matter, or topic, rather than by original or specific FASB standards and related pronouncements.
Principles of Consolidation—The consolidated financial statements include the accounts of Headwaters, all of its subsidiaries and other entities in which Headwaters has a controlling interest. In accordance with the requirements of ASC Topic 810 Consolidation (originally issued as FASB Interpretation No. 46R, “Consolidation of Variable Interest Entities,” as revised), Headwaters is required to consolidate any variable
F-7
Table of Contents
HEADWATERS INCORPORATED
NOTES TO CONSOLIDATED FINANCIAL STATEMENTS, continued
September 30, 2009
interest entities for which it is the primary beneficiary; however, as of September 30, 2009, there are none that are material. For investments in entities in which Headwaters has a significant influence over operating and financial decisions (generally defined as owning a voting or economic interest of 20% to 50%), Headwaters applies the equity method of accounting. In instances where Headwaters’ investment is less than 20% and significant influence does not exist, investments are carried at cost. All significant intercompany transactions and accounts are eliminated in consolidation.
As described in more detail in Note 11, Headwaters made one acquisition in 2007 and one acquisition in 2008. These entities’ results of operations for the periods from the acquisition dates through September 30, 2009 have been consolidated with Headwaters’ results; their operations prior to the dates of acquisition have not been included in Headwaters’ consolidated results for any period.
Use of Estimates—The preparation of consolidated financial statements in conformity with U.S. generally accepted accounting principles requires management to make estimates and assumptions that affect i) the reported amounts of assets and liabilities and disclosures of contingent assets and liabilities at the date of the financial statements, and ii) the reported amounts of revenue and expenses during the reporting period. Actual results could differ materially from those estimates.
Segment Reporting, Major Customers and Other Concentrations of Risk—Headwaters operates three business segments, light building products, heavy construction materials and energy technology. Additional information about segments is presented in Note 3. No customer accounted for over 10% of total revenue in any year presented and more than 90% of Headwaters’ revenue is from sales within the United States. Approximately 11% of Headwaters’ total 2009 revenue and cost of revenue was for services, substantially all of which was in the heavy construction materials segment. Headwaters purchases all of the polypropylene used in its resin-based building products from a single supplier. Management believes that if necessary, the polypropylene could be obtained from other suppliers, although such a change would be disruptive.
Revenue Recognition and Cost of Revenue—Revenue from the sale of building products, CCPs and cleaned coal is recognized upon passage of title to the customer, which coincides with physical delivery and assumption of risk of loss by the customer. Estimated sales rebates, discounts and allowances pertaining to the sale of building products are provided for at the time of sale and are based upon established policies and historical experience. Revenues include transportation charges and shipping and handling fees associated with delivering products and materials to customers when the transportation or shipping and handling is contractually provided for between the customer and Headwaters. Cost of revenue includes shipping and handling fees.
CCP service revenues are primarily earned under long-term contracts to dispose of residual materials created by coal-fired electric power generation. Revenues under long-term service contracts are recognized concurrently with the removal of material and are based on the volume of material removed at established prices per ton. In compliance with contractual obligations, the cost of CCPs purchased from certain utilities is based on a percentage of the “net revenues” from sale of the CCPs purchased. Costs also include landfill fees and transportation charges to deliver non-marketable CCPs to landfills.
Through December 31, 2007, Headwaters licensed its technologies to the owners of 28 coal-based solid alternative fuel facilities from which Headwaters earned license fees and/or revenue from the sale of chemical reagents. Non-refundable advance license fees and royalty payments were also received from certain licensees under various terms and conditions. These non-refundable license fees and royalties were deferred and
F-8
Table of Contents
HEADWATERS INCORPORATED
NOTES TO CONSOLIDATED FINANCIAL STATEMENTS, continued
September 30, 2009
recognized on a straight-line basis through December 31, 2007, the period covered by the related license and royalty agreements and the expiration date of Section 45K tax credits. Recurring license fees or royalty payments were recognized in the period when earned, which coincided with the sale of alternative fuel by Headwaters’ licensees, provided standard revenue recognition criteria such as amounts being “fixed or determinable” were met. In certain instances, Headwaters was required to pay to third parties a portion of license fees received or cash proceeds from the sale of chemical reagents. In such cases, Headwaters recorded the net proceeds as revenue. Revenue from the sale of chemical reagents was recognized upon delivery of product and assumption of the risk of loss by the licensee or non-licensee customer.
Cash and Cash Equivalents—Headwaters considers all short-term, highly-liquid investments with a maturity of three months or less when purchased to be cash equivalents. Certain cash and cash equivalents are deposited with financial institutions, and at times such amounts exceed insured depository limits.
Receivables—Allowances are provided for uncollectible accounts and notes when deemed necessary. Such allowances are based on an account-by-account analysis of collectibility or impairment plus a provision for non-customer specific defaults based upon historical collection experience. Collateral is not required for trade receivables, but Headwaters performs periodic credit evaluations of its customers. Collateral is generally required for notes receivable.
Inventories—Inventories are stated at the lower of cost or market (net realizable value). Cost includes direct material, transportation, direct labor and allocations of manufacturing overhead costs and is determined primarily using the first-in, first-out method.
Property, Plant and Equipment—Property, plant and equipment are recorded at cost. For significant self-constructed assets, cost includes direct labor and interest. Expenditures for major improvements are capitalized; expenditures for maintenance, repairs and minor improvements are charged to expense as incurred. Assets are depreciated using primarily the straight-line method over their estimated useful lives, limited to the lease terms for improvements to leased assets. The units-of-production method is used to amortize coal rights and to depreciate certain infrastructure-type assets at coal cleaning sites and for certain light building products segment assets. Upon the sale or retirement of property, plant and equipment, any gain or loss on disposition is reflected in results of operations (in other income (expense)), and the related asset cost and accumulated depreciation or amortization are removed from the respective accounts.
Intangible Assets and Goodwill—Intangible assets consist primarily of identifiable intangible assets obtained in connection with prior year acquisitions, including those described in Note 11. Intangible assets are amortized using the straight-line method, Headwaters’ best estimate of the pattern of economic benefit, over their estimated useful lives. Goodwill consists of the excess of the purchase price for businesses acquired over the fair value of assets acquired, net of liabilities assumed. As described in more detail in Note 5, in accordance with ASC Topic 350 Intangibles–Goodwill and Other (originally issued as Statement of Financial Accounting Standards (SFAS) No. 142, “Accounting for Goodwill and Intangible Assets”), goodwill is not amortized, but is tested at least annually for impairment. Goodwill impairment charges were recorded in 2007, 2008 and 2009, as more fully described in Note 5.
Valuation of Long-Lived Assets—Headwaters evaluates the carrying value of long-lived assets, including intangible assets and goodwill, as well as the related amortization periods, to determine whether adjustments to carrying amounts or to estimated useful lives are required based on current events and circumstances. The
F-9
Table of Contents
HEADWATERS INCORPORATED
NOTES TO CONSOLIDATED FINANCIAL STATEMENTS, continued
September 30, 2009
carrying value of a long-lived asset is considered impaired when the anticipated cumulative undiscounted cash flow from that asset is less than its carrying value. In that event, a loss is recognized based on the amount by which the carrying value exceeds the fair market value of the long-lived asset. Except for the goodwill impairment charges, there were no material impairment losses recorded for long-lived assets in any of the years presented.
Debt Issue Costs—Debt issue costs represent direct costs incurred for the issuance of long-term debt. These costs are amortized to interest expense over the lives of the respective debt issues using the effective interest method. When debt is repaid early, the portion of unamortized debt issue costs related to the early principal repayment is written off and included in interest expense.
Financial Instruments—Derivatives are recorded in the consolidated balance sheet at fair value, as required by ASC Topic 815 Derivatives and Hedging (originally issued as SFAS No. 133, “Accounting for Derivative Instruments and Hedging Activities,” as amended). Accounting for changes in the fair value of a derivative depends on the intended use of the derivative, which is established at inception. For derivatives designated as cash flow hedges and which meet the effectiveness guidelines of ASC Topic 815, changes in fair value, to the extent effective, are recognized in other comprehensive income until the hedged item is recognized in earnings. Hedge effectiveness is measured at least quarterly based on the relative changes in fair value between the derivative contract and the hedged item over time. Any change in fair value of a derivative resulting from ineffectiveness, or an excluded component of the gain or loss, is recognized immediately and is recorded as interest expense.
Headwaters formally documents all hedge transactions at inception of the contract, including identification of the hedging instruments and the hedged items, as well as its risk management objectives and strategies for undertaking the hedge transaction. This process includes linking the derivatives that are designated as hedges to specific assets, liabilities, firm commitments or forecasted transactions. Headwaters also formally assesses the effectiveness of any hedging instruments on an ongoing basis. Historically, Headwaters has entered into hedge agreements to limit its exposure for interest rate movements and certain commodity price fluctuations. Currently, except for hedges entered into by joint ventures in which Headwaters is a partner, and the convertible note hedge and warrant transaction described in Note 6, Headwaters has no hedge agreements or other derivatives in place.
Asset Retirement Obligations—Headwaters has asset retirement obligations associated with the restoration of certain coal cleaning sites and certain CCP disposal sites. Headwaters records its legal obligations associated with the retirement of long-lived assets in accordance with the requirements of ASC Topic 410 Asset Retirements and Environmental Obligations (originally issued as SFAS No. 143, “Accounting for Asset Retirement Obligations”). The fair value of a liability for an asset retirement obligation is recognized in the consolidated financial statements when the asset is placed in service. At such time, the fair value of the liability is estimated using discounted cash flows. In subsequent periods, the retirement obligation is accreted to its estimated future value as of the asset retirement date through charges to operating expenses. An asset equal in value to the retirement obligation is also recorded as a component of the carrying amount of the long-lived asset and is depreciated over the asset’s useful life. As of September 30, 2008 and 2009, asset retirement obligations totaled approximately $3.0 million and $2.8 million, respectively.
Income Taxes—Headwaters files a consolidated federal income tax return with substantially all of its subsidiaries. Income taxes are accounted for on an entity-by-entity basis and are accounted for in accordance with ASC Topic 740 Income Taxes (originally issued as SFAS No. 109, “Accounting for Income Taxes”).
F-10
Table of Contents
HEADWATERS INCORPORATED
NOTES TO CONSOLIDATED FINANCIAL STATEMENTS, continued
September 30, 2009
Headwaters recognizes deferred tax assets or liabilities for the expected future tax consequences of events that have been recognized in the financial statements or in income tax returns. Deferred tax assets or liabilities are determined based upon the differences between the financial statement and tax bases of assets and liabilities using enacted tax rates expected to apply when the differences are expected to be settled or realized. Deferred income tax assets are periodically reviewed for recoverability based on current events, and valuation allowances are provided as necessary. Expenses for interest and penalties related to income taxes are classified with the income tax provision.
Research and Development Costs—Research and development costs consist primarily of personnel-related costs and are expensed as incurred.
Advertising Costs—Advertising costs are expensed as incurred, except for the cost of certain materials which are capitalized and amortized to expense as the materials are distributed. Total advertising costs were approximately $9.1 million, $8.9 million and $6.3 million in 2007, 2008 and 2009, respectively.
Warranty Costs—Provision is made for warranty costs at the time of sale, based upon established policies and historical experience. Warranty costs were approximately $1.6 million, $2.4 million and $2.4 million in 2007, 2008 and 2009, respectively.
Contingencies—In accounting for legal matters and other contingencies, Headwaters follows the guidance in ASC Topic 450 Contingencies (originally issued as SFAS No. 5, “Accounting for Contingencies”), under which loss contingencies are accounted for based upon the likelihood of an impairment of an asset or the incurrence of a liability. If a loss contingency is “probable” and the amount of loss can be reasonably estimated, it is accrued. If a loss contingency is “probable” but the amount of loss cannot be reasonably estimated, disclosure is made. If a loss contingency is “reasonably possible,” disclosure is made, including the potential range of loss, if determinable. Loss contingencies that are “remote” are neither accounted for nor disclosed. Gain contingencies are given no accounting recognition until realized, but are disclosed if material.
Stock-Based Compensation—Headwaters uses the fair value method of accounting for stock-based compensation required by ASC Topic 718 Compensation–Stock Compensation (originally issued as SFAS No. 123 (revised 2004), “Share-Based Payment”). ASC Topic 718 requires companies to expense the value of employee stock options and other equity-based awards. Stock-based compensation expense is reported within the same expense line items as used for cash compensation expense. Due to immateriality, Headwaters has not capitalized any compensation cost as part of the cost of any self-constructed or purchased asset. Excess tax benefits resulting from exercise of stock options and stock appreciation rights (SARs) are reflected in the consolidated statements of changes in stockholders’ equity and cash flows.
Headwaters recognizes compensation expense equal to the grant-date fair value of stock-based awards for all awards expected to vest, over the period during which the related service is rendered by grantees. The fair value of stock-based awards is determined primarily using the Black-Scholes-Merton option pricing model (B-S-M model), developed for use in estimating the fair value of traded options that have no vesting restrictions and that are fully transferable. Option valuation models require the input of certain subjective assumptions, including expected stock price volatility and expected term. For stock-based awards, Headwaters primarily uses the “graded vesting” or accelerated method to allocate compensation expense over the requisite service periods. Estimated forfeiture rates are based largely on historical data and ranged from 1% to 5% from 2007 through 2009, depending on the type of award and the award recipients. As of September 30, 2009, the estimated forfeiture rate for most unvested awards was 5% per year.
F-11
Table of Contents
HEADWATERS INCORPORATED
NOTES TO CONSOLIDATED FINANCIAL STATEMENTS, continued
September 30, 2009
Earnings per Share Calculation—Earnings per share (EPS) has been computed based on the weighted-average number of common shares outstanding. Diluted EPS computations reflect the increase in weighted-average common shares outstanding that would result from the assumed exercise of outstanding stock-based awards, calculated using the treasury stock method (as modified by ASC Topic 718), and the assumed conversion of convertible securities, using the if-converted method, when such stock-based awards or convertible securities are dilutive.
Recent Accounting Pronouncements—Fair Value. In September 2006, the FASB issued a new standard related to the measurement of fair value (ASC Topic 820 Fair Value Measurements and Disclosures (originally issued as SFAS No. 157, “Fair Value Measurements”). The new rules address how companies should measure fair value when they are required to use a fair value measure for recognition or disclosure purposes under GAAP. Headwaters adopted the new fair value rules as of October 1, 2008, but this adoption did not have a material effect on reported results for 2009. Headwaters uses fair value measurements to determine the reported amounts of assets acquired and liabilities assumed in purchase transactions, in testing for potential goodwill impairment, for disclosure of the fair value of financial instruments, and elsewhere. It is therefore possible that the new fair value rules could have a material effect on the reported amounts or disclosures in Headwaters’ consolidated financial statements in future periods.
Business Combinations and Consolidation. In December 2007, the FASB issued new standards related to business combinations and consolidation (ASC Topic 805 Business Combinations and Topic 810 Consolidation; originally issued as SFAS No. 141R, “Business Combinations,” and SFAS No. 160, “Accounting and Reporting of Noncontrolling Interest in Consolidated Financial Statements, an Amendment of ARB No. 51”). These standards, which Headwaters adopted on October 1, 2009, will significantly change the accounting for and reporting of any future business combinations or for any minority interest that arises in the future.
Derivatives and Hedging. In March 2008, the FASB issued a new standard related to disclosures about derivatives and hedging activities (ASC Topic 815 Derivatives and Hedging; originally issued as SFAS No. 161, “Disclosures about Derivative Instruments and Hedging Activities, an Amendment of SFAS No. 133”). This new standard requires enhanced disclosures about how and why an entity uses derivative instruments, how such instruments and related hedged items are accounted for, and how those instruments and items affect an entity’s financial position, financial performance, and cash flows. Headwaters had no derivatives outstanding as of September 30, 2009; however, the adoption of this standard on October 1, 2009 could affect future disclosures related to any derivative instruments or related hedges that are entered into in future periods.
Convertible Debt. In May 2008, the FASB issued new rules related to accounting for certain convertible debt (ASC Topic 470 Debt; originally issued as FASB Staff Position APB 14-1, “Accounting for Convertible Debt Instruments That May Be Settled in Cash upon Conversion (Including Partial Cash Settlement)”). The new rules specify that issuers of convertible debt that can be settled in cash should separately account for the liability (debt) and equity (conversion option) components in a manner that reflects the entity’s nonconvertible debt borrowing rate when interest cost is recognized. The adoption of the new rules, which for Headwaters was required October 1, 2009, requires different accounting for Headwaters’ 2.50% Convertible Senior Subordinated Notes due 2014 issued in January 2007, the 16% Convertible Senior Subordinated Notes due 2016 issued in December 2008, and the 14.75% Convertible Senior Subordinated Notes due 2014 issued in March and April 2009 (see Note 6). The new rules must be applied retrospectively to all periods presented, or all periods subsequent to January 2007 for Headwaters.
F-12
Table of Contents
HEADWATERS INCORPORATED
NOTES TO CONSOLIDATED FINANCIAL STATEMENTS, continued
September 30, 2009
The adoption of the new rules will result in a redetermination of the carrying amounts of Headwaters’ 2.50% convertible notes, 16% convertible notes and 14.75% convertible notes, calculated by measuring the fair values of similar debt instruments that do not have the conversion features, and recording an equity component for the difference between the original proceeds of the debt and the redetermined amounts of debt. Debt discount recorded as a result of the redetermination of the debt carrying values will be amortized using the interest method and will result in recognition of additional interest cost for all periods subsequent to January 2007. The original debt issuance costs will be allocated pro-rata between debt and equity issuance costs and accounted for accordingly. Basis differences that arise from this accounting which represent a temporary difference will also require the recording of deferred taxes. Also, a portion of the increased interest cost is required to be capitalized by ASC Topic 835 Interest (originally issued as SFAS No. 34, “Capitalization of Interest Cost”) if it is material. Headwaters currently estimates that the adoption of the new rules will increase reported interest cost by approximately $3.8 million, $6.0 million and $7.1 million in fiscal years 2007, 2008 and 2009, respectively; will decrease the reported 2009 gain on extinguishment of debt by approximately $8.9 million; and will not have a material effect on deferred income taxes or interest capitalized for any period.
Subsequent Events. In May 2009, the FASB issued a new standard for subsequent events (ASC Topic 855 Subsequent Events; originally issued as SFAS No. 165, “Subsequent Events”), which sets forth principles and requirements for evaluating, recognizing and disclosing events or transactions that occur subsequent to the balance sheet date in financial statements. With the exception of disclosing the date through which subsequent events are evaluated for potential recognition or disclosure in the consolidated financial statements, the new standard did not have a significant effect on Headwaters. Because Headwaters’ financial statements are considered issued when filed with the SEC, it has evaluated subsequent events to November 20, 2009, the filing date of this Form 10-K with the SEC.
Variable Interest Entities. In June 2009, the FASB issued a new standard amending the consolidation guidance applicable to variable interest entities (ASC Topic 810 Consolidation; originally issued as SFAS No. 167, “Amendments to FASB Interpretation No. 46(R)”). The new provisions, which significantly affect the overall analysis of which entities may be required to be consolidated, are effective for Headwaters as of October 1, 2010. These new rules could have an effect on which entities Headwaters is required to consolidate in future periods.
Other. Headwaters has reviewed all other recently issued accounting standards which have not yet been adopted in order to determine their potential effect, if any, on the results of operations or financial position of Headwaters. Based on that review, Headwaters does not currently believe that any of these other recent accounting pronouncements will have a significant effect on its current or future financial position, results of operations, cash flows or disclosures.
Reclassifications—Certain prior year amounts have been reclassified to conform to the current year’s presentation. The reclassifications had no effect on net income or total assets.
| 3. | Segment Reporting |
Headwaters currently operates three business segments: light building products, heavy construction materials and energy technology. These segments are managed and evaluated separately by management due to differences in their markets, operations, products and services. Revenues for the light building products segment consist of product sales to wholesale and retail distributors, contractors and other users of building products.
F-13
Table of Contents
HEADWATERS INCORPORATED
NOTES TO CONSOLIDATED FINANCIAL STATEMENTS, continued
September 30, 2009
Revenues for the heavy construction materials segment consist primarily of CCP product sales with a smaller amount of service revenue. Revenues for the energy technology segment through December 31, 2007 consisted primarily of sales of chemical reagents and license fees related to Headwaters’ former Section 45K business. Beginning January 1, 2008, revenues for this segment have consisted primarily of coal sales. Intersegment sales are immaterial.
The following segment information has been prepared in accordance with ASC Topic 280 Segment Reporting (originally issued as SFAS No. 131, “Disclosure about Segments of an Enterprise and Related Information”). Segment performance is evaluated primarily on revenue and operating income, although other factors are also used, such as income tax credits generated by the energy technology segment and EBITDA, which is defined as net income (loss) plus net interest expense, income taxes (as defined), depreciation and amortization, stock-based compensation, foreign currency translation gain or loss and goodwill and other impairments, consistent with the historical methodology Headwaters has used in prior periods.
Segment costs and expenses considered in deriving segment operating income (loss) include cost of revenue, amortization, research and development, and segment-specific selling, general and administrative expenses. Amounts included in the “Corporate” column represent expenses not specifically attributable to any segment and include administrative departmental costs and general corporate overhead. Segment assets reflect those specifically attributable to individual segments and primarily include accounts receivable, inventories, property, plant and equipment, intangible assets and goodwill. Cash and cash equivalents and certain other assets are included in the “Corporate” column. Segment information includes acquired subsidiaries’ results only for the periods subsequent to the dates of acquisition, and therefore the information may not be comparable among all years presented.
| 2007 | ||||||||||||||||||||
| (in thousands) |
Light building products |
Heavy construction materials |
Energy technology |
Corporate | Totals | |||||||||||||||
| Segment revenue |
$ | 544,087 | $ | 306,394 | $ | 357,363 | $ | — | $ | 1,207,844 | ||||||||||
| Depreciation and amortization |
$ | (49,467 | ) | $ | (12,850 | ) | $ | (9,449 | ) | $ | (433 | ) | $ | (72,199 | ) | |||||
| Operating income (loss) |
$ | (45,112 | ) | $ | 60,021 | $ | 112,418 | $ | (26,985 | ) | $ | 100,342 | ||||||||
| Net interest expense |
(31,061 | ) | ||||||||||||||||||
| Other income (expense), net |
(10,940 | ) | ||||||||||||||||||
| Income tax provision |
(38,287 | ) | ||||||||||||||||||
| Net income |
$ | 20,054 | ||||||||||||||||||
| Capital expenditures |
$ | 32,298 | $ | 6,092 | $ | 16,407 | $ | 189 | $ | 54,986 | ||||||||||
| Segment assets |
$ | 1,082,854 | $ | 303,343 | $ | 165,606 | $ | 104,086 | $ | 1,655,889 | ||||||||||
F-14
Table of Contents
HEADWATERS INCORPORATED
NOTES TO CONSOLIDATED FINANCIAL STATEMENTS, continued
September 30, 2009
| 2008 | ||||||||||||||||||||
| (in thousands) |
Light building products |
Heavy construction materials |
Energy technology |
Corporate | Totals | |||||||||||||||
| Segment revenue |
$ | 457,008 | $ | 313,373 | $ | 116,023 | $ | — | $ | 886,404 | ||||||||||
| Depreciation and amortization |
$ | (47,519 | ) | $ | (12,264 | ) | $ | (8,687 | ) | $ | (414 | ) | $ | (68,884 | ) | |||||
| Operating income (loss) |
$ | (186,530 | ) | $ | 58,974 | $ | (6,798 | ) | $ | (18,527 | ) | $ | (152,881 | ) | ||||||
| Net interest expense |
(23,801 | ) | ||||||||||||||||||
| Other income (expense), net |
6,499 | |||||||||||||||||||
| Income tax benefit |
503 | |||||||||||||||||||
| Net loss |
$ | (169,680 | ) | |||||||||||||||||
| Capital expenditures |
$ | 37,301 | $ | 7,151 | $ | 71,142 | $ | 607 | $ | 116,201 | ||||||||||
| Segment assets |
$ | 860,155 | $ | 304,000 | $ | 162,680 | $ | 75,151 | $ | 1,401,986 | ||||||||||
| 2009 | ||||||||||||||||||||
| (in thousands) |
Light building products |
Heavy construction materials |
Energy technology |
Corporate | Totals | |||||||||||||||
| Segment revenue |
$ | 340,688 | $ | 260,934 | $ | 65,054 | $ | — | $ | 666,676 | ||||||||||
| Depreciation and amortization |
$ | (40,193 | ) | $ | (12,371 | ) | $ | (13,169 | ) | $ | (340 | ) | $ | (66,073 | ) | |||||
| Operating income (loss) |
$ | (458,447 | ) | $ | 47,762 | $ | (41,281 | ) | $ | (16,176 | ) | $ | (468,142 | ) | ||||||
| Net interest expense |
(39,027 | ) | ||||||||||||||||||
| Other income (expense), net |
7,082 | |||||||||||||||||||
| Income tax benefit |
84,537 | |||||||||||||||||||
| Net loss |
$ | (415,550 | ) | |||||||||||||||||
| Capital expenditures |
$ | 6,178 | $ | 20,713 | $ | 37,276 | $ | 41 | $ | 64,208 | ||||||||||
| Segment assets |
$ | 329,900 | $ | 305,641 | $ | 188,728 | $ | 67,655 | $ | 891,924 | ||||||||||
F-15
Table of Contents
HEADWATERS INCORPORATED
NOTES TO CONSOLIDATED FINANCIAL STATEMENTS, continued
September 30, 2009
| 4. | Current Assets |
Trade Receivables Allowance—Activity in the trade receivables allowance account was as follows for the three-year period ended September 30, 2009.
| (in thousands) |
Balance at beginning of year |
Charged to expense |
Additions from acquisitions |
Accounts written off |
Balance at end of year | |||||||||||
| 2007 |
$ | 5,516 | $ | 2,540 | $ | 30 | $ | (3,448 | ) | $ | 4,638 | |||||
| 2008 |
4,638 | 1,149 | 100 | (2,133 | ) | 3,754 | ||||||||||
| 2009 |
3,754 | 1,191 | — | (1,649 | ) | 3,296 | ||||||||||
Inventories—Inventories consisted of the following at September 30:
| (in thousands) |
2008 | 2009 | ||||
| Raw materials |
$ | 11,239 | $ | 9,856 | ||
| Finished goods |
41,829 | 28,873 | ||||
| $ | 53,068 | $ | 38,729 | |||
| 5. | Long-Lived Assets |
Property, Plant and Equipment—Property, plant and equipment consisted of the following at September 30:
| (in thousands) |
Estimated useful lives | 2008 | 2009 | |||||||
| Land and improvements |
15 - 40 years | $ | 13,558 | $ | 12,674 | |||||
| Coal rights |
— | 7,236 | 17,449 | |||||||
| Buildings and improvements |
2 - 40 years | 85,010 | 128,556 | |||||||
| Equipment and vehicles |
2 - 30 years | 181,294 | 206,172 | |||||||
| Dies and molds |
2 - 20 years | 77,707 | 74,065 | |||||||
| Construction in progress |
— | 64,459 | 34,772 | |||||||
| 429,264 | 473,688 | |||||||||
| Less accumulated depreciation |
(124,429 | ) | (152,372 | ) | ||||||
| Net property, plant and equipment |
$ | 304,835 | $ | 321,316 | ||||||
Depreciation expense was approximately $43.4 million, $45.0 million and $42.7 million in 2007, 2008 and 2009, respectively.
F-16
Table of Contents
HEADWATERS INCORPORATED
NOTES TO CONSOLIDATED FINANCIAL STATEMENTS, continued
September 30, 2009
Intangible Assets—All of Headwaters’ identified intangible assets are being amortized. The following table summarizes the gross carrying amounts and related accumulated amortization of intangible assets as of September 30:
| Estimated useful lives |
2008 | 2009 | ||||||||||||
| (in thousands) |
Gross Carrying Amount |
Accumulated Amortization |
Gross Carrying Amount |
Accumulated Amortization | ||||||||||
| CCP contracts |
8 - 20 years | $ | 117,690 | $ | 38,449 | $ | 117,690 | $ | 45,181 | |||||
| Customer relationships |
7 1/2 - 15 years | 77,403 | 20,826 | 77,603 | 26,681 | |||||||||
| Trade names |
5 - 20 years | 68,412 | 14,227 | 67,425 | 16,700 | |||||||||
| Patents and patented technologies |
6 - 19 years | 54,635 | 23,354 | 55,058 | 28,625 | |||||||||
| Other |
1 - 15 years | 6,370 | 1,486 | 5,690 | 2,647 | |||||||||
| $ | 324,510 | $ | 98,342 | $ | 323,466 | $ | 119,834 | |||||||
Total amortization expense related to intangible assets was approximately $22.9 million, $22.4 million and $23.4 million in 2007, 2008 and 2009, respectively. Total estimated annual amortization expense for 2010 through 2014 is shown in the following table.
| Year ending September 30: |
(in thousands) | ||
| 2010 |
$ | 22,064 | |
| 2011 |
21,653 | ||
| 2012 |
19,886 | ||
| 2013 |
18,977 | ||
| 2014 |
18,599 | ||
Goodwill—Changes in the carrying amount of goodwill, by segment, are as follows for the two-year period ended September 30, 2009.
| (in thousands) |
Light building products |
Heavy construction materials |
Energy technology |
Total | |||||||||||
| Balances as of September 30, 2007 |
$ | 666,904 | $ | 115,999 | $ | 4,258 | $ | 787,161 | |||||||
| Goodwill acquired during the year |
2,950 | — | — | 2,950 | |||||||||||
| Adjustments to previously recorded purchase price |
(3,000 | ) | — | — | (3,000 | ) | |||||||||
| Goodwill impairment |
(205,000 | ) | — | — | (205,000 | ) | |||||||||
| Balances as of September 30, 2008 |
$ | 461,854 | $ | 115,999 | $ | 4,258 | $ | 582,111 | |||||||
| Adjustments to previously recorded purchase price |
(456 | ) | — | — | (456 | ) | |||||||||
| Goodwill impairment |
(461,398 | ) | — | (4,258 | ) | (465,656 | ) | ||||||||
| Balances as of September 30, 2009 |
$ | — | $ | 115,999 | $ | — | $ | 115,999 | |||||||
The adjustments reflected above represent changes in estimates, primarily related to finalization of purchase price. In accordance with the requirements of ASC Topic 350 Intangibles–Goodwill and Other (originally issued
F-17
Table of Contents
HEADWATERS INCORPORATED
NOTES TO CONSOLIDATED FINANCIAL STATEMENTS, continued
September 30, 2009
as SFAS No. 142), Headwaters does not amortize goodwill, all of which relates to acquisitions. Under the requirements of ASC Topic 350, Headwaters is required to periodically test for goodwill impairment, at least annually, or sooner if indicators of possible impairment arise. Headwaters performs its annual impairment testing as of June 30, using a two-step process that begins with an estimation of the fair values of the reporting units that have goodwill.
Step 1 of impairment testing consists of determining and comparing the fair value of a reporting unit, calculated primarily using discounted expected future cash flows, to the carrying value of the reporting unit. If step 1 is failed for a reporting unit, indicating a potential impairment, Headwaters is required to complete step 2, which is a more detailed test to calculate the implied fair value of goodwill, and compare that value to the carrying value of the goodwill. If the carrying value of goodwill exceeds its implied fair value, an impairment loss is required to be recorded.
Through fiscal 2007, Headwaters had five reporting units with allocated goodwill, three of which were in the light building products segment. There was one reporting unit with goodwill in each of the heavy construction materials and energy technology segments. As a result of changes in the operations and management of the businesses in the light building products segment, and in accordance with the requirements contained in ASC Topics 350 and 280 (including the rules originally issued as EITF Topic D-101, “Clarification of Reporting Unit guidance in Paragraph 30 of SFAS No. 142”), commencing with its 2008 fiscal year Headwaters aggregated the three reporting units in the light building products segment into one reporting unit for the purpose of goodwill impairment testing.
As a result of the depressed new housing and residential repair and remodeling markets, Headwaters determined that the light building products reporting unit goodwill was impaired as of the June 30 test dates in fiscal 2007 and 2008, and non-cash impairment charges of $98.0 million and $205.0 million, respectively, were recorded in those years. Due to the continuing decline in the new housing and residential repair and remodeling markets, the continued downward revisions by market analysts of near-term projections in these markets, the collapse of the credit markets in 2009 and the significant decline in Headwaters’ stock price during the six months ended March 31, 2009, management determined that indicators of further goodwill impairment in the light building products reporting unit existed. In addition, the significant declines in coal and oil prices and in Headwaters’ stock price indicated potential goodwill impairment in the energy technology reporting unit as well. Accordingly, Headwaters performed goodwill impairment tests for both the light building products and energy technology reporting units during the quarter ended March 31, 2009. Upon completion of the impairment tests, Headwaters wrote off all remaining goodwill in the light building products and energy technology reporting units, totaling approximately $465.7 million. None of the impairment charges in 2007, 2008 or 2009 affected Headwaters’ cash position, cash flow from operating activities or senior debt covenant compliance. Changes in the credit markets in late 2008 and in 2009 increased Headwaters’ borrowing rate, which borrowing rate directly affects the discount rate used in the goodwill impairment calculations. This increase in the discount rate led to the majority of the goodwill impairment in 2009.
Step 1 of the goodwill impairment test was not failed for the heavy construction materials reporting unit for any test date, and accordingly, step 2 testing was not required to be performed and no impairment charges were necessary.
Other Long-Lived Assets—In connection with the goodwill impairment testing for the light building products and energy technology reporting units in 2009, Headwaters also performed an analysis for potential impairments of other long-lived assets in those reporting units, including all intangible assets and property, plant and equipment. The results of this analysis did not result in any significant impairment of any other long-lived assets.
F-18
Table of Contents
HEADWATERS INCORPORATED
NOTES TO CONSOLIDATED FINANCIAL STATEMENTS, continued
September 30, 2009
| 6. | Liabilities |
Other Accrued Liabilities—Other accrued liabilities consisted of the following at September 30:
| (in thousands) |
2008 | 2009 | ||||
| Cost of product received but not yet invoiced |
$ | 18,059 | $ | 13,999 | ||
| Acquisition related liabilities |
14,395 | 1,251 | ||||
| Other |
25,714 | 32,425 | ||||
| $ | 58,168 | $ | 47,675 | |||
Long-term debt—The components of long-term debt are shown in the following table. The amounts reflected in the November 20, 2009 column reflect the debt transactions that occurred in October 2009, but do not reflect the changes in accounting for convertible debt that Headwaters must implement in 2010, as described in Note 2.
| (in thousands) |
September 30, | November 20, 2009 | |||||||
| 2008 | 2009 | ||||||||
| Former senior secured debt |
$ | 200,000 | $ | 188,000 | $ | — | |||
| New senior secured notes, net of $3,000 discount |
— | — | 325,250 | ||||||
| Convertible senior subordinated notes: |
|||||||||
| 2.875%, due 2016 with put date of June 2011 |
172,500 | 71,795 | — | ||||||
| 16%, due 2016 with put date of June 2012 |
— | 48,277 | 48,277 | ||||||
| 2.50%, due 2014 |
160,000 | 120,900 | 120,900 | ||||||
| 14.75%, due 2014 |
— | 27,370 | 27,370 | ||||||
| Total convertible notes |
332,500 | 268,342 | 196,547 | ||||||
| Total long-term debt |
$ | 532,500 | $ | 456,342 | $ | 521,797 | |||
Senior Secured Credit Facility—Headwaters’ senior secured borrowings as of September 30, 2009 consisted of a first lien term loan in the amount of $163.0 million, plus $25.0 million outstanding under the associated revolving credit arrangement. As described below, in October 2009 Headwaters issued new senior secured notes due 2014 totaling $328.3 million and used most of the proceeds to repay all amounts owed under the senior secured credit facility, at which time the facility was terminated. Because the amount outstanding under the revolving credit arrangement as of September 30, 2009 was repaid with those proceeds, Headwaters classified it as long-term in the accompanying consolidated balance sheet. In connection with the termination of the credit facility and early repayment of the debt, Headwaters wrote off all remaining related debt issue costs, aggregating approximately $2.0 million. Headwaters was in compliance with all debt covenants, as amended, as of September 30, 2009 and as of the termination date. Significant terms of the former credit facility as they existed at September 30, 2009 are described in the following paragraphs.
The first lien term loan was senior in priority to all other debt and, with the exception of joint venture assets, was secured by all assets of Headwaters. The first lien term loan bore interest, at Headwaters’ option, at either i) the London Interbank Offered Rate (LIBOR) plus 5.25%, 5.75%, 6.25% or 6.75%, depending on the credit ratings most recently announced for the loans by Standard & Poor’s Ratings Services and Moody’s Investors Service, Inc.; or ii) the Base Rate, as defined, plus 4.25%, 4.75%, 5.25% or 5.75%, again depending on the credit ratings. LIBOR had a minimum floor of 3.0% and the Base Rate had a minimum floor of 4.0%. As of September 30, 2009, the interest rate was LIBOR plus 6.75%, or 9.75%.
F-19
Table of Contents
HEADWATERS INCORPORATED
NOTES TO CONSOLIDATED FINANCIAL STATEMENTS, continued
September 30, 2009
The first lien term loan was repayable in 2011 and had a maturity date of April 2011. Mandatory prepayments of the first lien term loan were required under certain circumstances. Two mandatory prepayments totaling $37.0 million were made in 2009, $2.5 million of which resulted from an asset sale and $34.5 million of which resulted from the issuance of common stock (see Note 9).
Until it was amended in September 2009, the credit facility provided for up to $60.0 million of borrowings under the revolving credit arrangement. As of September 30, 2009, there was $25.0 million outstanding under the revolving credit arrangement. Borrowings were generally subject to the terms of the first lien term loan agreement and fees for the unused portion of the revolving credit arrangement ranged from 0.5% to 0.75%.
The credit facility contained restrictions and covenants common to such agreements, including limitations on the incurrence of additional debt, investments, merger and acquisition activity, asset sales and liens, capital expenditures in excess of stated limits, and the payment of dividends, among others. In addition, Headwaters was required to maintain certain leverage and fixed charge coverage ratios, as those terms were defined in the agreements.
2.875% Convertible Senior Subordinated Notes Due 2016—In 2004, Headwaters issued $172.5 million of 2.875% convertible senior subordinated notes due June 2016, with interest payable semi-annually. In 2009, Headwaters entered into separate, privately-negotiated agreements with certain holders of the notes to exchange approximately $80.9 million in aggregate principal amount of the notes for approximately $63.3 million in aggregate principal amount of new 16% convertible senior subordinated notes due 2016, described below.
Also in 2009, Headwaters exchanged approximately $19.8 million of the 2.875% convertible senior subordinated notes plus related accrued interest for approximately 4.8 million shares of common stock. In accordance with the provisions of ASC Topic 470 Debt (originally issued as SFAS No. 84, “Induced Conversions of Convertible Debt”), Headwaters recorded a non-cash expense of approximately $13.6 million in connection with this transaction (recorded in other income (expense)), which amount represented the fair value of the shares issued in excess of the shares required to be issued pursuant to the original terms of conversion. Finally, in October 2009, Headwaters repaid virtually all of the remaining balance of $71.8 million of these notes with a portion of the proceeds from the new issuance of senior secured notes.
The 2.875% notes were subordinate to the former senior secured debt described above and ranked equally with the 16% convertible senior subordinated notes due 2016 and the 2.50% and 14.75% convertible senior subordinated notes due 2014 described below. Holders of the 2.875% notes could have converted the notes into shares of Headwaters’ common stock at a conversion rate of 33.3333 shares per $1,000 principal amount ($30 conversion price), or approximately 3.1 million aggregate shares of common stock, contingent upon certain events.
16% Convertible Senior Subordinated Notes Due 2016—As noted above, in 2009 Headwaters exchanged approximately $80.9 million of its 2.875% convertible senior subordinated notes due 2016 for $63.3 million of new 16% convertible senior subordinated notes due 2016. In accordance with the provisions of ASC Topic 470 Debt (originally issued as EITF Issue No. 96-19, “Debtor’s Accounting for a Modification or Exchange of Debt Instruments”), Headwaters accounted for this exchange of convertible debt securities as an extinguishment of the original debt and an issuance of new debt. A gain, recorded in other income (expense) of approximately $17.6 million, was recognized on the extinguishment of debt. Additionally, approximately $1.0 million of unamortized debt issue costs related to the extinguished $80.9 million of debt was charged to interest expense.
F-20
Table of Contents
HEADWATERS INCORPORATED
NOTES TO CONSOLIDATED FINANCIAL STATEMENTS, continued
September 30, 2009
Also in 2009, Headwaters exchanged approximately $15.0 million of the 16% convertible senior subordinated notes plus related accrued interest for approximately 3.5 million shares of common stock. In accordance with the accounting rules related to induced conversions referred to previously, Headwaters recorded a non-cash expense of approximately $8.8 million (recorded in other income (expense)) in connection with this transaction, which amount represented the fair value of the shares issued in excess of the shares required to be issued pursuant to the original terms of conversion.
The 16% notes were subordinate to the former senior secured debt described above and are now subordinate to the new senior secured notes described below and rank equally with the 2.50% and 14.75% convertible senior subordinated notes due 2014 described below, as well as any future issuances of senior subordinated debt. Holders of the 16% notes may convert the notes into shares of Headwaters’ common stock at a conversion rate of 42.5532 shares per $1,000 principal amount ($23.50 conversion price), or approximately 2.7 million aggregate shares of common stock, contingent upon certain events. The conversion rate adjusts for events related to Headwaters’ common stock, including common stock issued as a dividend, rights or warrants to purchase common stock issued to all holders of Headwaters’ common stock, and other similar rights or events that apply to all holders of common stock. Upon conversion, Headwaters will pay cash up to the principal amount of the notes, and, at Headwaters’ option, cash, shares of common stock, or a combination of cash and shares, to the extent the price of Headwaters’ common stock exceeds the conversion price during a 20-trading-day observation period. The conversion rate is adjusted for certain corporate transactions referred to as “fundamental changes.” As described in more detail in Note 2, the accounting for these notes will change upon adoption of the new rules related to accounting for convertible debt in October 2009.
The 16% notes are convertible if any of the following five criteria are met: 1) satisfaction of a market price condition which becomes operative if, prior to June 1, 2012, in any calendar quarter the closing price of Headwaters’ common stock exceeds $30.55 per share for at least 20 trading days in the 30 consecutive trading days ending on the last trading day of the calendar quarter, or, at any time on or after June 1, 2012 the closing price of Headwaters’ common stock exceeds $30.55 per share; 2) a credit rating, if any, assigned to the notes is three or more rating subcategories below the initial rating; 3) the notes trade at less than 98% of the product of the common stock trading price and the number of shares of common stock issuable upon conversion of $1,000 principal amount of the notes; 4) Headwaters calls the notes for redemption; or 5) upon the occurrence of specified corporate transactions.
Headwaters may redeem any portion of the notes at any time on or after June 4, 2012. In addition, the holders of the notes have the right to require Headwaters to repurchase all or a portion of the notes on June 1, 2012 or if a fundamental change in common stock has occurred, including termination of trading.
2.50% Convertible Senior Subordinated Notes Due 2014—In fiscal 2007, Headwaters issued $160.0 million of 2.50% convertible senior subordinated notes due February 2014, with interest payable semi-annually. In 2009, Headwaters entered into separate, privately-negotiated agreements with certain holders of the notes to exchange approximately $39.1 million in aggregate principal amount of the notes for approximately $27.4 million in aggregate principal amount of new 14.75% convertible senior subordinated notes due 2014, described below.
Following the 2009 extinguishment of $39.1 million principal amount of the 2.50% notes, approximately $120.9 million principal amount of the notes remains outstanding as of September 30, 2009. These notes were subordinate to the former senior secured debt described above and are now subordinate to the new senior secured notes described below and rank equally with the 16% convertible senior subordinated notes due 2016 described
F-21
Table of Contents
HEADWATERS INCORPORATED
NOTES TO CONSOLIDATED FINANCIAL STATEMENTS, continued
September 30, 2009
above and the 14.75% convertible senior subordinated notes due 2014 described below, and any future issuances of senior subordinated debt. The conversion rate for the notes is 33.9236 shares per $1,000 principal amount ($29.48 conversion price), subject to adjustment. Upon conversion, Headwaters will pay cash up to the principal amount of the notes, and shares of common stock to the extent the price of Headwaters’ common stock exceeds the conversion price during a 20-trading-day observation period. The conversion rate is adjusted for certain corporate transactions referred to as “fundamental changes.” As described in more detail in Note 2, the accounting for these notes will change upon adoption of the new rules related to accounting for convertible debt in October 2009.
The 2.50% notes are convertible at the option of the holders prior to December 1, 2013 if any of the following criteria are met: 1) during any fiscal quarter the closing price of Headwaters’ common stock exceeds $38.32 per share for at least 20 trading days during a period of 30 consecutive trading days ending on the last trading day of the preceding fiscal quarter; 2) during the five-business-day period after any ten-consecutive-trading-day period, the notes trade at less than 98% of the product of the common stock trading price and the number of shares of common stock issuable upon conversion of $1,000 principal amount of the notes; or 3) upon the occurrence of specified corporate transactions. The notes are convertible on or after December 1, 2013 regardless of the foregoing circumstances. Headwaters may not redeem the notes. If Headwaters has a “fundamental change,” holders may require Headwaters to repurchase the notes at a price equal to the principal amount plus any accrued interest.
In connection with the issuance of the 2.50% notes, Headwaters entered into convertible note hedge and warrant transactions for the purpose of effectively increasing the common stock conversion price for the notes from $29.48 per share to $35.00 per share. The convertible note hedge terminates upon the maturity of the notes or when none of the notes remain outstanding due to conversion or otherwise.
14.75% Convertible Senior Subordinated Notes Due 2014—As noted above, in 2009 Headwaters exchanged approximately $39.1 million of the 2.50% convertible senior subordinated notes due 2014 for approximately $27.4 million of new 14.75% convertible senior subordinated notes due 2014. In accordance with the accounting rules related to a modification or exchange of debt instruments referred to previously, Headwaters accounted for this exchange of convertible debt securities as an extinguishment of the original debt and an issuance of new debt. A gain, recorded in other income (expense) of approximately $11.7 million, was recognized on the extinguishment of debt. Additionally, approximately $0.9 million of unamortized debt issue costs related to the extinguished $39.1 million of debt was charged to interest expense.
The conversion rate for the 14.75% notes is 48.4623 shares per $1,000 principal amount ($20.63 conversion price), subject to adjustment. The conversion rate and the interest rate are the primary differences in terms between the 2.50% notes and the 14.75% notes. As described in more detail in Note 2, the accounting for these notes will change upon adoption of the new rules related to accounting for convertible debt in October 2009.
New Senior Secured Notes—In October 2009, Headwaters issued new senior secured notes aggregating approximately $328.3 million, for net proceeds of approximately $317.0 million. Headwaters used most of the proceeds to repay all of its obligations under the former senior secured credit facility and virtually all of the outstanding 2.875% convertible senior subordinated notes. Also in October 2009, Headwaters entered into a $70.0 million asset based revolving loan facility (ABL Revolver). Significant terms of the senior secured notes and the ABL Revolver are described in the following paragraphs.
The senior secured notes bear interest at a rate of 11.375%, interest is payable semiannually and the notes mature in November 2014. The notes were issued at 99.067% of face value, or a discount of approximately $3.1
F-22
Table of Contents
HEADWATERS INCORPORATED
NOTES TO CONSOLIDATED FINANCIAL STATEMENTS, continued
September 30, 2009
million, which discount will be amortized to interest expense over the five-year term. The notes are secured by substantially all assets of Headwaters, with the exception of joint venture assets; however, the note holders have a second priority position with respect to the assets that secure the ABL Revolver, currently primarily consisting of the trade receivables and inventories of Headwaters’ light building products and heavy construction materials segments. The notes are senior in priority to all other outstanding and future subordinated debt.
Prior to November 2012, the senior secured notes can be redeemed only with proceeds from one or more equity offerings, provided a premium of 11.375% of the face amount of notes is paid and at least 65% of the aggregate principal amount of notes issued remain outstanding following redemption, or at a redemption price equal to 100% of the principal amount of the notes to be redeemed plus an applicable premium, as defined. From November 2012 until November 2013, the notes can be redeemed for a premium payment of approximately 5.7% of the face amount of notes and from November 2013 until maturity, the notes can be redeemed at face value. Following certain asset sales, as defined, Headwaters could be required to prepay a portion of the outstanding notes.
The senior secured notes limit Headwaters in the incurrence of additional debt and liens on assets, prepayment of subordinated debt, merging or consolidating with another company, selling all or substantially all assets, making investments and the payment of dividends or distributions, among other things.
ABL Revolver—Availability under the ABL Revolver cannot exceed $70.0 million, which includes a $35.0 million sub-line for letters of credit and a $10.5 million swingline facility. Availability under the ABL Revolver is further limited by the borrowing base valuations of certain assets of Headwaters’ light building products and heavy construction materials segments, consisting of trade receivables and inventories, which secure the borrowings. In addition to the first lien position on these assets, the ABL Revolver lenders have a second priority position on substantially all other assets of Headwaters.
Outstanding borrowings under the ABL Revolver accrue interest at Headwaters’ option, at either i) the London Interbank Offered Rate (LIBOR) plus 3.75%, 4.0% or 4.25%, depending on Headwaters’ fixed charge coverage ratio; or ii) the “Base Rate” plus 2.25%, 2.5% or 2.75%, again depending on the fixed charge coverage ratio. The base rate is subject to a floor equal to the highest of i) the prime rate, ii) the federal funds rate plus 0.5%, and iii) the 30-day LIBOR rate plus 1.0%. Fees on the unused portion of the ABL Revolver range from 0.25% to 0.5%, depending on the amount of the credit facility which is utilized. The initial interest rate on the ABL Revolver, if there were borrowings outstanding at the current time, would be approximately 4.5%. The ABL Revolver matures in October 2013, at which time all amounts borrowed must be repaid and the lending commitment terminates.
The ABL Revolver contains restrictions and covenants common to such agreements, including limitations on the incurrence of additional debt and liens on assets, prepayment of subordinated debt, merging or consolidating with another company, selling assets, making capital expenditures, making acquisitions and investments and the payment of dividends or distributions, among other things. In addition, if availability under the ABL Revolver is less than a specified percentage, Headwaters will be required to maintain a monthly fixed charge coverage ratio of at least (i) 1.0x for the last twelve-month period for each month ending on or prior to December 31, 2010, and (ii) 1.1x for the last twelve-month period for each month ending after December 31, 2010.
Interest and Debt Maturities—During 2007, Headwaters incurred total interest costs of approximately $35.0 million, including approximately $5.3 million of non-cash interest expense and approximately $0.8 million of interest costs that were capitalized. During 2008, Headwaters incurred total interest costs of approximately $26.0 million, including approximately $2.8 million of non-cash interest expense and approximately $0.9 million
F-23
Table of Contents
HEADWATERS INCORPORATED
NOTES TO CONSOLIDATED FINANCIAL STATEMENTS, continued
September 30, 2009
of interest costs that were capitalized. During 2009, Headwaters incurred total interest costs of approximately $40.8 million, including approximately $6.4 million of non-cash interest expense and approximately $1.4 million of interest costs that were capitalized.
Interest income was approximately $3.1 million, $1.3 million and $0.4 million for 2007, 2008 and 2009, respectively. The weighted-average interest rate on the face amount of outstanding long-term debt, disregarding amortization of debt issue costs, was approximately 4.8% at September 30, 2008 and 7.7% at September 30, 2009 (9.9% as of November 20, 2009, following the changes in outstanding debt described previously).
Future maturities of long-term debt as of September 30, 2009 are shown in the following table. Following the October 2009 issuance of new senior secured notes and the repayments of outstanding debt with most of those proceeds, there are currently no maturities of debt prior to 2014, unless the holders of the 16% convertible senior subordinated notes exercise their put option in 2012.
| Year ending September 30, |
(in thousands) | ||
| 2011 |
$ | 163,000 | |
| 2014 |
173,270 | ||
| 2016 |
120,072 | ||
| Total long-term debt |
$ | 456,342 | |
The following table reflects debt maturities as of November 20, 2009, considering the October 2009 issuance of new senior secured notes and the payments of outstanding debt with most of those proceeds.
| Year ending September 30, |
(in thousands) | ||
| 2014 |
$ | 476,520 | |
| 2016 |
48,277 | ||
| Total long-term debt |
$ | 524,797 | |
| 7. | Fair Value of Financial Instruments |
Headwaters’ financial instruments consist primarily of cash and cash equivalents, trade receivables, accounts payable and long-term debt. All of these financial instruments except long-term debt are either carried at fair value in the balance sheets or are short-term in nature. Accordingly, the carrying values for those financial instruments as reflected in the consolidated balance sheets closely approximate their fair values.
Headwaters’ outstanding debt as of September 30, 2008 and 2009 consisted of both fixed-rate debt and variable-rate debt. The fixed-rate debt consisted of all issues of convertible senior subordinated notes. Using fair values for this debt, the fair value of all outstanding long-term debt (including the current portion) as of September 30, 2008 and 2009 would have been approximately $465.0 million and $390.0 million, respectively, compared to carrying values of $532.5 million and $456.3 million, respectively.
Fair value “Level 2” estimates for the convertible senior subordinated notes were based on several factors including market prices and discounted future cash flows using estimated current risk-adjusted borrowing rates for similar instruments. The fair values for the convertible senior subordinated notes differ substantially from the carrying values primarily due to below-market coupon interest rates and the significant differences between Headwaters’ common stock price at the balance sheet measurement dates and the convertible note conversion prices.
F-24
Table of Contents
HEADWATERS INCORPORATED
NOTES TO CONSOLIDATED FINANCIAL STATEMENTS, continued
September 30, 2009
In determining the fair value of long-term debt, Headwaters considered the relevant guidance in ASC Topic 820 Fair Value Measurements and Disclosures, including the guidance issued by the FASB in April 2009 (originally issued as FASB Staff Position FAS 157-4, “Determining Fair Value When the Volume and Level of Activity for the Asset or Liability Have Significantly Decreased and Identifying Transactions That Are Not Orderly”).
| 8. | Income Taxes |
Headwaters recorded income taxes with an effective tax rate of approximately 66% in 2007 (24% exclusive of the $98.0 million goodwill impairment charge, which was not tax-deductible); less than 1% in 2008 (29% exclusive of the $205.0 million goodwill impairment charge, most of which was not tax-deductible) and 17% in 2009 (51% exclusive of the $465.7 million goodwill impairment charge, most of which was not tax-deductible).
The effective tax rates disregarding goodwill impairment differ from the statutory rate primarily due to Section 45K tax credits (in 2007) and Section 45 tax credits (in 2008 and 2009). Section 45K tax credits related to two coal-based solid alternative fuel facilities that Headwaters owned and operated, plus Headwaters’ 19% interest in an entity that owned and operated another alternative fuel facility. Although challenged by the IRS in audit, Headwaters believes that the alternative fuel produced at these three facilities through December 31, 2007 qualified for tax credits pursuant to Section 45K of the Internal Revenue Code, subject to the uncertainties and other risks associated with the tax credits described in Note 12.
Section 45 refined coal tax credits (which are different from the Section 45K tax credits discussed above and elsewhere) have been generated by coal cleaning facilities that Headwaters owns and operates. Headwaters believes it is more likely than not that the refined coal produced at its coal cleaning facilities qualifies for tax credits pursuant to Section 45 of the Internal Revenue Code, notwithstanding the uncertainties and risks associated with the tax credits, as more fully described in Note 12.
The income tax benefit (provision) consisted of the following for the years ended September 30:
| (in thousands) |
2007 | 2008 | 2009 | |||||||||
| Current tax benefit (provision): |
||||||||||||
| Federal |
$ | (33,555 | ) | $ | 9,335 | $ | 17,929 | |||||
| State |
(4,041 | ) | 341 | (1,895 | ) | |||||||
| Total current tax benefit (provision) |
(37,596 | ) | 9,676 | 16,034 | ||||||||
| Deferred tax benefit (provision): |
||||||||||||
| Federal |
(652 | ) | (9,754 | ) | 58,638 | |||||||
| State |
(39 | ) | 581 | 9,865 | ||||||||
| Total deferred tax benefit (provision) |
(691 | ) | (9,173 | ) | 68,503 | |||||||
| Total income tax benefit (provision) |
$ | (38,287 | ) | $ | 503 | $ | 84,537 | |||||
F-25
Table of Contents
HEADWATERS INCORPORATED
NOTES TO CONSOLIDATED FINANCIAL STATEMENTS, continued
September 30, 2009
The provision for income taxes differs from the amount computed using the statutory federal income tax rate due to the following:
| (in thousands) |
2007 | 2008 | 2009 | |||||||||
| Tax benefit (provision) at U.S. statutory rate |
$ | (20,419 | ) | $ | 59,564 | $ | 175,030 | |||||
| State income taxes, net of federal tax effect |
(2,638 | ) | 339 | 5,244 | ||||||||
| Goodwill impairment |
(34,300 | ) | (60,149 | ) | (100,425 | ) | ||||||
| Estimated tax credits |
22,742 | 1,985 | 8,290 | |||||||||
| Change in valuation allowance |
(437 | ) | 32 | (3,978 | ) | |||||||
| Tax audit contingencies |
1,901 | (800 | ) | 1,695 | ||||||||
| Change in prior years’ estimates |
(1,996 | ) | 49 | (657 | ) | |||||||
| Stock-based compensation |
(2,964 | ) | (350 | ) | (641 | ) | ||||||
| Nondeductible expenses |
(556 | ) | (218 | ) | (297 | ) | ||||||
| Other |
380 | 51 | 276 | |||||||||
| Income tax benefit (provision) |
$ | (38,287 | ) | $ | 503 | $ | 84,537 | |||||
As of September 30, 2009, Headwaters had deferred tax assets related to U.S., state and non-U.S. net operating loss (NOL) and capital loss carryforwards totaling approximately $8.7 million. Headwaters has established a valuation allowance for most of this amount. A valuation allowance is required when there is significant uncertainty as to the realizability of deferred tax assets. Because the realization of the deferred tax assets related to these NOLs and capital losses is dependent upon future income or capital gains related to domestic and foreign jurisdictional operations that have historically generated losses, management determined that it is not “more likely than not” that these NOLs and capital losses will be realized and therefore, a valuation allowance is required. Substantially all of the valuation allowance in 2008 and 2009 related to NOL carryforwards in states where Headwaters has generated losses. The U.S. and state NOLs and capital losses expire from 2010 to 2029. Substantially all of the non-U.S. NOLs do not expire.
The components of Headwaters’ deferred income tax assets and liabilities were as follows as of September 30:
| (in thousands) |
2008 | 2009 | ||||||
| Deferred tax assets: |
||||||||
| Tax credit carryforwards |
$ | 1,336 | $ | 14,429 | ||||
| Stock-based compensation |
7,643 | 8,294 | ||||||
| Convertible note hedge |
13,104 | 8,272 | ||||||
| Estimated liabilities |
13,502 | 5,681 | ||||||
| Reserves and allowances |
6,611 | 3,371 | ||||||
| Deferred license fee revenue |
899 | 668 | ||||||
| NOL and capital loss carryforwards |
7,802 | 8,696 | ||||||
| Valuation allowances related to carryforwards and other items |
(4,823 | ) | (8,801 | ) | ||||
| Other |
1,492 | 938 | ||||||
| Total deferred tax assets |
47,566 | 41,548 | ||||||
| Deferred tax liabilities: |
||||||||
| Property, plant and equipment basis differences |
(25,023 | ) | (29,404 | ) | ||||
| Goodwill and intangible asset basis differences |
(77,392 | ) | (10,411 | ) | ||||
| Interest on convertible senior subordinated notes |
(16,450 | ) | (8,757 | ) | ||||
| Total deferred tax liabilities |
(118,865 | ) | (48,572 | ) | ||||
| Net deferred tax liability |
$ | (71,299 | ) | $ | (7,024 | ) | ||
F-26
Table of Contents
HEADWATERS INCORPORATED
NOTES TO CONSOLIDATED FINANCIAL STATEMENTS, continued
September 30, 2009
ASC Topic 740 Income Taxes (originally issued as FASB Interpretation No. 48, “Accounting for Uncertainty in Income Taxes—an Interpretation of FASB Statement No. 109,” or FIN 48) prescribes a consistent financial reporting recognition threshold and measurement standard, as well as criteria for subsequently recognizing, derecognizing and measuring tax positions taken or expected to be taken in a tax return. ASC Topic 740 also requires expanded disclosures with respect to the uncertainty in income taxes. Headwaters adopted these rules effective as of October 1, 2007, the beginning of the 2008 fiscal year, with a cumulative adjustment to decrease retained earnings and increase income tax liabilities for unrecognized income tax benefits by approximately $19.8 million, which included $2.9 million for interest and penalties. Certain reclassifications of deferred income taxes as of September 30, 2007 were also made to conform to the presentation requirements of ASC Topic 740, but these were not material. A reconciliation of the change in the amount of gross unrecognized income tax benefits during 2008 and 2009 is as follows.
| (in thousands) |
2008 | 2009 | ||||||
| Gross unrecognized income tax benefits at beginning of year |
$ | 32,584 | $ | 29,586 | ||||
| Changes based on tax positions related to the current year |
632 | 221 | ||||||
| Increases for tax positions related to prior years |
7,106 | 8,050 | ||||||
| Reductions for tax positions related to prior years |
(10,736 | ) | (24,470 | ) | ||||
| Settlements |
— | (1,247 | ) | |||||
| Gross unrecognized income tax benefits at end of year |
$ | 29,586 | $ | 12,140 | ||||
Headwaters recognizes accrued interest and potential penalties related to all income tax liabilities, including unrecognized income tax benefits, in income tax expense. During 2008, Headwaters recognized approximately $0.5 million of interest and penalties. During 2009, Headwaters released approximately $2.1 million of liabilities for interest and penalties and as of September 30, 2009, approximately $4.9 million was accrued for the payment of interest and penalties. Changes to the estimated liability for unrecognized income tax benefits during 2009 were primarily the result of settlement of the IRS audit for the years 2003 and 2004.
As of September 30, 2009, Headwaters had approximately $12.1 million of unrecognized tax benefits. Approximately $11.2 million of gross unrecognized income tax benefits would affect the 2009 effective tax rate if released into income.
The calculation of tax liabilities involves uncertainties in the application of complex tax regulations in multiple jurisdictions. For example, Headwaters is currently under audit by the IRS for the years 2005 and 2006 and has open tax periods subject to examination by both federal and state taxing authorities for the years 2005 through 2008. Headwaters recognizes potential liabilities for anticipated tax audit issues in the U.S. and state tax jurisdictions based on estimates of whether, and the extent to which, additional taxes and interest will be due. If events occur and the payment of these amounts ultimately proves to be unnecessary, the reversal of the liabilities would result in tax benefits being recognized in the period when it is determined the liabilities are no longer probable or necessary. If the estimate of tax liabilities proves to be less than the ultimate assessment, a further charge to expense would result. It is reasonably possible that the amount of Headwaters’ unrecognized income tax benefits will change significantly within the next 12 months. These changes could be the result of Headwaters’ ongoing tax audits or the settlement of outstanding audit issues. However, due to the number of years under audit and the matters being examined, at the current time, an estimate of the range of reasonably possible outcomes cannot be made, beyond amounts currently accrued.
F-27
Table of Contents
HEADWATERS INCORPORATED
NOTES TO CONSOLIDATED FINANCIAL STATEMENTS, continued
September 30, 2009
| 9. | Equity Securities and Stock-Based Compensation |
Authorized Stock—Headwaters has 100.0 million shares of authorized common stock and10.0 million shares of authorized preferred stock. No preferred stock was issued or outstanding as of September 30, 2008 or 2009.
Issuance of Common Stock—As described in more detail in Note 6, in 2009 Headwaters issued approximately 8.4 million shares of common stock in exchange for certain outstanding convertible senior subordinated notes. In September 2009, Headwaters issued 9.6 million shares of common stock for gross cash proceeds of approximately $37.4 million. After deducting offering costs totaling approximately $2.9 million, the net cash proceeds of $34.5 million were used to pay down Headwaters’ senior secured term debt.
Shelf Registration—Headwaters filed with the SEC a universal shelf registration statement for the potential sale of a total of $250.0 million of debt or equity securities. This registration statement was declared effective in April 2009. Following the September 2009 issuance of common stock described above, approximately $212.6 million remains available for future offerings of securities under the registration statement. A prospectus supplement describing the terms of any additional securities to be issued is required to be filed before any future offering could commence under the registration statement.
Grants and Cancellations of Stock Incentive Awards—The Compensation Committee of Headwaters’ Board of Directors (the Committee) approved the grant of approximately 0.2 million, 1.2 million and 2.4 million options, SARs and restricted shares to directors, officers and employees during 2007, 2008 and 2009, respectively. Approximately 1.2 million of the 2009 awards were performance-based SARs, which were cancelled on September 30, 2009 because the performance criteria required to be met on or before that date for vesting to occur were not met and the awards could never vest. Accordingly, no expense for those SARs was recognized in 2009. Subsequent to September 30, 2009, the Committee granted approximately 1.0 million stock-based awards to officers and employees.
All stock-based awards for the years 2007 through 2009 and subsequent thereto were granted under existing stock incentive plans, and all options and SARs have an exercise price equal to the fair market value of Headwaters’ common stock on the dates of grant and a contractual term of 10 years. When exercised by grantees, SARs are settled in Headwaters’ common stock.
Stock-Based Compensation—Stock-based compensation expense was approximately $10.1 million, $5.3 million and $5.6 million in 2007, 2008 and 2009, respectively. Approximately $3.9 million of the 2007 stock-based compensation resulted from the early voluntary cancellation of SARs and other stock-based awards, requiring an acceleration of expense recognition for unrecognized compensation cost that remained as of the cancellation dates. The total income tax benefit recognized for stock-based compensation in the consolidated statements of operations was approximately $0.5 million, $1.9 million and $1.4 million for 2007, 2008 and 2009, respectively.
Valuation Assumptions—The fair values of stock options and SARs have been estimated using the B-S-M model, adjusted where necessary to account for specific terms of awards that the B-S-M model does not have the capability to consider; for example, SARs which have a cap on allowed appreciation. For these SARs, the output determined by the B-S-M model has been reduced by an amount determined by a Quasi-Monte Carlo simulation to reflect the reduction in fair value associated with the appreciation cap.
F-28
Table of Contents
HEADWATERS INCORPORATED
NOTES TO CONSOLIDATED FINANCIAL STATEMENTS, continued
September 30, 2009
The following table summarizes the assumptions used in determining the fair values of stock-based awards for the years indicated.
| 2007 | 2008 | 2009 | ||||
| Expected stock volatility |
35% | 35% - 40% | 45% - 60% | |||
| Risk-free interest rates |
4.6% | 2.1% - 4.2% | 1.4% - 4.0% | |||
| Expected lives (beyond vest dates) |
3.5 years | 2.5 - 4 years | 2 - 4 years | |||
| Dividend yield |
0% | 0% | 0% |
Expected stock price volatility was estimated using primarily historical volatilities of Headwaters’ stock. Implied volatilities of traded options on Headwaters’ stock, volatility predicted by other models, and an analysis of volatilities used by other public companies in comparable lines of business to Headwaters were also considered. Risk-free interest rates used were the U.S. Treasury bond yields with terms corresponding to the expected terms of the awards being valued. In estimating expected lives, Headwaters considered the contractual and vesting terms of awards, along with historical experience; however, due to insufficient historical data from which to reliably estimate expected lives, Headwaters used estimates based on the “simplified method” set forth by the SEC in Staff Accounting Bulletins No. 107 and 110, where expected life is estimated by summing the award’s vesting term and contractual term and dividing that result by two. Insufficient historical data from which to reliably estimate expected lives is expected to exist for the foreseeable future due to different terms associated with awards granted in recent years, along with other factors.
Stock Incentive Plans—As of September 30, 2009, Headwaters had four stock incentive plans (the Plans), three of which have been approved by stockholders. A total of 8.6 million shares of common stock have been reserved for ultimate issuance under the Plans. One of the Plans has expired and awards can no longer be granted under that plan. As of September 30, 2009, options, SARs and other awards for approximately 1.6 million shares of common stock could be granted under the three remaining plans. Following the grants made subsequent to September 30, 2009, approximately 0.6 million shares were available for future grants under the Plans.
Headwaters uses newly issued shares to meet its obligations to issue stock when awards are exercised. The Committee, or in its absence, the full Board, administers and interprets the Plans. This Committee is authorized to grant options and other awards both under the Plans and outside of any Plan to eligible employees, officers, directors, and consultants of Headwaters. Terms of awards granted under the Plans, including vesting requirements, are determined by the Committee and historically have varied significantly. Awards granted under the Plans vest over periods ranging from zero to ten years, expire ten years from the date of grant and are not transferable other than by will or by the laws of descent and distribution. Incentive stock option grants must meet the requirements of the Internal Revenue Code.
Stockholder Approval of Equity Compensation Plans—The following table presents information related to stockholder approval of equity compensation plans as of September 30, 2009.
| (in thousands) |
|||||||
| Plan Category |
Maximum shares to be issued upon exercise of options and other awards |
Weighted-average exercise price of outstanding options and other awards |
Shares remaining available for future issuance under existing equity compensation plans (excluding shares reflected in the first column) | ||||
| Plans approved by stockholders |
2,799 | $ | 17.32 | 1,435 | |||
| Plans not approved by stockholders |
1,006 | 18.44 | 139 | ||||
| Total |
3,805 | $ | 17.61 | 1,574 | |||
F-29
Table of Contents
HEADWATERS INCORPORATED
NOTES TO CONSOLIDATED FINANCIAL STATEMENTS, continued
September 30, 2009
As discussed above, Headwaters has four Plans under which options and SARs have been granted and stockholders have approved three of the four Plans. Headwaters has also issued options not covered by any Plan. The amounts included in the caption “not approved by stockholders” in the above table represent amounts applicable under the Plan not approved by stockholders plus all awards granted outside of any Plan.
Stock Options—The following table summarizes the activity for all of Headwaters’ stock options, including options not granted under the Plans.
| (in thousands of shares) |
Shares | Weighted- average exercise price |
Weighted- average remaining contractual term in years |
Aggregate intrinsic value | |||||||
| Outstanding at September 30, 2006 |
2,434 | $ | 20.12 | ||||||||
| Granted |
0 | 0.00 | |||||||||
| Exercised |
(53 | ) | 8.93 | ||||||||
| Forfeited or expired |
(11 | ) | 12.84 | ||||||||
| Outstanding at September 30, 2007 |
2,370 | $ | 20.41 | 5.5 | $ | 2,826 | |||||
| Granted |
48 | $ | 13.57 | ||||||||
| Exercised |
(87 | ) | 3.13 | ||||||||
| Forfeited or expired |
(256 | ) | 20.33 | ||||||||
| Outstanding at September 30, 2008 |
2,075 | $ | 20.98 | 4.8 | $ | 1,003 | |||||
| Granted |
0 | $ | 0.00 | ||||||||
| Exercised |
(73 | ) | 5.58 | ||||||||
| Forfeited or expired |
(190 | ) | 20.35 | ||||||||
| Outstanding at September 30, 2009 |
1,812 | $ | 21.67 | 4.2 | $ | 0 | |||||
| Exercisable at September 30, 2007 |
2,283 | $ | 19.94 | 5.3 | $ | 2,826 | |||||
| Exercisable at September 30, 2008 |
1,982 | $ | 20.90 | 4.7 | $ | 1,003 | |||||
| Exercisable at September 30, 2009 |
1,808 | $ | 21.65 | 4.2 | $ | 0 | |||||
The weighted-average grant-date fair value (calculated using the B-S-M model) of options granted in 2008 was $5.17. The total intrinsic value of options exercised was approximately $0.7 million, $0.9 million and $0.1 million in 2007, 2008 and 2009, respectively.
F-30
Table of Contents
HEADWATERS INCORPORATED
NOTES TO CONSOLIDATED FINANCIAL STATEMENTS, continued
September 30, 2009
SARs—The following table summarizes the activity for all of Headwaters’ SARs.
| (in thousands of shares) |
Shares | Weighted- average threshold price |
Weighted- average remaining contractual term in years |
Aggregate intrinsic value | |||||||
| Outstanding at September 30, 2006 |
3,141 | $ | 32.15 | ||||||||
| Granted |
234 | 22.59 | |||||||||
| Exercised |
0 | 0 | |||||||||
| Forfeited or expired |
(2,866 | ) | 32.03 | ||||||||
| Outstanding at September 30, 2007 |
509 | $ | 28.42 | 7.6 | $ | 0 | |||||
| Granted |
948 | $ | 13.65 | ||||||||
| Exercised |
0 | 0 | |||||||||
| Forfeited or expired |
(162 | ) | 27.81 | ||||||||
| Outstanding at September 30, 2008 |
1,295 | $ | 17.68 | 8.4 | $ | 26 | |||||
| Granted |
2,123 | $ | 5.58 | ||||||||
| Exercised |
0 | 0 | |||||||||
| Forfeited or expired |
(1,487 | ) | 4.71 | ||||||||
| Outstanding at September 30, 2009 |
1,931 | $ | 14.37 | 7.9 | $ | 0 | |||||
| Exercisable at September 30, 2007 |
124 | $ | 33.62 | 3.4 | $ | 0 | |||||
| Exercisable at September 30, 2008 |
439 | $ | 17.77 | 7.5 | $ | 26 | |||||
| Exercisable at September 30, 2009 |
956 | $ | 15.15 | 7.5 | $ | 0 | |||||
The weighted-average grant-date fair value of SARs granted was $9.87, $5.40 and $2.57 in 2007, 2008 and 2009, respectively.
Other Stock-Based Awards and Unrecognized Compensation Cost—In addition to the stock options and SARs reflected in the tables above, during 2007 through 2009 Headwaters also issued approximately 0.5 million shares of restricted common stock to officers and employees and approximately 0.1 million restricted stock units to non-affiliated directors. The restricted stock vests over an approximate three-year period and the restricted stock units vest over an approximate one-year period. The restricted stock and restricted stock units were issued at no cost to the recipients and compensation expense equal to the trading price of the stock on the dates of grant is therefore recognized over the related vesting periods, which also represent the requisite service periods. Headwaters also recognizes compensation expense in connection with its Employee Stock Purchase Plan (ESPP). Compensation expense related to restricted stock, restricted stock units and the ESPP was approximately $0.8 million, $1.4 million and $1.9 million in 2007, 2008 and 2009, respectively.
As of September 30, 2009, there was approximately $4.5 million of total compensation cost related to unvested awards not yet recognized. This unrecognized compensation cost is expected to be recognized over a weighted-average period of approximately 1.5 years. Due to the grant of stock-based awards subsequent to September 30, 2009 described above, the amount of total compensation cost related to nonvested awards has increased, and the weighted-average period over which compensation cost will be recognized has changed.
F-31
Table of Contents
HEADWATERS INCORPORATED
NOTES TO CONSOLIDATED FINANCIAL STATEMENTS, continued
September 30, 2009
| 10. | Earnings Per Share |
The following table sets forth the computation of basic and diluted EPS for the years ended September 30:
| (in thousands, except per-share data) |
2007 | 2008 | 2009 | ||||||||
| Numerator: |
|||||||||||
| Numerator for basic and diluted earnings per share—net income (loss) |
$ | 20,054 | $ | (169,680 | ) | $ | (415,550 | ) | |||
| Denominator: |
|||||||||||
| Denominator for basic earnings per share—weighted-average shares outstanding |
42,167 | 41,357 | 43,337 | ||||||||
| Effect of dilutive securities—shares issuable upon exercise of options and SARs |
361 | — | — | ||||||||
| Denominator for diluted earnings per share—weighted-average shares outstanding after assumed exercises |
42,528 | 41,357 | 43,337 | ||||||||
| Basic earnings (loss) per share |
$ | 0.48 | $ | (4.10 | ) | $ | (9.59 | ) | |||
| Diluted earnings (loss) per share |
$ | 0.47 | $ | (4.10 | ) | $ | (9.59 | ) | |||
| Anti-dilutive securities not considered in diluted EPS calculation: |
|||||||||||
| Shares issuable upon conversion of convertible notes |
5,750 | 5,750 | 2,758 | ||||||||
| SARs |
3,203 | 1,227 | 2,035 | ||||||||
| Stock options |
1,143 | 2,162 | 1,929 | ||||||||
| Restricted stock |
— | — | 342 | ||||||||
In accordance with the requirements of ASC Topic 260 Earnings Per Share (originally issued as part of the new requirements of SFAS No. 123R), the diluted EPS calculations above considered all of the following as assumed proceeds in using the treasury stock method to calculate whether and to what extent options and SARs were dilutive: i) the amounts employees must pay upon exercise; plus ii) the average amount of compensation cost during the period, if any, attributed to future service, but not yet recognized; plus iii) the amount of tax benefits, if any, that would be credited to additional paid-in capital if the award were to be exercised.
| 11. | Acquisitions |
Dutch Quality Stone—In 2007, Headwaters acquired 100% of the ownership interests of Dutch Quality Stone (DQS), a privately-held manufacturer of architectural stone siding located in Ohio. DQS provided Headwaters’ light building products segment with additional manufacturing capacity and access to technological processes to improve the productivity of architectural stone manufacturing. DQS’ results of operations have been included in Headwaters’ consolidated statements of operations since the date of acquisition. Total consideration paid at the date of acquisition, of approximately $52.9 million, consisted primarily of cash. An additional $19.0 million was paid in 2008, based on earnings of DQS for the 12-month period ended September 30, 2007 that exceeded an agreed-upon threshold.
F-32
Table of Contents
HEADWATERS INCORPORATED
NOTES TO CONSOLIDATED FINANCIAL STATEMENTS, continued
September 30, 2009
The DQS acquisition was accounted for using the purchase method of accounting. The consideration paid for DQS was negotiated at arms length and assets acquired and liabilities assumed were recorded at their estimated fair values as of the acquisition date. The following table sets forth the total consideration paid to acquire DQS.
| (in thousands) | |||
| Cash paid or payable to DQS owners |
$ | 59,416 | |
| Cash paid to retire DQS debt and related accrued interest |
12,247 | ||
| Costs directly related to acquisition |
195 | ||
| $ | 71,858 | ||
The following table sets forth the allocation of the total consideration paid to the tangible and intangible assets acquired and liabilities assumed.
| (in thousands) | ||||
| Current assets |
$ | 3,573 | ||
| Property, plant and equipment |
4,595 | |||
| Intangible assets acquired: |
||||
| Trade name (20 years) |
4,400 | |||
| Customer relationships (10 years) |
2,600 | |||
| Non-competition agreements (5 years) |
1,000 | |||
| Goodwill |
56,646 | |||
| Current liabilities |
(956 | ) | ||
| Net assets acquired |
$ | 71,858 | ||
DQS produced architectural stone at a low cost and sold through an established distribution network focused in the central United States. DQS employed skilled artisans that crafted the molds utilized to produce the architectural stone. Because Headwaters’ light building products segment and DQS had similar distribution methods, but little overlap of customers, Headwaters could introduce the DQS product on a nation-wide basis at a low cost. DQS’ commitment to process improvement, technological advances and the synergies possible through similar distribution methods contributed to DQS’ high value and related purchase price. These items, combined with DQS’ growth rate and efficient manufacturing processes, were not separable and, accordingly, contributed to a significant amount of goodwill. As shown above, $8.0 million of the purchase price was allocated to identifiable intangible assets. The intangible assets are being amortized over estimated useful lives ranging from five to twenty years, with a combined weighted average life of approximately 15 years. The remaining purchase price not attributable to the tangible and identifiable intangible assets was allocated to tax deductible goodwill, all of which was written off in 2009 for the reasons described in Note 5.
2008 Acquisition—In 2008, Headwaters acquired certain assets and assumed certain liabilities of a privately-held company in the light building products industry. Total consideration for this acquisition was approximately $16.1 million, of which approximately $5.0 million was paid at the date of acquisition and approximately $10.8 million was paid in 2009, with approximately $0.3 million of assumed liabilities.
F-33
Table of Contents
HEADWATERS INCORPORATED
NOTES TO CONSOLIDATED FINANCIAL STATEMENTS, continued
September 30, 2009
| 12. | Commitments and Contingencies |
Commitments and contingencies as of September 30, 2009 not disclosed previously, are as follows.
Leases—Headwaters has noncancellable operating leases for certain facilities and equipment. Most of these leases have renewal terms and currently are set to expire in various years through 2019. Rental expense was approximately $34.4 million, $35.0 million and $39.2 million in 2007, 2008 and 2009, respectively. As of September 30, 2009, minimum rental payments due under these leases are as follows.
| Year ending September 30: |
(in thousands) | ||
| 2010 |
$ | 31,525 | |
| 2011 |
23,982 | ||
| 2012 |
17,946 | ||
| 2013 |
13,308 | ||
| 2014 |
9,098 | ||
| Thereafter |
8,258 | ||
| $ | 104,117 | ||
Purchase Commitments—Certain CCP contracts with suppliers require Headwaters to make minimum purchases of raw materials. In addition, two of Headwaters’ building products companies and one energy technology company have contracted with suppliers for the future purchase of materials. Actual purchases under contracts with minimum requirements were approximately $17.6 million, $19.4 million and $18.3 million for 2007, 2008 and 2009, respectively. As of September 30, 2009, minimum future purchase requirements, the large majority of which relate to CCP contracts, are as follows.
| Year ending September 30: |
(in thousands) | ||
| 2010 |
$ | 14,333 | |
| 2011 |
10,351 | ||
| 2012 |
4,327 | ||
| 2013 |
3,684 | ||
| 2014 |
2,663 | ||
| Thereafter |
11,471 | ||
| $ | 46,829 | ||
Compensation Arrangements—Employment Agreements. Headwaters and its subsidiaries have entered into employment agreements with its Chief Executive Officer and several other officers and employees. The agreements have original terms ranging up to five years, many of which are renewable by Headwaters, often for one-year terms. They provide for annual salaries currently ranging from approximately $0.1 million to $0.7 million annually per person. Assuming all agreements set to expire in 2009 are renewed, the annual commitment under all employment agreements combined would currently approximate $2.0 million. The aggregate commitment for all future periods as of September 30, 2009, assuming no renewals, is approximately $2.0 million. Many agreements provide for termination benefits, which vary widely from agreement to agreement.
Long-Term Incentive Cash Bonus Awards. In 2006, Headwaters’ Compensation Committee (the Committee) authorized the grant of long-term incentive cash bonus awards to certain officers and employees, which awards
F-34
Table of Contents
HEADWATERS INCORPORATED
NOTES TO CONSOLIDATED FINANCIAL STATEMENTS, continued
September 30, 2009
were granted under Headwaters’ Long Term Incentive Compensation Plan. In accordance with terms of the awards, cash payments are based on several factors, including the achievement of stipulated financial goals as measured by economic value added (EVA) by Headwaters and its operating units over the three-year period ended September 30, 2008. Payments for these awards may not exceed $30.0 million in the aggregate; however, based on results achieved during the three-year performance period, the maximum total payouts under the awards will not exceed $2.8 million, of which $2.1 million has been either paid or accrued as of September 30, 2009.
Executive Change in Control Agreements. In 2006, the Committee also approved “Executive Change in Control Agreements” with certain officers. Upon a change in control, as defined, the agreements provide for immediate vesting and exercisability of all outstanding stock awards. In addition, if termination of employment occurs within a specified period of a change in control, the agreements provide for i) severance pay equal to two times the sum of an officer’s current annual salary plus the highest cash bonus paid or payable for any single year in the three-year period commencing two years prior to the year in which the change in control occurs; and ii) continuance of health and other benefits and perquisites for a two-year period following the change in control. If terminations associated with a change in control would have occurred on September 30, 2009, the cash severance payments due to the officers plus the estimated costs of continuing benefits and perquisites and the excess of the market value of stock-based awards above related exercise prices would have aggregated approximately $10.9 million.
Performance Unit Awards. In 2005, the Committee authorized the grant of performance unit awards, to be settled in cash, based on performance criteria tied to the economic value created or preserved by one of Headwaters’ business units after December 2007. The grants of these performance units could result in the payment to employees of a maximum amount of approximately $2.3 million if all performance criteria are met. No amounts have been expensed for these awards through September 30, 2009 because it is not yet probable that the performance criteria will be met.
In 2009, the Committee approved grants of performance unit awards to certain officers and employees, to be settled in cash, based on the achievement of goals tied to cumulative divisional free cash flow generated subsequent to September 30, 2008 and prior to September 30, 2028, at which time the awards expire, if not forfeited earlier. These awards replaced all existing long-term cash-based awards, except for certain awards already earned at the date of grant. For purposes of these awards, free cash flow is generally defined as operating income plus depreciation, amortization and goodwill impairment, reduced by capital expenditures. Payments will vest according to a predetermined schedule as free cash flow accumulates over time. The maximum payout under the performance unit awards if all performance criteria were to be achieved by all of Headwaters’ operating divisions would be approximately $77.8 million. Approximately $0.7 million has been accrued for these awards through September 30, 2009.
Employee Benefit Plans—In addition to standard health and life insurance programs, Headwaters has five employee benefit plans that were operative from 2007 through 2009: the 401(k) Profit Sharing Plan (401(k) Plan), the 2000 Employee Stock Purchase Plan (ESPP), the Incentive Bonus Plan (IBP), the Deferred Compensation Plan (DCP) and the Long Term Incentive Compensation Plan (LTIP). Substantially all employees of Headwaters are eligible to participate in the 401(k) Plan and the ESPP after meeting length of service requirements. Only designated employees are eligible to participate in the IBP, DCP and LTIP.
The total expense for all of Headwaters’ benefit plans combined (including all general and discretionary bonuses, but excluding standard health and life insurance programs and ESPP expense, which is included in stock-based compensation) was approximately $23.0 million, $14.2 million and $7.1 million in 2007, 2008 and 2009, respectively.
F-35
Table of Contents
HEADWATERS INCORPORATED
NOTES TO CONSOLIDATED FINANCIAL STATEMENTS, continued
September 30, 2009
401(k) Plan. Under the terms of the 401(k) Plan, eligible employees may elect to make tax-deferred contributions of up to 50% of their compensation, subject to statutory limitations. Headwaters may match employee contributions up to a designated maximum rate, which matching contributions vest after three years. Headwaters is not required to be profitable to make matching contributions.
ESPP. The ESPP provides eligible employees with an opportunity to purchase Headwaters common stock on favorable terms and to pay for such purchases through payroll deductions. Approximately 1.3 million shares of common stock have been reserved for issuance under the Plan, and approximately 0.2 million shares remain available for future issuance as of September 30, 2009. In accordance with terms of the ESPP, participating employees purchase shares of stock directly from Headwaters, which shares have historically been made available from treasury shares which have been repurchased on the open market. The ESPP is intended to comply with Section 423 of the Internal Revenue Code, but is not subject to the requirements of ERISA. Employees purchase stock through payroll deductions of 1% to 10% of cash compensation, subject to certain limitations. The stock is purchased in a series of quarterly offerings. The cost per share to the employee is 85% of the fair market value at the end of each offering period.
IBP. The IBP, the specifics of which are approved annually by the Committee, provides for annual cash bonuses to be paid if Headwaters accomplishes certain financial goals and if participating employees meet individual goals.
DCP. The DCP is a nonqualified plan that allows eligible employees to make tax-deferred contributions of up to 50% of their base compensation and 100% of their incentive compensation. Headwaters may match employee contributions up to a designated maximum rate, which matching contributions vest after three years. Headwaters is not required to be profitable to make matching contributions.
LTIP. Other than obligations associated with the long-term incentive cash bonus awards and the 2009 performance unit awards described above and grants of certain of the stock-based awards described in Note 9, Headwaters has no material commitments under the LTIP as of September 30, 2009.
Self Insurance—Headwaters has adopted self-insured medical insurance plans that cover substantially all employees. There is stop-loss coverage for amounts in excess of $200,000 per individual per year. Headwaters also self insures for workers compensation claims in most states, limited by stop-loss coverage which begins for amounts in excess of $250,000 per occurrence and approximately $5.3 million in the aggregate annually. Headwaters has contracted with third-party administrators to assist in the payment and administration of claims. Insurance claims are recognized as expense when incurred and include an estimate of costs for claims incurred but not reported at the balance sheet date. As of September 30, 2009, approximately $7.2 million is accrued for medical and workers compensation claims incurred on or before September 30, 2009 that have not been paid or reported.
Property, Plant and Equipment—As of September 30, 2009, Headwaters was committed to spend approximately $5.5 million on capital projects that were in various stages of completion.
Joint Venture Obligations—Headwaters has entered into various joint ventures with Evonik Industries AG, an international chemical company based in Germany. One of these joint ventures purchased a hydrogen peroxide business located in South Korea. Headwaters is at risk for payment of 50% of the joint venture’s obligations, limited to Headwaters’ investment in the joint venture. Headwaters applies the equity method of accounting for its interest in this joint venture, and accordingly records its share of the joint venture’s foreign
F-36
Table of Contents
HEADWATERS INCORPORATED
NOTES TO CONSOLIDATED FINANCIAL STATEMENTS, continued
September 30, 2009
currency transaction gains and losses. These gains and losses arise primarily because the joint venture’s functional currency is the Korean Won, but it has significant debt obligations denominated in and repayable in the Euro. Headwaters’ share of the joint venture’s foreign currency transaction gains and losses was not material in 2007, but losses of approximately $6.6 million were recorded in 2008 and gains of approximately $1.1 million were recorded in 2009.
Legal Matters—Headwaters has ongoing litigation and asserted claims which have been incurred during the normal course of business, including the specific matters discussed below. Headwaters intends to vigorously defend or resolve these matters by settlement, as appropriate. Management does not currently believe that the outcome of these matters will have a material adverse effect on Headwaters’ operations, cash flow or financial position.
Historically, costs paid to outside legal counsel for litigation have comprised a majority of Headwaters’ litigation-related costs. During 2008 and 2009, Headwaters incurred approximately $1.8 million and $4.2 million, respectively, of expense for legal matters, which consisted primarily of costs for outside legal counsel. Headwaters currently believes the range of potential loss for all unresolved matters, excluding costs for outside counsel, is from $1.0 million up to the amounts sought by claimants and has recorded a total liability as of September 30, 2009 of $1.0 million. Claims and damages sought by claimants in excess of this amount are not deemed to be probable. Headwaters’ outside counsel currently believe that unfavorable outcomes of outstanding litigation are neither probable nor remote and declined to express opinions concerning the likely outcomes or liability to Headwaters. Accordingly, management cannot express an opinion as to the ultimate amount, if any, of Headwaters’ liability, nor is it possible to estimate what litigation-related costs will be in future periods.
The specific matters discussed below raise difficult and complex legal and factual issues, and the resolution of these issues is subject to many uncertainties, including the facts and circumstances of each case, the jurisdiction in which each case is brought, and the future decisions of juries, judges, and arbitrators. Therefore, although management believes that the claims asserted against Headwaters in the named cases lack merit, there is a possibility of material losses in excess of the amounts accrued if one or more of the cases were to be determined adversely against Headwaters for a substantial amount of the damages asserted. It is possible that a change in the estimates of probable liability could occur, and the changes could be material. Additionally, as with any litigation, these proceedings require that Headwaters incur substantial costs, including attorneys’ fees, managerial time and other personnel resources, in pursuing resolution.
Boynton. In October 1998, Headwaters entered into a technology purchase agreement with James G. Davidson and Adtech, Inc. The transaction transferred certain patent and royalty rights to Headwaters related to a synthetic fuel technology invented by Davidson. In June 2002, Headwaters received a summons and complaint from the United States District Court for the Western District of Tennessee filed by former stockholders of Adtech alleging, among other things, fraud, conspiracy, constructive trust, conversion, patent infringement and interference with contract arising out of the 1998 technology purchase agreement entered into between Davidson and Adtech on the one hand, and Headwaters on the other. All claims against Headwaters were dismissed in pretrial proceedings except claims of conspiracy and constructive trust. The District Court certified a class comprised of substantially all purported stockholders of Adtech, Inc. At trial, the plaintiffs sought compensatory damages from Headwaters in the approximate amount of $43.0 million plus prejudgment interest and punitive damages. On June 22, 2009, a jury reached a verdict in a trial in the amount of $8.7 million for eight named plaintiffs representing a portion of the class members. The jury also reached a verdict on certain legal liability issues and an advisory verdict on damages of $12.7 million on behalf of the balance of the class members. Fact discovery has begun with respect to unnamed class members. Headwaters expects that there will be further trial
F-37
Table of Contents
HEADWATERS INCORPORATED
NOTES TO CONSOLIDATED FINANCIAL STATEMENTS, continued
September 30, 2009
court proceedings to resolve an equitable claim as to all members of the class and the remaining legal issues as to the unnamed class members. It is not expected that a final judgment will be entered by the trial court until all issues are concluded following such further trial court proceedings which have not yet been scheduled. Once final judgment is entered, the parties may seek relief from judgment by motion to the trial court and by appeal from the final judgment. Because the resolution of the litigation is uncertain, legal counsel and management cannot express an opinion as to the ultimate amount, if any, of Headwaters’ liability.
Ecologica Carmelo. Headwaters Resources, Inc. (HRI), a subsidiary through which Headwaters conducts its CCP business, entered into a fly ash supply agreement with Ecologica Carmelo, Inc. (Carmelo) in February 2002 to supply fly ash to Carmelo for sale and use in the Caribbean basin region. The agreement guarantees first availability of fly ash to Carmelo from specific power generating plants and Carmelo agreed to purchase exclusively from HRI and to purchase a minimum tonnage of fly ash annually. In April 2008, HRI filed an arbitration demand against Carmelo in Atlanta, Georgia, alleging that Carmelo breached the fly ash supply agreement by failing to purchase the minimum annual volume of fly ash it was obligated to purchase under that agreement and for violation of Carmelo’s obligation to exclusively purchase fly ash from HRI. HRI is seeking approximately $3.9 million for lost profits on minimum fly ash purchases, plus other direct, incidental, and consequential damages relating to Carmelo’s failure to purchase from HRI exclusively.
In June 2008, Carmelo filed its response to HRI’s arbitration demand. Carmelo denied that it breached the fly ash supply agreement, alleged that it properly terminated the agreement, and filed a counterclaim against HRI. Carmelo has alleged that HRI failed to secure a cost-effective source of fly ash for Carmelo in violation of the fly ash supply agreement. Carmelo has asserted claims for breach of contract, breach of Puerto Rico Law No. 75, and breach of the covenant of good faith and fair dealing. Carmelo is seeking damages of at least $12.3 million which allegedly represents the lost value of its investment in a facility designed for the intake and storage of fly ash from HRI. HRI and Carmelo are attempting to reach a negotiated resolution of the matter. Because the resolution of the action is uncertain, legal counsel and management cannot express an opinion concerning the likely outcome of this matter or the liability of HRI, if any.
Mainland Laboratory. HRI entered into a license agreement for the use of a fly ash carbon treatment technology with Mainland Laboratory, LTD (Mainland) in April 2000. The agreement grants exclusive rights to the patented carbon treatment technology owned by Mainland. In 2006, HRI became aware of prior art relating to the Mainland patented technology which Headwaters believed invalidated the Mainland patent and HRI stopped paying royalties under the agreement. In September 2007, Mainland filed suit against HRI in the United States District Court for the Southern District of Texas with a demand for arbitration under the terms of the license agreement, for breach of contract and patent infringement. Mainland is seeking approximately $23.0 million in damages, enhancement of any damages award based on alleged willful infringement of its patent, and recovery of its costs associated with the litigation, including its attorneys’ fees. Additionally, Mainland is seeking an injunction to stop HRI from practicing the technology covered by the patent. The District Court has ruled that Mainland’s patent is invalid and remanded the case to arbitration for further proceedings. Because the resolution of remaining claims in arbitration is uncertain, legal counsel and management cannot express an opinion concerning the likely outcome of this matter or the liability of HRI, if any.
Coalco Corporation. Beginning in 1996, Headwaters entered into a series of agreements with Coalco Corporation by which Coalco would assist Headwaters in identifying financing sources for synthetic fuel manufacturing projects. Under these agreements, Headwaters agreed to pay certain fees to Coalco. Beginning in 1997, Pelletco Company, an affiliate of Coalco, entered into license agreements for the use of Headwaters’ synthetic fuel technology for which Pelletco agreed to pay certain license fees to Headwaters. As of
F-38
Table of Contents
HEADWATERS INCORPORATED
NOTES TO CONSOLIDATED FINANCIAL STATEMENTS, continued
September 30, 2009
December 31, 2008, trade receivables include $3.8 million which is due from Pelletco to Headwaters. The synthetic fuel businesses underlying all of these agreements ended during fiscal 2008. In January 2009, Coalco filed a complaint in state court which was removed to the United States District Court for the District of Massachusetts, alleging that Headwaters breached its agreements to pay certain fees to Coalco. Coalco seeks damages in the principal amount plus interest totaling approximately $27.4 million, plus attorneys’ fees, and other costs. Pelletco joined the complaint with Coalco, both seeking declaratory judgment as to their rights and obligations under the various agreements. Headwaters filed an answer denying the allegations of the complaint. Headwaters also filed a counterclaim against the plaintiffs and their principals claiming breach of contract and related claims for failure to pay the $3.8 million due from Pelletco to Headwaters. The parties have filed cross-motions for summary judgment which could be resolved in December 2009. Trial is scheduled to begin in March 2010. Because the resolution of the litigation is uncertain, legal counsel and management cannot express an opinion as to the ultimate amount, if any, of Headwaters’ liability. Although the merits of Coalco and Pelletco’s claims against Headwaters will be determined in due legal course, management currently believes that the $3.8 million owed to Headwaters from Pelletco is due and collectible.
J. Hall Inc. In June 2009, J. Hall, Inc. (Hall) and RC Trucking, Inc. (RC) filed a complaint against Covol Fuels No. 3, LLC (Covol) (a subsidiary of Headwaters), Yukon Coal Company, LLC, Suburban Coal Sales, LLC, and Century Coal, LLC (collectively, Yukon) in Bell County Circuit Court in the Commonwealth of Kentucky. The complaint alleges that Hall and RC obtained or brokered coal on behalf of Yukon which was then sold by Yukon to Covol. Allegedly, Yukon never paid Hall and RC for the coal. Hall and RC named Covol as a party to the suit claiming that Covol is an alter ego of Yukon and that Covol and Yukon are engaged in a joint venture or partnership in the operation of Covol’s coal cleaning facility located near Beverly, Kentucky. Hall and RC have asserted claims against Covol for breach of contract, unjust enrichment, and right of offset against Covol for monies owed by Hall and RC to Covol. Hall and RC are seeking damages of $0.7 million. Covol filed counterclaims against Hall and RC for breach of contract, or in the alternative, unjust enrichment for plaintiffs’ failure to pay for coal sold by Covol to Hall and RC in separate transactions. Covol seeks damages against Hall in the amount of $0.6 million. Covol also seeks monetary damages against RC for amounts less than $0.1 million. Although the merits of Hall’s and RC’s claims against Covol will be determined in due legal course, management currently believes that the $0.6 million owed to Covol from Hall and RC is due and collectible.
Fentress Families Trust. VFL Technology Corporation (VFL), acquired by HRI in 2004, provides services related to fly ash disposal to Virginia Electric and Power Company. Approximately 395 plaintiffs, most of whom are homeowners living in the City of Chesapeake, Virginia, filed a complaint in March 2009 in the State of Virginia Chesapeake Circuit Court against 16 named defendants, including Virginia Electric and Power Company, certain persons associated with the Battlefield Golf Course, including the owner, developer, and contractors, and others, including VFL and Headwaters. The complaint alleges that fly ash used to construct the golf course has contaminated area ground water exposing plaintiffs to toxic chemicals and causing property damage. The complaint alleges multiple causes of action and seeks a new water system, monitoring costs, site clean-up, and other damages totaling approximately $1.8 billion, including certain injunctive relief. A second lawsuit was filed in August 2009 and has been consolidated with the first action where approximately 62 plaintiffs have sued essentially the same defendants, alleging similar claims and requests for damages, in excess of $1.5 billion. The consolidated case is at an early stage of investigation and pleadings by the parties. Because resolution of the litigation is uncertain, legal counsel and management cannot express an opinion as to the ultimate amount, if any, of Headwaters’ liability.
Redbird Mountain Coal Company. In December 2008, Covol Fuels No. 3, LLC, one of our subsidiaries, and Yukon Coal Company, LLC, an affiliate of Redbird Mountain Coal Company, LLC, entered into an Amended
F-39
Table of Contents
HEADWATERS INCORPORATED
NOTES TO CONSOLIDATED FINANCIAL STATEMENTS, continued
September 30, 2009
and Restated Coal Purchase and Refuse Recovery Agreement (“Amended Purchase Agreement”), pursuant to which Covol spent in excess of $25.0 million to construct an on-site coal processing facility on land leased to Redbird by Asher Land and Mineral, LLP. Following a bankruptcy filing by Redbird in June 2009 in the United States Bankruptcy Court for the Eastern District of Kentucky, Redbird marketed the sale of its lease to the land that includes the on-site coal processing facility, claiming the leasehold interest included the coal processing facility. In July 2009, Covol filed an adversary proceeding before the bankruptcy court seeking declaratory judgment that it has exclusive ownership of the on-site coal processing facility, and in the alternative a claim for unjust enrichment against Redbird and Asher. Asher subsequently filed a counterclaim seeking a declaration that Covol has no right or interest in the coal processing facility or that Asher has a perfected security interest. Redbird filed a motion with the bankruptcy court seeking to reject the Amended Purchase Agreement. Trial is scheduled to begin in January 2010. Because resolution of the litigation is uncertain, legal counsel and management cannot express an opinion as to the ultimate amount, if any, of Headwaters’ liability.
Archstone. Archstone owns an apartment complex in Westbury, New York. Archstone alleges that moisture penetrated the building envelope and damaged moisture sensitive parts of the buildings which began to rot and grow mold. In 2008, Archstone evicted its tenants and began repairing the twenty-one apartment buildings. In January 2008, Archstone filed a complaint in the Nassau County Supreme Court of the State of New York against the prime contractor and its performance bond surety, the designer, and Eldorado Stone, LLC which supplied architectural stone that was installed by others during construction. The prime contractor then sued over a dozen subcontractors who in turn sued others. Archstone claims as damages approximately $36.0 million in repair costs, $15.0 million in lost lease payments, prejudgment interest, and an unknown amount for liabilities to tenants who have sued Archstone. Eldorado Stone answered denying liability and tendered the matter to its insurers who are paying for the defense of the case. Because the resolution of the action is uncertain, legal counsel and management cannot express an opinion concerning the likely outcome of this matter, the liability of Eldorado Stone, if any, or the insurers’ obligation to indemnify Eldorado Stone against loss, if any.
Headwaters Building Products Matters. There are litigation and pending and threatened claims made against certain subsidiaries of Headwaters Building Products (HBP), a division within Headwaters’ light building products segment, with respect to several types of exterior finish systems manufactured and sold by its subsidiaries for application by contractors on residential and commercial buildings. Typically, litigation and these claims are defended by such subsidiaries’ insurance carriers. The plaintiffs or claimants in these matters have alleged that the structures have suffered damage from latent or progressive water penetration due to some alleged failure of the building product or wall system. Some claims involve alleged defects associated with components of an Exterior Insulating and Finish System (EIFS) which was produced for a limited time (through 1997) by the HBP subsidiaries. There is a 10-year projected claim period following discontinuation of the product. Other claims involve alleged liabilities associated with certain stucco and architectural stone products which are produced and sold by certain subsidiaries of HBP.
Typically, the claims cite damages for alleged personal injuries and punitive damages for alleged unfair business practices in addition to asserting more conventional damage claims for alleged economic loss and damage to property. To date, claims made against such subsidiaries have been paid by their insurers, with the exception of minor deductibles or self-insured retentions, although such insurance carriers typically have issued “reservation of rights” letters. While, to date, none of these proceedings have required that HBP incur substantial costs, there is no guarantee of insurance coverage or continuing coverage. These and future proceedings may result in substantial costs to HBP, including attorneys’ fees, managerial time and other personnel resources and costs. Adverse resolution of these proceedings could have a materially negative effect on HBP’s business, financial condition, and results of operation, and its ability to meet its financial obligations. Although HBP carries general and product
F-40
Table of Contents
HEADWATERS INCORPORATED
NOTES TO CONSOLIDATED FINANCIAL STATEMENTS, continued
September 30, 2009
liability insurance, HBP cannot assure that such insurance coverage will remain available, that HBP’s insurance carrier will remain viable, or that the insured amounts will cover all future claims in excess of HBP’s uninsured retention. Future rate increases may also make such insurance uneconomical for HBP to maintain. In addition, the insurance policies maintained by HBP exclude claims for damages resulting from exterior insulating finish systems, or EIFS, that have manifested after March 2003. Because resolution of the litigation and claims is uncertain, legal counsel and management cannot express an opinion as to the ultimate amount, if any, of HBP’s liability.
Other. Headwaters and its subsidiaries are also involved in other legal proceedings that have arisen in the normal course of business.
Section 45K Matters—A material amount of Headwaters’ consolidated revenue and net income through December 31, 2007 was derived from license fees and sales of chemical reagents, both of which were dependent on the ability of licensees and other customers to manufacture and sell qualified synthetic fuel that generated tax credits under Section 45K of the Internal Revenue Code. Headwaters has also claimed Section 45K tax credits for synthetic fuel sales from facilities in which it owned an interest (see Note 8). The following issues exist related to Section 45K tax credits.
Termination of Section 45K. By law, Section 45K tax credits for synthetic fuel produced from coal expired for synthetic fuel sold after December 31, 2007. With the expiration of Section 45K at the end of calendar 2007, Headwaters’ licensees’ synthetic fuel facilities and the facilities owned by Headwaters were closed because production of synthetic fuel was not profitable absent the tax credits. The closure of these facilities had a material adverse effect on the revenue, net income and cash flow of Headwaters. Section 45K tax credits were subject to phase-out after the average annual U.S. wellhead oil price (reference price) reached a beginning phase-out threshold price, and would have been eliminated entirely if the reference price had reached the full phase-out price. The calendar 2007 reference price and phase-out range were announced in calendar 2008 and accordingly, in fiscal 2008 Headwaters adjusted previously recognized revenue and tax credits as required to reflect the finalized phase-out.
IRS Audits. The IRS is currently auditing Headwaters’ tax credits claimed for synthetic fuel sold from the facilities in which it owned an interest. The tax credits which are under audit that Headwaters believes are more likely than not to be sustained, and are therefore not included in unrecognized income tax benefits in the balance sheet, total approximately $30.0 million.
Section 45 Matters—As explained in Note 8, Headwaters’ effective tax rates for 2008 and 2009 are lower than the statutory rate in part due to refined coal tax credits related to facilities that Headwaters owns and operates. Headwaters believes the refined coal produced at these facilities and sold to qualified buyers qualifies for tax credits under Section 45 (which are different from the Section 45K tax credits discussed above) of the Internal Revenue Code. To date, the IRS has issued limited guidance about how this tax credit program will be administered and what restrictions will be placed on the availability of such credits. Based on the language of Section 45, Headwaters believes that its coal cleaning facilities are eligible for Section 45 refined coal tax credits, and as a result, has recognized a benefit for such credits in its 2008 and 2009 tax provisions. The ability to claim tax credits is dependent upon a number of conditions, including, but not limited to:
| • | Placing facilities in service on or before December 31, 2008; |
| • | Producing a fuel from coal that is lower in NOx and either SOx or mercury emissions by the specified amount as compared to the emissions of the feedstock; |
| • | Producing a fuel at least 50% more valuable than the feedstock; and |
| • | Sale of the fuel to a third party for the purpose of producing steam. |
F-41
Table of Contents
HEADWATERS INCORPORATED
NOTES TO CONSOLIDATED FINANCIAL STATEMENTS, continued
September 30, 2009
The IRS will challenge Section 45 tax credits claimed by Headwaters. In addition, Congress may modify or repeal Section 45 so that these tax credits may not be available in the future. From 2007 through 2009, Headwaters has recognized a total benefit of approximately $10.3 million related to Section 45 tax credits.
In the Energy Improvement and Extension Act of 2008, Congress extended the benefits of Section 45 tax credits to refined coal facilities placed in service during calendar 2009. For refined coal facilities placed in service in calendar year 2009, Congress also eliminated the Section 45 requirement that there be a 50% increase in market value but increased the emissions reduction required of either SOx or mercury to 40% from 20%.
| 13. | Related Party Transactions |
In addition to transactions disclosed elsewhere, Headwaters was involved in the following transactions with related parties. A director of Headwaters is a principal in one of the insurance brokerage companies Headwaters uses to purchase certain insurance benefits for its employees. Commissions paid to that company by providers of insurance services to Headwaters totaled approximately $0.2 million in 2007, 2008 and 2009.
A majority of one of Headwaters’ subsidiary’s transportation needs are provided by a company, two of the principals of which are related to an officer of the subsidiary. Costs incurred were approximately $5.7 million, $7.8 million and $6.8 million in 2007, 2008 and 2009, respectively.
One of Headwaters’ other subsidiaries purchases product from an entity located in Mexico in which a person who was an officer of Headwaters until November 2007 has a minority ownership interest. Costs incurred for materials purchased from this entity were approximately $14.6 million, $10.2 million and $6.7 million in 2007, 2008 and 2009, respectively.
| 14. | Quarterly Financial Data (unaudited) |
Summarized unaudited quarterly financial data for 2008 and 2009 is as follows.
| 2008 | |||||||||||||||||||
| (in thousands, except per-share data) |
First quarter |
Second quarter |
Third quarter |
Fourth quarter (3) |
Full year | ||||||||||||||
| Net revenue (1) |
$ | 248,897 | $ | 171,979 | $ | 230,456 | $ | 235,072 | $ | 886,404 | |||||||||
| Gross profit |
63,056 | 41,335 | 64,292 | 64,128 | 232,811 | ||||||||||||||
| Net income (loss) |
9,913 | (9,204 | ) | 13,697 | (184,086 | ) | (169,680 | ) | |||||||||||
| Basic earnings (loss) per share (2) |
0.24 | (0.22 | ) | 0.33 | (4.46 | ) | (4.10 | ) | |||||||||||
| Diluted earnings (loss) per share (2) |
0.23 | (0.22 | ) | 0.31 | (4.46 | ) | (4.10 | ) | |||||||||||
| 2009 | |||||||||||||||||||
| (in thousands, except per-share data) |
First quarter |
Second quarter (4) |
Third quarter |
Fourth quarter |
Full year | ||||||||||||||
| Net revenue (1) |
$ | 166,166 | $ | 137,668 | $ | 175,231 | $ | 187,611 | $ | 666,676 | |||||||||
| Gross profit |
31,641 | 22,642 | 42,132 | 50,133 | 146,548 | ||||||||||||||
| Net income (loss) (5) |
(879 | ) | (406,269 | ) | 11,292 | (19,694 | ) | (415,550 | ) | ||||||||||
| Basic earnings (loss) per share (2) |
(0.02 | ) | (9.78 | ) | 0.27 | (0.40 | ) | (9.59 | ) | ||||||||||
| Diluted earnings (loss) per share (2) |
(0.02 | ) | (9.78 | ) | 0.27 | (0.40 | ) | (9.59 | ) | ||||||||||
| (1) | Headwaters’ revenue is very seasonal. Also, in 2008, the timing of revenue recognized for tax credit-based license fees was significantly affected by the “fixed or determinable” accounting rules for revenue recognition (see Note 2). |
F-42
Table of Contents
HEADWATERS INCORPORATED
NOTES TO CONSOLIDATED FINANCIAL STATEMENTS, continued
September 30, 2009
| (2) | In accordance with ASC Topic 260 Earnings Per Share, EPS is computed independently for each of the four fiscal quarters in a year. The basic and diluted EPS computed for 2008 and 2009 do not equal the sum of the four quarterly computations due primarily to the combination of profitable quarters and loss quarters in each year. |
| (3) | In the fourth quarter of 2008, Headwaters recorded an income tax benefit of only $0.5 million even though there was a loss before income taxes of $170.2 million. This resulted primarily from the non-tax deductibility of most of the $205.0 million goodwill impairment charge recorded in that quarter (see Notes 5 and 8). The estimated effective tax rate used to record income tax expense (prior to the consideration of discrete items) for the first three quarters was 29%. The effective tax rate for the year was less than 1%. |
| (4) | In the second quarter of 2009, Headwaters recorded a goodwill impairment charge of $465.7 million, most of which was not tax-deductible and which therefore had a material effect on the effective income tax rate for 2009 (see Notes 5 and 8). |
| (5) | As described in Note 6, in 2009 Headwaters exchanged certain convertible senior subordinated notes for new convertible senior subordinated notes and for common stock, for a net gain of approximately $6.9 million. Gains of approximately $17.6 million, $1.6 million and $10.1 million were recognized in the first, second, and third quarters of 2009, respectively, and a loss of approximately $22.4 million was recognized in the fourth quarter. |
F-43