Attached files
| file | filename |
|---|---|
| 8-K - 8-K FILING FOR PRESENTATION AT CITI SMALL/MID CAP CONFERENCE - MEREDITH CORP | form8k.htm |

Citi’s 6th Annual
Small/Mid Cap Conference
New York, Nov. 19-20, 2009

2
Safe Harbor
This presentation and management’s public commentary contain certain forward-looking statements
that are subject to risks and uncertainties. These statements are based on management’s current
knowledge and estimates of factors affecting the Company’s operations. Statements in this
presentation that are forward-looking include, but are not limited to, the statements regarding
broadcast pacings, publishing advertising revenues, as well as any guidance related to the Company’s
financial performance.
Actual results may differ materially from those currently anticipated. Factors that could adversely affect
future results include, but are not limited to, downturns in national and/or local economies; a softening
of the domestic advertising market; world, national, or local events that could disrupt broadcast
television; increased consolidation among major advertisers or other events depressing the level of
advertising spending; the unexpected loss or insolvency of one or more major clients; the integration
of acquired businesses; changes in consumer reading, purchasing and/or television viewing patterns;
increases in paper, postage, printing, or syndicated programming costs; changes in television network
affiliation agreements; technological developments affecting products or the methods of distribution;
changes in government regulations affecting the Company’s industries; unexpected changes in
interest rates; and the consequences of any acquisitions and/or dispositions. The Company
undertakes no obligation to update any forward-looking statement, whether as a result of new
information, future events, or otherwise.

3
Agenda
§ Meredith Overview
§ Advertising Overview
§ Performance Improvement Plan
§ Financial Overview
4
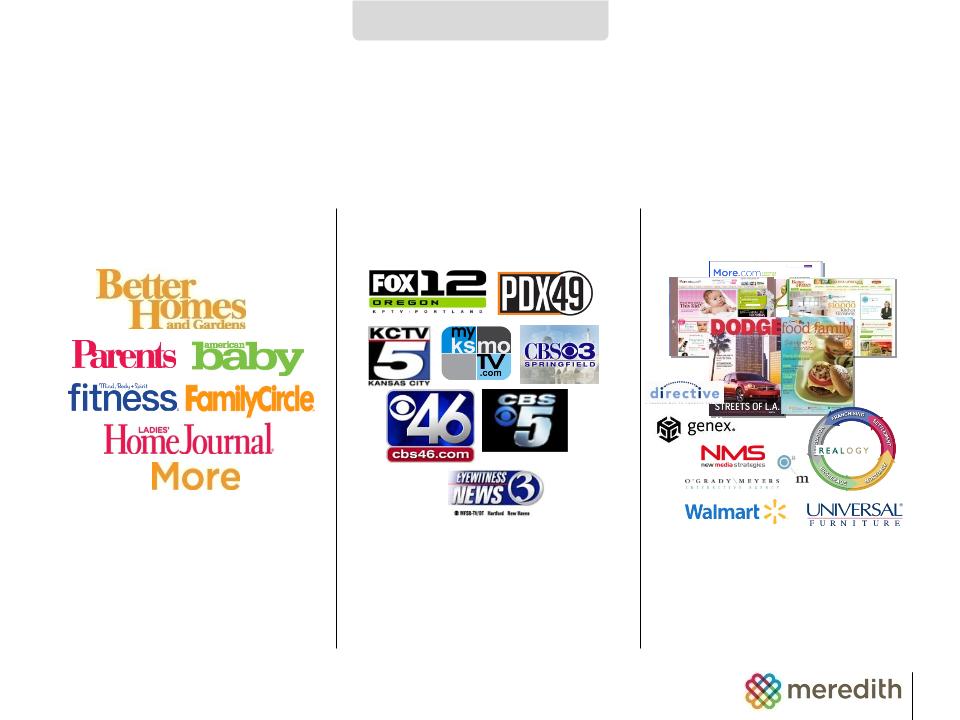
Broad Media and Marketing Footprint
MEREDITH OVERVIEW
§ Integrated Marketing
§ Brand Licensing
§ Retransmission fees
§ Video Solutions
NATIONAL MEDIA
Revenues: $900 million
Revenues: $900 million
LOCAL MEDIA
Revenues: $270 million
Revenues: $270 million
§ 25 Subscription titles
§ 135 Newsstand titles
§ 30+ Websites
§ 12 television stations
§ 10% of U.S. households
§ 25+ Websites
MARKETING SERVICES &
DIVERSIFIED
Revenues: $240 million
DIVERSIFIED
Revenues: $240 million
4

5
Powerful National Brands Across Life Stages
MEREDITH OVERVIEW
PARENTHOOD/FAMILY
HOME/SHELTER
25 subscription
magazines
magazines
30+ websites 17MM
unique visitors
unique visitors
135 Special
Interest titles
Interest titles

6
6
National Media Brands Achievements
§ Delivered highest-ever market share in magazine advertising
§ Achieved all-time high profit contribution from circulation
§ Increased newsstand market share
§ Eliminated 10% in expenses
§ Named “Publishing Company of the Year”
MEREDITH OVERVIEW
7
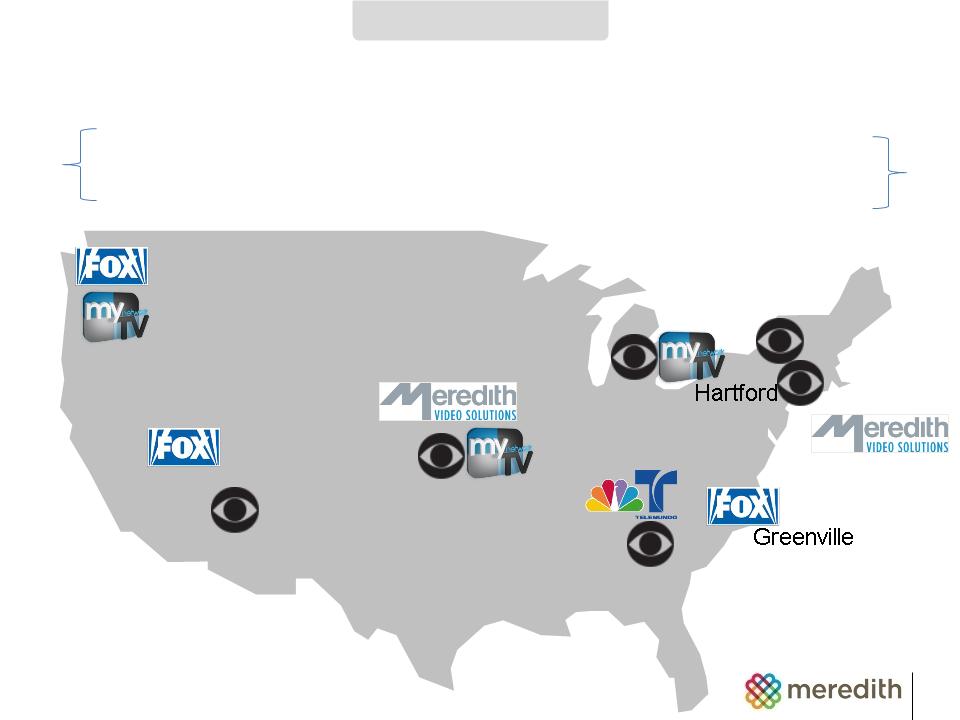
12 network affiliates
10MM+ households
Diverse Local Media Portfolio Across Country
MEREDITH OVERVIEW
25+ websites
5MM unique visitors
Mobile platforms
Syndicated Television
Kansas City
Phoenix
Flint-Saginaw
Atlanta
Nashville
Las Vegas
Portland
Springfield
New York
Des Moines

8
8
Local Media Brands Achievements
§ Grew morning news ratings across the group
§ Increased Atlanta’s ratings in every newscast
§ Expanded number of markets airing Better show
§ Developed new sales and marketing programs
§ Initiated cost-saving plan to create hubs
MEREDITH OVERVIEW
9
MEREDITH INTEGRATED
MARKETING
MARKETING
BRAND LICENSING
RETRANSMISSION/VIDEO
SOLUTIONS
SOLUTIONS
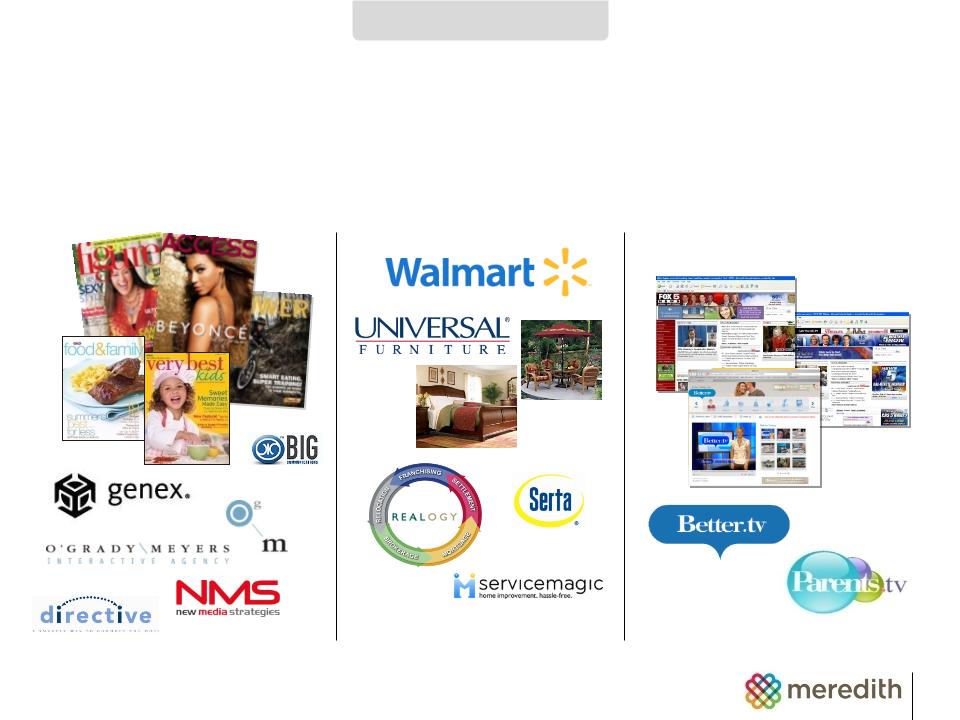
Growing Marketing Solutions and Diversified Businesses
MEREDITH OVERVIEW

10
Online: Meredith
Women’s Network
Women’s Network
Magazines: Home, Family,
Health & Well-being
Health & Well-being
Consumer Events
Custom Marketing
Database Marketing
Consumer Research
Broad Capabilities Across Media Platforms
Video Solutions
Brand Licensing
MEREDITH OVERVIEW

11
Agenda
§ Meredith Overview
§ Advertising Overview
§ Performance Improvement Plan
§ Financial Overview

12
ADVERTISING OVERVIEW
|
|
Meredith
Internal |
Industry
PIB |
|
Meredith
Internal |
Industry
TVB |
|
1st Half FY09 |
(18)% |
(12)% |
|
(20)% |
(16)% |
|
2nd Half FY09 |
(12)% |
(22)% |
|
(27)% |
(25)% |
|
1st Quarter FY10 |
(5)% |
(18)% |
|
(13)% |
(20)% |
|
2nd Quarter FY10 |
(4-6)%* ESTIMATE |
N/A |
|
(8)%* PACINGS |
N/A |
National Media Brands
Local Media Brands
* As of Oct. 29, 2009
Progressive advertising revenue improvement

13
§ Month-to-month volatility in magazine advertising
§ Broadcasting strengthening - November and December
results are uncertain
results are uncertain
§ Limited visibility into calendar 2010 ad budgets
§ Will update advertising outlook mid-December, 2009
Advertising environment
ADVERTISING OVERVIEW

14
Agenda
§ Meredith Overview
§ Advertising Overview
§ Performance Improvement Plan
– Gain market
share in core businesses
– Increase consumer connection
– Develop new revenue streams
– Exercise disciplined expense and cash management
§ Financial Overview
STRATEGIC OVERVIEW
15
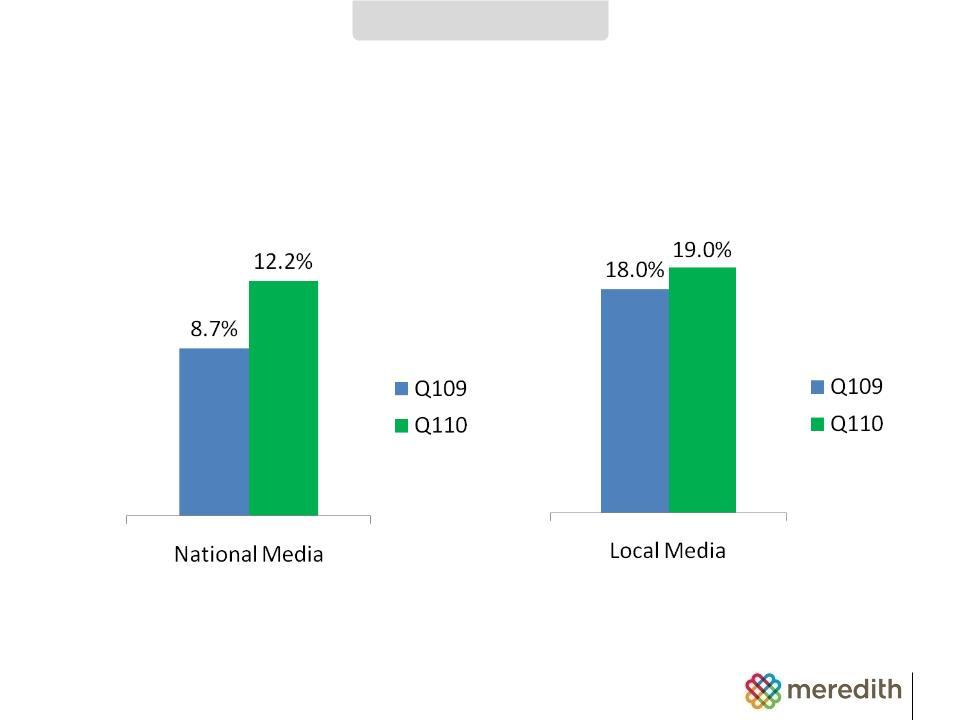
Growing National and Local Market Share
GAIN MARKET SHARE
Source: National: TNS Media Intelligence, 2009, Local: TvB

16
Agenda
STRATEGIC OVERVIEW
§ Meredith Overview
§ Current Advertising Update
§ Performance Improvement Plan
– Gain market share in core businesses
– Increase
consumer connection
– Develop new revenue streams
– Exercise disciplined expense and cash management
§ Financial Overview

17
17
§ Magazine readership strong at 110 million
§ Direct mail response rates increased
§ Newsstand market share grew
§ November TV sweeps strong to-date
§ Record traffic on Meredith Women’s Network
§ Wal-Mart licensing agreement expanded
Increase Consumer Connection
INCREASE CONSUMER CONNECTION

18
Agenda
STRATEGIC OVERVIEW
§ Meredith Overview
§ Advertising Overview
§ Performance Improvement Plan
– Gain market share in core businesses
– Increase consumer connection
– Develop
new revenue streams
– Exercise disciplined expense and cash management
§ Financial Overview
19
§ Integrated Marketing
§ Brand Licensing
§ Retransmission
§ Video Solutions
§ Mobile Marketing Opportunity
New Revenue Stream Development
DEVELOP NEW REVENUE STREAMS

20
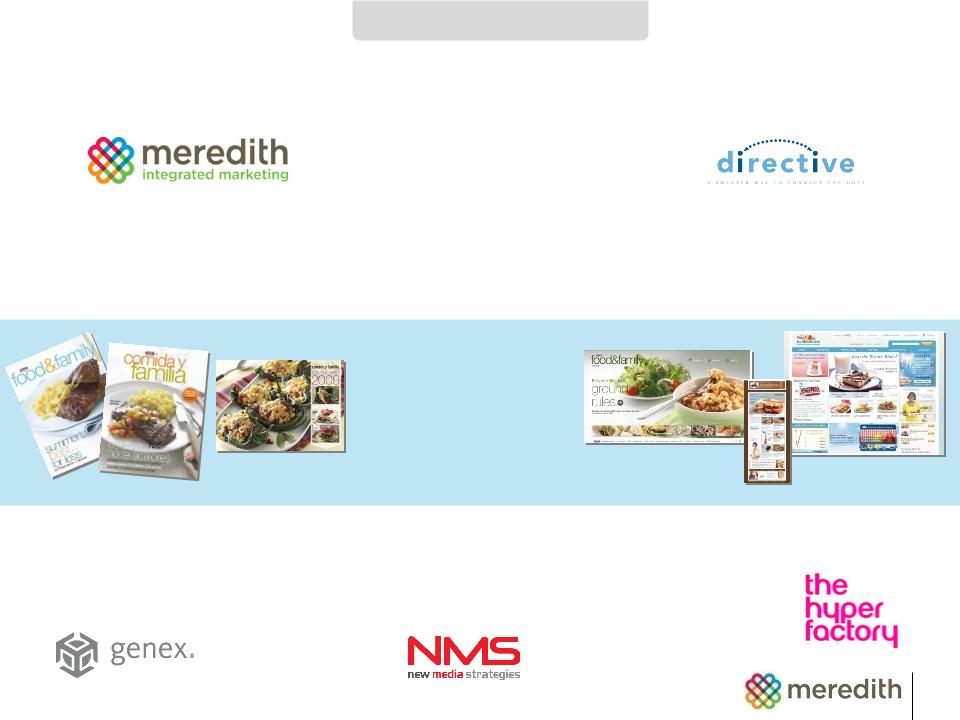
Meredith Integrated Marketing Update
DEVELOP NEW REVENUE STREAMS
§ Client base of nearly 200
§ Rich pipeline of requests for new business proposals
§ Clients focused on program expense and measurability
§ Great interest in new ways of taking brands to market
– Social media
– Mobile
21
• Content strategy
• Quarterly magazines
• Multi-language e-mail campaigns
• Food photography & videos in multiple languages
• Database Marketing strategy
• Campaign management
• Business intelligence
• Shopper purchase analytics
• Digital magazine
• iFood assistant
• Digital design
• Digital strategy
• Mobile strategy
• Mobile execution
• Online word of mouth
• Digital public relations
• Online intelligence
• Food blogging
Kraft & Meredith Integrated Marketing
DEVELOP NEW REVENUE STREAMS
Kraft CRM
&
Meredith

22
Growing Presence in Brand Licensing
– Sales meeting expectations
– SKUs tripled to more than 1,500 in 2009
– Expanded to Canada earlier this month
DEVELOP NEW REVENUE STREAMS
Garden
Interior decor
Paint
Canada

23
$ in millions
DEVELOP NEW REVENUE STREAMS
Increasing TV Retransmission Revenues
$4
$20+
$8
2006
(Actual)
2008
(Actual)
2010
(Estimate)

24
§ The next big distribution platform
§ Opportunities in:
– Business to consumer
– Business to business
§ Clients increasingly asking for mobile marketing solutions
§ Relationship with The Hyperfactory
– Clients include Toyota, Coke, Blackberry, Nike,
Vodafone, Disney
– Offices in New York, Los Angeles, New Zealand,
India
GROW NEW REVENUE STREAMS
Mobile Opportunity

25
Agenda
§ Meredith Overview
§ Advertising Overview
§ Performance Improvement Plan
– Gain market share across businesses
– Increase consumer connection
– Develop new revenue streams
– Exercise
disciplined expense and cash management
§ Financial Overview
STRATEGIC OVERVIEW

26
Actions Taken
DISCIPLINED EXPENSE MANAGEMENT
§ Departmental efficiencies
§ Reductions in workforce
§ Strategic vendor sourcing initiative
§ Reduced capital expenditures
§ Aggressive working capital management
§ Result: Reduced $125 million in debt over 15 months
27
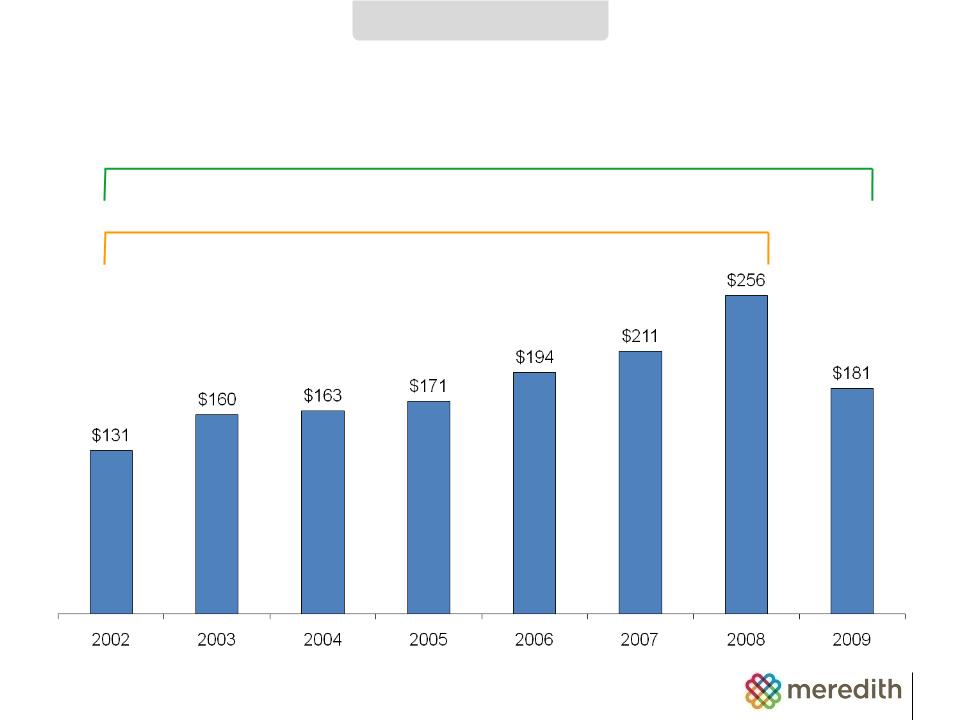
Historical Cash Flow From Operations
FINANCIAL OVERVIEW
12% CAGR
5% CAGR
$ in millions

28
Use of Cash: Fiscal 2000 through 2009
FINANCIAL OVERVIEW
200
Stock Option Exercises
$2,000
Utilization of Cash
100
Net Debt
300
Capital Expenditures
600
Acquisitions, Net of Dispositions
$2,000
Available Cash
$1,800
Operating Cash Flow
300
Dividends
$ in millions
$700
Share Repurchases
$1,000
SUBTOTAL
29
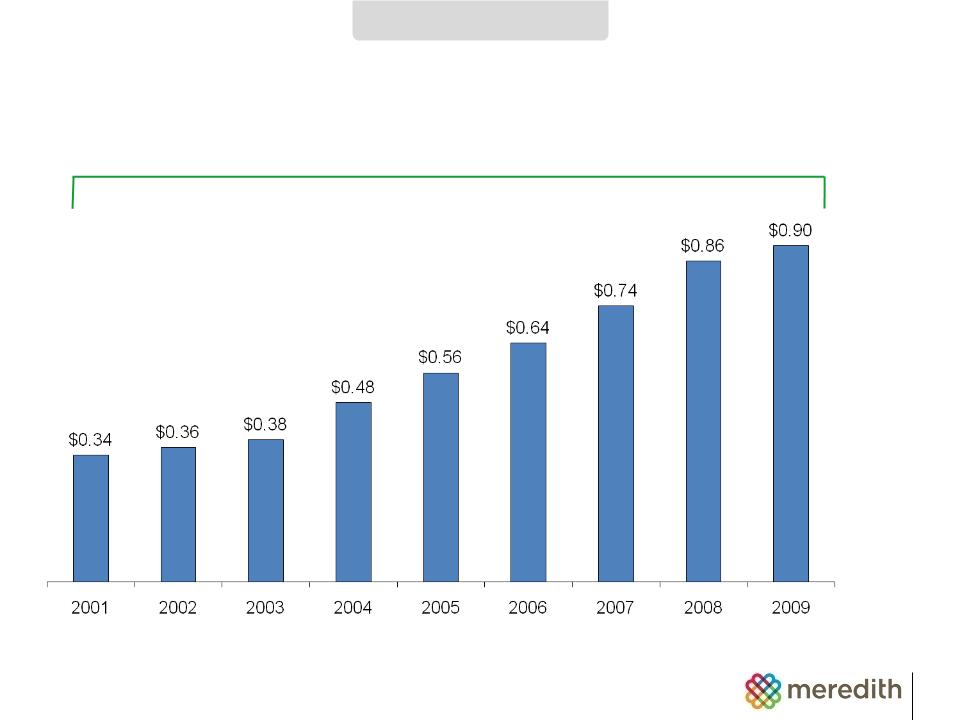
Calendar Year Dividends Per Share
FINANCIAL OVERVIEW
13% CAGR

30
|
|
Current |
Capacity/Authorization |
|
Debt Level |
$360 million |
Additional $470 million |
|
Debt-to-EBITDA Ratio |
1.7x |
Less than 3.75x |
|
Interest Coverage Ratio |
10.8x |
Greater than 2.75x |
|
Average Cost of Funds |
5.6% |
|
As of 9/30/09
Financial Metrics
FINANCIAL OVERVIEW

31
$209 trailing 12 EBITDA
$209 trailing 12 EBITDA
$1.7B total cap
$1.3B market cap
§ Current dividend yield
§ EPS multiple:
§ EBITDA multiple
to market capitalization:
to market capitalization:
§ EBITDA multiple
to total capitalization:
to total capitalization:
$2.01 trailing 12 EPS
$29.09 share price
Current Valuation Metrics
• As of Sept. 30, 2009 using trailing 4 quarters actual results, excluding discontinued operations and special items.
• Dividend data uses current dividend of $0.225 per quarter.
• Share price data is market close on Nov. 16, 2009.
FINANCIAL OVERVIEW
$0.90 dividend
$29.09 share price
3.1%
14.5x
6.2x
8.0x

32
Summary
§ Vibrant and profitable media assets and brands
§ Growing market share
§ Wide array of new revenue stream development
§ Strong financial foundation

Citi’s 6th Annual
Small/Mid Cap Conference
New York, Nov. 19-20, 2009