Attached files
| file | filename |
|---|---|
| 8-K - FORM 8-K - General Motors Co | d8k.htm |
| EX-99.1 - NEWS RELEASE DATED NOVEMBER 16, 2009 AND FINANCIAL STATEMENTS - General Motors Co | dex991.htm |
 General Motors Company Preliminary Results July 10, 2009 – Sept. 30, 2009 Nov 16, 2009 Exhibit 99.2 |
 Forward Looking Statements 1 In this presentation and in related comments by our management, our use of the words “expect,” “anticipate,” “ensure,” “promote,”
“target,” “believe,” “improve,” “intend,”
“enable,” “continue,” “will,” “may,” “would,” “could,” “should,” “project,” “projected,” “positioned” or similar
expressions is intended to identify forward-looking statements that represent our current
judgment about possible future events. We believe these judgments are reasonable, but these statements are not guarantees of any events or financial results, and our actual results may differ materially due to a variety of important factors. Among other items, such factors might include: our ability to comply with the requirements of our credit agreements with the U.S. Treasury as well as the EDC and VEBA; our ability to maintain adequate liquidity and financing sources and an appropriate level of debt; our ability to realize production efficiencies and to achieve reductions in costs as a result of our restructuring initiatives and labor modifications; our ability to restore consumers’ confidence in our viability as a continuing entity and our ability to continue to attract customers, particularly for our new products, including cars and crossover vehicles; significant changes in the competitive environment and the effect of competition on our markets, including on our pricing policies; and overall strength and stability of general economic conditions and of the automotive industry, both in the United States and in global markets. |
 Preliminary Managerial Results • General Motors Company is a private company and voluntary filer with United States Securities & Exchange Commission (SEC) – Per agreement with SEC, GM will file under Form 8-K unaudited condensed consolidated managerial financial statements for period July 10 – Sept. 30, 2009 and include information related to Old GM • Consolidated managerial financial statements do not comply with Generally Accepted Accounting Principles (GAAP) – Assets & liabilities valued at historical cost basis (Old GM prior to 363 sale)
– Fixed asset impairment testing and benefit plan remeasurements have not been performed – Results do not reflect application of fresh-start reporting and other adjustments and will change significantly when these adjustments are applied to comply with GAAP – We will continue to analyze time periods in which revenues and expenses were recorded along with allocation of certain assets and liabilities • GM is a new entity and financial statements are not comparable to those of Old GM • In 2010, GM will file Forms 10-Q and 10-K, including GAAP compliant financials, for periods ending Sept. 30, 2009 and Dec. 31, 2009, respectively 2 |
 Changes in Presentation • Q3 2009 preliminary managerial financial results have been segregated into two periods – July 1 through July 9 Old GM – July 10 through Sept 30 New GM • Former Europe, Latin America/Africa/Middle East and Asia Pacific segments combined into GMIO Segment – Consistent with operating structure to streamline business and speed decision making • Due to lack of significant influence over GMAC, GM has changed accounting treatment for investment to cost method from prior equity method – GM’s common equity ownership in GMAC is 24.5%, 9.9% is held directly, and 14.6% is held in an independent trust 3 |
 Highlight of Major Achievements • Encouraging vehicle launches globally – U.S.: Chevrolet Camaro & Equinox, Cadillac SRX, Buick LaCrosse, GMC Terrain – GMIO: Holden Cruze, Daewoo Matiz Creative, Chevrolet Agile, Opel Astra • Fewer brands, dealers & nameplates • Significantly improved cost structure – Competitive wage structure in place – ~19% reduction in total U.S. employment from YE 2008 through September 30 • Healthier balance sheet with lower leverage • Resolution of Delphi restructuring • New BOD and leaner executive team • New operating structure • Accelerating change in GM’s culture 4 |
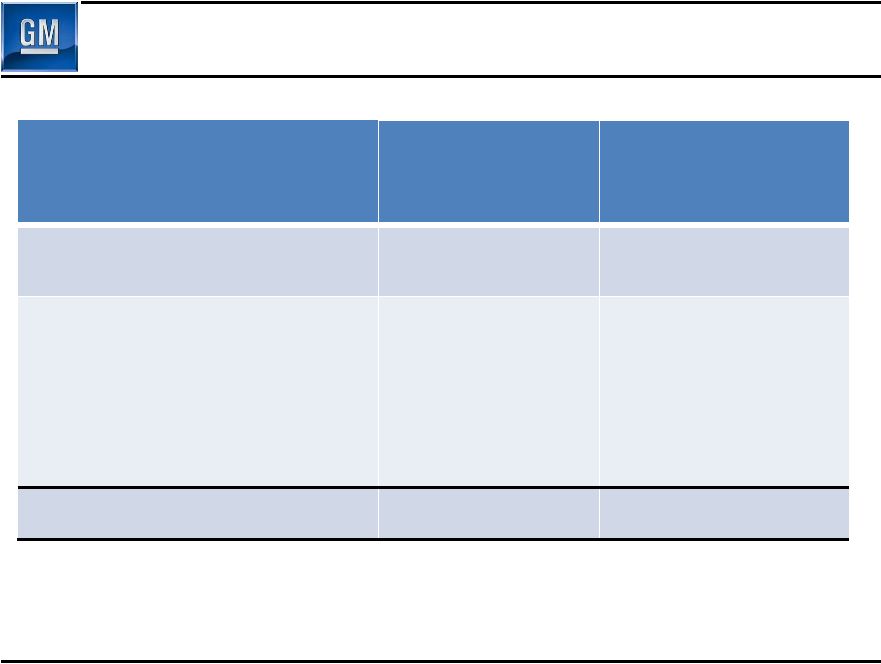
 Preliminary Results Overview 5 July 10 – Sept. 30 Preliminary Managerial Results $Billion Net Revenue $26.5 EBIT $(0.3) Net Interest $(0.2) Special Items $(0.5) EBT $(1.0) Total Managerial Income/(Loss) $(1.2) Managerial OCF (Before Special Items) $3.3 Memo: EBITDA (Before Special Items) $1.5 September 30 Cash Balance Including $17.4B in escrow $42.6 3Q 2009 Actual Status vs. H1 2009 Global Market Share U.S. Market Share China Market Share 11.9% 19.5% 13.5% 0.3 p.p. increase Unchanged 0.1 ppt. increase Ending U.S. Dealer Inventory (000’s) 424K 158K reduction (vs. June 30) |
 Q3
Global Sales Results 6 Memo: Viability Plan 1Q09 2Q09 3Q09 3Q09 * Total Global - Net Revenue ($B) 22.4 23.1 28.0 23.5 - Industry SAAR (Mil) 57.7 62.7 67.8 56.5 - Market Share 11.2% 11.9% 11.9% 11.2% - Production Volume (000) 1,330 1,538 1,697 N/A - Deliveries (000) 1,617 1,937 1,969 1,554 GMNA - GMNA Net Revenue ($B) 12.3 11.4 15.5 14.7 - U.S. Industry SAAR (Mil) 9.7 9.8 11.7 10.8 - U.S. Market Share 18.4% 20.5% 19.5% 18.8% - GMNA Production Volume (000) 371 395 531 532 - GMNA Deliveries (000) 501 657 691 621 GMIO - Net Revenue ($B) 11.2 11.7 12.9 9.4 - Market Share 9.6% 9.9% 9.9% 8.9% - Production Volume (000) 959 1,143 1,166 N/A - Deliveries (000) 1,116 1,281 1,278 933 * Viability Plan based on 5/31 plan filed with U.S. Bankruptcy court in support of
363 sale, adjusted to include full year consolidation of GME and other items (see supplemental slides for detail) Production includes consolidated operations, proportion of JV volume allocated per JV agreement & third party facilities when GM engineering resources, tooling and material is used in exchange for an assembly fee
|
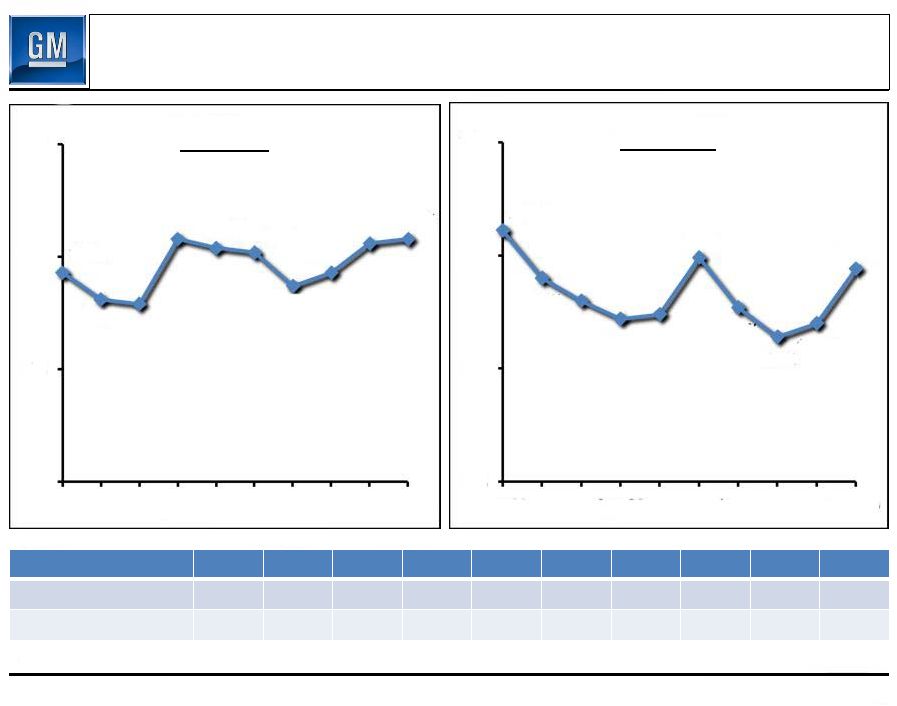 7 Core Brands Jan Feb Mar Apr May Jun Jul Aug Sep Oct Total Share 16.7% 15.0% 14.8% 18.4% 18.0% 16.4% 15.8% 16.2% 18.6% 19.0% Retail Share 18.1% 16.1% 15.1% 14.7% 14.8% 16.0% 14.7% 13.8% 15.7% 18.5% All data prior to July 10, 2009 refers to Old GM. New GM acquired operations from
Old GM on July 10, 2009 10% 15% 20% 25% Jan-09 Apr-09 Jul-09 Oct-09 Total Share 20.8% 19.3% 18.1% 17.9% 20.4% 20.2% 18.7% 19.3% 20.6% 20.8% 10% 15% 20% 25% Jan-09 Apr-09 Jul-09 Oct-09 Retail Share 19.0% 18.0% 17.2% 17.7% 16.4% 17.0% 17.4% 21.1% 19.9% 19.4% U.S. Market Performance 2009 Oct CYTD |
 U.S.
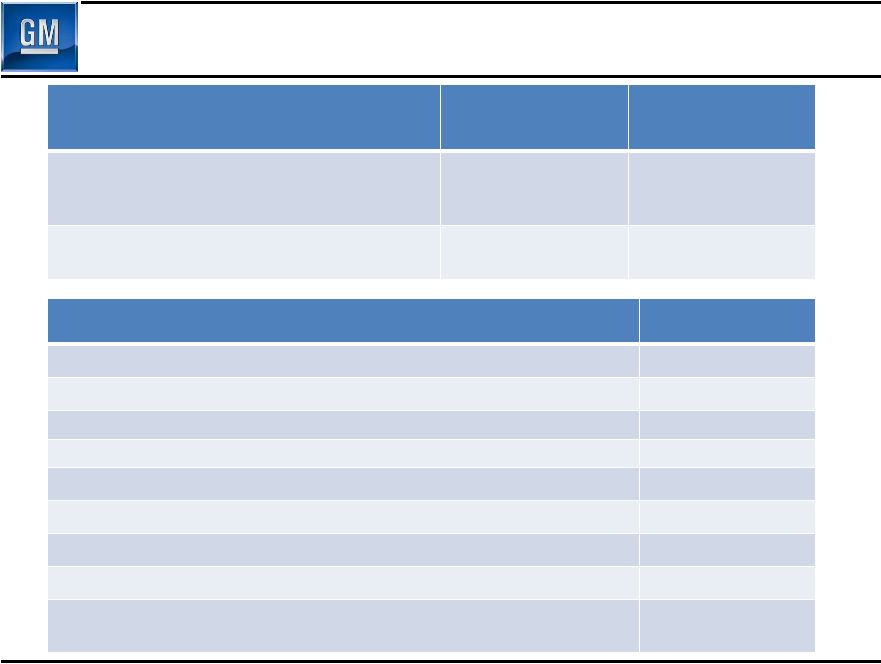
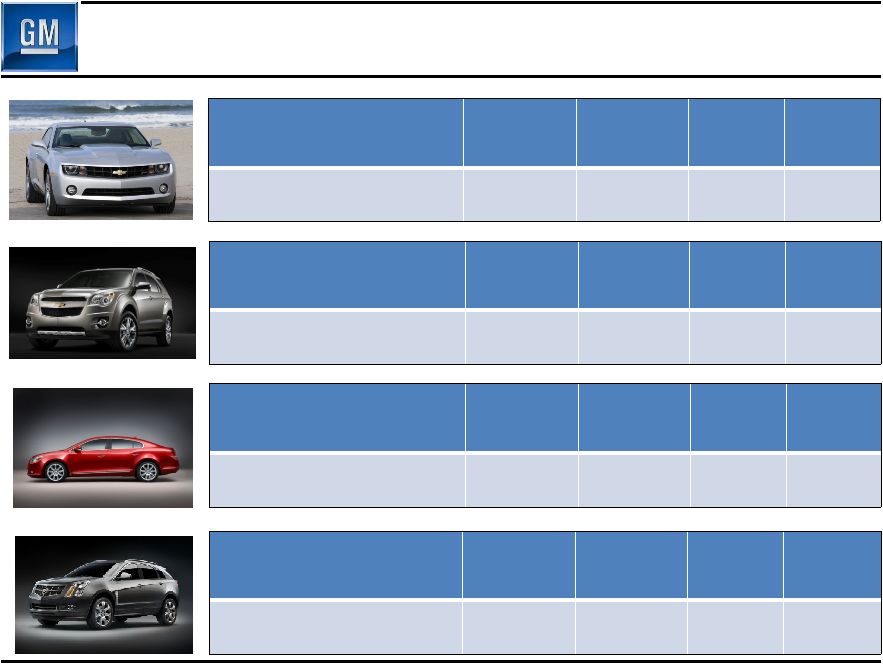
Product Launch Performance 2010 Chevrolet Equinox Share of Segment (Jul–Oct ‘09) Average Transaction Price (ATP) ATP vs. Segment Average 36 month Residual Value U.S. Market Performance vs. predecessor CY 2008 ~ 7.6% + 1.4 ppt. ~ $25,500 + $4,100 110% + 12.9 ppt. 43.4% + 5.4 ppt. 8 2010 Buick Lacrosse Share of Segment (Aug–Oct ‘09) Average Transaction Price (ATP) ATP vs. Segment Average 36 month Residual Value U.S. Market Performance vs. predecessor CY 2008 ~ 4.1% - 0.5 ppt. ~ $31,700 + $9,400 117% + 26.1 ppt. 45.3% + 5.6 ppt. 2010 Cadillac SRX Share of Segment (Sep–Oct ‘09) Average Transaction Price (ATP) ATP vs. Segment Average 36 month Residual Value U.S. Market Performance vs. predecessor CY 2008 ~ 12.0% + 6.8 ppt. ~ $40,300 + $4,300 92% + 5.9 ppt. 50.7% + 14.2 ppt. 2010 Chevrolet Camaro Share of Segment (Jul–Oct ‘09) Average Transaction Price (ATP) ATP vs. Segment Average 36 month Residual Value U.S. Market Performance vs. predecessor CY 2008 ~ 43.9% N/A ~ $34,800 N/A 116% N/A 52.6% N/A |
 U.S.
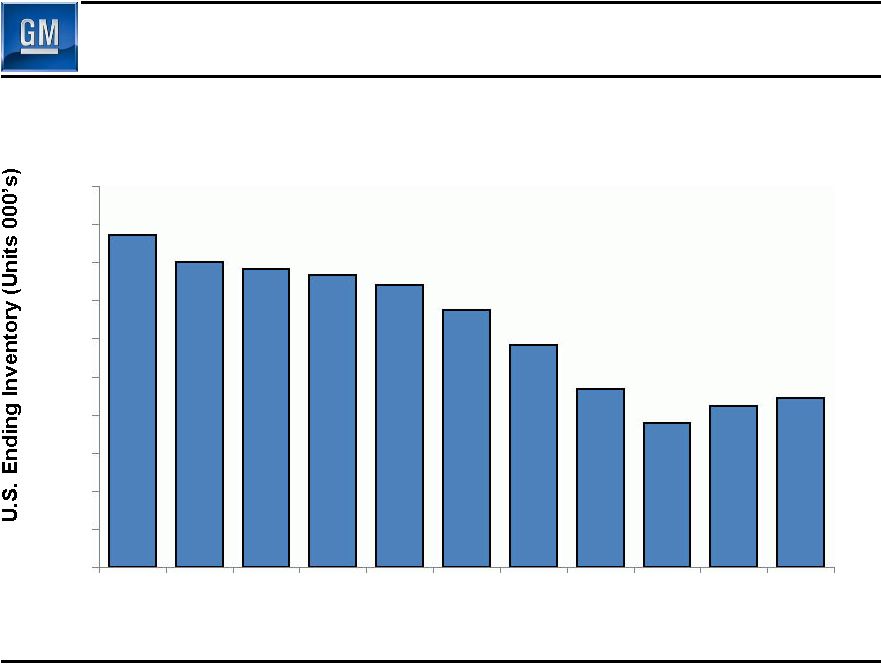
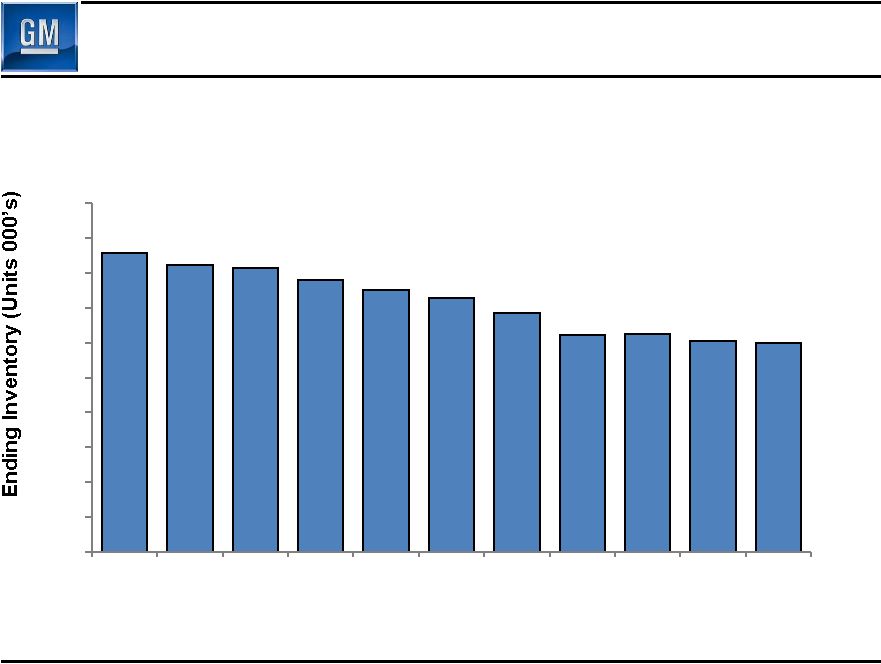
Dealer Inventory 9 All data prior to July 10, 2009 refers to Old GM. New GM acquired operations from
Old GM on July 10, 2009 872 801 781 767 741 674 582 466 379 424 444 0 100 200 300 400 500 600 700 800 900 1,000 Dec-08 Jan-09 Feb-09 Mar-09 Apr-09 May-09 Jun-09 Jul-09 Aug-09 Sep-09 Oct-09 |
 U.S.
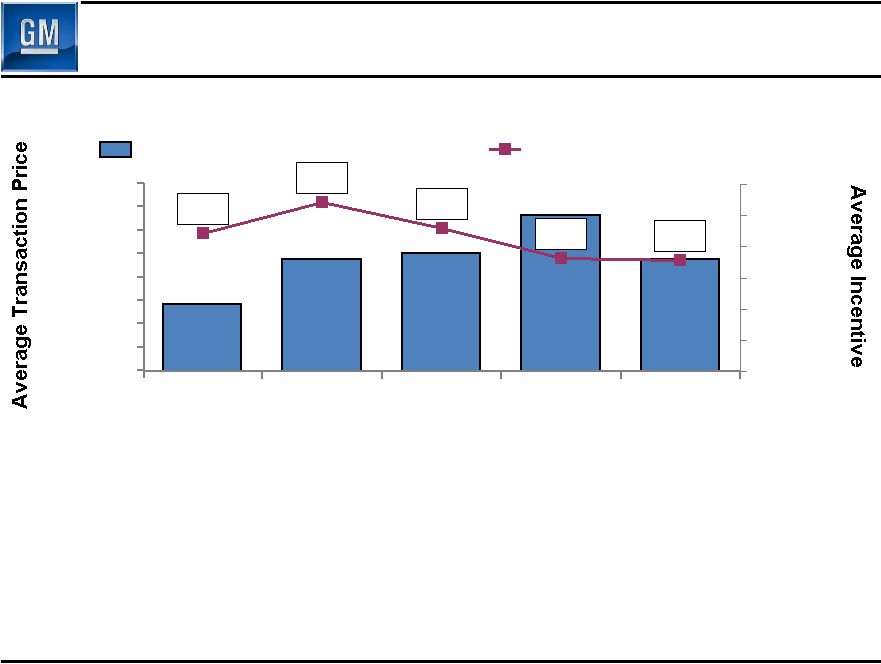
Pricing 10 • Average retail transaction prices trending favorably – Aided by continued performance of launch vehicles – U.S. CARS Program significantly increased sales rate, but negatively impacted
3Q09 average retail transaction price due to increased mix of small vehicles
• Focus on dealer inventory management has favorably impacted retail incentives Average transaction price and incentive based on JD Power PIN data 25,788 27,001 27,156 28,179 26,996 4,427 5,433 4,589 3,641 3,561 3Q08 4Q08 1Q09 2Q09 3Q09 - 1,000 2,000 3,000 4,000 5,000 6,000 Average Retail Transaction Price Average Retail Incentive 24,500 25,000 25,500 26,000 26,500 27,000 27,500 28,000 28,500 |
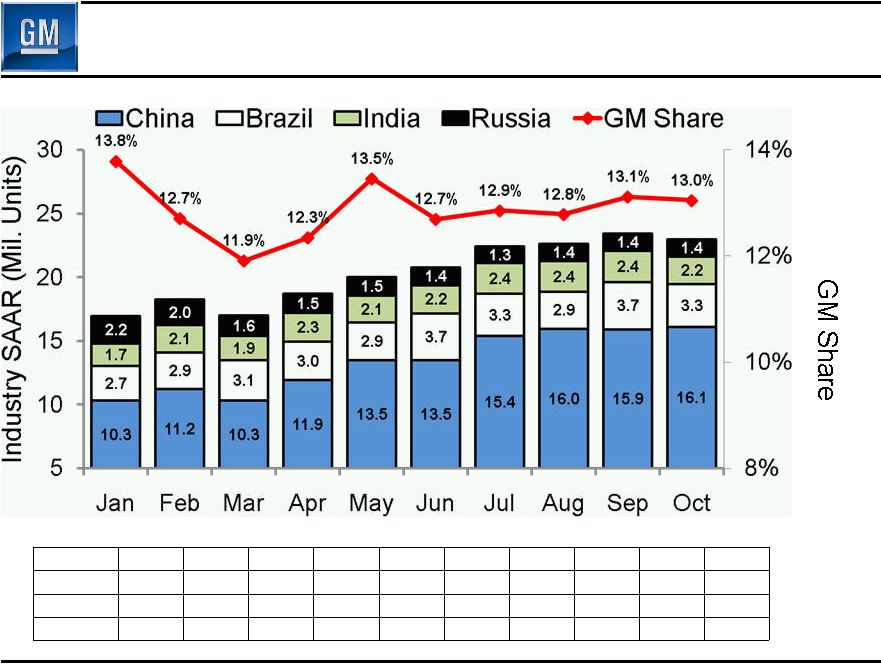 BRIC
Industry Market Performance 2009 CYTD 11 Share by Country China 15.1% 13.8% 12.4% 13.0% 14.0% 12.6% 13.2% 13.4% 13.5% 13.8% Brazil 19.3% 17.9% 18.2% 17.3% 19.4% 19.5% 19.6% 19.5% 20.0% 18.8% India 2.4% 2.8% 2.4% 2.9% 3.0% 2.5% 2.6% 3.1% 3.6% 3.7% Russia 11.6% 11.2% 9.8% 9.3% 11.1% 11.4% 9.3% 7.8% 7.6% 7.5% All data prior to July 10, 2009 refers to Old GM. New GM acquired operations from
Old GM on July 10, 2009 16.9 18.2 16.9 18.7 20.0 20.8 22.4 22.7 23.4 23.0 |
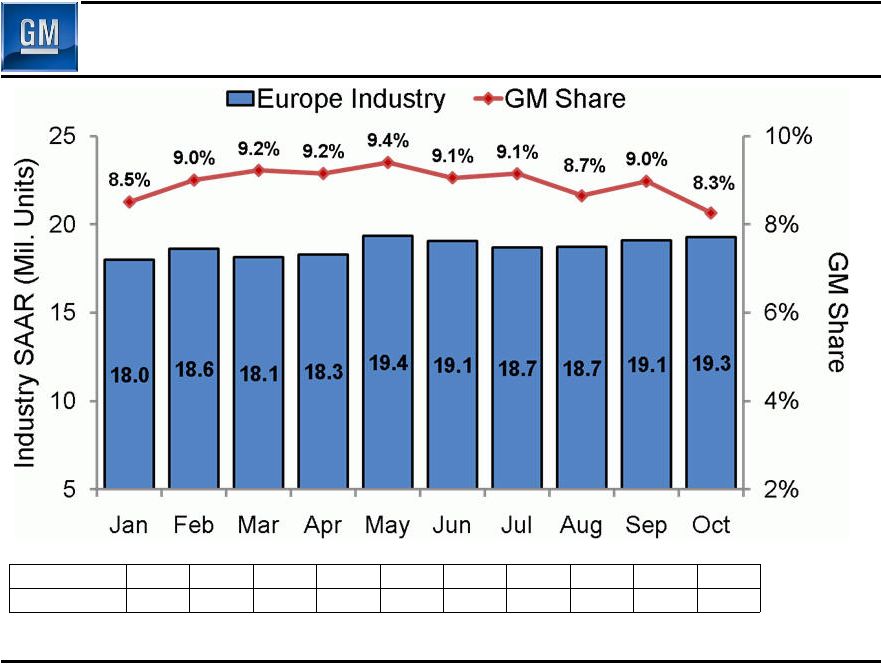 Europe Industry Market Performance 2009 CYTD 12 All data prior to July 10, 2009 refers to Old GM. New GM acquired operations from
Old GM on July 10, 2009 Memo: Industry includes Western, Central,
Eastern and Other Europe (Incl. Russia) Share by Brand Opel/Vauxhall 6.1% 6.3% 7.0% 6.8% 6.9% 6.6% 6.7% 6.0% 6.8% 6.0% Chevrolet 2.2% 2.5% 1.9% 2.1% 2.4% 2.3% 2.3% 2.6% 2.1% 2.2% |
 Europe 2009 GM & Dealer Inventories – Key Markets 13 Western/Central Europe & Russia Opel/Vauxhall/Chevrolet/Saab 429 411 407 390 375 364 342 311 313 303 299 0 50 100 150 200 250 300 350 400 450 500 Dec-08 Jan-09 Feb-09 Mar-09 Apr-09 May-09 Jun-09 Jul-09 Aug-09 Sep-09 Oct-09 |
 Opel • November 4, GM’s Board of Directors decided to retain Opel – Deemed best long-term and least costly solution • Decision based on: – Improving business conditions – Considerable complexity and uncertainty with potential sale • Next steps include: – Work cooperatively and diligently on restructuring with all stakeholders including employees and governments – Discuss financing from European governments • Opel Bridge Loan balance €900M on Sept 30 – Repaid €500M as of Nov 13 – Remaining €400M to be repaid by the end of Nov 14 |
 15 General Motors Company Review of Preliminary Managerial Results |
 Preliminary Managerial Results 16 * Special items (July 1-July 9, 2009) includes reorganization gain of
$80.7B * New GM July 1 - July 10 - ($ Millions) 1Q09 2Q09 July 9, 2009 Sept. 30, 2009 GMNA (2,764) $ (4,058) $ (532) $ (651) $ GMIO (1,216) (1,181) (81) 238 Corp. / Other (Including Elims) (15) (440) (14) 152 GMAC Equity Income/(Loss) (885) (596) 0 0 EBIT (Before Special Items) (4,880) (6,275) (627) (261) Memo: EBITDA (2,603) (2,502) (184) 1,532 Net Interest (1,136) (1,679) (209) (250) Special Items (73) (6,964) 79,672 (505) Total EBT (6,089) (14,918) 78,836 (1,016) Taxes 114 444 522 (135) Total Managerial Net Income/(Loss) (5,975) (14,474) 79,358 (1,151) Old GM |
 Preliminary Special Items 17 New GM July 1 - July 10 - ($ Millions) 1Q09 2Q09 July 9, 2009 Sept. 30, 2009 Restructuring & Special Attrition Programs (116) (3,943) (384) (452) Delphi Related (135) (812) (41) (112) SAAB Related (822) (67) (23) 59 Accelerated Discount Amortization on DIP Financing - (1,620) (600) - Reorganization Gains, Net - (1,157) 80,720 - GMAC Related 385 483 - - Impairments (291) - - - Gain on Extinguishment of Debt 906 - - - Other - 152 - - Total Special Items (73) (6,964) 79,672 (505) Old GM |
 Preliminary Managerial Results 18 New GM Memo: July 1 - July 10 - Viability Plan ($ Millions) 3Q08 July 9, 2009 Sept. 30, 2009 3Q09 ** GMNA (2,015) $ (532) $ (651) $ (2,094) $ GMIO (447) (81) 238 (967) Corp. / Other (Including Elims) 47 (14) 152 (518) GMAC Equity Income/(Loss) (1,235) 0 0 N/A Total EBIT (Before Special Items) (3,650) (627) (261) (3,579) Memo: EBITDA (1,682) (184) 1,532 (1,277) Net Interest (487) (209) (250) (620) Special Items 1,653 79,672 (505) N/A Total EBT (2,484) 78,836 (1,016) (4,199) Taxes (68) 522 (135) Total Managerial Net Income/(Loss) (2,552) 79,358 (1,151) (4,199) Old GM * Special items (July 1-July 9, 2009) includes reorganization gain of
$80.7B * * * Viability Plan based on 5/31 plan filed with U.S. Bankruptcy court in support
of 363 sale, adjusted to include full year consolidation of GME and other
items (see supplemental slides for detail) |
 GMNA
Preliminary Managerial Results Before Special Items 19 * Viability Plan based on 5/31 plan filed with U.S. Bankruptcy court in support of
363 sale, adjusted to include full year consolidation of GME and other items
(see supplemental slides for detail) Old GM New GM Memo: July 1 - July 10 - Viability Plan ($ Millions) 3Q08 July 9, 2009 Sept. 30, 2009 3Q09 * Revenue $22,544 $398 $15,252 $14,652 EBIT (2,015) (532) (651) (2,094) EBIT Margin (8.9)% (133.7)% (4.3)% (14.3)% Memo: EBITDA (760) (204) 577 (741) Viability Plan 3Q08 3Q09 3Q09 GMNA Production (000's) 915 531 532 |
 GMIO
Preliminary Managerial Results Before Special Items 20 * Viability Plan based on 5/31 plan filed with U.S. Bankruptcy court in support of
363 sale, adjusted to include full year consolidation of GME and other items
(see supplemental slides for detail) ** Excludes IO eliminations Old GM New GM Memo: July 1 - July 10 - Viability Plan ($ Millions) 3Q08 July 9, 2009 Sept. 30, 2009 3Q09 * Revenue $15,714 $1,147 $11,775 $9,397 Income/(Loss) Before Interest, Taxes, Equity Income (569) (63) 167 (1,101) Equity Income 71 8 217 82 Non-Controlling Interests 51 (26) (146) 52 EBIT (447) (81) 238 (967) EBIT Margin (2.8)% (7.1)% 2.0% (10.3)% Memo: EBITDA 211 26 745 (64) Memo: EBIT ** - Europe n/a n/a (437) n/a - LAAM n/a n/a 245 n/a - Asia Pacific n/a n/a 429 n/a Viability Plan 3Q08 3Q09 GMIO Production (000's) 1,124 N/A 3Q09 1,166 |
 Automotive Structural Cost Summary 21 New GM 9 Months January 1 July 10 Ended Through Through September 30, 2008 July 9, 2009 September 30, 2009 Total Structural Cost ($Bil) $37.8B $22.0B $9.1B Old GM Structural cost performance achieved through: – Salaried headcount reduction – Hourly headcount reduction – Engineering savings – Volume related savings – Media spending |
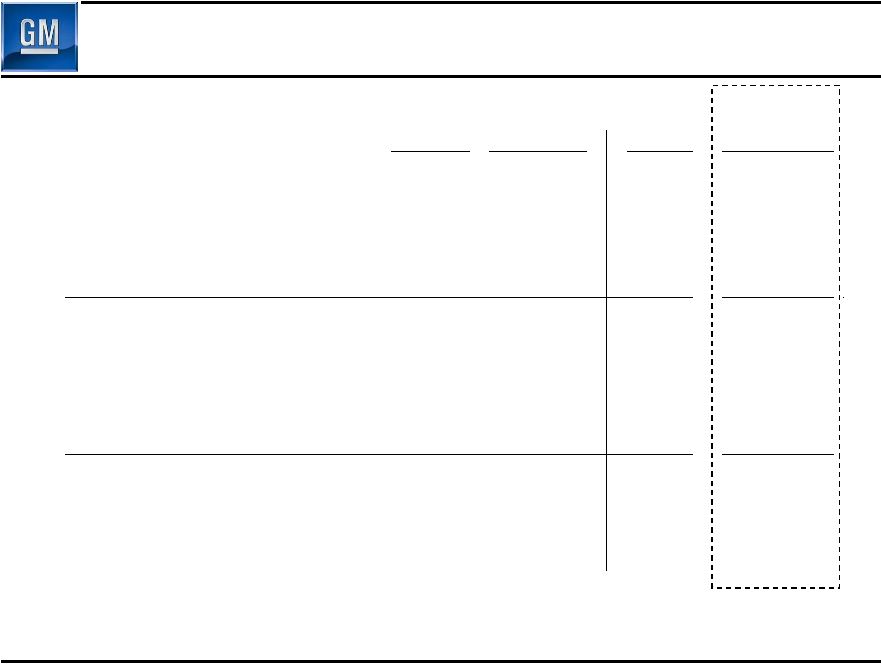
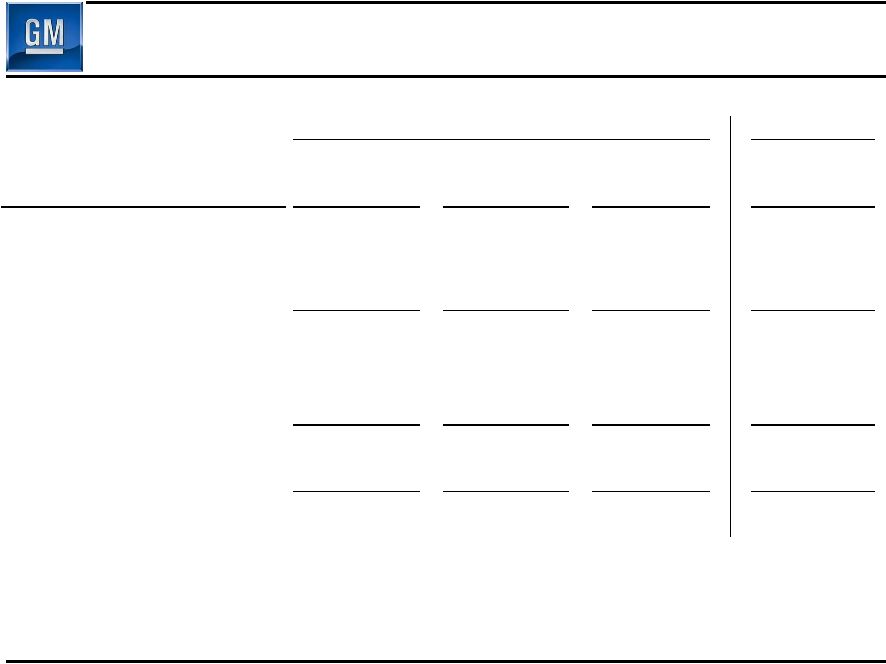
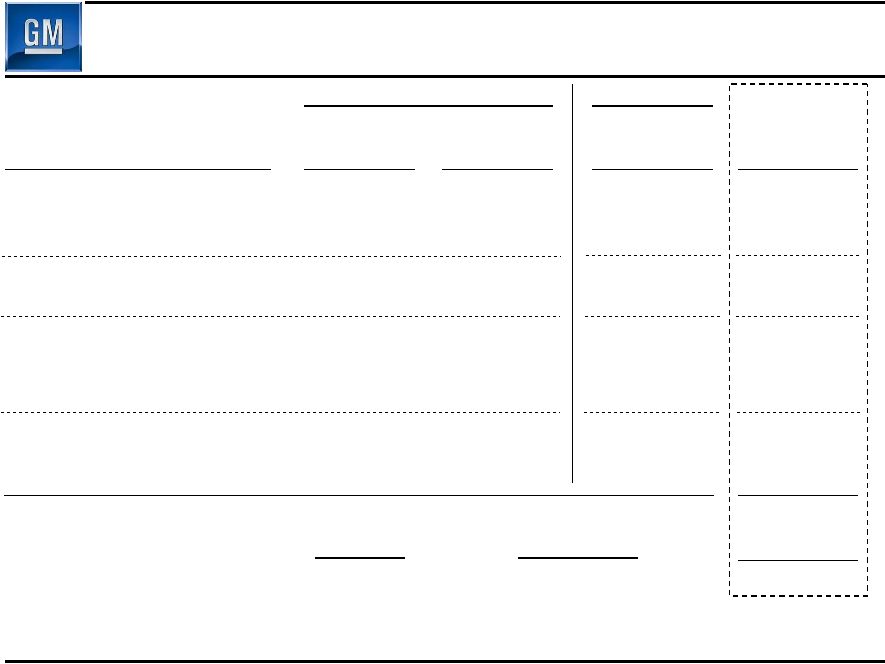
 Total Debt September 30, 2009 vs. July 9, 2009 ** Total debt as of 9/30/2009 does not include $9B preferred stock, $2.5B UAW VEBA
note, or $0.7B CAW note Old GM 22 * Does not include equitization of $3.9B received from EDC post July 10th ($ billions) Sept 30 UST 6.7 EDC (C$1.5) 1.4 Supplier Support 0.3 Adam Opel Bridge Loan (€0.9) 1.3 Total Government 9.7 GMNA (Ex. Gov't) 1.5 GMIO (Ex. Gov't) 4.8 Capital Leases & Other 1.0 Total Debt 17.0 New GM 94.7 (49.5) (26.8) (1.2) 17.2 17.0 - 20 40 60 80 100 120 Old GM Debt Balance @ 7/9/2009 Government Equitization* Unsecured Bonds Left at Old GM UST Debt Left at Old GM New GM Debt Balance @ 7/10/2009 New GM Debt Balance @ 9/30/2009** $ billions $ billion |
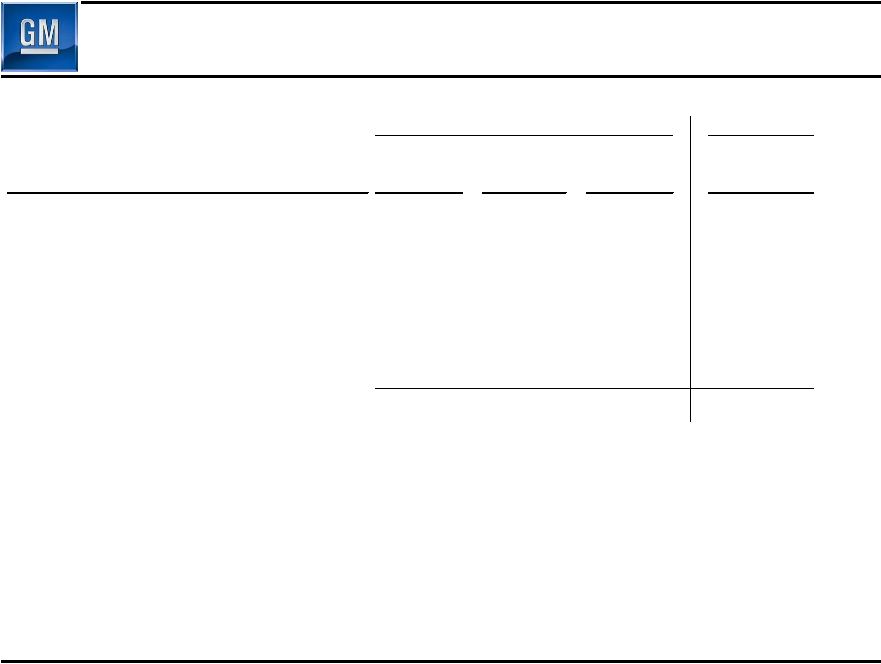
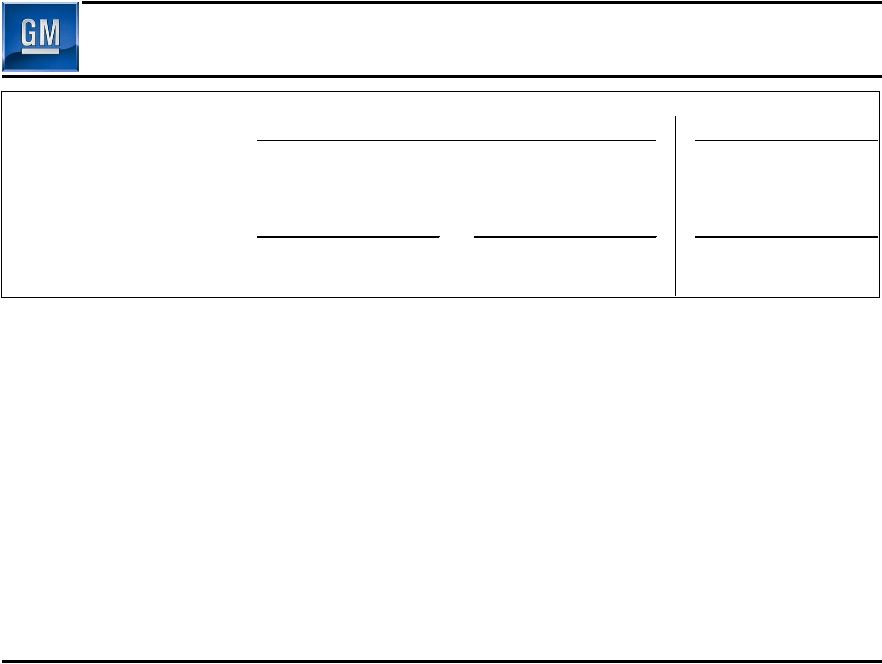
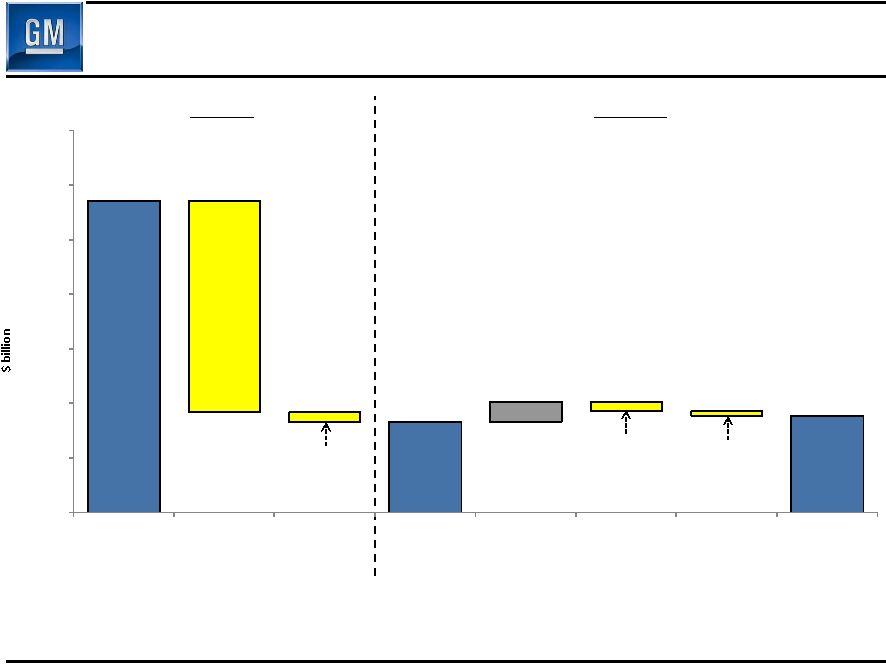 Total Liabilities September 30, 2009 vs. July 9, 2009 * Total liabilities as of 9/30/2009 do not reflect the impact of the employee
healthcare settlement agreements reached with our various
constituencies Old GM New GM 23 214.2 (77.5) (3.5) 133.2 7.4 (3.4) (1.6) 135.6 100 120 140 160 180 200 220 240 Total Old GM Liabilities @ 7/9/2009 Debt Equitized or Left at Old GM Other Liabilities Equitized or Left at Old GM Total New GM Liabilities @ 7/10/2009 Accounts Payable Pensions & OPEB Other Total New GM Liabilities @ 9/30/2009 * $ billions |
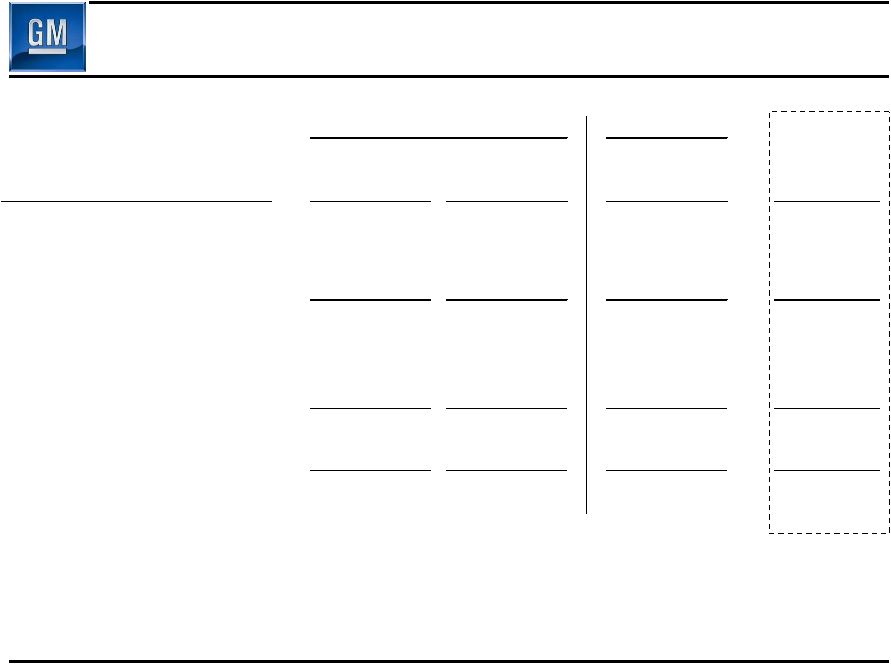
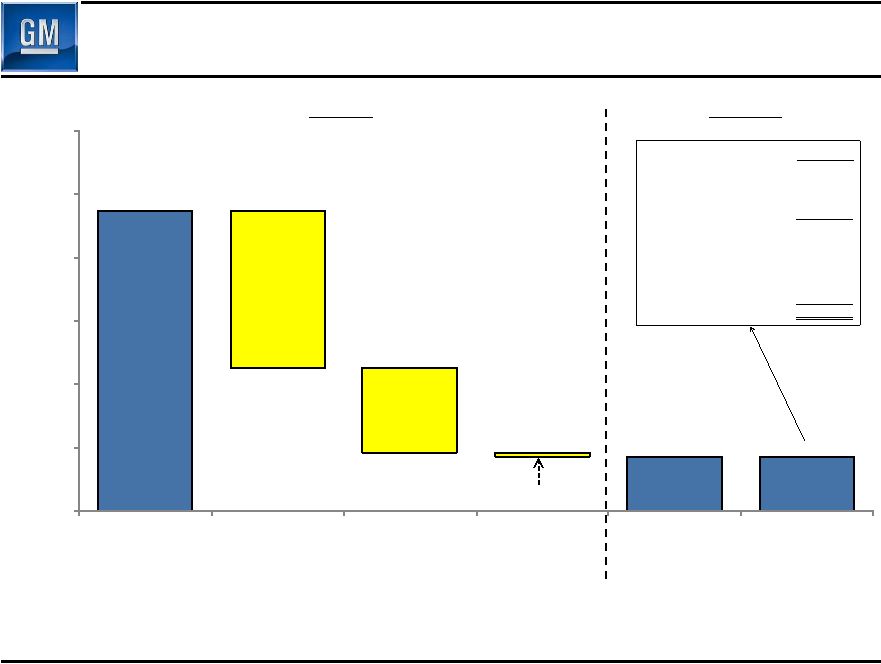
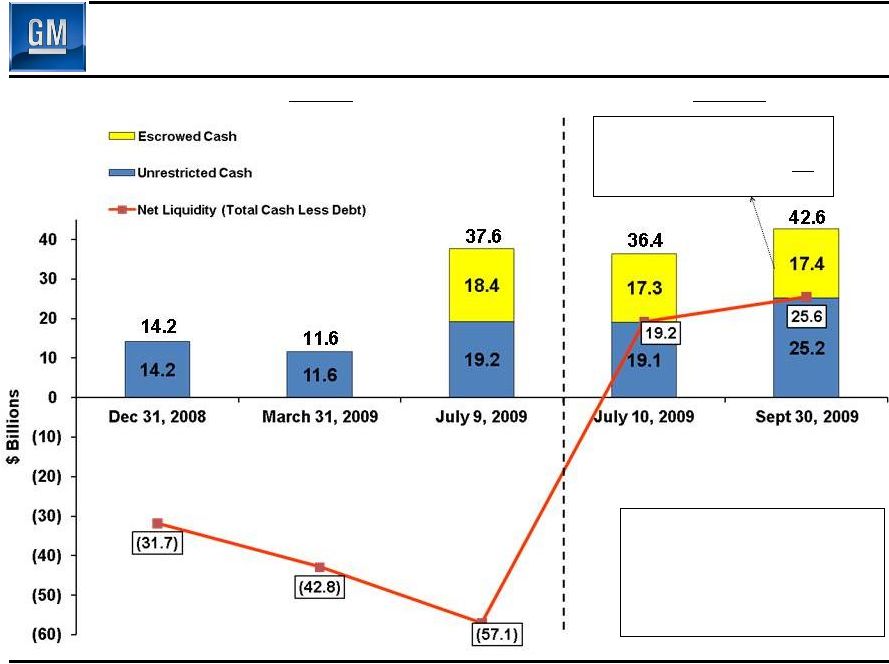 Liquidity Walk 24 Debt Balance Does Not Include: • $2.5B UAW VEBA Note • $0.7B CAW Note • $9.0B Preferred Stock Old GM New GM Repayment of UST/EDC Debt 8.1 Delphi 2.8 Canada Healthcare 0.9 Remaining
Escrow 5.6 Total Escrowed
Cash 17.4 |
 25 Managerial Cash Flow Summary * Viability Plan based on 5/31 plan filed with U.S. Bankruptcy court in support of
363 sale, adjusted to include full year consolidation of GME and other items
(see supplemental slides for detail) Note: The $20.1 billion net change in cash and cash-related includes $1.2 billion of UST
DIP that was subsequently carved-out and left behind with MLC, while the Viability Plan cash flow walk recognized a $1.0B outflow. Old GM New GM Memo: ($ Billions) July 1 -9, 2009 July 10 - Sept. 30, 2009 Viability Plan 3Q 2009* Earnings Before Tax 78.8 (1.0) (4.2) Depreciation & Amortization 0.4 1.8 2.3 Capital Expenditures (0.6) (0.6) (1.4) Change in Receivables, Payables & Inventory (2.7) 8.2 3.8 Pension & OPEB Expense (Net of Payments) - (3.9) (4.2) Accrued Expenses & Other (79.5) (1.2) (0.5) Managerial Operating Cash Flow before Special Items (3.6) 3.3 (4.2) Cash Restructuring Costs (0.1) (0.9) (1.5) Delphi Related - (0.2) (3.0) Special Cash Charges (0.1) (1.1) (4.5) Managerial Operating Cash Flow after Special Cash Charges (3.7) 2.2 (8.7) Non-Operating Related Change in Debt 23.7 (0.4) 15.6 Proceeds from Investment by EDC - 4.0 3.9 Other 0.1 0.4 (3.0) Total Non-Operating Related 23.8 4.0 16.5 Net Change in Cash and Cash-related 20.1 6.2 7.8 |
 Escrow Account • $16.4B from the DIP Facility deposited in a US escrow established on July 10 – $2.8B drawn to date for Delphi related payments – Escrow to expire in June 2010 and undrawn funds used to repay UST loan; GM may request one year extension subject to UST agreement – Remaining funds to be distributed to GM • US escrow originally established to cover certain contingencies anticipated in GM’s viability plan which are not expected to materialize
– Underlying performance also better than viability plan • As a result GM has entered into an agreement with UST to repay $1.2B/quarter ($1B to UST and $192M to Canadian government) from US escrow funds starting Q4 2009 until GM completes an IPO – Begin process of repaying taxpayer funds and reduce negative carry on interest – Balance of the terms remain unchanged versus original agreement including June 2010 expiration date of escrow and potential for one year extension • In addition C$5.0B deposited in escrow for Canadian pension and healthcare contributions – C$1.0B remains in escrow to fund Canadian Health Care Trust 26 |
 27 Forward Perspectives General Motors Company |
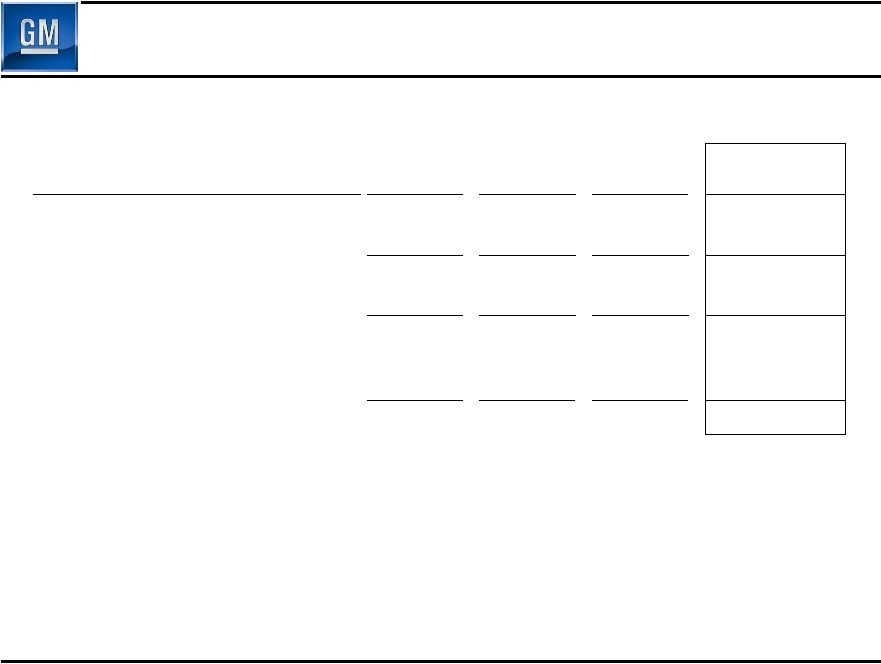
 Global Industry Outlook Q4 & CY 2009 28 SAAR * (Mil) Total Including Heavy Q3 2009 Actual Q4 2009 Outlook CY 2009 Outlook GMNA U.S. 14.2 11.7 13.3 10.7 13.0 10.5 GMIO Brazil Russia India China Germany 53.6 3.3 1.4 2.4 15.7 4.0 52.1 3.2 1.3 2.5 13.4 3.6 50.3 3.2 1.5 2.2 13.0 4.1 Global Total 67.8 65.4 63.3 * SAAR – Seasonally Adjusted Annualized Rate |
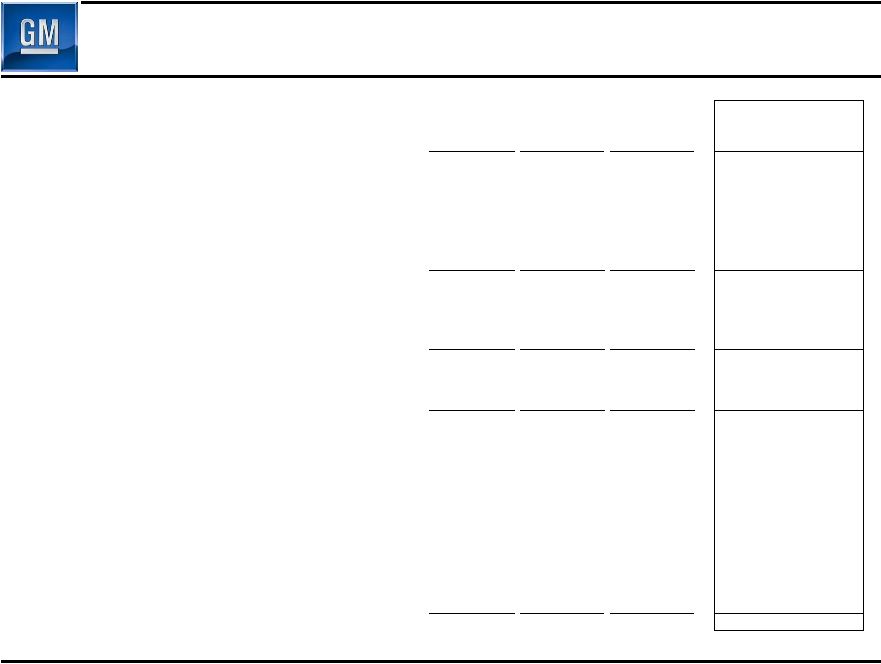
 Fourth Quarter Perspectives 29 Item Status vs. Q3 Fav/(Unfav) Drivers Market (Unfavorable) • Moderating global markets • End of various vehicle tax incentives GM’s Market Performance / Production Favorable • Launch product strength • Balanced U.S. dealer inventory • U.S. pricing flat to slightly down Cost Drivers (Unfavorable) • Increased media • Increased engineering • Higher capital expenditures Net Cash Flow (Unfavorable) • Favorable Q3 working capital • Supplier payment terms to net 47 days ~$(2.0)B • Delphi ~$(2.8)B • Continued restructuring costs ~$(1.0)B • Repayment various gov’t loans ~$(2.5)B |
 Global Industry Outlook CY 2009 & 2010 30 Units (Mil) Total Including Heavy CY 2009 Outlook Preliminary CY 2010 Outlook GMNA U.S. 13.0 10.5 13.5-14.5 11.0 – 12.0 GMIO Brazil Russia India China Germany 50.3 3.2 1.5 2.2 13.0 4.1 48.5 – 50.5 3.1 – 3.3 1.4 – 1.5 2.4 – 2.5 12.0 – 13.8 2.9 – 3.1 Global Total 63.3 62.0– 65.0 |
 Q3
Summary • Recorded $1.2B managerial loss ….significantly more work to do • Positive managerial operating cash flow favorably impacted by: – Working capital driven by supplier payments & production start up – Low level of capital spending • Third quarter GM global deliveries and market share ahead of Viability Plan – U.S. share also ahead of Viability Plan • Strong structural cost performance • Balance sheet significantly de-levered • Stronger cash balances – Begin process of UST/EDC repayment – Fourth quarter global cash balances materially lower due to number of special factors 31 |
 Key
Focus Areas • Drive profitable top line market and revenue performance • European restructuring • Continued execution of North American Operating Plan • Reinvention of GM Culture 32 |
 Supplemental Charts General Motors Company S-0 |
 Viability Plan Filed in Support of 363 Sale Adjusted to Include Full Year Consolidation of GME & Other Items 5/31/2009 Adjusted Memo: Viability Plan Viability Plan Adjusted Viability Plan ($ Millions) CY 2009 Adjustments * CY 2009 3Q 2009 GMNA (10,847) (82) (10,929) (2,094) GMIO (3,495) (1,012) (4,507) (967) Auto Eliminations (134) - (134) (89) Total Automotive EBIT Excluding
Special Items (14,476) (1,094) (15,570) (3,150) Corp Other (1,077) 81 (996) (429) GMAC ** N/A - N/A N/A Total EBIT Excluding Special Items (15,553) (1,013) (16,566) (3,579) Equity Income 308 (308) 0 Minority Interest 499 (499) 0 Interest (2,786) 13 (2,773) (620) Total EBT Excluding Special Items (17,532) (1,807) (19,339) (4,199) * Adjusted to include Jun – Dec 2009 consolidation of GME, reclassification of equity income and minority interest to EBIT and inclusion of FIO EBT ** GMAC excluded from 5/31/2009 Viability Plan S-1 |
 Viability Plan Filed in Support of 363 Sale – Managerial OCF Adjusted to Include Full Year Consolidation of GME & Other Items $ Billions 5/31/2009 Viability Plan CY 2009 Adjustments Adjusted Viability Plan CY 2009 Memo: Adjusted Viability Plan 3Q 2009 Total EBT Excluding Special Items (17.5) (1.8) (19.3) (4.2) Depreciation &
Amortization 7.7 1.6 9.3 2.3 Capital
Expenditures (5.0) (1.0) (6.0) (1.4) Change in Receivables,
Payables & Inventory 1.0 0.9 1.9 3.8 Pension & OPEB
Expense, (Net of Payments) (5.8) - (5.8) (4.2) Accrued Expenses & Other
(6.2) (0.9) (7.1) (0.5) Managerial Operating Cash
Flow (25.8) (1.2) (27.0) (4.2) Asset Sales 0.1 - 0.1 - Delphi Impact
(3.7) - (3.7) (3.0) Cash Restructuring
Costs (4.2) (1.2) (5.4) (1.5) Managerial Operating Cash Flow
After Special Items (33.5) (2.4) (36.0) (8.7) GMAC Asset Carve-out Cash
Flows 1.0 - 1.0 0.3 GMAC Distributions /
GMAC Flows (2.5) - (2.5) 0.3 Managerial Operating Cash
Flow After GMAC Related Flows (35.0) (2.4) (37.5) (8.1) VEBA Withdrawals (Salaried and
Hourly) 0.0 - 0.0 - UAW/CAW IT VEBA
Contribuitons (1.0) 0.1 (0.9) (0.9) Credit Facillity Draws /
(Repayments) (5.4) - (5.4) (4.7) Debt Maturities (3.3) - (3.3) (2.2) Debt Financing 0.3 - 0.3 - US Government
Funding 45.5 - 45.5 19.7 Canadian Government Funding
9.5 - 9.5 5.9 Non-US/Canadian
Government Funding - 3.3 3.3 0.8 Gov't Loan for GMAC
Rights Offering 0.9 - 0.9 - Other Non-Operating
Cash Flows (10.1) 1.3 (8.8) (2.7) Net Cash Flow 1.3 2.3 3.6 7.8 S-2 |