Attached files
| file | filename |
|---|---|
| 8-K - Dresser-Rand Group Inc. | v166520_8k.htm |
Annual Small / Mid Cap Conference
Disclosure
The Private Securities Litigation Reform Act of 1995 provides a “safe harbor” for certain
forward-looking statements so long as such information is identified as forward-looking and is
accompanied
by meaningful cautionary statements identifying important factors that could
cause actual results to differ materially from those projected in the information.
The use of words such as “may”, “might”, “will”, “should”, “expect”, “plan”, “outlook”,
“anticipate”, “believe”, “estimate",
"appear”, “project”, “intend”, “future”, “potential” or
“continue”, and other similar expressions are intended to identify forward-looking statements.
All of these forward-looking statements are based on estimates and assumptions by our
management that, although we believe to be reasonable, are inherently uncertain. Forward-
looking statements involve
risks and uncertainties, including, but not limited to, economic,
competitive, governmental and technological factors outside of our control, that may cause our
business, industry, strategy or actual results to differ materially from the forward-looking
statements.
the Company’s most recent
filings with the Securities and Exchange Commission, and other
factors which may not be
known to us. Any forward-looking statement speaks only as of its date. We undertake no
obligation to publicly update or revise any forward-looking statement, whether as a result of
new information, future events or otherwise,
except as required by law.
2
Company Overview
Global Supplier of Energy Solutions
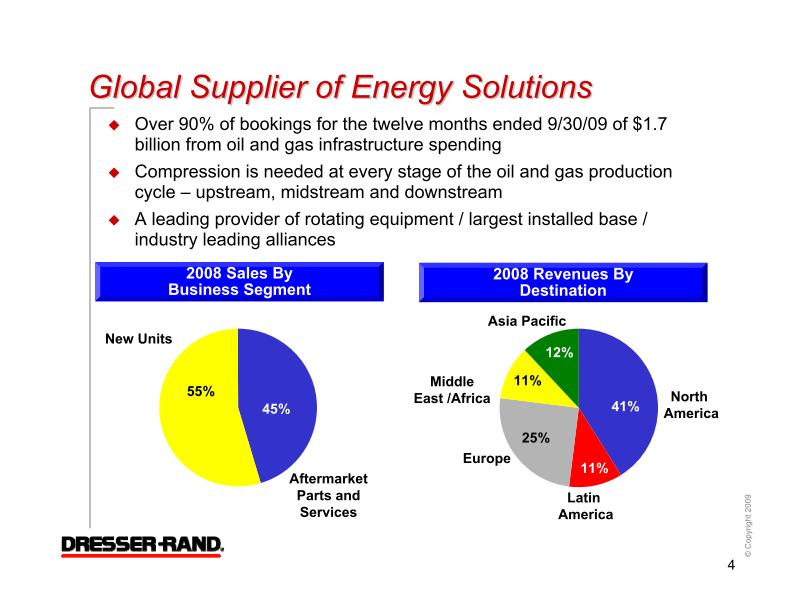
Over 90% of bookings for the twelve months ended 9/30/09 of $1.7
billion from oil and gas infrastructure spending
Compression is needed at every stage of the oil and gas production
cycle – upstream, midstream and downstream
A leading provider of rotating equipment / largest installed base /
industry leading alliances
Aftermarket
Parts and
Services
New Units
55%
45%
2008 Sales By
Business Segment
2008 Revenues By
Destination
North
America
Asia Pacific
11%
41%
Latin
America
Europe
Middle
East /Africa
25%
11%
12%
4
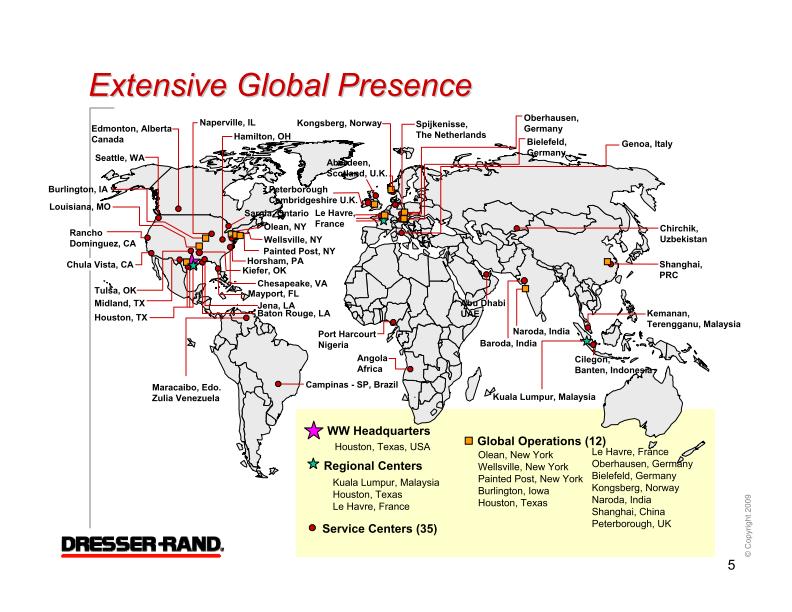
Extensive Global Presence
Shanghai,
PRC
Kemanan,
Terengganu, Malaysia
Cilegon,
Banten, Indonesia
Naroda, India
Kongsberg, Norway
Spijkenisse,
The Netherlands
Oberhausen,
Germany
Peterborough
Cambridgeshire U.K.
Le Havre,
France
Genoa, Italy
Campinas - SP, Brazil
Maracaibo, Edo.
Zulia Venezuela
Edmonton, Alberta
Canada
Seattle, WA
Rancho
Dominguez, CA
Chula Vista, CA
Tulsa, OK
Midland, TX
Houston, TX
Baton Rouge, LA
Chesapeake, VA
Naperville, IL
Hamilton, OH
Horsham, PA
Olean, NY
Wellsville, NY
Painted Post, NY
WW Headquarters
Regional Centers
Kuala Lumpur, Malaysia
Houston, Texas
Le Havre, France
Houston, Texas, USA
Service Centers (35)
Global Operations (12)
Painted Post, New York
Burlington, Iowa
Houston, Texas
Kuala Lumpur, Malaysia
Burlington, IA
Bielefeld,
Germany
Port Harcourt
Nigeria
Mayport, FL
Chirchik,
Uzbekistan
Angola
Africa
Aberdeen,
Scotland, U.K.
Le Havre, France
Oberhausen, Germany
Bielefeld, Germany
Kongsberg, Norway
Naroda, India
Shanghai, China
Peterborough, UK
Louisiana, MO
Jena, LA
Sarnia, Ontario
Kiefer, OK
Abu Dhabi
UAE
Baroda, India
5
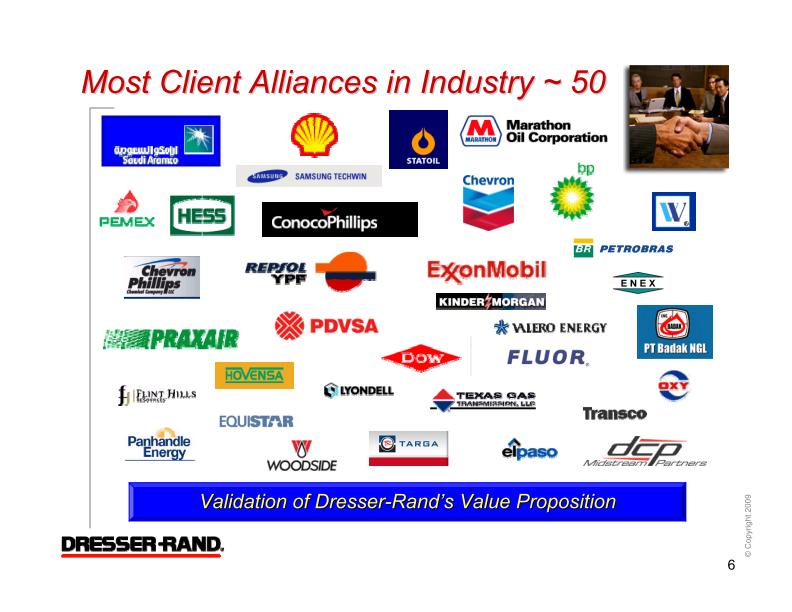
Most Client Alliances in Industry ~ 50
Validation of Dresser-Rand’s Value Proposition
6
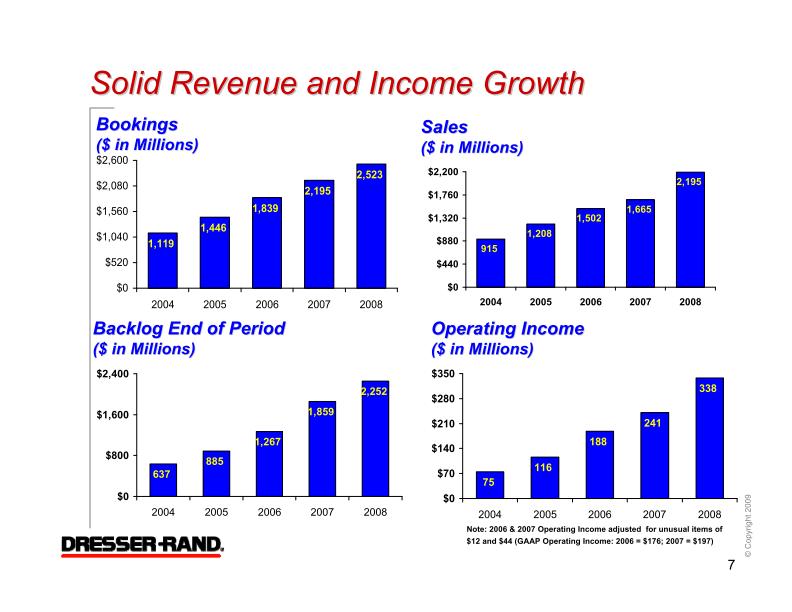
Solid Revenue and Income Growth
2008
2007
2006
2005
2004
$2,600
$2,080
$1,560
$1,040
$520
$0
2,523
2,195
1,839
1,446
1,119
2008
2007
2006
2005
2004
$2,400
$1,600
$800
$0
2,252
1,859
1,267
885
637
($ in Millions)
($ in Millions)
915
1,208
1,502
1,665
2,195
$0
$440
$880
$1,320
$1,760
$2,200
2004
2005
2006
2007
2008
($ in Millions)
($ in Millions)
75
116
188
241
338
$0
$70
$140
$210
$280
$350
2004
2005
2006
2007
2008
7

(1
9 Months / $ in Millions, except EPS)
9 Mos. 09
9 Mos. 08
Change
Sales
New Units
$974
$755
29%
Aftermarket
753
694
9%
Total
$1,727
$1,449
19%
Operating Income
New Units
$129
$73
78%
Aftermarket
197
185
7%
Unallocated
(60)
(52)
15%
Total
$266
$205
30%
Net Income
$169
$121
40%
EPS
$2.05
$1.43
43%
Bookings
New Units
$358
$1,013
-65%
Aftermarket
694
799
-13%
Total
$1,051
$1,813
-42%
8
Business Model Characteristics
~ ½ revenues tied to new build-out – cyclical
Flexible manufacturing model to effectively meet
demand swings – mitigates large swings in new unit
margins
~ ½ revenues tied to installed base – much less cycle
sensitive
~ 75% operating income from aftermarket (installed
base)
Strong value proposition
Low capital intensity
Strong Relative Performance in Both Up and Down
Cycles
9

New Units - Flexible Manufacturing Model
Highly absorbed internally at cycle bottoms
Able to flex capacity to meet cycle peaks
Flexibility Through Supply Chain Management
($ in Millions)
2001
2008
08 vs. '01
Sales
$877
$2,195
2 1/2 X
Operating Income
$21
$338
16 X
- % of Sales
2.4%
15.4%
Employees
6,084
6,400
5%
Manufacturing Footprint ( Sq. Ft.)
~ 3.9 M
~ 4.0 M
Small
Change
10
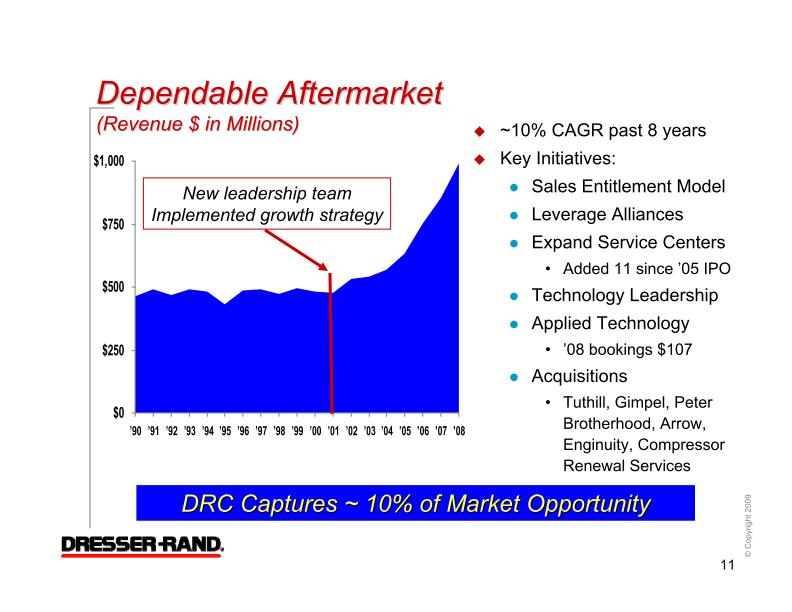
New leadership team
Implemented growth strategy
~10% CAGR past 8 years
Key Initiatives:
Sales Entitlement Model
Leverage Alliances
Expand Service Centers
Added 11 since ’05 IPO
Technology Leadership
Applied Technology
’08 bookings $107
Acquisitions
Tuthill, Gimpel, Peter
Brotherhood, Arrow,
Enginuity, Compressor
Renewal Services
DRC Captures ~ 10% of Market Opportunity
(Revenue $ in Millions)
$0
$250
$500
$750
$1,000
’90
’91
’92
’93
’94
’95
’96
’97
’98
’99
’00
’01
’02
’03
’04
’05
'06
'07
'08
11
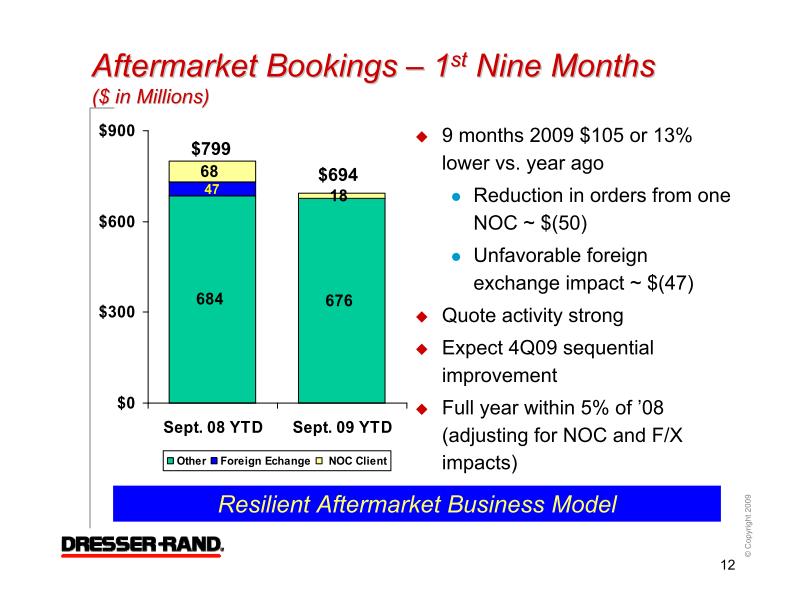
Nine Months
($ in Millions)
Resilient Aftermarket Business Model
$694
$799
9 months 2009 $105 or 13%
lower vs. year ago
Reduction in orders from one
NOC ~ $(50)
Unfavorable foreign
exchange impact ~ $(47)
Quote activity strong
Expect 4Q09 sequential
improvement
Full year within 5% of ’08
(adjusting for NOC and F/X
impacts)
684
676
47
68
18
$0
$300
$600
$900
Sept. 08 YTD
Sept. 09 YTD
Other
Foreign Echange
NOC Client
12
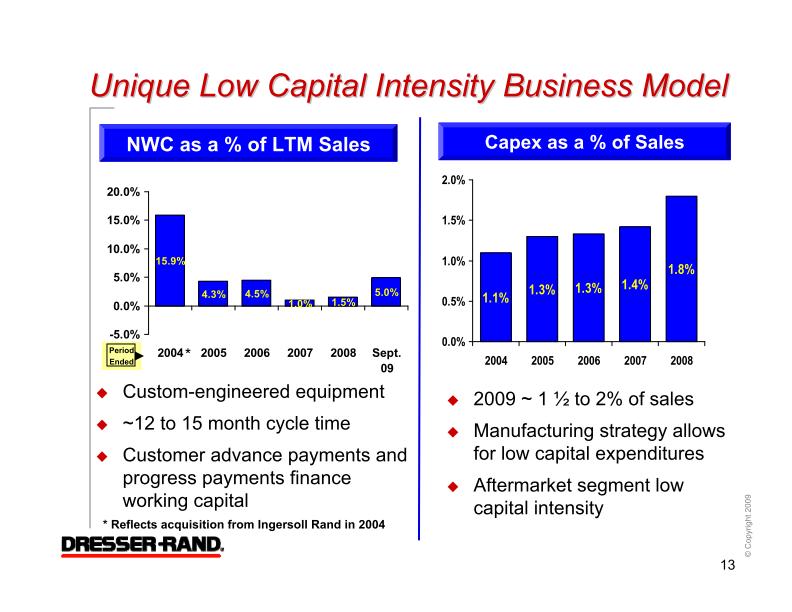
Unique Low Capital Intensity Business Model
NWC as a % of LTM Sales
09
Sept.
2008
2007
2006
2005
2004
20.0%
15.0%
10.0%
5.0%
0.0%
-5.0%
5.0%
1.5%
1.0%
4.5%
4.3%
15.9%
*
Period
Ended
* Reflects acquisition from Ingersoll Rand in 2004
Capex as a % of Sales
2009 ~ 1 ½ to 2% of sales
Manufacturing strategy allows
for low capital expenditures
Aftermarket segment low
capital intensity
Custom-engineered equipment
~12 to 15 month cycle time
Customer advance payments and
progress payments finance
working capital
1.1%
1.3%
1.3%
1.4%
1.8%
0.0%
0.5%
1.0%
1.5%
2.0%
2004
2005
2006
2007
2008
13
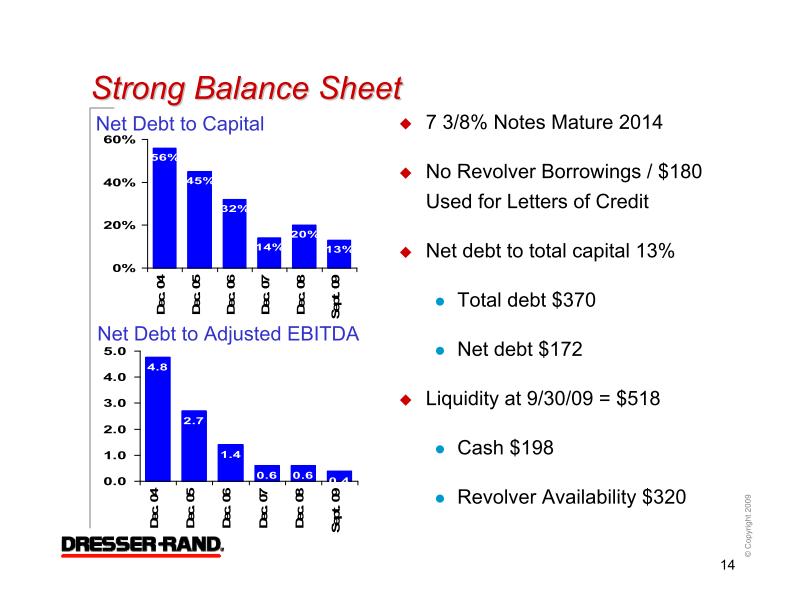
Strong Balance Sheet
Net Debt to Capital
Net Debt to Adjusted EBITDA
60%
40%
20%
0%
13%
20%
14%
32%
45%
56%
7 3/8% Notes Mature 2014
No Revolver Borrowings / $180
Used for Letters of Credit
Net debt to total capital 13%
Total debt $370
Net debt $172
Liquidity at 9/30/09 = $518
Cash $198
Revolver Availability $320
4.8
2.7
1.4
0.6
0.6
0.4
0.0
1.0
2.0
3.0
4.0
5.0
14
Outlook

Traditional Market Opportunities
Offshore production / FPSO (100+ next 5 yrs.)
Tracking ~ 60 LNG projects (more than 20 FLNG)
FLNG project
Peter Brotherhood acquisition / Samsung Techwin
Upstream
Midstream
Downstream
Pipelines & storage (growth in Asia, China, India, US)
Coal bed methane & shale opportunities
Acquisitions strengthen position (Arrow; Enginuity;
Compressor Renewal Services)
Refining – 200,000 bpd ~ $50MM opportunity
Expansions e.g., Saudi Aramco Jubail & Yanbu
Process upgrades, environmental compliance,
energy conservation, difficult crudes
Chemical (Asia, India & Middle East)
16
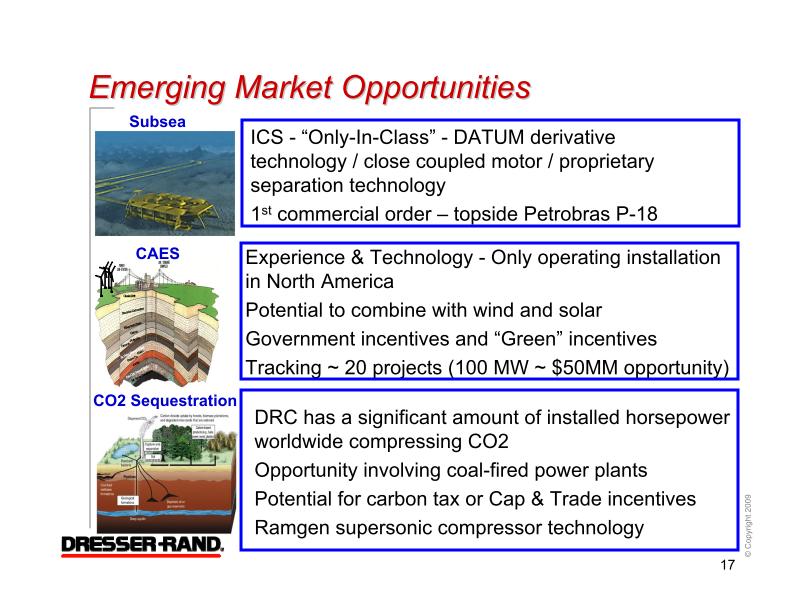
Emerging Market Opportunities
ICS - “Only-In-Class” - DATUM derivative
technology / close coupled motor / proprietary
separation technology
commercial order – topside Petrobras P-18
Subsea
CAES
CO2 Sequestration
Experience & Technology - Only operating installation
in North America
Potential to combine with wind and solar
Government incentives and “Green” incentives
Tracking ~ 20 projects (100 MW ~ $50MM opportunity)
DRC has a significant amount of installed horsepower
worldwide compressing CO2
Opportunity involving coal-fired power plants
Potential for carbon tax or Cap & Trade incentives
Ramgen supersonic compressor technology
17
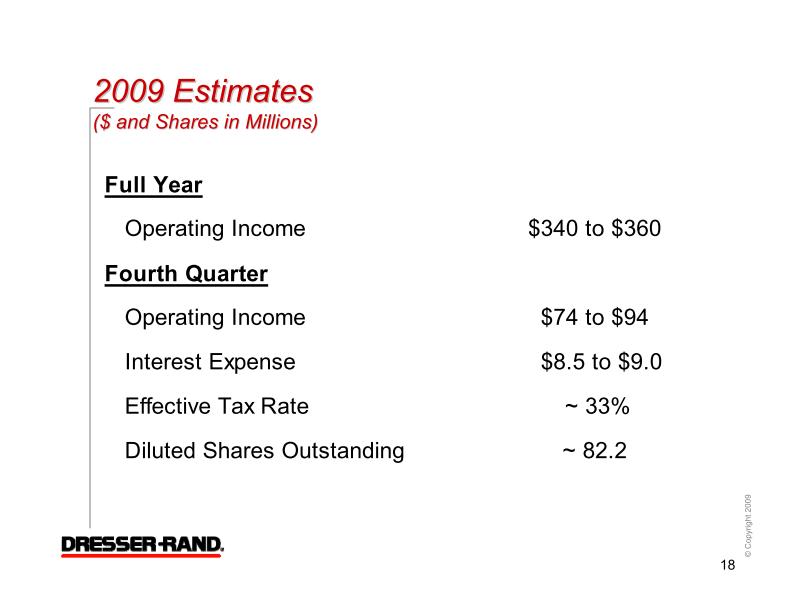
($ and Shares in Millions)
Full Year
Operating Income
$340 to $360
Fourth Quarter
Operating Income
$74 to $94
Interest Expense
$8.5 to $9.0
Effective Tax Rate
~ 33%
Diluted Shares Outstanding
~ 82.2
18
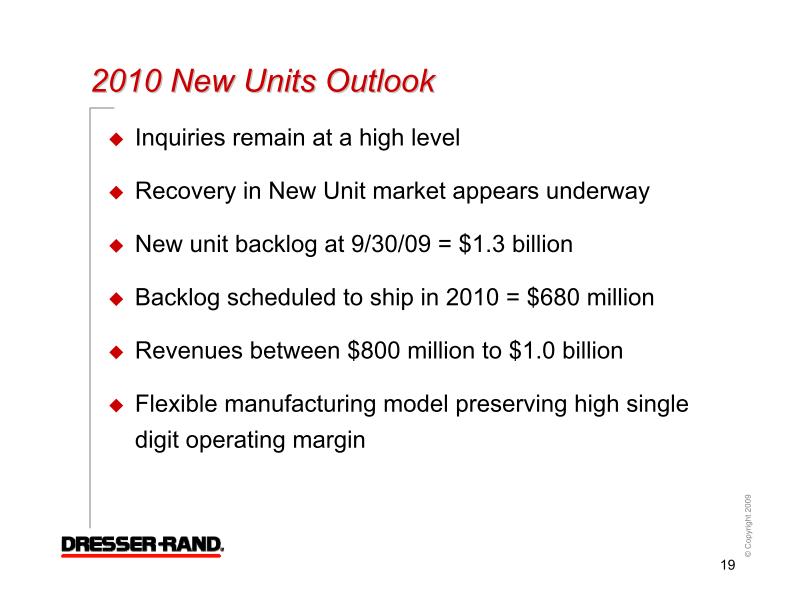
2010 New Units Outlook
Inquiries remain at a high level
Recovery in New Unit market appears underway
New unit backlog at 9/30/09 = $1.3 billion
Backlog scheduled to ship in 2010 = $680 million
Revenues between $800 million to $1.0 billion
Flexible manufacturing model preserving high single
digit operating margin
19
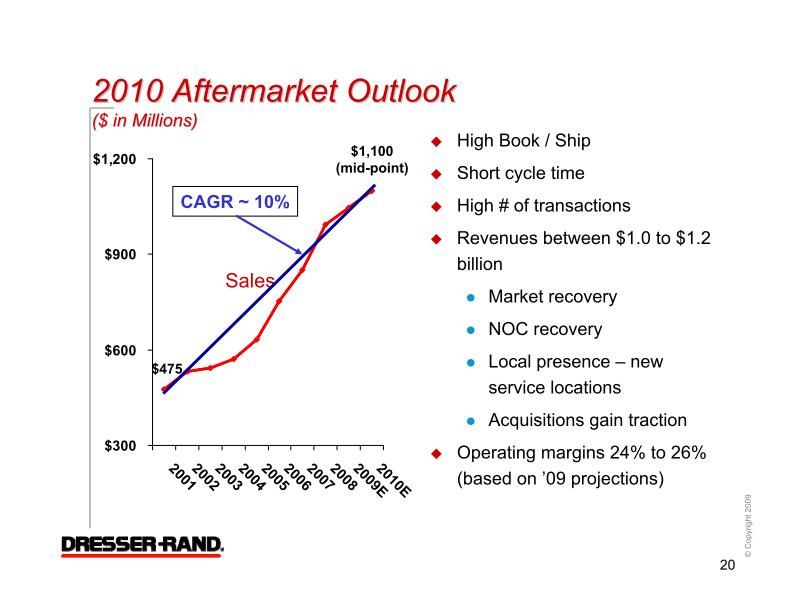
($ in Millions)
CAGR ~ 10%
Sales
$1,100
(mid-point)
$475
High Book / Ship
Short cycle time
High # of transactions
Revenues between $1.0 to $1.2
billion
Market recovery
NOC recovery
Local presence – new
service locations
Acquisitions gain traction
$300
$600
$900
$1,200
20
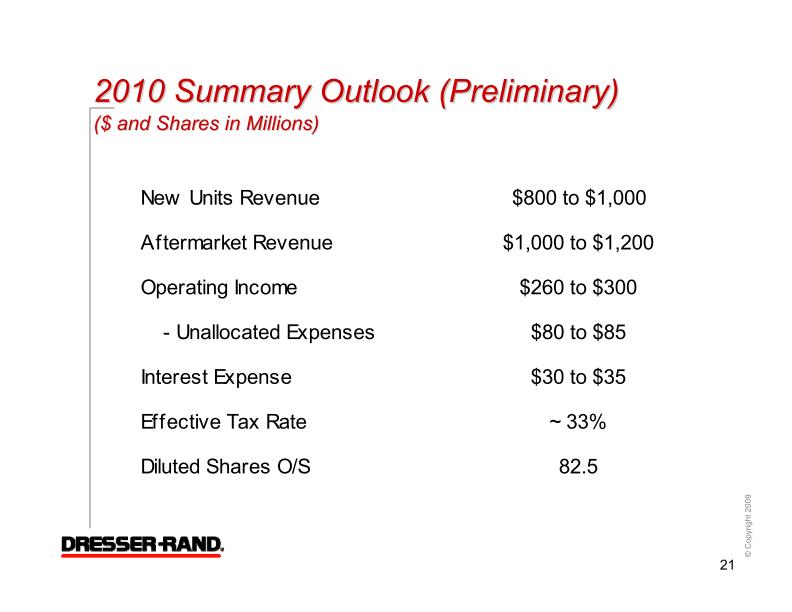
2010 Summary Outlook($ and Shares in Millions)
New Units Revenue
$800 to $1,000
Aftermarket Revenue
$1,000 to $1,200
Operating Income
$260 to $300
- Unallocated Expenses
$80 to $85
Interest Expense
$30 to $35
Effective Tax Rate
~ 33%
Diluted Shares O/S
82.5
21
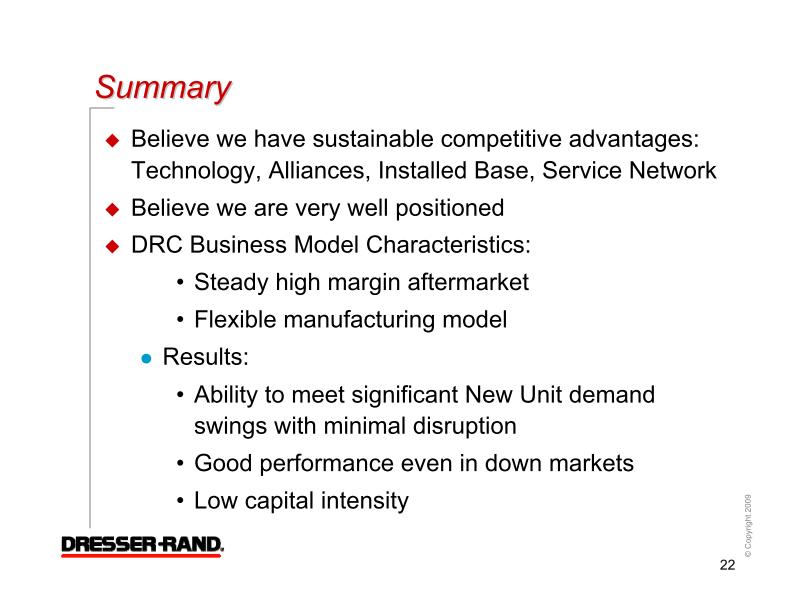
Summary
Believe we have sustainable competitive advantages:
Technology, Alliances, Installed Base, Service Network
Believe we are very well positioned
DRC Business Model Characteristics:
Steady high margin aftermarket
Flexible manufacturing model
Results:
Ability to meet significant New Unit demand
swings with minimal disruption
Good performance even in down markets
Low capital intensity
22
www.dresser-rand.com
info@dresser-rand.com