Attached files
| file | filename |
|---|---|
| EX-32.1 - EXHIBIT 32.1 - CHORDIANT SOFTWARE INC | ex321.htm |
| EX-23.1 - EXHIBIT 23.1 - CHORDIANT SOFTWARE INC | ex231.htm |
| EX-31.1 - EXHIBIT 31.1 - CHORDIANT SOFTWARE INC | ex311.htm |
| EX-31.2 - EXHIBIT 31.2 - CHORDIANT SOFTWARE INC | ex312.htm |
| EX-10.37 - EXHIBIT 10.37 - CHORDIANT SOFTWARE INC | ex1037.htm |
| EX-10.52 - EXHIBIT 10.52 - CHORDIANT SOFTWARE INC | ex1052.htm |
| EX-10.31 - EXHIBIT 10.31 - CHORDIANT SOFTWARE INC | ex1031.htm |
UNITED
STATES
SECURITIES
AND EXCHANGE COMMISSION
WASHINGTON,
DC 20549
|
FORM
10-K
|
||
(Mark
One)
x ANNUAL
REPORT PURSUANT TO SECTION 13 OR 15(d) OF THE SECURITIES EXCHANGE ACT OF
1934
For
the fiscal year ended September 30, 2009
or
TRANSITION REPORT PURSUANT TO SECTION
13 OR 15(d) OF THE SECURITIES EXCHANGE ACT OF 1934
For
the transition period from
to
Commission
File Number 001-34179
|
Chordiant
Software, Inc.
|
||
|
(Exact
name of registrant as specified in its charter)
|
||
|
Delaware
|
93-1051328
|
|
(State
or other jurisdiction of incorporation or organization)
|
(I.R.S.
Employer Identification No.)
|
20400
Stevens Creek Boulevard, Suite 400
Cupertino,
CA 95014
(Address
of principal executive offices) (Zip Code)
(408)
517-6100
(Registrant’s
telephone number, including area code)
Securities
Registered Pursuant to Section 12(b) of the Act:
|
Title
of each class
|
Name
of each exchange on which registered
|
|
|
Common
Stock $.001 Par Value per Share
|
The
NASDAQ Stock Market LLC
|
|
|
(NASDAQ
Global Market)
|
Securities
Registered Pursuant to Section 12(g) of the Act: None
Indicate by check mark if the registrant
is a well-known seasoned issuer, as defined in Rule 405 of the Securities
Act. Yes No x
Indicate by check mark if the registrant
is not required to file reports pursuant to Section 13 or Section 15(d) of the
Act. Yes No x
Indicate by check mark whether the
registrant (1) has filed all reports required to be filed by
Section 13 or 15(d) of the Securities Exchange Act of 1934 during the
preceding 12 months (or for such shorter period that the registrant was required
to file such reports), and (2) has been subject to such filing requirements
for the past 90 days: Yes x No
Indicate by check mark whether the
registrant has submitted electronically and posted on its corporate Website, if
any, every Interactive Data File required to be submitted and posted pursuant to
Rule 405 of Regulation S-K (§229.405 of this chapter) during the preceding 12
months (or for such shorter period that the registrant was required to submit
and post such files). Yes No
Indicate by check mark if disclosure of
delinquent filers pursuant to Item 405 of Regulation S-K (§229.405 of
this chapter) is not contained herein, and will not be contained, to the best of
Registrant’s knowledge, in definitive proxy or information statements
incorporated by reference in Part III of this Form 10-K or any
amendment to this Form 10-K.
Indicate
by check mark whether the registrant is a large accelerated filer, an
accelerated filer, a non-accelerated filer, or a smaller reporting company. See
definition of “large accelerated filer”, “accelerated filer” and “smaller
reporting company” in Rule 12b-2 of the Exchange Act.
|
Large
accelerated filer
|
Accelerated
filer
|
|
|
Non-accelerated
filer x
(Do not check if a smaller reporting company)
|
Smaller
reporting company
|
Indicate
by check mark whether the registrant is a shell company (as defined in Exchange
Act Rule 12b-2). Yes No x
State
the aggregate market value of the voting and non-voting common equity held by
non-affiliates computed by reference to the price at which the common equity was
last sold, or the average bid and asked price of such common equity, as of March
31, 2009, the last business day of the registrant’s most recently completed
second fiscal quarter: $68,608,078.
As
of November 1, 2009, there were 30,208,845 shares of the registrant’s common
stock outstanding.
DOCUMENTS
INCORPORATED BY REFERENCE
Part
III-Portions of the registrant’s definitive proxy statement to be issued in
conjunction with registrant’s 2010 Annual Stockholder’s
meeting.
ANNUAL
REPORT ON FORM 10-K
INDEX
|
Item
1
|
3
|
|
|
Item
1A.
|
13
|
|
|
Item
2.
|
25
|
|
|
Item
3.
|
25
|
|
|
Item
4.
|
26
|
|
|
Item
5.
|
27
|
|
|
Item
6.
|
29
|
|
|
Item
7.
|
30
|
|
|
Item
7A.
|
54
|
|
|
Item
8.
|
55
|
|
|
Item
9.
|
93
|
|
|
Item
9A.
|
93
|
|
|
Item
9B.
|
95
|
|
|
Item
10.
|
95
|
|
|
Item
11.
|
95
|
|
|
Item
12.
|
95
|
|
|
Item
13.
|
95
|
|
|
Item
14.
|
95
|
|
|
Item
15.
|
96
|
|
|
102
|
FORWARD-LOOKING
INFORMATION
Except
for the historical information contained herein, this Annual Report contains
certain information that is forward-looking in nature. This information is based
on our current expectations, assumptions, estimates and projections about our
business and our industry, and involves known and unknown risks, uncertainties
and other factors that may cause our or our industry’s results, levels of
activity, performance or achievements to be materially different from any future
results, levels of activity, performance or achievements expressed or implied
in, or contemplated by the forward-looking statements. Words such as “believe,”
“anticipate,” “expect,” “intend,” “plan,” “will,” “may,” “should,” “estimate,”
“predict,” “guidance,” “potential,” “continue” or the negative of such terms or
other similar expressions identify forward-looking statements. In addition, any
statements that refer to expectations, projections or other characterizations of
future events or circumstances are forward-looking statements. Our actual
results could differ materially from those anticipated in such forward-looking
statements as a result of several factors more fully described under the caption
“Risk Factors” and those discussed elsewhere in this document. These and many
other factors could affect the future financial and operating results of
Chordiant. Chordiant undertakes no obligation to update any forward-looking
statement to reflect events after the date of this report. All references to
“Chordiant”, “we”, “us”, or “the Company” means Chordiant Software, Inc. and its
subsidiaries except where it’s made clear that the term means only the parent
company.
|
BUSINESS
|
Chordiant
Software leads the advancement of Customer Experience Management (CEM) solutions
to help global brands multiply customer lifetime value.
Chordiant
Software, and its Cx Enterprise Foundation, Chordiant Decision Management (CDM)
and Chordiant Marketing Director (CMD) Solutions, arms marketing, customer
service and customer loyalty executives with a suite of predictive and adaptive
decisioning applications to deliver an order of magnitude improvement in
customer experience.
Chordiant
gives global brands a real-time unified view and understanding of their
customer’s behavior and capabilities to optimize customer strategies that match
each customer’s individual situation. In addition, Chordiant reshapes the way
brands engage customers with Next-Best-Action™ capabilities that dynamically
guide conversations across every channel, determining and adapting actions as
the interaction is occurring.
Together,
these CEM capabilities are transformative in nature, enabling companies to
deliver intelligent conversations based upon analysis of past customer behavior,
as well as current responses and mood. Now, today’s fast-paced brands can engage
more effectively with customers, quickly measure how the strategy is working and
change at new levels of speed and economy. The net result: faster acquisition,
improved competitiveness, less churn, and superior customer
service.
Chordiant
maximizes the value of every conversation, consistently across every channel.
With Chordiant, brands no longer have to sacrifice a better customer experience
while navigating tight budgets. Business users can efficiently deliver highly
expressive customer experience strategies using models that predict and react to
individual customer expectations, propensities and behaviors. This behavioral
segmentation is combined with powerful real-time decisioning and centrally
deployed to any channel across the enterprise.
Chordiant
signals the end of pre-scripted, inconsistent customer interactions based upon
static, outdated market segmentation. With Chordiant Next-Best-Action™, every
customer interaction becomes unique, appropriate and consistent. The
conversation with the customer is continually guided, with actions adapting as
the conversation is occurring. Recommendations are determined in
real-time, based upon customer responses, mood and instant analysis of customer
behavior.
Chordiant
helps today’s executives in the insurance, healthcare, telecommunications and
financial services markets respond in new ways to changing buyer behavior,
competitive pressures and market dynamics. Chordiant unlocks brands from the
rigid, IT-heavy approach to deploying, measuring and changing customer
strategies. Using the industry’s most contemporary technology, Chordiant gives
business owners powerful visual command and control capabilities to simulate
different strategies and visualize their impact on customers and business
metrics. Once optimized, customer strategies can be deployed at the touch of a
button and changed on-demand, without IT intervention.
Chordiant
heralds a new era of customer experience management solutions. Over 200 of the
world’s most demanding brands trust Chordiant to help them build stronger and
more profitable customer relationships.
Chordiant
Solutions & Technology
Solution
Overview
Our
solutions are designed for global enterprises seeking to optimize their customer
experiences through effective decision analysis, marketing, selling and
servicing efforts. We have designed our solutions and services to integrate
customer information from different data sources and systems of record, automate
business processes based on a customer’s specific profile and requests, and
provide uniform service and information to customers across multiple
communication channels. Our solutions are designed to enable companies to
deliver appropriate recommendations (also known as “next best action”),
services, offers and information to a targeted customer at the time of customer
need while complying with relevant business policy and industry regulatory
requirements.
Our
solutions are designed to address the enterprise requirements of global consumer
companies serving millions of customers across multiple business channels
integrating multiple lines of business. The solution suite is typically licensed
as an integrated set of software products that run on top of a common layer of
foundational technology and supporting tools. Chordiant’s software is based on
open systems software standards that are widely adopted by our industry and
capable of deployment throughout an enterprise’s information technology
infrastructure. Chordiant software is built to be highly scalable and adaptable
to a customer’s specific business requirements or technology
infrastructure.
Historically,
our products have been categorized into three general groups: Cx Enterprise
Foundation solutions, Chordiant Decision Management (CDM) solutions, and the
Chordiant Marketing Director (CMD) Solution. Our solutions are designed to
address a variety of business needs within our targeted vertical markets of
insurance, healthcare, telecommunications, and financial services.
Technology
Overview
Chordiant
technology is based on an open Service Oriented Architecture (SOA). This
architecture provides a framework for large or growing businesses to provide
multi-channel interaction and process orchestration across multiple lines of
business. The Cx Enterprise Foundation framework provides a pre-integrated
environment that supports the business applications required by these large
scale organizations. A combination of decisioning, adaptive, and predictive
analytics allows organizations to utilize Chordiant technology to obtain
customer behavioral insight and use this information to drive the most
appropriate business processes, guide staff through the best tasks to increase
responsiveness, reduce errors, shorten cycle times, and present the most
relevant offers to customers in each interaction.
Chordiant’s
architecture leverages J2EE and Web Services extensively to provide a services
oriented architecture for use by Chordiant applications and other systems. The
business services and related business components use a data persistence
foundation with built-in support for Oracle and DB2 databases as well as IBM
WebSphere MQ messaging. Generally, our software is easily integrated with other
data sources, including those built on the Java Connector Architecture
(JCA).
Chordiant’s
web browser technology delivers consistent self-service and agent-driven
customer interaction processes using a rich web-based application platform that
provides desktop interface behavior in a browser-based technology with high
performance, low maintenance costs, and flexibility to meet the differing
demands of a diverse user population.
Certain
of our products use technology modules from third party technology providers
including IBM, Oracle (as a result of their acquisition of BEA Systems and Sun
Microsystems) and certain non-public entities. Our enterprise platform solutions
support industry standard J2EE application servers including IBM WebSphere and
Oracle WebLogic. Our server software runs on UNIX server platforms from Oracle
(Sun Microsystems) and IBM.
Cx Enterprise Foundation Solutions
Overview
Cx
Foundation Solutions, including Foundation Server, Café, and Tools Platform,
consist of a family of products with enterprise-wide process orchestration and
case management at its core, the Chordiant Cx Enterprise Foundation product
family provides a common, highly scalable base platform for all Chordiant
solutions. The product family incorporates industry standards such as J2EE,
model driven development, AJAX high performance thin client desktops, Java
Server Faces (JSF), and enterprise open source technologies including Hibernate,
and Apache Trinidad. The products are supported by process development and
administration tools that use the Eclipse integrated development
environment.
The
Cx Enterprise Foundation Platform incorporates module ‘servers’ to deliver
additional functionality as needed including business rules, decision
management, telephony integration, connectivity to systems of record and
interaction channel management. These allow organizations to implement only
those functions that are required for their particular business requirement
without interfering with future project requirements.
This
solution includes the following product modules:
|
·
|
Call Center and Customer
Service Desktop (Call Center Advisor – Browser Edition): This
product is a browser-based guided desktop designed for the effective
management of customer contacts, service requests, and customer case
history in the call center channel. The desktop is integrated with leading
computer telephony integration products, working with our own queue-based
work management to deliver ‘universal queues’ to the enterprise. It is
designed to meet the high volume transaction and business processes common
in enterprise contact centers. This product is used by customer service
professionals, acts as a delivery channel for our decision management and
marketing products together with the other business applications that
Chordiant offers.
|
|
·
|
Credit Card Disputes,
Chargebacks and Fraud: These modular applications are designed to
automate and optimize customer and mid-office functions associated with
credit card dispute handling and fraud investigation and recovery. The
applications use Chordiant technology to implement the dispute and
chargeback regulatory requirements of credit card associations to assist
organizations in managing their compliance of these complex regulations.
These applications are used by customer service professionals in the
credit card segment of banking to drive more cost effective, compliant
handling of disputes and fraud
cases.
|
|
·
|
Collections: This
product is designed to deliver automation and operational efficiency to
debt recovery and collections professionals. The product is designed to
make extensive use of Chordiant’s Decision Management (CDM) technology to
deliver real-time decisioning that helps collect on overdue accounts while
preserving the customer
relationship.
|
Chordiant Decision Management (CDM)
Solutions
Consisting
of a flexible set of products and tools for adaptive decisioning, predictive
decisioning, and rules, our Chordiant Decision Management (CDM) solution family
is designed to allow organizations to effectively drive application behavior
based on industry or organizational models and logic. This capability allows
business users advanced control over business priorities, and enables the
business to refine offer and service management in real-time. CDM is a suite of
the following products:
|
·
|
Chordiant Data Preparation
Director—Chordiant Data Preparation Director allows non-IT users to
combine, manipulate and aggregate customer data using an easy to use
visual interface.
|
|
·
|
Chordiant Predictive Analytics
Director—Chordiant Predictive Analytics Director provides marketing
professionals functionality which enables in-depth analysis of significant
amounts of customer information using data-mining and predictive
analytical capabilities.
|
|
·
|
Chordiant Adaptive
Analytics—Chordiant Adaptive Analytics solution allows customer
facing solutions to be self-learning and to adapt in real time to ensure a
strong balance between customer experience and company revenue
objectives.
|
|
·
|
Chordiant Strategy
Director—Chordiant Strategy Director allows users to design
customer interaction strategies and marketing offers based on decisions
and rules that reflect customer behavior, preferences, legislation,
corporate policies and desired business outcomes. The resulting
decision logic is executed in our campaign management solution for
outbound communication or executed in real-time in multiple channels of
communication.
|
|
·
|
Chordiant Decision
Monitor—Chordiant Decision Monitor provides management with insight
into business results, measures data analysis effectiveness, and allows an
organization to learn from current and future data models. It is a
software module in which decisions are automatically logged and stored in
a monitoring database together with the relevant data as well as
subsequent customer information and behavior. This module can be
integrated and analyzed by third party business intelligence
tools.
|
|
·
|
Chordiant Deployment
Manager—Chordiant Deployment Manager provides the administrative
function to prepare available data in the operational environment and
implement the decision logic into production campaigns, business processes
and applications.
|
|
·
|
Chordiant Real-Time Decisioning
Services—Chordiant Real-Time Decisioning Server generates a
decisioning service that can be hosted in industry-standard application
servers.
|
|
·
|
Chordiant Database Decisioning
Services—The Chordiant Database Decisioning Server provides an
application for data mining, analysis, and modeling to create the optimal
decision logic and the appropriate decisions
outcomes.
|
|
·
|
Chordiant Recommendation
Advisor: This product is designed to provide flexible lead
collection and routing in a common guided selling desktop, integrated with
marketing campaigns and product fulfillment. Predictive and adaptive
analytics guide staff toward best offers and “next best action” in the
context of inbound or outbound customer interactions. This product is used
by sales and service professionals across our target markets to manage
leads and deliver highly effective sales
messages.
|
|
·
|
Chordiant Visual Business
Director: This solution allows users to simulate and test the
potential impact of the even the most complex customer strategies before
putting them into production. Once deployed, performance can be monitored
and controlled at any level of operation in
real-time.
|
Chordiant
Marketing Director (CMD) Solution
Marketing Director: This
solution is designed to drive unified, personalized marketing campaigns and
response management across multiple media types and multiple channels including
email, web, phone, and mobile messaging (MMS/SMS). This solution is used by
marketing professionals across all our target markets to segment and target
prospects and customers delivering to them effective marketing campaigns.
Chordiant Marketing Director (CMD) integrates with our Chordiant Decision
Management (CDM) products to provide an integrated campaign management
system.
Chordiant
Mesh Collaboration
Chordiant
Mesh is a collaborative development community where customers, partners, and
Chordiant staff can work together on solutions to respond to customer
initiatives. By providing deep access into Chordiant’s engineering process and
infrastructure, the Mesh enables solution development as a continuous
conversation among stakeholders. All members of Chordiant’s economic ecosystem
can engage directly on a wide variety of solutions, components, and tools. By
applying principles from open source projects to an enterprise solution
development environment, Chordiant Mesh facilitates far greater collaboration,
agility, speed to market, transparency, and quality than customers are
accustomed to receiving from traditional high-end software
providers.
Key
benefits of Chordiant Mesh are:
|
·
|
A
complete software development environment and set of methodologies for
building applications collaboratively with Chordiant and its
partners.
|
|
·
|
An
egalitarian venue for the ideation and design of solutions to real
business problems.
|
|
·
|
A
best of breed infrastructure for hosting the development of value-added
components.
|
|
·
|
An
open-source inspired system that allows Chordiant to take code revisions
submitted by community members − customers, partners and Chordiant itself
− and allow these to be incorporated into its products when
appropriate.
|
With
the Mesh, Chordiant has committed to the long-term success of its customers and
partners by building a tangible and transparent co-innovation environment that
directly impacts product solutions.
Strategic
Direction
The
Company is focused on delivering a suite of solutions which solves complex
business problems while optimizing the customer experience. In this
“new normal” our customers are focused more than ever on customer retention and
loyalty with a focus on multiplying customer lifetime value. This is achieved by
making every customer conversation multi-channel and cross-channel capable while
using customer strategies to drive consistently intelligent solutions. Our
target market is the Global 1000 in the target industries of insurance,
healthcare, telecommunications, and financial services markets. Chordiant
anticipates that it will increasingly deliver business-focused solutions based
on an open and adaptable core information technology, or IT infrastructure that
provides high levels of business agility and fast return on investment for
enterprises by allowing rapid changes to their IT systems. Within the markets
above, Chordiant expects to continue to develop domain-level solutions for these
markets, focusing on the most mission-critical business processes facing our
customers.
Customers
We
target global brand leaders in our core markets. Our customers include: ING,
Canada, Inc., HSBC Technology and Services (USA), Inc., Capital One Services,
Inc., O2 (UK) Limited, Time Warner Cable, Inc., Deutsche Angestellten
Krankenkasse (DAK), Covad Communication Company, 21st Century Insurance,
T-Mobile, Lloyds TSB Bank plc, Bank of Ireland Group, The Royal Bank of Scotland
plc, Metropolitan Life Insurance Company, Signal Iduna, Deutsche Bank AG,
Canadian Tire Financial Services, Canadian Imperial Bank of Commerce, Halifax
plc, British Telecommunications plc, Connecticut General Life Insurance Company,
Citibank Credit Services Inc. (USA), and Sky Subscribers Services Limited. As we
deploy new applications, we anticipate that a certain percentage of these and
new customers will adopt new Chordiant applications and expand their investment
in Chordiant products.
For
the fiscal year ended September 30, 2009, Vodafone Group Services Limited and
affiliated companies and Citicorp Credit Services Inc. accounted for 20% and 10%
of our total revenues, respectively. The revenue we derived from Vodafone Group
Services Limited and affiliated companies was related to a $26.1 million
agreement we entered into on December 21, 2007 for perpetual enterprise licenses
and support for certain Decision Management Solutions and Marketing Director
Solutions suites. The revenue we derived from Citicorp Credit Services, Inc. was
from an agreement we entered into on December 8, 2006 for license and services.
For a description of the material terms of the agreements with Vodafone Group
Services Limited and Citicorp Credit Services Inc., see our current reports on
Form 8-K filed with the SEC on December 27, 2007 and December 13, 2006,
respectively, which terms are incorporated herein by this
reference.
Sales
and Marketing
Our
sales strategy is a direct business model selling primarily through a geography
based sales organization that is complemented by selling and support efforts
with business alliance partners such as IBM Global Services, Tata Consulting
Services, HCL Technologies, Cap Gemini, Accenture, systems integrators and other
technology vendors. Our market focus is the Global 1000 in the Financial
Services (Retail Banking and Card Processing), Telecommunications (Wireline,
Wireless and Cable) and Insurance (Healthcare, Property & Casualty and Life
and Annuity) industries. Our target buyer is a line of business executive or IT
executive that has a focus on improving their customer’s
experience. We focus in the business-to-consumer (B to C) segment of
the market with a targeted effort on leading consumer companies that have
millions of customers and offer multiple channels as the means of conducting
business and serving customers.
We
license our solutions through the traditional perpetual software model as well
as a term licensing model that was introduced in 2009. We sell our services
direct as well as staff augmentation to large system integration projects within
our Chordiant customer base.
The
sales process generally ranges from approximately three to eighteen months
depending on the level of knowledge that prospective customers need about the
use and benefits of our solutions and the involvement of systems integrators.
During the sales process, we typically approach the senior management teams of
the business and information technology departments of a prospective customer’s
organization. We utilize sales teams consisting of sales and technical
professionals who work with our systems integration partners to create company
specific proposals, presentations and proof of concept demonstrations that
address the needs of the business and its technology requirements.
Our
corporate offices are located in Cupertino, California, and we maintain an
applications development center in Bedford, New Hampshire. In Europe, we have
offices in the greater metropolitan areas of London, Madrid, Amsterdam, Munich
and Beijing. We have sales and support personnel and consultants in various
additional locations in North America and Europe.
Our
Services
We
offer a comprehensive set of customer services including professional consulting
services and product support and training services. We believe that providing
high quality customer service is critical to achieving rapid product
implementation and customer success.
Professional
Services
We
provide implementation consulting and customer support services to licensed
customers through our worldwide professional services organization. Our
professional services consulting teams often assist customers and systems
integrator partners in the configuration and implementation of our software
solutions.
Our
professional services organization deploys consultants as part of the project
team alongside systems integration partners and members of the customer’s
internal team to provide subject matter expertise, technical knowledge, process
engineering guidance, project governance and quality assessments during the
entire solution lifecycle. In the design stage, we provide a variety of
professional services that help determine a customer’s business processes and
the technical requirements of the solutions implementation. In the
implementation stage, we use a delivery methodology to assist customers and
integration partners in planning and managing the implementation. Typically,
systems integrators provide overall program management and coordinate the
implementation of our products with a customer’s existing communications,
applications, databases and transaction systems. In the final phases of an
implementation, the systems integrators provide deployment services to enable a
customer’s internal team to implement the system, train internal users and
provide first-level end-user support.
Although
our primary strategy is to leverage our strategic systems integration partners
for implementations, our internal professional services organization is often
integral in implementing our enterprise platform software solutions for our
customers. We believe that our consulting services enhance the use and
administration of our software solutions, facilitate the implementation of our
solutions and result in sharing best business practices with client and systems
integrator project teams. In addition to implementing our software, our
professional services organization works closely with our internal research and
development organization to enhance existing software solutions.
In
addition to our internal professional services organization, in calendar 2009,
we renewed for three years our agreement with Ness Technologies Inc., Ness
Global Services, Inc. and Ness Technologies India, Ltd. (collectively, “Ness”),
that we originally entered into in 2003. Ness provides Chordiant with resources
focused on technical product support, sustaining engineering product testing and
product development through their global technical resources and operations
center in Bangalore, India. Ness is an independent contracting company with
global technical resources. The agreement with Ness may be extended for
additional one year terms at our discretion. Our agreement with Ness enables
them, at our direction, to attract, train, assimilate and retain sufficient
highly qualified personnel to perform technical support and certain sustaining
engineering functions.
Educational
Services
We
provide educational services to train and enable our systems integrators and
customers to use our products and technologies. We offer a comprehensive series
of training modules to provide the knowledge and skills to successfully deploy,
use and maintain our products. These training courses focus on the technical
aspects of our products as well as business issues and processes. We provide
on-site and on-line customized training courses for a fee and, also, through
classroom, lab instructions, and e-learning. In addition, we provide
certification programs for our partners and customers. Fees for our training
services are typically charged separately from our software license, maintenance
and consulting fees.
Customer
Support
We
provide our customers with support and maintenance services including telephone
support, web-based support and updates to our products and documentation. We
believe that providing a high level of technical support is critical to customer
satisfaction. We also offer training programs to our customers and other
companies with which we have relationships to accelerate the implementation and
adoption of our solutions by the users within a company.
Our
customers have a choice of support and maintenance options depending on the
level of service desired. Our technical support services are available to
clients by telephone, over the web, by e-mail and on-site. Additionally, we
provide unspecified product enhancement releases to customers as part of our
support and maintenance contracts. We use a customer service automation system
to track each customer inquiry until it is resolved. We also make use of our
website and a secured customer forum to provide product information and
technical support information worldwide 24 hours a day, seven days a
week.
Strategic
Partnerships
Establishing
partnerships and alliances with third parties that provide additional services
and resources for implementing our solutions to enhance our sales and service
organizations’ productivity is an important element of our strategy. These
relationships and alliances fall into the following categories:
Consulting and System Integration
Relationships. To enhance the productivity of our sales and service
organizations, we have established relationships with systems integrators,
complementary technology providers, and alternative service providers. We have
established relationships and trained professionals at a number of systems
integrators including: Cap Gemini, Accenture, IBM Global Services, Ness
Technologies, Tata Consultancy Services, HCL Technologies, Wipro Systems,
Infosys, Cognizant, and Patni. We believe that our relationships with systems
integrators and independent consulting firms will enable us to gain a greater
share of our target markets.
Technology Partnerships. We
make extensive use of industry platforms and embrace a number of core
technologies in our solution offerings. We have formed partnerships with vendors
of software and hardware technology platforms. We currently maintain technology
relationships with vendors such as Avaya/Lucent,
Alcatel/Genesys, Cisco Systems, IBM, and Oracle
(Sun Microsystems). Many of these companies voluntarily provide us
with early releases of new technology platforms, education related to those
platforms and limited access to their technical resources to facilitate adoption
of their technology.
Product
Development
We
have made substantial investments in research and development through internal
development, acquisitions and technology licensing. Our product development
efforts are focused on extending our enterprise software solutions, application
components, industry specific processes and business process functionality, and
continued integration of industry-specific transaction systems and services. Our
product development organization is responsible for defining a product strategy
that is continuously aligned with market requirements and turning this strategy
into sales assets through architecture, engineering, testing, quality assurance
and enabling the compatibility of our products with third party hardware and
software platforms.
Our
product development resources are organized into a number of development teams
including:
|
·
|
Cx
Enterprise Platform, which includes Foundational Server, Tools, and
Decision Management Products;
|
|
·
|
Operations,
which includes Mesh, Fulfillment, Performance Labs, and Release
Management;
|
|
·
|
Applications,
which includes our vertical and Marketing
Applications;
|
|
·
|
Product
Test and Quality.
|
Our
product development teams have experience in enterprise and distributed
computing, J2EE and object oriented development, data management, process and
workflow engineering, transaction system interfaces, Internet and Web-Services
technologies. Our research and development expenditures were $19.0 million,
$25.6 million, and $27.5 million for the years ended September 30, 2009, 2008,
and 2007, respectively.
Competition
The
market for our products is competitive, rapidly evolving, and can be affected by
new product introductions and other market activities of industry participants.
The competitive landscape is quickly evolving to address the need for
enterprise-wide integration of IT assets and the convergence of customer
interaction applications, back-office systems and business processes. The most
significant competition we face is from customers’ internal development efforts,
custom system integration, as well as other software providers that offer
integration and development platforms.
Internal
Development
Many
of our customers and potential customers have in the past attempted to develop
customer service, call center, customer relationship management and new
front-office systems in-house or with the help of systems integrators. Internal
information technology departments have staffed projects to build their own
systems utilizing a variety of tools. In some cases, such internal development
projects have been successful in satisfying the needs of an organization. The
costs of
internal
development and total cost-of-ownership have risen to become a primary concern
of the business and management. In spite of current ongoing efforts to reduce IT
budgets, we expect that internal development will continue to be a significant
source of competition.
Custom
System Integration Projects
Another
source of competition results from systems integrators engaged to build a custom
development application. The introduction of a systems integrator typically
increases the likelihood of success for the customer. The competitive factors in
this area require that we demonstrate to the customer the cost savings and
advantages of configurable, upgradeable and commercially supported software
products developed by a dedicated professional software
organization.
We
frequently rely on system consulting and systems integration firms for
implementation and other global services, as well as recommendations of our
products during the evaluation stage of the purchase process. Many of these
third parties have similar and often more established relationships with our
customers. We cannot assure that these third parties, many of whom have
significantly greater resources than us, will not market software products in
competition with us.
Application
Software Competitors
As
discussed, our primary competition is from internal development at our customers
and potential customers. However, other competitors include providers of
traditional, first-generation customer relationship management, enterprise
resources planning, call center, marketing automation software and sales force
automation software. These vendors include, among others, companies such as:
Oracle Corporation, SAP, Pegasystems, Inc., Unica Corporation, Fidelity National
Information Systems, Inc., S1 Corporation, Infor (Ephipany) and Amdocs
Limited.
Some
of these companies have longer operating histories, greater financial, marketing
and other resources, greater name recognition in other markets and a larger base
of customers than we do. In addition, some companies have well-established
relationships with our current and potential customers. As a result, these
competitors may be able to devote greater resources to the development,
promotion and sale of their products than we can.
We
believe that we compete favorably in the industries we serve based on the
following competitive advantages: process-driven solutions for servicing and
selling; real-time and transactional processes; real-time decision management
and vertical processes implemented in a multi-channel architecture. The
technology advantages include: Chordiant architecture providing an open services
oriented architecture providing for integration with multiple legacy systems,
third party applications and communication channels and advanced browser based
application environment for high volume call center, mid-office and branch
operations.
There
is no one competitor, nor are there a small number of competitors that are
dominant in our market. There are many factors that may increase competition in
the enterprise customer relationship management market, including (i) entry of
new competitors, (ii) mergers and alliances among existing competitors, (iii)
consolidation in the software industry and (iv) technological changes or changes
in the use of the Internet. Increased competition may result in price
reductions, reduced gross margins and loss of market share, any of which could
materially and adversely affect our business, operating results and financial
condition. Continuing consolidation in the software industry during the
past years may indicate that we will face new competitors in the future.
Recently, IBM, SAP, Oracle and Sun Microsystems have made numerous acquisitions
in the industry and Oracle has entered into an agreement to acquire Sun
Microsystems, which transaction is subject to certain regulatory approvals.
While we do not believe that the companies acquired by IBM, SAP and Oracle have
been significant competitors of Chordiant in the past, these acquisitions may
indicate that we may face increased competition from larger and more established
entities in the future.
We
cannot assure that we will be able to compete successfully against current and
future competitors or that the competitive pressure faced by us will not
materially and adversely affect our business, operating results and financial
condition.
Intellectual
Property and Proprietary Rights
Our
success is in part dependent upon our ability to develop and protect proprietary
technology and intellectual proprietary rights. We rely primarily on a
combination of contractual provisions, confidentiality procedures, patents,
trade secrets, and copyright and trademark laws to protect our intellectual
property and proprietary rights.
We
license our products through non-exclusive license agreements that impose
restrictions on customers’ ability to utilize the software. In addition, we seek
to avoid disclosure of our trade secrets, including requiring employees,
customers and others with access to our proprietary information to execute
confidentiality agreements with us and restricting access to our source code. We
also seek to protect our rights in our products, documentation and other written
materials under trade secret and copyright laws. Due to rapid technological
change, we believe factors such as the technological and creative skills of our
personnel, new product developments and enhancements to our existing products
are more important than the various legal protections of our technology to
establishing and maintaining a technology leadership position.
We
integrate third party software into our products. Costs associated with
integrated technology provided by third parties historically accounts for
approximately 2% to 5% of total license revenues. The third party software may
not continue to be available on commercially reasonable terms or at all. If we
cannot maintain licenses to key third party software, shipments of our products
could be delayed until equivalent software is developed or licensed and
integrated into our products. Moreover, although we are generally indemnified
against claims if technology licensed from third parties infringes the
intellectual property and proprietary rights of others, this indemnification is
not always available for all types of intellectual property and proprietary
rights and in some cases the scope of this indemnification is limited. There can
be no assurance that infringement or invalidity claims arising from the
incorporation of third party technology or claims for indemnification from our
customers resulting from these claims will not be asserted or prosecuted against
us. These claims, even if not meritorious, could result in the expenditure of
significant financial and managerial resources, in addition to potential product
redevelopment costs and delays.
Despite
our efforts to protect our proprietary rights, existing laws afford only limited
protection. Attempts may be made to copy or reverse engineer aspects of our
products or to obtain and use information that we regard as proprietary. There
can be no assurance that we will be able to protect our proprietary rights
against unauthorized third party copying or use. Use by others of our
proprietary rights could materially harm our business. Furthermore, policing the
unauthorized use of our products is difficult and expensive litigation may be
necessary in the future to enforce our intellectual property
rights.
Third
parties may claim, and have claimed, that we have infringed, or currently
infringe, their current or future products. We expect that software developers
will increasingly be subject to infringement claims as the number of products in
different industry segments overlap. Any claims, with or without merit, can be
time-consuming, result in costly litigation, prevent product shipment, cause
delays, or require us to enter into royalty or licensing agreements, any of
which could harm our business. Patent litigation in particular has complex
technical issues and inherent uncertainties. If an infringement claim against us
was successful and we could not obtain a license on acceptable terms, license a
substitute technology or redesign to avoid infringement, our business could be
harmed.
In
fiscal year 2007, Chordiant received two patents from the US Patent and
Trademark Office. The first patent was US Patent Number 7,178,109 for innovative
user interface design, first introduced in its family of browser-based
applications in 2003. The second was US Patent Number 7,194,380 which covers the
Decision Management Suite. In fiscal year 2009 and 2008, we neither filed for
nor received patents.
Environmental
Laws
Compliance
with federal, state and local and foreign laws enacted for the protection of the
environment has to date had no material effect on the Company’s capital
expenditures, earnings, or competitive position.
Employees
As
of September 30, 2009, we employed 222 full time employees. Of that total, 71
were primarily engaged in product development, engineering or systems
engineering, 70 were engaged in sales and marketing, 41 were engaged in
professional services and 40 were engaged in operational, financial and
administrative functions.
None
of our employees are represented by a labor union and we have never experienced
a work stoppage. We believe that our relations with our employees are good. We
believe our future success will depend in part on our continued ability to
recruit and retain highly skilled technical, sales, finance, management and
marketing personnel.
Financial
Information about Geographic Areas
For
a description of our sales by geographic region, we incorporate by reference the
information in Note 13 to our Consolidated Financial Statements contained in
Item 8 of this Annual Report on Form 10-K. Although the Company’s revenues are
not considered seasonal, our international operations do experience a slowdown
in the summer months and professional services provided on an hourly basis
decline due to the holidays in the quarterly periods ended December 31. For
information relating to the risks attendant to our foreign operations, we
incorporate by reference the information under the headings “—Risk Factors—If we
fail to adequately address the difficulties of managing our international
operations, our revenues and operating expenses will be adversely affected” and
“—Risk Factors—Fluctuations in the value of the U.S. Dollar relative to foreign
currencies could negatively affect our operating results and cash
flows.”
Financial
Information about Segments
The
Company has one segment. For a description of our revenues, profit and loss, and
total assets, we incorporate by reference the information in Item 6 and Note 13
to our Consolidated Financial Statements contained in Item 8 of this Annual
Report on Form 10-K.
Backlog
For
a discussion of backlog, we incorporate by reference the information in Part II,
Item 7 “Management’s Discussion and Analysis of Financial Condition and Results
of Operations” under the heading Financial Trends.
Available
Information
We
were incorporated in California in March 1991 and were reincorporated in
Delaware in October 1997.
We
maintain a site on the worldwide web at www.chordiant.com; however, information
found on our website is not incorporated by reference into this Annual Report on
Form 10-K. We make available free of charge on or through our website our
filings with the Securities and Exchange Commission or SEC, including our Annual
Report on Form 10-K, quarterly reports on Form 10-Q, current reports on Form 8-K
and amendments to those reports filed or furnished pursuant to
Section 13(a) or 15(d) of the Securities Exchange Act, as soon as
reasonably practicable after we electronically file such material with, or
furnish it to, the SEC. Further, a copy of this annual report on Form 10-K is
located at the SEC’s Public Reference Room at 100 F Street, NE, Room 1580,
Washington, D.C. 20549. Information on the operation of the Public Reference
Room can be obtained by calling the SEC at 1-800-SEC-0330. The SEC maintains an
Internet site that contains reports, proxy and information statements, and other
information regarding our filings at http://www.sec.gov.
|
RISK
FACTORS
|
We
may experience a shortfall in bookings, revenue, earnings, cash flow or other
financial metrics, or otherwise fail to meet public market expectations, which
could materially and adversely affect our business and the market price of our
common stock.
Our
revenues and operating results may fluctuate significantly because of a number
of factors, many of which are outside of our control. Some of these factors may
include:
|
|
•
|
Additional
deterioration and changes in domestic and foreign markets and economies,
including those impacted by the turmoil in the financial services,
mortgage and credit markets;
|
|
|
•
|
Our
ability to close new license
transactions;
|
|
|
•
|
Size
and timing of individual license
transactions;
|
|
|
•
|
Delay,
deferral or termination of customer implementations of our
products;
|
|
|
•
|
Lengthening
of our sales cycle;
|
|
|
•
|
Efficiently
utilizing our global services organization, direct sales force and
indirect distribution channels;
|
|
|
•
|
Our
ability to develop and market new
products;
|
|
|
•
|
Timing
of new product introductions and product
enhancements;
|
|
|
•
|
Mix
of products licensed and services
sold;
|
|
|
•
|
Activities
of and acquisitions by our
competitors;
|
|
|
•
|
Product
and price competition; and
|
|
|
•
|
Our
ability to control our costs.
|
One
or more of the foregoing factors may cause our operating expenses to be
disproportionately high during any given period or may cause our bookings,
revenues and operating results to fluctuate significantly. Based upon the
preceding factors, we may experience a shortfall in bookings, revenues and
earnings or otherwise fail to meet public market expectations, which could
materially and adversely affect our business, financial condition, results of
operations and the market price of our common stock.
Our
backlog has declined over the past two years, which will adversely affect
revenues and could result in losses in future periods, and our known backlog of
business may not result in revenue.
We
define backlog as contractual commitments by our customers through purchase
orders or contracts. Backlog includes software license orders for which the
delivered products have not been accepted by customers or have not otherwise met
all of the required criteria for revenue recognition, deferred revenue from
customer support contracts, and deferred consulting and education orders for
services not yet completed or delivered.
Prior
to the fiscal quarter ended September 30, 2009 when backlog increased, backlog
had declined sequentially over each of the prior six fiscal quarters due to
lower than expected bookings. In the aggregate, backlog declined significantly
over the past fiscal year. The decline in backlog is primarily due to revenue on
previously signed transactions being recognized at a faster pace than new
transactions were being consummated. Each category of backlog has also been
unfavorably impacted by recent foreign exchange rate changes, as significant
portions of the underlying balances are denominated in Euros or Pounds
Sterling.
The
decline in backlog and the associated deferred revenue balances will adversely
affect revenues in future periods, and our ability to forecast future revenues
will be diminished. Because our backlog has declined, the financial results of
future periods will be more dependent upon the signing of new transactions.
Accordingly, the level of future revenues will be less predictable. If average
quarterly aggregate bookings remain at the $13.7 million levels achieved during
the past twelve months, future losses would be incurred unless operating
expenses are reduced.
Backlog
is not necessarily indicative of revenues to be recognized in a specified future
period. There are many factors that would impact the Company’s filling of
backlog, such as the Company’s progress in completing projects for its customers
and Chordiant’s customers’ meeting anticipated schedules for customer-dependent
deliverables. The Company provides no assurances that any portion of its backlog
will be filled during any fiscal year or at all, or that its backlog will be
recognized as revenues in any given period or at all. In addition, it is
possible that customers from whom we expect to derive revenue from backlog will
default, and as a result we may not be able to recognize expected revenue from
backlog. The risk that customers will reduce the scope of, delay or terminate
projects, thus delaying or eliminating our ability to recognize backlog as
revenue, is exacerbated in the current economic environment. For the fiscal year
ended September 30, 2009, statements of work for professional services
aggregating approximately $5.8 million were reversed from our backlog balances
as the underlying projects were canceled or the statement of work contractually
expired unutilized.
Geopolitical
concerns could make the closing of license transactions with new and existing
customers difficult.
Our
revenues may further decrease in fiscal year 2010 or beyond if we are unable to
enter into new large value license transactions with new and existing customers.
The current state of the global financial markets and the global economic
decline generally have left many customers reluctant to enter into new large
value license transactions without some expectation that the economy both in the
customer’s home country and globally will stabilize. Geopolitical instability
will continue to make closing large license transactions difficult. In addition,
we cannot predict what effect the U.S. military presence overseas or potential
or actual political or military conflict have had or are continuing to have on
our existing and prospective customers’ decision-making process with respect to
licensing or implementing enterprise-level products such as ours. Our ability to
enter into new large value license transactions also directly affects our
ability to create additional consulting service and maintenance revenue
opportunities, on which we also depend.
Recent
worldwide market turmoil may adversely affect our customers which directly
impacts our business and results of operations.
The
Company’s operations and performance depend on our customers having adequate
resources to purchase our products and services. The unprecedented turmoil in
the global markets and the global economic downturn generally continues to
adversely impact our customers and potential customers. These market and
economic conditions have continued to deteriorate despite government
intervention globally, and may remain volatile and uncertain for the foreseeable
future. Customers have altered and may continue to alter their purchasing and
payment activities in response to deterioration in their businesses, lack of
credit, economic uncertainty and concern about the stability of markets in
general, and these customers may reduce, delay or terminate purchases of, and
payment for, our products and services. Recently, a number of our current and
prospective customers have merged with others, been forced to raise significant
amounts of capital, or received loans or equity investments from the government,
which actions may result in less demand for our products and services. If we are
unable to adequately respond to changes in demand resulting from deteriorating
market and economic conditions, our financial condition and operating results
may be materially and adversely affected.
In
periods of worsening economic conditions, our exposure to credit risk and
payment delinquencies on our accounts receivable significantly
increases.
Our
outstanding accounts receivables are generally not secured by any form of
collateral. In addition, our standard terms and conditions permit payment within
a specified number of days following the receipt of our product. While we have
procedures to monitor and limit exposure to credit risk on our receivables,
there can be no assurance such procedures will effectively limit our credit risk
and avoid losses. As economic conditions deteriorate, certain of our customers
have faced and may face liquidity concerns and have delayed and may delay or may
be unable to satisfy their payment obligations, which would have a material
adverse effect on our financial condition and operating results.
Our
cash and cash equivalents could be adversely affected if the financial
institutions in which we hold our cash and cash equivalents fail.
Our
cash and cash equivalents are highly liquid investments with original maturities
of three months or less at the time of purchase. We maintain the cash and cash
equivalents with reputable major financial institutions. Deposits with these
banks exceed the Federal Deposit Insurance Corporation (“FDIC”) insurance limits
or similar limits in foreign jurisdictions. While we frequently monitor the cash
balances in the operating accounts and adjust the balances as appropriate, these
balances could be impacted if one or more of the financial institutions with
which we deposit fails or is subject to other adverse conditions in the
financial or credit markets. To date we have experienced no loss or lack of
access to our invested cash or cash equivalents; however, we can provide no
assurance that access to our invested cash and cash equivalents will not be
impacted by adverse conditions in the financial and credit
markets.
To
date, our sales have been concentrated in the insurance, healthcare,
telecommunications and financial services markets, and if we are unable to
continue sales in these markets or successfully penetrate new markets, our
revenues may decline.
Sales
of our products and services in several large markets—insurance, healthcare,
telecommunications and financial services, accounted for approximately 86% and
92% of our total revenues for the fiscal years ended September 30, 2009 and
2008, respectively. We expect that revenues from these markets will continue to
account for a substantial portion of our total revenues for the foreseeable
future. However, we are seeking to opportunistically expand in other markets. If
we are unable to successfully increase penetration of our existing markets or
achieve sales in additional markets, or if the overall economic conditions in
our target markets further deteriorates, our revenues may decline. Some of our
current and prospective customers, especially those in the financial services
and insurance industries, have faced and may continue to face severe financial
difficulties given their exposure to deteriorating financial and credit markets,
as well as the mortgage and homebuilder sectors of the economy. This may cause
our current and prospective customers to reduce, delay or terminate their
spending on technology, which in turn would have an adverse impact on our
bookings and revenues.
Because
a small number of customers account for a substantial portion of our revenues,
the loss of a significant customer could cause a substantial decline in our
revenues.
We
derive a significant portion of our license and service revenue from a limited
number of customers. The loss of a major customer could cause a decrease in
revenues and net income. For the fiscal year ended September 30, 2009, Vodafone
Group Services Limited and affiliated companies and Citicorp Credit Services,
Inc. accounted for 20% and 10% of our total revenue, respectively. For the
fiscal year ended September 30, 2008, Citicorp Credit Services, Inc. and
Vodafone Group Services Limited and affiliated companies accounted for 22% and
11%, respectively, of our total revenue. While our customer concentration has
fluctuated, we expect that a limited number of customers will continue to
account for a substantial portion of our revenues in any given period. As a
result, if we lose a major customer, or if a contract is delayed or cancelled or
we do not contract with new major customers, our revenues and net income would
be adversely affected. In addition, customers that have accounted for
significant revenues in the past may not generate revenues in any future period,
which may materially affect our operating results. For example, Vodafone Group
Services Limited and affiliated companies, which had purchase commitments
through the quarter ended June 30, 2009, may not purchase additional products or
services with us. The deteriorating economic environment has resulted in
failures of financial institutions and significant consolidation within the
financial services industry from which we derive a significant portion of our
customers and revenues. Accordingly, the risk that we could lose a significant
customer is exacerbated in the current economic environment.
Historically,
some of our products and services have assisted companies in attracting and
retaining customers. To the extent financial institutions and other large
companies shrink the size of their customer base, the demand for these products
may be reduced.
Some
of our customers have used our products to aggressively expand the size of their
customer base. Our marketing, decisioning and enterprise solutions have been
used to varying degrees on projects intended to manage leads, personalize
marketing campaigns and deliver highly effective sales messages. Due to the
current economic climate, many large financial institutions have been forced to
deleverage, sell parts of their businesses, or otherwise reduce the size of
their organizations. In these situations it is possible that the demand for our
products has been, and may continue to be, reduced, resulting in lower revenues
in the future.
Over
the near term, we have shifted the focus of our sales staff towards Decisioning
Management products and have reduced the marketing focus on Enterprise
Foundation products to reflect market conditions. This change in focus may not
be successful and may result in lower revenues.
Sales
of Enterprise Foundation solutions generally have a much higher cost to a
customer than Decisioning Management solutions. The magnitude of the
professional services required to implement Enterprise Foundation projects is
also much higher and often can take long periods of time to complete.
Decisioning products are generally faster to implement and can produce a
positive return on investment in a shorter period of time. Due to the current
economic climate, our customers are focusing on those projects that are smaller
and faster to complete. Accordingly, we have shifted our sales force to increase
the marketing of these types of solutions. This plan may not be successful and,
as a result, revenues may not meet our expectations. Further, license and
services fees associated with our Decisioning Management solutions generate
smaller sales and, as a result, may result in lower revenues.
Fluctuations
in the value of the U.S. dollar relative to foreign currencies could negatively
affect our operating results and cash flows.
A
significant portion of our sales and operating expenses result from transactions
outside of the U.S., often denominated in foreign currencies. These currencies
include the United Kingdom Pound Sterling, the Euro, the Canadian Dollar, and
the Chinese Yuan. Our international sales comprised 65 % and 48% of our total
sales for the fiscal year ended September 30, 2009 and 2008, respectively. Our
future operating results, as well as our cash and deferred revenue balances,
will continue to be subject to fluctuations in foreign currency rates,
especially if international sales increase as a percentage of our total sales,
and we may be negatively impacted by fluctuations in foreign currency rates in
the future. For the fiscal year ended September 30, 2009, we had a foreign
currency transaction loss of less than $0.1 million. See Item 7A, Quantitative
and Qualitative Disclosures about Market Risk, for further
discussions.
Given
current economic and market conditions, we may be forced to make additional
reductions to our workforce.
In
July 2005, October 2006, May 2008 and October 2008, we reduced our workforce by
approximately 10% to 15% in each instance. Given the current economic and
market conditions, we may be forced to further reduce our workforce, which could
materially and adversely affect our business, financial condition and results of
operations.
Given
that our stock price is near its historical low, we may be subject to takeover
overtures that will divert the attention of our management and Board, and
require us to incur expenses for outside advisors.
Given
that our stock price is near its historical low, we may be subject to takeover
overtures. Evaluating and addressing these overtures would require the time and
attention of our management and Board, divert them from their focus on our
business, and require us to incur additional expenses on outside legal,
financial and other advisors, all of which could materially and adversely affect
our business, financial condition and results of operations.
Low
gross margin in services revenues could adversely impact our overall gross
margin and income.
Our
services revenues have had lower gross margins than our license revenues.
Service revenues comprised 71% and 70% of our total revenues for the fiscal
years ended September 30, 2009 and 2008, respectively. Gross margin on service
revenues was 60% and 57% for the fiscal years ended September 30, 2009 and 2008,
respectively. License revenues comprised 29% and 30% of our total revenues for
the fiscal years ended September 30, 2009 and 2008, respectively. Gross margins
on license revenues were 98% and 97% for the fiscal years ended September 30,
2009 and 2008, respectively. As a result, an increase in the percentage of total
revenues represented by services revenues, or an unexpected decrease in license
revenues, could have a detrimental impact on our overall gross margins. To
increase services revenues, we may expand our services organization, requiring
us to successfully recruit and train a sufficient number of qualified services
personnel, enter into new implementation projects and obtain renewals of current
maintenance contracts by our customers. This expansion could further reduce
gross margins in our services revenues. In addition, given the current economic
environment, customers and potential customers have sought and may seek
discounts on our services, or services at no charge, which has and would further
reduce our services gross margins and materially and adversely affect our
business, financial condition and results of operations.
Our
revenues decreased in fiscal year 2009 as compared to fiscal year 2008, in
fiscal year 2008 as compared to fiscal year 2007, and in fiscal year 2009 we
were not profitable, which may raise vendor viability concerns about us and
thereby make it more difficult to consummate license transactions with new and
existing customers.
Our
revenues decreased materially in fiscal year 2009 as compared to fiscal year
2008 and in fiscal year 2008 as compared to fiscal year 2007. In addition, we
were not profitable in fiscal year 2009 or the fiscal years prior to September
30, 2007. As of September 30, 2009, we had an accumulated deficit of $236.6
million. We may incur losses in the future and cannot be certain that we can
generate sufficient revenues to achieve profitability. Continued losses or
decreased revenues may make many customers reluctant to enter into new large
value license transactions without some assurance that we will operate
profitably. If we fail to enter into new large value license transactions due to
profitability and/or viability concerns by our vendors, our revenues could
decline, which could further adversely affect our operating
results.
Anti-takeover
provisions could make it more difficult for a third-party to acquire
us.
We
have adopted a stockholder rights plan and initially declared a dividend
distribution of one right for each outstanding share of common stock to
stockholders of record as of July 21, 2008. Each right entitles the holder
to purchase one one-hundredth of a share of our Series A Junior
Participating Preferred Stock for $20. Under certain circumstances, if a person
or group acquires 20 percent or more of our outstanding common stock,
holders of the rights (other than the person or group triggering their exercise)
will be able to purchase, in exchange for the $20 exercise price, shares of our
common stock or of any company into which we are merged, having a value of $40.
The rights expire on July 21, 2011, unless extended by our Board of Directors.
Because the rights may substantially dilute the stock ownership of a person or
group attempting to acquire us without the approval of our Board of Directors,
our rights plan could make it more difficult for a third-party to acquire us (or
a significant percentage of our outstanding capital stock) without first
negotiating with our Board of Directors regarding that acquisition.
In
addition, our Board of Directors has the authority to issue up to
51 million shares of Preferred Stock (of which 500,000 shares have been
designated as Series A Junior Participating Preferred Stock) and to fix the
designations and the powers, preferences and rights, and the qualifications,
limitations and restrictions thereof. The rights of the holders of our common
stock may be subject to, and may be adversely affected by, the rights of the
holders of any Preferred Stock that may be issued in the future. The issuance of
Preferred Stock may have the effect of delaying, deterring or preventing a
change of control of Chordiant without further action by the stockholders and
may adversely affect the voting and other rights of the holders of our common
stock.
Further,
certain provisions of our charter documents, including a provision limiting the
ability of stockholders to raise matters at a meeting of stockholders without
giving advance notice, may have the effect of delaying or preventing changes in
control or management of Chordiant, which could have an adverse effect on the
market price of our stock. In addition, our charter documents do not permit
cumulative voting, which may make it more difficult for a third party to gain
control of our Board of Directors. Similarly, we have a classified Board of
Directors whereby approximately one-third of our Board members are elected
annually to serve for three-year terms, which may also make it more difficult
for a third party to gain control of our Board of Directors. Further,
we are subject to the anti-takeover provisions of Section 203 of the
Delaware General Corporation Law, which will prohibit us from engaging in a
“business combination” with an “interested stockholder” for a period of three
years after the date of the transaction in which the person became an interested
stockholder, even if such combination is favored by a majority of stockholders,
unless the business combination is approved in a prescribed manner. The
application of Section 203 also could have the effect of delaying or
preventing a change of control or management.
Our primary products have a long
sales and implementation cycle, which makes it difficult to predict our
quarterly and annual results and may cause our operating results to vary
significantly from period to period.
The
period between the initial contact with a prospective customer and the sale of
our products is unpredictable and often lengthy, typically ranging from three to
eighteen months. Thus, revenue and cash receipts could vary significantly from
quarter to quarter. Any delays in the implementation of our products could cause
reductions in our revenues. The licensing of our products is often an
enterprise-wide decision that generally requires us to provide a significant
level of education to prospective customers about the use and benefits of our
products. The implementation of our products involves a significant commitment
of technical and financial resources that may be provided by us, by the customer
or by third-party systems integrators. If we underestimate the resources
required to meet the expectations we have set with a customer when we set
prices, then we may experience a net loss on that customer engagement. If this
happens with a large customer engagement, then this could have a material
adverse effect on our financial results. Customers generally consider a wide
range of issues before committing to purchase our products, including product
benefits, ability to operate with existing and future computer systems, vendor
financial stability and longevity, ability to accommodate increased transaction
volume and product reliability. Certain of our customers have become more
cautious regarding their technology purchases given the current economic
conditions and specifically the issues that continue to impact the financial and
credit markets. The result is that our sales cycles may have lengthened in some
instances, requiring more time to finalize transactions. In particular, in each
of the past several quarters, transactions that we expected to close before the
end of the quarter were delayed or suspended.
Competition
in our markets is intense and could reduce our sales and prevent us from
achieving profitability.
Increased
competition in our markets could result in price reductions for our products and
services, reduced gross margins and loss of market share, any one of which could
reduce our future revenues. The market for our products is intensely
competitive, evolving and subject to rapid technological change. Historically,
our primary competition has been from internal development, custom systems
integration projects and application software competitors, each of whom we
expect will continue to be a significant source of competition. In particular,
we compete with:
|
|
•
|
Internal information
technology departments: in-house information technology departments
of potential customers have developed or may develop systems that provide
some or all of the functionality of our
products.
|
|
|
•
|
Custom systems integration
projects: we compete with large systems integrators who may develop
custom solutions for specific companies which may reduce the likelihood
that they would purchase our products and
services.
|
|
|
•
|
Application software
vendors: we compete with providers of stand-alone point solutions
for web-based customer relationship management as well as traditional
client/server-based, call-center service customer and sales-force
automation solution providers, many of whom offer broad suites of
application and other software.
|
The
enterprise software industry continues to undergo consolidation in sectors of
the software industry in which we operate. IBM, SAP, Oracle and Sun Microsystems
have made numerous acquisitions in the industry and Oracle has entered into an
agreement to acquire Sun Microsystems, which transaction is subject to certain
regulatory approvals. While we do not believe that the companies acquired by
IBM, SAP and Oracle have been significant competitors of Chordiant in the past,
these acquisitions may indicate that we may face increased competition from
larger and more established entities in the future.
Many
of our competitors have greater resources, broader customer relationships and
broader product and service offerings than we do. In addition, many of these
competitors have extensive knowledge of our industry. Current and potential
competitors have established, or may further establish, cooperative
relationships among themselves or with third parties to offer a single solution
and to increase the ability of their products to address customer
needs.
Our
operating results and cash flows fluctuate significantly and delays in delivery
or implementation of our products or changes in the payment terms with customers
may cause unanticipated declines in revenues or cash flow, which could
disappoint investors and result in a decline in our stock price.
A
portion of our quarterly revenues depend primarily upon product implementation
by our customers. We have historically recognized a significant portion of our
license and services revenue through the percentage-of-completion accounting
method, using labor hours incurred as the measure of progress towards completion
of implementation of our products, and we expect this practice to continue. The
percentage-of-completion accounting method requires ongoing estimates of
progress of complicated and frequently changing technology projects. Documenting
the measure of progress towards completion of implementation is subject to
potential errors and changes in estimates. As a result, even minor errors or
minor changes in estimates may lead to significant changes in accounting results
which may be revised in later quarters due to subsequent information and events.
Thus, delays or changes in customer business goals or direction when
implementing our software may adversely impact our quarterly revenue.
Additionally, we may increasingly enter into term, subscription or
transaction-based licensing transactions that would cause us to recognize
license revenue for such transactions over a longer period of time than we have
historically experienced for our perpetual licenses. In addition, a significant
portion of new customer orders have been booked in the third month of each
calendar quarter, with many of these bookings occurring in the last two weeks of
the third month. We expect this trend to continue, and therefore any failure or
delay in bookings would decrease our quarterly revenue and cash flows. The terms
and conditions of individual license agreements with customers vary from
transaction to transaction. Historically, the Company has been able to obtain
prepayments for product in some cases, but more recently we have entered into
large transactions with payments from customers due over one or more years.
Other transactions link payment to the delivery or acceptance of products. If we
are unable to negotiate prepayments of fees our cash flows and financial ratios
with respect to accounts receivable would be adversely impacted. If our
revenues, operating margins or cash flows are below the expectations of the
investment community, our stock price is likely to decline.
If
we are not able to successfully manage our partner operations in India, our
operations and financial results may be adversely affected.
Since
2003, we have contracted with Ness Technologies Inc., Ness USA, Inc. (formerly
Ness Global Services, Inc.) and Ness Technologies India, Ltd. (collectively,
“Ness”) to attract, train, assimilate and retain sufficient highly qualified
personnel to provide staffing for our consulting projects, technical support,
product testing and certain sustaining engineering functions. As of September
30, 2009, we use the services of approximately 127 consultants through Ness. In
addition, as a result of the reductions in our workforce in recent years, we
continue to have a significant dependence on Ness. This agreement is an
important component of our strategy to address the business needs of our
customers and manage our expenses. The success of this operation will depend on
our ability and Ness’s ability to attract, train, assimilate and retain highly
qualified personnel in the required periods. A disruption or termination of our
relationship with Ness could adversely affect our operations. Failure to
effectively manage the organization and operations will harm our business and
financial results.
If
we become subject to intellectual property infringement claims, including
copyright or patent infringement claims, these claims could be costly and
time-consuming to defend, divert management’s attention, cause product delays
and have an adverse effect on our revenues and net income.
We
expect that software product developers and providers of software in markets
similar to our target markets will increasingly be subject to infringement
claims as the number of products and competitors in our industry grows and the
functionality of products overlap. Additionally, we are seeing copyright
infringement claims being asserted by certain third party software developers.
Any claims, with or without merit, could be costly and time-consuming to defend,
divert our management’s attention or cause product delays. If any of our
products were found to infringe a third party’s proprietary rights, we could be
required to pay damages and/or enter into royalty or licensing agreements to be
able to sell our products, if at all. Royalty and licensing agreements, if
required, may not be available on terms acceptable to us or at all. A patent or
copyright infringement claim could have a material adverse effect on our
business, operating results and financial condition.
We
are the subject of a suit by a person and related entity claiming that certain
of our products infringe their copyrights. Such litigation is
costly. If any of our products were found to infringe such
copyrights, we could be required to pay damages. If we were to settle
such claim, it could be costly.
If
we fail to adequately address the difficulties of managing our international
operations, our revenues and operating expenses will be adversely
affected.
For
the fiscal year ended September 30, 2009, international revenues were $50.5
million or approximately 65% of our total revenues. For the fiscal year ended
September 30, 2008, international revenues were $54.2 million or approximately
48% of our total revenues. We expect that international revenues will continue
to represent a significant portion of our total revenues in future periods. We
have faced, and will continue to face, difficulties in managing international
operations, which include:
|
|
•
|
Difficulties
in hiring qualified local
personnel;
|
|
|
•
|
Seasonal
fluctuations in customer orders;
|
|
|
•
|
Longer
accounts receivable collection
cycles;
|
|
|
•
|
Expenses
associated with licensing products and servicing customers in foreign
markets;
|
|
|
•
|
Economic
downturns and political uncertainty in international
economies;
|
|
|
•
|
Income
tax withholding issues in countries in which we do not have a physical
presence, resulting in non-recoverable tax
payments;
|
|
|
•
|
Complex
transfer pricing arrangements between legal
entities;
|
|
|
•
|
Doing
business and licensing our software to customers in countries with weaker
intellectual property protection laws and enforcement capabilities;
and
|
|
|
•
|
Difficulties
in commencing new operations in countries where the Company has not
previously conducted business, including those associated with tax laws,
banking relationships, product registrations, employment laws, government
regulation, product warranty laws and adopting to local customs and
culture;
|
Any
of these factors could have a significant impact on our ability to license
products and provide services on a competitive and timely basis and could
adversely affect our operating expenses and net income.
Because
competition for qualified personnel is intense, we may not be able to retain or
recruit personnel, which could impact the development and sales of our
products.
If
we are unable to hire or retain qualified personnel, or if newly hired personnel
fail to develop the necessary skills or fail to reach expected levels of
productivity, our ability to develop and market our products will be weakened.
Our success depends largely on the continued contributions of our key
management, finance, engineering, sales, marketing and professional services
personnel. In particular, in prior years we have had significant turnover of our
executives as well as in our sales, marketing and engineering organizations, and
several key positions are held by people who have less than two
years
of experience in their roles with the Company. If these people are not well
suited to their new roles, then this could result in the Company having problems
in executing its strategy or in developing and marketing new products. Because
of the dependency on a small number of large deals, we are uniquely dependent
upon the talents and relationships of a few executives and have no guarantee of
their retention. Changes in key sales management could affect our ability to
maintain existing customer relationships or to close pending transactions.
Further, particularly in the current economic environment, employees or
potential employees may choose to work for larger, more profitable
companies.
The
application of percentage-of-completion and completed contract accounting to our
business is complex and may result in delays in the reporting of our financial
results and revenue not being recognized as we expect.
Although
we attempt to use standardized license agreements designed to meet current
revenue recognition criteria under generally accepted accounting principles, we
must often negotiate and revise terms and conditions of these standardized
agreements, particularly in multi-product transactions. At the time of entering
into a transaction, we assess whether any services included within the
arrangement require us to perform significant implementation or customization
essential to the functionality of our products. For contracts involving
significant implementation or customization essential to the functionality of
our products, we recognize the license and professional consulting services
revenues using the percentage-of-completion accounting method using labor hours
incurred as the measure of progress towards completion. The application of the
percentage-of-completion method of accounting is complex and involves judgments
and estimates, which may change significantly based on customer requirements.
This complexity combined with changing customer requirements could result in
delays in the proper determination of our percentage-of-completion estimates and
revenue not being recognized as we expect.
In
the past we have also entered into co-development projects with our customers to
jointly develop new applications, often over the course of a year or longer. In
such cases we may only be able to recognize revenue upon delivery of the new
application. The accounting treatment for these co-development projects could
result in delays in the recognition of revenue. If we were to enter into similar
transactions, the failure to successfully complete these projects to the
satisfaction of the customer could have a material adverse effect on our
business, operating results and financial condition.
The
company's common stock price has historically been and may continue to be
volatile, which could result in substantial losses for
stockholders.
The
market price of shares of the Company’s common stock has been, and is likely to
continue to be, highly volatile and may be significantly affected by factors
such as the following:
|
|
•
|
Actual
or anticipated fluctuations in our operating
results;
|
|
|
•
|
Changes
in economic and political conditions in the United States and
abroad;
|
|
|
•
|
Terrorist
attacks, war or the threat of terrorist attacks or
war;
|
|
|
•
|
The
announcement of mergers or acquisitions by the Company or its
competitors;
|
|
|
•
|
Financial
difficulties or poor operating results announced by significant
customers;
|
|
|
•
|
Developments
in ongoing or threatened
litigation;
|
|
|
•
|
Announcements
of technological innovations;
|
|
|
•
|
Failure
to comply with the requirements of Section 404 of the Sarbanes-Oxley
Act;
|
|
|
•
|
New
products or new contracts announced by the Company or its
competitors;
|
|
|
•
|
Developments
with respect to intellectual property
laws;
|
|
|
|
|
•
|
Price
and volume fluctuations in the stock
market;
|
|
|
•
|
Changes
in corporate purchasing of software by companies in the industry verticals
supported by the Company;
|
|
|
•
|
Adoption
of new accounting standards affecting the software industry;
and
|
|
|
•
|
Changes
in financial estimates by securities
analysts.
|
In
addition, following periods of volatility in the market price of a particular
company’s securities, securities class action litigation has often been brought
against such companies. If the Company is involved in such litigation, it could
result in substantial costs and a diversion of management’s attention and
resources and could materially harm the Company’s business, operating results
and financial condition.
If
we fail to maintain and expand our relationships with systems integrators and
other business partners, our ability to develop, market, sell and support our
products may be adversely affected.
Our
development, marketing and distribution strategies rely on our ability to form
and maintain long-term strategic relationships with systems integrators, in
particular, with our existing business alliance partners IBM, Ness, Electronic
Data Systems, Tata Consultancy Services and HCL Technologies. These business
relationships often consist of joint marketing programs, technology partnerships
and resale and distribution arrangements. Although most aspects of these
relationships are contractual in nature, many important aspects of these
relationships depend on the continued cooperation between the parties.
Divergence in strategy, change in focus, competitive product offerings or
potential contract defaults may interfere with our ability to develop, market,
sell or support our products, which in turn could harm our business. If any of
IBM, Ness, Electronic Data Systems, Tata Consultancy Services or HCL
Technologies were to terminate their agreements with us or our relationship were
to deteriorate, it could have a material adverse effect on our business,
financial condition and results of operations. In many cases, these parties have
extensive relationships with our existing and potential customers and influence
the decisions of these customers. A number of our competitors have stronger
relationships with IBM, Ness, Electronic Data Systems, Tata Consultancy Services
and HCL Technologies and, as a result, these systems integrators may be more
likely to recommend competitors’ products and services. Over the past several
years, IBM has acquired a number of software companies. While we do not believe
those companies were direct competitors of Chordiant in the past, IBM’s
acquisition of these companies may indicate that IBM will become a more
significant competitor of ours in the future. While the Company currently has a
good relationship with IBM, this relationship and the Company’s strategic
relationship agreement with IBM may be harmed if the Company increasingly finds
itself competing with IBM. Our relationships with systems integrators and their
willingness to recommend our products to their customers could be harmed if the
Company were to be subject to a takeover attempt from a competitor of such
systems integrators.
If
systems integrators fail to properly implement our software, our business,
reputation and financial results may be harmed.
We
often rely on systems integrators to implement our products. As a result, we
have less quality control over the implementation of our software with respect
to these transactions and are more reliant on the ability of our systems
integrators to correctly implement our software. If these systems integrators
fail to properly implement our software, our business, reputation and financial
results may be harmed.
If
we do not maintain effective internal controls over financial reporting,
investors could lose confidence in our financial reporting and customers may
delay purchasing decisions, which would harm our business and the market price
of our common stock.
Effective
internal controls are necessary for us to provide reliable financial reports. If
we cannot provide reliable financial reports, our business could be harmed. We
are a complex company with complex accounting issues and thus subject to related
risks of errors in financial reporting which may cause problems in corporate
governance, the costs of which may outweigh the costs of the underlying errors
themselves.
If
we are not successful in maintaining effective internal controls over financial
reporting, customers may delay purchasing decisions or we may lose customers,
create investor uncertainty, face litigation and the market price of our common
stock may decline.
If
our products do not operate effectively in a company-wide environment, we may
lose sales and suffer decreased revenues.
If
existing customers have difficulty deploying our products or choose not to fully
deploy our products, it could damage our reputation and reduce revenues. Our
success requires that our products be highly scalable and able to accommodate
substantial increases in the number of users. Our products are expected to be
deployed on a variety of computer software and hardware platforms and to be used
in connection with a number of third-party software applications by personnel
who may not have previously used application software systems or our products.
These deployments present very significant technical challenges, which are
difficult or impossible to predict. If these deployments do not succeed,
we
may
lose future sales opportunities and suffer decreased revenues. If we
underestimate the resources required to meet the expectations we have set with a
customer when we set prices, then we may experience a net loss on that customer
engagement. If this happens with a large customer engagement then this could
have a material adverse effect on our financial results.
Defects
in our products could diminish demand for our products and result in decreased
revenues, decreased market acceptance and injury to our reputation.
Errors
may be found from time-to-time in our existing, new, acquired or enhanced
products. Any significant software errors in our products may result in
decreased revenues, decreased sales, and injury to our reputation and/or
increased warranty and repair costs. Although we conduct extensive product
testing during product development, we have in the past discovered and may in
the future discover software errors in our products as well as in third-party
products, and as a result have experienced and may in the future experience
delays in the shipment of our new products.
We
may not have the workforce necessary to support our platform of products if
demand for our products substantially increased, and, if we need to rebuild our
workforce in the future, we may not be able to recruit personnel in a timely
manner, which could negatively impact the development, sales and support of our
products.
In
recent years, we have, from time to time, reduced our workforce. In the event
that demand for our products increases, we may need to rebuild our workforce or
increase outsourced functions to companies based in foreign jurisdictions and we
may be unable to hire, train or retain qualified personnel in a timely manner,
which may weaken our ability to market our products in a timely manner,
negatively impacting our operations. Our success depends largely on ensuring
that we have adequate personnel to support our suite of products as well as the
continued contributions of our key management, finance, engineering, sales,
marketing and professional services personnel.
If
we fail to introduce new versions and releases of functional and scalable
products in a timely manner, customers may license competing products and our
revenues may decline.
If
we are unable to ship or implement enhancements to our products when planned, or
fail to achieve timely market acceptance of these enhancements, we may suffer
lost sales and could fail to achieve anticipated revenues. If our competitors
release new products that are superior to our products in performance or price,
or if we fail to enhance our products or introduce new products, features and
functionality in a timely manner, demand for our products may decline. We have
in the past experienced delays in the planned release dates of new products or
new versions of our software products and upgrades. New versions of our products
may not be released on schedule or may contain defects when
released.
We
depend on technology licensed to us by third parties, and the loss or inability
to maintain these licenses could prevent or delay sales of our
products.
We
license from several software providers technologies that are incorporated into
our products. We anticipate that we will continue to license technology from
third parties in the future. This software may not continue to be available on
commercially reasonable terms, if at all. While currently we are not materially
dependent on any single third party for such licenses, the loss of the
technology licenses could result in delays in the license of our products until
equivalent technology is developed or identified, licensed and integrated into
our products. Given the current economic environment, the risk that one or more
of our suppliers or vendors may go out of business or be unable to meet their
contractual obligations to us is exacerbated. Even if substitute technologies
are available, there can be no guarantee that we will be able to license these
technologies on commercially reasonable terms, if at all, which could have a
material adverse effect on our business, operating results and financial
condition.
Defects
in third party products associated with our products could impair our products’
functionality and injure our reputation.
The
effective implementation of our products depends upon the successful operation
of third-party products in conjunction with our products. Any undetected defects
in these third-party products could prevent the implementation or impair the
functionality of our products, delay new product introductions or injure our
reputation. In the past, while our business has not been materially harmed,
product releases have been delayed as a result of errors in third-party software
and we have incurred significant expenses fixing and investigating the cause of
these errors.
Our
customers and systems integration partners may have the ability to alter our
source code and resulting inappropriate alterations could adversely affect the
performance of our products, cause injury to our reputation and increase
operating expenses.
Customers
and systems integration partners may have access to the computer source code for
certain elements of our products and may alter the source code. Alteration of
our source code may lead to implementation, operation, technical support and
upgrade problems for our customers. This could adversely affect the market
acceptance of our products and our reputation, and any necessary investigative
work and repairs could cause us to incur significant expenses and delays in
implementation, which could have a material adverse effect on our business,
operating results and financial condition.
If
our products do not keep up with advancing technological requirements or operate
with the hardware and software platforms used by our customers, our customers
may license competing products and our revenues will decline.
If
our products fail to satisfy advancing technological requirements of our
customers and potential customers, the market acceptance of these products could
be reduced. We currently serve a customer base with a wide variety of constantly
changing hardware, software applications and networking platforms. Customer
acceptance of our products depends on many factors, including our ability to
integrate our products with multiple platforms and existing or legacy systems,
and our ability to anticipate and support new standards, especially Internet and
enterprise Java standards. If our products do not keep up with advancing
technological requirements or operate with the hardware and software platforms
used by our customers, our customers may license competing products and our
revenues will decline.
Our
failure to successfully acquire or integrate with future acquired or merged
companies and technologies could prevent us from operating
efficiently.
Our
business strategy includes pursuing opportunities to grow our business, both
through internal growth and through mergers, acquisitions and technology and
other asset transactions. To implement this strategy, we may be involved in
various related discussions and activity. Such endeavors may involve significant
risks and uncertainties, including that we may not consummate opportunities that
we pursue. These endeavors could distract management from current operations
that may adversely affect the Company’s financial condition and operating
results. Merger and acquisition transactions are motivated by many factors,
including, among others, our desire to grow our business, obtain recurring
support and maintenance revenue streams, acquire skilled personnel, obtain new
technologies and expand and enhance our product offerings or markets. Mergers
and acquisitions of high-technology companies are inherently risky, and the
Company cannot be certain that any acquisition will be successful and will not
materially harm the Company’s business, operating results or financial
condition. Generally, acquisitions involve numerous risks, including: (i) the
benefits of the acquisition (such as cost savings and synergies) not
materializing as planned or not materializing within the time periods or to the
extent anticipated; (ii) the Company’s ability to manage acquired entities’
people and processes, particularly those that are headquartered in separate
geographical locations from the Company’s headquarters; (iii) the possibility
that the Company will pay more than the value it derives from the acquisition;
(iv) difficulties in integration of the operations, technologies, content and
products of the acquired companies; (v) the assumption of certain known and
unknown liabilities of the acquired companies; (vi) difficulties in retaining
key relationships with customers, partners and suppliers of the acquired
company; (vii) the risk of diverting management’s attention from normal daily
operations of the business; (viii) the Company’s ability to issue new releases
of the acquired company’s products on existing or other platforms; (ix) negative
impact to the Company’s financial condition and results of operations and the
potential write down of impaired goodwill and intangible assets resulting from
combining the acquired company’s financial condition and results of operations
with our financial statements; (x) risks of entering markets in which the
Company has no or limited direct prior experience; (xi) incurring significant
legal and accounts costs to investigate and analyze potential merger
opportunities which fail to be completed; and (xii) the potential loss of key
employees of the acquired company. Realization of any of these risks in
connection with any technology transaction or asset purchase we have entered
into, or may enter into, could have a material adverse effect on our business,
operating results and financial condition.
Changes
in our revenue recognition model could result in short-term declines in
revenue.
Historically,
we have recognized revenue for a high percentage of our license transactions on
the percentage-of-completion method of accounting or upon the delivery of
product. If we were to enter into new types of transactions accounted for on a
subscription or term basis, revenues might be recognized over a longer period of
time. The impact of this change might make revenue recognition more predictable
over the long term, but it might also result in a short-term reduction of
revenue as the new transactions took effect.
We
may encounter unexpected delays in maintaining the requisite internal controls
over financial reporting and we expect to incur ongoing expenses and diversion
of management’s time as a result of performing future system and process
evaluation, testing and remediation required to comply with future management
assessment and auditor attestation requirements.
Management
must report on, and our independent registered public accounting firm must
attest to, our internal control over financial reporting as required by
Section 404 of SOX, within the time frame required by Section 404. We
may encounter unexpected delays in satisfying those requirements. Accordingly,
we cannot be certain about the timely completion of our evaluation, testing and
remediation actions or the impact that these activities will have on our
operations. We also expect to incur ongoing expenses and diversion of
management’s time as a result of performing ongoing system and process
evaluations and the testing and remediation required to comply with management’s
assessment and auditor attestation requirements. If we are not able to timely
comply with the requirements set forth in Section 404 in future periods, we
might be subject to sanctions or investigation by the regulatory authorities.
Any such action could adversely affect our business or financial
results.
We
may experience additional volatility in our operating results as a result of our
periodic evaluation of our goodwill and deferred tax assets.
We
have recorded significant goodwill and deferred tax asset balances that are
subject to periodic evaluation of either impairment or realizability evaluations
under U.S. Generally Accepted Accounting Principles. Such evaluations are based
on factors including our future profitability and market value. As a result, if
we experience significant declines in those measurements, these assets could be
subject to impairment or write-off, which would result in additional volatility
to our operating results.
|
PROPERTIES
|
Our
headquarters are located in offices that are approximately 25,000 square feet in
Cupertino, California pursuant to an office lease expiring in December 2013. We
also lease office space in Bedford, New Hampshire. Outside of the United States,
we have offices in the greater metropolitan areas of London, Amsterdam, Munich,
and Beijing. We believe our existing facilities meet our current needs and that
we will be able to obtain additional commercial space as needed.
|
LEGAL
PROCEEDINGS
|
IPO
Laddering
Beginning
in July 2001, the Company and certain of its officers and directors
(“Individuals”) were named as defendants in a series of class action stockholder
complaints filed in the United States District Court for the Southern District
of New York, now consolidated under the caption “In re Chordiant Software, Inc.
Initial Public Offering Securities Litigation, Case No. 01-CV-6222.” In the
amended complaint, filed in April 2002, the plaintiffs allege that the Company,
the Individuals, and the underwriters of the Company’s initial public offering
(“IPO”), violated Section 11 of the Securities Act of 1933, as amended
(“Securities Act”), and Section 10(b) of the Securities Exchange Act of 1934, as
amended (“Exchange Act”), based on allegations that the Company’s registration
statement and prospectus failed to disclose material facts regarding the
compensation to be received by, and the stock allocation practices of, the
Company’s IPO underwriters. The complaint also contains claims against the
Individuals for control person liability under Securities Act Section 15 and
Exchange Act Section 20. The plaintiffs seek unspecified monetary damages and
other relief. Similar complaints were filed in the same court against hundreds
of other public companies that conducted IPO’s of their common stock in the late
1990’s or in the year 2000 (collectively, the “IPO Lawsuits”).
On
February 25, 2009, liaison counsel for plaintiffs informed the district court
that a settlement of the IPO Lawsuits had been agreed to in principle, subject
to formal approval by the parties and preliminary and final approval by the
court. On April 2, 2009, the parties submitted a tentative settlement agreement
to the court and moved for preliminary approval thereof. On June 11, 2009, the
Court granted preliminary approval of the tentative settlement, ordered that
Notice of the settlement be published and mailed, and set a Final Fairness
Hearing for September 10, 2009. On October 6, 2009, the District Court certified
the settlement class in each IPO Case and granted final approval of the
settlement. On or about October 23, 2009, three shareholders filed a Petition
for Permission To Appeal Class Certification Order, challenging the District
Court’s certification of the settlement classes. Between October 29 and November
2, 2009, a number of shareholders also filed direct appeals, objecting to final
approval of the settlement. Similar petitions and direct appeals may
be filed by other shareholders. If the settlement is affirmed on appeal, the
settlement will
result in the dismissal of all claims against the Company and its officers and
directors with prejudice, and the Company’s pro rata share of the settlement
fund will be fully funded by insurance.
Yue
vs. Chordiant Software, Inc.
On
January 2, 2008, the Company and certain of its officers and one other employee
were named in a complaint filed in the United States District Court for the
Northern District of California by Dongxiao Yue under the caption Dongxiao Yue
v. Chordiant Software, Inc. et al. Case No. CV 08-0019 (N.D. Cal.). The
complaint alleged that the Company’s Marketing Director (“CMD”) software product
infringed copyrights in certain software referred to as the “PowerRPC software,”
copyrights that had been owned by Netbula LLC and assigned to Mr. Yue, the sole
employee and owner of Netbula. The alleged infringement included (a)
distributing more copies of the PowerRPC software than had originally been
authorized in a run time license Netbula granted to Chordiant Software, Intl.,
(b) infringement of a software developer kit (“SDK”) by making copies of the SDK
in excess of those that had been licensed by Netbula, (c) making unauthorized
derivative works of the SDK, (d) unauthorized distribution of PowerRPC for
products operating on the Windows Vista platform, and (e) unauthorized
distribution of PowerRPC for server based products. Plaintiffs also alleged that
the license Netbula granted to Chordiant Software, Int’l Ltd. should not be
construed to authorize uses by its parent company, Chordiant Software, Inc.
Plaintiffs sought unspecified monetary damages, disgorgement of profits, and
injunctive relief according to proof. On February 5, 2008, the Company and its
officers and employees filed a motion to dismiss the complaint for failure to
state a claim upon which relief could be granted, and as to lack of personal
jurisdiction as to one employee. On July 23, 2008, the Court issued an order
that (1) denied plaintiffs’ motion to disqualify counsel; (2) granted one
employee’s motion to dismiss for lack of personal jurisdiction, with prejudice,
and (3) granted the Company’s motion to dismiss, ruling that Mr. Yue’s company,
Netbula LLC, is the real party in interest and must appear through counsel. The
Court ruled that Netbula LLC could file an amended complaint within 45 days and
join Mr. Yue as an individual plaintiff at that time.
On
September 9, 2008, plaintiffs Dongxiao Yue and Netbula LLC filed a First Amended
Complaint asserting four causes of action relating to the Company’s alleged
unauthorized use and distribution of plaintiffs’ PowerRPC
software: claims for copyright infringement, unfair competition, and
“accession and confusion of property” against the Company, and a claim for
vicarious copyright infringement against the Company’s Chief Executive Officer
and its former Vice President, General Counsel and Secretary (the “individual
defendants”).
On
September 20, 2008, the parties filed a stipulation allowing plaintiffs to file
a Second Amended Complaint asserting the two causes of action for copyright
infringement and vicarious copyright infringement, but not including the unfair
competition and accession and confusion claims. The Second Amended Complaint
sought unspecified monetary damages, disgorgement of profits, and injunctive
relief according to proof. On November 10, 2008, the Company answered the
complaint and asserted various affirmative defenses, including that the
plaintiffs’ claims are barred by the existence of an express or implied license
from the plaintiffs. On March 2, 2009, the Company filed a motion for summary
judgment based on this defense. On July 9, 2009, the Court found triable issues
about whether the Company held a license and accordingly denied the Company’s
motion for summary judgment.
On
November 10, 2008, the individual defendants filed a motion to dismiss on
grounds that the plaintiffs failed to state a claim as to them. On March 20,
2009, the Court granted the motion to dismiss with leave for plaintiffs to amend
their complaint. Plaintiffs filed a Third Amended Complaint on April 6, 2009,
and the Company and individual defendants answered on April 23,
2009.
On
May 29, 2009, as stipulated by the parties, the Court allowed plaintiffs to file
a Fourth Amended Complaint to include allegations about the Company’s use in CMD
of a different, additional Netbula product, an implementation of ONC RPC for
Java. Plaintiffs filed the Fourth Amended Complaint on May 29, 2009, and
the Company and the individual defendants answered on June 15,
2009.
Also
in its May 29, 2009 order, the Court allowed discovery on all issues to
proceed, set the close of discovery for October 30, 2009, and set the
deadline for dispositive motions for December 14, 2010.
On
September 24, 2009, the Court issued a trial scheduling order, with jury
selection set for April 6, 2010, trial sessions on April 7-9 and
April 13-16, arguments on April 20, 2010, and jury deliberation on
April 21-23, 2010. The Court also set a final pretrial conference for
March 22, 2010.
On
October 30, 2009, both fact and expert discovery closed, although Plaintiffs and
the Company each have pending motions to compel further discovery, with hearings
set for November 17 and December 15, 2009.
On
November 4, 2009, the parties stipulated to the dismissal, with prejudice, of
the Company’s Chief Executive Officer from the case. On November 9, 2009, the
Court ordered the dismissal of the Company’s Chief Executive Officer, leaving
only one remaining individual defendant, the Company’s former general
counsel.
On
November 9, 2009, Plaintiffs filed a motion for partial summary judgment as to
liability for copyright infringement of Plaintiffs’ implementation of ONC RPC
for Java. Also on November 9, 2009, the Company filed a motion for summary
judgment based on the Company’s rights to copy and distribute software under
Plaintiffs’ licensing agreements. The Company also moved for summary judgment as
to Plaintiffs’ ineligibility for statutory damages or attorney fees. The
remaining individual defendant filed a motion for summary judgment as to
vicarious infringement. All of these pending summary judgment motions are set to
be heard on December 14, 2009.
The
Company cannot predict the outcome or provide an estimate of any possible
losses. The Company will continue to vigorously defend itself against the claims
in these actions.
This
action may divert the efforts and attention of our management and, if determined
adversely to us, could have a material impact on our business, results of
operations, financial condition or cash flows.
The
Company, from time to time, is also subject to various other claims and legal
actions arising in the ordinary course of business. The ultimate disposition of
these various other claims and legal actions is not expected to have a material
effect on our business, financial condition, results of operations or cash
flows. However, litigation is subject to inherent uncertainties.
|
SUBMISSION
OF MATTERS TO A VOTE OF SECURITY
HOLDERS
|
None.
|
MARKET
FOR REGISTRANT’S COMMON EQUITY, RELATED STOCKHOLDER MATTERS AND ISSUER
PURCHASES OF EQUITY SECURITIES
|
Our
common stock is traded on the Nasdaq Global Market under the symbol “CHRD.” The
following table sets forth the range of high and low per share sales prices of
our common stock as reported for each period indicated:
|
High
|
Low
|
||||||
|
Year
Ended September 30, 2009
|
|||||||
|
First
Quarter (October 1 - December 31)
|
$
|
4.75
|
$
|
2.15
|
|||
|
Second
Quarter (January 1 - March 31)
|
$
|
3.19
|
$
|
2.08
|
|||
|
Third
Quarter (April 1 - June 30)
|
$
|
4.24
|
$
|
2.93
|
|||
|
Fourth
Quarter (July 1 - September 30)
|
$
|
4.17
|
$
|
3.51
|
|||
|
Year
Ended September 30, 2008
|
|||||||
|
First
Quarter (October 1 - December 31)
|
$
|
16.60
|
$
|
7.75
|
|||
|
Second
Quarter (January 1 - March 31)
|
$
|
9.00
|
$
|
5.69
|
|||
|
Third
Quarter (April 1 - June 30)
|
$
|
6.42
|
$
|
4.55
|
|||
|
Fourth
Quarter (July 1 - September 30)
|
$
|
6.28
|
$
|
4.50
|
|||
As
of November 1, 2009, there were approximately 78 holders of record of our common
stock who together held approximately 254,117 shares of our common stock. The
remainder of our outstanding shares is held by brokers and other institutions on
behalf of stockholders. We have never paid or declared any cash dividends and do
not intend to pay dividends for the foreseeable future. We currently expect to
retain working capital for use in the operation and expansion of our business
and therefore do not anticipate paying any cash dividends.
In
response to the Securities and Exchange Commission’s or SEC’s adoption of Rule
10b5-1 under the Securities Exchange Act of 1934, we approved amendments to our
insider trading policy on July 20, 2001 to permit our directors, executive
officers and certain key employees to enter into trading plans or arrangements
for systematic trading in our securities. As of September 30, 2009, the Company
had no directors or executive officers who had any such active trading plans. We
anticipate that, as permitted by Rule 10b5-1 and our insider trading policy,
some or all of our directors, executive officers and employees may establish
trading plans at some date in the future.
Issuer
Purchases of Equity Securities
None.
STOCK
PERFORMANCE GRAPH AND CUMULATIVE TOTAL RETURN
The
following graph shows the five-year cumulative total stockholder return of an
investment of $100 in cash on September 30, 2004 for:
|
(i)
|
|
Our
common stock;
|
|
(ii)
|
|
The
Nasdaq Composite Index;
|
|
(iii)
|
|
The
Standard & Poor’s Application Software
Index.
|
Historic
stock price performance is not necessarily indicative of future stock price
performance.
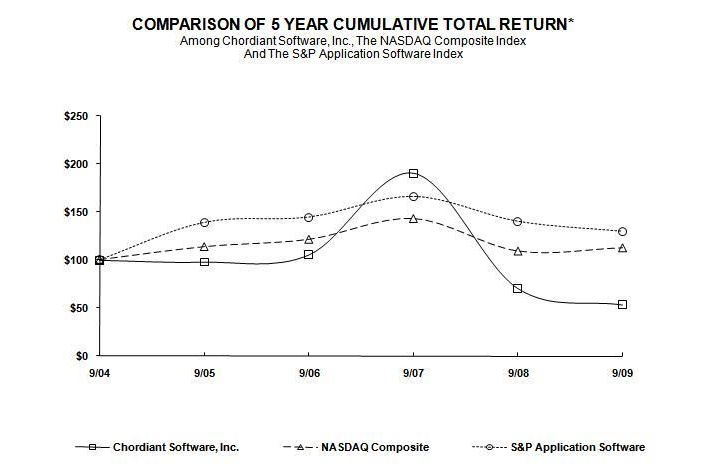
*$100
invested on 9/30/04 in stock or index, including reinvestment of dividends.
Fiscal year ending September 30.
|
9/04
|
9/05
|
9/06
|
|
9/07
|
9/08
|
9/09
|
|||||||||||
|
Chordiant
Software, Inc.
|
$
|
100.00
|
$
|
97.94
|
$
|
105.50
|
$
|
190.52
|
$
|
70.52
|
$
|
53.47
|
|||||
|
NASDAQ
Composite
|
$
|
100.00
|
$
|
113.78
|
$
|
121.50
|
$
|
143.37
|
$
|
109.15
|
$
|
112.55
|
|||||
|
S&P
Application Software
|
$
|
100.00
|
$
|
138.95
|
$
|
144.51
|
$
|
166.02
|
$
|
140.04
|
$
|
129.64
|
|||||
|
SELECTED
FINANCIAL DATA
|
We
derived the Consolidated Statement of Operations data for the years ended
September 30, 2009, 2008 and 2007 and the Consolidated Balance Sheet data at
September 30, 2009 and 2008 from our audited Consolidated Financial Statements
and Notes thereto appearing in this Form 10-K. We derived the Consolidated
Statement of Operations data for the years ended September 30, 2006 and 2005 and
the Consolidated Balance Sheet data at September 30, 2007, 2006, and 2005 from
Selected Financial Data contained in our 2008 Annual Report on Form 10-K. The
following selected financial data set forth below is not necessarily indicative
of results of future operations, and should be read in conjunction with Item 7,
“Management’s Discussion and Analysis of Financial Condition and Results of
Operations” and the Consolidated Financial Statements and related notes thereto
included in Item 8 of this Annual Report on Form 10-K to fully understand
factors that may affect the comparability of the information presented
below.
|
Years
Ended September 30,
|
|||||||||||||||||||
|
2009
|
2008
|
2007
|
2006
|
2005
|
|||||||||||||||
|
(amounts
in thousands, except per share data)
|
|||||||||||||||||||
|
Consolidated
Statement of Operations Data:
|
|||||||||||||||||||
|
Revenues
|
$
|
77,462
|
$
|
112,964
|
$
|
124,547
|
$
|
97,536
|
$
|
83,725
|
|||||||||
|
Net
income (loss)
|
(10,764
|
)
|
1,065
|
6,028
|
(16,001
|
)
|
(19,865
|
)
|
|||||||||||
|
Net
income (loss) per share—basic
|
(0.36
|
)
|
0.03
|
0.19
|
(0.51
|
)
|
(0.67
|
)
|
|||||||||||
|
Net
income (loss) per share—diluted
|
$
|
(0.36
|
)
|
$
|
0.03
|
$
|
0.18
|
$
|
(0.51
|
)
|
$
|
(0.67
|
)
|
||||||
|
Weighted
average shares used in computing net income (loss) per
share—basic
|
30,067
|
31,658
|
32,425
|
31,073
|
29,780
|
||||||||||||||
|
Weighted
average shares used in computing net income (loss) per
share—diluted
|
30,067
|
31,957
|
33,261
|
31,073
|
29,780
|
||||||||||||||
|
As
of September 30,
|
|||||||||||||||||||
|
2009
|
2008
|
2007
|
2006
|
2005
|
|||||||||||||||
|
(amounts
in thousands)
|
|||||||||||||||||||
|
Consolidated
Balance Sheet Data:
|
|||||||||||||||||||
|
Cash,
cash equivalents, and marketable securities
|
$
|
49,863
|
$
|
55,516
|
$
|
90,146
|
$
|
45,278
|
$
|
38,546
|
|||||||||
|
Working
capital
|
31,730
|
37,887
|
56,447
|
22,323
|
23,733
|
||||||||||||||
|
Total
assets
|
101,309
|
124,700
|
164,815
|
111,503
|
107,250
|
||||||||||||||
|
Current
and long term portion of capital lease obligations
|
—
|
—
|
—
|
95
|
309
|
||||||||||||||
|
Short-term
and long-term deferred revenue
|
37,961
|
46,334
|
67,982
|
29,505
|
26,197
|
||||||||||||||
|
Stockholders’
equity
|
$
|
52,013
|
$
|
59,852
|
$
|
73,361
|
$
|
57,225
|
$
|
65,157
|
|||||||||
Effective
October 1, 2005, the Company adopted a statement issued by Financial Accounting
Standards Board which requires the measurement and recognition of compensation
expense for all shared based payment awards be based on estimated fair value.
This is more fully described in Note 2 to the Consolidated Financial Statements
contained in this Annual report.
Safe
Harbor
The
following discussion and analysis contains forward-looking statements. These
statements are based on our current expectations, assumptions, estimates and
projections about our business and our industry, and involve known and unknown
risks, uncertainties and other factors that may cause our or our industry’s
results, levels of activity, performance or achievement to be materially
different from any future results, levels of activity, performance or
achievements expressed or implied in or contemplated by the forward-looking
statements. Words such as “believe,” “anticipate,” “expect,” “intend,” “plan,”
“will,” “may,” “should,” “estimate,” “predict,” “guidance,” “potential,”
“continue” or the negative of such terms or other similar expressions, identify
forward-looking statements. Our actual results and the timing of events may
differ significantly from those discussed in the forward-looking statements as a
result of various factors, including but not limited to, those discussed in Item
1A of this Form 10-K under the caption “Risk Factors” and those discussed
elsewhere in this Annual Report and in our other filings with the Securities and
Exchange Commission. Chordiant undertakes no obligation to update any
forward-looking statement to reflect events after the date of this
report.
Executive
Overview
We
generate substantially all of our revenues from the insurance, healthcare,
telecommunications, financial services and retail markets. Our customers
typically fund purchases of our software and services out of their lines of
business and information technology budgets. As a result, our revenues are
heavily influenced by our customers’ long-term business outlook and willingness
to invest in new enterprise information systems and business
applications.
Our
business, like other businesses, has been impacted and continues to be impacted
by the global economic recession. Unprecedented market conditions include
illiquid credit markets, volatile equity markets, and dramatic fluctuations in
foreign currency rates and economic recession, all of which have adversely
impacted our business.
Our
operations and performance depend on our customers having adequate resources to
purchase our products and services. The unprecedented turmoil in the credit
markets and the global economic downturn generally adversely impacts our
customers and potential customers. These economic conditions have not shown
significant improvement despite government intervention globally, and may remain
volatile and uncertain for the foreseeable future. Customers may alter their
purchasing activities in response to a lack of credit, economic uncertainty and
concern about the stability of markets in general, and these customers may
reduce, delay or terminate purchases of our products and services or other sales
activities that affect purchases of our products and services. If we are unable
to adequately respond to changes in demand resulting from unfavorable economic
conditions, our financial condition and operating results may be materially and
adversely affected.
Several
of our current and prior customers have recently merged with others, been forced
to raise significant levels of new capital, or received funds and/or equity
infusions from regulators or governmental entities. This list of companies is
extensive and includes Wachovia Corporation, AIG, Halifax Bank of Scotland,
Royal Bank of Scotland, Barclays, and Lloyds. The impact of these transactions
on Chordiant’s near term business is uncertain. Customers who have recently
reorganized, merged or face new regulations may delay or terminate their
software purchasing decisions, and an acquired or merged entity may lose the
ability to make such purchasing decisions, resulting in declines in our
bookings, revenues and cash flows. Alternatively, merged customers may expand
the use of our software across the larger entity resulting in opportunities for
us to sell additional software and services.
For
the fiscal year ended September 30, 2009, we recorded revenue of $77.5 million.
We incurred a net loss of $10.8 million and ended the fiscal year with $49.9
million in cash and cash and cash equivalents as compared to $55.5 million for
fiscal year ended September 30, 2008. We used $3.8 million of cash in operating
activities compared to $13.7 million of cash in the prior year.
Total
revenue for the fiscal year ended September 30, 2009 decreased 31% to $77.5
million from $113.0 million in the prior year. The decrease in revenue included
a decline in license revenue, decreasing $11.6 million as the Company had fewer
license transactions. Service revenue decreased $23.9 million from prior year.
The decrease in service revenue was primarily composed of a decrease of $14.5
million from consulting revenue, $6.0 million associated with support and
maintenance revenue, $1.1 million in training revenue and $2.3 million in
expense reimbursement revenue.
Software
Industry Consolidation and Possible Increased Competition
Our
business strategy includes pursuing opportunities to grow our business, both
through internal growth and through merger, acquisition and technology and other
asset transactions. To implement this strategy, we may be involved in merger and
acquisition activity and additional technology and asset purchase transactions
of other software companies.
The
enterprise software industry continues to undergo consolidation in sectors of
the software industry in which we operate. IBM, SAP, Oracle and Sun Microsystems
have made numerous acquisitions in the industry and Oracle has entered into an
agreement to acquire Sun Microsystems, which transaction is subject to certain
regulatory approvals. While we do not believe that the companies acquired by
IBM, SAP and Oracle have been significant competitors of Chordiant in the past,
these acquisitions may indicate that we may face increased competition from
larger and more established entities in the future.
Financial
Trends
Backlog. As of September 30,
2009 and 2008, we had approximately $43.5 million and $70.1 million in backlog,
respectively, which we define as contractual commitments made by our customers
through purchase orders or contracts. Backlog is comprised of:
|
|
•
|
software
license orders for which the delivered products have not been accepted by
customers or have not otherwise met all of the required criteria for
revenue recognition. This component includes billed amounts classified as
deferred revenue;
|
|
|
•
|
contractual
commitments received from customers through purchase orders or contracts
that have yet to be delivered;
|
|
|
•
|
deferred
revenue from customer support contracts;
and
|
|
|
•
|
consulting
service orders representing the unbilled remaining balances of consulting
contracts not yet completed or delivered, plus deferred consulting revenue
where we have not otherwise met all of the required criteria for revenue
recognition. Consulting service orders that have expired are excluded from
backlog.
|
The
$26.6 million decline in total backlog over the past fiscal year is due to
declines of approximately $15.1 million, $5.4 million and $6.1 million in the
areas of software licenses, customer support contracts and professional services
consulting contracts, respectively. Backlog has declined sequentially for six of
the past seven fiscal quarters. The declines in backlog are due to revenue on
previously signed transactions being recognized at a faster pace than new
transactions are being consummated. Each category of backlog has also been
impacted by recent foreign exchange rate changes, as significant portions of the
underlying balances are denominated in Euros or in Pounds Sterling.
The
decline in backlog and the associated deferred revenue balances will adversely
affect revenues in future periods and our ability to forecast future revenues
will be diminished. Because our backlog has declined, the financial results of
future periods will be more dependent upon the signing of new transactions.
Accordingly, the level of future revenues will be less predictable. If average
quarterly aggregate bookings remain at the $13.7 million levels achieved during
the past twelve months, future losses will be incurred unless operating expenses
are further reduced.
With
respect to the decline in the backlog of professional service consulting
contracts, as some customers recently delayed or canceled projects, statements
of work for professional services either expired unutilized or were canceled.
For the fiscal year ended September 30, 2009 these items aggregated $5.8 million
and were removed from backlog at the date of the expiration or cancellation.
While additional significant cancelations are not contemplated, such events
could cause further declines.
Backlog
at September 31, 2008 included approximately $12.6 million of licenses and
support balances relating to a large telecommunications customer commitment, the
majority of which was recognized during the fiscal year. Accordingly, the
balance of backlog may continue to decline in the near term if bookings are not
sufficient to offset the amounts recognized as revenue.
Backlog
is not necessarily indicative of revenues to be recognized in a specified future
period. There are many factors that would impact Chordiant’s conversion of
backlog as recognizable revenue, such as Chordiant’s progress in completing
projects for its customers, Chordiant’s customers’ meeting anticipated schedules
for customer-dependent deliverables and customers increasing the scope or
duration of a contract causing license revenue to be deferred for a longer
period of time.
A
significant portion of our revenues have been derived from large customer
transactions. For some of these transactions, the associated professional
services provided to the customer can span over a period greater than one year.
If the services delivery period is over a prolonged period of time, it will
cause the associated backlog of services to be recognized as revenue over a
similar period of time. Chordiant provides no assurances that any portion of its
backlog will be recognized as revenue during any fiscal year or at all, or that
its backlog will be recognized as revenues in any given period. In addition, it
is possible that customers from whom we expect to derive revenue from backlog
will default and, as a result, we may not be able to recognize expected revenue
from backlog.
Implementation by Third
Parties. Over time, as our products mature and system integrators become
more familiar with our products, our involvement with implementations has
diminished on some projects. If this trend continues to evolve, certain
agreements with customers may transition from a contract accounting model to a
more traditional revenue model whereby revenues are recorded upon
delivery.
Service Revenues. Service
revenues as a percentage of total revenues were 71%, 70%, and 57% for the years
ended September 30, 2009, 2008, and 2007, respectively. We expect that service
revenues will represent between 60% and 75% of our total revenues in the
foreseeable future.
Revenues from International
Customers versus North America. For all periods presented, revenues were
principally derived from customer accounts in North America and Europe. For the
fiscal years ended September 30, 2009, 2008, and 2007, international revenues
were $50.5 million, $54.2 million, and $58.8 million or approximately 65%, 48%,
and 47% of our total revenues, respectively. In future periods, the Company
plans to pursue revenue opportunities in several emerging markets including
Eastern Europe, Russia, China, and India. We believe that international revenue
may represent a larger portion of our total revenues if our expansion into
emerging markets is successful.
For
the fiscal years ended September 30, 2009, 2008, and 2007, North America
revenues were $27.0 million, $58.8 million, and $65.7 million or approximately
35%, 52%, and 53% of our total revenues, respectively. The decrease in the
fiscal year ended 2009 from 2008 was primarily due to a fewer number of
transactions at lower average prices. We believe North America revenues will
continue to represent a significant portion of our total revenues in the
foreseeable future.
Gross Margins. Management
focuses on license and service gross margins in evaluating our financial
condition and operating performance. Gross margins on license revenues were 98%,
97%, and 97% for the fiscal years ended September 30, 2009, 2008, and 2007,
respectively. The increase in margin for the fiscal year ended September 30,
2009 is primarily a function of the fixed periodic amortization costs associated
with a capitalized software project. We fully amortized these costs in fiscal
year 2008. We expect license gross margins on current products to range from 96%
to 98% in the foreseeable future. The margin will fluctuate with the mix of
products sold. Historically, the enterprise solution products have higher
associated third party royalty expense than the marketing solution products and
decision management products.
Gross
margins on service revenues were 60%, 57%, and 57% for the fiscal years ended
September 30, 2009, 2008, and 2007, respectively. We expect that gross margins
on service revenues to range between 50% and 60% in the foreseeable
future.
Costs Related to Compliance with the
Sarbanes-Oxley Act of 2002. In addition to audit fees, significant
professional service expenses are included in general and administrative costs
relating to efforts to comply with the Sarbanes-Oxley Act of 2002. For the
fiscal years ended September 30, 2009, 2008, and 2007, these costs were $0.4
million, $0.5 million, and $1.0 million. While these costs are expected to
continue into the next fiscal year, the decline in amount and timing of the
costs through fiscal year 2010 is uncertain as compared to the costs incurred
for the year ended September 30, 2009.
Reductions in Workforce. In
October 2008, we initiated a restructuring plan intended to align our resources
and cost structure with expected future revenues. The restructuring plan
included reductions in headcount and third party consultants across all
functional areas in both North America and Europe. The restructuring plan
included a reduction of approximately 13% of our permanent workforce. A
significant portion of the positions eliminated were in North
America.
As
a result of the cost-cutting measures, we recorded a pre-tax cash restructuring
charge in the first quarter of fiscal year 2009, of approximately $0.9 million,
including $ 0.8 million for severance costs and $0.1 million for other contract
termination costs. We paid the severance costs and other contract termination
costs in the first quarter of fiscal year 2009.
On
May 1, 2008, we implemented a reduction of approximately 10% of our workforce.
We reduced our headcount across all functions of the organization. We
reallocated resources in support of growth opportunities in emerging markets as
well as adding headcount in revenue generating areas such as sales and
alliances. We incurred approximately $0.5 million in expenses in the third
quarter of fiscal year 2008 in connection with this reduction of force. As these
costs did not meet the
criteria
of one of the standards issued by Financial Accounting Standards Board or FASB
to qualify as restructuring expenses, the expenses were charged as operating
expenses to the respective functional areas.
In
October 2006, the Company initiated a restructuring plan intended to align its
resources and cost structure with expected future revenues. The restructuring
plan included a balancing of services resources worldwide, an elimination of
duplicative functions internationally, and a shift in the U.S. field
organization toward a focus on domain-based sales and pre-sales teams. The
restructuring plan included an immediate reduction in positions of slightly more
than 10% of the Company's workforce, consolidation of our European facilities,
and the closure of our France office. A majority of the positions eliminated
were in Europe.
We
recorded a pre-tax cash restructuring expense of $6.1 million as calculated
using the net present value of the related costs. The expense was composed of
costs for severance and exiting excess facilities. During the three months ended
March 31, 2007, we incurred an additional charge of $0.1 million for employee
severance costs associated with the closure of our France office. Also during
the three months ended March 31, 2007, we negotiated an early termination of the
France office lease associated with its closure, resulting in a $0.2 million
reduction in the excess facility liability. This reduction was recorded as an
offset to restructuring expense in the period. In quarter ended December 31,
2007, we negotiated a break clause in the lease allowing for an early
termination of the United Kingdom facility which released us from any future
rent liabilities subsequent to January 2008. All termination payments have now
been made.
In
July 2005, we undertook an approximate 10% reduction in our workforce. In
connection with this action, we incurred a one-time cash expense of
approximately $1.1 million in the fourth quarter ended September 30, 2005 for
severance benefits. During the three months ended March 31, 2007, the Company
incurred an additional charge of less than $0.1 million for additional severance
expense for an employee located in France. During the three months ended
December 31, 2008, the Company reversed the charge as the Company was not
required to pay the severance expense to the employee. All severance benefits
have now been paid.
During
fiscal year 2002, we restructured several areas of the Company to reduce
expenses and improve revenues. As part of this restructuring, we closed an
office facility in Boston, Massachusetts and recorded an expense associated with
the long-term lease which expires in January 2011. During the three months ended
March 31, 2007, we executed a sublease with a sub-lessee for the remaining term
of our lease at a rate lower than that which was forecasted when the original
restructuring expense was recorded in 2002. This change in estimate resulted in
a $0.4 million restructuring expense for the fiscal year ended September 30,
2007. If the sub-lessee of the facility were to default on their payments to the
Company, further adjustments to restructuring expense would be
required.
Income Taxes. During the
fiscal year ended September 30, 2009, we recognized $3.4 million of non-cash
deferred tax expense related to taxable income in the United Kingdom. It is
expected that we will recognize a total of approximately $1.7 million of
non-cash deferred tax expense during fiscal year 2010. We expect the deferred
tax expense to be reduced in future years.
Effective
October 1, 2007, the Company adopted a FASB guidance on tax provisions and
reclassified $0.2 million of gross unrecognized tax benefits to Other
liabilities—non-current in our Consolidated Balance Sheets. As of September 30,
2009, the Company had $1.0 million of gross unrecognized tax benefits. As of
September 30, 2009, the Company cannot make a reasonably reliable estimate of
the period in which these liabilities may be settled with the respective tax
authorities. See Note 11 to the Consolidated Financial Statements for additional
information.
Past Results may not be Indicative
of Future Performance. We believe that period-to-period comparisons of
our operating results should not be relied upon as indicative of future
performance. Our prospects must be considered given the risks, expenses and
difficulties frequently encountered by companies in new and rapidly evolving
businesses. There can be no assurance we will be successful in addressing these
risks and difficulties. Moreover, we may not achieve or maintain profitability
in the future.
Critical
Accounting Estimates
Our
discussion and analysis of our financial condition and results of operations are
based upon our Consolidated Financial Statements, which have been prepared in
accordance with Generally Accepted Accounting Principles or GAAP in the United
States. The preparation of these financial statements requires us to make
estimates and judgments that affect the reported amounts of assets, liabilities,
revenues and expenses, and related disclosure of contingent assets and
liabilities.
On
an on-going basis, we evaluate the estimates, including those related to our
allowance for doubtful accounts, valuation of stock-based compensation,
valuation of goodwill and intangible assets, valuation of deferred tax assets,
restructuring expenses, contingencies, vendor specific objective evidence, or
VSOE, of fair value in multiple element
arrangements
and the estimates associated with the percentage-of-completion method of
accounting for certain of our revenue contracts. We base our estimates on
historical experience and on various other assumptions that are believed to be
reasonable under the circumstances, the results of which form the basis for
making judgments about the carrying values of assets and liabilities and the
recognition of revenue and expenses that are not readily apparent from other
sources. Actual results may differ from these estimates under different
assumptions or conditions.
We
believe the following critical accounting judgments and estimates are used in
the preparation of our Consolidated Financial Statements:
|
|
•
|
Revenue
recognition, including estimating the total estimated time required to
complete sales arrangements involving significant implementation or
customization essential to the functionality of our
products;
|
|
|
•
|
Estimating
valuation allowances and accrued liabilities, specifically the allowance
for doubtful accounts, and assessment of the probability of the outcome of
our current litigation;
|
|
|
•
|
Stock-based
compensation expense;
|
|
|
•
|
Accounting
for income taxes;
|
|
|
•
|
Valuation
of long-lived and intangible assets and
goodwill;
|
|
|
•
|
Restructuring
expenses; and
|
|
|
•
|
Determining
functional currencies for the purposes of consolidating our international
operations.
|
Revenue Recognition. We
derive revenues from licenses of our software and related services, which
include assistance in implementation, customization and integration,
post-contract customer support or PCS, training and consulting. The amount and
timing of our revenue is difficult to predict and any shortfall in revenue or
delay in recognizing revenue could cause our operating results to vary
significantly from quarter to quarter and could result in operating losses. The
accounting rules related to revenue recognition are complex and are affected by
interpretation of the rules and an understanding of industry practices, both of
which are subject to change. Consequently, the revenue recognition accounting
rules require management to make significant estimates based on
judgment.
For
arrangements with multiple elements, we recognize revenue for services and PCS
based upon the fair value VSOE of the respective elements. The fair value VSOE
of the services element is based upon the standard hourly rates we charge for
the services when such services are sold separately. The fair value VSOE for
annual PCS is generally established with the contractual future renewal rates
included in the contracts, when the renewal rate is substantive and consistent
with the fees when support services are sold separately. When contracts contain
multiple elements and fair value VSOE exists for all undelivered elements, we
account for the delivered elements, principally the license portion, based upon
the “residual method” as prescribed by relevant accounting guidance on software
revenue recognition. In multiple element transactions where VSOE is not
established for an undelivered element, we recognize revenue upon the
establishment of VSOE for that element or when the element is
delivered.
At
the time we enter into a transaction, we assess whether any services included
within the arrangement related to significant implementation or customization
essential to the functionality of our products. For contracts for products that
do not involve significant implementation or customization essential to the
product functionality, we recognize license revenues when there is persuasive
evidence of an arrangement, the fee is fixed or determinable, collection of the
fee is probable and delivery has occurred as prescribed by relevant accounting
guidance on software revenue recognition. For contracts that involve significant
implementation or customization essential to the functionality of our products,
we recognize the license and professional consulting services revenue using
either the percentage-of-completion method or the completed contract
method.
The
percentage-of-completion method is applied when we have the ability to make
reasonably dependable estimates of the total effort required for completion
using labor hours incurred as the measure of progress towards completion. The
progress toward completion is measured based on the “go-live” date. We define
the “go-live” date as the date the essential product functionality has been
delivered or the application enters into a production environment or the point
at which no significant additional Chordiant supplied professional service
resources are required. Estimates are subject to revisions as the contract
progresses to completion. We account for the changes as changes in accounting
estimates when the information becomes known. Information impacting estimates
obtained after the balance sheet date but before the issuance of
the
financial
statements is used to update the estimates. Provisions for estimated contract
losses, if any, are recognized in the period in which the loss becomes probable
and can be reasonably estimated. When we sell additional licenses related to the
original licensing agreement, revenue is recognized upon delivery if the project
has reached the go-live date, or if the project has not reached the go-live
date, revenue is recognized under the percentage-of-completion method. We
classify revenues from these arrangements as license and service revenue based
upon the estimated fair value of each element using the residual
method.
The
completed contract method is applied when we are unable to obtain reasonably
dependable estimates of the total effort required for completion. Under the
completed contract method, all revenue and related costs of revenue are deferred
and recognized upon completion.
For
product co-development arrangements relating to software products in development
prior to the consummation of the individual arrangements where we retain the
intellectual property being developed and intend to sell the resulting products
to other customers, license revenue is deferred until the delivery of the final
product, provided all other requirements of the guidance on software revenue
recognition are met. Expenses associated with these co-development arrangements
are normally expensed as incurred as they are considered to be research and
development costs that do not qualify for capitalization or
deferral.
Revenue
from subscription or term license agreements, which include software and rights
to unspecified future products or maintenance, is recognized ratably over the
term of the subscription period. Revenue from subscription or term license
agreements, which include software, but exclude rights to unspecified future
products and maintenance, is recognized upon delivery of the software if all
conditions of recognizing revenue have been met including that the related
agreement is non-cancelable, non-refundable and provided on an unsupported
basis.
For
transactions involving extended payment terms, we deem these fees not to be
fixed or determinable for revenue recognition purposes and revenue is deferred
until the fees become payable and due.
For
arrangements with multiple elements accounted for under the relevant accounting
guidance on revenue recognition where we determine we can account for the
elements separately and the fees are not fixed or determinable due to extended
payment terms, revenue is recognized in the following manner. If the undelivered
element is PCS, or other services, an amount equal to the estimated value of the
services to be rendered prior to the next payment becoming due is allocated to
the undelivered services. The residual of the payment is allocated to the
delivered elements of the arrangement.
For
arrangements with multiple elements accounted for under the relevant accounting
guidance where we determine we can account for the elements separately and the
fees are not fixed or determinable due to extended payment terms, revenue is
recognized in the following manner. Amounts are first allocated to the
undelivered elements included in the arrangement, as payments become due or are
received, the residual is allocated to the delivered elements.
We
recognize revenue for PCS ratably over the support period which ranges from one
to five years.
Our
training and consulting services revenues are recognized as such services are
performed on an hourly or daily basis for time and material contracts. For
consulting services arrangements with a fixed fee, we recognize revenue on a
percentage-of-completion method.
For
all sales we use either a signed license agreement or a binding purchase order
where we have a master license agreement as evidence of an arrangement. Sales
through our third party systems integrators are evidenced by a master agreement
governing the relationship together with binding purchase orders or order forms
on a transaction-by-transaction basis. Revenues from reseller arrangements are
recognized on the “sell-through” method, when the reseller reports to us the
sale of our software products to end-users. Our agreements with customers and
resellers do not contain product return rights.
We
assess collectability based on a number of factors, including past transaction
history with the customer and the credit-worthiness of the customer. We
generally do not request collateral from our customers. If we determine that the
collection of a fee is not probable, we recognize revenue at the time collection
becomes probable, which is generally upon the receipt of cash.
Allowance for Doubtful
Accounts. We must make estimates of the uncollectability of our accounts
receivables. We specifically analyze accounts receivable and analyze historical
bad debts, customer concentrations, customer credit-worthiness and current
economic trends when evaluating the adequacy of the allowance for doubtful
accounts. Generally, we require no collateral from our customers. Our gross
accounts receivable balance was $17.9 million (including
long-term
accounts
receivable of $0.9 million) with an allowance for doubtful accounts of $0.3
million as of September 30, 2009. Our gross accounts receivable balance was
$25.5 million with an allowance for doubtful accounts of $0.6 million as of
September 30, 2008. If the financial condition of our customers were to
deteriorate, resulting in an impairment of their ability to make payments,
additional allowances would be required. Based upon current economic conditions,
the Company has reviewed accounts receivable and has recorded allowances as
deemed necessary.
Probability of the outcome of our
current litigation. As discussed in Part I, Item 3 of this Form 10-K
under the heading “Legal Proceedings” and in Note 10, “Litigation” in Notes to
Consolidated Financial Statements, the Company is subject to various legal
proceedings and claims that arise in the ordinary course of business. In
accordance with GAAP, we record a liability when it is probable that a loss has
been incurred and the amount is reasonably estimable. There is significant
judgment required in both the probability determination and as to whether an
exposure can be reasonably estimated. In management’s opinion, we do not have a
potential liability related to any current legal proceedings and claims that
would individually or in the aggregate materially adversely affect its financial
condition or operating results. However, the outcomes of legal proceedings and
claims brought against us are subject to significant uncertainty. Should we fail
to prevail in any of these legal matters or should several of these legal
matters be resolved against us in the same reporting period, the operating
results of a particular reporting period could be materially adversely
affected.
Stock-based Compensation Expense.
We estimate the fair value of share-based payment awards on the date of
grant using the Black-Scholes model. The determination of the fair value of
shared-based payment awards on the date of grant using an option-pricing model
is affected by our stock price as well as assumptions regarding a number of
highly complex and subjective variables. These variables include, but are not
limited to the expected stock price volatility over the term of the awards, and
actual and projected employee stock option exercise behaviors.
We
used the trinomial lattice valuation technique to determine the assumptions used
in the Black-Scholes model. The trinomial lattice valuation technique was used
to provide better estimates of fair values and meet the fair value objectives of
the FASB standard on stock compensation. The expected term of options granted is
derived from historical data on employee exercises and post-vesting employment
termination behavior. The expected volatility is based on the historical
volatility of our stock.
As
stock-based compensation expense recognized in the Consolidated Statement of
Operations is based on awards ultimately expected to vest, it has been reduced
for estimated forfeitures. The standard on stock compensation requires
forfeitures to be estimated at the time of grant and revised, if necessary, in
subsequent periods if actual forfeitures differ from those estimates.
Forfeitures were estimated based on historical experience.
If
factors change and we employ different assumptions in the application of the
FASB standard in future periods, the compensation expense that we record under
the FASB standard may differ significantly from what we have recorded in the
current period. The estimated value of a stock option is most sensitive to the
volatility assumption. Based on the September 30, 2009 variables, it is
estimated that a change of 10% in either the volatility, expected life or
interest rate assumption would result in a corresponding 8%, 4% or 1% change,
respectively, in the estimated value of the option being valued using the
Black-Scholes model. See Note 12 to the Consolidated Financial Statements for
detailed information about stock-based compensation.
Accounting for Income Taxes.
As part of the process of preparing our Consolidated Financial Statements we are
required to estimate our income taxes in accordance with a FASB standard in each
of the jurisdictions in which we operate. This process involves estimating our
actual current tax exposure together with assessing temporary differences
resulting from differing treatment of items, such as deferred revenue, for tax
and accounting purposes. These differences result in deferred tax assets and
liabilities, which are included within our Consolidated Balance Sheets. We must
then assess the likelihood that our deferred tax assets will be recovered from
future taxable income and to the extent we believe that recovery is not likely,
we must establish a valuation allowance. To the extent we establish a valuation
allowance or increase this allowance in a period, we must include an expense
within the tax provision in the Consolidated Statement of
Operations.
At
September 30, 2009, we had $74.8 million in gross deferred tax assets (DTAs)
attributable principally to our net operating losses (NOLs) and to a lesser
extent temporary differences relating to deferred revenue. Prior to fiscal year
2008, we maintained a 100% valuation allowance on our DTAs because we have
previously been unable to conclude that it is more-likely-than-not that we will
realize the tax benefits of these DTAs. Based on recent operating results at the
subsidiary level and the reorganization of our intellectual property, our
current projections of disaggregated future taxable income have enabled us to
conclude that it is more-likely-than-not that as of September 30, 2009 we will
have future taxable income sufficient to realize $5.2 million of tax benefits
from our deferred tax assets, which consist of that portion of our net deferred
tax assets attributable to our NOLs and capital allowances residing in the
United Kingdom. On September 30, 2008, we had
released
(eliminated) the valuation allowance on our DTAs relating to the United Kingdom,
of which $9.5 million was recognized as an offsetting reduction to goodwill
(representing pre-acquisition NOLs). Beginning on October 1, 2009 through future
periods, we expect to continue incurring tax expense related to the United
Kingdom; however, to the extent that such tax expense is offset by the
utilization of NOLs and capital allowances, the recognition of this additional
tax expense will be a non-cash item.
The
remaining balance of gross deferred tax assets was generated in the U.S. With
respect to our U.S. generated DTAs, we have recorded a full valuation allowance
as the future realization of the tax benefit is not considered by management to
be more likely than not. Our estimate of future taxable income considers
available positive and negative evidence regarding our current and future
operations, including projections of income in various states and foreign
jurisdictions. We believe our estimate of future taxable income is reasonable;
however, it is inherently uncertain, and if our future operations generate
taxable income greater than projected, further adjustments to reduce the
valuation allowance are possible. Conversely, if we realize unforeseen material
losses in the future, or our ability to generate future taxable income necessary
to realize a portion of the net deferred tax asset is materially reduced,
additions to the valuation allowance could be recorded. At September 30, 2009,
the balance of the valuation allowance is approximately $69.6 million.
Effective
October 1, 2007, the Company adopted a FASB guidance on tax provisions that
prescribes a recognition threshold and measurement guidance for the financial
statement reporting of uncertain tax positions taken or expected to be taken in
a company’s income tax return. The application of this FASB guidance is
explained in Note 11 to the Consolidated Financial Statements.
Valuation of Long-lived and
Intangible Assets and Goodwill. We assess the impairment of identifiable
intangibles and long-lived assets whenever events or changes in circumstances
indicate that the carrying value may not be recoverable. Furthermore, we assess
the impairment of goodwill annually. Factors we consider important which could
trigger an impairment review include the following:
|
|
•
|
Significant
underperformance relative to expected historical or projected future
operating results;
|
|
|
•
|
Significant
changes in the manner of our use of the acquired assets or the strategy
for our overall business;
|
|
|
•
|
Significant
negative industry or economic
trends;
|
|
|
•
|
Significant
decline in our stock price for a sustained
period;
|
|
|
•
|
Market
capitalization declines relative to net book value;
and
|
|
|
•
|
A
current expectation that, more likely than not, a long-lived asset will be
sold or otherwise disposed of significantly before the end of its
previously estimated useful life.
|
When
one or more of the above indicators of impairment occurs we estimate the value
of long-lived assets and intangible assets to determine whether there is
impairment. We measure any impairment based on the projected discounted cash
flow method, which requires us to make several estimates including the estimated
cash flows associated with the asset, the period over which these cash flows
will be generated and a discount rate commensurate with the risk inherent in our
current business model. These estimates are subjective and if we made different
estimates, it could materially impact the estimated fair value of these assets
and the conclusions we reached regarding impairment. Recently, due to the
decline of our stock price, our market capitalization, and the general economic
climate we have assessed our long-lived assets and intangible assets and
determined that no impairment charge was necessary. At September 30, 2009, the
market capitalization of the Company exceeded the book value of the
Company.
We
are required to perform an impairment review of our goodwill balance on at least
an annual basis. This impairment review involves a two-step process as
follows:
Step
1—We compare the fair value of our reporting units to the carrying value,
including goodwill, of each of those units. For each reporting unit where the
carrying value, including goodwill, exceeds the unit’s fair value, we proceed on
to Step 2. If a unit’s fair value exceeds the carrying value, no further work is
performed and no impairment charge is necessary.
Step
2—We perform an allocation of the fair value of the reporting unit to our
identifiable tangible and non-goodwill intangible assets and liabilities. This
derives an implied fair value for the reporting unit’s goodwill. We then compare
the implied fair value of the reporting unit’s goodwill with the carrying amount
of the reporting unit’s goodwill. If the carrying amount of the reporting unit’s
goodwill is greater than the implied fair value of its goodwill, an impairment
charge would be recognized for the excess.
We
determined that we have one reporting unit. We completed a goodwill impairment
review for the period ended September 30, 2009 and performed Step 1 of the
goodwill impairment analysis required by a FASB standard on “Goodwill and Other
Intangible Assets”, and concluded that goodwill was not impaired as of September
30, 2009 using the methodology described above. Accordingly, Step 2 was not
performed. We will continue to test for impairment on an annual basis and on an
interim basis if an event occurs or circumstances change that would more likely
than not reduce the fair value of our reporting units below their carrying
amount.
Restructuring Expenses. In
the past several years, we have implemented cost-reduction plans as part of our
continued effort to streamline our operations to reduce ongoing operating
expenses. These plans resulted in restructuring expenses related to, among
others, the consolidation of excess facilities. These charges relate to
facilities and portions of facilities we no longer utilize and either seek to
terminate early or sublease. Cost to terminate contracts represents contract
termination costs related to the restructuring plan. Lease termination costs and
brokerage fees for the abandoned facilities were estimated for the remaining
lease obligations and were offset by estimated sublease income. Estimates
related to sublease costs and income are based on assumptions regarding the
period required to locate and contract with suitable sub-lessees and sublease
rates which can be achieved using market trend information analyses provided by
a commercial real estate brokerage retained by us. Each reporting period we
review these estimates and to the extent that these assumptions change due to
new agreements with landlords, new subleases with tenants, potential defaults on
existing subleases, or changes in the market, the ultimate restructuring
expenses for these abandoned facilities could vary by material amounts. See Note
6 to the Consolidated Financial Statement for detailed information regarding
restructuring expense.
Determining Functional Currencies
for the Purpose of Consolidation. We have several foreign subsidiaries
that together account for a significant portion of our revenues, expenses,
assets and liabilities.
In
preparing our Consolidated Financial Statements, we are required to translate
the financial statements of the foreign subsidiaries from the currency in which
they keep their accounting records, generally the local currency, into United
States dollars. This process results in exchange gains and losses which, under
the relevant accounting guidance are either included within the Consolidated
Statement of Operations or as a separate part of our net equity under the
caption “Accumulated Other Comprehensive Income.” Under the relevant accounting
guidance, the treatment of these translation gains or losses is dependent upon
our management’s determination of the functional currency of each subsidiary.
The functional currency is determined based on management’s judgment and
involves consideration of all relevant economic facts and circumstances
affecting the subsidiary. Generally, the currency in which the subsidiary
conducts a majority of its transactions, including billings, financing, payroll
and other expenditures would be considered the functional currency but any
dependency upon the parent and the nature of the subsidiary’s operations must
also be considered.
If
any subsidiary’s functional currency were deemed to be the local currency, then
any gain or loss associated with the translation of that subsidiary’s financial
statements would be included in cumulative translation adjustments. However, if
the functional currency were deemed to be the United States dollar then any gain
or loss associated with the translation of these financial statements would be
included within our Consolidated Statement of Operations. If we dispose of any
of our subsidiaries, any cumulative translation gains or losses would be
recognized in our Consolidated Statement of Operations. If we determine that
there has been a change in the functional currency of a subsidiary to the United
States dollar, any translation gains or losses arising after the date of change
would be included within our Consolidated Statement of Operations.
Based
on our assessment of the factors discussed above, we consider the relevant
subsidiary’s local currency to be the functional currency for each of our
international subsidiaries. Accordingly, foreign currency translation gains and
losses are included as part of Accumulated Other Comprehensive Income within our
Consolidated Balance Sheets for all periods presented.
The
magnitude of foreign currency gains or losses is dependent upon movements in the
exchange rates of the foreign currencies in which we transact business against
the United States dollar. These currencies include the United Kingdom Pound
Sterling, the Euro, the Canadian Dollar, and the Chinese Yuan. Any future
translation gains or losses could be significantly larger or smaller than those
reported in previous periods. In June 2009, a long term intercompany account
from the U.S. parent to the U.K. subsidiary in the original amount of $22.9
million was settled. The settlement of this long term intercompany account
resulted in a foreign currency translation gain which is classified as a
component of Accumulated Other Comprehensive Income in the September 30, 2009
Consolidated Balance Sheet. At September 30, 2009, approximately $15.7 million
of our cash and cash equivalents were held by our subsidiaries outside of the
United States as compared to $39.3 million at September 30,
2008.
Recent
Accounting Pronouncements
See
Note 3 to the Consolidated Financial Statements for detailed information
regarding status of new accounting standards.
IFRS
International
Financial Reporting Standards (IFRS) is a comprehensive series of accounting
standards published by the International Accounting Standards Board (IASB). In
November 2008, the SEC issued for comment a proposed roadmap outlining several
milestones that, if achieved, could lead to mandatory adoption of IFRS by U.S.
issuers starting in 2014. Implementation of IFRS reporting would be in staged
transition periods based upon the Company’s filing status. Based upon the
current filing status, the Company would begin IFRS filing for the year ended
September 30, 2017. The SEC is expected to make a determination in 2011
regarding the mandatory adoption of IFRS. We are currently assessing the impact
that this potential change would have on our Consolidated Financial Statements,
and we will continue to monitor the development of the potential implementation
of IFRS.
Results
of Operations
The
following table sets forth, in dollars (in thousands) and as a percentage of
total revenues, Consolidated Statements of Operations data for the periods
indicated. This information has been derived from the Consolidated Financial
Statements included elsewhere in this Annual Report.
|
Years
Ended September 30,
|
||||||||||||||||||||||
|
2009
|
2008
|
2007
|
||||||||||||||||||||
|
Consolidated
Statements of Operations Data:
|
||||||||||||||||||||||
|
Revenues:
|
||||||||||||||||||||||
|
License
|
$
|
22,462
|
29
|
%
|
$
|
34,111
|
30
|
%
|
$
|
54,052
|
43
|
%
|
||||||||||
|
Service
|
55,000
|
71
|
78,853
|
70
|
70,495
|
57
|
||||||||||||||||
|
Total
revenues
|
77,462
|
100
|
112,964
|
100
|
124,547
|
100
|
||||||||||||||||
|
Cost
of revenues:
|
||||||||||||||||||||||
|
License
|
400
|
1
|
1,059
|
1
|
1,813
|
2
|
||||||||||||||||
|
Service
|
22,249
|
29
|
34,012
|
30
|
30,329
|
24
|
||||||||||||||||
|
Amortization
of intangible assets
|
1,211
|
1
|
1,211
|
1
|
1,211
|
1
|
||||||||||||||||
|
Total
cost of revenues
|
23,860
|
31
|
36,282
|
32
|
33,353
|
27
|
||||||||||||||||
|
Gross
profit
|
53,602
|
69
|
76,682
|
68
|
91,194
|
73
|
||||||||||||||||
|
Operating
expenses:
|
||||||||||||||||||||||
|
Sales
and marketing
|
26,786
|
34
|
34,722
|
31
|
32,597
|
26
|
||||||||||||||||
|
Research
and development
|
18,998
|
25
|
25,598
|
22
|
27,546
|
22
|
||||||||||||||||
|
General
and administrative
|
13,293
|
17
|
17,995
|
16
|
19,898
|
16
|
||||||||||||||||
|
Restructuring
expense
|
784
|
1
|
—
|
—
|
6,543
|
6
|
||||||||||||||||
|
Total
operating expenses
|
59,861
|
77
|
78,315
|
69
|
86,584
|
70
|
||||||||||||||||
|
Income
(loss) from operations
|
(6,259
|
)
|
(8
|
)
|
(1,633
|
)
|
(1
|
)
|
4,610
|
3
|
||||||||||||
|
Interest
income, net
|
520
|
1
|
2,383
|
2
|
2,198
|
2
|
||||||||||||||||
|
Other
income, net
|
9
|
—
|
417
|
—
|
822
|
1
|
||||||||||||||||
|
Income
(loss) before income taxes
|
(5,730
|
)
|
(7
|
)
|
1,167
|
1
|
7,630
|
6
|
||||||||||||||
|
Provision
for income taxes
|
5,034
|
7
|
102
|
—
|
1,602
|
1
|
||||||||||||||||
|
Net
income (loss)
|
$
|
(10,764
|
)
|
(14
|
)%
|
$
|
1,065
|
1
|
%
|
$
|
6,028
|
5
|
%
|
|||||||||
Comparison
of the Year Ended September 30, 2009 to the Year Ended September 30,
2008
Revenues
License
Revenue
The
increase or decrease of license revenue occurring within our three different
product emphases is dependent on the timing of when a sales transaction is
completed and whether a license transaction was sold with essential consulting
services. License revenue sold with essential consulting services is generally
recognized under the percentage-of-completion method of accounting. The timing
and amount of revenue for those transactions being recognized under the
percentage-of-completion is influenced by the progress of work performed
relative to the project length of customer contracts and the dollar value of
such contracts. These orders typically involve consulting services that are
essential to functionality of the respective licenses. The following table sets
forth our license revenue by product emphasis for the years ended September 30,
2009 and 2008 (in thousands, except percentages):
|
Years
Ended September 30,
|
|||||||||||||||||
|
2009
|
2008
|
Change
|
%
|
||||||||||||||
|
License
Revenue:
|
|||||||||||||||||
|
Enterprise
Foundation solutions
|
$
|
5,996
|
$
|
19,615
|
$
|
(13,619
|
)
|
(69
|
)%
|
||||||||
|
Marketing
Director solutions
|
3,904
|
6,744
|
(2,840
|
)
|
(42
|
)
|
|||||||||||
|
Decision
Management solutions
|
12,562
|
7,752
|
4,810
|
62
|
|||||||||||||
|
Total
license revenue
|
$
|
22,462
|
$
|
34,111
|
$
|
(11,649
|
)
|
(34
|
)%
|
||||||||
Total
license revenue decreased $11.6 million, or 34%, for the year ended September
30, 2009 compared to the same period of the prior year. The change in license
revenue is the result of fewer sales transactions and transactions of
smaller
magnitude
being executed in the comparative periods, primarily due to the current economic
climate. Additionally, customer demand for our Enterprise Foundation solutions
has decreased while demand for our Decision Management solutions has increased
due to our near term shift of focus of our sales staff towards Decision
Management solutions rather than Enterprise Foundation solutions. However, our
Decision Management solutions generally generate smaller revenue per transaction
than our Enterprise Foundation solutions. License revenue as percentage of total
revenue was 29% and 30% for the fiscal years ended September 30, 2009 and 2008,
respectively.
Service
Revenue
Service
revenue is primarily composed of consulting implementation and integration,
consulting customization, training, PCS, and certain reimbursable out-of-pocket
expenses. The increase or decrease of service revenue within our three different
product emphases is primarily due to the timing of when license transactions are
completed, whether or not the license was sold with essential consulting
services, the sophistication of the customer’s application, and the expertise of
the customer’s internal development team. For non-essential service
transactions, service revenue will lag in timing compared to the period of when
the license revenue is recognized. The following table sets forth our service
revenue by product emphasis for the year ended September 30, 2009 and 2008 (in
thousands, except percentages):
|
Years
Ended September 30,
|
|||||||||||||||||
|
2009
|
2008
|
Change
|
%
|
||||||||||||||
|
Service
Revenue:
|
|||||||||||||||||
|
Enterprise
Foundation solutions
|
$
|
32,123
|
$
|
54,805
|
$
|
(22,682
|
)
|
(41
|
)%
|
||||||||
|
Marketing
Director solutions
|
9,765
|
12,721
|
(2,956
|
)
|
(23
|
)
|
|||||||||||
|
Decision
Management solutions
|
13,112
|
11,327
|
1,785
|
16
|
|||||||||||||
|
Total
service revenue
|
$
|
55,000
|
$
|
78,853
|
$
|
(23,853
|
)
|
(30
|
)%
|
||||||||
Total
service revenue decreased $23.9 million or 30 % for the year ended September 30,
2009 compared to the same period of the prior year. The change in service
revenue was primarily from decreases of $14.5 million from consulting revenue,
$6.0 million associated with support and maintenance revenue, $1.1 million in
training revenue and $2.3 million in expense reimbursement revenue. The decrease
in consulting revenue is directly related to the decrease in license revenues
for comparable periods since the majority of our customers use some form of our
consulting services in connection with their projects. We derived more of our
license revenues from Decision Management solutions rather than Enterprise
Foundation solutions which require less consulting services.
See
the Financial Trend section for further analysis of revenues.
Cost
of Revenues
License
Cost
of license revenue includes third-party software royalties and amortization of
capitalized software development costs. Royalty expenses can vary depending upon
the mix of products sold within the period. In addition, not all license
products have associated royalty expense. Capitalized software development costs
pertain to a banking product that was completed and available for general
release in August 2005 and third party costs associated with the porting of
existing products to new platforms. The following table sets forth our cost of
license revenues for the year ended September 30, 2009 and 2008 (in thousands,
except percentages):
|
Years
Ended September 30,
|
|||||||||||||||||
|
2009
|
2008
|
Change
|
%
|
||||||||||||||
|
Cost
of license revenue
|
$
|
400
|
$
|
1,059
|
$
|
(659
|
)
|
(62
|
)%
|
||||||||
|
Percentage
of total revenue
|
1
|
%
|
1
|
%
|
|||||||||||||
Cost
of license revenues decreased $0.7 million or 62% for the year ended September
30, 2009 as compared to the same period of the prior year. The change was
primarily from amortization of third party technology which became fully
amortized in fiscal year 2008. In addition, we reduced royalty costs associated
with third party technology included in our products.
Service
Cost
of service revenue consists primarily of personnel costs, third-party consulting
costs, facility and travel costs incurred to provide consulting implementation
and integration, consulting customization, training, and PCS support
services.
The
following table sets forth our cost of service revenue for the year ended
September 30, 2009 and 2008 (in thousands, except percentages):
|
Years
Ended September 30,
|
|||||||||||||||||
|
2009
|
2008
|
Change
|
%
|
||||||||||||||
|
Cost
of service revenue
|
$
|
22,249
|
$
|
34,012
|
$
|
(11,763
|
)
|
(35
|
)%
|
||||||||
|
Percentage
of total revenue
|
29
|
%
|
30
|
%
|
|||||||||||||
Cost
of service revenue decreased by $11.8 million or 35% for the year ended
September 30, 2009 as compared to the same period of the prior year. The change
was primarily from decreases of $2.3 million in employee related costs, $0.1
million in recruiting expense, $6.2 million of consultant expense, $0.5 million
in facility expense, and $2.7 million in travel expense. The 35% decrease in
service cost is consistent with the 30% decrease in service revenue. The
decrease in employee related costs is primarily from an 8% reduction in average
headcount and reduction in employee bonuses earned. See Note 6 to the
Consolidated Financial Statement for more details regarding the reduction in
headcount. We also utilized fewer third party consultants because of the
decrease in service revenue.
Gross
Margins
See
the Financial Trend section for our analysis of gross margins.
Amortization of Intangible
Assets (included in Cost of Revenues)
Amortization
of intangible assets cost consists of the amortization of amounts paid for
developed technologies, customer lists, and trade-names resulting from business
acquisitions. The following table sets forth our costs associated with
amortization of intangible assets for the year ended September 30, 2009 and 2008
(in thousands, except percentages):
|
Years
Ended September 30,
|
|||||||||||||||||
|
2009
|
2008
|
Change
|
%
|
||||||||||||||
|
Amortization
of intangible assets
|
$
|
1,211
|
$
|
1,211
|
$
|
—
|
—
|
%
|
|||||||||
|
Percentage
of total revenue
|
1
|
%
|
1
|
%
|
|||||||||||||
These
costs are solely related to the $6.1 million of intangible assets associated
with the acquisition of KiQ in December 2004. We expect amortization expense for
intangible assets to be $ $0.3 million in the first quarter of fiscal year 2010
at which time the balances will be fully amortized.
Operating
Expenses
Sales and
Marketing
Sales
and marketing expense is composed primarily of costs associated with selling,
promoting and advertising our products, product demonstrations and customer
sales calls. These costs consist primarily of employee compensation and
benefits, commissions and bonuses, benefits, facilities, travel expenses and
promotional and advertising expenses. The following table sets forth our sales
and marketing expenses for the year ended September 30, 2009 and 2008 (in
thousands, except percentages):
|
Years
Ended September 30,
|
|||||||||||||||||
|
2009
|
2008
|
Change
|
%
|
||||||||||||||
|
Sales
and marketing costs
|
$
|
26,786
|
$
|
34,722
|
$
|
(7,936
|
)
|
(23
|
)%
|
||||||||
|
Percentage
of total revenue
|
34
|
%
|
31
|
%
|
|||||||||||||
Sales
and marketing expenses decreased $7.9 million or 23% for the year ended
September 30, 2009 as compared to the same period of the prior year. The change
was primary from decreases of $4.9 million in employee related costs, $0.4
million in recruiting expense, $0.2 million in consultant expense, $0.9 million
in sales and marketing programs, $0.4 million in facility expense, and $1.1
million in travel expense. The decrease in employee related costs is primarily
from a 9% reduction in average headcount and reductions in employee commissions
and bonuses earned. In addition we canceled or reduced the scope of several
sales events due to the current economic climate.
Research and
Development
Research
and development expense is composed primarily of costs associated with the
development of new products, enhancements of existing products and quality
assurance activities. These costs consist primarily of employee compensation,
benefits, facilities, the cost of software and development tools, equipment and
consulting costs, including costs for offshore consultants. The following table
sets forth our research and development expenses for the year ended September
30, 2009 and 2008 (in thousands, except percentages):
|
Years
Ended September 30,
|
|||||||||||||||||
|
2009
|
2008
|
Change
|
%
|
||||||||||||||
|
Research
and development costs
|
$
|
18,998
|
$
|
25,598
|
$
|
(6,600
|
)
|
(26
|
)%
|
||||||||
|
Percentage
of total revenue
|
25
|
%
|
22
|
%
|
|||||||||||||
Research
and development expense decreased $6.6 million or 26% for the year ended
September 30, 2008 as compared to the same period of the prior year. The change
was primarily from decreases of $3.6 million in employee related costs, $0.1
million in recruiting expense, $2.0 million in consultant expense, $0.5 million
in facility expense, and $0.4 million in travel expense. The decrease in
employee related costs is primarily from a 24% reduction in average
headcount.
General and
Administrative
General
and administrative expense is composed primarily of costs associated with our
executive and administrative personnel (e.g. the office of the CEO, legal, human
resources and finance personnel). These costs consist primarily of employee
compensation, bonuses, stock compensation expense, benefits, facilities,
consulting, legal and audit costs, including costs for Sarbanes-Oxley Act of
2002 (SOX) compliance. The following table sets forth our general and
administrative expenses for the year ended September 30, 2009 and 2008 (in
thousands, except percentages):
|
Years
Ended September 30,
|
|||||||||||||||||
|
2009
|
2008
|
Change
|
%
|
||||||||||||||
|
General
and administrative costs
|
$
|
13,293
|
$
|
17,995
|
$
|
(4,702
|
)
|
(26
|
)%
|
||||||||
|
Percentage
of total revenue
|
17
|
%
|
16
|
%
|
|||||||||||||
General
and administrative expense decreased $4.7 million or 26% for the year ended
September 30, 2009 as compared to the same period of the prior year. The change
is primarily from decreases of $2.8 million in employee related costs, $0.2
million in recruiting expense, $0.3 million in consultant expense, $0.3 million
in travel expense, $1.0 million in professional services, $0.7 million in bad
debt expense offset by $0.6 million in higher facility expense. The decrease in
employee related costs is primarily from a 26% reduction in average headcount.
The decrease in professional services is primarily from decreases in accounting
services, tax services, and legal services. The increase in facility expense is
primarily from the renewal of our Cupertino headquarters lease.
Restructuring
Expense
In
October 2008, the Company initiated a restructuring plan, intended to align its
resources and cost structure with expected future revenues. The restructuring
plan includes reductions in headcount and third party consultants across all
functional areas in both North America and Europe. The restructuring plan
includes a reduction of approximately 13% of the Company’s permanent workforce.
A significant portion of the positions eliminated were in North
America.
As
a result of the cost-cutting measures, the Company recorded a pre-tax cash
restructuring charge in the first quarter of fiscal year 2009, of approximately
$0.9 million, including $ 0.8 million for severance costs and $0.1 million for
other contract termination costs. We paid the severance costs and other contract
termination costs in the first quart of fiscal year 2009.
In
July 2005, we undertook an approximate 10% reduction in our workforce. In
connection with this action, we incurred a one-time cash expense of
approximately $1.1 million in the fourth quarter ended September 30, 2005
for severance benefits. During the three months ended March 31, 2007, the
Company incurred an additional charge of less than $0.1 million for additional
severance expense for an employee located in France. During the three months
ended December 31, 2008, the Company reversed the charge as the Company was not
required to pay the severance expense to the employee. All severance benefits
have now been paid.
Stock-Based Compensation
(Included in Individual Operating Expense and Cost of Revenue
Categories)
The
following table sets forth our stock-based compensation expense and functional
breakdown for the year ended September 30, 2009 and 2008 (in
thousands):
|
Years
Ended September 30,
|
|||||||||
|
2009
|
2008
|
||||||||
|
Stock-based
compensation expense:
|
|||||||||
|
Cost
of revenues
|
$
|
574
|
$
|
490
|
|||||
|
Sales
and marketing
|
889
|
922
|
|||||||
|
Research
and development
|
418
|
586
|
|||||||
|
General
and administrative
|
1,787
|
2,127
|
|||||||
|
Total
stock-based compensation expense
|
$
|
3,668
|
$
|
4,125
|
|||||
For
the year ended September 30, 2009, the aggregate stock-based compensation cost
included in cost of revenues and in operating expenses was $3.7 million which is
a combination of $2.9 million associated with stock options, $0.4 million
associated with restricted stock awards or RSAs, and $0.4 million associated
with restricted stock units or RSUs.
For
the year ended September 30, 2008, the aggregate stock-based compensation cost
included in cost of revenues and in operating expenses was $4.1 million which is
a combination of $3.8 million associated with stock options, $0.3 million
associated with RSAs, and zero associated with RSUs. On May 1, 2008, Chordiant
implemented a reduction of approximately 10% of its workforce. As part of the
reduction in workforce, an executive left the Company which resulted in the
modification of his stock options as the right to exercise the stock options was
extended by the Board of Directors. The net charge to stock compensation expense
for the modification was less than $0.1 million.
Stock
compensation decreased in fiscal year 2009 compared to fiscal year 2008
primarily due to new option grants with lower fair value. The
weighted average estimated fair value of stock options granted for fiscal year
2009 was $1.25 as compared to $4.12 for fiscal year 2008.
Interest
Income, Net
Interest
income, net, consists primarily of interest income generated from our cash, cash
equivalents, and marketable securities offset by interest expense incurred in
connection imputed under a FASB standard on restructuring accruals. The
following table sets forth our interest income, net for the year ended September
30, 2009 and 2008 (in thousands, except percentages):
|
Years
Ended September 30,
|
|||||||||||||||||
|
2009
|
2008
|
Change
|
%
|
||||||||||||||
|
Interest
income, net
|
$
|
520
|
$
|
2,383
|
$
|
(1,863
|
)
|
(78
|
)%
|
||||||||
|
Percentage
of total revenue
|
1
|
%
|
2
|
%
|
|||||||||||||
Interest
income, net, decreased $1.9 million or 78% for the year ended September 30, 2009
as compared to the same period of the prior year. The change is primarily from
the decrease of cash and cash equivalents. We had higher average balances in
fiscal year 2008 than in fiscal year 2009. Additionally, we earned less interest
income due to lower average interest rates.
Other
Income, Net
These
gains and losses are primarily associated with foreign currency transaction
gains or losses and the re-measurement of our short-term intercompany balances
between the U.S. and our foreign currency denominated subsidiaries. The
following table sets forth our other income, net for the year ended September
30, 2009 and 2008 (in thousands, except percentages):
|
Years
Ended September 30,
|
|||||||||||||||||
|
2009
|
2008
|
Change
|
%
|
||||||||||||||
|
Other
income, net
|
$
|
9
|
$
|
417
|
$
|
(408
|
)
|
(98
|
)%
|
||||||||
|
Percentage
of total revenue
|
—
|
%
|
—
|
%
|
|||||||||||||
Other
income, net decreased $0.4 million or 98% for the year ended September 30, 2009
as compared to the same period of the prior year. The change is primarily due
the re-measurement of our short-term intercompany balances and the changes in
foreign exchange rates.
Provision
for Income Taxes
These
provisions for income taxes are primarily attributable to taxes on earnings from
our foreign subsidiaries, certain foreign withholding taxes, and non-cash
deferred tax expense on earnings of our UK subsidiaries. The following table
sets forth our provision for income taxes for the years ended September 30, 2009
and 2008 (in thousands, except percentages):
|
Years
Ended September 30,
|
|||||||||||||||||
|
2009
|
2008
|
Change
|
%
|
||||||||||||||
|
Provision
for income taxes
|
$
|
5,034
|
$
|
102
|
$
|
4,932
|
4,835
|
%
|
|||||||||
|
Percentage
of total revenue
|
7
|
%
|
—
|
%
|
|||||||||||||
Our
provision for income taxes was $5.0 million and $0.1 million for the years ended
September 30, 2009 and 2008, respectively. The $4.9 million increase in income
taxes is primarily due to an increase in the taxable income of our UK
subsidiaries which led to a non-cash tax expense of approximately $3.4 million,
representing the utilization of available NOL carryforwards (as discussed
further below), and an increase of $0.8 million in unrecoverable withholding tax
payments related to sales transactions that occurred in Egypt, India, Poland,
Portugal and Turkey compared to the year ended September 30, 2008. The remainder
of our provision is primarily attributable to taxes on earnings from our foreign
subsidiaries.
At
September 30, 2009, we had $74.8 million in gross DTAs attributable principally
to our NOLs and to a lesser extent temporary differences relating to deferred
revenue. Prior to fiscal year 2008, we maintained a 100% valuation allowance on
our DTAs because we have previously been unable to conclude that it is
more-likely-than-not that we will realize the tax benefits of these DTAs. Based
on recent operating results at the subsidiary level and the reorganization of
our intellectual property, our current projections of disaggregated future
taxable income have enabled us to conclude that it is more-likely-than-not that
as of September 30, 2009 we will have future taxable income sufficient to
realize $5.2 million of tax benefits from our deferred tax assets, which consist
of that portion of our net deferred tax assets attributable to our NOLs and
capital allowances residing in the United Kingdom. On September 30, 2008, we had
released (eliminated) the valuation allowance on our DTAs relating to the United
Kingdom, of which $9.5 million was recognized as an offsetting reduction to
goodwill (representing pre-acquisition NOLs). Beginning on October 1, 2009
through future periods, we expect to continue incurring tax expense related to
the United Kingdom; however, to the extent that such tax expense is offset by
the utilization of NOLs and capital allowances, the recognition of this
additional tax expense will be a non-cash item.
The
remaining balance of gross deferred tax assets was generated in the U.S. With
respect to our U.S. generated DTAs, we have recorded a full valuation allowance
as the future realization of the tax benefit is not considered by management to
be more likely than not. Our estimate of future taxable income considers
available positive and negative evidence regarding our current and future
operations, including projections of income in various states and foreign
jurisdictions. We believe our estimate of future taxable income is reasonable;
however, it is inherently uncertain, and if our future operations generate
taxable income greater than projected, further adjustments to reduce the
valuation allowance are possible. Conversely, if we realize unforeseen material
losses in the future, or our ability to generate future taxable income necessary
to realize a portion of the net deferred tax asset is materially reduced,
additions to the valuation allowance could be recorded. At September 30, 2009,
the balance of the deferred tax valuation allowance is approximately $69.6
million.
Comparison
of the Year Ended September 30, 2008 to the Year Ended September 30,
2007
Revenues
License
Revenue
The
increase or decrease of license revenue occurring within our three different
product groups is dependent on the timing of when a sales transaction is
completed and whether a license transaction was sold with essential consulting
services. Licenses sold with essential consulting services are generally
recognized as revenue under the percentage-of-completion method of accounting.
The timing and amount of revenue for those transactions being recognized under
the percentage-of-completion method is influenced by the progress of work
performed relative to the project length of customer contracts and the dollar
value of such contracts. These orders typically involve consulting services that
are essential to functionality of the respective licenses. The following table
sets forth our license revenue by product emphasis for the years ended September
30, 2008 and 2007 (in thousands, except percentages):
|
Years
Ended September 30,
|
|||||||||||||||||
|
2008
|
2007
|
Change
|
%
|
||||||||||||||
|
License
Revenue:
|
|||||||||||||||||
|
Enterprise
Foundation solutions
|
$
|
19,615
|
$
|
37,648
|
$
|
(18,033
|
)
|
(48
|
)%
|
||||||||
|
Marketing
Director solutions
|
6,744
|
6,013
|
731
|
12
|
|||||||||||||
|
Decision
Management solutions
|
7,752
|
10,391
|
(2,639
|
)
|
(25
|
)
|
|||||||||||
|
Total
license revenue
|
$
|
34,111
|
$
|
54,052
|
$
|
(19,941
|
)
|
(37
|
)%
|
||||||||
Total
license revenue decreased $19.9 million, or 37%, for the year ended September
30, 2008 compared to the same period of the prior year. The decrease in license
revenue is the result of fewer sales transactions and transactions of smaller
magnitude being executed in the current year. In the quarter ended June 30,
2007, we recognized license revenue that was deferred in the previous quarters.
These revenues were deferred as they were related to an undelivered license
element that was subsequently delivered in the June 2007 quarter.
Service
Revenue
Service
revenue is primarily composed of consulting implementation and integration,
consulting customization, training, PCS, and certain reimbursable out-of-pocket
expenses. The increase or decrease of service revenue within our three different
product emphases is primarily due to the timing of when license transactions are
completed, whether or not the license was sold with essential consulting
services, the sophistication of the customer’s application, and the expertise of
the customer’s internal development team. For non-essential service
transactions, service revenue will lag in timing compared to the period of when
the license revenue is recognized. The following table sets forth our service
revenue by product emphasis for the years ended September 30, 2008 and 2007 (in
thousands, except percentages):
|
Years
Ended September 30,
|
|||||||||||||||||
|
2008
|
2007
|
Change
|
%
|
||||||||||||||
|
Service
Revenue:
|
|||||||||||||||||
|
Enterprise
Foundation solutions
|
$
|
54,805
|
$
|
51,584
|
$
|
3,221
|
6
|
%
|
|||||||||
|
Marketing
Director solutions
|
12,721
|
12,369
|
352
|
3
|
|||||||||||||
|
Decision
Management solutions
|
11,327
|
6,542
|
4,785
|
73
|
|||||||||||||
|
Total
service revenue
|
$
|
78,853
|
$
|
70,495
|
$
|
8,358
|
12
|
%
|
|||||||||
Total
service revenue increased $8.4 million or 12 % for the year ended September 30,
2008 compared to the same period of the prior year. The increase in service
revenue is primarily related to increases from $6.3 million of support and
maintenance revenue, $0.5 million from consulting revenue, $0.8 million from
training revenue and $0.8 million from expense reimbursement revenue. Support
and maintenance revenue increased due to an increase in the number of customers
subscribing to the service. If existing customers do not renew support and
maintenance contracts, service revenues could decline. The changes in foreign
exchange rates may also cause revenues related to prepaid contracts to be lower
than ultimately recognized as revenue.
See
the Financial Trend section for further analysis of revenues.
Cost
of Revenues
License
Cost
of license revenue includes third-party software royalties and amortization of
capitalized software development costs. Royalty expenses can vary depending upon
the mix of products sold within the period. In addition, not all license
products have associated royalty expense. Capitalized software development costs
pertain to a banking product that was completed and available for general
release in August 2005 and third party costs associated with the porting of
existing products to new platforms. The following table sets forth our cost of
license revenues for the years ended September 30, 2008 and 2007 (in thousands,
except percentages):
|
Years
Ended September 30,
|
|||||||||||||||||
|
2008
|
2007
|
Change
|
%
|
||||||||||||||
|
Cost
of license revenue
|
$
|
1,059
|
$
|
1,813
|
$
|
(754
|
)
|
(42
|
)%
|
||||||||
|
Percentage
of total revenue
|
1
|
%
|
2
|
%
|
|||||||||||||
Cost
of license revenues decreased $0.7 million or 42% for the year ended September
30, 2008 as compared to the same period of the prior year. The decrease was
primarily from the reduction of royalty expense resulting from the decrease of
37% in license revenue.
Service
Cost
of service revenues consists primarily of personnel, third party consulting,
facility costs, and travel costs incurred to provide consulting implementation
and integration, consulting customization, training, and PCS. The following
table sets forth our cost of service revenues for the years ended September 30,
2008 and 2007 (in thousands, except percentages):
|
Years
Ended September 30,
|
|||||||||||||||||
|
2008
|
2007
|
Change
|
%
|
||||||||||||||
|
Cost
of service revenue
|
$
|
34,012
|
$
|
30,329
|
$
|
3,683
|
12
|
%
|
|||||||||
|
Percentage
of total revenue
|
30
|
%
|
24
|
%
|
|||||||||||||
Cost
of service revenue increased by $3.7 million or 12% for the year ended September
30, 2008 as compared to the same period of the prior year. The increase was
primarily from increases of $0.3 million in employee related costs, $3.5 million
of consultant expense, $0.2 million of sales events, $0.1 million in travel
expense offset by decreases of $0.1 million in legal services and $0.3 million
in support and maintenance expense. The increase in consultant expense is the
result of reduction of average headcount of 25% year over year. The 12% increase
in service cost of revenues is consistent with the 12% increase in service
revenue.
Gross
Margins
See
the Financial Trend section for our analysis of gross margins.
Amortization of Intangible
Assets (included in Cost of Revenues)
Amortization
of intangible assets cost consists of the amortization of amounts paid for
developed technologies, customer lists and trade-names resulting from business
acquisitions. The following table sets forth our costs associated with
amortization of intangible assets for the years ended September 30, 2008 and
2007 (in thousands, except percentages):
|
Years
Ended September 30,
|
|||||||||||||||||
|
2008
|
2007
|
Change
|
%
|
||||||||||||||
|
Amortization
of intangible assets
|
$
|
1,211
|
$
|
1,211
|
$
|
—
|
—
|
%
|
|||||||||
|
Percentage
of total revenue
|
1
|
%
|
1
|
%
|
|||||||||||||
These
costs are solely related to the $6.1 million of intangible assets associated
with the acquisition of KiQ in December 2004. We expect amortization expense for
intangible assets to be $1.2 million in fiscal year 2009 and $0.3 million in
fiscal year 2010.
Operating
Expenses
Sales and
Marketing
Sales
and marketing expenses is composed primarily of costs associated with selling,
promoting and advertising our products, product demonstrations and customer
sales calls. These costs consist primarily of employee compensation and
benefits, commissions and bonuses, facilities, travel expenses and promotional
and advertising expenses. The following table sets forth our sales and marketing
expenses for the years ended September 30, 2008 and 2007 (in thousands, except
percentages):
|
Years
Ended September 30,
|
|||||||||||||||||
|
2008
|
2007
|
Change
|
%
|
||||||||||||||
|
Sales
and marketing costs
|
$
|
34,722
|
$
|
32,597
|
$
|
2,125
|
7
|
%
|
|||||||||
|
Percentage
of total revenue
|
31
|
%
|
26
|
%
|
|||||||||||||
Sales
and marketing expenses increased $2.1 million or 7% for the year ended September
30, 2008 as compared to the same period of the prior year. The increase was
primary from increases of $1.8 million in third party consultant
and
commission
expense, $0.2 million in recruiting expense, $0.2 million in facility expense,
and $0.2 million in travel expense offset by decrease of $0.2 million in
employee related costs. Employee related costs decreased primarily from the
decrease of $3.5 million of commissions paid offset by increases of $2.8 million
of employee salaries and related costs as we increased headcount for sales
personnel year over year, $0.3 million in bonuses paid, and $0.2 million of
stock-based compensation. The increase in consultant expense is primarily from
hiring of consultants in emerging markets.
Research and
Development
Research
and development expenses are composed primarily of costs associated with the
development of new products, enhancements of existing products and quality
assurance activities. These costs consist primarily of employee compensation and
benefits, facilities, the cost of software and development tools, equipment and
consulting costs, including costs for offshore consultants. The following table
sets forth our research and development expenses for the years ended September
30, 2008 and 2007 (in thousands, except percentages):
|
Years
Ended September 30,
|
|||||||||||||||||
|
2008
|
2007
|
Change
|
%
|
||||||||||||||
|
Research
and development costs
|
$
|
25,598
|
$
|
27,546
|
$
|
(1,948
|
)
|
(7
|
)%
|
||||||||
|
Percentage
of total revenue
|
22
|
%
|
22
|
%
|
|||||||||||||
Research
and development expense decreased $1.9 million or 7% for the year ended
September 30, 2008 as compared to the same period of the prior year. The
decrease was primarily from decreases of $1.4 million in employee related costs,
$0.1 million in consultant expense, $0.2 million in facility expense, and $0.3
million in travel expense offset by an increase of $0.1 million in recruiting
expense. Employee related costs decreased primarily from decreases in employee
bonuses paid.
General and
Administrative
General
and administrative expense is composed primarily of costs associated with our
executive and administrative personnel (e.g. the office of the CEO, legal, human
resources and finance personnel). These costs consist primarily of employee
compensation and benefits, bonuses, stock compensation expense, facilities,
professional fees, including audit costs and costs for Sarbanes-Oxley Act of
2002 (SOX) consultants. The following table sets forth our general and
administrative expenses for the years ended September 30, 2008 and 2007 (in
thousands, except percentages):
|
Years
Ended September 30,
|
|||||||||||||||||
|
2008
|
2007
|
Change
|
%
|
||||||||||||||
|
General
and administrative costs
|
$
|
17,995
|
$
|
19,898
|
$
|
(1,903
|
)
|
(10
|
)%
|
||||||||
|
Percentage
of total revenue
|
16
|
%
|
16
|
%
|
|||||||||||||
General
and administrative expense decreased $1.9 million or 10% for the year ended
September 30, 2008 as compared to the same period of the prior year. The
decrease is primarily from decreases of $1.1 million from professional services,
$0.7 million in employee related costs, $0.3 million in consultant expense, and
$0.4 million in facility expense offset by increases of $0.5 million in other
expenses related to U.S. state franchise taxes and bad debt expense. The
decrease in professional services is primarily related to the stock option
investigation that occurred in fiscal year 2007. Employee related costs
decreased primarily from decreases in the level of employee bonuses
earned.
Restructuring
Expense
In
October 2006, we initiated a restructuring plan that included an immediate
reduction in positions of slightly more than 10% of the Company's workforce,
consolidation of our European facilities, and the closure of our French office.
A majority of the positions eliminated were in Europe. We recorded a pre-tax
cash restructuring charge of $6.1 million as calculated using the net present
value of the related costs. During the quarter ended March 31, 2007, the Company
incurred an additional charge of $0.1 million for employee severance costs
associated with the closure of the France office. Also during March 2007, the
Company negotiated an early termination of the France office lease associated
with its closure resulting in a $0.2 million reduction in the restructure
facility liability. This reduction was recorded as an offset to restructuring
expense in the period. In quarter ended December 31, 2007, we negotiated a break
clause in the lease allowing for an early termination of the United Kingdom
facility which released us from any future rent liabilities subsequent to
January 2008. All termination payments have now been made.
In
July 2005, we undertook an approximate 10% reduction in our workforce. In
connection with this action, we incurred a one-time cash expense of
approximately $1.1 million in the fourth quarter ended September 30, 2005 for
severance benefits. During the three months ended March 31, 2007, the Company
incurred an additional charge of less than $0.1 million for additional severance
expense for an employee located in France.
During
fiscal year 2002, we restructured several areas of the Company to reduce
expenses and improve revenues. As part of this restructuring, we closed an
office facility in Boston, Massachusetts and recorded a charge associated with
the long term lease which expires in January 2011. In the March 2007 quarter, we
completed a new sublease with a sub-lessee for the remaining term of our lease
at a rate lower than that which was forecasted when the original restructure
charge was recorded in 2002. This change in estimate resulted in a $0.4 million
charge to restructuring in the quarter ended March 31, 2007.
Stock-based Compensation
(included in individual Operating Expense and Cost of Revenue
Categories)
The
following table sets forth our stock-based compensation expense in terms of
absolute dollars and functional breakdown for the years ended September 30, 2008
and 2007 (in thousands):
|
Years
Ended September 30,
|
|||||||||
|
2008
|
2007
|
||||||||
|
Stock-based
compensation expense:
|
|||||||||
|
Cost
of revenues
|
$
|
490
|
$
|
313
|
|||||
|
Sales
and marketing
|
922
|
744
|
|||||||
|
Research
and development
|
586
|
546
|
|||||||
|
General
and administrative
|
2,127
|
1,417
|
|||||||
|
Total
stock-based compensation expense
|
$
|
4,125
|
$
|
3,020
|
|||||
For
the year ended September 30, 2008, the aggregate stock-based compensation cost
included in cost of revenues and in operating expenses was $4.1 million which is
a combination of $3.8 million associated with stock options, $0.3 million
associated with RSAs, and zero associated with RSUs. On May 1, 2008, Chordiant
implemented a reduction of approximately 10% of its workforce. As part of the
reduction in workforce, an executive left the Company which resulted in the
modification of his stock options as the right to exercise the stock options was
extended by the Board of Directors. The net charge to stock compensation expense
for the modification was less than $0.1 million.
For
the year ended September 30, 2007, the aggregate stock-based compensation cost
included in cost of revenues and in operating expenses was $3.0 million which is
a combination of $2.8 million associated with stock options and $0.2 million
associated with RSAs. During the quarter ended June 30, 2007, the Company
completed a tender offer which resulted in the modification of certain options.
The Company increased the exercise price of options previously issued at a
discount to limit the potential adverse personal tax consequences that may apply
to those stock options under Section 409A of the Internal Revenue Code and state
law equivalents. When combined with the related cash bonus to be paid to the
option holders in connection with the exchange, the net charge to compensation
expense for during the quarter was $0.1 million.
Stock
option expense increased from fiscal year 2007 to 2008, in part, due to a lower
than expected forfeiture rate for 2008.
Interest
Income, Net
Interest
income, net, consists primarily of interest income generated from our cash, cash
equivalents and marketable securities, offset by interest expense incurred in
connection with our capital leases and letters of credit and imputed under a
FASB standard on restructuring accruals. The following table sets forth our
interest income, net, in terms of absolute dollars for the years ended September
30, 2008 and 2007 (in thousands, except percentages):
|
Years
Ended September 30,
|
|||||||||||||||||
|
2008
|
2007
|
Change
|
%
|
||||||||||||||
|
Interest
income, net
|
$
|
2,383
|
$
|
2,198
|
$
|
185
|
8
|
%
|
|||||||||
|
Percentage
of total revenue
|
2
|
%
|
2
|
%
|
|||||||||||||
Interest
income, net, increased $0.2 million or 8% for the year ended September 30, 2008
as compared to the same period of the prior year. The increase is primarily from
interest income earned from the United Kingdom where the Company held cash and
cash equivalents in accounts that earned a higher return of interest income than
in the prior year. Average balances were also higher for the first half of the
fiscal year.
Other
Income, Net
These
gains and losses are primarily associated with foreign currency transaction
gains or losses and the re-measurement of our short-term intercompany balances
between the U.S. and our foreign subsidiaries with different functional
currencies than the U.S. Dollar. The following table sets forth our other
income, net in terms of absolute dollars for the years ended September 30, 2008
and 2007 (in thousands, except percentages):
|
Years
Ended September 30,
|
|||||||||||||||||
|
2008
|
2007
|
Change
|
%
|
||||||||||||||
|
Other
income, net
|
$
|
417
|
$
|
822
|
$
|
(405
|
)
|
(49
|
)%
|
||||||||
|
Percentage
of total revenue
|
—
|
%
|
1
|
%
|
|||||||||||||
Other
income decreased $0.4 million or 51% for the year ended September 30, 2008 as
compared to the same period of the prior year primarily due to higher net
transaction losses associated with the re-measurement of our short-term
intercompany balances.
Provision
for Income Taxes
Our
provision for income taxes is $0.1 million and $1.6 million for the years ended
September 30, 2008 and 2007, respectively. The $1.5 million decrease in income
taxes is primarily due to the reduction of taxable income, the reversal of
valuation allowance on deferred tax assets of $0.5 million and a decrease of
$0.6 million in unrecoverable withholding tax payments related to sales
transactions that occurred in Turkey and Poland compared to fiscal year 2007.
The remainder of our provision is attributable to taxes on earnings from our
foreign subsidiaries and certain U.S. state income taxes.
At
September 30, 2008, we had $75.8 million in gross DTAs attributable principally
to our NOLs. Historically, we have maintained a 100% valuation allowance on our
DTAs because we have previously been unable to conclude that it is
more-likely-than-not that we will realize the tax benefits of these DTAs. Based
on recent operating results and the reorganization of our intellectual property
into the U.S., our current projections of disaggregated future taxable income
have enabled us to conclude that it is more-likely-than-not that we will have
future taxable income sufficient to realize $10.0 million of tax benefits from
our deferred tax assets, which consist of that portion of our net deferred tax
assets attributable to our NOLs residing in the United Kingdom. Accordingly, we
have released (eliminated) $10.0 million of the valuation allowance on our DTAs,
of which $9.5 million is recognized as an offsetting reduction to goodwill
(representing pre-acquisition NOLs) and $0.5 million is recognized as a credit
(reduction) to the provision for income taxes. In future periods, we expect to
incur tax expense related to the United Kingdom which will result in an increase
in overall expense; however, to the extent that such tax expense is offset by
the utilization of NOLs, the recognition of this additional tax expense will be
a non-cash item.
The
remaining balance of gross deferred tax assets was generated in the U.S. With
respect to our U.S. generated deferred tax assets, we have recorded a full
valuation allowance as the future realization of the tax benefit is not
considered by management to be more likely than not. At September 30, 2008, the
balance of the deferred tax valuation allowance was approximately $65.9
million.
Liquidity
and Capital Resources
Prior
to fiscal year 2007, we had not been profitable and we periodically generated
cash through the issuance of our common stock. In fiscal year 2008, we
repurchased and retired $18.6 million of our common stock. For the year ended
September 30, 2009, we used cash from operating and investing activities and
generated nominal cash from financing activities. It is anticipated that our
current cash balances are adequate to fund operations for the next twelve
months, however in the event we are not profitable, we would anticipate a
decrease in cash and cash equivalents in the near term.
From
September 30, 2008 to September 30, 2009 our current net accounts receivable
balances have declined from $24.9 million to $16.7 million, accordingly, in the
near term, significantly lower levels of cash will be derived from the
collection of amounts currently due to the Company. Additionally, during the
three months ended June 30, 2009 we billed and collected the final series of
payments associated with a large telecommunications customer commitment that was
entered into in December of 2007. Due to these circumstances, maintaining our
cash balances at their current levels will be highly dependent upon our ability
to enter into new license and service agreements with customers and the payment
terms associated with these agreements. Historically we have been able to
negotiate payment terms that were favorable to the Company. In the current
economic environment we may not be as successful in negotiating payments terms
that are as favorable as in the past. If bookings do not meet our expectations,
or we are not able to negotiate favorable payment terms, we would anticipate a
decrease in cash and cash equivalents in the near term.
Operating
Activities
Cash
used in operating activities was $3.8 million during the year ended September
30, 2009, which consisted primarily of our net loss of $10.8 million adjusted
for non-cash items (primarily depreciation, amortization, non-cash stock-based
compensation expense, provision for doubtful accounts, and other non-cash
provision for income taxes) aggregating approximately $10.1 million and the net
cash outflow effect from changes in assets and liabilities of approximately $3.1
million. This net cash outflow effect from changes in assets and liabilities was
primarily related to decreases in deferred revenue of $5.7 million, accounts
payable of $3.7 million, accrued expenses, other liabilities- non-current, and
restructuring expense of $2.9 million and other assets of $0.6 million offset by
increases in accounts receivable of $7.3 million and prepaid expenses and other
current assets of $2.5 million. Deferred revenues declined as revenues were
recognized at a rate faster than new bookings were recorded.
Cash
used in operating activities was $13.7 million during the year ended September
30, 2008, which consisted primarily of our net income of $1.1 million adjusted
for non-cash items (depreciation, amortization, non-cash stock-based
compensation expense, provision for doubtful accounts, and other non-cash
charges) aggregating approximately $8.1 million and the net cash outflow effect
from changes in assets and liabilities of approximately $22.9 million. This net
cash outflow effect from changes in assets and liabilities was primarily related
to decreases in deferred revenue of $19.4 million, other liabilities of $4.2
million, other assets of $0.3 million, accounts payable of $0.2 million offset
by increases in accounts receivable of $1.1 million and prepaid expenses and
other current assets of $0.1 million. Deferred revenues declined as revenues
were recognized at a rate faster than new bookings were recorded.
Cash
provided by operating activities was $38.9 million during the year ended
September 30, 2007, which consisted primarily of our net income of $6.0 million
adjusted for non-cash items (depreciation, amortization, non-cash stock-based
compensation expense, provision for doubtful accounts, loss on disposal of
assets and other non-cash charges) aggregating approximately $7.8 million and
the net cash inflow effect from changes in assets and liabilities of
approximately $25.1 million. This net cash inflow effect from changes in assets
and liabilities was primarily related to changes in deferred revenue of $36.6
million offset by changes in accounts receivable of $11.8 million The increase
in deferred revenue was the result of sales transactions that were completed
during the year ended September 30, 2007 for which revenue was not recognized
until subsequent periods.
Investing
Activities
Cash
used in investing activities during the year ended September 30, 2009 was $0.5
million. The cash used was primarily for the purchase of property and equipment
of $0.4 million and $0.1 million of capitalized porting software costs. The
purchase of property and equipment was primarily for computer equipment and
software used for day-to-day operations. During fiscal year 2009, property and
equipment purchases were tightly controlled and spending levels were below
historical levels. As computer equipment continues to age, the Company expects
that it will need to increase equipment purchases in some future period.
Additionally, we may use cash to fund acquisitions, purchase minority ownership
interests in other companies, or fund investments in other businesses,
technologies, or product lines.
Cash
provided by investing activities during the year ended September 30, 2008 was
$10.7 million. The cash provided was primarily from $17.3 million of proceeds
from the maturity of marketable securities and $0.2 million from the release of
restricted cash. The cash provided was offset by $5.1 million purchase of
marketable securities, $1.3 million for the purchased property and equipment and
$0.4 million of capitalized porting software costs. The purchase of property and
equipment was primarily for computer equipment and software used for day-to-day
operations.
Cash
used in investing activities during the year ended September 30, 2007 was $14.9
million. The cash was used primarily for the purchase of $18.0 million of
marketable securities, the purchase of $2.8 million of property and equipment,
and the capitalization of $0.3 million of software development costs associated
with the porting an existing product to a new platform. This use of cash was
offset by $6.0 million of proceeds from the maturity of marketable securities
and the release of $0.2 million of restricted cash during the period. The
majority of the property and equipment purchased was associated with the closure
of the old European headquarters office and the opening of the new smaller
European headquarters office during the period. The remainder of the property
and equipment purchases was primarily computer equipment use in for day-to-day
operations.
Financing
Activities
Cash
provided by financing activities during the year ended September 30, 2009
consisted of proceeds from stock option exercises of $0.1 million. The majority
of stock options outstanding have strike prices that exceed the current market
value, accordingly we do not anticipate significant proceeds from stock option
exercises in the near term.
Cash
used in financing activities during the year ended September 30, 2008 was $17.9
million. The amount includes $18.6 million used in the repurchase of common
stock offset by $0.7 million in proceeds from stock option exercises. The
majority of stock options outstanding have strike prices that exceed the current
market value, accordingly we do not anticipate significant proceeds from stock
option exercises in the near term. The 2008 stock repurchase plan concluded,
however, given the current share price of the Company’s common stock, additional
share repurchases may be considered in the future periods.
Cash
provided by financing activities during the year ended September 30, 2007 was
$6.2 million. The amount relates to $6.2 million in proceeds from stock option
exercises and $0.1 million from excess tax benefits from stock based
compensation, offset by payments of $0.1 million on capital lease obligations.
We paid off the remainder of the capital lease obligations during the year ended
September 30, 2007.
Revolving
Line of Credit
See
Note 8 to the Consolidated Financial Statements for detailed information
regarding our existing revolving line of credit. The Company may consider other
bank borrowing options which it believes are commercially available to it. Such
facilities generally allow for higher borrowing limits based on a percentage of
annual recurring revenues.
Contractual
Obligations
Ness
We
entered into an agreement with Ness Technologies Inc., Ness USA, Inc. (formerly
Ness Global Services, Inc.) and Ness Technologies India, Ltd. (collectively,
“Ness”), effective December 15, 2003, and in January 2009, we extended the Ness
agreement through December 31, 2011. Pursuant to the Ness agreement, Ness
provides our customers with technical product support through a worldwide help
desk facility, a sustaining engineering function that serves as the interface
between technical product support and internal engineering organization, product
testing services, product development services and certain other identified
technical and consulting services (collectively, the “Services”). Under the
terms of the Ness agreement, we pay for services rendered on a monthly fee
basis, including approved out of-pocket expenses. If we terminate the Ness
agreement for convenience prior to December 31, 2009, we may be required to pay
a termination fee no greater than $0.5 million. We also had guaranteed certain
equipment lease obligations of Ness for equipment acquired by Ness to be used in
performance of the Services, either through leasing arrangements or direct cash
purchases, for which we were obligated under the agreement to reimburse Ness.
Ness entered into a 36 month equipment lease agreement with IBM India and, in
connection with the lease agreement we had an outstanding standby letter of
credit to guarantee Ness’ financial commitments under the lease. During the
quarter ended June 30, 2009, the lease expired and we no longer have an
obligation to reimburse Ness.
Leases
Operating
lease obligations in the table below include approximately $0.9 million for our
Boston, Massachusetts facility operating lease commitments that are included in
Restructuring expenses. As of September 30, 2009, the Company has $0.4 million
in sublease income contractually committed for future periods relating to this
facility. See Notes 6 and 9 to the Consolidated Financial Statements for further
discussion.
The
office lease for our Cupertino headquarters was scheduled to expire on December
31, 2008. In July 2008, the Company renewed the lease for a five year period
with an option to renew for an additional five years. The table below includes
this lease commitment.
We
have asset retirement obligations, associated with commitments to return
property subject to operating leases to original condition upon lease
termination. As of September 30, 2009, we estimate that approximately $0.3
million will be required to fulfill these obligations
We
have no material commitments for capital expenditures. Expenditures in the next
24 months may increase as the average age of laptops and servers has increased
in 2009.
The
following table presents certain payments due under contractual obligations as
of September 30, 2009 based on fiscal years (in thousands):
|
Payments
Due By Period
|
||||||||||||||||||||
|
Total
|
Due
in
2010
|
Due
in
2011-2012
|
Due
in
2013-2014
|
Thereafter
|
||||||||||||||||
|
Operating
lease obligations
|
$
|
11,154
|
$
|
3,576
|
$
|
5,196
|
$
|
2,382
|
$
|
—
|
||||||||||
|
Asset
retirement obligations
|
321
|
—
|
321
|
—
|
—
|
|||||||||||||||
|
Total
|
$
|
11,475
|
$
|
3,576
|
$
|
5,517
|
$
|
2,382
|
$
|
—
|
||||||||||
Effective
October 1, 2007, the Company adopted a FASB guidance on tax provisions and
reclassified $0.2 million of gross unrecognized tax benefits to Other
liabilities—non-current in our Consolidated Balance Sheets. As of September 30,
2009, the Company had $1.0 million of gross unrecognized tax benefits. As of
September 30, 2009, the Company cannot make a reasonably reliable estimate of
the period in which these liabilities may be settled with the respective tax
authorities. See Note 11 to the Consolidated Financial Statements for additional
information.
We
believe that the effects of our strategic actions implemented to improve revenue
as well as to control costs will be adequate to reduce the near term level of
cash used by operations, which, when considered with existing cash balances,
will be sufficient to meet our working capital and operating resource
expenditure requirements for the near term. If the global economy weakens
further, additional declines in cash balances could occur.
We
anticipate that operating expenses will continue to be a material use of our
cash resources. We may utilize cash resources to fund acquisitions, purchase
minority ownership interests in other companies, or fund investments in other
businesses, technologies or product lines. In the long-term, we may require
additional funds to support our working capital and operating expense
requirements or for other purposes, and may seek to raise these additional funds
through public or private debt or equity financings. There can be no assurance
that this additional financing will be available, or if available, will be on
reasonable terms. Failure to generate sufficient revenues or to control spending
could adversely affect our ability to achieve our business
objectives.
Indemnification
See
Note 9 to the Consolidated Financial Statements for detailed information
regarding our indemnifications.
Off
Balance Sheet Arrangements
None.
|
QUANTITATIVE
AND QUALITATIVE DISCLOSURES ABOUT MARKET
RISK
|
We
are exposed to the impact of interest rate changes and foreign currency
fluctuations.
Interest Rate Risk. The
primary objective of our investment activities is to preserve principal while at
the same time maximizing yields without significantly increasing risk. To
achieve this objective, we primarily invested in money market accounts and
short-term certificates of deposit. Due to the nature of these investments, the
Company did not have a material interest rate risk at September 30,
2009.
Foreign Currency Risk.
International revenues accounted for approximately 65%, 48%, and 47% of total
revenues for years ended September 30, 2009, 2008, and 2007 respectively. The
Company’s international operations have increased our exposure to foreign
currency fluctuations. Revenues and related expense generated from our
international subsidiaries are generally denominated in the functional
currencies of the local countries. Primary currencies include the United Kingdom
Pound Sterling, the Euro, the Canadian Dollar, and the Chinese Yuan. The
Consolidated Statement of Operations is translated into United States Dollars at
the average exchange rates in each applicable period. To the extent the United
States Dollar strengthens against foreign currencies, the translation of these
foreign currency denominated transactions results in reduced revenues, operating
expense, and net income for our international operations. Similarly, our
revenues, operating expenses, and net income will increase for our international
operations, if the United States Dollar weakens against foreign currencies. We
do not hedge our exposure to foreign currency fluctuations.
We
are also exposed to foreign exchange rate fluctuations as we convert the
financial statements of our foreign subsidiaries and our investments in equity
interests into United States dollars in consolidation. If there is a change in
foreign currency exchange rates, the conversion of the foreign subsidiaries’
financial statements into United States dollars will lead to a translation gain
or loss which is recorded as a component of accumulated other comprehensive
income which is a component of Stockholders’ Equity. In addition, we have
certain assets and liabilities that are denominated in currencies other than the
relevant entity’s functional currency. Changes in the functional currency value
of these assets and liabilities create fluctuations that will lead to a
transaction gain or loss. For the years ended September 30, 2009, 2008 and 2007,
we recorded net foreign currency transaction gains and (losses), of
approximately less than $(0.1) million, $0.3 million, and $0.6 million,
respectively, which were recorded in Other income, net, in the Consolidated
Statements of Operations.
|
CONSOLIDATED
FINANCIAL STATEMENTS AND SUPPLEMENTARY
DATA
|
Index
to Consolidated Financial Statements
Chordiant
Software, Inc. and Subsidiaries: Consolidated Financial Statements for the Years
Ended September 30, 2009, 2008 and 2007.
|
Consolidated
Financial Statements:
|
|
|
56
|
|
|
57
|
|
|
58
|
|
|
59
|
|
|
60
|
|
|
61
|
|
|
Financial
Statement Schedule:
|
|
|
96
|
All
other schedules are omitted because they are not applicable or the required
information is shown in the Consolidated Financial Statements or Notes
thereto.
Report
of Independent Registered Public Accounting Firm
Board
of Directors and Stockholders
Chordiant
Software, Inc.
Cupertino,
California
We
have audited the accompanying consolidated balance sheets of Chordiant Software,
Inc. as of September 30, 2009 and 2008, and the related consolidated statements
of operations, stockholders’ equity and comprehensive income (loss), and cash
flows for each of the three years in the period ended September 30, 2009. In
connection with our audits of the financial statements, we have also audited the
financial statement schedules listed in the accompanying index. These
financial statements and schedules are the responsibility of the Company’s
management. Our responsibility is to express an opinion on these
financial statements and schedules based on our audits.
We
conducted our audits in accordance with the standards of the Public Company
Accounting Oversight Board (United States). Those standards require
that we plan and perform the audit to obtain reasonable assurance about whether
the financial statements are free of material misstatement. An audit also
includes examining, on a test basis, evidence supporting the amounts and
disclosures in the financial statements, assessing the accounting principles
used and significant estimates made by management, as well as evaluating the
overall presentation of the financial statements and schedules. We
believe that our audits provide a reasonable basis for our opinion.
In
our opinion, the consolidated financial statements referred to above present
fairly, in all material respects, the financial position of Chordiant Software,
Inc. at September 30, 2009 and 2008, and the results of its operations and its
cash flows for each of the three years in the period ended September 30,
2009, in conformity with
accounting principles generally accepted in the United States of
America.
Also,
in our opinion, the financial statement schedules, when considered in relation
to the basic consolidated financial statements taken as a whole, present fairly,
in all material respects, the information set forth therein.
We
also have audited, in accordance with the standards of the Public Company
Accounting Oversight Board (United States), Chordiant Software Inc.'s internal
control over financial reporting as of September 30, 2009, based on criteria
established in Internal
Control – Integrated Framework issued by the Committee of Sponsoring
Organizations of the Treadway Commission (COSO) and our report dated November
19, 2009 expressed an unqualified opinion thereon.
/s/
BDO Seidman, LLP
San
Jose, California
November
19, 2009
CONSOLIDATED
BALANCE SHEETS
(in
thousands, except per share data)
|
September
30,
|
||||||||
|
2009
|
2008
|
|||||||
|
ASSETS
|
||||||||
|
Current
assets:
|
||||||||
|
Cash
and cash equivalents
|
$
|
49,863
|
$
|
55,516
|
||||
|
Accounts
receivable, net
|
16,708
|
24,873
|
||||||
|
Prepaid
expenses and other current assets
|
4,006
|
8,168
|
||||||
|
Total
current assets
|
70,577
|
88,557
|
||||||
|
Property
and equipment, net
|
1,850
|
3,165
|
||||||
|
Goodwill
|
22,608
|
22,608
|
||||||
|
Intangible
assets, net
|
303
|
1,514
|
||||||
|
Deferred
tax assets—non-current
|
3,480
|
6,849
|
||||||
|
Other
assets
|
2,491
|
2,007
|
||||||
|
Total
assets
|
$
|
101,309
|
$
|
124,700
|
||||
|
LIABILITIES
AND STOCKHOLDERS’ EQUITY
|
||||||||
|
Current
liabilities:
|
||||||||
|
Accounts
payable
|
$
|
3,809
|
$
|
7,711
|
||||
|
Accrued
expenses
|
6,334
|
9,456
|
||||||
|
Deferred
revenue
|
28,704
|
33,503
|
||||||
|
Total
current liabilities
|
38,847
|
50,670
|
||||||
|
Deferred
revenue—long-term
|
9,257
|
12,831
|
||||||
|
Other
liabilities—non-current
|
1,069
|
818
|
||||||
|
Restructuring
costs, net of current portion
|
123
|
529
|
||||||
|
Total
liabilities
|
49,296
|
64,848
|
||||||
|
Commitments
and contingencies (Notes 6, 8, 9, and 10)
|
||||||||
|
Stockholders’
equity:
|
||||||||
|
Preferred
stock, $0.001 par value; 51,000 shares authorized (500 shares designated
as Series A Junior Participating Preferred Stock); none issued and
outstanding at September 30, 2009 and 2008
|
—
|
—
|
||||||
|
Common
stock, $0.001 par value; 300,000 shares authorized; 30,208 and 30,076
shares issued and outstanding at September 30, 2009 and 2008,
respectively
|
30
|
30
|
||||||
|
Additional
paid-in capital
|
285,666
|
281,910
|
||||||
|
Accumulated
deficit
|
(236,614
|
)
|
(225,850
|
)
|
||||
|
Accumulated
other comprehensive income
|
2,931
|
3,762
|
||||||
|
Total
stockholders’ equity
|
52,013
|
59,852
|
||||||
|
Total
liabilities and stockholders’ equity
|
$
|
101,309
|
$
|
124,700
|
||||
The
accompanying notes are an integral part of these consolidated financial
statements.
CONSOLIDATED
STATEMENTS OF OPERATIONS
(in
thousands, except per share data)
|
Years
Ended September 30,
|
||||||||||||
|
2009
|
2008
|
2007
|
||||||||||
|
Revenues:
|
||||||||||||
|
License
|
$
|
22,462
|
$
|
34,111
|
$
|
54,052
|
||||||
|
Service,
including related party items aggregating nil, $116, and $252 for the
years ended September 30, 2009, 2008, and 2007,
respectively
|
55,000
|
78,853
|
70,495
|
|||||||||
|
Total
revenues
|
77,462
|
112,964
|
124,547
|
|||||||||
|
Cost
of revenues:
|
||||||||||||
|
License
|
400
|
1,059
|
1,813
|
|||||||||
|
Service
, including related party items aggregating nil, nil, and $72 for the
years ended September 30, 2009, 2008, and 2007,
respectively
|
22,249
|
34,012
|
30,329
|
|||||||||
|
Amortization
of intangible assets
|
1,211
|
1,211
|
1,211
|
|||||||||
|
Total
cost of revenues
|
23,860
|
36,282
|
33,353
|
|||||||||
|
Gross
profit
|
53,602
|
76,682
|
91,194
|
|||||||||
|
Operating
expenses:
|
||||||||||||
|
Sales
and marketing
|
26,786
|
34,722
|
32,597
|
|||||||||
|
Research
and development
|
18,998
|
25,598
|
27,546
|
|||||||||
|
General
and administrative
|
13,293
|
17,995
|
19,898
|
|||||||||
|
Restructuring
expense
|
784
|
—
|
6,543
|
|||||||||
|
Total
operating expenses
|
59,861
|
78,315
|
86,584
|
|||||||||
|
Income
(loss) from operations
|
(6,259
|
)
|
(1,633
|
)
|
4,610
|
|||||||
|
Interest
income, net
|
520
|
2,383
|
2,198
|
|||||||||
|
Other
income, net
|
9
|
417
|
822
|
|||||||||
|
Income
(loss) before income taxes
|
(5,730
|
)
|
1,167
|
7,630
|
||||||||
|
Provision
for income taxes
|
5,034
|
102
|
1,602
|
|||||||||
|
Net
income (loss)
|
$
|
(10,764
|
)
|
$
|
1,065
|
$
|
6,028
|
|||||
|
Net
income (loss) per share:
|
||||||||||||
|
Basic
|
$
|
(0.36
|
)
|
$
|
0.03
|
$
|
0.19
|
|||||
|
Diluted
|
$
|
(0.36
|
)
|
$
|
0.03
|
$
|
0.18
|
|||||
|
Weighted
average shares used in computing net income (loss) per
share:
|
||||||||||||
|
Basic
|
30,067
|
31,658
|
32,425
|
|||||||||
|
Diluted
|
30,067
|
31,957
|
33,261
|
|||||||||
The
accompanying notes are an integral part of these consolidated financial
statements.
CONSOLIDATED
STATEMENTS OF STOCKHOLDERS’ EQUITY AND COMPREHENSIVE INCOME (LOSS)
(in
thousands)
|
Common
Stock
|
||||||||||||||||||||||||
|
Shares
|
Amount
|
Additional
Paid-in
Capital
|
Accumulated
Deficit
|
Accumulated
Other
Comprehensive
Income
(Loss)
|
Total
Stockholders’
Equity
|
|||||||||||||||||||
|
Balance
at September 30, 2006
|
32,030
|
$
|
32
|
$
|
286,440
|
$
|
(232,943
|
)
|
$
|
3,696
|
$
|
57,225
|
||||||||||||
|
Comprehensive
income:
|
||||||||||||||||||||||||
|
Net
income
|
—
|
—
|
—
|
6,028
|
—
|
6,028
|
||||||||||||||||||
|
Unrealized
gain/loss on marketable securities, net
|
—
|
—
|
—
|
—
|
(2
|
)
|
(2
|
)
|
||||||||||||||||
|
Foreign
currency translation gain
|
—
|
—
|
—
|
—
|
899
|
899
|
||||||||||||||||||
|
Total
comprehensive income
|
—
|
—
|
—
|
—
|
—
|
6,925
|
||||||||||||||||||
|
Exercise
of stock options
|
1,328
|
1
|
6,113
|
—
|
—
|
6,114
|
||||||||||||||||||
|
Cancellation
of restricted stock awards
|
(137
|
)
|
—
|
—
|
—
|
—
|
—
|
|||||||||||||||||
|
Stock-based
compensation-stock options
|
—
|
—
|
2,870
|
—
|
—
|
2,870
|
||||||||||||||||||
|
Stock-based
compensation-restricted stock awards
|
—
|
—
|
150
|
—
|
—
|
150
|
||||||||||||||||||
|
Tax
benefit from stock options
|
—
|
—
|
77
|
—
|
—
|
77
|
||||||||||||||||||
|
Balance
at September 30, 2007
|
33,221
|
33
|
295,650
|
(226,915
|
)
|
4,593
|
73,361
|
|||||||||||||||||
|
Comprehensive
income:
|
||||||||||||||||||||||||
|
Net
income
|
—
|
—
|
—
|
1,065
|
—
|
1,065
|
||||||||||||||||||
|
Unrealized
gain/loss on marketable securities, net
|
—
|
—
|
—
|
—
|
2
|
2
|
||||||||||||||||||
|
Foreign
currency translation loss
|
—
|
—
|
—
|
—
|
(833
|
)
|
(833
|
)
|
||||||||||||||||
|
Total
comprehensive income
|
—
|
—
|
—
|
—
|
—
|
234
|
||||||||||||||||||
|
Exercise
of stock options
|
135
|
0
|
730
|
—
|
—
|
730
|
||||||||||||||||||
|
Issuance
of restricted stock awards
|
71
|
—
|
—
|
—
|
—
|
—
|
||||||||||||||||||
|
Repurchase
and retirement of common stock
|
(3,351
|
)
|
(3
|
)
|
(18,595
|
)
|
—
|
—
|
(18,598
|
)
|
||||||||||||||
|
Stock-based
compensation-stock options
|
—
|
—
|
3,777
|
—
|
—
|
3,777
|
||||||||||||||||||
|
Stock-based
compensation-restricted stock awards
|
—
|
—
|
348
|
—
|
—
|
348
|
||||||||||||||||||
|
Stock-based
compensation-restricted stock units
|
—
|
—
|
0
|
—
|
—
|
—
|
||||||||||||||||||
|
Balance
at September 30, 2008
|
30,076
|
30
|
281,910
|
(225,850
|
)
|
3,762
|
59,852
|
|||||||||||||||||
|
Comprehensive
loss
|
||||||||||||||||||||||||
|
Net
loss
|
—
|
—
|
—
|
(10,764
|
)
|
—
|
(10,764
|
)
|
||||||||||||||||
|
Foreign
currency translation loss
|
—
|
—
|
—
|
—
|
(831
|
)
|
(831
|
)
|
||||||||||||||||
|
Total
comprehensive loss
|
—
|
—
|
—
|
—
|
—
|
(11,595
|
)
|
|||||||||||||||||
|
Exercise
of stock options
|
42
|
0
|
88
|
—
|
—
|
88
|
||||||||||||||||||
|
Issuance
of restricted stock awards
|
90
|
—
|
—
|
—
|
—
|
—
|
||||||||||||||||||
|
Stock-based
compensation-stock options
|
—
|
—
|
2,892
|
—
|
—
|
2,892
|
||||||||||||||||||
|
Stock-based
compensation-restricted stock awards
|
—
|
—
|
369
|
—
|
—
|
369
|
||||||||||||||||||
|
Stock-based
compensation-restricted stock units
|
—
|
—
|
407
|
—
|
—
|
407
|
||||||||||||||||||
|
Balance
at September 30, 2009
|
30,208
|
$
|
30
|
$
|
285,666
|
$
|
(236,614
|
)
|
$
|
2,931
|
$
|
52,013
|
||||||||||||
The
accompanying notes are an integral part of these consolidated financial
statements.
CONSOLIDATED
STATEMENTS OF CASH FLOWS
(in
thousands)
|
Years
Ended September 30,
|
||||||||||||
|
2009
|
2008
|
2007
|
||||||||||
|
Cash
flows from operating activities:
|
||||||||||||
|
Net
income (loss)
|
$
|
(10,764
|
)
|
$
|
1,065
|
$
|
6,028
|
|||||
|
Adjustments
to reconcile net income (loss) to net cash provided by (used in) operating
activities:
|
||||||||||||
|
Depreciation
and amortization
|
1,636
|
1,766
|
1,611
|
|||||||||
|
Amortization
of intangibles and capitalized software
|
1,504
|
2,149
|
2,133
|
|||||||||
|
Non-cash
stock-based compensation expense
|
3,668
|
4,125
|
3,020
|
|||||||||
|
Excess
tax benefits from stock-based compensation
|
—
|
—
|
(77
|
)
|
||||||||
|
Provision
(reversal) for doubtful accounts
|
(125
|
)
|
663
|
82
|
||||||||
|
Non-cash
provision (benefit) for income taxes
|
3,418
|
(511
|
)
|
—
|
||||||||
|
(Gain)/loss
on disposal of assets
|
—
|
(8
|
)
|
673
|
||||||||
|
Accretion
of discounts on investments
|
—
|
(56
|
)
|
(131
|
)
|
|||||||
|
Other
non-cash charges
|
—
|
—
|
445
|
|||||||||
|
Changes
in assets and liabilities:
|
||||||||||||
|
Accounts
receivable
|
7,291
|
1,129
|
(11,825
|
)
|
||||||||
|
Prepaid
expenses and other current assets
|
2,509
|
96
|
(59
|
)
|
||||||||
|
Other
assets
|
(626
|
)
|
(249
|
)
|
2,585
|
|||||||
|
Accounts
payable
|
(3,694
|
)
|
(222
|
)
|
238
|
|||||||
|
Accrued
expenses, other long term liabilities and restructuring
|
(2,936
|
)
|
(4,245
|
)
|
(2,383
|
)
|
||||||
|
Deferred
revenue
|
(5,706
|
)
|
(19,383
|
)
|
36,573
|
|||||||
|
Net
cash provided by (used in) operating activities
|
(3,825
|
)
|
(13,681
|
)
|
38,913
|
|||||||
|
Cash
flows from investing activities:
|
||||||||||||
|
Property
and equipment purchases
|
(387
|
)
|
(1,353
|
)
|
(2,809
|
)
|
||||||
|
Capitalized
product development costs
|
(135
|
)
|
(413
|
)
|
(257
|
)
|
||||||
|
Proceeds
from release of restricted cash
|
—
|
223
|
215
|
|||||||||
|
Purchases
of marketable securities and short term investments
|
—
|
(5,099
|
)
|
(18,028
|
)
|
|||||||
|
Proceeds
from sale and maturities of short term investments
|
—
|
17,322
|
6,000
|
|||||||||
|
Net
cash provided by (used in) investing activities
|
(522
|
)
|
10,680
|
(14,879
|
)
|
|||||||
|
Cash
flows from financing activities:
|
||||||||||||
|
Proceeds
from exercise of stock options
|
88
|
730
|
6,191
|
|||||||||
|
Repurchase
of common stock
|
—
|
(18,598
|
)
|
—
|
||||||||
|
Payment
on capital leases
|
—
|
—
|
(96
|
)
|
||||||||
|
Excess
tax benefits from stock-based compensation
|
—
|
—
|
77
|
|||||||||
|
Net
cash provided by (used in) financing activities
|
88
|
(17,868
|
)
|
6,172
|
||||||||
|
Effect
of exchange rate changes
|
(1,394
|
)
|
(1,602
|
)
|
2,503
|
|||||||
|
Net
increase (decrease) in cash and cash equivalents
|
(5,653
|
)
|
(22,471
|
)
|
32,709
|
|||||||
|
Cash
and cash equivalents at beginning of the year
|
55,516
|
77,987
|
45,278
|
|||||||||
|
Cash
and cash equivalents at end of the year
|
$
|
49,863
|
$
|
55,516
|
$
|
77,987
|
||||||
|
Supplemental
cash flow information:
|
||||||||||||
|
Cash
paid for interest
|
$
|
5
|
$
|
2
|
$
|
3
|
||||||
|
Cash
paid for income taxes
|
$
|
1,269
|
$
|
567
|
$
|
1,669
|
||||||
The
accompanying notes are an integral part of these consolidated financial
statements.
CHORDIANT
SOFTWARE, INC.
NOTES
TO CONSOLIDATED FINANCIAL STATEMENTS
Chordiant
Software, Inc., or the Company, or Chordiant, is an enterprise software vendor
that offers software solutions for global business-to-consumer companies that
seek to improve the quality of their customer interactions and to reduce costs
through increased employee productivity and process efficiencies. The Company
concentrates on serving global customers in insurance, healthcare,
telecommunications, financial services, and other consumer direct industries.
The Company was incorporated in California in March 1991 and reincorporated in
Delaware in October 1997.
The
Company delivers customer solutions that include software applications and tools
and services that enable businesses to integrate their customer information and
corporate systems so that they can have an accurate, real-time view of their
customers across multiple forms of customer interaction. The Company also offers
a suite of predictive and adaptive decisioning applications.
The
Company believes its solutions offer flexibility to businesses to set business
policies and processes to control the quality of servicing, fulfillment and
marketing to their customers. The Company’s solutions enable its customers to
control and change their business policies and processes. The Company believes
that it is a leader in providing business process driven solutions for customer
management.
The
Company’s software solutions and architecture are based on leading industry
standards that are widely adopted by business customers in the industries the
Company serves. The Company believes these solutions are capable of being the
foundation for contemporary distributed computing environments required by
global business-to-consumer enterprises.
NOTE
2—SUMMARY OF SIGNIFICANT ACCOUNTING POLICIES
Principles
of Consolidation
The
accompanying consolidated financial statements include accounts of the Company
and its wholly-owned subsidiaries. All significant intercompany transactions and
balances have been eliminated in consolidation.
Use
of Estimates
The
preparation of Consolidated Financial Statements in conformity with Generally
Accepted Accounting Principles or GAAP in the United States of America requires
the Company to make estimates and assumptions that affect the reported amounts
of assets and liabilities, disclosures of contingent assets and liabilities at
the date of the financial statements and the reported amounts of revenues and
expenses during the reporting periods.
On
an on-going basis, the Company evaluates the estimates, including those related
to our allowance for doubtful accounts, the valuation of stock-based
compensation, the valuation of goodwill and intangible assets, the valuation of
deferred tax assets, restructuring expenses, contingencies, vendor specific
objective evidence or VSOE of fair value in multiple element arrangements and
the estimates associated with the percentage-of-completion method of accounting
for certain of our revenue contracts. The Company bases the estimates on
historical experience and on various other assumptions that are believed to be
reasonable. Actual results may differ materially from these estimates under
different assumptions or conditions.
Cash,
Cash Equivalents and Marketable Securities
Cash
equivalents consist of highly liquid instruments purchased with an original
maturity of three months or less. The Company invests primarily in money market
funds as these investments have historically been subject to minimal credit and
market risks.
Historically
the Company’s marketable securities have been classified as available-for-sale.
In accordance with a Financial Accounting Standards Board or FASB standard,
available-for-sale securities are carried at fair value with unrealized gains
and losses included as a separate component of Stockholder’s Equity, net of any
tax effect. Realized gains and losses and declines in value determined by
management to be other than temporary on these investments are included in
interest income and expense when held. The Company periodically evaluates these
investments for other-than-temporary impairment. For the purposes of computing
realized gains and losses, cost is identified on a specific identification
basis. As
CHORDIANT
SOFTWARE, INC.
NOTES TO CONSOLIDATED FINANCIAL
STATEMENTS-(Continued)
of
September 30, 2009 and 2008, the Company held no marketable securities. For the
year ended September 30, 2008, less than $0.1 million of gains were realized on
the sale of marketable securities. For the years ended September 30, 2009 and
2007, no gains or losses were realized on the sale of marketable
securities.
Restricted
Cash
At
September 30, 2009 and 2008, interest bearing certificates of deposit were
classified as restricted cash. These restricted cash balances serve as
collateral for letters of credit securing certain lease obligations. These
restricted cash balances are classified in Other assets in the Consolidated
Balance Sheets. See Note 5 for restricted cash balances at each balance sheet
date.
Fair
Value of Financial Instruments
The
Company’s financial instruments, including cash and cash equivalents, accounts
receivable, accounts payable and borrowings are carried at cost, which
approximates fair value because of the short-term nature of these instruments.
The reported amount of borrowings approximates fair value because of the market
value interest rates that these debts bear. As of September 30, 2009, the
Company had no borrowings.
During
the years ended September 30, 2009, 2008, and 2007, the Company did not enter
into any foreign currency forward exchange contracts.
Revenue
recognition
The
Company derives revenue from licensing software and related services, which
include assistance in implementation, customization and integration,
post-contract customer support or PCS , training and consulting. All revenue
amounts are presented net of sales taxes in the Company’s Consolidated
Statements of Operations. The amount and timing of revenue is difficult to
predict and any shortfall in revenue or delay in recognizing revenue could cause
operating results to vary significantly from period to period and could result
in operating losses. The accounting rules related to revenue recognition are
complex and are affected by the interpretation of the rules and an understanding
of industry practices, both of which are subject to change. Consequently, the
revenue recognition accounting rules require management to make significant
estimates based on judgment.
For
arrangements with multiple elements, the Company recognizes revenue for services
and PCS based upon the fair value VSOE of the respective elements. The fair
value VSOE of the services element is based upon the standard hourly rates
charged for the services when such services are sold separately. The fair value
VSOE for annual PCS is generally established with the contractual future renewal
rates included in the contracts, when the renewal rate is substantive and
consistent with the fees when support services are sold separately. When
contracts contain multiple elements and fair value VSOE exists for all
undelivered elements, the Company accounts for the delivered elements,
principally the license portion, based upon the “residual method” as prescribed
by relevant accounting guidance on software recognition. In multiple element
transactions where VSOE is not established for an undelivered element, revenue
is recognized upon the establishment of VSOE for that element or when the
element is delivered.
At
the time a transaction is entered into, the Company assesses whether any
services included within the arrangement relate to significant implementation or
customization that is essential to the functionality of our products. For
contracts for products that do not involve significant implementation or
customization essential to the product functionality, the Company recognizes
license revenue when there is persuasive evidence of an arrangement, the fee is
fixed or determinable, collection of the fee is probable and delivery has
occurred as prescribed by relevant accounting guidance on revenue recognition.
For contracts that involve significant implementation or customization services
essential to the functionality of our products, the license and professional
consulting services revenue is recognized using either the
percentage-of-completion method or the completed contract method.
The
percentage-of-completion method is applied when the Company has the ability to
make reasonably dependable estimates of the total effort required for completion
using labor hours incurred as the measure of progress towards
CHORDIANT
SOFTWARE, INC.
NOTES TO CONSOLIDATED FINANCIAL
STATEMENTS-(Continued)
completion.
The progress toward completion is measured based on the “go-live” date. The
“go-live” date is defined as the date the essential product functionality has
been delivered, or the application enters into a production environment or the
point at which no significant additional Chordiant supplied professional service
resources are required. Estimates are subject to revisions as the contract
progresses to completion and these changes are accounted for as changes in
accounting estimates when the information becomes known. Information impacting
estimates obtained after the balance sheet date but before the issuance of the
financial statements is used to update the estimates. Provisions for estimated
contract losses, if any, are recognized in the period in which the loss becomes
probable and can be reasonably estimated. When additional licenses are sold
related to the original licensing agreement, revenue is recognized upon delivery
if the project has reached the go-live date, or if the project has not reached
the go-live date, revenue is recognized under the percentage-of-completion
method. Revenue from these arrangements is classified as license and service
revenue based upon the estimated fair value of each element using the residual
method.
The
completed contract method is applied when the Company is unable to obtain
reasonably dependable estimates of the total effort required for completion.
Under the completed contract method, all revenue and related costs of revenue
are deferred and recognized upon completion.
For
product co-development arrangements relating to software products in development
prior to the consummation of the individual arrangements, where the Company
retains the intellectual property being developed, and intends to sell the
resulting products to other customers, license revenue is deferred until the
delivery of the final product, provided all other requirements of the guidance
on software revenue recognition are met. Expenses associated with these
co-development arrangements are normally expensed as incurred as they are
considered to be research and development costs that do not qualify for
capitalization or deferral.
Revenue
from subscription or term license agreements, which include software and rights
to unspecified future products or maintenance, is recognized ratably over the
term of the subscription period. Revenue from subscription or term license
agreements, which include software, but exclude rights to unspecified future
products and maintenance, is recognized upon delivery of the software if all
conditions of recognizing revenue have been met, including that the related
agreement is non-cancelable, non-refundable and provided on an unsupported
basis.
For
transactions involving extended payment terms, the Company deems these fees not
to be fixed or determinable for revenue recognition purposes and revenue is
deferred until the fees become due and payable.
For
arrangements with multiple elements accounted for under relevant accounting
guidance where the Company determines it can account for the elements separately
and the fees are not fixed or determinable due to extended payment terms,
revenue is recognized in the following manner. If the undelivered element is
PCS, or other services, an amount equal to the estimated value of the services
to be rendered prior to the next payment becoming due is allocated to the
undelivered services. The residual of the payment is allocated to the delivered
elements of the arrangement.
For
arrangements with multiple elements accounted for under the relevant accounting
guidance where the Company determines it can account for the elements separately
and the fees are not fixed or determinable due to extended payment terms,
revenue is recognized in the following manner. Amounts are first allocated to
the undelivered elements included in the arrangement, as payments become due or
are received, the residual is allocated to the delivered elements.
Revenue
for PCS is recognized ratably over the support period which ranges from one to
five years.
Training
and consulting services revenue is recognized as such services are performed on
an hourly or daily basis for time and material contracts. For consulting
services arrangements with a fixed fee, revenue is recognized on a
percentage-of-completion basis.
For
all sales, either a signed license agreement or a binding purchase order with an
underlying master license agreement is used as evidence of an arrangement. Sales
through third party systems integrators are evidenced by a master agreement
governing the relationship together with binding purchase orders or order forms
on a transaction-by-transaction basis. Revenues from reseller arrangements are
recognized on the “sell-through” method, when the reseller reports to the
Company the sale of software products to end-users. The Company’s agreements
with customers and resellers do not contain product return
rights.
CHORDIANT
SOFTWARE, INC.
NOTES TO CONSOLIDATED FINANCIAL
STATEMENTS-(Continued)
Collectability
is assessed based on a number of factors, including past transaction history
with the customer and the credit-worthiness of the customer. Collateral is
generally not requested from customers. If it is determined that the collection
of a fee is not probable, the revenue is recognized at the time the collection
becomes probable, which is generally upon the receipt of cash.
Stock-based
Compensation
The
Company measures and recognizes compensation expense for all share-based payment
awards made to employees and directors including employee stock options,
restricted stock awards or RSAs, restricted stock units or RSUs, and employee
stock purchases related to the Employee Stock Purchase Plan, or ESPP, based on
estimated fair values in accordance with a FASB standard on stock compensation.
The FASB standard requires companies to estimate the fair value of share-based
payment awards on the date of grant using an option-pricing model. The value of
the portion of the award that is ultimately expected to vest is recognized as
expense over the requisite service periods in the Consolidated Statement of
Operations.
The
Company estimates the fair value of shared-based payment awards on the date of
grant using the Black-Scholes model. We used the trinomial lattice valuation
technique to determine the assumptions used in the Black-Scholes model. The
trinomial lattice valuation technique was used to provide better estimates of
fair values and meet the fair value objectives of the FASB
standard.
The
Company’s determination of fair value of share-based payment awards on the date
of grant is affected by the Company’s stock price as well as assumptions
regarding a number of highly complex and subjective variables. These variables
include, but are not limited to the Company’s expected stock price volatility
over the term of the awards, and actual and projected employee stock option
exercise behaviors. Because changes in the subjective assumptions can materially
affect the estimated value, in management’s opinion, the existing valuation
models may not provide an accurate measure of the fair value of the Company’s
employee stock options. Although the fair value of stock options, RSAs, and RSUs
is determined in accordance with the an option-pricing model, that value may not
be indicative of the fair value observed in a willing buyer/willing seller
market transaction.
As
stock-based compensation expense recognized in the Consolidated Statement of
Operations for the years ended September 30, 2009, 2008, and 2007 is based on
awards ultimately expected to vest, it has been reduced for estimated
forfeitures. The FASB standard requires forfeitures to be estimated at the time
of grant and revised, if necessary, in subsequent periods if actual forfeitures
differ from those estimates.
There
was no stock-based compensation expense related to the ESPP recognized during
the years ended September 30, 2009, 2008 and 2007 as it’s currently suspended.
See Note 12 for additional information.
Settlement
of Intercompany Loan
In
June 2009, a long term intercompany account from the U.S. parent to the U.K.
subsidiary in the original amount of $22.9 million was settled. The settlement
of this long term intercompany account resulted in a foreign currency
translation gain which is classified as a component of Accumulated Other
Comprehensive Income in the 2009 Consolidated Balance Sheet.
Concentrations
of Credit Risk
Financial
instruments that potentially subject the Company to concentrations of credit
risk consist of cash, cash equivalents, restricted cash, and accounts
receivable. To date, the Company has invested excess funds in money market
accounts, commercial paper, corporate bonds, and certificates-of-deposit. The
Company has cash and cash equivalents on deposit at various large banks and
institutions domestically and internationally.
The
Company’s accounts receivable are derived from sales to customers located in
North America, Europe, and elsewhere in the world. The Company performs ongoing
credit evaluations of customers’ financial condition and, generally, requires no
collateral from customers. The Company maintains an allowance for doubtful
accounts when deemed necessary.
CHORDIANT
SOFTWARE, INC.
NOTES TO CONSOLIDATED FINANCIAL
STATEMENTS-(Continued)
The
Company estimates its allowance for doubtful accounts by analyzing accounts
receivable for specific risk accounts as well as providing for a general
allowance amount based on historical billing dispute percentages. The estimate
considers historical bad debts, customer concentrations, customer
credit-worthiness and current economic trends. Based upon current economic
conditions, the Company reviewed accounts receivable and has recorded allowances
as deemed necessary.
Some
of our current or prospective customers have recently been facing financial
difficulties. Customers that have accounted for significant revenues in the past
may not generate revenues in any future period, causing any failure to obtain
new significant customers or additional orders from existing customers to
materially affect our operating results. The following table summarizes the
revenues from customers that accounted for 10% or more of total
revenues:
|
Year Ended September
30,
|
||||||||||
|
2009
|
2008
|
2007
|
||||||||
|
Vodafone
Group Services Limited and affiliated companies
|
20
|
%
|
11
|
%
|
*
|
|||||
|
Citicorp
Credit Services, Inc.
|
10
|
%
|
22
|
%
|
23
|
%
|
||||
|
International
Business Machine (IBM)
|
*
|
*
|
16
|
%
|
||||||
* Represents
less than 10% of total revenues.
At
September 30, 2009, General Motors Corporation, the Royal Bank of Scotland plc,
and Turkiye Is Bankasi, A.S. accounted for approximately 17%, 14% and 11% of our
accounts receivable, respectively. At September 30, 2008, Citicorp Credit
Services, Inc., Vodafone Group Services Limited and affiliated companies, and
IBM accounted for approximately 19%, 18% and 13% of our accounts receivable,
respectively.
Research
and Development
Software
development costs are expensed as incurred until technological feasibility of
the underlying software product is achieved. After technological feasibility is
established, software development costs are capitalized until general
availability of the product. Capitalized costs are then amortized at the greater
of a straight line basis over the estimated product life, or the ratio of
current revenue to total projected product revenue.
During
fiscal years 2008 and 2009, technological feasibility to port existing products
to new platforms was established through the completion of detailed program
designs. Costs aggregating $0.5 million associated with these products have been
capitalized and included in Other Assets as of September 30, 2009. As porting of
these products are completed, the capitalized costs are being amortized using
the straight-line method over the estimated economic life of the product which
is 36 months. For the years ended September 30, 2009 and 2008, amortization
expense, included in cost of revenue for licenses related to these products was
$0.1 million and less than $0.1 million, respectively. As of September 30, 2009,
the unamortized expense was approximately $0.4 million.
During
the quarter ended September 30, 2006, technological feasibility to port an
existing product to a new platform was established through the completion of a
detailed program design. Costs aggregating $0.5 million associated with this
product were capitalized and included in Other assets as of September 30, 2007.
This product was completed and became available for general release in July
2007, accordingly, the capitalized costs are being amortized using the
straight-line method over the remaining estimated economic life of the product
which is 36 months. For the years ended September 30, 2009, 2008 and 2007,
amortization expense, included in cost of revenue for licenses related to this
product was $0.2 million, $0.2 million and less than $0.1 million, respectively.
As of September 30, 2009, the unamortized expense was $0.1 million.
During
the quarter ended September 30, 2004, technological feasibility for an acquired
banking product was established through the completion of a detailed program
design. Costs aggregating $2.7 million associated with this product were
capitalized and included in Other assets as of September 30, 2005. During the
quarter ended September 30, 2005, the product became available for general
release and, accordingly, the costs capitalized commenced to be amortized. The
capitalized costs were amortized using the straight-line method over the
estimated economic life of the product which was 36 months. For the years ended
September 30, 2008 and 2007, amortization expense related to this product was
approximately $0.7 million and $0.9 million, respectively. As of September 30,
2008, the product was fully amortized.
CHORDIANT
SOFTWARE, INC.
NOTES
TO CONSOLIDATED FINANCIAL STATEMENTS-(Continued)
Subsequent
Events
The
Company has evaluated subsequent events through the time that we filed these
financial statements in our Form 10-K Report with the SEC on November 19,
2009.
Property
and Equipment
Property
and equipment are recorded at cost. Depreciation is computed using the
straight-line method based upon the estimated useful lives of assets, which
range from three to seven years. Amortization of leasehold improvements is
calculated using the straight-line method over the shorter of the economic life
of the asset or the lease term. Purchased internal-use software consists
primarily of amounts paid for perpetual licenses to third party software
applications, which are amortized over their estimated useful lives, generally
three years. Depreciation and amortization expense was approximately $1.6
million, $1.7 million, and $1.5 million for the years ended September 30, 2009,
2008, and 2007, respectively.
As
required by FASB guidance, the Company has recorded an Asset Retirement
Obligation (ARO) of approximately $0.3 million and a corresponding increase in
leasehold improvements. The FASB guidance requires the recognition of a
liability for the fair value of a legally required conditional ARO when
incurred, if the liability’s fair value can be reasonability estimated. The fair
value of the liability is added to the carrying amount of the associated asset
and this additional carrying amount is amortized over the life of the
asset.
The
Company’s ARO is associated with leasehold improvements to facilities where the
Company is the lessee and the lease agreement contains a reinstatement clause,
which generally requires any leasehold improvements the Company makes to the
leased property be restored to their original condition at the end of the lease.
This amount represents the present value of the ARO and will be amortized over
the term of the lease.
Goodwill
and Intangible Assets
As
required by a FASB standard, the Company tests for impairment of goodwill and
other indefinite-lived assets on an annual basis, or more frequently if
indicators of impairment are present. Goodwill represents the excess of the
purchase price in a business combination over the fair value of net tangible and
intangible assets acquired. Intangible assets that are not considered to have an
indefinite useful life are amortized over their useful lives, which range from
one and one half to five years (See Note 5 to the Consolidated Financial
Statements). The carrying amount of these assets is reviewed whenever events or
changes in circumstances indicate that the carrying value of an asset may not be
recoverable. Recoverability of these assets is measured on a projected
discounted cash flow method using a discount rate determined by management to be
commensurate with the risk inherent in our current business model. If the asset
is considered to be impaired, the amount of any impairment is measured as the
difference between the carrying value and the fair value of the impaired asset.
The Company did not recognize any goodwill or intangible asset impairment
charges in the years ended September 30, 2009, 2008, and 2007.
In
the fiscal year ended September 30, 2008, the Company reduced goodwill by $9.5
million. The adjustment relates to a tax benefit attributable to our acquisition
in the United Kingdom. The adjustment of goodwill is discussed in Note 11 to the
Consolidated Financial Statements.
Royalties
The
Company has certain royalty commitments associated with the shipment and
licensing of certain products or components of products. Royalty expense is
generally based on a percentage of the underlying revenue and subject to minimum
and maximum amounts. Royalty expense was approximately $0.4 million, $0.5
million, and $1.8 million for the years ended September 30, 2009, 2008, and
2007, respectively.
Advertising
Costs
Advertising
costs are expensed to sales and marketing expense as incurred. Advertising costs
for the year ended September 30, 2009, 2008, and 2007 totaled approximately $0.2
million, $0.2 million, and $0.5 million, respectively.
CHORDIANT
SOFTWARE, INC.
NOTES
TO CONSOLIDATED FINANCIAL STATEMENTS-(Continued)
Foreign
Currency Translation
The
functional currency of our foreign entities is their respective local currency.
Foreign currency assets and liabilities are translated at the current exchange
rates at each balance sheet date. Revenues and expenses are translated at
weighted average exchange rates in effect during the year. The related
unrealized gains and losses from foreign currency translation are recorded in
Accumulated Other Comprehensive Income (Loss) as a separate component of
Stockholders’ Equity. Net gains and losses resulting from foreign exchange
transactions are included in Other Income, Net. For the years ended September
30, 2009, 2008 and 2007, the Company recorded net foreign currency transaction
gains and (losses) of approximately less than ($0.1) million, $0.3 million, and
$0.6 million, respectively.
Income
Taxes
In
accordance with a FASB standard, income taxes are accounted for using an asset
and liability approach, which requires the recognition of taxes payable or
refundable for the current period and deferred tax liabilities and assets for
the future tax consequences of events that have been recognized in our financial
statements or tax returns. The measurement of current and deferred tax
liabilities and assets is based on provisions of the enacted tax law; the
effects of future changes in tax laws or rates are not anticipated. The
measurement of deferred tax assets is reduced, if necessary, by the amount of
any tax benefits that, based on available evidence, are not expected to be
realized.
Effective
October 1, 2007, the Company adopted a FASB guidance on tax provisions that
prescribes a recognition threshold and measurement guidance for the financial
statement reporting of uncertain tax positions taken or expected to be taken in
a company’s income tax return. The application of this FASB guidance is
explained in Note 11 to the Consolidated Financial Statements.
Net
Income (Loss) Per Share
The
Company computes net income (loss) per share in accordance with a FASB standard.
Under the provisions of the FASB standard, basic net income (loss) per share is
computed by dividing the net income (loss) by the weighted average number of
common shares outstanding during the period. Diluted net income (loss) per share
is computed by dividing the net income (loss) for the period by the weighted
average number of common and potentially dilutive shares outstanding during the
period. Potentially dilutive shares, which consist of incremental shares
issuable upon the exercise of stock options, unvested RSAs (using the treasury
stock method), and unvested RSUs (using the treasury stock method), are included
in the calculation of diluted net income per share, in periods in which net
income is reported, to the extent such shares are dilutive. In accordance with
the FASB standard, unvested performance based RSUs are not included in the
computation of earnings per share as they are considered contingently issuable
shares. The calculation of diluted net loss per share excludes potential common
shares as their effect is anti-dilutive for the fiscal year ended September 30,
2009.
CHORDIANT
SOFTWARE, INC.
NOTES
TO CONSOLIDATED FINANCIAL STATEMENTS-(Continued)
The
following table sets forth the computation of basic and diluted net income
(loss) per share for the periods indicated (in thousands, except for per share
data):
|
Years ended September
30,
|
||||||||||||||
|
2009
|
2008
|
2007
|
||||||||||||
|
Net
income (loss) available to common stockholders
|
$
|
(10,764
|
)
|
$
|
1,065
|
$
|
6,028
|
|||||||
|
Denominator:
|
||||||||||||||
|
Weighted
average common stock outstanding
|
30,067
|
31,658
|
32,650
|
|||||||||||
|
Common
stock subject to repurchase
|
—
|
—
|
(225
|
)
|
||||||||||
|
Denominator
for basic calculation
|
30,067
|
31,658
|
32,425
|
|||||||||||
|
Effect
of dilutive potential common shares
|
—
|
(*)
|
252
|
836
|
||||||||||
|
Effect
of dilutive RSAs and RSUs
|
—
|
(*)
|
47
|
—
|
||||||||||
|
Denominator
for diluted calculation
|
30,067
|
31,957
|
33,261
|
|||||||||||
|
Net
income (loss) per share – basic
|
$
|
(0.36
|
)
|
$
|
0.03
|
$
|
0.19
|
|||||||
|
Net
income (loss) per share – diluted
|
$
|
(0.36
|
)
|
$
|
0.03
|
$
|
0.18
|
|||||||
(*)
– Dilutive potential common shares are excluded from the calculation of diluted
net loss per share.
The
following table sets forth the potential total common shares that are excluded
from the calculation of diluted net loss per share as their effect is
anti-dilutive as of the dates indicated (in thousands):
|
September
30,
2009
|
|||||||||
|
Stock
options
|
3,694
|
||||||||
|
RSAs
|
90
|
||||||||
|
RSUs
|
588
|
||||||||
|
4,372
|
NOTE
3—RECENT ACCOUNTING PRONOUNCEMENTS
In
October 2009, the FASB issued an Accounting Standard Update or ASU that that
amends software revenue recognition to remove from the scope of industry
specific revenue accounting guidance for software and software related
transactions, tangible products containing software components and non-software
components that function together to deliver the product’s essential
functionality. The ASU will be effective prospectively for revenue arrangements
entered into or materially modified in fiscal years beginning on or after June
15, 2010 and early adoption will be permitted. The Company is currently
evaluating the effects of implementing this ASU.
In
October 2009, the FASB issued an ASU that addresses criteria for separating the
consideration in multiple-element arrangements. The ASU 1will require companies
to allocate the overall consideration to each deliverable by using a best
estimate of the selling price of individual deliverables in the arrangement in
the absence of VSOE or other third-party evidence of the selling price. The ASU
will be effective prospectively for revenue arrangements entered into or
materially modified in fiscal years beginning on or after June 15, 2010 and
early adoption will be permitted. The Company is currently evaluating the
effects of implementing this ASU.
In
August 2009, the FASB issued an ASU on the fair value measurement of
liabilities. This amendment provides guidance on estimating the fair value of a
liability. It is effective in the first reporting period after issuance. The
Company has evaluated the ASU and has determined that it will not have a
significant impact on the determination or reporting of our financial
results.
CHORDIANT
SOFTWARE, INC.
NOTES
TO CONSOLIDATED FINANCIAL STATEMENTS-(Continued)
In
June 2009, the FASB issued a standard that provides further guidance on
assessing the consolidation of variable interest entities or VIE. This standard
will, among other things, establish new criteria for determining the primary
beneficiary, and increase the frequency of required reassessments to determine
whether a company is the primary beneficiary of a VIE. It also clarifies the
characteristics that identify a VIE and contains a new requirement that any
term, transaction, or arrangement that does not have a substantive effect on an
entity’s status as a VIE, a company’s power over a VIE, or a company’s
obligation to absorb losses or its rights to receive benefits of an entity must
be disregarded. The standard will be effective for annual financial statements
for periods ending after November 15, 2009. The Company has evaluated the
standard and has determined that it will not have a significant impact on the
determination or reporting of our financial results.
In
June 2009, the FASB issued a standard that eliminates the concept of a
qualifying special-purpose entity, creates more stringent conditions for
reporting a transfer of a portion of a financial asset as a sale, clarifies
other sale-accounting criteria, and changes the initial measurement of a
transferor’s interest in transferred financial assets. The standard will be
effective for transfers of financial assets in fiscal years beginning after
November 15, 2009 and in interim periods within those fiscal years with earlier
adoption prohibited. The Company has evaluated the standard and has determined
that it will not have a significant impact on the determination or reporting of
our financial results.
In
May 2009, the FASB issued a standard intended to establish general standards of
accounting for and disclosures of events that occur after the balance sheet date
but before financial statements are issued or are available to be issued. It
requires the disclosure of the date through which an entity has evaluated
subsequent events and the basis for selecting that date, that is, whether that
date represents the date the financial statements were issued or were available
to be issued. The standard is effective for interim or annual financial periods
ending after June 15, 2009. The Company evaluated the standard and determined
that it does not have a significant impact on the determination or reporting of
our financial results.
In
April 2009, the FASB issued guidance that provides additional guidance for
estimating fair value when the volume and level of activity for the asset or
liability have significantly decreased. It also includes guidance on identifying
circumstances that indicate a transaction is not orderly. The guidance is
effective for interim and annual reporting periods ending after June 15, 2009 on
a prospective basis. The Company has evaluated the guidance and has determined
that it will not have a significant impact on the determination or reporting of
our financial results.
In
April 2009, the FASB issued guidance which amends the other-than-temporary
impairment guidance in U.S. GAAP for debt securities to make the guidance more
operational and to improve the presentation and disclosure of
other-than-temporary impairments on debt and equity securities in the financial
statements. The guidance is effective for interim and annual reporting periods
ending after June 15, 2009. The Company has evaluated the guidance and has
determined that it will not have a significant impact on the determination or
reporting of our financial results.
In
April 2009, the FASB issued guidance that amends the disclosure requirements
relating to the fair value of financial instruments for interim reporting
periods of publicly traded companies as well as in annual financial statements.
The guidance is effective for interim reporting periods ending after June 15,
2009. The Company has evaluated the guidance and has determined that it will not
have a significant impact on the determination or reporting of our financial
results.
In
April 2009, the FASB issued guidance that amends and clarifies the initial
recognition and measurement, subsequent measurement and accounting, and related
disclosures of assets and liabilities arising from contingencies in a business
combination. This guidance is effective for assets and liabilities arising from
contingencies in business combinations for which the acquisition date is on or
after December15, 2008. The Company has not had any business combinations on or
after December 15, 2008 and therefore this guidance has not had an impact on our
financial statements.
CHORDIANT
SOFTWARE, INC.
NOTES
TO CONSOLIDATED FINANCIAL STATEMENTS-(Continued)
In
November 2008, the FASB ratified guidance that clarifies the accounting for
certain transactions and impairment considerations involving equity method
investments. The guidance is effective for fiscal years beginning after December
15, 2008, with early adoption prohibited. The Company does not currently have
any investments that are accounted for under the equity method and therefore the
guidance will not have a significant impact on the determination of our
financial results.
In
November 2008, the FASB ratified guidance that clarifies the accounting for
certain separately identifiable intangible assets which an acquirer does not
intend to actively use but intends to hold to prevent its competitors from
obtaining access to them. The guidance requires an acquirer in a business
combination to account for a defensive intangible asset as a separate unit of
accounting which should be amortized to expense over the period the asset
diminishes in value. The guidance is effective for fiscal years beginning after
December 15, 2008, with early adoption prohibited. The Company has evaluated the
guidance and has determined that it will not have a significant impact on the
determination or reporting of our financial results.
In
October, 2008, the FASB issued guidance that clarifies the application of fair
value and provides an example to illustrate key considerations in determining
the fair value of a financial asset when the market for that financial asset is
not active. The guidance is effective upon issuance, including prior periods for
which financial statements have not been issued. The Company has evaluated the
guidance and has determined that it will not have a significant impact on the
determination or reporting of our financial results.
NOTE
4—FINANCIAL INSTRUMENTS AND FAIR VALUE
The
Company adopted the provisions of a FASB standard effective October 1, 2008.
Under the FASB standard, fair value is defined as the price that would be
received to sell an asset or paid to transfer a liability in an orderly
transaction between market participants at the measurement date.
The
Company has investments that are valued in accordance with the provisions of the
FASB standard. The FASB standard establishes a hierarchy for inputs used in
measuring fair value that maximizes the use of observable inputs and minimizes
the use of unobservable inputs by requiring that the most observable inputs be
used when available. The hierarchy is broken down into three levels based on the
reliability of inputs as follows:
|
Level
1 – Valuations based on quoted prices in active markets for identical
assets that the Company has the ability to access.
|
|
|
Level
2 – Valuations based on quoted prices in markets that are not active or
for which all significant inputs are observable, either directly or
indirectly.
|
|
|
Level
3 – Valuations based on inputs that are unobservable and significant to
the overall fair value measurement.
|
The
following table represents information about the Company’s investments measured
at fair value on a recurring basis (in thousands).
|
Fair
value of investments as of September 30, 2009
|
||||||||||||||||
|
Total
|
Quoted
Prices
In
Active
Markets
for
Identical
Assets
(Level
1)
|
Significant
Other
Observable
Inputs
(Level
2)
|
Significant
Unobservable
Inputs
(Level
3)
|
|||||||||||||
|
Money
Market Funds included in Cash and Cash Equivalents
|
$
|
39,497
|
$
|
39,497
|
$
|
—
|
$
|
—
|
||||||||
CHORDIANT
SOFTWARE, INC.
NOTES
TO CONSOLIDATED FINANCIAL STATEMENTS-(Continued)
NOTE
5— BALANCE SHEET COMPONENTS
Accounts
Receivable, Net
Accounts
receivable, net, consists of the following (in thousands):
|
September
30,
|
|||||||||
|
2009
|
2008
|
||||||||
|
Accounts
receivable, net:
|
|||||||||
|
Accounts
receivable
|
$
|
17,017
|
$
|
25,502
|
|||||
|
Less:
allowance for doubtful accounts
|
(309
|
)
|
(629
|
)
|
|||||
|
$
|
16,708
|
$
|
24,873
|
||||||
Prepaid
Expenses and Other Current Assets
Prepaid
expense and other current assets consist of the following (in
thousands):
|
September
30,
|
|||||||||
|
2009
|
2008
|
||||||||
|
Prepaid
expense and other current assets:
|
|||||||||
|
Prepaid
commissions and royalties
|
$
|
582
|
$
|
2,171
|
|||||
|
Deferred
tax assets
|
1,684
|
3,102
|
|||||||
|
Other
prepaid expenses and current assets
|
1,740
|
2,895
|
|||||||
|
$
|
4,006
|
$
|
8,168
|
||||||
Property
and Equipment, Net
Property
and equipment, net, consists of the following (in thousands):
|
September 30,
|
|||||||||
|
2009
|
2008
|
||||||||
|
Property
and equipment, net:
|
|||||||||
|
Computer
hardware (useful lives of 3 years)
|
$
|
4,580
|
$
|
4,744
|
|||||
|
Purchased
internal-use software (useful lives of 3 years)
|
3,381
|
3,323
|
|||||||
|
Furniture
and equipment (useful lives of 3 to 7 years)
|
739
|
749
|
|||||||
|
Leasehold
improvements (shorter of 7 years or the term of the lease)
|
2,741
|
2,811
|
|||||||
|
11,441
|
11,627
|
||||||||
|
Accumulated
depreciation and amortization
|
(9,591
|
)
|
(8,462
|
)
|
|||||
|
$
|
1,850
|
$
|
3,165
|
||||||
Intangible
Assets, Net
Intangible
assets, net, consist of the following (in thousands):
|
September
30, 2009
|
September
30, 2008
|
|||||||||||||||||||||||
|
Gross
Carrying
Amount
|
Accumulated
Amortization
|
Net
Carrying
Amount
|
Gross
Carrying
Amount
|
Accumulated
Amortization
|
Net
Carrying
Amount
|
|||||||||||||||||||
|
Intangible
assets, net:
|
||||||||||||||||||||||||
|
Developed
technologies
|
$
|
6,904
|
$
|
(6,661
|
)
|
$
|
243
|
$
|
6,904
|
$
|
(5,765
|
)
|
$
|
1,139
|
||||||||||
|
Customer
list and trade-names
|
2,731
|
(2,671
|
)
|
60
|
2,731
|
(2,356
|
)
|
375
|
||||||||||||||||
|
$
|
9,635
|
$
|
(9,332
|
)
|
$
|
303
|
$
|
9,635
|
$
|
(8,121
|
)
|
$
|
1,514
|
|||||||||||
CHORDIANT
SOFTWARE, INC.
NOTES
TO CONSOLIDATED FINANCIAL STATEMENTS-(Continued)
All
of the Company’s acquired intangible assets are subject to amortization and are
carried at cost less accumulated amortization. Amortization is computed on a
straight-line basis over the assets estimated useful lives which are as follows:
Developed technologies—one and one half to five years; trade-names—three to five
years; and customer list—three to five years. Aggregate amortization expense for
intangible assets totaled $1.2 million, $1.2 million, and $1.2 million for the
years ended September 30, 2009, 2008, and 2007, respectively. The Company
expects amortization expense on acquired intangible assets to be $0.3 million
for the first quarter of fiscal year 2010 and become fully
amortized.
Other
Assets
Other
assets consist of the following (in thousands):
|
September 30,
|
|||||||||
|
2009
|
2008
|
||||||||
|
Other
assets:
|
|||||||||
|
Long-term
accounts receivable
|
$
|
930
|
$
|
—
|
|||||
|
Long-term
restricted cash
|
90
|
89
|
|||||||
|
Other
assets
|
1,471
|
1,918
|
|||||||
|
$
|
2,491
|
$
|
2,007
|
||||||
The
long-term account receivable balance represents a receivable from a single
customer related to a multiple year maintenance renewal that occurred during the
quarter ended March 31, 2009. This amount represents a payment which is due in
the quarter ending March 31, 2011. All revenue associated with this receivable
has been deferred and will be recognized as revenue over the term of the
services performed. As of September 30, 2009, an allowance has not been provided
for this receivable based on the Company’s assessment of the underlying
customer’s credit worthiness.
Accrued
Expenses
Accrued
expenses consist of the following (in thousands):
|
September
30,
|
|||||||||
|
2009
|
2008
|
||||||||
|
Accrued
expenses:
|
|||||||||
|
Accrued
payroll, payroll taxes and related expenses
|
$
|
2,509
|
$
|
5,088
|
|||||
|
Accrued
restructuring expenses, current portion (Note 6)
|
408
|
538
|
|||||||
|
Accrued
third party consulting fees
|
505
|
1,264
|
|||||||
|
Accrued
income, sales and other taxes
|
1,786
|
1,678
|
|||||||
|
Other
accrued liabilities
|
1,126
|
888
|
|||||||
|
$
|
6,334
|
$
|
9,456
|
||||||
Deferred
Revenue
Deferred
revenue consists of the following (in thousands):
|
September
30,
|
|||||||||
|
2009
|
2008
|
||||||||
|
Deferred
revenue:
|
|||||||||
|
License
|
$
|
7,314
|
$
|
12,465
|
|||||
|
Support
and maintenance
|
29,959
|
32,908
|
|||||||
|
Other
|
688
|
961
|
|||||||
|
37,961
|
46,334
|
||||||||
|
Less:
current portion
|
(28,704
|
)
|
(33,503
|
)
|
|||||
|
Long-term
deferred revenue
|
$
|
9,257
|
$
|
12,831
|
|||||
CHORDIANT
SOFTWARE, INC.
NOTES
TO CONSOLIDATED FINANCIAL STATEMENTS-(Continued)
NOTE
6—RESTRUCTURING
Restructuring
Costs
Through
September 30, 2009, the Company approved certain restructuring plans to, among
other things, reduce its workforce, terminate contracts and consolidate
facilities. Restructuring and asset impairment expenses have been recorded to
align the Company’s cost structure with changing market conditions and to create
a more efficient organization. The Company’s restructuring expenses have been
comprised primarily of: (i) severance and termination benefit costs related to
the reduction of our workforce; (ii) lease termination costs and costs
associated with permanently vacating certain facilities, and (iii) contract
termination costs. The Company accounted for each of these costs in accordance
with a FASB standard or previous FASB guidance.
Retroactive
application of the FASB standard to periods prior to January 1, 2003, was
prohibited; accordingly, the accrual relating to facilities vacated prior to the
effective date of the FASB standard continues to be accounted for in accordance
with the previous guidance. Accruals for facilities that were restructured prior
to 2003 do not reflect any adjustments relating to the estimated net present
value of cash flows associated with the facilities.
For
each of the periods presented herein, restructuring expenses consist solely
of:
|
|
•
|
Severance
and Termination Benefits—These costs represent severance and payroll taxes
related to restructuring plans.
|
|
|
•
|
Excess
Facilities Costs—These costs represent future minimum lease payments
related to excess and abandoned office space under leases, and the
disposal of property and equipment including facility leasehold
improvements, net of estimated sublease
income.
|
|
|
•
|
Termination
Costs—These costs represent contract termination costs related to the
restructuring plan.
|
As
of September 30, 2009, the total restructuring accrual consisted of the
following (in thousands):
|
Current
|
Non-Current
|
Total
|
|||||||||||
|
Excess
facilities
|
$
|
408
|
$
|
123
|
$
|
531
|
|||||||
|
Total
|
$
|
408
|
$
|
123
|
$
|
531
|
As
of September 30, 2009 and 2008, $0.4 million and $0.5 million, respectively, of
the restructuring reserve are included in the Accrued Expenses line item on the
Consolidated Balance Sheets. The allocation between current portion and long
term portion is based on the current lease agreements or the anticipated
settlement dates.
As
of September 30, 2009, all severance and termination benefits and contract
termination costs have been paid.
The
Company expects to pay the excess facilities amounts related to the restructured
or vacated leased office space as follows (in thousands):
|
Fiscal Year
Ended September 30,
|
Total
Net Future
Minimum
Lease
Payments
|
||||||||||||
|
2010
|
$
|
408
|
|||||||||||
|
2011
|
123
|
||||||||||||
|
Total
|
$
|
531
|
Included
in the future minimum lease payments schedule above is an offset of $0.4 million
of contractually committed sublease rental income.
CHORDIANT
SOFTWARE, INC.
NOTES
TO CONSOLIDATED FINANCIAL STATEMENTS-(Continued)
Fiscal
Year 2009 Restructuring
In
October 2008, the Company initiated a restructuring plan, the 2009
Restructuring, intended to align its resources and cost structure with expected
future revenues. The 2009 Restructuring plan included reductions in headcount
and third party consultants across all functional areas in both North America
and Europe. The 2009 Restructuring plan included a reduction of approximately
13% of the Company’s permanent workforce. A significant portion of the positions
eliminated were in North America.
As
a result of the cost-cutting measures, the Company recorded a pre-tax cash
restructuring charge in the first quarter of fiscal year 2009, of approximately
$0.9 million, including $ 0.8 million for severance costs and $0.1 million for
other contract termination costs. As of September 30, 2009, all payments have
been made.
|
Severance
and
Benefits
|
Contract
Termination
Costs
|
Total
|
|||||||||||
|
Provision
|
$
|
758
|
$
|
130
|
$
|
888
|
|||||||
|
Cash
paid
|
(758
|
)
|
(130
|
)
|
(888
|
)
|
|||||||
|
Reserve
balance as of September 30, 2009
|
$
|
—
|
$
|
—
|
$
|
—
|
Fiscal
Year 2007 Restructuring
In
October 2006, the Company initiated a restructuring plan, the 2007
Restructuring, intended to align its resources and cost structure with expected
future revenues. The restructuring plan included a balancing of service
resources worldwide, elimination of duplicative functions internationally, and a
shift in the U.S. field organization toward a focus on domain–based sales and
pre-sales teams. As a result of the restructuring plan, management undertook a
reduction of 33 positions or approximately 10% of the Company’s workforce and
consolidation of the European headquarters in the United Kingdom and the closure
of the France office.
As
part of the 2007 Restructuring, the Company incurred a one-time restructuring
expense of $6.1 million for severance and termination benefits, and excess
facilities expensed to restructuring expense in the Consolidated Statements of
Operations. The Company accrued lease costs pertaining to the consolidation of
excess facilities relating to lease terminations and non-cancelable lease costs
in France and the United Kingdom. During the three months ended March 31, 2007,
the Company incurred an additional charge of $0.1 million for employee severance
costs associated with the closure of the France office. In March 2007, the
Company negotiated an early termination of the France office lease associated
with its closure resulting in a $0.2 million reduction in the restructure
facility liability. This reduction was recorded as an offset to restructuring
expense in the period. The Company was able to terminate the France facility
lease during the year ended September 30, 2007. In the quarter ended December
31, 2007, the Company negotiated an early termination option for the United
Kingdom lease which terminated the lease in January 2008. All termination
payments have now been made.
The
following table summarizes the activity related to the 2007 Restructuring (in
thousands):
|
Severance
and
Benefits
|
Excess
Facilities
|
Total
|
|||||||||||
|
Provision
|
$
|
1,752
|
$
|
4,378
|
$
|
6,130
|
|||||||
|
Non-cash
|
4
|
(947
|
)
|
(943
|
)
|
||||||||
|
Cash
paid
|
(1,756
|
)
|
(905
|
)
|
(2,661
|
)
|
|||||||
|
Reserve
balance as of September 30, 2007
|
—
|
2,526
|
2,526
|
||||||||||
|
Provision
adjustment
|
—
|
(36
|
)
|
(36
|
)
|
||||||||
|
Non-cash
|
—
|
(62
|
)
|
(62
|
)
|
||||||||
|
Cash
paid
|
—
|
(2,428
|
)
|
(2,428
|
)
|
||||||||
|
Reserve
balance as of September 30, 2008
|
$
|
—
|
$
|
—
|
$
|
—
|
CHORDIANT
SOFTWARE, INC.
NOTES
TO CONSOLIDATED FINANCIAL STATEMENTS-(Continued)
Fiscal
Year 2005 Restructuring
In
May 2005, the Company initiated an approximate 10% reduction in the Company’s
workforce, or 2005 Restructuring, in order to improve profitability and control
expenses. As part of the 2005 Restructuring, the Company incurred a one-time
restructuring charge of $1.1 million in the fourth quarter ended
September 30, 2005 for severance and termination benefits.
During
the quarter ended March 31, 2007, the Company incurred an additional charge of
less than $0.1 million for additional severance expense for an employee located
in France. During the quarter ended December 31, 2008, the Company reversed the
charge as the Company was not required to pay the severance expense to the
employee. As of September 30, 2009, all severance and termination benefits have
been paid.
Prior
Restructurings
During
fiscal year 2002, based upon the Company’s continued evaluation of economic
conditions in the information technology industry and our expectations regarding
revenue levels, the Company restructured several areas so as to reduce expenses
and improve revenue per employee, or 2002 Restructuring. As part of the 2002
Restructuring, the Company recorded a total workforce reduction expense relating
to severance and termination benefits of approximately $2.0 million and $3.8
million for years ended December 31, 2003 and 2002, respectively. In
addition to these costs, the Company accrued lease costs related to excess
facilities of $0.2 million and $2.8 million during the years ended
December 31, 2003 and 2002, respectively, pertaining to the consolidation
of excess facilities relating to lease terminations and non-cancelable lease
costs. This expense was recorded net of estimated sublease income based on the
then current comparable rates for leases in the respective markets.
During
the year ended September 30, 2007, the Company entered into a new sublease for
the last remaining facility lease associated with the 2002 Restructuring. As a
result of this sublease, rental income was lower than previously estimated as
part of the restructure facility reserve, and the Company recorded an additional
$0.4 million of restructuring expense during the year ended September 30, 2007.
The sublease term is through the entire remaining term of the Company’s lease
obligation for the facility.
The
following table summarizes the activity related to the 2002 Restructuring (in
thousands):
|
Excess
Facilities
|
|||||
|
Reserve
balance as of September 30, 2006
|
$
|
1,862
|
|||
|
Provision
adjustment
|
353
|
||||
|
Non-cash
|
1
|
||||
|
Cash
paid
|
(856
|
)
|
|||
|
Reserve
balance as of September 30, 2007
|
1,360
|
||||
|
Non-cash
|
—
|
||||
|
Cash
paid
|
(417
|
)
|
|||
|
Reserve
balance as of September 30, 2008
|
943
|
||||
|
Non-cash
|
—
|
||||
|
Cash
paid
|
(412
|
)
|
|||
|
Reserve
balance as of September 30, 2009
|
$
|
531
|
CHORDIANT
SOFTWARE, INC.
NOTES
TO CONSOLIDATED FINANCIAL STATEMENTS-(Continued)
NOTE
7—RELATED PARTY TRANSACTIONS
In
August 2005, the Company entered into a service provider agreement with Infogain
Corporation, or Infogain. Samuel T. Spadafora, a former director and executive
officer of the Company, is a director of Infogain. Mr. Spadafora terminated his
relationship with the Company in November 2006.
Charles
E. Hoffman, a director of the Company, is the former President and Chief
Executive Officer of Covad Communications Group, Inc. (“Covad”), a former
customer of ours.
In
February 2008, Daniel A. Gaudreau became a director of the Company. Mr. Gaudreau
is the Chief Financial Officer of Actuate Corporation, a provider of licensed
technology to the Company.
The
following presents the related party transaction balances (in
thousands):
|
Revenue
|
Cost
of Revenues
|
Payments
|
||||||||||||||||||||||||
|
Year
Ended September 30,
|
||||||||||||||||||||||||||
|
2009
|
2008
|
2007
|
2009
|
2008
|
2007
|
2009
|
2008
|
2007
|
||||||||||||||||||
|
Infogain
Corporation
|
$
|
—
|
$
|
—
|
$
|
—
|
$
|
—
|
$
|
—
|
$
|
72
|
$
|
—
|
$
|
—
|
$
|
204
|
||||||||
|
Covad
Communications
|
—
|
116
|
252
|
—
|
—
|
—
|
—
|
—
|
—
|
|||||||||||||||||
|
Actuate
Corporation
|
—
|
—
|
—
|
—
|
—
|
—
|
—
|
3
|
20
|
|||||||||||||||||
|
$
|
—
|
$
|
116
|
$
|
252
|
$
|
—
|
$
|
—
|
$
|
72
|
$
|
—
|
$
|
3
|
$
|
224
|
|||||||||
There
were no accounts receivable, accounts payable or deferred revenue balances with
these companies as of September 30, 2009 and 2008.
NOTE
8—BORROWINGS
Revolving
Line of Credit
The
Company’s revolving line of credit with Comerica Bank expires on June 7, 2010.
The terms of the agreement include a $5.0 million line of credit, available on a
non-formula basis, and requires the Company to (i) maintain at least a $5.0
million cash balance in Comerica Bank accounts, (ii) maintain a minimum quick
ratio of 2 to 1, (iii) maintain a liquidity ratio of at least 1 to 1 at all
times, and (iv) subordinate any debt issuances subsequent to the effective date
of the agreement, and certain other covenants. All assets of the Company have
been pledged as collateral on the credit facility.
The
revolving line of credit contains a provision for a sub-limit of up to $5.0
million for issuances of standby commercial letters of credit. As of September
30, 2009, the Company had utilized $0.1 million of the standby commercial
letters of credit limit which serves as collateral for a leased facility. The
revolving line of credit also contains a provision for a sub-limit of up to $3.0
million for issuances of foreign exchange forward contracts. As of September 30,
2009, the Company had not entered into any foreign exchange forward contracts.
The Company is required to secure the standby commercial letters of credit and
foreign exchange forward contracts through June 7, 2010. If these have not been
secured to Comerica Bank’s satisfaction, the Company’s cash and cash equivalent
balances held by Comerica Bank automatically secure such obligations to the
extent of the then continuing or outstanding and undrawn letters of credit or
foreign exchange contracts.
Borrowings
under the revolving line of credit bear interest at the lending bank’s prime
rate. Except for the standby commercial letters of credit, as of September 30,
2009, there were no outstanding balances on the revolving line of
credit.
NOTE
9—COMMITMENTS AND CONTINGENCIES
Lease
Commitments
The
Company leases its facilities and certain equipment under non-cancelable
operating leases that expire on various dates through 2014. Rent expense is
recognized on a straight line basis over the lease terms.
CHORDIANT
SOFTWARE, INC.
NOTES
TO CONSOLIDATED FINANCIAL STATEMENTS-(Continued)
Future
minimum lease payments as of September 30, 2009 are as follows (in
thousands):
|
Operating
Leases
|
Operating
Sublease
Income
|
Net
Operating
Leases
|
|||||||||||
|
Fiscal
year ended September 30:
|
|||||||||||||
|
2010
|
$
|
3,576
|
$
|
(294
|
)
|
$
|
3,282
|
||||||
|
2011
|
2,997
|
(86
|
)
|
2,911
|
|||||||||
|
2012
|
2,199
|
—
|
2,199
|
||||||||||
|
2013
|
2,031
|
—
|
2,031
|
||||||||||
|
2014
|
351
|
—
|
351
|
||||||||||
|
Total
minimum payments
|
$
|
11,154
|
$
|
(380
|
)
|
$
|
10,774
|
Operating
lease obligations in the table above include approximately $0.9 million for our
Boston, Massachusetts facility operating lease commitment that was included in
Restructuring Expense. As of September 30, 2009, the Company has $0.4 million in
sublease income contractually committed for future periods relating to this
facility. See Note 6 for further discussion.
The
office lease for our Cupertino headquarters was scheduled to expire on December
31, 2008. In July 2008, the Company renewed the lease for a five year period
with an option to renew for an additional five years. The table above includes
our lease commitment for this facility.
Rent
expense for the years ended September 30, 2009, 2008, and 2007 totaled $2.6
million, $2.3 million, and $2.5 million, respectively. Certain operating leases
included in the table above are part of our restructuring activities and lease
payments on such leases are charged against the restructuring
accrual.
Asset
Retirement Obligations
As
required by FASB guidance, the Company recorded an Asset Retirement Obligation
(ARO) of approximately $0.3 million and a corresponding increase in leasehold
improvements in the fiscal year 2007. The FASB guidance requires the recognition
of a liability for the fair value of a legally required conditional ARO when
incurred, if the liability’s fair value can be reasonability estimated. The fair
value of the liability is added to the carrying amount of the associated asset
and this additional carrying amount is amortized over the life of the
asset.
The
Company’s ARO is associated with commitments to return property subject to
operating leases to original condition upon lease termination. As of September
30, 2009, the Company estimated that gross expected cash flows of approximately
$0.3 million will be required to fulfill these obligations.
ARO
payments as of September 30, 2009 are included in Other Long-term Liabilities in
the Consolidated Balance Sheets and are estimated as follows (in
thousands):
|
Payments
|
|||||||||||||
|
Fiscal
year ended September 30:
|
|||||||||||||
|
2010
|
$
|
—
|
|||||||||||
|
2011
|
147
|
||||||||||||
|
2012
|
174
|
||||||||||||
|
Total
|
$
|
321
|
Other
Obligations
The
Company entered into an agreement with Ness Technologies Inc., Ness USA, Inc.
(formerly Ness Global Services, Inc.) and Ness Technologies India, Ltd.
(collectively, “Ness”), effective December 15, 2003, and in January 2009, the
Company and Ness extended the Ness agreement through December 31, 2011. Pursuant
to the Ness agreement, Ness provides the Company’s customers with technical
product support through a worldwide help desk facility, a sustaining engineering
function that serves as the interface between technical product support and
internal engineering organization,
CHORDIANT
SOFTWARE, INC.
NOTES
TO CONSOLIDATED FINANCIAL STATEMENTS-(Continued)
product
testing services, product development services and certain other identified
technical and consulting services (collectively, the “Services”). Under the
terms of the Ness agreement, the Company pays for services rendered on a monthly
fee basis, including approved out-of-pocket expenses. If the Company terminates
the Ness agreement for convenience prior to December 31, 2009, it may be
required to pay a termination fee no greater than $0.5 million. The Company also
had guaranteed certain equipment lease obligations of Ness for equipment
acquired by Ness to be used in performance of the Services, either through
leasing arrangements or direct cash purchases, for which the Company was
obligated under the agreement to reimburse Ness. Ness entered into a 36 month
equipment lease agreement with IBM India and, in connection with the lease
agreement the Company had an outstanding standby letter of credit to guarantee
Ness’ financial commitments under the lease. During the quarter ended June 30,
2009, the lease expired and the Company no longer has an obligation to reimburse
Ness.
Indemnification
As
permitted under Delaware law, the Company enters into indemnification agreements
pursuant to which the Company is obligated to indemnify certain of its officers,
directors and employees for certain events or occurrences while the officer,
director or employee is, or was, serving at the Company’s request in such
capacity. The Company’s Bylaws similarly provide for indemnification of its
officers, directors and employees under certain circumstances to the maximum
extent permitted under Delaware law. The maximum potential amount of future
payments the Company could be required to make under these indemnification
agreements and arrangements is unlimited; however, the Company has a Director
and Officer insurance policy that limits the Company’s exposure and may enable
the Company to recover a portion of any future amounts paid. As a result of
insurance policy coverage, the Company believes the estimated fair value of
these indemnification agreements and arrangements is minimal. Accordingly, the
Company has no liabilities recorded for these agreements or arrangements as of
September 30, 2009.
The
Company enters into standard agreements with indemnification provisions in its
ordinary course of business. Pursuant to these agreements, the Company agrees to
indemnify, defend, hold harmless, and to reimburse the indemnified party for
losses suffered or incurred by the indemnified party, generally the Company’s
customers or business partners, in connection with any patent, copyright or
other intellectual property infringement claim by any third party with respect
to the Company’s products. The term of these agreements is generally perpetual
after execution of the agreement. The maximum potential amount of future
payments the Company could be required to make under these agreements is
unlimited. The Company has not incurred significant costs to defend lawsuits or
settle claims related to these agreements. The Company believes the estimated
fair value of these agreements is minimal. Accordingly, the Company has no
liabilities recorded for these agreements as of September 30, 2009.
The
Company may, at its discretion and in the ordinary course of business, enter
into arrangements with our business partners whereby the business partners agree
to provide services as subcontractors for the Company’s implementations.
Accordingly, the Company enters into standard agreements with its customers,
whereby the Company indemnifies them for other acts, such as personal property
damage, by its subcontractors. The maximum potential amount of future payments
the Company could be required to make under these agreements is unlimited;
however, the Company has general and umbrella insurance policies that may enable
the Company to recover a portion of any amounts paid. The Company has not
incurred significant costs to defend lawsuits or settle claims related to these
agreements. As a result, the Company believes the estimated fair value of these
agreements is minimal. Accordingly, the Company has no liabilities recorded for
these agreements as of September 30, 2009.
When,
as part of an acquisition, the Company acquires all of the stock or all of the
assets and liabilities of a company, the Company may assume the liability for
certain events or occurrences that took place prior to the date of acquisition.
The maximum potential amount of future payments, if any, the Company could be
required to make for such obligations is undeterminable at this time.
Accordingly, the Company has no amounts recorded for these contingent
liabilities as of September 30, 2009.
The
Company warrants that its software products will perform in all material
respects in accordance with standard published specifications and documentation
in effect at the time of delivery of the licensed products to the customer for a
specified period of time. Additionally, the Company warrants that maintenance
and consulting services will be performed consistent with generally accepted
industry standards. If necessary, the Company would account for the estimated
cost of product and service warranties based on specific warranty claims and
claim history, however, the Company has not incurred significant expense under
product or services warranties to date. As a result, the Company believes the
estimated fair value of these warranties is minimal. Accordingly, the Company
has no amounts recorded for these contingent liabilities as of September 30,
2009.
CHORDIANT
SOFTWARE, INC.
NOTES
TO CONSOLIDATED FINANCIAL STATEMENTS-(Continued)
NOTE
10—LITIGATION
IPO
Laddering
Beginning
in July 2001, the Company and certain of its officers and directors
(“Individuals”) were named as defendants in a series of class action stockholder
complaints filed in the United States District Court for the Southern District
of New York, now consolidated under the caption “In re Chordiant Software, Inc.
Initial Public Offering Securities Litigation, Case No. 01-CV-6222.” In the
amended complaint, filed in April 2002, the plaintiffs allege that the Company,
the Individuals, and the underwriters of the Company’s initial public offering
(“IPO”), violated Section 11 of the Securities Act of 1933, as amended
(“Securities Act”), and Section 10(b) of the Securities Exchange Act of 1934, as
amended (“Exchange Act”), based on allegations that the Company’s registration
statement and prospectus failed to disclose material facts regarding the
compensation to be received by, and the stock allocation practices of, the
Company’s IPO underwriters. The complaint also contains claims against the
Individuals for control person liability under Securities Act Section 15 and
Exchange Act Section 20. The plaintiffs seek unspecified monetary damages and
other relief. Similar complaints were filed in the same court against hundreds
of other public companies that conducted IPO’s of their common stock in the late
1990’s or in the year 2000 (collectively, the “IPO Lawsuits”).
On
February 25, 2009, liaison counsel for plaintiffs informed the district court
that a settlement of the IPO Lawsuits had been agreed to in principle, subject
to formal approval by the parties and preliminary and final approval by the
court. On April 2, 2009, the parties submitted a tentative settlement agreement
to the court and moved for preliminary approval thereof. On June 11, 2009, the
Court granted preliminary approval of the tentative settlement, ordered that
Notice of the settlement be published and mailed, and set a Final Fairness
Hearing for September 10, 2009. On October 6, 2009, the District Court certified
the settlement class in each IPO Case and granted final approval of the
settlement. On or about October 23, 2009, three shareholders filed a Petition
for Permission To Appeal Class Certification Order, challenging the District
Court’s certification of the settlement classes. Between October 29 and November
2, 2009, a number of shareholders also filed direct appeals, objecting to final
approval of the settlement. Similar petitions and direct appeals may be filed by
other shareholders. If the settlement is affirmed on appeal, the settlement will
result in the dismissal of all claims against the Company and its officers and
directors with prejudice, and the Company’s pro rata share of the settlement
fund will be fully funded by insurance.
Yue
vs. Chordiant Software, Inc.
On
January 2, 2008, the Company and certain of its officers and one other employee
were named in a complaint filed in the United States District Court for the
Northern District of California by Dongxiao Yue under the caption Dongxiao Yue
v. Chordiant Software, Inc. et al. Case No. CV 08-0019 (N.D. Cal.). The
complaint alleged that the Company’s Marketing Director (“CMD”) software product
infringed copyrights in certain software referred to as the “PowerRPC software,”
copyrights that had been owned by Netbula LLC and assigned to Mr. Yue, the sole
employee and owner of Netbula. The alleged infringement included (a)
distributing more copies of the PowerRPC software than had originally been
authorized in a run time license Netbula granted to Chordiant Software, Intl.,
(b) infringement of a software developer kit (“SDK”) by making copies of the SDK
in excess of those that had been licensed by Netbula, (c) making unauthorized
derivative works of the SDK, (d) unauthorized distribution of PowerRPC for
products operating on the Windows Vista platform, and (e) unauthorized
distribution of PowerRPC for server based products. Plaintiffs also
alleged that the license Netbula granted to Chordiant Software, Int’l Ltd.
should not be construed to authorize uses by its parent company, Chordiant
Software, Inc. Plaintiffs sought unspecified monetary damages,
disgorgement of profits, and injunctive relief according to proof. On February
5, 2008, the Company and its officers and employees filed a motion to dismiss
the complaint for failure to state a claim upon which relief could be granted,
and as to lack of personal jurisdiction as to one employee. On July 23, 2008,
the Court issued an order that (1) denied plaintiffs’ motion to disqualify
counsel; (2) granted one employee’s motion to dismiss for lack of personal
jurisdiction, with prejudice, and (3) granted the Company’s motion to dismiss,
ruling that Mr. Yue’s company, Netbula LLC, is the real party in interest and
must appear through counsel. The Court ruled that Netbula LLC could file an
amended complaint within 45 days and join Mr. Yue as an individual plaintiff at
that time.
CHORDIANT
SOFTWARE, INC.
NOTES
TO CONSOLIDATED FINANCIAL STATEMENTS-(Continued)
On
September 9, 2008, plaintiffs Dongxiao Yue and Netbula LLC filed a First Amended
Complaint asserting four causes of action relating to the Company’s alleged
unauthorized use and distribution of plaintiffs’ PowerRPC
software: claims for copyright infringement, unfair competition, and
“accession and confusion of property” against the Company, and a claim for
vicarious copyright infringement against the Company’s Chief Executive Officer
and its former Vice President, General Counsel and Secretary (the “individual
defendants”).
On
September 20, 2008, the parties filed a stipulation allowing plaintiffs to file
a Second Amended Complaint asserting the two causes of action for copyright
infringement and vicarious copyright infringement, but not including the unfair
competition and accession and confusion claims. The Second Amended Complaint
sought unspecified monetary damages, disgorgement of profits, and injunctive
relief according to proof. On November 10, 2008, the Company answered the
complaint and asserted various affirmative defenses, including that the
plaintiffs’ claims are barred by the existence of an express or implied license
from the plaintiffs. On March 2, 2009, the Company filed a motion for summary
judgment based on this defense. On July 9, 2009, the Court found triable issues
about whether the Company held a license and accordingly denied the Company’s
motion for summary judgment.
On
November 10, 2008, the individual defendants filed a motion to dismiss on
grounds that the plaintiffs failed to state a claim as to them. On March 20,
2009, the Court granted the motion to dismiss with leave for plaintiffs to amend
their complaint. Plaintiffs filed a Third Amended Complaint on April 6, 2009,
and the Company and individual defendants answered on April 23,
2009.
On
May 29, 2009, as stipulated by the parties, the Court allowed plaintiffs to file
a Fourth Amended Complaint to include allegations about the Company’s use in CMD
of a different, additional Netbula product, an implementation of ONC RPC for
Java. Plaintiffs filed the Fourth Amended Complaint on May 29, 2009, and
the Company and the individual defendants answered on June 15,
2009.
Also
in its May 29, 2009 order, the Court allowed discovery on all issues to
proceed, set the close of discovery for October 30, 2009, and set the
deadline for dispositive motions for December 14, 2010.
On
September 24, 2009, the Court issued a trial scheduling order, with jury
selection set for April 6, 2010, trial sessions on April 7-9 and
April 13-16, arguments on April 20, 2010, and jury deliberation on
April 21-23, 2010. The Court also set a final pretrial conference for
March 22, 2010.
On
October 30, 2009, both fact and expert discovery closed, although Plaintiffs and
the Company each have pending motions to compel further discovery, with hearings
set for November 17 and December 15, 2009.
On
November 4, 2009, the parties stipulated to the dismissal, with prejudice, of
the Company’s Chief Executive Officer from the case. On November 9, 2009, the
Court ordered the dismissal of the Company’s Chief Executive Officer, leaving
only one remaining individual defendant, the Company’s former general
counsel.
On
November 9, 2009, Plaintiffs filed a motion for partial summary judgment as to
liability for copyright infringement of Plaintiffs’ implementation of ONC RPC
for Java. Also on November 9, 2009, the Company filed a motion for summary
judgment based on the Company’s rights to copy and distribute software under
Plaintiffs’ licensing agreements. The Company also moved for summary judgment as
to Plaintiffs’ ineligibility for statutory damages or attorney fees. The
remaining individual defendant filed a motion for summary judgment as to
vicarious infringement. All of these pending summary judgment motions are set to
be heard on December 14, 2009.
The
Company cannot predict the outcome or provide an estimate of any possible
losses. The Company will continue to vigorously defend itself against the claims
in these actions.
This
action may divert the efforts and attention of our management and, if determined
adversely to us, could have a material impact on our business, results of
operations, financial condition or cash flows.
The
Company, from time to time, is also subject to various other claims and legal
actions arising in the ordinary course of business. The ultimate disposition of
these various other claims and legal actions is not expected to have a material
effect on our business, financial condition, results of operations or cash
flows. However, litigation is subject to inherent
uncertainties.
CHORDIANT
SOFTWARE, INC.
NOTES
TO CONSOLIDATED FINANCIAL STATEMENTS-(Continued)
NOTE
11—INCOME TAXES
The
components of income (loss) before income taxes are as follows (in
thousands):
|
Years
ended September 30,
|
|||||||||||||
|
2009
|
2008
|
2007
|
|||||||||||
|
United
States
|
$
|
(17,259
|
)
|
$
|
(657
|
)
|
$
|
(2,363
|
)
|
||||
|
Foreign
|
11,529
|
1,824
|
9,993
|
||||||||||
|
$
|
(5,730
|
)
|
$
|
1,167
|
$
|
7,630
|
|||||||
The
provision for income tax expense (benefit) was comprised of the following (in
thousands):
|
Years
ended September 30,
|
|||||||||||||
|
2009
|
2008
|
2007
|
|||||||||||
|
Current
|
|||||||||||||
|
United
States
|
$
|
—
|
$
|
—
|
$
|
150
|
|||||||
|
International
|
1,619
|
586
|
1,431
|
||||||||||
|
State
|
(3
|
)
|
27
|
21
|
|||||||||
|
1,616
|
613
|
1,602
|
|||||||||||
|
Deferred
|
|||||||||||||
|
United
States
|
—
|
—
|
—
|
||||||||||
|
International
|
3,418
|
(511
|
)
|
—
|
|||||||||
|
State
|
—
|
—
|
—
|
||||||||||
|
3,418
|
(511
|
)
|
—
|
||||||||||
|
$
|
5,034
|
$
|
102
|
$
|
1,602
|
||||||||
The
Company’s provision for income taxes is $5.0 million, $0.1 million and $1.6
million for the years ended September 30, 2009, 2008, and 2007, respectively. At
fiscal year ended 2009, as compared to fiscal year ended 2008, the $4.9 million
increase in income taxes is primarily due to an increase in the taxable income
of the Company’s UK subsidiaries which led to a non-cash tax expense of
approximately $3.4 million and an increase of $0.8 million in unrecoverable
withholding tax payments related to sales transactions that occurred in Egypt,
India, Poland, Portugal and Turkey. The remainder of the Company’s provision is
primarily attributable to taxes on earnings from our foreign
subsidiaries.
At
fiscal year ended 2008, as compared to fiscal year ended 2007, the $1.5 million
decrease in income taxes is primarily due to the reduction of taxable income,
the reversal of valuation allowance on deferred tax assets of $0.5 million and a
decrease in unrecoverable withholding tax payments related to sales transactions
that occurred in Turkey and Poland.
The
provision for income taxes differs from the amount computed by applying the
statutory federal income tax as follows (in thousands):
|
Years
ended September 30,
|
|||||||||||||
|
2009
|
2008
|
2007
|
|||||||||||
|
Income
(loss) before income taxes
|
$
|
(5,730
|
)
|
$
|
1,167
|
$
|
7,630
|
||||||
|
Federal
tax at 35 % statutory rate
|
$
|
(2,005
|
)
|
$
|
408
|
$
|
2,670
|
||||||
|
State
tax (benefit), net of federal tax benefit
|
(211
|
)
|
42
|
14
|
|||||||||
|
Stock-based
compensation
|
593
|
599
|
531
|
||||||||||
|
Subpart
F Income
|
210
|
444
|
—
|
||||||||||
|
Expenses
not deductible for tax
|
195
|
73
|
81
|
||||||||||
|
Foreign
tax at other than US rates
|
1,002
|
(564
|
)
|
(2,067
|
)
|
||||||||
|
UK
distribution
|
1,722
|
—
|
—
|
||||||||||
|
Valuation
allowance
|
3,528
|
(900
|
) |
373
|
|||||||||
|
Provision
for income taxes
|
$
|
5,034
|
$
|
102
|
$
|
1,602
|
|||||||
CHORDIANT
SOFTWARE, INC.
NOTES
TO CONSOLIDATED FINANCIAL STATEMENTS-(Continued)
Deferred
income taxes reflect the net tax effects of temporary differences between the
carrying amounts of assets and liabilities for financial reporting purposes and
the amounts used for income tax purposes. The significant components of our
deferred tax assets are as follows (in thousands):
|
September
30,
|
|||||||||
|
2009
|
2008
|
||||||||
|
Net
operating loss carryforwards
|
$
|
55,649
|
$
|
59,923
|
|||||
|
Accrued
expenses and provisions
|
913
|
1,180
|
|||||||
|
Tax
credit carryforwards
|
5,050
|
3,899
|
|||||||
|
Deferred
revenue
|
8,184
|
7,033
|
|||||||
|
Stock-based
compensation
|
1,764
|
1,902
|
|||||||
|
Depreciation
and amortization
|
3,249
|
1,866
|
|||||||
|
Gross
deferred tax assets
|
74,809
|
75,803
|
|||||||
|
Deferred
tax valuation allowance
|
(69,645
|
)
|
(65,852
|
)
|
|||||
|
Net
deferred tax assets
|
$
|
5,164
|
$
|
9,951
|
|||||
The
valuation allowance increased by $3.8 million for period ended September 30,
2009. The Company records a valuation allowance to reduce deferred tax assets to
the amount that is more likely than not to be realized in future periods. In
evaluating the Company’s ability to recover deferred tax assets, the Company
considers all available positive and negative evidence, including operating
results, reversal of deferred tax liabilities, history of losses, and forecasts
of future taxable income.
At
September 30, 2009, the Company has $74.8 million in gross deferred tax assets
(DTAs) attributable principally to net operating losses (NOLs). Prior to fiscal
year 2008, the Company maintained a 100% valuation allowance on DTAs because it
previously was unable to conclude that it is more-likely-than-not that it will
realize the tax benefits of these DTAs. Based on recent operating
results at the subsidiary level and the reorganization of the Company’s
intellectual property, current projections of disaggregated future taxable
income has enabled the Company to conclude that it is more-likely-than-not that
it will have future taxable income sufficient to realize $5.2 million of tax
benefits from its deferred tax assets, which consist of that portion of net
deferred tax assets attributable to net operating losses (NOLs) residing in the
United Kingdom. On September 30, 2008, the Company had released (eliminated)
$10.0 million of the valuation allowance on its DTAs, of which $9.5 million was
recognized as an offsetting reduction to goodwill (representing pre-acquisition
NOLs) and $0.5 million was recognized as a credit (reduction) to the provision
for income taxes. In future periods, the Company expects to incur tax expense
related to the United Kingdom which will result in an increase in overall
expense; however, to the extent that such tax expense is offset by the
utilization of NOLs and capital allowances, the recognition of this additional
tax expense will be a non-cash item.
The
remaining balance of gross deferred tax assets was generated in the U.S. With
respect to U.S. generated deferred tax assets, the Company recorded a full
valuation allowance as the future realization of the tax benefit is not
considered by management to be more likely than not. The Company’s estimate of
future taxable income considers available positive and negative evidence
regarding current and future operations, including projections of income in
various states and foreign jurisdictions. The Company believes the
estimate of future taxable income is reasonable; however, it is inherently
uncertain, and if future operations generate taxable income greater than
projected, further adjustments to reduce the valuation allowance are
possible. Conversely, if the Company realizes unforeseen material
losses in the future, or the ability to generate future taxable income necessary
to realize a portion of the net deferred tax asset is materially reduced,
additions to the valuation allowance could be recorded. At September 30, 2009,
the balance of deferred tax valuation allowance is approximately $69.6
million.
At
September 30, 2009, the Company has net operating loss carryforwards for federal
and state income tax purposes of approximately $144.3 million and $36.2 million,
respectively. Approximately $18.1 million of the federal net operating loss
carryforwards represent net operating loss carryforwards related to Prime
Response. In addition to the federal and state net operating loss carryforwards,
the Company has approximately $13.6 million of net operating loss carryfowards
that were generated in the United Kingdom, none of which will expire.
Approximately $4.3 million of additional net operating loss carryforwards are
related to stock option deductions which, if utilized, will be accounted for as
an addition to equity rather than as a reduction of the provision for income
taxes. These carryforwards are available to offset future federal and state
taxable income and expire in fiscal years 2011 through 2029 and 2010 through
2029, respectively. At September 30, 2009, there are approximately $1.8
million of federal research and development credits and alternative minimum tax
credits that
CHORDIANT
SOFTWARE, INC.
NOTES
TO CONSOLIDATED FINANCIAL STATEMENTS-(Continued)
expire
in 2025 through 2029. For the year ended September 30, 2009, there were
also California state credits of approximately $4.0 million of which $3.9
million does not expire.
On
September 23, 2008, the state of California enacted tax legislation on the
utilization of net operating losses and credit limitations. Effective fiscal
year 2009, any California net operating losses that the Company generates will
have a 20 year carryforward period and effective for fiscal year ended 2012,
will have a two year carryback period. In addition, for fiscal year 2009 through
fiscal year 2010, the Company will be unable to utilize California net operating
losses as they are being temporarily disallowed as a result of this legislation.
This may give rise to tax expense for any such taxable income rising out of the
disallowable 2 year period. Any disallowed California net operating losses that
cannot be utilized during the disallowed period will be extended by two years.
For fiscal year 2012, the carryback amount cannot exceed 50% of the net
operating loss, for fiscal year 2013, the carryback cannot exceed 75% of the net
operating loss, and for fiscal year 2014, the carryback cannot exceed 100% of
the net operating loss. For the year ended September 30, 2009, the Company
generated $3.7 million of additional net operating losses in California which
will expire in 2029.
Effective
fiscal year 2009, California business tax credits will be limited to 50% of the
Company’s tax liability. The carryover period for disallowed credit will be
extended by the number of tax years that the credit was disallowed.
Under
the Tax Reform Act of 1986, the amounts of, and the benefit from, net operating
losses that can be carried forward may be impaired or limited in certain
circumstances. Under Section 382 of the Internal Revenue Code (IRC), as amended,
a cumulative stock ownership change of more than 50% over a three-year period
can cause such limitations. The Company has analyzed its historical ownership
changes and removed any net operating loss carryforwards that will expire
unutilized from its deferred tax balances as a result of IRC Sec. 382
limitations.
At
September 30, 2009, the Company has not provided for U.S. federal and state
income taxes on foreign earnings which are expected to be invested outside of
the U.S. indefinitely. Upon distribution of those earnings, the Company will be
subject to U.S. income taxes (subject to a reduction of the foreign tax credit)
and withholding taxes payable to the foreign countries where the foreign
operations are located, if any.
The
Company adopted a FASB guidance on tax provisions effective October 1, 2007. As
a result of the implementation of this FASB guidance, the Company did not
recognize a cumulative adjustment to the October 1, 2007 balance of retained
earnings as the amount was deemed immaterial. As of October 1, 2007, the Company
had gross unrecognized tax benefits of approximately $0.8 million. As of
September 30, 2009, the Company had gross unrecognized tax benefits of
approximately $1.0 million. The Company does not anticipate the total amount of
our unrecognized tax benefits to significantly change over the next 12
months.
Total
amount of unrecognized tax benefits (in thousands):
|
Balance
at October 1, 2007
|
$
|
831
|
|||||||
|
Increase
in balance due to current year tax position
|
153
|
||||||||
|
Increase
in balance due to prior year tax position
|
—
|
||||||||
|
Reduction
for prior year tax positions
|
(33)
|
||||||||
|
Settlements
|
—
|
||||||||
|
Balance
at September 30, 2008
|
$
|
951
|
|||||||
|
Increase
in balance due to current year tax position
|
70
|
||||||||
|
Increase
in balance due to prior year tax position
|
265
|
||||||||
|
Reduction
for prior year tax positions
|
(279
|
)
|
|||||||
|
Settlements
|
—
|
||||||||
|
Balance
at September 30, 2009
|
$
|
1,007
|
In
accordance with this FASB guidance, the Company has elected to classify interest
and penalties related to uncertain tax positions as a component of our provision
for income taxes. Accrued interest and penalties relating to the income tax on
unrecognized tax benefits as of September 30, 2008 was less than $0.1
million.
The
Company is subject to taxation in the U.S., various states and foreign
jurisdiction. Due to the Company’s tax loss position in prior years, all tax
years are open to examination in the U.S. and state jurisdictions for generation
of net operating losses and tax credits. The Company is also open to examination
in various foreign tax jurisdictions for tax years 2003 and forward, none of
which were individually material.
CHORDIANT
SOFTWARE, INC.
NOTES
TO CONSOLIDATED FINANCIAL STATEMENTS-(Continued)
NOTE
12—STOCK BENEFIT PLANS AND STOCK-BASED COMPENSATION
2005
Equity Incentive Plan
The 2005
Equity Incentive Plan, or 2005 Plan, was approved by stockholders at the annual
meeting on September 27, 2005. The 2005 Plan replaces the 1999 Equity Incentive
Plan, or 1999 Plan and provides for the grant of incentive stock options,
nonstatutory stock options, stock purchase awards, RSAs, RSUs and other forms of
equity compensation (collectively, the “stock awards”). The option price shall
not be less than the fair market value of the shares on the date of grant and no
portion may be exercised beyond ten years from that date. However, during the
stock option review (see Note 3 in Notes to Consolidated Financial Statements of
the 2006 Form 10-K), it was discovered that some options granted had the option
price less than the fair market value of the shares on the date of grant. As
more fully described on Form SC TO-I filed with the SEC on March 29, 2007,
Chordiant amended these eligible options. Based on the terms of individual
options grants, options granted under the 2005 Plan generally expire four to ten
years after the grant date and generally becomes exercisable over a period of
two to four years, with either yearly or monthly vesting. Under the 1999 Plan,
stock options generally expire ten years after the grant date and vest over a
period that is limited to five years, but were typically granted with a
four-year vesting period. The stock option grant agreements allow for the early
exercise of options granted to employees. Exercised but unvested shares are
subject to repurchase by the Company at the initial exercise price. Beginning
September 27, 2005, no additional stock awards will be granted under the 1999
Plan. Shares remaining available for issuance pursuant to the exercise of
options or settlement of stock awards under the 1999 Plan of approximately 0.5
million shares were added to the share reserve of the 2005 Plan and, as of
September 27, 2005, became available for issuance pursuant to stock awards
granted under the 2005 Plan. All outstanding stock awards granted under the 1999
Plan will remain subject to the terms of the 1999 Plan, except that the Board
may elect to extend one or more of the features of the 2005 Plan to stock awards
granted under the 1999 Plan. Any shares subject to outstanding stock awards
granted under the 1999 Plan that expire or terminate for any reason prior to
exercise or settlement shall be added to the share reserve of the 2005 Plan and
become available for issuance pursuant to stock awards granted under the 2005
Plan. The 2005 Plan increased the number of shares available for issuance by 2.2
million shares of common stock from an aggregate total of approximately 0.5
million shares available under the 1999 Plan as of September 27, 2005, resulting
in an aggregate of approximately 2.7 million shares available for future grant
and issuance under the 2005 Plan at that date. In January 2007, November 2007,
and November 2008, the Board amended the 2005 plan to increase the number of
shares reserved for future issuance by 1.6 million, 0.7 million, and 0.7 million
shares respectively. These amendments were approved by the stockholders at the
2007, 2008, and 2009 Annual Meetings of Stockholders. As of September 30, 2009,
there were approximately 2.8 million shares reserved for future issuance and
approximately 3.8 million options that were outstanding under the 2005
Plan.
In
the quarter ended December 31, 2007, the Company granted 0.2 million
performance-based RSUs to selected executives of the Company pursuant to the
2005 Plan. In addition, new executives to the Company were also enrolled into
the program during fiscal year 2008. The performance-based RSUs cliff vest at
the end of a two year requisite service period, constituting the Company’s
fiscal years 2008 and 2009, upon achievement of specified performance criteria
established by the Compensation Committee of our Board of Directors. Total
compensation cost for these awards is based on the fair market value of the
shares at the date of grant. The portion of the total compensation cost related
to the performance-based awards is subject to adjustment each quarter based on
management’s assessment of the likelihood of achieving the two year performance
criteria. As of September 30, 2009, management did not achieve the two year
performance criteria and the 0.2 million grants were cancelled in October
2009.
During
the fiscal year ended September 2009, the Company granted 0.5 million RSUs to
executive officers, 0.1 million RSUs to non-executive management team members,
and 0.1 million RSUs to a new management team member. The RSUs are equal to an
equivalent number of shares of common stock. Vesting of the shares are time
based with one third of the RSU’s vesting each year after the date of grant for
a period of three years. Vested shares are subject to a two-year post-vesting
holding period. In the event of certain changes in control of the Company, any
unvested shares would automatically vest and vested shares subject to the
holding period will be released.
2000
Nonstatutory Equity Incentive Plan
In
March 2000, the Board adopted the 2000 Nonstatutory Equity Incentive Plan, or
2000 Plan. Stockholder approval of this plan was not required and was not
obtained by the Company. The 2000 Plan provided for the grant of nonstatutory
stock options and the issuance of restricted stock and stock bonuses to
employees. Generally, stock options under the 2000 Plan vest over a period of
four years in equal monthly installments with 25% of the shares vesting after
one year, and the
CHORDIANT
SOFTWARE, INC.
NOTES
TO CONSOLIDATED FINANCIAL STATEMENTS-(Continued)
remainder
vesting in equal monthly installments over the remaining three years. In January
2007, the Board amended the 2000 Plan to reduce the number of shares available
for future issuance to zero. No additional stock options will be granted under
the 2000 Plan. As of September 30, 2009, there were approximately 0.3 million
options outstanding under the 2000 Plan.
1999
Non-Employee Director Option Plan
The 1999
Non-Employee Director Stock Option Plan, or 1999 Director Plan, was adopted by
the Board of Directors and became effective on the date of the Company’s initial
public offering. The 1999 Director Plan was amended by the stockholders at the
2007 and 2009 Annual Meeting of Stockholders’. Under the amended 1999 Directors’
Plan,
Directors will no longer receive stock options under the Directors’ Plan.
Instead, continuing directors will be issued a single grant at each year’s
annual meeting of the stockholders equal to a number of shares of restricted
stock equal to $100,000 divided by the fair market value of the Company’s common
stock on the date of the Annual meeting. These shares of restricted stock will
vest on the earlier to occur of (1) the next annual meeting or (2) twelve (12)
months from the date of grant. The maximum number of shares of restricted stock
that a Board member may receive in connection with the annual grant of
restricted stock under the Directors’ Plan is limited to 15,000 shares per year.
New non-employee directors will receive a grant of restricted stock on
substantially the same terms but with the number of shares and vesting schedule
prorated in proportion to the amount time remaining between the grant and the
first anniversary of the most recent annual meeting of stockholders. Such
shares of restricted stock will be subject to a post-vesting holding period,
such that the director may not sell or otherwise transfer any of the shares
until the earliest of (1) the second anniversary of the vesting date, (2) the
closing of a merger or sale of substantially all of the assets of the Company,
(3) the certification by the Board that the director has suffered an
unforeseeable emergency or (4) the death or disability of the director. Shares
sold or withheld by the Company to cover applicable tax withholdings will not be
deemed a violation of this holding period. Prior to January 2007, the amount
reserved under the Directors’ Plan automatically increased on October 1st of
each year by the greater of (1) 0.5% outstanding shares on such date or (2) the
number of shares subject to stock awards made under the Directors’ Plan during
the prior year. The Board amended and restated the Directors’ Plan to decrease
the number of shares reserved for future issuance to 0.3 million shares and
eliminated the automatic increase provision. As of September 30, 2009,
approximately 0.1 million shares of common stock have been reserved for issuance
and 0.2 million options are outstanding under the 1999 Director
Plan.
On
February 1, 2008, the Company’s Board members were granted 71,088 RSAs for their
annual service award under the Directors’ Plan. The RSAs cliff vest at the
earlier of the date of the first anniversary of the most recent Annual Meeting
or on the date of the next Annual meeting. The shares vested during the fiscal
year ended September 30, 2009.
On
January 28, 2009, the Company’s Board members were granted 90,000 RSAs for their
annual service award under the Directors’ Plan. The RSAs cliff vest at the
earlier of the date of the first anniversary of the most recent Annual Meeting
or on the date of the next Annual meeting.
Shareholder
Rights Plan
On
July 7, 2008, the Board of Directors declared a dividend of one preferred share
purchase right (a “Right”) for each outstanding share of common stock, par value
$0.001 per share (the “Common Shares”), of the Company. The dividend was
effective as of July 21, 2008 (the “Record Date”) with respect to the
stockholders of record on that date. The Rights will also attach to new Common
Shares issued after the Record Date. Each Right entitles the registered holder
to purchase from the Company one one-hundredth of a share of Series A Junior
Participating Preferred Stock, par value $0.001 per share (the “Preferred
Shares”), of the Company at a price of $20.00 per one one-hundredth of a
Preferred Share (the “Purchase Price”), subject to adjustment. Each Preferred
Share is designed to be the economic equivalent of one hundred (100) Common
Shares.
The
Rights are exercisable only if a person or group acquires beneficial ownership
of, or makes a tender for, 20 percent or more of our outstanding common
stock.
If
any person becomes the beneficial owner of 20 percent or more of our outstanding
common stock, each Right not owned by such person or certain related parties
will entitle its holder to purchase at the Right's then current exercise price
shares of our common stock having a market value equal to twice the then current
exercise price
Our
Board of Directors will be entitled to redeem the Rights at $0.001 per Right at
any time prior to a person or group acquiring 20 percent or more of our common
stock. Otherwise, the Rights will expire on July 21, 2011.
CHORDIANT
SOFTWARE, INC.
NOTES
TO CONSOLIDATED FINANCIAL STATEMENTS-(Continued)
In
conjunction with the Right’s Plan 500,000 shares of Preferred Stock, $0.001 par
value per share, have been designated as Series A Junior Participating Preferred
Stock. Preferred Shares purchasable upon exercise of the Rights will not be
redeemable. Each Preferred Share will be entitled to a minimum
preferential quarterly dividend payment of one dollar ($l.00) per share but will
be entitled to an aggregate dividend of one hundred times (100x) the dividend
declared per Common Share. In the event of liquidation, the holders of the
Preferred Shares will be entitled to a minimum preferential liquidation payment
of one hundred dollars ($100) per share but will be entitled to an aggregate
payment of one hundred (100x) times the payment made per Common Share. Each
Preferred Share will have one hundred (100) votes, voting together with the
Common Shares. Finally, in the event of any merger, consolidation or other
transaction in which Common Shares are exchanged, each Preferred Share will be
entitled to receive one hundred times (100x) the amount received per Common
Share.
Stock
Option Activity
The
following table summarizes stock option activity under our stock option plans
(in thousands, except per share data):
|
Outstanding
|
||||||||||||||
|
Shares
|
Weighted
Average
Exercise
Price
|
Weighted
Average
Remaining
Contractual
Life
(Years)
|
Aggregate
Intrinsic
Value
Closing
Price at
9/30/2009
of
$3.89
|
|||||||||||
|
Balance
at September 30, 2006
|
3,689
|
$
|
6.33
|
|||||||||||
|
Granted
|
1,354
|
9.11
|
||||||||||||
|
Options
exercised
|
(1,328
|
)
|
4.57
|
|||||||||||
|
Options
cancelled/forfeited
|
(537
|
)
|
8.86
|
|||||||||||
|
Balance
at September 30, 2007
|
3,178
|
7.96
|
||||||||||||
|
Granted
|
1,112
|
9.04
|
||||||||||||
|
Options
exercised
|
(135
|
)
|
5.40
|
|||||||||||
|
Options
cancelled/forfeited
|
(493
|
)
|
9.34
|
|||||||||||
|
Balance
at September 30, 2008
|
3,662
|
8.19
|
||||||||||||
|
Granted
|
973
|
2.92
|
||||||||||||
|
Options
exercised
|
(42
|
)
|
2.10
|
|||||||||||
|
Options
cancelled/forfeited
|
(899
|
)
|
8.41
|
|||||||||||
|
Balance
at September 30, 2009
|
3,694
|
$
|
6.82
|
6.32
|
$
|
1,231
|
||||||||
|
Vested
and expected to vest at September 30, 2009
|
3,582
|
$
|
6.86
|
6.26
|
$
|
1,179
|
||||||||
|
Exercisable
at September 30, 2009
|
2,407
|
$
|
7.24
|
5.96
|
$
|
576
|
||||||||
The
following table summarizes information about stock options outstanding and
exercisable at September 30, 2009 (in thousands, except exercise prices and
contractual life data):
|
Options
Outstanding and Exercisable
|
Options
Vested
|
|||||||||||||||||||||
|
Range
of
Exercise
Prices
|
Number
Outstanding
|
Weighted
Average
Remaining
Contractual
Life
(Years)
|
Weighted
Average
Exercise
Price
|
Aggregate
Intrinsic
Value
Closing
Price
at
09/30/2009
of
$3.89
|
Number
Exercisable
|
Weighted
Average
Exercise
Price
|
Aggregate
Intrinsic
Value
Closing
Price
at
09/30/09
of
$3.89
|
|||||||||||||||
|
$0.35
– 2.32
|
673
|
4.00
|
$
|
2.30
|
$
|
1,073
|
289
|
$
|
2.27
|
$
|
469
|
|||||||||||
|
2.50
– 4.75
|
564
|
6.52
|
3.97
|
158
|
344
|
3.87
|
107
|
|||||||||||||||
|
4.90
– 7.53
|
462
|
6.62
|
6.43
|
—
|
359
|
6.62
|
—
|
|||||||||||||||
|
7.58
– 8.13
|
455
|
6.13
|
7.95
|
—
|
406
|
7.95
|
—
|
|||||||||||||||
|
8.25
– 8.35
|
586
|
7.29
|
8.26
|
—
|
420
|
8.26
|
—
|
|||||||||||||||
|
8.38
– 9.25
|
584
|
7.97
|
9.18
|
—
|
298
|
9.14
|
—
|
|||||||||||||||
|
9.26
– 45.00
|
370
|
5.94
|
12.52
|
—
|
291
|
12.53
|
—
|
|||||||||||||||
|
$0.35
– 45.00
|
3,694
|
6.32
|
$
|
6.82
|
$
|
1,231
|
2,407
|
$
|
7.24
|
$
|
576
|
|||||||||||
CHORDIANT
SOFTWARE, INC.
NOTES
TO CONSOLIDATED FINANCIAL STATEMENTS-(Continued)
The
aggregate intrinsic value in the preceding table represents the total intrinsic
value, based on the Company’s closing stock price of $3.89 as of September 30,
2009, which would have been received by the option holders had all option
holders exercised their options as of that date. The total intrinsic value of
options exercised during the years ended September 30, 2009, 2008, and 2007 was
$0.1 million, $0.8 million, and $8.5 million, respectively. As of September 30,
2009, total unrecognized compensation costs related to non-vested stock options
was $3.4 million, which is expected to be recognized as expense over a
weighted-average period of approximately 1.9 years.
Stock
Award Activity
Non-vested
stock awards are comprised of restricted stock awards and restricted stock
units. The following table summarizes the stock award activity (in thousands,
except per share data):
|
Non-vested
Stock Awards
|
RSAs
|
RSUs
|
Total
Number of Shares
Underlying
Awards
|
Weighted
Average
Grant
Date
Fair Value
|
|||||||||||
|
Non-vested
balance at September 30, 2006
|
407
|
—
|
407
|
$
|
6.08
|
||||||||||
|
Awarded
|
—
|
—
|
—
|
—
|
|||||||||||
|
Vested/Released
|
(270
|
)
|
—
|
(270
|
)
|
5.37
|
|||||||||
|
Forfeited
|
(137
|
)
|
—
|
(137
|
)
|
7.49
|
|||||||||
|
Non-vested
balance at September 30, 2007
|
—
|
—
|
—
|
—
|
|||||||||||
|
Awarded
|
71
|
—
|
*
|
71
|
8.44
|
||||||||||
|
Vested/Released
|
—
|
—
|
—
|
—
|
|||||||||||
|
Forfeited
|
—
|
—
|
—
|
—
|
|||||||||||
|
Non-vested
balance at September 30, 2008
|
71
|
—
|
71
|
8.44
|
|||||||||||
|
Awarded
|
90
|
638
|
*
|
728
|
2.46
|
||||||||||
|
Vested/Released
|
(71
|
)
|
—
|
(71
|
)
|
8.44
|
|||||||||
|
Forfeited
|
—
|
(50
|
)
|
(50
|
)
|
2.32
|
|||||||||
|
Non-vested
balance at September 30, 2009
|
90
|
588
|
678
|
$
|
2.48
|
* The number of
RSUs granted is an estimate based upon management’s assessment of the likelihood
of achieving the two year performance criteria.
The
aggregate intrinsic value of unvested RSAs based upon the Company’s closing
price of $3.89 as of September 30, 2009 was $0.4 million. As of September 30,
2009, total unrecognized compensation costs related to unvested RSAs was $0.1
million which is expected to be recognized as expense over a weighted average
period of approximately 0.6 year.
The
aggregate intrinsic value of RSUs based upon the Company’s closing price of
$3.89 as of September 30, 2009 was $2.3 million. As of September 30, 2009, total
unrecognized compensation costs related to unvested RSUs was $1.1 million which
is expected to be recognized as expense over a weighted average period of
approximately 2.5 years.
In
October 2007, the Company granted 0.2 million performance-based RSUs to selected
executives of the Company pursuant to the 2005 Plan. Based upon management’s
assessment of the likelihood of achieving the two year performance criteria, the
Company has estimated that zero out of a maximum of 0.2 million of unvested RSUs
with an average fair value of $13.99 per unit will be awarded at the end of the
measurement period. For the years ended September 30, 2009 and 2008, zero stock
compensation expense related to the performance-based RSUs has been recognized.
As of September 30, 2009, management did not achieve the two year performance
criteria and the 0.2 million grants were cancelled in October 2009.
The
Company settles stock option exercises, RSAs and RSUs with newly issued common
shares.
CHORDIANT
SOFTWARE, INC.
NOTES
TO CONSOLIDATED FINANCIAL STATEMENTS-(Continued)
Valuation
and Expense Information under SFAS 123(R)
On
October 1, 2005, the Company adopted a FASB standard, which requires the
measurement and recognition of compensation expense for all share-based payment
awards made to the Company’s employees and directors including employee stock
options, RSAs, and RSUs based on estimated fair values. The following table
summarizes stock-based compensation expense related to employee stock options,
RSAs, and RSUs for years ended September 30, 2009, 2008, and 2007 which was
allocated as follows (in thousands):
|
Years
Ended September 30,
|
|||||||||||||
|
2009
|
2008
|
2007
|
|||||||||||
|
Stock-based
compensation expense:
|
|||||||||||||
|
Cost
of revenues
|
$
|
574
|
$
|
490
|
$
|
313
|
|||||||
|
Sales
and marketing
|
889
|
922
|
744
|
||||||||||
|
Research
and development
|
418
|
586
|
546
|
||||||||||
|
General
and administrative
|
1,787
|
2,127
|
1,417
|
||||||||||
|
Total
stock-based compensation expense
|
$
|
3,668
|
$
|
4,125
|
$
|
3,020
|
|||||||
Stock-based
compensation expense recognized under the FASB standard for the year ended
September 30, 2009 was $3.7 million which consisted of stock-based compensation
expense related to employee stock options of $2.9 million, stock-based
compensation expense related to RSAs of $0.4 million, and $0.4 million of
stock-based compensation expense related to RSUs.
Stock-based
compensation expense recognized under the FASB standard for the year ended
September 30, 2008 was $4.1 million which consisted of stock-based compensation
expense related to employee stock options of $3.8 million, stock-based
compensation expense related to RSAs of $0.3 million, and zero stock-based
compensation expense related to RSUs. On May 1, 2008, Chordiant implemented a
reduction of approximately 10% of its workforce. As part of the reduction in
workforce, an executive left the Company which resulted in the modification of
his stock options as the right to exercise the stock options was extended by the
Board of Directors. The net charge to stock compensation expense for the
modification was less than $0.1 million.
Stock-based
compensation expense recognized under the FASB standard for the year ended
September 30, 2007 was $3.0 million which consisted of stock-based compensation
expense related to employee stock options of $2.8 million and stock-based
compensation expense related to RSAs of $0.2 million. During the quarter ended
June 30, 2007, the Company completed a tender offer which resulted in the
modification of certain options. The Company increased the exercise price of
options previously issued at a discount to limit the potential adverse personal
tax consequences that may apply to those stock options under Section 409A of the
Internal Revenue Code and state law equivalents. When combined with the related
cash bonus to be paid to the option holders in connection with the exchange, the
net charge to compensation expense for during the quarter was $0.1
million.
The
weighted-average estimated fair value of stock options granted for the years
ended September 30, 2009, 2008, and 2007 was $1.25, $4.12, and $4.41 per share,
respectively, using the Black-Scholes model with the following weighted-average
assumptions:
|
2009
|
2008
|
2007
|
|||||||||||
|
Expected
lives in years
|
2.9
|
3.5
|
3.5
|
||||||||||
|
Risk
free interest rates
|
1.6
|
%
|
3.2
|
%
|
4.7
|
%
|
|||||||
|
Volatility
|
62
|
%
|
59
|
%
|
63
|
%
|
|||||||
|
Dividend
yield
|
0
|
%
|
0
|
%
|
0
|
%
|
|||||||
The
fair value of each option award is estimated on the date of grant using the
Black-Scholes option valuation model with the weighted-average assumptions for
volatility, expected term, and risk free interest rate. The Company used the
trinomial lattice valuation technique to determine the assumptions used in the
Black-Scholes model. The trinomial lattice valuation technique was used to
provide a better estimate of fair values and meet the fair value objectives of
the FASB standard. The expected term of options granted is derived from
historical data on employee exercises and post-vesting
CHORDIANT
SOFTWARE, INC.
NOTES
TO CONSOLIDATED FINANCIAL STATEMENTS-(Continued)
employment
termination behavior. The risk-free rate is based on the U.S. Treasury rates in
effect during the corresponding period of grant. The expected volatility rate is
based on the historical volatility of our stock price.
Stock-based
compensation expense recognized in the Consolidated Statement of Operations for
the years ended September 30, 2009, 2008, and 2007 is based on awards ultimately
expected to vest. Fiscal years 2009, 2008 and 2007 have been reduced for
estimated forfeitures. The FASB standard requires forfeitures to be estimated at
the time of grant and revised, if necessary, in subsequent periods if actual
forfeitures differ from those estimates. The Company’s estimated forfeiture rate
for the year ended September 30, 2009, 2008, and 2007 was based on historical
forfeiture experience.
Accuracy
of Fair Value Estimates
The
Company uses available information including third-party analyses to assist in
developing the fair value assumptions based on a trinomial lattice valuation
technique used in the Black-Scholes model. The Company is responsible for
determining the assumptions used in estimating the fair value of share-based
payment awards.
Our
determination of fair value of share-based payment awards on the date of grant
using an option-pricing model is affected by the Company’s stock price as well
as assumptions regarding a number of highly complex and subjective variables.
These variables include, but are not limited to the Company’s expected stock
price volatility over the term of the awards, and actual and projected employee
stock option exercise behaviors. Because the Company’s employee and director
stock options have certain characteristics that are significantly different from
traded options, and because changes in the subjective assumptions can materially
affect the estimated value, in management’s opinion, the existing valuation
models may not provide an accurate measure of the fair value of the Company’s
stock options, RSAs, and RSUs. Although the fair value of stock options, RSAs,
and RSUs is determined in accordance with a FASB standard and a SAB using an
option-pricing model, that value may not be indicative of the fair value
observed in a willing buyer/willing seller market transaction.
401(k)
Savings Plan
The
Company sponsors a 401(k) Savings Plan (the “Plan”) for full-time employees in
the United States. Under the Plan, each participant may elect to contribute part
of their pre-tax compensation subject to annual maximum IRS limitations. The
Plan allows the Company to match the employee’s contributions. Employee
contributions are fully vested, whereas vesting in the Company’s matching
contributions occurs at a rate of 33.3% per year of employment for the first
three years and at 100% thereafter. The Company’s contributions to the 401(k)
Plan totaled approximately $0.4 million, $0.6 million, and $0.4 million for the
years ended September 30, 2009, 2008, and 2007, respectively.
Defined
Contribution Plan
The
Company also sponsors a defined contribution pension plan for the employees of
Canada, the United Kingdom, the Netherlands, and Germany. The Company’s
contributions to the pension plan totaled approximately $0.5 million, $0.6
million, and $0.4 million for the years ended September 30, 2009, 2008, and
2007, respectively.
1999
Employee Stock Purchase Plan
The
1999 ESPP was adopted by the Board of Directors and became effective on
February 14, 2000, the date of the Company’s initial public offering. The
number of shares reserved under the 1999 ESPP automatically increases on
October 1st of each year by the greater of (1) 2% of the outstanding shares
on such date or (2) the number of shares subject to stock awards made under this
plan during the prior year. However, the automatic increase is subject to
reduction by the Board of Directors. Notwithstanding the foregoing, the
aggregate number of shares that may be sold under the 1999 ESPP shall not exceed
5.2 million shares. There were no purchases of common stock under the ESPP for
the years ended September 2009, 2008 and 2007, as the plan is currently
suspended. In January 2007, the Board amended the ESPP to reduce the number of
shares available for future issuance to 0.4 million. Subsequently, during fiscal
year 2009 and 2008, the shares reserved under the 1999 ESPP automatically
increased by 0.6 and 0.7 million shares, respectively, at each
date.
CHORDIANT
SOFTWARE, INC.
NOTES
TO CONSOLIDATED FINANCIAL STATEMENTS-(Continued)
NOTE
13—SEGMENT INFORMATION
The
Company’s chief operating decision maker reviews financial information presented
on a consolidated basis, accompanied by desegregated information about revenues
by geographic region for purposes of making operating decisions and assessing
financial performance. Accordingly, the Company has concluded that the Company
has one reportable segment.
The
following table summarizes license revenues by product emphasis (in
thousands):
|
Years
Ended September 30,
|
|||||||||||||
|
2009
|
2008
|
2007
|
|||||||||||
|
License
revenue
|
|||||||||||||
|
Enterprise
Foundation solutions
|
$
|
5,996
|
$
|
19,615
|
$
|
37,648
|
|||||||
|
Marketing
Director solutions
|
3,904
|
6,744
|
6,013
|
||||||||||
|
Decision
Management solutions
|
12,562
|
7,752
|
10,391
|
||||||||||
|
Total
|
$
|
22,462
|
$
|
34,111
|
$
|
54,052
|
|||||||
The
following table summarizes service revenue consisting of consulting
implementation and integration, consulting customization, training, PCS and
certain reimbursable out-of-pocket expenses by product emphasis (in
thousands):
|
Years
Ended September 30,
|
|||||||||||||
|
2009
|
2008
|
2007
|
|||||||||||
|
Service
revenue
|
|||||||||||||
|
Enterprise
Foundation solutions
|
$
|
32,123
|
$
|
54,805
|
$
|
51,584
|
|||||||
|
Marketing
Director solutions
|
9,765
|
12,721
|
12,369
|
||||||||||
|
Decision
Management solutions
|
13,112
|
11,327
|
6,542
|
||||||||||
|
Total
|
$
|
55,000
|
$
|
78,853
|
$
|
70,495
|
|||||||
Foreign
revenues are based on the country in which the customer order is generated. The
following is a summary of total revenues by geographic area (in
thousands):
|
Years
Ended September 30,
|
|||||||||||||
|
2009
|
2008
|
2007
|
|||||||||||
|
North
America
|
$
|
27,018
|
$
|
58,813
|
$
|
65,701
|
|||||||
|
Europe
|
50,444
|
54,151
|
58,846
|
||||||||||
|
Total
revenues
|
$
|
77,462
|
$
|
112,964
|
$
|
124,547
|
|||||||
Included
in foreign revenue results for Europe is revenue from the United Kingdom of
$23.8 million, $24.7 million, and $28.3 million for the years ended September
30, 2009, 2008, and 2007, respectively.
Property
and equipment information is based on the physical location of the assets. The
following is a summary of property and equipment, net by geographic area (in
thousands):
|
Years
Ended September 30,
|
|||||||||||||
|
2009
|
2008
|
2007
|
|||||||||||
|
North
America
|
$
|
1,313
|
$
|
2,250
|
$
|
2,346
|
|||||||
|
Europe
|
537
|
915
|
1,292
|
||||||||||
|
Total
property and equipment, net
|
$
|
1,850
|
$
|
3,165
|
$
|
3,638
|
|||||||
CHORDIANT
SOFTWARE, INC.
NOTES
TO CONSOLIDATED FINANCIAL STATEMENTS-(Continued)
NOTE
14—QUARTERLY FINANCIAL DATA (UNAUDITED)
The
following tables set forth a summary of the Company’s quarterly financial
information for each of the four quarters for the years ended September 30, 2009
and 2008:
Year
ended September 30, 2009:
|
Quarters
-Ended
|
||||||||||||||||
|
September30,
2009
|
June
30,
2009
|
March
31,
2009
|
December
31,
2008
|
|||||||||||||
|
(in
thousands, except per share data)
|
||||||||||||||||
|
Revenues
|
$
|
15,204
|
$
|
20,878
|
$
|
18,003
|
$
|
23,377
|
||||||||
|
Gross
profit
|
$
|
10,044
|
$
|
15,468
|
$
|
11,800
|
$
|
16,290
|
||||||||
|
Net
loss
|
$
|
(4,537
|
)
|
$
|
(22
|
)
|
$
|
(3,536
|
)
|
$
|
(2,669
|
)
|
||||
|
Net
loss per share:
|
||||||||||||||||
|
Basic
|
$
|
(0.15
|
)
|
$
|
0.00
|
$
|
(0.12
|
)
|
$
|
(0.09
|
)
|
|||||
|
Diluted
|
$
|
(0.15
|
)
|
$
|
0.00
|
$
|
(0.12
|
)
|
$
|
(0.09
|
)
|
|||||
|
Weighted
average shares used in computing net loss per share:
|
||||||||||||||||
|
Basic
|
30,109
|
30,092
|
30,059
|
30,008
|
||||||||||||
|
Diluted
|
30,109
|
30,092
|
30,059
|
30,008
|
||||||||||||
Year
ended September 30, 2008:
|
Quarters
-Ended
|
||||||||||||||||
|
September30,
2008
|
June
30,
2008
|
March
31,
2008
|
December
31,
2007
|
|||||||||||||
|
(in
thousands, except per share data)
|
||||||||||||||||
|
Revenues
|
$
|
28,398
|
$
|
30,716
|
$
|
24,716
|
$
|
29,134
|
||||||||
|
Gross
profit
|
$
|
19,667
|
$
|
21,398
|
$
|
15,598
|
$
|
20,019
|
||||||||
|
Net
income (loss)
|
$
|
1,260
|
$
|
759
|
$
|
(1,159
|
)
|
$
|
205
|
|||||||
|
Net
income (loss) per share:
|
||||||||||||||||
|
Basic
|
$
|
.04
|
$
|
0.03
|
$
|
(0.04
|
)
|
$
|
0.01
|
|||||||
|
Diluted
|
$
|
.04
|
$
|
0.02
|
$
|
(0.04
|
)
|
$
|
0.01
|
|||||||
|
Weighted
average shares used in computing net income (loss) per
share:
|
||||||||||||||||
|
Basic
|
29,995
|
30,262
|
33,066
|
33,292
|
||||||||||||
|
Diluted
|
30,208
|
30,474
|
33,066
|
33,864
|
||||||||||||
NOTE
15—STOCK REPURCHASE
On
February 28, 2008, the Company’s Board of Directors authorized a program to
repurchase up to $25 million of the Company’s common stock over a one year
period, or 2008 Repurchase Plan, which started on March 4, 2008. On April 30,
2008, the Company terminated the 2008 Repurchase Plan after repurchasing a total
of 3.4 million shares of common stock for $18.6 million at an average price of
$5.55 per share. Repurchased shares were immediately retired and resumed the
status of authorized but unissued shares.
There
were no repurchases of the Company’s common stock during the years ended
September 30, 2009 and 2007.
CHORDIANT
SOFTWARE, INC.
NOTES
TO CONSOLIDATED FINANCIAL STATEMENTS-(Continued)
NOTE
16—SUBSEQUENT EVENTS
Equity
Compensation
In
November 2009, the Company’s Board of Directors approved the grant of 455,600
shares of Stock Options and 618,300 RSUs to the employees and executives of the
Company.
|
CHANGES
IN AND DISAGREEMENTS WITH ACCOUNTANTS ON ACCOUNTING AND FINANCIAL
DISCLOSURE
|
None
|
CONTROLS
AND PROCEDURES
|
Evaluation
of Disclosure Controls and Procedures
The
Company’s management, with the participation of the Company’s principal
executive officer and principal financial officer, has evaluated the
effectiveness of the Company’s disclosure controls and procedures (as such term
is defined in Rules 13a-15(e) and 15d-15(e) under the Exchange Act) as of the
end of the period covered by this report. Based on such evaluation, the
Company’s principal executive officer and principal financial officer have
concluded that, as of the
end
of such period, the Company’s disclosure controls and procedures were
effective.
Changes
in Internal Control over Financial Reporting
There
were no changes in our internal controls over financial reporting during the
quarter ended September 30, 2009 that have materially affected, or are
reasonably likely to materially affect, our internal controls over financial
reporting.
MANAGEMENT’S
REPORT ON INTERNAL CONTROL OVER FINANCIAL REPORTING
Our
management is responsible for establishing and maintaining adequate internal
control over financial reporting, as such terms are defined in Exchange Act
Rules 13a-15(f) and 15d-15(f). Under the supervision and with the
participation of our management, including our Chief Executive Officer and Chief
Financial Officer, we conducted an evaluation of the effectiveness of our
internal control over financial reporting as of September 30, 2009 based on the
guidelines established in Internal Control—Integrated
Framework issued by the Committee of Sponsoring Organizations of the
Treadway Commission (COSO). Because of its inherent limitations, internal
control over financial reporting cannot provide absolute assurance of achieving
financial reporting objectives. Internal control over financial reporting is a
process that involves human diligence and compliance and is subject to lapses in
judgment and breakdowns resulting from human failures. Internal control over
financial reporting also can be circumvented by collusion or improper management
override. Because of such limitations, there is a risk that material
misstatements may not be prevented or detected on a timely basis by internal
control over financial reporting. Also, projections of any evaluation of
effectiveness to future periods are subject to the risk that controls may become
inadequate because of changes in conditions or that the degree of compliance
with established policies or procedures may deteriorate.
In
connection with the Company’s assessment of the effectiveness of internal
control over financial reporting, our management has concluded that our internal
over financial reporting was effective as of September 30, 2009.
BDO
Seidman, LLP, our independent registered public accounting firm has audited the
effectiveness of our internal control over financial reporting as of September
30, 2009. BDO Seidman, LLP’s report on the audit of internal control over
financial reporting is included in Item 9A of this
Form 10-K.
Report
of Independent Registered Public Accounting Firm
To
the Board of Directors and Stockholders
Chordiant
Software, Inc.
Cupertino,
California
We
have audited Chordiant Software, Inc.’s internal control over financial
reporting as of September 30, 2009, based on criteria established in Internal Control – Integrated
Framework issued by the Committee of Sponsoring Organizations of the
Treadway Commission (the COSO criteria). Chordiant Software, Inc.’s management
is responsible for maintaining effective internal control over financial
reporting and for its assessment of the effectiveness of internal control over
financial reporting, included in the accompanying Item 9A, Management’s Report
on Internal Control Over Financial Reporting. Our responsibility is to express
an opinion on the company’s internal control over financial reporting based on
our audit.
We
conducted our audit in accordance with the standards of the Public Company
Accounting Oversight Board (United States). Those standards require that we plan
and perform the audit to obtain reasonable assurance about whether effective
internal control over financial reporting was maintained in all material
respects. Our audit included obtaining an understanding of internal control over
financial reporting, assessing the risk that a material weakness exists, and
testing and evaluating the design and operating effectiveness of internal
control based on the assessed risk. Our audit also included performing such
other procedures as we considered necessary in the circumstances. We believe
that our audit provides a reasonable basis for our opinion.
A
company’s internal control over financial reporting is a process designed to
provide reasonable assurance regarding the reliability of financial reporting
and the preparation of financial statements for external purposes in accordance
with generally accepted accounting principles. A company’s internal control over
financial reporting includes those policies and procedures that (1) pertain to
the maintenance of records that, in reasonable detail, accurately and fairly
reflect the transactions and dispositions of the assets of the company; (2)
provide reasonable assurance that transactions are recorded as necessary to
permit preparation of financial statements in accordance with generally accepted
accounting principles, and that receipts and expenditures of the company are
being made only in accordance with authorizations of management and directors of
the company; and (3) provide reasonable assurance regarding prevention or timely
detection of unauthorized acquisition, use, or disposition of the company’s
assets that could have a material effect on the financial
statements.
Because
of its inherent limitations, internal control over financial reporting may not
prevent or detect misstatements. Also, projections of any evaluation of
effectiveness to future periods are subject to the risk that controls may become
inadequate because of changes in conditions, or that the degree of compliance
with the policies or procedures may deteriorate.
In
our opinion, Chordiant Software, Inc. maintained, in all material respects,
effective internal control over financial reporting as of September 30, 2009,
based on the COSO criteria.
We
also have audited, in accordance with the standards of the Public Company
Accounting Oversight Board (United States), the consolidated balance sheets of
Chordiant Software, Inc. as of September 30, 2009 and 2008, and the related
consolidated statements of operations, stockholders’ equity and comprehensive
income (loss), and cash flows for each of the three years in the period ended
September 30, 2009 and our report dated November 19, 2009 expressed an
unqualified opinion thereon.
/s/
BDO Seidman, LLP
San
Jose, California
November
19, 2009
|
OTHER
INFORMATION
|
None.
|
DIRECTORS,
EXECUTIVE OFFICERS AND CORPORATE
GOVERNANCE
|
The
information required by this Item is incorporated by reference from the
information contained in our definitive Proxy Statement to be filed with the
Securities and Exchange Commission in connection with the solicitation of
proxies for our 2010 Annual Meeting of Stockholders (the “Proxy Statement”). The
Proxy Statement will be filed with the Securities and Exchange Commission not
later than 120 days after the end of our fiscal year ended September 30,
2009.
|
EXECUTIVE
COMPENSATION
|
The
information required by this Item is incorporated by reference from the
information to be contained in our Proxy Statement.
|
SECURITY
OWNERSHIP OF CERTAIN BENEFICIAL OWNERS AND MANAGEMENT AND RELATED
STOCKHOLDER MATTERS
|
The
information required by this Item, including information regarding securities
authorized for issuance under our equity compensation plans, is incorporated by
reference from the information to be contained in our Proxy
Statement.
|
CERTAIN
RELATIONSHIPS AND RELATED TRANSACTIONS, AND DIRECTOR
INDEPENDANCE
|
The
information required by this Item is incorporated by reference from the
information to be contained in our Proxy Statement.
|
PRINCIPAL
ACCOUNTANT FEES AND SERVICES
|
The
information required by this Item is incorporated by reference from the
information to be contained in our Proxy Statement.
|
EXHIBITS
AND FINANCIAL STATEMENT SCHEDULES
|
(a)
|
|
1.
|
Index
to Financial Statements
|
Please see the accompanying Index to
Consolidated Financial Statements, which appears on page 55 of this report. The
Report of Independent Registered Public Accounting Firm, Financial Statements
and Notes to Financial Statements which are listed in the Index to Financial
Statements and which appear beginning on page 61 of this report are included in
Item 8 above.
|
|
2.
|
Financial
Statement Schedule
|
Schedule
II—Valuation and Qualifying Accounts for the years ended September 30,
2009, 2008, and 2007 are as follows (in thousands):
|
Balance at
Beginning
of
Period
|
Charged to
Expenses
|
Deductions
/ Adjustment
|
Balance at
End of Period
|
||||||||||||
|
Allowance
for doubtful accounts
|
|||||||||||||||
|
2009
|
$
|
629
|
$
|
(125
|
)
|
$
|
(195
|
)
|
$
|
309
|
|||||
|
2008
|
$
|
165
|
$
|
663
|
$
|
(199
|
)
|
$
|
629
|
||||||
|
2007
|
$
|
83
|
$
|
82
|
$
|
—
|
$
|
165
|
|||||||
|
Deferred
tax asset valuation allowance
|
|||||||||||||||
|
2009
|
$
|
65,852
|
$
|
—
|
$
|
3,793
|
$
|
69,645
|
|||||||
|
2008
|
$
|
88,899
|
$
|
(511
|
)
|
$
|
(22,536
|
)
|
$
|
65,852
|
|||||
|
2007
|
$
|
88,917
|
$
|
—
|
$
|
(18
|
)
|
$
|
88,899
|
||||||
Schedules
not listed have been omitted because the information required to be set forth
therein is not applicable or is included in the Financial Statements or notes
thereto.
|
|
3.
|
Exhibits
|
|
Incorporated
by Reference
|
||||||||
|
Exhibit
Number
|
Description
of Document
|
Form
|
Date
|
Filed
Herewith
|
||||
|
3.1
|
Amended
and Restated Certificate of Incorporation of Chordiant Software,
Inc.
|
Form
10-K
|
11/20/2008
|
|||||
|
3.2
|
Certificate
of Designation of Series A. Junior Participating Preferred
Stock.
|
Form
8-K
|
7/11/2008
|
|||||
|
3.3
|
Amended
and Restated Bylaws of Chordiant Software, Inc.
|
Form 8-K
|
6/3/2008
|
|||||
|
4.1
|
Specimen
Common Stock Certificate.
|
Form
S-11
(No.
333-92187)
|
2/7/2000
|
|||||
|
4.2
|
Rights
Agreement dated as of July 10, 2008 by and between Chordiant Software,
Inc. and American Stock Transfer & Trust Company, LLC
|
Form
8-K
|
7/11/2008
|
|||||
|
4.3
|
Form
of Rights Certificate
|
Form
8-K
|
7/11/2008
|
|||||
|
10.1*
|
1999
Equity Incentive Plan and Form of Stock Option Agreement.
|
Form
S-1
(No.
333-92187)
|
12/6/1999
|
|||||
|
10.2*
|
1999
Employee Stock Purchase Plan.
|
Form
S-1
(No.
333-92187)
|
12/6/1999
|
|||||
|
Incorporated
by Reference
|
||||||||
|
Exhibit
Number
|
Description
of Document
|
Form
|
Date
|
Filed
Herewith
|
||||
|
10.3*
|
Amended
and Restated 1999 Non-Employee Directors' Stock Option
Plan
|
Form
10-Q
|
1/29/2009
|
|||||
|
10.4*
|
Form
of Stock Option Agreement for 1999 Non-Employee Directors' Stock Option
Plan.
|
Form
S-1
(No.
333-92187)
|
1/19/2000
|
|||||
|
10.5*
|
Form
of Chordiant Software, Inc. Amended and Restated 1999 Non-Employee
Directors’ Stock Option Plan Restricted Stock Award Grant Notice and
Chordiant Software, Inc. Amended and Restated 1999 Non-Employee Directors’
Stock Option Plan Restricted Stock Award Agreement.
|
Form
10-Q
|
1/29/2009
|
|||||
|
10.6*
|
Form
of Chordiant Software, Inc. Amended and Restated 1999 Non-Employee
Directors’ Stock Option Plan Restricted Stock Award Grant Notice for
Non-U.S. Directors and Chordiant Software, Inc. Amended and Restated 1999
Non-Employee Directors’ Stock Option Plan Restricted Stock Award Agreement
for Non-U.S. Directors.
|
Form
10-Q
|
1/29/2009
|
|||||
|
10.7*
|
2000
Nonstatutory Equity Incentive Plan.
|
S-8
(No.
333-42844)
|
8/2/2000
|
|||||
|
10.8*
|
2005
Equity Incentive Plan, as amended.
|
Schedule
14A
|
12/17/2008
|
|||||
|
10.9*
|
Form
of Chordiant Software, Inc. 2005 Equity Incentive Plan Stock Option Grant
Notice and Chordiant Software, Inc. 2005 Equity Incentive Plan Stock
Option Agreement.
|
Form
10-Q
|
1/29/2009
|
|||||
|
10.10*
|
Form
of Chordiant Software, Inc. 2005 Equity Incentive Plan Restricted Stock
Unit Grant Notice and Chordiant Software, Inc. 2005 Equity Incentive Plan
Restricted Stock Unit Agreement.
|
Form
10-Q
|
5/7/2009
|
|||||
|
10.11*
|
Form
of Chordiant Software, Inc. 2005 Equity Incentive Plan Stock Option Grant
Notice for Non-U.S. Employees and Chordiant Software, Inc. 2005 Equity
Incentive Plan Stock Option Agreement for Non-U.S.
Employees.
|
Form
10-Q
|
1/29/2009
|
|||||
|
10.12*
|
Form
of Chordiant Software, Inc. 2005 Equity Incentive Plan Restricted Stock
Unit Grant Notice for Non-U.S. Employees and Chordiant Software, Inc. 2005
Equity Incentive Plan Restricted Stock Unit Agreement for Non-U.S.
Employees.
|
Form
10-Q
|
5/7/2009
|
|||||
|
10.13*
|
Form
of 2008-2009 Performance Share Unit Program Award Grant
Notice
|
Form
10-K
|
11/15/2007
|
|||||
|
10.14*
|
Form
of Stock Option Agreement for Steven R. Springsteel.
|
Form
8-K
|
2/2/2006
|
|||||
|
10.15*††
|
2008-2009
Performance Share Unit Program.
|
Form
10-K
|
11/15/2007
|
|||||
|
10.16*
|
A
description of certain compensation arrangements between Chordiant
Software, Inc. and its executive officers.
|
Form
8-K/A
|
11/25/2008
|
|||||
|
10.17*††
|
Chordiant
Software, Inc. Fiscal Year 2009 Executive Incentive Bonus
Plan
|
Form
10-Q
|
5/7/2009
|
|||||
|
10.18*
|
Form
of Director Agreement by and between Chordiant Software, Inc. and certain
officers and directors of Chordiant Software, Inc.
|
Form
10-K/T
|
3/29/2005
|
|||||
|
10.19*
|
Form
of Indemnity Agreement by and between Chordiant Software, Inc. and certain
officers and directors of Chordiant Software, Inc.
|
Form
10-Q
|
1/29/2009
|
|||||
|
10.20*
|
Board
Member Agreement dated March 7, 2006 for Richard Stevens.
|
Form
8-K
|
3/10/2006
|
|||||
|
Incorporated
by Reference
|
||||||||
|
Exhibit
Number
|
Description
of Document
|
Form
|
Date
|
Filed
Herewith
|
||||
|
10.21*††
|
Chordiant
Software, Inc. 2009 Vice President Worldwide Sales Incentive Bonus
Plan.
|
Form
10-Q
|
5/7/2009
|
|||||
|
10.22*††
|
Chordiant
Software, Inc. 2009 Vice President Worldwide Professional Services
Incentive Bonus Plan.
|
Form
10-Q
|
5/7/2009
|
|||||
|
10.23*††
|
Chordiant
Software, Inc. 2009 General Counsel Incentive Bonus Plan.
|
Form
10-Q
|
5/7/2009
|
|||||
|
10.24*
|
Amended
and Restated Change of Control Agreement dated November 24, 2008 by and
between Chordiant Software, Inc. and Steven R.
Springsteel.
|
Form
8-K
|
11/25/2008
|
|||||
|
10.25*
|
Amended
and Restated Change of Control Agreement dated November 25, 2008 by and
between Chordiant Software, Inc. and Peter S. Norman.
|
Form
8-K
|
11/25/2008
|
|||||
|
10.26*
|
Amended
Form of Change of Control Agreement by and between Chordiant Software,
Inc. and certain of its executive officers
|
Form
8-K
|
11/25/2008
|
|||||
|
10.27*
|
Change
of Control Agreement dated April 8, 2009 by and between Chordiant
Software, Inc. and Marchai Bruchey.
|
Form
10-Q
|
7/30/2009
|
|||||
|
10.28*
|
Change
of Control Agreement dated May 22, 2006 by and between Chordiant Software,
Inc. and Frank Florence.
|
Form
10-Q
|
4/30/2007
|
|||||
|
10.29*
|
Separation
Agreement dated May 1, 2008 by and between Chordiant Software Inc. and
Derek P. Witte.
|
Form
10-Q
|
7/31/2008
|
|||||
|
10.30*
|
Separation
Agreement by and between Chordiant Software, Inc. and David C. Cunningham
dated February 13, 2009.
|
Form
10-Q
|
5/7/2009
|
|||||
|
10.31*
|
Separation
Agreement by and between Chordiant Software, Inc. and Charles Altomare
dated October 9, 2009.
|
X
|
||||||
|
10.32*
|
Offer
Letter dated January 31, 2006 for Steven R. Springsteel.
|
Form
8-K
|
2/2/2006
|
|||||
|
10.33*
|
Offer
Letter dated February 3, 2008 for Charles Altomare.
|
Form
10-K
|
11/20/2008
|
|||||
|
10.34*
|
Offer
Letter dated July 18, 2008 for David Zuckerman.
|
Form
10-K
|
11/20/2008
|
|||||
|
10.35*
|
Offer
Letter dated July 19, 2004 for Peter Norman.
|
Form
10-K
|
11/20/2008
|
|||||
|
10.36*
|
Offer
Letter dated July 14, 2006 for P.K. Karnik.
|
Form
10-K
|
11/20/2008
|
|||||
|
10.37*
|
Offer
Letter dated March 19, 2008 for Raymond Gerber.
|
X
|
||||||
|
10.38*
|
Offer
Letter dated March 2, 2009 for Marchai Bruchey.
|
Form
10-Q
|
5/7/2009
|
|||||
|
10.39
|
Second
Amended and Restated Loan and Security Agreement by and between Chordiant
Software, Inc. and Comerica Bank-California, successor in interest to
Imperial Bank, dated March 8, 2006.
|
Form
10-Q
|
5/4/2006
|
|||||
|
10.40
|
Modification
to Second Amended and Restated Loan and Security Agreement dated June 30,
2008, by and between Chordiant Software, Inc., and Comerica
Bank-California.
|
Form
10-Q
|
7/31/2008
|
|||||
|
10.41
|
Master
Agreement for Subcontracted Services dated June 14, 2002 by and between
Chordiant Software, Inc. and International Business Machines
Corporation.
|
Form
10-K
|
2/9/2007
|
|||||
|
10.42
|
Amendment
Number One dated May 31, 2005 to the Master Agreement for Subcontracted
Services dated June 14, 2006 by and between Chordiant Software, Inc. and
International Business Machines Corporation.
|
Form
10-K
|
2/9/2007
|
|||||
|
Incorporated
by Reference
|
||||||||
|
Exhibit
Number
|
Description
of Document
|
Form
|
Date
|
Filed
Herewith
|
||||
|
10.43
|
Amendment
Number Two dated October 12, 2006 to the Master Agreement for
Subcontracted Services dated June 14, 2006 by and between Chordiant
Software, Inc. and International Business Machines
Corporation.
|
Form
10-K
|
2/9/2007
|
|||||
|
10.44††
|
Statement
of Work dated September 28, 2006 by and between Chordiant Software, Inc.
and International Business Machines Corporation.
|
Form
10-K
|
2/9/2007
|
|||||
|
10.45
|
Order
Form Agreement dated September 28, 2006 by and between Chordiant Software,
Inc. and International Business Machines Corporation.
|
Form
10-K
|
2/9/2007
|
|||||
|
10.46
|
Amendment
Number Three dated December 21, 2007 to the Master Agreement for
Subcontracted Services dated June 14, 2006 by and between Chordiant
Software, Inc. and International Business Machines
Corporation.
|
Form
10-Q
|
5/7/2009
|
|||||
|
10.47††
|
Software
License and Services Agreement dated September 28, 2006 by and between
Chordiant Software, Inc. and Connecticut General Life Insurance
Company.
|
Form
10-K
|
11/15/2007
|
|||||
|
10.48†
|
Master
Software License and Support Agreement dated March 21, 2006 by and between
Chordiant Software, Inc. and Citicorp Credit Services, Inc.
(USA).
|
Form
10-K
|
2/9/2007
|
|||||
|
10.49
|
Amendment
No. 1 to the Master Software License and Support Agreement dated March 21,
2006 by and between Chordiant Software and Citicorp Credit Services, Inc.
(USA).
|
Form
10-K
|
2/9/2007
|
|||||
|
10.50†
|
License
Schedule #5 dated December 8, 2006 to the Master Software License and
Support Agreement dated March 21, 2006 by and between Chordiant Software
and Citicorp Credit Services, Inc. (USA).
|
Form
10-K
|
11/15/2007
|
|||||
|
10.51
|
Master
Professional Services Agreement dated June 6, 2006 by and between
Chordiant Software, Inc. and Citicorp Credit Services, Inc.
(USA).
|
Form
10-K
|
2/9/2007
|
|||||
|
10.52†
|
Amendment
No. 1 dated June 4, 2007 to the Master Professional Services Agreement
dated June 6, 2006 by and between Chordiant Software, Inc. and Citicorp
Credit Services, Inc. (USA).
|
X
|
||||||
|
10.53†
|
Letter
Agreement dated November 11, 2008 by and between Chordiant Software, Inc.
and Citicorp Credit Services, Inc. (USA).
|
Form
10-Q
|
5/7/2009
|
|||||
|
10.54
|
Order
Form Agreement dated December 19, 2006 by and between Chordiant Software
International GmbH and IBM Deustchland GmbH.
|
Form
10-K
|
2/9/2007
|
|||||
|
10.55
|
Software
License and Services Agreement dated December 19, 2006 by and between
Chordiant Software International GmbH and Deutsche Angestellten
Krankenkasse.
|
Form
10-K
|
2/9/2007
|
|||||
|
10.56††
|
Master
Agreement dated June 28, 2007 by and between WellPoint, Inc. and Chordiant
Software, Inc.
|
Form
10-Q
|
8/10/2007
|
|||||
|
10.57†††
|
Master
Services Agreement By and Between Chordiant Software, Inc. and Ness
Technologies, Inc., Ness Global Services, Inc. and Ness Technologies India
Ltd., dated December 15, 2003, as amended
|
Form
10-K
|
11/15/2007
|
|||||
|
Incorporated
by Reference
|
||||||||
|
Exhibit
Number
|
Description
of Document
|
Form
|
Date
|
Filed
Herewith
|
||||
|
10.58
|
Addendum
A to Master Services Agreement dated September 11, 2006 by and between
Chordiant Software, Inc. and Ness USA, Inc.
|
Form
10-K
|
2/9/2007
|
|||||
|
10.59
|
Addendum
A to the Master Services Agreement dated October 25, 2007 by and between
Chordiant Software, Inc. and Ness USA, Inc.
|
Form
10-K
|
11/15/2007
|
|||||
|
10.60
|
Addendum
A to Master Services Agreement dated August 15, 2008 by and between
Chordiant Software, Inc. and Ness USA, Inc.
|
Form
8-K
|
8/29/2008
|
|||||
|
10.61††
|
Addendum
B to Master Services Agreement dated March 28, 2006 by and among Chordiant
Software, Inc., Ness USA, Inc., Ness Technologies, India Ltd. and Ness
Technologies, Inc.
|
Form
10-K
|
11/20/2008
|
|||||
|
10.62
|
Addendum
A to Master Services Agreement dated September 12, 2005 by and among
Chordiant Software, Inc., Ness Global Services, Inc., Ness Technologies
India Ltd. and Ness Technologies, Inc.
|
Form
10-K
|
11/20/2008
|
|||||
|
10.63†
|
Addendum
C dated January 14, 2009 to the Master Services Agreement by and between
Chordiant Software, Inc. and Ness USA, Inc. dated December 15, 2003, as
amended.
|
Form
10-Q
|
1/29/2009
|
|||||
|
10.64
|
Addendum
D dated March 20, 2009 to the Master Services Agreement by and between
Chordiant Software, Inc. and Ness USA, Inc. dated December 15, 2003, as
amended.
|
Form
10-Q
|
5/7/2009
|
|||||
|
10.65††
|
Global
Framework Agreement dated December 21, 2007 by and between Chordiant
Software, Inc. and Vodafone Group Services Limited.
|
Form
10-Q
|
2/7/2008
|
|||||
|
10.66
|
Memorandum
of Understanding re Compromise and Settlement, dated May 29,
2008.
|
Form
8-K
|
6/3/2008
|
|||||
|
10.67
|
Cupertino
City Center Net Office Lease, dated June 19, 1998, by and between
Cupertino City Center Buildings, as Lessor, and Chordiant Software, Inc.,
as Lessee.
|
Form
S-1
(No.
333-92187)
|
1/19/2000
|
|||||
|
10.68
|
First
amendment to Cupertino City Center Net Office Lease, dated December 10,
2003, by and between Cupertino City Center Buildings, as Lessor, and
Chordiant Software, Inc., as Lessee.
|
10-K
|
3/8/2004
|
|||||
|
10.69
|
Second
Amendment to Cupertino City Center Net Office Lease dated March 10, 2006,
by and between Cupertino City Center Buildings, as Lessor, and Chordiant
Software, Inc., as Lessee
|
Form
10-K
|
11/20/2008
|
|||||
|
10.70
|
Third
Amendment to Cupertino City Center Net Office Lease dated July 11, 2008,
by and between Cupertino City Center Buildings, as Lessor, and Chordiant
Software, Inc., as Lessee.
|
Form
10-Q
|
7/31/2008
|
|||||
|
21.1
|
Subsidiaries
of Chordiant Software, Inc.
|
Form
10-Q
|
5/7/2009
|
|||||
|
23.1
|
Consent
of BDO Seidman, LLP, Independent Registered Public Accounting
Firm.
|
X
|
||||||
|
24.1
|
Power
of Attorney (included on the signature pages hereto).
|
X
|
||||||
|
31.1
|
Certification
required by Rule 13a-14(a) or Rule 15d-14(a).
|
X
|
||||||
|
Incorporated
by Reference
|
||||||||
|
Exhibit
Number
|
Description
of Document
|
Form
|
Date
|
Filed
Herewith
|
||||
|
31.2
|
Certification
required by Rule 13a-14(a) or Rule 15d-14(a).
|
X
|
||||||
|
32.1#
|
Certification
required by Rule 13a-14(b) or Rule 15d-14(b) and Section 1350 of Chapter
63 of Title 18 of the United States Code (18 U.S.C. 1350).
|
|||||||
|
†
|
Confidential
treatment has been requested with respect to certain portions of this
exhibit. Omitted portions have been filed separately with the SEC pursuant
to Rule 24b-2 of the Securities Exchange Act of
1934.
|
|
††
|
Confidential
treatment granted. Omitted portions have been filed separately with the
SEC pursuant to Rule 24b-2 of the Securities Exchange Act of
1934.
|
|
†††
|
Confidential
treatment extension requested. Omitted portions have been filed separately
with the SEC pursuant to Rule 24b-2 of the Securities Exchange Act of
1934.
|
|
#
|
The
certification attached as Exhibit 32.1 is not deemed filed with the
Securities and Exchange Commission and is not incorporated by reference
into any filing of Chordiant Software, Inc., whether made before or after
the date of this Form 10-K irrespective of any general incorporation
language contained in such filing.
|
|
*
|
Management
contract or compensatory plan or
arrangement.
|
Pursuant
to the requirements of Section 13 or 15(d) of the Securities Exchange Act of
1934, as amended, the Registrant has duly caused this report on Form 10-K to be
signed on our behalf by the undersigned, thereunto duly authorized, in the City
of Cupertino, State of California, on November 19, 2009.
|
CHORDIANT
SOFTWARE, INC.
|
|||
|
By:
|
/s/ STEVEN
R. SPRINGSTEEL
|
||
|
Steven
R. Springsteel
Chairman,
President, and CEO
|
|||
KNOW ALL PERSONS BY THESE
PRESENTS, that each person whose signature appears below constitutes and
appoints STEVEN R. SPRINGSTEEL
and PETER S.
NORMAN, and each or any one of them, his true and lawful attorney-in-fact
and agent, with full power of substitution and resubstitution, for him and in
his name, place and stead, in any and all capacities, to sign any and all
amendments (including post-effective amendments) to this report on Form 10-K,
and to file the same, with all exhibits thereto, and other documents in
connection therewith, with the Securities and Exchange Commission, granting unto
said attorneys-in-fact and agents, and each of them, full power and authority to
do and perform each and every act and thing requisite and necessary to be done
in connection therewith, as fully to all intents and purposes as he might or
could do in person, hereby ratifying and confirming all that said
attorneys-in-fact and agents, or any of them, or their or his substitutes or
substitute, may lawfully do or cause to be done by virtue hereof.
Pursuant
to the requirements of the Securities Exchange Act of 1934, as amended, this
report on Form 10-K has been signed by the following persons on behalf of
the Registrant and of the capacities and on the dates indicated.
|
Signature
|
Title
|
Date
|
||
|
/s/
STEVEN R. SPRINGSTEEL
|
Chairman,
President, and Chief Executive Officer
|
November
19, 2009
|
||
|
Steven
R. Springsteel
|
||||
|
/s/
PETER S. NORMAN
|
Chief
Financial Officer and Principal Accounting
|
November
19, 2009
|
||
|
Peter
S. Norman
|
Officer
|
|||
|
/s/
RICHARD G. STEVENS
|
Director
|
November
19, 2009
|
||
|
Richard
G. Stevens
|
||||
|
/s/
DAVID R. SPRINGETT
|
Director
|
November
19, 2009
|
||
|
David
R. Springett
|
||||
|
/s/
WILLIAM J. RADUCHEL
|
Director
|
November
19, 2009
|
||
|
William
J. Raduchel
|
||||
|
/s/
ALLEN A.A. SWANN
|
Director
|
November
19, 2009
|
||
|
Allen
A. A. Swann
|
||||
|
/s/
CHARLES E. HOFFMAN
|
Director
|
November
19, 2009
|
||
|
Charles
E. Hoffman
|
||||
|
/s/
DANIEL A. GAUDREAU
|
Director
|
November
19, 2009
|
||
|
Daniel
A. Gaudreau
|
EXHIBIT
INDEX
|
Incorporated
by Reference
|
||||||||
|
Exhibit
Number
|
Description
of Document
|
Form
|
Date
|
Filed
Herewith
|
||||
|
3.1
|
Amended
and Restated Certificate of Incorporation of Chordiant Software,
Inc.
|
Form
10-K
|
11/20/2008
|
|||||
|
3.2
|
Certificate
of Designation of Series A. Junior Participating Preferred
Stock.
|
Form
8-K
|
7/11/2008
|
|||||
|
3.3
|
Amended
and Restated Bylaws of Chordiant Software, Inc.
|
Form 8-K
|
6/3/2008
|
|||||
|
4.1
|
Specimen
Common Stock Certificate.
|
Form
S-11
(No.
333-92187)
|
2/7/2000
|
|||||
|
4.2
|
Rights
Agreement dated as of July 10, 2008 by and between Chordiant Software,
Inc. and American Stock Transfer & Trust Company, LLC
|
Form
8-K
|
7/11/2008
|
|||||
|
4.3
|
Form
of Rights Certificate
|
Form
8-K
|
7/11/2008
|
|||||
|
10.1*
|
1999
Equity Incentive Plan and Form of Stock Option Agreement.
|
Form
S-1
(No.
333-92187)
|
12/6/1999
|
|||||
|
10.2*
|
1999
Employee Stock Purchase Plan.
|
Form
S-1
(No.
333-92187)
|
12/6/1999
|
|||||
|
10.3*
|
Amended
and Restated 1999 Non-Employee Directors' Stock Option
Plan
|
Form
10-Q
|
1/29/2009
|
|||||
|
10.4*
|
Form
of Stock Option Agreement for 1999 Non-Employee Directors' Stock Option
Plan.
|
Form
S-1
(No.
333-92187)
|
1/19/2000
|
|||||
|
10.5*
|
Form
of Chordiant Software, Inc. Amended and Restated 1999 Non-Employee
Directors’ Stock Option Plan Restricted Stock Award Grant Notice and
Chordiant Software, Inc. Amended and Restated 1999 Non-Employee Directors’
Stock Option Plan Restricted Stock Award Agreement.
|
Form
10-Q
|
1/29/2009
|
|||||
|
10.6*
|
Form
of Chordiant Software, Inc. Amended and Restated 1999 Non-Employee
Directors’ Stock Option Plan Restricted Stock Award Grant Notice for
Non-U.S. Directors and Chordiant Software, Inc. Amended and Restated 1999
Non-Employee Directors’ Stock Option Plan Restricted Stock Award Agreement
for Non-U.S. Directors.
|
Form
10-Q
|
1/29/2009
|
|||||
|
10.7*
|
2000
Nonstatutory Equity Incentive Plan.
|
S-8
(No.
333-42844)
|
8/2/2000
|
|||||
|
10.8*
|
2005
Equity Incentive Plan, as amended.
|
Schedule
14A
|
12/17/2008
|
|||||
|
10.9*
|
Form
of Chordiant Software, Inc. 2005 Equity Incentive Plan Stock Option Grant
Notice and Chordiant Software, Inc. 2005 Equity Incentive Plan Stock
Option Agreement.
|
Form
10-Q
|
1/29/2009
|
|||||
|
10.10*
|
Form
of Chordiant Software, Inc. 2005 Equity Incentive Plan Restricted Stock
Unit Grant Notice and Chordiant Software, Inc. 2005 Equity Incentive Plan
Restricted Stock Unit Agreement.
|
Form
10-Q
|
5/7/2009
|
|||||
|
10.11*
|
Form
of Chordiant Software, Inc. 2005 Equity Incentive Plan Stock Option Grant
Notice for Non-U.S. Employees and Chordiant Software, Inc. 2005 Equity
Incentive Plan Stock Option Agreement for Non-U.S.
Employees.
|
Form
10-Q
|
1/29/2009
|
|||||
|
Incorporated
by Reference
|
||||||||
|
Exhibit
Number
|
Description
of Document
|
Form
|
Date
|
Filed
Herewith
|
||||
|
10.12*
|
Form
of Chordiant Software, Inc. 2005 Equity Incentive Plan Restricted Stock
Unit Grant Notice for Non-U.S. Employees and Chordiant Software, Inc. 2005
Equity Incentive Plan Restricted Stock Unit Agreement for Non-U.S.
Employees.
|
Form
10-Q
|
5/7/2009
|
|||||
|
10.13*
|
Form
of 2008-2009 Performance Share Unit Program Award Grant
Notice
|
Form
10-K
|
11/15/2007
|
|||||
|
10.14*
|
Form
of Stock Option Agreement for Steven R. Springsteel.
|
Form
8-K
|
2/2/2006
|
|||||
|
10.15*††
|
2008-2009
Performance Share Unit Program.
|
Form
10-K
|
11/15/2007
|
|||||
|
10.16*
|
A
description of certain compensation arrangements between Chordiant
Software, Inc. and its executive officers.
|
Form
8-K/A
|
11/25/2008
|
|||||
|
10.17*††
|
Chordiant
Software, Inc. Fiscal Year 2009 Executive Incentive Bonus
Plan
|
Form
10-Q
|
5/7/2009
|
|||||
|
10.18*
|
Form
of Director Agreement by and between Chordiant Software, Inc. and certain
officers and directors of Chordiant Software, Inc.
|
Form
10-K/T
|
3/29/2005
|
|||||
|
10.19*
|
Form
of Indemnity Agreement by and between Chordiant Software, Inc. and certain
officers and directors of Chordiant Software, Inc.
|
Form
10-Q
|
1/29/2009
|
|||||
|
10.20*
|
Board
Member Agreement dated March 7, 2006 for Richard Stevens.
|
Form
8-K
|
3/10/2006
|
|||||
|
10.21*††
|
Chordiant
Software, Inc. 2009 Vice President Worldwide Sales Incentive Bonus
Plan.
|
Form
10-Q
|
5/7/2009
|
|||||
|
10.22*††
|
Chordiant
Software, Inc. 2009 Vice President Worldwide Professional Services
Incentive Bonus Plan.
|
Form
10-Q
|
5/7/2009
|
|||||
|
10.23*††
|
Chordiant
Software, Inc. 2009 General Counsel Incentive Bonus Plan.
|
Form
10-Q
|
5/7/2009
|
|||||
|
10.24*
|
Amended
and Restated Change of Control Agreement dated November 24, 2008 by and
between Chordiant Software, Inc. and Steven R.
Springsteel.
|
Form
8-K
|
11/25/2008
|
|||||
|
10.25*
|
Amended
and Restated Change of Control Agreement dated November 25, 2008 by and
between Chordiant Software, Inc. and Peter S. Norman.
|
Form
8-K
|
11/25/2008
|
|||||
|
10.26*
|
Amended
Form of Change of Control Agreement by and between Chordiant Software,
Inc. and certain of its executive officers
|
Form
8-K
|
11/25/2008
|
|||||
|
10.27*
|
Change
of Control Agreement dated April 8, 2009 by and between Chordiant
Software, Inc. and Marchai Bruchey.
|
Form
10-Q
|
7/30/2009
|
|||||
|
10.28*
|
Change
of Control Agreement dated May 22, 2006 by and between Chordiant Software,
Inc. and Frank Florence.
|
Form
10-Q
|
4/30/2007
|
|||||
|
10.29*
|
Separation
Agreement dated May 1, 2008 by and between Chordiant Software Inc. and
Derek P. Witte.
|
Form
10-Q
|
7/31/2008
|
|||||
|
10.30*
|
Separation
Agreement by and between Chordiant Software, Inc. and David C. Cunningham
dated February 13, 2009.
|
Form
10-Q
|
5/7/2009
|
|||||
|
10.31*
|
Separation
Agreement by and between Chordiant Software, Inc. and Charles Altomare
dated October 9, 2009.
|
X
|
||||||
|
10.32*
|
Offer
Letter dated January 31, 2006 for Steven R. Springsteel.
|
Form
8-K
|
2/2/2006
|
|||||
|
10.33*
|
Offer
Letter dated February 3, 2008 for Charles Altomare.
|
Form
10-K
|
11/20/2008
|
|||||
|
Incorporated
by Reference
|
||||||||
|
Exhibit
Number
|
Description
of Document
|
Form
|
Date
|
Filed
Herewith
|
||||
|
10.34*
|
Offer
Letter dated July 18, 2008 for David Zuckerman.
|
Form
10-K
|
11/20/2008
|
|||||
|
10.35*
|
Offer
Letter dated July 19, 2004 for Peter Norman.
|
Form
10-K
|
11/20/2008
|
|||||
|
10.36*
|
Offer
Letter dated July 14, 2006 for P.K. Karnik.
|
Form
10-K
|
11/20/2008
|
|||||
|
10.37*
|
Offer
Letter dated March 19, 2008 for Raymond Gerber.
|
X
|
||||||
|
10.38*
|
Offer
Letter dated March 2, 2009 for Marchai Bruchey.
|
Form
10-Q
|
5/7/2009
|
|||||
|
10.39
|
Second
Amended and Restated Loan and Security Agreement by and between Chordiant
Software, Inc. and Comerica Bank-California, successor in interest to
Imperial Bank, dated March 8, 2006.
|
Form
10-Q
|
5/4/2006
|
|||||
|
10.40
|
Modification
to Second Amended and Restated Loan and Security Agreement dated June 30,
2008, by and between Chordiant Software, Inc., and Comerica
Bank-California.
|
Form
10-Q
|
7/31/2008
|
|||||
|
10.41
|
Master
Agreement for Subcontracted Services dated June 14, 2002 by and between
Chordiant Software, Inc. and International Business Machines
Corporation.
|
Form
10-K
|
2/9/2007
|
|||||
|
10.42
|
Amendment
Number One dated May 31, 2005 to the Master Agreement for Subcontracted
Services dated June 14, 2006 by and between Chordiant Software, Inc. and
International Business Machines Corporation.
|
Form
10-K
|
2/9/2007
|
|||||
|
10.43
|
Amendment
Number Two dated October 12, 2006 to the Master Agreement for
Subcontracted Services dated June 14, 2006 by and between Chordiant
Software, Inc. and International Business Machines
Corporation.
|
Form
10-K
|
2/9/2007
|
|||||
|
10.44††
|
Statement
of Work dated September 28, 2006 by and between Chordiant Software, Inc.
and International Business Machines Corporation.
|
Form
10-K
|
2/9/2007
|
|||||
|
10.45
|
Order
Form Agreement dated September 28, 2006 by and between Chordiant Software,
Inc. and International Business Machines Corporation.
|
Form
10-K
|
2/9/2007
|
|||||
|
10.46
|
Amendment
Number Three dated December 21, 2007 to the Master Agreement for
Subcontracted Services dated June 14, 2006 by and between Chordiant
Software, Inc. and International Business Machines
Corporation.
|
Form
10-Q
|
5/7/2009
|
|||||
|
10.47††
|
Software
License and Services Agreement dated September 28, 2006 by and between
Chordiant Software, Inc. and Connecticut General Life Insurance
Company.
|
Form
10-K
|
11/15/2007
|
|||||
|
10.48†
|
Master
Software License and Support Agreement dated March 21, 2006 by and between
Chordiant Software, Inc. and Citicorp Credit Services, Inc.
(USA).
|
Form
10-K
|
2/9/2007
|
|||||
|
10.49
|
Amendment
No. 1 to the Master Software License and Support Agreement dated March 21,
2006 by and between Chordiant Software and Citicorp Credit Services, Inc.
(USA).
|
Form
10-K
|
2/9/2007
|
|||||
|
10.50†
|
License
Schedule #5 dated December 8, 2006 to the Master Software License and
Support Agreement dated March 21, 2006 by and between Chordiant Software
and Citicorp Credit Services, Inc. (USA).
|
Form
10-K
|
11/15/2007
|
|||||
|
10.51
|
Master
Professional Services Agreement dated June 6, 2006 by and between
Chordiant Software, Inc. and Citicorp Credit Services, Inc.
(USA).
|
Form
10-K
|
2/9/2007
|
|||||
|
Incorporated
by Reference
|
||||||||
|
Exhibit
Number
|
Description
of Document
|
Form
|
Date
|
Filed
Herewith
|
||||
|
10.52†
|
Amendment
No. 1 dated June 4, 2007 to the Master Professional Services Agreement
dated June 6, 2006 by and between Chordiant Software, Inc. and Citicorp
Credit Services, Inc. (USA).
|
X
|
||||||
|
10.53†
|
Letter
Agreement dated November 11, 2008 by and between Chordiant Software, Inc.
and Citicorp Credit Services, Inc. (USA).
|
Form
10-Q
|
5/7/2009
|
|||||
|
10.54
|
Order
Form Agreement dated December 19, 2006 by and between Chordiant Software
International GmbH and IBM Deustchland GmbH.
|
Form
10-K
|
2/9/2007
|
|||||
|
10.55
|
Software
License and Services Agreement dated December 19, 2006 by and between
Chordiant Software International GmbH and Deutsche Angestellten
Krankenkasse.
|
Form
10-K
|
2/9/2007
|
|||||
|
10.56††
|
Master
Agreement dated June 28, 2007 by and between WellPoint, Inc. and Chordiant
Software, Inc.
|
Form
10-Q
|
8/10/2007
|
|||||
|
10.57†††
|
Master
Services Agreement By and Between Chordiant Software, Inc. and Ness
Technologies, Inc., Ness Global Services, Inc. and Ness Technologies India
Ltd., dated December 15, 2003, as amended
|
Form
10-K
|
11/15/2007
|
|||||
|
10.58
|
Addendum
A to Master Services Agreement dated September 11, 2006 by and between
Chordiant Software, Inc. and Ness USA, Inc.
|
Form
10-K
|
2/9/2007
|
|||||
|
10.59
|
Addendum
A to the Master Services Agreement dated October 25, 2007 by and between
Chordiant Software, Inc. and Ness USA, Inc.
|
Form
10-K
|
11/15/2007
|
|||||
|
10.60
|
Addendum
A to Master Services Agreement dated August 15, 2008 by and between
Chordiant Software, Inc. and Ness USA, Inc.
|
Form
8-K
|
8/29/2008
|
|||||
|
10.61††
|
Addendum
B to Master Services Agreement dated March 28, 2006 by and among Chordiant
Software, Inc., Ness USA, Inc., Ness Technologies, India Ltd. and Ness
Technologies, Inc.
|
Form
10-K
|
11/20/2008
|
|||||
|
10.62
|
Addendum
A to Master Services Agreement dated September 12, 2005 by and among
Chordiant Software, Inc., Ness Global Services, Inc., Ness Technologies
India Ltd. and Ness Technologies, Inc.
|
Form
10-K
|
11/20/2008
|
|||||
|
10.63†
|
Addendum
C dated January 14, 2009 to the Master Services Agreement by and between
Chordiant Software, Inc. and Ness USA, Inc. dated December 15, 2003, as
amended.
|
Form
10-Q
|
1/29/2009
|
|||||
|
10.64
|
Addendum
D dated March 20, 2009 to the Master Services Agreement by and between
Chordiant Software, Inc. and Ness USA, Inc. dated December 15, 2003, as
amended.
|
Form
10-Q
|
5/7/2009
|
|||||
|
10.65††
|
Global
Framework Agreement dated December 21, 2007 by and between Chordiant
Software, Inc. and Vodafone Group Services Limited.
|
Form
10-Q
|
2/7/2008
|
|||||
|
10.66
|
Memorandum
of Understanding re Compromise and Settlement, dated May 29,
2008.
|
Form
8-K
|
6/3/2008
|
|||||
|
10.67
|
Cupertino
City Center Net Office Lease, dated June 19, 1998, by and between
Cupertino City Center Buildings, as Lessor, and Chordiant Software, Inc.,
as Lessee.
|
Form
S-1
(No.
333-92187)
|
1/19/2000
|
|||||
|
Incorporated
by Reference
|
||||||||
|
Exhibit
Number
|
Description
of Document
|
Form
|
Date
|
Filed
Herewith
|
||||
|
10.68
|
First
amendment to Cupertino City Center Net Office Lease, dated December 10,
2003, by and between Cupertino City Center Buildings, as Lessor, and
Chordiant Software, Inc., as Lessee.
|
10-K
|
3/8/2004
|
|||||
|
10.69
|
Second
Amendment to Cupertino City Center Net Office Lease dated March 10, 2006,
by and between Cupertino City Center Buildings, as Lessor, and Chordiant
Software, Inc., as Lessee
|
Form
10-K
|
11/20/2008
|
|||||
|
10.70
|
Third
Amendment to Cupertino City Center Net Office Lease dated July 11, 2008,
by and between Cupertino City Center Buildings, as Lessor, and Chordiant
Software, Inc., as Lessee.
|
Form
10-Q
|
7/31/2008
|
|||||
|
21.1
|
Subsidiaries
of Chordiant Software, Inc.
|
Form
10-Q
|
5/7/2009
|
|||||
|
23.1
|
Consent
of BDO Seidman, LLP, Independent Registered Public Accounting
Firm.
|
X
|
||||||
|
24.1
|
Power
of Attorney (included on the signature pages hereto).
|
X
|
||||||
|
31.1
|
Certification
required by Rule 13a-14(a) or Rule 15d-14(a).
|
X
|
||||||
|
31.2
|
Certification
required by Rule 13a-14(a) or Rule 15d-14(a).
|
X
|
||||||
|
32.1#
|
Certification
required by Rule 13a-14(b) or Rule 15d-14(b) and Section 1350 of Chapter
63 of Title 18 of the United States Code (18 U.S.C. 1350).
|
|||||||
|
†
|
Confidential
treatment has been requested with respect to certain portions of this
exhibit. Omitted portions have been filed separately with the SEC pursuant
to Rule 24b-2 of the Securities Exchange Act of
1934.
|
|
††
|
Confidential
treatment granted. Omitted portions have been filed separately with the
SEC pursuant to Rule 24b-2 of the Securities Exchange Act of
1934.
|
|
†††
|
Confidential
treatment extension requested. Omitted portions have been filed separately
with the SEC pursuant to Rule 24b-2 of the Securities Exchange Act of
1934.
|
|
#
|
The
certification attached as Exhibit 32.1 is not deemed filed with the
Securities and Exchange Commission and is not incorporated by reference
into any filing of Chordiant Software, Inc., whether made before or after
the date of this Form 10-K irrespective of any general incorporation
language contained in such filing.
|
|
*
|
Management
contract or compensatory plan or
arrangement.
|
107