Attached files
UNITED STATES
SECURITIES AND EXCHANGE COMMISSION
Washington, D.C. 20549
FORM 10-K
ANNUAL REPORT PURSUANT TO
SECTION 13 OR 15(d) OF THE SECURITIES EXCHANGE ACT OF 1934
For the Fiscal Year
Ended September 27, 2009
Commission file number 1-15983
_______________
ARVINMERITOR,
INC.
(Exact name of registrant as
specified in its charter)
| Indiana | 38-3354643 | |||
| (State or other jurisdiction of incorporation or | (I.R.S. Employer | |||
| organization) | Identification No.) | |||
| 2135 West Maple Road | ||||
| Troy, Michigan | 48084-7186 | |||
| (Address of principal executive offices) | (Zip Code) | |||
Registrant’s telephone number, including area code: (248) 435-1000
| SECURITIES REGISTERED PURSUANT TO SECTION 12(b) OF THE ACT: | ||||
| Title of each class | Name of each exchange on which registered | |||
| Common Stock, $1 Par Value (including the | New York Stock Exchange | |||
| associated Preferred Share Purchase Rights) | ||||
Yes [ ] No [ X ]
Indicate by check mark if the
registrant is not required to file reports pursuant to Section 13 or Section
15(d) of the Act.
Yes
[
] No [ X
]
Indicate by check mark whether the registrant (1) has filed all reports
required to be filed by Section 13 or 15(d) of the Securities Exchange Act of
1934 during the preceding 12 months (or for such shorter period that the
registrant was required to file such reports), and (2) has been subject to such
filing requirements for the past 90 days.
Yes [ X
] No [ ]
Indicate by check mark whether the registrant has submitted
electronically and posted on its corporate web site, if any, every Interactive
Data File required to be submitted and posted pursuant to Rule 405 of
Registration S-T during the preceding twelve months (or for such shorter period
that the registrant was required to submit and post such files).
Yes [
] No [
]
Indicate by check mark if disclosure of delinquent filers pursuant to Item 405 of Regulation S-K is not contained herein, and will not be contained, to the best of registrant’s knowledge, in definitive proxy or information statements incorporated by reference in Part III of this Form 10-K or any amendment to this Form 10-K. [ X ]
Indicate by check mark whether the registrant is a large accelerated filer, an accelerated filer, or a non-accelerated filer. See definition of “accelerated filer and large accelerated filer” in Rule 12b-2 of the Exchange Act.
| Large accelerated filer | o | Accelerated filer | x |
| Non-accelerated filer | o (Do not check if a smaller reporting company) | Smaller reporting company | o |
Indicate by check mark whether the registrant is a shell company (as
defined in Rule 12b-2 of the Exchange Act).
Yes [ ] No [ X ]
The aggregate market value of the registrant’s voting and non-voting common equity held by non-affiliates of the registrant on March 27, 2009 (the last business day of the most recently completed second fiscal quarter) was approximately $83,586,199 million.
74,269,521 shares of the registrant’s Common Stock, par value $1 per share, were outstanding on November 2, 2009.
| Page | ||||||
| No. | ||||||
| PART I. | ||||||
| Item 1. | Business Information | 1 | ||||
| Item 1A. | Risk Factors | 14 | ||||
| Item 1B. | Unresolved Staff Comments | 23 | ||||
| Item 2. | Properties | 23 | ||||
| Item 3. | Legal Proceedings | 23 | ||||
| Item 4. | Submission of Matter to a Vote of Security Holders | 24 | ||||
| Item 4A. | Executive Officers of the Registrant | 24 | ||||
| PART II. | ||||||
| Item 5. | Market for Registrant’s Common Equity, Related Stockholder Matters and Issuer | |||||
| Purchases of Equity Securities | 25 | |||||
| Item 6. | Selected Financial Data | 27 | ||||
| Item 7. | Management’s Discussion and Analysis of Financial Conditions and Results of Operations | 28 | ||||
| Item 7A. | Quantitative and Qualitative Disclosures About Market Risk | 56 | ||||
| Item 8. | Financial Statements and Supplementary Data | 58 | ||||
| Item 9. | Changes in and Disagreements with Accountants on Accounting and Financial Disclosure | 111 | ||||
| Item 9A. | Controls and Procedures | 111 | ||||
| Item 9B. | Other Information | 113 | ||||
| PART III. | ||||||
| Item 10. | Directors, Executive Officers and Corporate Governance | 113 | ||||
| Item 11. | Executive Compensation | 117 | ||||
| Item 12. | Security Ownership of Certain Beneficial Owners and Management and Related | |||||
| Stockholder Matters | 147 | |||||
| Item 13. | Certain Relationships and Related Transactions, and Director Independence | 149 | ||||
| Item 14. | Principal Accountant Fees and Services | 153 | ||||
| PART IV. | ||||||
| Item 15. | Exhibits and Financial Statement Schedules | 153 | ||||
| Signatures | 159 |
PART I
Item 1. Business.
Overview
ArvinMeritor, Inc. (the "company" or "ArvinMeritor"), headquartered in Troy, Michigan, is a premier global supplier of a broad range of integrated systems, modules and components to original equipment manufacturers (“OEMs”) and the aftermarket for the commercial vehicle, transportation and industrial sectors. The company serves commercial truck, trailer, off-highway, military, bus and coach and other industrial OEMs and certain aftermarkets, and light vehicle OEMs. Our principal products are axles, undercarriages, drivelines, brakes and braking systems, and roofs and door systems.
ArvinMeritor was incorporated in Indiana in 2000 in connection with the merger of Meritor Automotive, Inc. ("Meritor") and Arvin Industries, Inc. ("Arvin"). As used in this Annual Report on Form 10-K, the terms "company," "ArvinMeritor," "we," "us" and "our" include ArvinMeritor, its consolidated subsidiaries and its predecessors unless the context indicates otherwise.
ArvinMeritor serves a broad range of customers worldwide, including medium- and heavy-duty truck OEMs, specialty vehicle manufacturers, certain aftermarkets, trailer producers and light vehicle OEMs. Our total sales from continuing operations in fiscal year 2009 were $4.1 billion. Our ten largest customers accounted for approximately 59 percent of fiscal year 2009 sales from continuing operations. Sales from operations outside the United States (U.S.) accounted for approximately 61 percent of total sales from continuing operations in fiscal year 2009. Our continuing operations also participated in 9 unconsolidated joint ventures, which we accounted for under the equity method of accounting and that generated revenues of approximately $929 million in fiscal year 2009.
The company’s fiscal year ends on the Sunday nearest to September 30. Fiscal year 2009 ended on September 27, 2009, fiscal year 2008 ended on September 28, 2008 and fiscal year 2007 ended on September 30, 2007. All year and quarter references relate to our fiscal year and fiscal quarters unless otherwise stated. For ease of presentation, September 30 is utilized consistently throughout this report to represent the fiscal year end.
Whenever an item in this Annual Report on Form 10-K refers to information under specific captions in Item 7. Management’s Discussion and Analysis of Financial Condition and Results of Operations or Item 8. Financial Statements and Supplementary Data, the information is incorporated in that item by reference.
References in this Annual Report on Form 10-K to our belief that we are a leading supplier or the world's leading supplier, and other similar statements as to our relative market position are based principally on calculations we have made. These calculations are based on information we have collected, including company and industry sales data obtained from internal and available external sources as well as our estimates. In addition to such quantitative data, our statements are based on other competitive factors such as our technological capabilities, our engineering, research and development efforts, and our innovative solutions as well as the quality of our products and services, in each case relative to that of our competitors in the markets we address.
Corporate Transformation Activity
After significant strategic review, we announced in 2008 our intention to separate our Light Vehicle Systems (“LVS”) and Commercial Vehicle Systems (“CVS”) businesses. We believe our decision to move away from LVS was a good one. LVS is subject to high competition, oversupply, intensely competitive end markets and financially troubled customers. With limited resources and cash to invest we decided to concentrate on our commercial vehicle and industrial business, which should allow keener focus on more attractive, targeted investments with potentially higher margins. In 2009, we made substantial progress in the transformation of our company through the sale of many of our LVS businesses, with only the Body Systems business and a relatively minor portion of our Chassis business remaining in our light vehicle segment.
We are continuing to strategically evaluate all options with respect to divesting our Body Systems business, including a sale of the entire business, multiple sales of portions of the business, shut downs of portions of the business or a combination of partial sales and shut downs. We expect that the divestiture process will extend until the end of 2010 or beyond. There are significant risks and uncertainties (as well as potentially substantial costs) inherent in any options we may pursue. See Item 1A. Risk Factors for information on risks associated with the planned divestiture.
1
Our fiscal year 2009 divestiture activity included the following:
- Wheels. On September 21, 2009, we completed the sale of our Wheels business –
formerly a division of LVS – to Iochpe-Maxion S.A., a Brazilian producer of
wheels and frames for commercial vehicles, railway freight cars and
castings. The gross purchase price was
approximately $180 million. Net proceeds after certain taxes and adjustments
for working capital and net debt were $166 million (net of cash on hand of $3
million), which were used to reduce outstanding balances on our revolving
credit facility.
- Chassis. In 2009, we completed, or entered into letters of intent to complete,
the sale of substantially all of our Chassis businesses, formerly a part of
LVS. The status of our Chassis businesses is as follows.
- Gabriel de Venezuela. On June 5, 2009, we sold our 51 percent interest in
Gabriel de Venezuela to our joint venture partner. Gabriel de Venezuela, a
consolidated subsidiary prior to the divestiture, supplies shock absorbers,
struts, exhaust systems and suspension modules to light vehicle customers,
primarily in Venezuela and Colombia.
- Gabriel Ride Control Products North
America. During fiscal year 2009, we
completed the sale of our Gabriel Ride Control Products North America
(Gabriel Ride Control) business to Ride Control, LLC, a wholly owned
subsidiary of OpenGate Capital, a private equity firm. Gabriel Ride Control
supplies motion control products, shock absorbers, struts, ministruts and
corner modules, as well as other automotive parts to the passenger car,
light truck and sport utility vehicle and related aftermarket
industries.
- Meritor Suspension Systems Company. On June 24, 2009, the company entered into a binding letter of intent to sell its 57 percent interest in Meritor Suspension Systems Company (“MSSC”), a joint venture that manufactures and sells automotive coil springs, torsion bars and stabilizer bars in North America, to our joint venture partner, a subsidiary of Mitsubishi Steel Mfg. Co., LTD. We completed the transaction on October 30, 2009 for a purchase price of $13 million, which included a cash dividend of $12 million received by the company in the third quarter of fiscal year 2009.
- Gabriel de Venezuela. On June 5, 2009, we sold our 51 percent interest in
Gabriel de Venezuela to our joint venture partner. Gabriel de Venezuela, a
consolidated subsidiary prior to the divestiture, supplies shock absorbers,
struts, exhaust systems and suspension modules to light vehicle customers,
primarily in Venezuela and Colombia.
Remaining Chassis Businesses. Our remaining Chassis businesses are primarily composed of module assembly operations in the United States and certain European operations. Module assembly operations in the United States are expected to continue through the term of existing supply contracts ending in March 2010 and December 2011 at which time operations are expected to cease or be transitioned to other suppliers. Our remaining European Chassis operations include a facility in Bonneval, France that makes ride control parts (shock absorbers) for aftermarket sales in Europe and one in Leicester, England that makes and distributes gas springs for sale to automotive customers and industrial applications. Sales from our remaining Chassis businesses were $106 million in fiscal year 2009.
See Note 3 of the Notes to Consolidated Financial Statements under Item 8. Financial Statements and Supplementary Data below for further information with respect to changes in continuing and discontinued operations.
Our Business
As a result of the divestitures described above, LVS now consists primarily of the Body Systems business. In order to better reflect the importance of our remaining core CVS businesses and a much smaller LVS business and to reflect the manner in which management reviews information regarding our business, we have revised our reporting segments as follows:
- The Commercial Truck segment
supplies drivetrain systems and components, including axles, drivelines and
braking and suspension systems, primarily for medium- and heavy-duty trucks in
North America, South America and Europe.
- The Industrial segment supplies
drivetrain systems including axles, brakes, drivelines and suspensions for
off-highway, military, construction, bus and coach, fire and emergency, and
other industrial applications. This segment also includes all of our
businesses in Asia-Pacific, including all on- and off-highway
activities.
- The Aftermarket & Trailer segment supplies axles, brakes, drivelines, suspension parts and other
replacement and remanufactured parts, including transmissions, to commercial
vehicle aftermarket customers. This segment also supplies a wide variety of
undercarriage products and systems for trailer applications.
- The LVS segment includes our Body Systems business, which supplies roof and door systems for passenger cars to OEMs, and our remaining Chassis businesses.
We refer to our three segments other than LVS as, collectively, our “Core Business”.
2
The financial statements and financial information included in this 10-K have been restated to reflect our change in reporting segments as well as to reflect the divestiture activity discussed above. See Note 24 of the Notes to Consolidated Financial Statements under Item 8. Financial Statements and Supplementary Data for financial information by segment for continuing operations for each of the three years ended September 30, 2009, including information on sales and assets by geographic area. The heading "Products" below includes information on certain product sales for each of the three fiscal years ended September 30, 2009.
Business Strategies
We are currently a global supplier of a broad range of integrated systems, modules and components to OEMs and the aftermarket for the commercial vehicle, transportation and industrial sectors, and we believe we have developed market positions as a leader in many of the markets we serve. The recent unprecedented challenges in the credit markets, deterioration in the commercial vehicle and automotive markets and a worldwide recession have forced us to sharpen our business and operating strategies to align to these new business conditions and to better position our company for the future. We are working to enhance our leadership positions in our Core Business, capitalize on our existing customer, product and geographic strengths, and increase sales, earnings and shareowner returns by growing the businesses that offer more attractive returns.
There are several significant factors and trends occurring in the commercial vehicle, transportation and industrial sectors that present both opportunities and challenges to industry suppliers, and which have a significant influence on our business strategies. These factors and trends include:
- severely
weakened financial condition of OEMs and suppliers and sharply reduced
volumes;
- emissions,
safety and related regulations affecting the trucking and transportation
industries;
- the
cyclicality of these industries, including the effects of new emissions and
other regulations for commercial vehicles on vehicle sales and
production;
- consolidation and globalization of OEMs and their
suppliers;
- evaluation
by OEMs of their outsourcing strategies given capacity and other market
conditions;
- pricing
pressures from OEMs that could negatively impact suppliers' earnings even when
sales volumes begin to increase;
- fluctuations in the cost of raw materials, primarily
steel and oil;
- rapid
market growth in developing countries;
- increased
demand for modules and systems (as opposed to components) by OEMs;
and
- an increasing emphasis on engineering and technology focused on improving vehicle fuel efficiency and safety.
Our specific business strategies are influenced by these industry factors and trends as well as by the recent global economic and financial crisis and are focused on leveraging our resources to continue to develop and produce competitive product offerings. We believe the following Core Business strategies will allow us to maintain a balanced portfolio of commercial truck, industrial and aftermarket businesses covering key global markets. See Item 1A. Risk Factors below for information on certain risks that could have an impact on our business, financial condition or results of operations in the future.
Financial and Operational Excellence
Managing the Cycle. The industries in which we operate have been characterized historically by periodic fluctuations in overall demand for medium- and heavy-duty trucks, and other vehicles for which we supply products, resulting in corresponding fluctuations in demand for our products. The lengths and timing of the cyclical nature of the vehicle industry cannot be predicted with certainty. In response, we are focused on utilizing flexible manufacturing processes and plant footprints to take advantage of industry upturns and effectively manage industry downturns. In addition, we expect to balance the on-highway commercial vehicle cycles with complementary business lines, including aftermarket, military, construction and industrial supply. To effectively manage the cyclical nature of our Core Business, we are also focused on cost management and maintaining sufficient balance sheet flexibility.
Drive a Continuous Improvement Culture. The company implemented Performance Plus, a long-term profit improvement and cost reduction initiative, in fiscal year 2007 to improve operational performance and increase cash flow, earnings and shareowner value. The actions and programs that are part of the Performance Plus initiatives include delivering cost improvements by focusing on operational excellence (materials; manufacturing; and overhead) and enhancing revenue by focusing on commercial excellence (engineering, research and development; product strategy and growth; and aftermarket).
3
In fiscal year 2007, as part of Performance Plus, we implemented the ArvinMeritor Production System ("APS"), a lean manufacturing initiative that guides our pursuit of operational excellence. APS integrates several of our previous performance improvement initiatives into a set of actions that focus on improving systems, processes, behaviors and capabilities. Throughout our company, continuous improvement teams work to achieve significant cost savings, increase productivity and efficiency, improve design and quality, streamline operations and improve workplace safety. Maintaining a continuous improvement culture is important to our business operations and to maintaining and improving our operating results.
We expect the lower cost base that we have established through the above disciplined approach to serve us well not only through the current difficult environment but also during an economic recovery in the future.
Profitable Growth
Focus on Organic Growth in Our Core Business While Reviewing Strategic Opportunities. Our goal is to grow businesses that offer attractive returns and are core to our operations as well as to diversify over geographic and product lines to adjacent markets. We have identified the areas of our Core Business that we believe have the most potential for leveraging into other industries, products, markets and technologies, and we are focusing our resources on these areas. As we pursue additional growth opportunities, we intend to maintain or grow our market share with our commercial vehicle OEM customers by providing high quality products and services at competitive pricing. We also continue to review and evaluate on an ongoing basis all of our existing businesses to determine whether we need to modify, restructure, sell or otherwise discontinue any one of the businesses.
We intend to focus on growing product categories that offer favorable margins, such as the commercial vehicle aftermarket (“CVA”), with a focus on low customer transaction costs, remanufacturing, off-highway and military. We also intend to expand the CVA product portfolio geographically (into South America, China and India). In fiscal year 2008, we acquired Mascot Truck Parts Ltd ("Mascot") and Trucktechnic SA ("Trucktechnic"). Mascot remanufactures transmissions, drive axles, steering gears and drivelines in North America. Trucktechnic is a supplier of remanufactured brake calipers, components and testing equipment primarily to European markets.
We also intend to continue to concentrate on military design innovation – which has been a strong and profitable business for us. In addition, we are focused on growing our off-highway business. We plan to re-enter and increase off-highway market share in North America and Europe over the next 5 years, continue to grow in South America and expand our leadership position in Asia Pacific. Additionally, we are looking to leverage adjacent off-highway products to better serve our customers with a complete off-highway drive systems solution.
Longer term we intend to explore other industrial opportunities to apply our commercial, engineering, and manufacturing capabilities to new markets and product lines, perhaps totally separate from the traditional vehicle market applications.
We believe that commercial suppliers continue to consolidate into larger, more efficient and more capable companies and collaborate with each other in an effort to better serve the global needs of OEM customers by being where these customers need them. We regularly evaluate various strategic and business development opportunities, including licensing agreements, marketing arrangements, joint ventures, acquisitions and dispositions. We remain committed to selectively pursuing alliances and acquisitions that would allow us to leverage our capabilities, gain access to new customers and technologies, expand our global presence, enter complementary product market segments and implement our business strategies.
Strengthen our Presence in Emerging Global Markets. Geographic expansion to meet the global sourcing needs of customers and to enter new markets is an important element of our growth strategy. We currently have wholly-owned operations and regional joint ventures in South America, a market that has recently experienced significant growth. We also have joint ventures and wholly-owned subsidiaries in China, India and Turkey and participate in programs to support customers as they establish and expand operations in those markets.
We plan to continue to grow and expand globally, with a keen focus on South America and Asia Pacific (primarily China and India) because we believe these regions offer the greatest growth potential. Sales in these regions represented approximately 19 percent, 19 percent and 15 percent of total sales from continuing operations in fiscal years 2009, 2008 and 2007, respectively. We are also positioning the company in other growing markets, such as Eastern Europe.
In 2009, we signed a strategic partnership with Yutong Group Co., Ltd., the largest producer of high-end buses and coaches in the China market, to supply drivetrain components for buses and coaches in China. As part of ArvinMeritor’s partnership with Yutong, ArvinMeritor and Yutong will also sell and distribute standard aftermarket service kits for its products. In addition to supplying premium non-drive and drive axles to Yutong, ArvinMeritor manufactures differential carriers and brake calipers at its facility in Wuxi, China, for application on Yutong's axles utilizing local suppliers to meet the needs of customers in the China market. The final product is assembled at Yutong's plant in Zhenzhou, China.
4
Product and Technology Focus
Deliver High Quality Products for All Markets we Serve. We believe the quality of our core product lines and our ability to service our products through our aftermarket capabilities give us a competitive advantage. A key part of delivering high quality products is delivering service through the entire life cycle of the product. We continue to invest in new product development as we seek to keep our core product lines continually refreshed and in step with evolving market requirements and continue to grow our complimentary product lines. Building upon the strength of these core technologies, we intend to expand our presence globally, and continue our growth in complementary product lines, such as the critical military vehicle and off-highway markets. Our strategy involves diversifying on a geographic and product line basis through the aftermarket, off- and on-highway and added adjacencies that we will explore. Through implementation of our technology roadmap, complementary technologies such as electronics, controls and mechatronics are expected to be applied to traditional product lines to provide enhanced performance and expanded vehicle content.
Leverage Our Technology to Address Mobility, Safety and Environmental Provisions. In our opinion, another industry trend is the increasing amount of equipment required for changes in environmental and safety-related regulatory provisions. OEMs select suppliers based not only on the cost and quality of their products, but also on their ability to meet stringent environmental and safety requirements and to service and support the customer after the sale. We use our technological and market expertise to anticipate trends and to develop and engineer products that aim to address mobility, safety and environmental concerns.
To address safety, we have implemented a strategy of focusing on products and technologies that enhance overall vehicle braking performance. As part of this strategy, we are focusing on the integration of braking and stability products and suspension products as well as the development of electronic control capabilities. Through MeritorWabco, our joint venture with WABCO Holdings, Inc. ("WABCO"), we offer electronic braking systems that integrate anti-lock braking systems technology, automatic traction control, collision avoidance systems and other key vehicle control system components to improve braking performance and meet all required stopping distances for commercial vehicles.
In addition, we have developed a hybrid diesel-electric drivetrain for Class 8 line-haul trucks. This concept project, as further discussed below, has potential for environmental and economic benefits to heavy-duty truck customers in the future, including significant improvements in fuel efficiency. We are also working on a commercial pick-up and delivery truck program using an alternative battery-powered drivetrain that reduces emissions and fossil fuel consumption.
Nurture Emerging Next-Generation Products. We plan to continue to invest in advanced technologies that address customer needs by improving fuel efficiency and driver/vehicle safety. Examples of these advanced technologies being developed include:
- The Hybrid Class 8 Line-haul Powertrain Concept.
ArvinMeritor delivered a concept hybrid drivetrain
system to Walmart Transportation in January 2009. Although this product is a
concept system only and at this juncture we have no orders or contracts to
produce it, we intend to pursue this area in the future. While most hybrid
systems today are best suited for start-stop applications, our concept hybrid
drivetrain is specifically designed for linehaul, over-the-road trucks, the
largest segment of the commercial vehicle population and the greatest consumer
of diesel fuel on the road. Our concept hybrid drivetrain, the Meritor
Multi-Mode Hybrid Powertrain, combines both mechanical and electrical drive
systems. Under 48 miles-per-hour, vehicle propulsion is delivered entirely
through an electric motor with power from lithium ion batteries. These
batteries are recharged through regenerative braking and/or an engine-driven
generator. As the vehicle approaches highway speed, the drivetrain phases to a
diesel-powered system with the electric motor providing power, only as
required, allowing for total system optimization. The key differentiation of
this system is its ability for zero-emission mode over a wide range of vehicle
driving conditions. This allows the truck to operate in places where emissions
are restricted, like a port or urban area. Additionally, the batteries provide
continuous power for hotel loads during an overnight rest period, eliminating
the need for engine idling or other redundant anti-idling systems.
Electrification of accessories such as the air or AC compressors provides
further efficiency benefits. Additional benefits have been demonstrated in
noise, handling and smoother acceleration. The Meritor concept hybrid
drivetrain in the Walmart tractor was developed by ArvinMeritor as project
leader and in collaboration with Navistar and Cummins and is comprised of a
proprietary motor/generator unit, high capacity lithium ion batteries, as well
as the overall power-management system.
- ArvinMeritor’s Smart Systems Technology. ArvinMeritor’s
Smart Systems technology roadmap focuses on improving vehicle system
performance through the integration and application of electronics, controls
and materials.
- Meritor Lubrication Management System (MLMS). MLMS adjusts the axle lubricant level according to vehicle operating conditions. It is estimated that linehaul vehicles spend up to 90% of their operation at highway speeds. Under these conditions, when oil churning losses are most significant, the lube level is automatically reduced, with an attendant reduction in viscous drag. By reducing oil churning during high speed operation, axle efficiency is improved by up to 1%, with a corresponding reduction in fuel consumption.
5
Products
ArvinMeritor designs, develops, manufactures, markets, distributes, sells, services and supports a broad range of products for use in the transportation and industrial sectors. In addition to sales of original equipment systems and components, we provide our original equipment, aftermarket and remanufactured products to vehicle OEMs and their dealers (who in turn sell to motor carriers and commercial vehicle users of all sizes), independent distributors, and other end-users in certain aftermarkets.
The following chart sets forth, for each of the three fiscal years with the most recent ended September 30, 2009, information about product sales for products comprising more than 10% of consolidated revenue in any of those years. A narrative description of our principal products follows the chart.
Product Sales:
| Fiscal Year Ended | |||||||||
| September 30, | |||||||||
| 2009 | 2008 | 2007 | |||||||
| CORE BUSINESS: | |||||||||
| Axles, Undercarriage and Drivelines | 55 | % | 57 | % | 54 | % | |||
| Brakes and Braking Systems | 19 | % | 17 | % | 19 | % | |||
| Other | 1 | % | 1 | % | 1 | % | |||
| Total Core Business: | 75 | % | 75 | % | 74 | % | |||
| LVS: | |||||||||
| Roofs and Door Systems | 23 | % | 22 | % | 21 | % | |||
| Other | 2 | % | 3 | % | 5 | % | |||
| Total LVS Business: | 25 | % | 25 | % | 26 | % | |||
| Total: | 100 | % | 100 | % | 100 | % | |||
Core Business
The three segments included in our Core Business manufacture and supply the products set forth and described below.
Axles, Undercarriage & Drivelines
We believe we are one of the world's leading independent suppliers of axles for medium- and heavy-duty commercial vehicles, with axle manufacturing facilities located in North America, South America, Europe and the Asia/Pacific regions. Our extensive truck axle product line includes a wide range of front steer axles and rear drive axles, aluminum carriers to reduce weight and pressurized filtered lubrication systems for longer life. Our front steer and rear drive axles can be equipped with our cam, wedge or air disc brakes, automatic slack adjusters, anti-lock braking systems (“ABS”), vehicle stability control systems and complete wheel-end equipment.
We supply heavy-duty axles in certain global regions, for use in numerous off-highway vehicle applications, including construction, material handling, and mining. We also supply axles for use in medium- and heavy-duty military tactical wheeled vehicles, principally in North America. These products are designed to tolerate extremely high tonnage and operate under extreme geographical and climate conditions. In addition, we have other off-highway vehicle products that are currently in development for certain other regions. We supply axles for use in buses, coaches and recreational vehicles, fire trucks and other specialty vehicles in North America, Asia-Pacific and Europe, and believe we are the leading supplier of bus and coach axles in North America.
We believe we are one of the world's leading manufacturers of heavy-duty trailer axles, with a leadership position in North America. Our trailer axles are available in more than 40 models in capacities from 20,000 to 30,000 pounds for virtually all heavy trailer applications and are available with our broad range of brake products, including drum brakes, disc brakes, anti-lock and trailer stability control systems, and ABS.
We supply universal joints and driveline components, including our Permalube™ universal joint and RPL Permalube™ driveline, which are low maintenance, permanently lubricated designs used often in the high mileage on-highway market. We supply drivelines in a variety of global regions, for use in numerous on- and off-highway vehicle applications, including construction, material handling, mining, agriculture and forestry. We supply ABS transfer cases and drivelines for use in medium- and heavy-duty military tactical wheeled vehicles, principally in North America. We also supply transfer cases for use in specialty vehicles in North America. Anti-lock brakes and stability control systems are also used in military vehicles and specialty vehicles. In addition, we supply trailer air suspension systems and products in Europe with an increasing market presence in North America. We also supply suspensions for use in buses, coaches and recreational vehicles, fire trucks and other specialty vehicles in North America and Europe, and supply advanced suspension modules for use in medium- and heavy-duty military tactical wheeled vehicles, principally in North America.
6
Through a joint venture, we develop, manufacture and sell truck suspensions, trailer axles and suspensions and related wheel-end products in the South American market. We believe this joint venture has a number one product position in suspension and trailer axles in the South American market.
Brakes and Braking Systems
We believe we are a leading independent supplier of air brakes to medium- and heavy-duty commercial vehicle manufacturers in North America and Europe. In Brazil, one of the largest truck and trailer markets in the world, we believe that our 49%-owned joint venture with Randon S. A. Vehiculos e Implementos is a leading supplier of brakes and brake-related products.
Through manufacturing facilities located in North America, Asia-Pacific and Europe, we manufacture a broad range of foundation air brakes, as well as automatic slack adjusters for brake systems. Our foundation air brake products include cam drum brakes, which offer improved lining life and tractor/trailer interchangeability; air disc brakes, which provide fade resistant braking for demanding applications; wedge drum brakes, which are lightweight and provide automatic internal wear adjustment; hydraulic brakes; and wheel-end components such as hubs, drums and rotors.
Our brakes and brake system components are used in medium- and heavy-duty military tactical wheeled vehicles, principally in North America. We also supply brakes for use in buses, coaches and recreational vehicles, fire trucks and other specialty vehicles in North America and Europe, and we are the leading supplier of bus and coach brakes in North America, and also supply brakes for buses and coaches in Asia-Pacific.
U.S. Federal regulations require that new medium- and heavy-duty vehicles sold in the United States be equipped with ABS. We believe that our 50%-owned joint venture with WABCO is a leading supplier of ABS and a supplier of other electronic and pneumatic control systems (such as stability control and collision avoidance systems) for North American heavy-duty commercial vehicles. The joint venture also supplies hydraulic ABS to the North American medium-duty truck market and produces stability control and collision mitigation systems for tractors and trailers, which are designed to help maintain vehicle stability and aid in reducing tractor-trailer rollovers and other incidents.
Other Products
We sell the following products through our aftermarket distribution channels: brake shoes and friction materials; automatic slack adjusters; drive axles, gears and trailer axles; clutches; driveline components; U-joints, yokes and shafts; wheel-end hubs and drums; hydraulic brakes and components; ABS and stability control systems; suspension parts, shock absorbers and air springs; and air brakes, air systems, air dryers and compressors.
Light Vehicle Systems
Roofs and Door Systems
Our Body Systems business supplies sunroofs and roof systems’ products, including panoramic roof modules, tilt and slide sunroof modules and complete roof systems, for use in passenger cars, light trucks and sport utility vehicles. Our roof systems’ manufacturing facilities are located in Europe, China and North America. Body Systems also supplies integrated door modules and systems, including manual and power window regulators and access control systems and components such as modular and integrated door latches, actuators, trunk and hood latches and fuel flap locking devices. Our power and manual door system products utilize numerous technologies, including our own electric motors with electronic function capabilities such as anti-squeeze technologies. We manufacture door system components at plants primarily in Europe, China and North America.
Other products
We assemble upper and complete corner modules as well as front and rear cross vehicle suspension modules in the United States. We also make shock absorbers for aftermarket sales in Europe and make and distribute gas springs for sale to automotive customers and industrial applications.
Through our 57% owned joint venture, MSSC, which we sold on October 30, 2009, we supplied products used in suspension systems for passenger cars, light trucks and sport utility vehicles in North America. Our suspension system products, which were manufactured at facilities in the United States and Canada, included coil springs, stabilizer bars and torsion bars.
7
Customers; Sales and Marketing
ArvinMeritor has numerous customers worldwide and has developed long-standing business relationships with many of these customers. Our ten largest customers accounted for approximately 59% of our total sales from continuing operations in fiscal year 2009. Sales to AB Volvo and Navistar International Corporation represented approximately 15 percent and 10 percent of our sales in fiscal year 2009. No other customer accounted for 10% or more of our total sales in fiscal year 2009.
Core Business – OEMs
In North America, we design, engineer, market and sell products principally to OEMs, dealers and distributors. While our North American sales are typically direct to the OEMs, our ultimate commercial truck customers include trucking and transportation fleets. Fleet customers may specify our components and integrated systems for installation in the vehicles they purchase from OEMs. We employ what we refer to as a “push-pull” marketing strategy. We “push” for being the standard product at the OEM. At the same time, our district field managers then call on fleets and OEM dealers to “pull-through” our components on specific truck purchases. For all other markets, we specifically design, engineer, market and sell products principally to OEMs for their market specific needs or product specifications.
For certain large OEM customers, our supply arrangements are generally negotiated on a long-term contract basis for a multi-year period that may require us to provide annual cost reductions (through price reductions or other cost benefits for the OEMs). If we are unable to generate sufficient cost savings in the future to offset such price reductions, our gross margins will be adversely affected. Sales to other OEMs are typically made through open order releases or purchase orders at market based prices which do not require the purchase of a minimum number of products. The customer typically has the right to cancel or delay these orders on reasonable notice. We generally compete for new business from OEMs, both at the beginning of the development of new vehicles and upon the redesign of existing vehicles.
We have established leading positions in many of the markets we serve as a global supplier of a broad range of drivetrain systems, modules and components. Based on available industry data and internal company estimates, our market leading positions include independent truck drive axles in North America, Europe, South America and India, truck drivelines in North America, truck air brakes in North America and Europe and military wheeled vehicle drivetrain, suspension and brakes in North America.
Our global customer portfolio includes companies such as AB Volvo, Navistar International Corp., Daimler AG, BAE Systems, Iveco and PACCAR, Inc.
Core Business – Aftermarket
We market and sell truck, trailer, off-highway and other products principally to, and service such products principally for, OEMs, their parts marketing operations, their dealers and other independent distributors and service garages within the aftermarket industry. Our product sales are generated through long-term agreements with certain of our OEM customers, distribution agreements and through sales to independent dealers and distributors. Sales to other OEMs are typically made through open order releases or purchase orders at market based prices which do not require the purchase of a minimum number of products. The customer typically has the right to cancel or delay these orders on reasonable notice.
Our product offerings allow us to service all stages of our customers’ vehicle ownership lifecycle. In North America, we stock and distribute hundreds of parts from top national brands to our customers or what we refer to as our “all makes” strategy. Also, as part of our growth strategy, we employ what believe to be world class remanufacturing processes that allow us to offer highly engineered genuine remanufactured components to our customers in North America and Europe. Our district field managers call on our OEM and independent customers to market our full product line capabilities on a regular basis to seek to ensure that we satisfy our customers’ needs. Our aftermarket business sells products under the following brand names: Meritor; Meritor Wabco; Euclid; Trucktechnic; and Mascot Truck Parts.
Based on available industry data and internal company estimates, our North America aftermarket business has the market leadership position for the products in which we participate.
Light Vehicle Systems
We sell products principally to OEMs. New platform development awards generally begin two to four years prior to start-up of production. We market our products and new technologies directly to the OEMs. Consistent with industry practice, we make most of our sales to OEMs through open order releases or purchase orders, which do not require the purchase of a minimum number of products and typically may be cancelled by the customer on reasonable notice without penalty. However, given the cost and complexity of the tooling required to produce vehicle parts, once awarded, it is typically very difficult and costly for the OEM to switch suppliers. We also sell products to certain customers under long-term arrangements that require us to provide annual cost reductions to our customers (through price reductions or other cost benefits for the OEMs). If we are unable to generate sufficient cost savings in the future to offset such price reductions, our gross margins will be adversely affected.
8
The majority of our light vehicle sales are generated through customers that are concentrated in Europe although we still have a strong customer base that has operations around the globe. Our customers include Volkswagen AG, Ford Motor Company, Renault-Nissan BV, Peugeot S.A., General Motors Corporation, Bayerische Motoren Werke AG and Chrysler Group LLC.
Competition
We compete worldwide with a number of North American and international providers of components and systems, some of which are owned by or associated with some of our customers. The principal competitive factors are price, quality, service, product performance, design and engineering capabilities, new product innovation and timely delivery. In addition, certain OEMs manufacture their own components that compete with the types of products we supply.
Our major competitors for axles are Dana Holding Corp. and, in certain markets, OEMs that manufacture axles for use in their own products. Emerging competitors for axles include Daimler Truck North America’s Axle Alliance Company and Han de, Ankai. Our major competitors for brakes are Haldex, WABCO, Brembo, Bendix/Knorr Bremse and, in certain markets, OEMs that manufacture brakes for use in their own products. Our major competitors for industrial applications are ZF, MAN, AxleTech International, Marmon-Herrington, Dana Holding Corp., Knorr, Kessler & Co., Carraro, NAF, Sisu and, in certain markets, OEMs that manufacture industrial products for use in their own vehicles. Our major competitors for trailer applications are Hendrickson, BPW and SAF-Holland. Our major competitors for light vehicle roof systems are Webasto, Inalfa and Aisin and for light vehicle door and access control systems are Brose, Intier, Kiekert AG, Mitsui, Valeo, Aisin and Grupo Antolin.
See Item 1A. Risk Factors for information on certain risks associated with our competitive environment.
Raw Materials and Suppliers
We concentrate our purchases of certain raw materials and parts over a limited number of suppliers, some of which are located in developing countries and some of which have been adversely affected by weakening economic conditions. We are dependent upon our suppliers’ ability to meet performance and quality specifications and delivery schedules. The inability of a supplier to meet these requirements, the loss of a significant supplier, or any labor issues or work stoppages at a significant supplier, could have an adverse effect on our ability to meet our customer’s delivery requirements.
Although the cost of our core products is susceptible to changes in overall steel commodity prices, including ingredients used for various grades of steel, we generally structure our major steel supplier and customer contracts to absorb and pass on normal market fluctuations in steel prices with minimal impact on our operating results. In 2008, there was a sudden and extraordinary surge in the price of steel, energy and other commodities. In response, we pursued incremental recovery of, in some cases, monthly increases in such costs through surcharges or other pricing arrangements with our entire affected customer base in order to mitigate the impact on our operating margins. The price of steel has stabilized during fiscal year 2009. However, significant future volatility in the commodity markets – including a global shortage of scrap steel, a rapid escalation in the price of critical raw materials such as iron ore, coking coal and metal alloys, and higher fuel and energy costs – may require us to continue this practice of monthly increases through surcharges or pricing arrangements until these costs stabilize. In addition, if supplies are inadequate for our needs, or if prices remain at current levels or increase and we are unable to either pass these prices to our customer base or otherwise mitigate the costs, our operating results could be further adversely affected.
We continuously work to address these competitive challenges by reducing costs, improving productivity and, as needed, restructuring operations. We have developed a supplier risk management process under which we conduct an initial supplier risk assessment for all major suppliers and an intensive assessment of high-risk suppliers. On an ongoing basis, we monitor third party financial statements, conduct surveys through supplier questionnaires and do site visits. We are proactive in managing our supplier relationships to avoid supply disruptions and evaluate potential options, including dual sourcing and exit strategy. Our process employs well-defined trigger points that cause us to take aggressive actions and then monitor the progress closely.
Divestitures and Restructuring
As described above, our business strategies are focused on enhancing our market position by continuously evaluating the competitive differentiation of our product portfolio, focusing on our strengths and core competencies, and growing the businesses that offer the most attractive returns. Implementing these strategies involves various types of strategic initiatives.
9
Divestitures.
As part of our strategy to refocus our business and dedicate our resources to our core capabilities, we regularly review the prospects of our existing businesses to determine whether any of them should be modified, restructured, sold or otherwise discontinued. In an effort to execute our long-term strategy to transform our company away from the light vehicle business to focus on the commercial vehicle and industrial business, we completed the following initiatives since the beginning of fiscal year 2007 (see Note 3 of the Notes to Consolidated Financial Statements under Item 8. Financial Statements and Supplementary Data below):
- In fiscal years 2006 and 2007, we completed
the sale of a significant part of our Light Vehicle Aftermarket (LVA)
businesses.
- In fiscal year 2007, we sold our Emissions
Technologies (ET) business to EMCON Technologies Holdings Limited, a private
equity affiliate of JPMorgan Securities, Inc.
- In fiscal year 2007, we sold our European
light vehicle aftermarket exhaust and filters operations to Klarius Group
Limited. This transaction completed the sale of our LVA businesses (except for
the North American aftermarket ride control business, which as described below
we sold in fiscal year 2009).
- In fiscal year 2009, we completed the sale of
our 51 percent interest in Gabriel de Venezuela to our joint venture
partner.
- In fiscal year 2009, we completed the sale of our
Gabriel Ride Control Products North America business.
- In fiscal year 2009, we entered into a binding
letter of intent to sell our 57 percent interest in MSSC to the joint venture
partner, a subsidiary of Mitsubishi Steel Mfg. Co., LTD. The sale was
completed on October 30, 2010.
- In fiscal year 2009, we completed the sale of our Wheels business to Iochpe-Maxion S.A., a Brazilian producer of wheels and frames for commercial vehicles, railway freight cars and castings.
Restructuring.
Performance Plus: The company implemented Performance Plus, a long-term profit improvement and cost reduction initiative, in fiscal year 2007. As part of this program, we identified significant restructuring actions intended to improve our global footprint and cost competitiveness by eliminating up to 2,800 positions in North America and Europe and consolidating and combining certain global facilities, with costs to be incurred over several years. In our continuing operations, we recorded restructuring costs of $36 million, $9 million and $62 million in fiscal years 2009, 2008 and 2007, respectively, related to these actions. These costs include $76 million primarily for estimated employee severance benefits, $14 million of asset impairment charges associated with certain facility closures and $17 million of other shutdown costs.
As part of Performance Plus, in fiscal year 2009, we closed our Commercial Truck manufacturing facility in Tilbury, Ontario, Canada (Tilbury). We recognized restructuring costs of approximately $30 million in fiscal year 2009 associated with this closure for estimated employee severance benefits, including pension termination benefits under the terms of the Tilbury retirement plans and certain asset impairment charges. We expect a significant portion of the cash payments associated with this closure to be incurred in fiscal years 2010 through 2012. In fiscal year 2009, the company also announced the closure of its Commercial Truck facility in Carrollton, Kentucky (Carrollton) and recognized approximately $2 million of restructuring costs. We expect to close this facility in the first quarter of fiscal year 2010.
In addition, we announced in fiscal year 2009 the closure of our coil spring operations in Milton, Ontario, Canada (Milton), which is part of MSSC. Costs associated with this closure were $16 million, primarily for employee severance and pension termination benefits, and are included in loss from discontinued operations in the consolidated statement of operations. We completed the sale of our interest in MSSC in the first quarter of fiscal year 2010. Accordingly, these restructuring liabilities were assumed by the purchaser.
Fiscal Year 2009 Actions: In addition to Performance Plus, in fiscal 2009, we began implementing a number of immediate restructuring and cost reduction actions in response to a significant decline in global market conditions. These actions include:
- Temporary or permanent workforce reductions
of approximately 3,000 employees, including full-time, contract and temporary workers;
- Plant level furlough programs, including
government supported programs;
- Extended shutdowns at all
plants;
- Temporary pay reductions for salaried employees in North America and, on a voluntary basis, from around the world, which was achieved through base salary adjustments and/or curtailed production schedules;
10
- Temporary suspension of the matching
contribution for the U.S. 401(k) plan;
- Temporary suspension of fiscal year 2009
merit increases for all global employees; and
- Temporary reduction of Board of Directors annual compensation by 10 percent.
The majority of these actions have been completed. We have recognized in our continuing operations approximately $44 million of restructuring costs in connection with these actions for severance and related benefits, of which $36 million was paid in fiscal year 2009.
In fiscal year 2009, our Core Business achieved an estimated $195 million in savings related to these significant actions. We estimate approximately $48 million of these savings are related to temporary cost reduction measures associated with the suspension of annual variable incentive compensation, 401(k) employer matching contributions and salary reductions. In addition, approximately $50 million of these savings are related to variable labor which would be expected to increase as market volumes recover.
In addition, we continue to focus on improving cash flow by maintaining tight controls on global inventory, pursuing working capital improvements, reducing capital spending and significantly reducing discretionary spending.
See Note 5 of the Notes to Consolidated Financial Statements under Item 8. Financial Statements and Supplementary Data below for further information on our restructuring actions.
See Item 1A. Risk Factors for information on certain risks associated with strategic initiatives.
Joint Ventures
As the industries in which we operate have become more globalized, joint ventures and other cooperative arrangements have become an important element of our business strategies. These strategic alliances provide for sales, product design, development and manufacturing in certain product and geographic areas. As of September 30, 2009, our Core Business participated in the following non-consolidated joint ventures:
| Key Products | Country | ||
| Meritor WABCO Vehicle Control Systems | Antilock braking and air systems | U.S. | |
| Master Sistemas Automotivos Limitada | Braking systems | Brazil | |
| Suspensys Sistemas Automotivos Ltda. | Suspensions, axles, hubs and drums | Brazil | |
| Sistemas Automotrices de Mexico S.A. de C.V. | Axles, drivelines and brakes | Mexico | |
| Ege Fren Sanayii ve Ticaret A.S. | Braking systems | Turkey | |
| Automotive Axles Limited | Rear drive axle assemblies | India |
Our LVS segment participates in three non-consolidated joint ventures. Aggregate sales of our non-consolidated joint ventures were $929 million, $1,484 million and $1,182 million in fiscal years 2009, 2008 and 2007, respectively.
In accordance with accounting principles generally accepted in the United States, our consolidated financial statements include the operating results of those joint ventures in which we have control. For additional information of our unconsolidated joint ventures and percentage ownership thereof see Note 13 of the Notes to Consolidated Financial Statements under Item 8. Financial Statements and Supplementary Data below.
Research and Development
We have significant research, development, engineering and product design capabilities. We spent $103 million in fiscal year 2009, $122 million in fiscal year 2008 and $116 million in fiscal year 2007 on company-sponsored research, development and engineering. We employ professional engineers and scientists globally, and have additional engineering capabilities through contract arrangements in low-cost countries. We also have advanced technical centers in North America, Europe and Asia-Pacific (primarily in India and China). We recently opened a new technical center in Bangalore, India.
Patents and Trademarks
We own or license many United States and foreign patents and patent applications in our engineering and manufacturing operations and other activities. While in the aggregate these patents and licenses are considered important to the operation of our businesses, management does not consider them of such importance that the loss or termination of any one of them would materially affect a business segment or ArvinMeritor as a whole.
11
Our registered trademarks ArvinMeritor® and Meritor® are important to our business. Other significant trademarks owned by us include EuclidTM, Mascot and TRUCKTECHNIC for aftermarket products.
Substantially all of our intellectual property is subject to a first priority perfected security interest securing our obligations to the lenders under our credit facility. See Note 16 of the Notes to Consolidated Financial Statements under Item 8. Financial Statements and Supplementary Data below.
Employees
At September 30, 2009, we had approximately 13,200 full-time employees. At that date, 686 employees in the United States and Canada were covered by collective bargaining agreements and most of our facilities outside of the United States and Canada were unionized. We believe our relationship with unionized employees is satisfactory.
Our collective bargaining agreement with the Canadian Auto Workers (“CAW”) at our CVS brakes facility in Ontario, Canada, expired on June 3, 2006. On June 4, 2006, we announced that, after lengthy negotiations, a new tentative agreement with the CAW had not yet been reached and, as a result, we had suspended operations at the facility. On June 12, 2006, we reached a tentative agreement with the CAW, which was subsequently ratified on June 14, 2006, and resumed operations. As a result of this work stoppage, we experienced temporary manufacturing inefficiencies and incurred certain costs in order to return to normal production. Other than the foregoing, no significant work stoppages have occurred in the past five years.
Environmental Matters
Federal, state and local requirements relating to the discharge of substances into the environment, the disposal of hazardous wastes and other activities affecting the environment have, and will continue to have, an impact on our operations. We record liabilities for environmental issues in the accounting period in which they are considered to be probable and the cost can be reasonably estimated. At environmental sites in which more than one potentially responsible party has been identified, we record a liability for our allocable share of costs related to our involvement with the site, as well as an allocable share of costs related to insolvent parties or unidentified shares. At environmental sites in which we are the only potentially responsible party, we record a liability for the total estimated costs of remediation before consideration of recovery from insurers or other third parties.
We have been designated as a potentially responsible party at eight Superfund sites, excluding sites as to which our records disclose no involvement or as to which our liability has been finally determined. In addition to Superfund sites, various other lawsuits, claims and proceedings have been asserted against us, alleging violations of federal, state and local environmental protection requirements or seeking remediation of alleged environmental impairments, principally at previously disposed-of properties. We have established reserves for these liabilities when they are considered to be probable and reasonably estimable. See Note 23 of the Notes to Consolidated Financial Statements under Item 8. Financial Statements and Supplementary Data below for information as to our estimates of the total reasonably possible costs we could incur and the amounts recorded as a liability as of September 30, 2009, and as to changes in environmental accruals during fiscal year 2009.
The process of estimating environmental liabilities is complex and dependent on physical and scientific data at the site, uncertainties as to remedies and technologies to be used, and the outcome of discussions with regulatory agencies. The actual amount of costs or damages for which we may be held responsible could materially exceed our current estimates because of uncertainties, including the financial condition of other potentially responsible parties, the success of the remediation and other factors that make it difficult to predict actual costs accurately. However, based on management's assessment, after consulting with Vernon G. Baker, II, Esq., ArvinMeritor's General Counsel, and with outside advisors who specialize in environmental matters, and subject to the difficulties inherent in estimating these future costs, we believe that our expenditures for environmental capital investment and remediation necessary to comply with present regulations governing environmental protection and other expenditures for the resolution of environmental claims will not have a material adverse effect on our business, financial condition or results of operations. In addition, in future periods, new laws and regulations, changes in remediation plans, advances in technology and additional information about the ultimate clean-up remedy could significantly change our estimates. Management cannot assess the possible effect of compliance with future requirements.
International Operations
We believe our international operations provide us with geographical diversity and help us to weather the cyclical nature of our business. Approximately 62 percent of our total assets as of September 30, 2009 and 61 percent of fiscal year 2009 sales from continuing operations were outside the U.S.. See Note 24 of the Notes to Consolidated Financial Statements under Item 8. Financial Statements and Supplementary Data below for financial information by geographic area for the three fiscal years ended September 30, 2009.
12
Our international operations are subject to a number of risks inherent in operating abroad (see Item 1A. Risk Factors below). There can be no assurance that these risks will not have a material adverse impact on our ability to increase or maintain our foreign sales or on our financial condition or results of operations.
Our operations are also exposed to global market risks, including foreign currency exchange rate risk related to our transactions denominated in currencies other than the U.S. dollar. We have implemented a foreign currency cash flow hedging program to help reduce the company’s exposure to changes in exchange rates. We use foreign currency forward contracts to manage the company’s exposures arising from foreign currency exchange risk. Gains and losses on the underlying foreign currency exposures are partially offset with gains and losses on the foreign currency forward contracts. The contracts generally mature within twelve months. It is our policy not to enter into derivative financial instruments for speculative purposes and, therefore, we hold no derivative instruments for trading purposes. See Item 7A. Quantitative and Qualitative Disclosures About Market Risk and Note 17 of the Notes to Consolidated Financial Statements under Item 8. Financial Statements and Supplementary Data below.
Seasonality; Cyclicality
We may experience seasonal variations in the demand for our products, to the extent OEM vehicle production fluctuates. Historically, for all of our operations (except our aftermarket business), demand has been somewhat lower in the quarters ended September 30 and December 31, when OEM plants may close during model changeovers and vacation and holiday periods.
In addition, the industries in which we operate have been characterized historically by periodic fluctuations in overall demand for trucks, trailers, passenger cars and other specialty vehicles for which we supply products, resulting in corresponding fluctuations in demand for our products. Production and sales of the vehicles for which we supply products generally depend on economic conditions and a variety of other factors that are outside of our control, including freight tonnage, customer spending and preferences, labor relations and regulatory requirements. See Item 1A. Risk Factors below. Cycles in the major vehicle industry markets of North America and Europe are not necessarily concurrent or related. It is part of our strategy to continue to seek to expand our operations globally to help mitigate the effect of periodic fluctuations in demand of the vehicle industry in one or more particular countries.
In fiscal year 2009, we believe the substantial uncertainty and significant deterioration in the worldwide credit markets, the global economic downturn and the current climate in the U.S. and other economies have, as shown in the below table, impacted the demand for the products of our customers. Many of our customers have experienced sharp declines in production and sales volumes, which started in November 2008 and have continued through September 2009.
The following table sets forth estimated vehicle production in principal markets we serve for the last five fiscal years based on available industry sources and management’s estimates:
| Year Ended September 30, | |||||||||
| 2009 | 2008 | 2007 | 2006 | 2005 | |||||
| Estimated Commercial Vehicle Production (in thousands): | |||||||||
| North America, Heavy-Duty Trucks | 128 | 194 | 246 | 352 | 324 | ||||
| North America, Medium-Duty Trucks | 74 | 122 | 176 | 216 | 208 | ||||
| United States and Canada, Trailers | 93 | 176 | 275 | 312 | 327 | ||||
| Western Europe, Heavy- and Medium-Duty Trucks | 247 | 562 | 480 | 439 | 421 | ||||
| South America, Heavy- and Medium- Duty Trucks | 118 | 161 | 127 | 107 | 112 | ||||
| Estimated Light Vehicle Production (in millions): | |||||||||
| North America | 8.5 | 13.7 | 15.1 | 15.7 | 15.6 | ||||
| South America | 3.4 | 4.0 | 3.3 | 3.0 | 2.7 | ||||
| Western Europe (including Czech Republic) | 12.1 | 15.5 | 16.5 | 16.4 | 16.4 | ||||
| Asia/Pacific | 25.8 | 29.6 | 26.7 | 24.8 | 22.7 | ||||
Available Information
We make available free of charge through our web site (www.arvinmeritor.com) our Annual Report on Form 10-K, Quarterly Reports on Form 10-Q, Current Reports on Form 8-K, all amendments to those reports, and other filings we make with the Securities and Exchange Commission (“SEC”), as soon as reasonably practicable after they are filed.
13
Cautionary Statement
This Annual Report on Form 10-K contains statements relating to future results of the company (including certain projections and business trends) that are “forward-looking statements” as defined in the Private Securities Litigation Reform Act of 1995. Forward-looking statements are typically identified by words or phrases such as “believe,” “expect,” “anticipate,” “estimate,” “should,” “are likely to be,” “will” and similar expressions. There are risks and uncertainties as well as potential substantial costs relating to the company’s announced plans to divest the body systems business of LVS and any of the strategic options under which to pursue such divestiture. In the case of any sale of all or a portion of the business, these risks and uncertainties include the timing and certainty of completion of any sale, the terms upon which any purchase and sale agreement may be entered into (including potential substantial costs) and whether closing conditions (some of which may not be within the company’s control) will be met. In the case of any shut down of portions of the business, these risks and uncertainties include the amount of substantial severance and other payments as well as the length of time we will continue to have to operate the business, which is likely to be longer than in a sale scenario. There is also a risk of loss of customers of this business due to the uncertainty as to the future of this business. In addition, actual results may differ materially from those projected as a result of substantial costs, certain risks and uncertainties, including but not limited to global economic and market cycles and conditions, including the recent global economic crisis; the demand for commercial, specialty and light vehicles for which the company supplies products; availability and sharply rising costs of raw materials, including steel; risks inherent in operating abroad (including foreign currency exchange rates and potential disruption of production and supply due to terrorist attacks or acts of aggression); whether our liquidity will be affected by declining vehicle production volumes in the future; OEM program delays; demand for and market acceptance of new and existing products; successful development of new products; reliance on major OEM customers; labor relations of the company, its suppliers and customers, including potential disruptions in supply of parts to our facilities or demand for our products due to work stoppages; the financial condition of the company’s suppliers and customers, including potential bankruptcies; possible adverse effects of any future suspension of normal trade credit terms by our suppliers; potential difficulties competing with companies that have avoided their existing contracts in bankruptcy and reorganization proceedings; successful integration of acquired or merged businesses; the ability to achieve the expected annual savings and synergies from past and future business combinations and the ability to achieve the expected benefits of restructuring actions; success and timing of potential divestitures; potential impairment of long-lived assets, including goodwill; potential adjustment of the value of deferred tax assets; competitive product and pricing pressures; the amount of the company’s debt; the ability of the company to continue to comply with covenants in its financing agreements; the ability of the company to access capital markets; credit ratings of the company’s debt; the outcome of existing and any future legal proceedings, including any litigation with respect to environmental or asbestos-related matters; the outcome of actual and potential product liability, warranty and recall claims; rising costs of pension and other postretirement benefits; and possible changes in accounting rules; as well as other substantial costs, risks and uncertainties, including but not limited to those detailed herein and from time to time in other filings of the company with the SEC. See also the following portions of this Annual Report on Form 10-K: Item 1. Business, “Customers; Sales and Marketing”; “Competition”; “Raw Materials and Supplies”; “Strategic Initiatives”; “Employees”; “Environmental Matters”; “International Operations”; and “Seasonality; Cyclicality”; Item 1A. Risk Factors; Item 3. Legal Proceedings; and Item 7. Management’s Discussion and Analysis of Financial Condition and Results of Operations. These forward-looking statements are made only as of the date hereof, and the company undertakes no obligation to update or revise the forward-looking statements, whether as a result of new information, future events or otherwise, except as otherwise required by law.
Item 1A. Risk Factors.
Our business, financial condition and results of operations can be impacted by a number of risks, including those described below and elsewhere in this Annual Report on Form 10-K, any one of which could cause our actual results to vary materially from recent results or from anticipated future results. Any of these individual risks could materially and adversely affect our business, financial condition and results of operations. This effect could be compounded if multiple risks were to occur.
The disposition of our remaining LVS businesses could involve substantial costs and be subject to risks and uncertainties.
Our light vehicle Body Systems business has incurred significant recent operating losses and, until recent quarters, negative cash flows. There can be no assurances that there will not be future operating losses or negative cash flows. In addition, this business has from time-to-time incurred significant warranty charges and there can be no certainty that additional warranty charges in the future will not be significant.
It is our intent to divest our Body Systems business in the most economically advantageous way possible. We have commenced a strategic evaluation of available options to divest this business, which include a sale of the entire business, multiple sales of portions of the business, shut downs of portions of the business or a combination of partial sales and shut downs. We expect that the divestiture process could extend until the end of 2010 or beyond. There are significant risks and uncertainties inherent in any options we may pursue. Risks involved in any sale process include the timing and certainty of completion of any transaction and the terms upon which any sale agreement with respect to all or any portion of the business may be entered into. Risks involved in any shut down include the substantial severance and other payments we will be required to make in connection therewith. Shut downs will also likely result in our operating the business for a lengthier period. Potential cash costs to sell or shut down all or portions of the business may be substantial and could be in excess of $100 million. In addition, there is the potential to lose new or replacement customer awards due to the uncertainty as to the future of the business.
14
Until the closing of any sale or the completion of any shut down, we will be responsible for the operation of this business. Therefore, it is possible that an extended process could result in continued significant operating losses and cash requirements for which we would be responsible. We will continue to evaluate and weigh the costs (which may include significant restructuring costs) to carry the business against any substantial costs to dispose or shut down various pieces of the business and intend to make the most economically advantageous decisions with respect to this business. Accordingly, because we are still evaluating and will be weighing our possible options, we are unable to estimate with further specificity the costs associated with divesting or shutting down this business.
Continued production and sales volume declines in the commercial and automotive vehicle markets may adversely affect our results of operations, our ability to fund our liquidity requirements and our ability to meet our long-term commitments.
The substantial uncertainty and significant deterioration in the worldwide credit markets, the global economic downturn and the current climate in the U.S. and other economies have severely diminished demand for our customers’ products. As a result, commercial and automotive production and sales volumes have declined significantly in most markets and continue to adversely affect the amount of cash flows generated from operations for meeting the needs of our business. We believe volumes will continue to be at depressed levels and that the impact of these lower volumes will continue to impact our business in fiscal year 2010. Our cash and liquidity needs have been impacted by the level, variability and timing of our customers’ worldwide vehicle production and other factors outside of our control.
The financial and economic environment has also made it difficult in the short-term to accomplish our goal of becoming a commercial vehicle and industrial business and has left us with servicing the cash outflows of certain of our light vehicle businesses, which have been substantial. In addition, our high levels of fixed costs can make it difficult to adjust our cost base to the extent necessary, or to make such adjustments on a timely basis, and the continued volume declines can result in non-cash impairment charges as the value of certain long-lived assets is reduced. As a result, our financial condition and results of operations have been and would be expected to continue to be adversely affected during periods of prolonged declining production and sales volumes in the commercial and automotive vehicle markets.
The negative impact on our financial condition and results of operations from continued volume declines could also have negative effects on our liquidity. If cash flows are not available from our operations, we may be required to rely on the banking and credit markets to meet our financial commitments and short-term liquidity needs; however, we cannot predict whether that funding will be available or will be available on commercially reasonable terms. In addition, as a consequence of reduced sales, levels of receivables decline, which leads to a decline in funding available under our U.S. receivables facility or under our European factoring arrangements.
We operate in an industry that is cyclical and that has periodically experienced significant year-to-year fluctuations in demand for vehicles; we also experience seasonal variations in demand for our products.
The industries in which we operate have been characterized historically by periodic fluctuations in overall demand for medium- and heavy-duty trucks, passenger cars and other vehicles for which we supply products, resulting in corresponding fluctuations in demand for our products. The length and timing of the cyclical nature of the vehicle industry cannot be predicted with certainty.
Production and sales of the vehicles for which we supply products generally depend on economic conditions and a variety of other factors that are outside our control, including customer spending and preferences, labor relations and regulatory requirements. In particular, demand for our Commercial Truck segment products can be affected by a pre-buy before the effective date of new regulatory requirements, such as changes in emissions standards. Historically, implementation of new, more stringent, emissions standards (like the kind that is scheduled for 2010 in the U.S.), has increased heavy-duty truck demand in the U.S. market prior to the effective date of the new regulations, and correspondingly decreased this demand after the new standards are implemented. However, it is uncertain as to whether this trend will continue and any expected increase in the heavy-duty truck demand prior to the effective date of new emissions standards may be offset by the current instability in the financial markets and resulting economic contraction in the U.S. and worldwide markets.
Sales from the aftermarket portion of our Core Business depend on overall levels of truck ton miles and gross domestic product (GDP) and may be influenced by times of slower economic growth or economic contraction based on the average age of commercial truck fleets.
15
We may also experience seasonal variations in the demand for our LVS and other products to the extent that vehicle production fluctuates. Historically, for our Core Business (other than the aftermarket) and LVS, demand has been somewhat lower in the quarters ended September 30 and December 31, when OEM plants may close during model changeovers and vacation and holiday periods.
We may be at risk in an upturn of not being able to meet demand.
In the anticipated upturn of the cyclical cycle when demand increases from what has recently been a historical low for production, we may have difficulty in meeting this demand if it occurs rapidly or is extreme. This difficulty may include not having sufficient manpower or working capital to meet the needs of our customers or relying on other suppliers who may not be able to respond quickly to a changed environment when demand increases rapidly.
Disruptions in the financial markets are adversely impacting the availability and cost of credit which could negatively affect our business.
Disruptions in the financial markets, including the bankruptcy, insolvency or restructuring of certain financial institutions, and the lack of liquidity generally continue to impact the availability and cost of incremental credit for many companies and may adversely affect the availability of credit already arranged. These disruptions also continue to adversely affect the U.S. and world economy, further negatively impacting consumer spending patterns in the transportation and industrial sectors. In addition, as our customers and suppliers respond to rapidly changing consumer preferences, they may require access to additional capital. If that capital is not available or its cost is prohibitively high, their business would be negatively impacted which could result in further restructuring or even reorganization under bankruptcy laws. Any such negative impact, in turn, could negatively affect our business either through loss of sales to any of our customers so affected or through inability to meet our commitments (or inability to meet them without excess expense) because of loss of supplies from any of our suppliers so affected. There are no assurances that government responses to these disruptions will restore consumer confidence or improve the liquidity of the financial markets.
In addition, disruptions in the capital and credit markets, as have been experienced during 2008 and 2009, could adversely affect our ability to draw on our revolving credit facility. Our access to funds under that credit facility is dependent on the ability of the banks that are parties to the facility to meet their funding commitments. Those banks may not be able to meet their funding commitments to us if they experience shortages of capital and liquidity or if they experience excessive volumes of borrowing requests from ArvinMeritor and other borrowers within a short period of time. Due to the bankruptcy of Lehman Brothers, for example, $34 million of the commitments on our revolving credit facility are unavailable. Longer term disruptions in the capital and credit markets as a result of uncertainty, changing or increased regulation, reduced alternatives, or failures of significant financial institutions could adversely affect our access to liquidity needed for our business. Any disruption could require us to take measures to conserve cash until the markets stabilize or until alternative credit arrangements or other funding for our business needs can be arranged.
Continued fluctuation in the prices of raw materials and transportation costs has adversely affected our business and, together with other factors, will continue to pose challenges to our financial results.
Prices of raw materials, primarily steel and oil, for our manufacturing needs and costs of transportation continued to increase sharply and to have a negative impact on our operating income in fiscal year 2007 and 2008. In 2008, we pursued recovery of, in some cases, monthly increases in such costs through surcharges or other pricing arrangements with our entire affected customer base in order to mitigate the impact on our operating margins. The price of steel stabilized during fiscal year 2009. However, there was a delayed effect of the decrease, and the price of steel continues to challenge our industry. If we are unable to pass price increases on to our customer base or otherwise mitigate the costs, our operating income could continue to be adversely affected.
Raw material price fluctuation, together with the volatility of the commodity markets will continue to pose challenges to our financial results.
We depend on large OEM customers, and loss of sales to these customers could have an adverse impact on our business.
We are dependent upon large OEM customers with substantial bargaining power with respect to price and other commercial terms in our Core Business as well as in LVS. Loss of all or a substantial portion of sales to any of our large volume customers for whatever reason (including, but not limited to, loss of market share by these customers, loss of contracts, insolvency of such customers, reduced or delayed customer requirements, plant shutdowns, strikes or other work stoppages affecting production by such customers), or continued reduction of prices to these customers, could have a significant adverse effect on our financial results. There can be no assurance that we will not lose all or a portion of sales to our large volume customers, or that we will be able to offset continued reduction of prices to these customers with reductions in our costs.
During fiscal year 2009, sales to AB Volvo and Navistar International Corporation represented approximately 15 percent and 10 percent of our sales from continuing operations. No other customer accounted for 10% or more of our total sales from continuing operations in fiscal year 2009. For fiscal year 2009, our three largest customers were AB Volvo, Navistar International and Volkswagen. The terms of several of our North American agreements with AB Volvo ended in May 2009 and we are currently in the process of negotiating new agreements. During this period, we are continuing to supply AB Volvo, with all parties generally operating under the terms that are expected to be set forth in the new agreements. A failure to enter into new agreements or the inclusion of less favorable terms in the new agreements could adversely affect our business and results of operations.
16
The level of our sales to large OEM customers, including the realization of future sales from awarded business, is inherently subject to a number of risks and uncertainties, including the number of vehicles that these OEM customers actually produce and sell. Several of our significant customers have major union contracts that expire periodically and are subject to renegotiation. Any strikes or other actions that affect our customers' production during this process would also affect our sales. Further, to the extent that the financial condition, including bankruptcy or market share of any of our largest customers deteriorates or their sales otherwise continue to decline, our financial position and results of operations could be adversely affected. In addition, our customers generally have the right to replace us with another supplier at any time for a variety of reasons. Accordingly, we may not in fact realize all of the future sales represented by our awarded business. Any failure to realize these sales could have a material adverse effect on our financial condition and results of operations.
Escalating price pressures from customers may adversely affect our business.
Pricing pressure by OEMs is a characteristic of the automotive and, to a lesser extent, commercial vehicle industry. Virtually all OEMs have aggressive price reduction initiatives and objectives each year with their suppliers, and such actions are expected to continue in the future. Accordingly, we must be able to reduce our operating costs in order to maintain our current margins. Price reductions have impacted our margins and may do so in the future. There can be no assurance that we will be able to avoid future customer price reductions or offset future customer price reductions through improved operating efficiencies, new manufacturing processes, sourcing alternatives or other cost reduction initiatives.
We operate in a highly competitive industry.
Each of ArvinMeritor's businesses operates in a highly competitive environment. We compete worldwide with a number of North American and international providers of components and systems, some of which are owned by or associated with some of our customers. Some of these competitors are larger and have greater financial resources or have established stronger relationships with significant customers. In addition, certain OEMs manufacture products for their own use that compete with the types of products we supply, and any future increase in this activity could displace ArvinMeritor’s sales.
Many companies in our industry have undertaken substantial changes in contractual obligations to current and former employees, primarily with respect to pensions and other postretirement benefits. The bankruptcy or insolvency of a major competitor could result in that company's eliminating or reducing some or all of these obligations, which could give that competitor a cost advantage over us.
Exchange rate fluctuations could adversely affect our financial condition and results of operations.
As a result of our substantial international operations, we are exposed to foreign currency risks that arise from our normal business operations, including in connection with our transactions that are denominated in foreign currencies. While we employ financial instruments to hedge certain of our foreign currency exchange risks relating to these transactions, our efforts to manage these risks may not be successful.
In addition, we translate sales and other results denominated in foreign currencies into U.S. dollars for purposes of our consolidated financial statements. As a result, appreciation of the U.S. dollar against these foreign currencies generally will have a negative impact on our reported revenues and operating income while depreciation of the U.S. dollar against these foreign currencies will generally have a positive effect on reported revenues and operating income. For fiscal years 2008 and 2007, our reported financial results have benefited from depreciation of the U.S. dollar against foreign currencies. During fiscal year 2009, our reported financial results have been adversely affected by appreciation of the U.S. dollar against foreign currencies. We do not hedge against our foreign currency exposure related to translations to U.S. dollars of our financial results denominated in foreign currencies.
A disruption in supply of raw materials or parts could impact our production and increase our costs.
Some of our significant suppliers have experienced a weakening financial condition in recent years that resulted, for some companies, in filing for protection under the bankruptcy laws. In addition, some of our significant suppliers are located in developing countries. We are dependent upon the ability of our suppliers to meet performance and quality specifications and delivery schedules. The inability of a supplier to meet these requirements, the loss of a significant supplier, or any labor issues or work stoppages at a significant supplier, could disrupt the supply of raw materials and parts to our facilities and could have an adverse effect on us.
17
Work stoppages or similar difficulties could significantly disrupt our operations.
A work stoppage at one or more of our manufacturing facilities could have material adverse effects on our business. In addition, if a significant customer were to experience a work stoppage, that customer could halt or limit purchases of our products, which could result in shutting down the related manufacturing facilities. Also, a significant disruption in the supply of a key component due to a work stoppage at one of our suppliers could result in shutting down manufacturing facilities, which could have a material adverse effect on our business.
Our international operations are subject to a number of risks.
We have a significant amount of facilities and operations outside the United States, including investments and joint ventures in developing countries. During fiscal 2009, approximately 61 percent of our sales were generated outside of the United States. Our strategy to grow in emerging markets may put us at risk due to the risks inherent in operating in such markets. In particular, we have grown, and intend as part of our strategy to continue to grow, in the emerging markets of China, India and Brazil. Our international operations are subject to a number of risks inherent in operating abroad, including, but not limited to:
- risks with respect to currency exchange rate
fluctuations (as more fully discussed above);
- local economic and political
conditions;
- disruptions of capital and trading
markets;
- possible terrorist attacks or acts of aggression
that could affect vehicle production or the availability of raw materials or
supplies;
- restrictive governmental actions (such as
restrictions on transfer of funds and trade protection measures, including
export duties and quotas and customs duties and tariffs);
- changes in legal or regulatory
requirements;
- import or export licensing
requirements;
- limitations on the repatriation of
funds;
- high inflationary conditions;
- difficulty in obtaining distribution and
support;
- nationalization;
- the laws and policies of the United States
affecting trade, foreign investment and loans;
- the ability to attract and retain qualified
personnel;
- tax laws; and
- labor disruptions.
There can be no assurance that these risks will not have a material adverse impact on our ability to increase or maintain our foreign sales or on our financial condition or results of operations.
Our sales in the military vehicle market are subject to continued appropriations by Congress and reduced funding for defense procurement could result in terminated or delayed contracts with our customers who sell to the U.S. Government and adversely affect our ability to maintain our sales and results of operations.
We have significant sales to U.S. Government contractors in the military vehicle market. Future sales from orders placed under our existing contracts with U.S. Government contractors are reliant on the continuing availability of Congressional appropriations. We and other companies that sell products to the U.S. defense establishment have benefited from an upward trend in overall U.S. defense spending in the last few years. Future defense budgets and appropriations for the military vehicles that our products supply may be affected by possibly differing priorities of the current Administration, including budgeting constraints stemming from the economic recovery and stimulus programs. Reductions in appropriations for these military vehicles, unless offset by other programs and opportunities, could adversely affect our ability to maintain our sales and results of operations.
18
Our working capital requirements may negatively affect our liquidity and capital resources.
Our working capital requirements can vary significantly, depending in part on the level, variability and timing of our customers' worldwide vehicle production and the payment terms with our customers and suppliers. Our cash flow has been affected by increased working capital requirements driven in part by our expansion efforts in South America and Asia-Pacific, higher receivable balances in non-US operations and lower accounts payable balances reflecting more normalized levels. If our working capital needs exceed our cash flows from operations, we would look to our cash balances and availability for borrowings under our borrowing arrangements to satisfy those needs, as well as potential sources of additional capital, which may not be available on satisfactory terms and in adequate amounts.
Our liquidity, including our access to capital markets and financing, could be constrained by limitations in the overall credit market, our credit ratings, our ability to comply with financial covenants in our debt instruments, and our suppliers suspending normal trade credit terms on our purchases.
Upon expiration of our current revolving credit facility in June 2011, we will require a new or renegotiated facility (which may be smaller and have less favorable terms than our current facility) or other financing arrangements. Our ability to access additional capital in the long-term will depend on availability of capital markets and pricing on commercially reasonable terms as well as our credit profile at the time we are seeking funds, and there is no guarantee that we will be able to access additional capital. In 2009, our credit rating decreased and we saw a significant decline in our stock price.
Standard & Poor's current corporate credit rating and senior secured credit rating for our company is CCC+ and B-, respectively. Moody's Investors Service corporate credit rating and senior secured credit rating for our company is Caa1 and B1, respectively. There are a number of factors, including our ability to achieve the intended benefits from restructuring and other strategic activities on a timely basis, that could result in further lowering of our credit ratings. The rating agencies' opinions about our creditworthiness may also be affected by their views of industry conditions generally, including their views concerning the financial condition of our major OEM customers. If the credit rating agencies perceive further weakening in the industry, they could lower our ratings. Further declines in our ratings could reduce our access to capital markets, further increase our borrowing costs and result in lower trading prices for our securities.
Our liquidity could also be adversely impacted if our suppliers were to suspend normal trade credit terms and require payment in advance or payment on delivery of purchases. If this were to occur, we would be dependent on other sources of financing to bridge the additional period between payment of our suppliers and receipt of payments from our customers.
A violation of the financial covenant in our senior secured credit facility could result in a default thereunder and could lead to an acceleration of our obligations under this facility and, potentially, other indebtedness.
Our ability to borrow under our existing financing arrangements depends on our compliance with covenants in the related agreements, and on our performance against covenants in our bank credit facility that require compliance with certain financial ratios as of the end of each fiscal quarter. To the extent that we are unable to maintain compliance with these requirements or to perform against the financial ratio covenants, due to one or more of the various risk factors discussed herein or otherwise, our ability to borrow, and our liquidity, would be adversely impacted.
Our availability under our revolving credit facility is subject to a senior secured debt to EBITDA ratio covenant, as defined in the agreement, which may limit our borrowings under the agreement as of each quarter end. Under the terms of this covenant, this senior secured debt to EBITDA ratio has to be no greater than 2.00 to 1 on the last day of the quarter. If an amendment or waiver is needed and not obtained, we would be in violation of that covenant and the lenders would have the right to accelerate the obligations upon the vote of the lenders holding at least 51% of outstanding loans thereunder. A default under the senior secured credit facility could also constitute a default under our outstanding convertible notes as well as our U.S. receivables facility and could result in the acceleration of these obligations. In addition, a default under our senior secured credit facility could result in a cross-default or the acceleration of our payment obligations under other financing agreements. If our obligations under our senior secured credit facility and other financing arrangements are accelerated as described above, our assets and cash flow may be insufficient to fully repay these obligations, and the lenders under our senior secured credit facility could institute foreclosure proceedings against our assets.
Our strategic initiatives may be unsuccessful, may take longer than anticipated, or may result in unanticipated costs.
The success and timing of any future divestitures (including, without limitation, our LVS Body Systems business) and acquisitions will depend on a variety of factors, many of which are not within our control. If we engage in acquisitions, we may finance these transactions by issuing additional debt or equity securities. The additional debt from any such acquisitions, if consummated, could increase our debt to capitalization ratio. In addition, the ultimate benefit of any acquisition would depend on our ability to successfully integrate the acquired entity or assets into our existing business and to achieve any projected synergies. There is no assurance that the total costs and total cash costs associated with any current and future restructuring will not exceed our estimates, or that we will be able to achieve the intended benefits of these restructurings.
19
We are exposed to environmental, health and safety and product liabilities.
Our business is subject to liabilities with respect to environmental and health and safety matters. In addition, we are required to comply with federal, state, local and foreign laws and regulations governing the protection of the environment and health and safety, and we could be held liable for damages arising out of human exposure to hazardous substances or other environmental or natural resource damages. Environmental health and safety laws and regulations are complex, change frequently and tend to be increasingly stringent. As a result, our future costs to comply with such laws may increase significantly. There is also an inherent risk of exposure to warranty and product liability claims, as well as product recalls, in the commercial and automotive vehicle industry if our products fail to perform to specifications or are alleged to cause property damage, injury or death.
With respect to environmental liabilities, we have been designated as a potentially responsible party at eight Superfund sites (excluding sites as to which our records disclose no involvement or as to which our liability has been finally determined). In addition to the Superfund sites, various other lawsuits, claims and proceedings have been asserted against us alleging violations of federal, state and local and foreign environmental protection requirements or seeking remediation of alleged environmental impairments. We have established reserves for these liabilities when we determine that the company has a probable obligation and we can reasonably estimate it, but the process of estimating environmental liabilities is complex and dependent on evolving physical and scientific data at the site, uncertainties as to remedies and technologies to be used, and the outcome of discussions with regulatory agencies. The actual amount of costs or damages for which we may be held responsible could materially exceed our current estimates because of these and other uncertainties which make it difficult to predict actual costs accurately. In future periods, new laws and regulations, changes in remediation plans, advances in technology and additional information about the ultimate clean-up remedy could significantly change our estimates and have a material impact on our financial position and results of operations. Management cannot assess the possible effect of compliance with future requirements.
We are exposed to asbestos litigation liability.
One of our subsidiaries, Maremont Corporation, manufactured friction products containing asbestos from 1953 through 1977, when it sold its friction product business. We acquired Maremont in 1986. Maremont and many other companies are defendants in suits brought by individuals claiming personal injuries as a result of exposure to asbestos-containing products. We, along with many other companies, have also been named as a defendant in lawsuits alleging personal injury as a result of exposure to asbestos used in certain components of products of Rockwell International Corporation (now Rockwell Automation, Inc., and referred to as "Rockwell"). Liability for these claims was transferred to us at the time of the spin-off of Rockwell’s automotive business to Meritor in 1997.
The uncertainties of asbestos claim litigation, the outcome of litigation with insurance companies regarding the scope of coverage and the long-term solvency of our insurance carriers make it difficult to predict accurately the ultimate resolution of asbestos claims. The possibility of adverse rulings or new legislation affecting asbestos claim litigation or the settlement process increases that uncertainty. Although we have established reserves to address asbestos liability and corresponding receivables for recoveries from our insurance carriers, if our assumptions with respect to the nature of pending and future claims, the cost to resolve claims and the amount of available insurance prove to be incorrect, the actual amount of liability for asbestos-related claims, and the effect on us, could differ materially from our current estimates and, therefore, could have a material impact on our financial position and results of operations.
We are exposed to the rising cost of pension and other postretirement benefits.
The commercial and automotive vehicle industry, like other industries, continues to be impacted by the rising cost of pension and other postretirement benefits. In estimating our expected obligations under our pension and postretirement benefit plans, we make certain assumptions as to economic and demographic factors, such as discount rates, investment returns and health care cost trends. If actual experience as to these factors is worse than our assumptions, our obligations could increase. Due to the worldwide recession and its effect on our pension liabilities and related investments, our pension plans are underfunded by $517 million as of September 30, 2009. As a result of this underfunding, we may be required to increase our contributions to these plans.
Impairment in the carrying value of long-lived assets and goodwill could negatively affect our operating results and financial condition.
We have a significant amount of long-lived assets and goodwill on our consolidated balance sheet. Under generally accepted accounting principles, long-lived assets, excluding goodwill, are required to be reviewed for impairment whenever adverse events or changes in circumstances indicate a possible impairment. If business conditions or other factors cause our operating results and cash flows to decline, we may be required to record non-cash impairment charges. Goodwill must be evaluated for impairment at least annually. If the carrying value of our reporting units exceeds their current fair value as determined based on the discounted future cash flows of the related business, the goodwill is considered impaired and is reduced to fair value via a non-cash charge to earnings. Events and conditions that could result in impairment in the value of our long-lived assets and goodwill include changes in the industries in which we operate, particularly the impact of the current downturn in the global economy, as well as competition and advances in technology, adverse changes in the regulatory environment, or other factors leading to reduction in expected long-term sales or operating results. If the value of long-lived assets or goodwill is impaired, our earnings and financial condition could be adversely affected.
20
The value of our deferred tax assets could become impaired, which could materially and adversely affect our results of operations and financial condition.
In accordance with the Financial Accounting Standards Board (FASB) Accounting Standards Codification (ASC) Topic 740 “Income Taxes,” each quarter we determine the probability of the realization of deferred tax assets, using significant judgments and estimates with respect to, among other things, historical operating results, expectations of future earnings and tax planning strategies. If we determine in the future that there is not sufficient positive evidence to support the valuation of these assets, due to the risk factors described herein or other factors, we may be required to adjust the valuation allowance to reduce our deferred tax assets. Such a reduction could result in material non-cash expenses in the period in which the valuation allowance is adjusted and could have a material adverse effect on our results of operations and financial condition.
Our overall effective tax rate is equal to our total tax expense as a percentage of our total earnings before tax. However, tax expenses and benefits are determined separately for each tax paying component (an individual entity) or group of entities that is consolidated for tax purposes in each jurisdiction. Losses in certain jurisdictions which have valuation allowances against their deferred tax assets provide no current financial statement tax benefit unless required under the intra-period allocation requirements of ASC Topic 740. As a result, changes in the mix of projected earnings between jurisdictions, among other factors, could have a significant impact on our overall effective tax rate.
Our unrecognized tax benefits recorded in accordance with FASB ASC Topic 740 could significantly change.
FASB ASC Topic 740, “Income Taxes,” defines the confidence level that a tax position must meet in order to be recognized in the financial statements. This topic requires that the tax effects of a position be recognized only if it is "more-likely-than-not" to be sustained based solely on its technical merits as of the reporting date. The more-likely-than-not threshold represents a positive assertion by management that a company is entitled to the economic benefits of a tax position. If a tax position is not considered more-likely-than-not to be sustained based solely on its technical merits, no benefits of the position are to be recognized. Moreover, the more-likely-than-not threshold must continue to be met in each reporting period to support continued recognition of a benefit. In the event that the more-likely-than-not threshold is not met, we would be required to change the relevant tax position which could have an adverse effect on our results of operations and financial condition.
Restriction on use of tax attributes from tax law “ownership change”
Section 382 of the U.S. Internal Revenue Code of 1986, as amended, limits the ability of a corporation that undergoes an “ownership change” to use its tax attributes, such as net operating losses and tax credits. In general, an “ownership change” occurs if five percent shareholders (applying certain look-through rules) of an issuer’s outstanding common stock, collectively, increase their ownership percentage by more than fifty percentage points within any three year period over such shareholders’ lowest percentage ownership during this period. If we were to issue new shares of stock, such new shares could contribute to such an “ownership change” under U.S. tax law. Moreover, not every event that could contribute to such an “ownership change” is within our control. If an “ownership change” under Section 382 were to occur, our ability to utilize tax attributes in the future may be limited.
Assertions against us or our customers relating to intellectual property rights could materially impact our business.
Our industry is characterized by companies that hold large numbers of patents and other intellectual property rights and that vigorously pursue, protect and enforce intellectual property rights. From time to time, third parties may assert against us and our customers and distributors their patent and other intellectual property rights to technologies that are important to our business.
21
Claims that our products or technology infringe third-party intellectual property rights, regardless of their merit or resolution, are frequently costly to defend or settle and divert the efforts and attention of our management and technical personnel. In addition, many of our supply agreements require us to indemnify our customers and distributors from third-party infringement claims, which have in the past and may in the future require that we defend those claims and might require that we pay damages in the case of adverse rulings. Claims of this sort also could harm our relationships with our customers and might deter future customers from doing business with us. We do not know whether we will prevail in these proceedings given the complex technical issues and inherent uncertainties in intellectual property litigation. If any pending or future proceedings result in an adverse outcome, we could be required to:
- cease the manufacture, use or sale of the
infringing products or technology;
- pay substantial damages for
infringement;
- expend significant resources to develop
non-infringing products or technology;
- license technology from the third-party claiming
infringement, which license may not be available on commercially reasonable
terms, or at all;
- enter into cross-licenses with our competitors,
which could weaken our overall intellectual property
portfolio;
- lose the opportunity to license our technology to
others or to collect royalty payments based upon successful protection and
assertion of our intellectual property against others;
- pay substantial damages to our customers or end
users to discontinue use or replace infringing technology with non-infringing
technology; or
- relinquish rights associated with one or more of our patent claims, if our claims are held invalid or otherwise unenforceable.
Any of the foregoing results could have a material adverse effect on our business, financial condition and results of operations.
We utilize a significant amount of intellectual property in our business. If we are unable to protect our intellectual property, our business could be adversely affected.
Our success depends in part upon our ability to protect our intellectual property. To accomplish this, we rely on a combination of intellectual property rights, including patents, trademarks and trade secrets, as well as customary contractual protections with our customers, distributors, employees and consultants, and through security measures to protect our trade secrets. We cannot guarantee that:
- any of our present or future patents will not
lapse or be invalidated, circumvented, challenged, abandoned or, in the case
of third-party patents licensed or sub-licensed to us, be licensed to
others;
- our intellectual property rights will provide
competitive advantages to us;
- rights previously granted by third parties to
intellectual property rights licensed or assigned to us, will not hamper our
ability to assert our intellectual property rights against potential
competitors or hinder the settlement of currently pending or future
disputes;
- any of our pending or future patent applications
will be issued or have the coverage originally sought;
- our intellectual property rights will be enforced
in jurisdictions where competition may be intense or where legal protection
may be weak; or
- any of the trademarks, trade secrets or other intellectual property rights that we presently employ in our business will not lapse or be invalidated, circumvented, challenged, abandoned or licensed to others.
In addition, we may not receive competitive advantages from the rights granted under our patents and other intellectual property rights. Our competitors may develop technologies that are similar or superior to our proprietary technologies, duplicate our proprietary technologies, or design around the patents we own or license. Our existing and future patents may be circumvented, blocked, licensed to others, or challenged as to inventorship, ownership, scope, validity or enforceability. Effective intellectual property protection may be unavailable or more limited in one or more relevant jurisdictions relative to those protections available in the United States, or may not be applied for in one or more relevant jurisdictions. If we pursue litigation to assert our intellectual property rights, an adverse decision in any of these legal actions could limit our ability to assert our intellectual property rights, limit the value of our technology or otherwise negatively impact our business, financial condition and results of operations.
22
We are a party to a number of patent and intellectual property license agreements. Some of these license agreements require us to make one-time or periodic payments. We may need to obtain additional licenses or renew existing license agreements in the future. We are unable to predict whether these license agreements can be obtained or renewed on acceptable terms.
Item 1B. Unresolved Staff Comments.
None.
Item 2. Properties.
At September 30, 2009, our operating segments and our majority owned and minority owned joint ventures had the following facilities in the United States, Europe, South America, Canada, Mexico, Australia, South Africa and the Asia/Pacific region. For purposes of these numbers, multiple facilities in one geographic location are counted as one facility.
| Engineering Facilities, | |||
| Sales Offices, | |||
| Manufacturing | Warehouses and | ||
| Facilities | Service Centers | ||
| Commercial Truck | 19 | 11 | |
| Industrial | 10 | 3 | |
| Aftermarket & Trailer | 10 | 11 | |
| LVS | 29 | 9 | |
| Other | 3 | 7 | |
| 71 | 41 |
These facilities had an aggregate floor space of approximately 15 million square feet, substantially all of which is in use. We owned approximately 71% and leased approximately 29% of this floor space. Substantially all of our owned domestic plants and equipment are subject to liens securing our obligations under our revolving credit facility with a group of banks (see Note 16 of the Notes to Consolidated Financial Statements under Item 8. Financial Statements and Supplementary Data). In the opinion of management, our properties have been well maintained, are in sound operating condition and contain all equipment and facilities necessary to operate at present levels.
A summary of floor space of these facilities at September 30, 2009, is as follows:
| Owned Facilities | Leased Facilities | ||||||||||||||||||||||
| Commercial | Aftermarket | Commercial | Aftermarket | ||||||||||||||||||||
| Location | LVS | Truck | & Trailers | Industrial | Other | LVS | Truck | & Trailers | Industrial | Other | Total | ||||||||||||
| United States | 266,050 | 1,237,763 | 432,037 | 1,013,528 | 630,756 | 292,850 | 487,723 | 470,327 | 7,500 | — | 4,838,534 | ||||||||||||
| Canada | 217,233 | 196,000 | — | — | 452,000 | — | — | 307,174 | — | — | 1,172,407 | ||||||||||||
| Europe | 611,732 | 2,185,581 | 656,661 | — | — | 824,662 | 92,141 | 112,826 | — | 30,165 | 4,513,768 | ||||||||||||
| Asia/Pacific | 232,625 | — | — | 470,805 | — | 352,985 | 21,284 | — | 797,201 | 3,175 | 1,878,075 | ||||||||||||
| Latin America | 15,855 | 1,605,400 | 38,913 | — | — | 45,213 | 400,000 | 33,207 | — | — | 2,138,588 | ||||||||||||
| Total | 1,343,495 | 5,224,744 | 1,127,611 | 1,484,333 | 1,082,756 | 1,515,710 | 1,001,148 | 923,534 | 804,701 | 33,340 | 14,541,372 | ||||||||||||
Item 3. Legal Proceedings
1. See Note 20 of the Notes to Consolidated Financial Statements under Item 8. Financial Statements and Supplementary Data for information with respect to three class action lawsuits filed against the company as a result of modifications made to its retiree medical benefits.
2. See Note 23 of the Notes to Consolidated Financial Statements under Item 8. Financial Statements and Supplementary Data for information with respect to litigation related to alleged asbestos-related liabilities.
3. See Item 1. Business, “Environmental Matters” for information relating to environmental proceedings.
4. On October 5, 2006, ZF Meritor LLC, a joint venture between an ArvinMeritor subsidiary and ZF Friedrichshafen AG, filed a lawsuit against Eaton Corporation in the United States District Court for the District of Delaware, alleging that Eaton had engaged in exclusionary, anticompetitive conduct in the markets for heavy-duty truck transmissions, in violation of the U.S. antitrust laws. The plaintiffs seek an injunction prohibiting Eaton from engaging in such anticompetitive conduct and monetary damages. On October 8, 2009, the jury found that Eaton engaged in exclusionary and anticompetitive conduct in the sale and marketing of heavy-duty truck transmissions. This ruling completed the initial phase of the trial in which the jury was asked to determine whether or not Eaton was liable for the alleged violations. Given the jury’s finding that Eaton did engage in anticompetitive conduct, the parties are expected to now proceed to the damages phase of the legal process through a separate trial. Eaton has indicated publicly that it intends to move to set aside the jury verdict and/or appeal the liability decision.
23
5. On March 31, 2008, S&E Quick Lube, a filter distributor, filed suit in U.S. District Court for the District of Connecticut alleging that twelve filter manufacturers, including a prior subsidiary of the company, engaged in a conspiracy to fix prices, rig bids and allocate U.S. customers for aftermarket automotive filters. This suit is a purported class action on behalf of direct purchasers of filters from the defendants. Several parallel purported class actions, including on behalf of indirect purchasers of filters, have been filed by other plaintiffs in a variety of jurisdictions in the United States and Canada. On April 16, 2009, the Attorney General of the State of Florida filed a complaint with the U.S. District Court for the Northern District of Illinois based on these same allegations. The company intends to vigorously defend the claims raised in all of these actions. The Antitrust Division of the U.S. Department of Justice (DOJ) is also investigating the allegations raised in these suits. The DOJ has issued subpoenas to certain employees of the defendants, which include the company. The company is fully cooperating with the investigation. The company is unable to estimate a range of exposure, if any, at this time.
6. Various other lawsuits, claims and proceedings have been or may be instituted or asserted against ArvinMeritor or our subsidiaries relating to the conduct of our business, including those pertaining to product liability, warranty or recall claims, intellectual property, safety and health, contract and employment matters. Although the outcome of litigation cannot be predicted with certainty and some lawsuits, claims or proceedings may be disposed of unfavorably to ArvinMeritor, management believes, after consulting with Vernon G. Baker, II, Esq., ArvinMeritor's General Counsel, that the disposition of matters that are pending will not have a material adverse effect on our business, financial condition or results of operations.
Item 4. Submission of Matters to a Vote of Security Holders.
There were no matters submitted to a vote of security holders during the fourth quarter of fiscal year 2009.
Item 4A. Executive Officers of the Registrant.
The name, age, positions and offices held with ArvinMeritor and principal occupations and employment during the past five years of each of our executive officers as of November 6, 2009, are as follows:
Charles G. McClure, Jr., 56 – Chairman of the Board, Chief Executive Officer and President since August 2004. Chief Executive Officer of Federal-Mogul Corporation (automotive component supplier) from July 2003 to July 2004; and President and Chief Operating Officer of Federal-Mogul Corporation from January 2001 to July 2003.
Vernon G. Baker, II, 56 – Senior Vice President and General Counsel since July 2000.
Timothy E. Bowes, 46 – Vice President and President, Industrial, since November 6, 2009; Vice President and Managing Director, Asia Pacific since 2008; Vice President, Sales, Marketing & Product Strategy from 2007 – 2008; and General Manager, Specialty Sales & Service from 2005 – 2007. Prior to that he was Vice President, Sales, Hilite International.
Jeffrey A. Craig, 49 – Senior Vice President and Chief Financial Officer since January 2009 and Acting Controller from May 2008 to January 2009. Senior Vice President and Controller from July 2007 to May 2008. Vice President and Controller of ArvinMeritor from May 2006 to July 2007; and President and Chief Executive Officer, Commercial Finance, of General Motors Acceptance Corporation (automotive and commercial finance, mortgage, real estate and insurance businesses) from 2001 to May 2006.
Linda M. Cummins, 62 - Senior Vice President, Communications, since July 2000.
James D. Donlon, III, 63 – Executive Vice President since May 2008. Executive Vice President and Chief Financial Officer from July 2007 to May 2008. Senior Vice President and Chief Financial Officer of ArvinMeritor from April 2005 to July 2007; Senior Vice President and Chief Financial Officer of Kmart Corporation (retailer) from January 2004 to March 2005; and Senior Vice President and Controller of the Chrysler Division of DaimlerChrysler AG (automotive) from 2001 to 2003.
Mary A. Lehmann, 50 – Senior Vice President, Strategic Initiatives, since July 2009 and Treasurer from July 2007 to July 2009. Vice President and Treasurer of ArvinMeritor from January 2006 to July 2007; Assistant Treasurer of ArvinMeritor from 2004 to January 2006; and Director, Affiliate Financing, of Ford Motor Company (automotive) from 2001 to 2004.
24
Joseph L. Mejaly, 46 – Vice President and President, Aftermarket & Trailer since November 6, 2009; Vice President and General Manager, Commercial Vehicle Aftermarket from 2005 – 2009; Director, Customer Support from 2001 – 2005.
Barbara G. Novak, 47 – Vice President and Secretary since January 2008 and appointed as an executive officer in January 2009. Senior Counsel, Securities of TRW Automotive Holdings Corp. (automotive) from 2002 to 2007.
Carsten J. Reinhardt, 42 – Senior Vice President and Chief Operating Officer since November 6, 2009, Senior Vice President and President, Commercial Vehicle Systems from September 2006 to November 2009. Chief Executive Officer and President of Detroit Diesel Corporation (a subsidiary of DaimlerChrysler AG) from March 2003 to September 2006; and General Manager and Vice President-Operations for Western Star Trucks (a subsidiary of DaimlerChrysler AG) from March 2001 to March 2003.
There are no family relationships, as defined in Item 401 of Regulation S-K, between any of the above executive officers and any director, executive officer or person nominated to become a director or executive officer. No officer of ArvinMeritor was selected pursuant to any arrangement or understanding between him or her and any person other than ArvinMeritor. All executive officers are elected annually.
PART II
Item 5. Market for Registrant’s Common Equity, Related Stockholder Matters and Issuer Purchases of Equity Securities
ArvinMeritor's common stock, par value $1 per share (“Common Stock”), is listed on the New York Stock Exchange (“NYSE”) and trades under the symbol "ARM." On November 2, 2009, there were 23,611 shareowners of record of ArvinMeritor's Common Stock.
The high and low sale prices per share of ArvinMeritor Common Stock for each quarter of fiscal years 2009 and 2008 were as follows:
| Fiscal Year 2009 | Fiscal Year 2008 | |||||||||||
| Quarter Ended | High | Low | High | Low | ||||||||
| December 31 | $ | 13.70 | $ | 2.21 | $ | 17.60 | $ | 9.17 | ||||
| March 31 | 3.99 | 0.32 | 14.24 | 9.08 | ||||||||
| June 30 | 4.42 | 0.65 | 17.40 | 12.11 | ||||||||
| September 30 | 9.29 | 3.14 | 18.11 | 9.99 | ||||||||
Quarterly cash dividends in the amount of $0.10 per share were declared and paid in each quarter of the fiscal year 2008 and in the first quarter of fiscal year 2009. This dividend was suspended in February of 2009. Our payment of cash dividends and the amount of the dividend are subject to review and change at the discretion of our Board of Directors.
See Item 12. Security Ownership of Certain Beneficial Owners and Management and Related Stockholder Matters for information on securities authorized for issuance under equity compensation plans.
Issuer repurchases
The independent trustee of our 401(k) plans purchases shares in the open market to fund investments by employees in our common stock, one of the investment options available under such plans, and any matching contributions in company stock we provide under certain of such plans. In addition, our stock incentive plans permit payment of an option exercise price by means of cashless exercise through a broker and permit the satisfaction of the minimum statutory tax obligations upon exercise of options and the vesting of restricted stock units through stock withholding. However, the company does not believe such purchases or transactions are issuer repurchases for the purposes of this Item 5 of this Report on Form 10-K. In addition, our stock incentive plans also permit the satisfaction of tax obligations upon the vesting of restricted stock through stock withholding. There were 9,531 shares so withheld in the fourth quarter of fiscal year 2009.
25
| (c) | (d) | |||||||
| (a) | Total Number of Shares | Maximum Number of | ||||||
| Total Number | (b) | Purchased as Part of | Shares that May Yet Be | |||||
| of Shares | Average Price | Publicly Announced | Purchased Under the | |||||
| Period | Purchases (1) | Paid Per Share | Plans or Programs | Plans or Programs | ||||
| 07/01/09 – 07/31/09 | 5,681 | $ | 5.20 | N/A | N/A | |||
| 08/01/09 – 08/31/09 | — | — | N/A | N/A | ||||
| 09/01/09 – 09/30/09 | 3,850 | $ | 8.94 | N/A | N/A | |||
| Total | 9,531 | $ | 6.71 | N/A | N/A | |||
| (1) |
Shares of restricted stock were withheld by ArvinMeritor, upon vesting of restricted stock, to satisfy tax withholding requirements. |
Shareowner Return Performance Presentation
The line graph below compares the cumulative total shareowner return on an investment in ArvinMeritor’s common stock against the cumulative total return of the S&P 500 and a peer group of companies for the period from September 30, 2004 to September 30, 2009, assuming a fixed investment of $100 at the respective closing prices on the last day of each fiscal year and reinvestment of all cash dividends.
Comparison of Total Return
Common Stock, S&P 500
Index1 and Peer Group Index2
COMPARISON OF 5 YEAR CUMULATIVE
TOTAL RETURN*
Among ArvinMeritor,
Inc., The S&P 500 Index
And A Peer Group
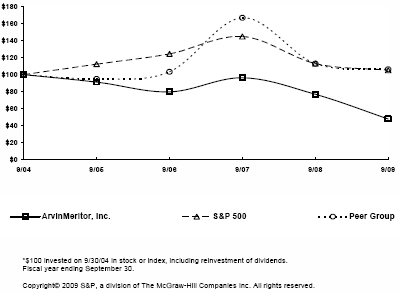
____________________
| 1 |
Standard & Poor’s 500 Market Index. | |
| 2 | We believe that a peer group of representative independent automotive suppliers of approximately comparable size and products to ArvinMeritor is appropriate for comparing shareowner return. The peer group consists of BorgWarner, Inc., Cummins Inc., Dana Holding Corp., Delphi Corporation, Eaton Corporation, Johnson Controls, Inc., Lear Corporation, Superior Industries International, Inc., Tenneco, Inc. and Visteon Corporation. This peer group is the same as the group utilized in the performance chart in the Annual Report on Form 10-K for the fiscal year ended September 30, 2008. |
26
The information included under the heading “Shareowner Return Performance Presentation” is not to be treated as “soliciting material” or as “filed” with the SEC, and is not incorporated by reference into any filing by the company under the Securities Act of 1933 or the Securities Exchange Act of 1934 that is made on, before or after the date of filing of this Annual Report on Form 10-K.
Item 6. Selected Financial Data.
The following sets forth selected consolidated financial data. The data should be read in conjunction with the information included under Item 7. Management’s Discussion and Analysis of Financial Condition and Results of Operations and Item 8. Financial Statements and Supplementary Data below.
| Year Ended September 30, | |||||||||||||||||||
| 2009 | 2008 | 2007 | 2006 | 2005 | |||||||||||||||
| SUMMARY OF OPERATIONS | |||||||||||||||||||
| Commercial Truck | $ | 1,566 | $ | 2,922 | $ | 2,621 | $ | 2,764 | $ | 2,641 | |||||||||
| Industrial | 888 | 1,117 | 854 | 697 | 582 | ||||||||||||||
| Aftermarket & Trailer | 954 | 1,183 | 1,090 | 1,092 | 1,106 | ||||||||||||||
| Light Vehicle Systems | 1,033 | 1,571 | 1,515 | 1,518 | 1,625 | ||||||||||||||
| Intersegment Sales | (333 | ) | (403 | ) | (360 | ) | (374 | ) | (357 | ) | |||||||||
| Total Continuing Operations | $ | 4,108 | $ | 6,390 | $ | 5,720 | $ | 5,697 | $ | 5,597 | |||||||||
| Operating Income (Loss) | $ | (290 | ) | $ | 135 | $ | (22 | ) | $ | 104 | $ | 111 | |||||||
| Income (Loss) Before Income Taxes | (361 | ) | 93 | (97 | ) | 6 | 15 | ||||||||||||
| Income (Loss) from Continuing Operations | $ | (1,077 | ) | $ | (115 | ) | $ | (93 | ) | $ | 70 | $ | 27 | ||||||
| Income (Loss) from Discontinued Operations | (135 | ) | 14 | (126 | ) | (245 | ) | (15 | ) | ||||||||||
| Net Income (Loss) | $ | (1,212 | ) | $ | (101 | ) | $ | (219 | ) | $ | (175 | ) | $ | 12 | |||||
| BASIC EARNINGS (LOSS) PER SHARE | |||||||||||||||||||
| Continuing Operations | $ | (14.86 | ) | $ | (1.60 | ) | $ | (1.32 | ) | $ | 1.01 | $ | 0.39 | ||||||
| Discontinued Operations | (1.86 | ) | 0.20 | (1.79 | ) | (3.53 | ) | (0.22 | ) | ||||||||||
| Basic Earnings (Loss) per Share | $ | (16.72 | ) | $ | (1.40 | ) | $ | (3.11 | ) | $ | (2.52 | ) | $ | 0.17 | |||||
| DILUTED EARNINGS (LOSS) PER SHARE | |||||||||||||||||||
| Continuing Operations | $ | (14.86 | ) | $ | (1.60 | ) | $ | (1.32 | ) | $ | 1.00 | $ | 0.39 | ||||||
| Discontinued Operations | (1.86 | ) | 0.20 | (1.79 | ) | (3.49 | ) | (0.22 | ) | ||||||||||
| Diluted Earnings (Loss) per Share | $ | (16.72 | ) | $ | (1.40 | ) | $ | (3.11 | ) | $ | (2.49 | ) | $ | 0.17 | |||||
| Cash Dividends per Share | $ | 0.10 | $ | 0.40 | $ | 0.40 | $ | 0.40 | $ | 0.40 | |||||||||
| FINANCIAL POSITION AT SEPTEMBER 30 | |||||||||||||||||||
| Total Assets | $ | 2,508 | $ | 4,674 | $ | 4,789 | $ | 5,508 | $ | 5,872 | |||||||||
| Short-term Debt | 97 | 240 | 18 | 56 | 136 | ||||||||||||||
| Long-term Debt | 1,080 | 1,063 | 1,130 | 1,174 | 1,436 | ||||||||||||||
Income (loss) from continuing operations in the selected financial data information presented above includes the following items specific to the period of occurrence (in millions):
| Year Ended September 30, | |||||||||||||||||||
| 2009 | 2008 | 2007 | 2006 | 2005 | |||||||||||||||
| Pretax items: | |||||||||||||||||||
| Restructuring costs | $ | (80 | ) | $ | (9 | ) | $ | (62 | ) | $ | (17 | ) | $ | (45 | ) | ||||
| Asset impairment charges | (223 | ) | — | — | — | — | |||||||||||||
| LVS separation costs | (9 | ) | (19 | ) | — | — | — | ||||||||||||
| Gain on divestitures of business | — | — | 1 | 14 | — | ||||||||||||||
| Environmental remediation charges | (1 | ) | (3 | ) | (2 | ) | (8 | ) | (7 | ) | |||||||||
| After tax items: | |||||||||||||||||||
| Non-cash charge on repatriated earnings | — | (137 | ) | — | — | — | |||||||||||||
| Deferred tax asset valuation allowance | (676 | ) | (46 | ) | — | — | (25 | ) | |||||||||||
27
Income (loss) from discontinued operations in the selected financial data information presented above includes the following items specific to the period of occurrence (in millions):
| Year Ended September 30, | ||||||||||||||||||||
| 2009 | 2008 | 2007 | 2006 | 2005 | ||||||||||||||||
| Pretax items: | ||||||||||||||||||||
| Gain (loss) on divestitures of businesses, net | $ | (10 | ) | $ | (16 | ) | $ | (200 | ) | $ | 28 | $ | 7 | |||||||
| Restructuring costs | (21 | ) | (11 | ) | (3 | ) | (16 | ) | (74 | ) | ||||||||||
| Long-lived assets and goodwill impairment (charges) reversals | (56 | ) | — | 12 | (332 | ) | (43 | ) | ||||||||||||
| Charge for indemnity obligation | (28 | ) | — | — | — | — | ||||||||||||||
Item 7. Management’s Discussion and Analysis of Financial Conditions and Results of Operations.
Overview
ArvinMeritor, Inc., headquartered in Troy, Michigan, is a premier global supplier of a broad range of integrated systems, modules and components to original equipment manufacturers (“OEMs”) and the aftermarket for the commercial vehicle, transportation and industrial sectors. The company serves commercial truck, trailer, off-highway, military, bus and coach and other industrial OEMs and certain aftermarkets, and light vehicle original equipment manufacturers. ArvinMeritor common stock is traded on the New York Stock Exchange under the ticker symbol ARM.
Fiscal year 2009 was extremely difficult for us and the industries in which we participate. We believe that the substantial uncertainty and significant deterioration in the worldwide credit markets, the global economic downturn and the current climate in the U.S. and other economies have impacted the demand for the products of our customers as highlighted in the production volumes summarized below. Many of our customers have experienced sharp declines in production and sales volumes, which started in November 2008 and have continued through September 2009 and are expected to continue at reduced levels in the near term with recovery varying by region. These decreases in production and sales volumes had a significant impact on our revenues and operating results in the fiscal year ended September 30, 2009 and will continue to negatively impact our revenue and operating results until production levels return to historically normal levels. Our business was adversely affected in fiscal year 2009 by decreased volumes in all major markets with most of the declines occurring in North America and Europe.
The following table reflects estimated commercial vehicle and automotive production volumes for selected original equipment (OE) markets for the fiscal year ended September 30, 2009 and 2008 based on available sources and management’s estimates.
| Year Ended September 30, | ||||||||||
| 2009 | 2008 | 2007 | 2006 | 2005 | ||||||
| Estimated Commercial Vehicle production (in thousands): | ||||||||||
| North America, Heavy-Duty Trucks | 128 | 194 | 246 | 352 | 324 | |||||
| North America, Medium-Duty Trucks | 74 | 122 | 176 | 216 | 208 | |||||
| United States and Canada, Trailers | 93 | 176 | 275 | 312 | 327 | |||||
| Western Europe, Heavy- and Medium-Duty Trucks | 247 | 562 | 480 | 439 | 421 | |||||
| South America, Heavy- and Medium- Duty Trucks | 118 | 161 | 127 | 107 | 112 | |||||
| Estimated Light Vehicle production (in millions): | ||||||||||
| North America | 8.5 | 13.7 | 15.1 | 15.7 | 15.6 | |||||
| South America | 3.4 | 4.0 | 3.3 | 3.0 | 2.7 | |||||
| Western Europe (including Czech Republic) | 12.1 | 15.6 | 16.5 | 16.4 | 16.4 | |||||
| Asia/Pacific | 25.8 | 29.6 | 26.7 | 24.8 | 22.7 | |||||
28
In addition, our business continues to address a number of challenging industry-wide issues including the following:
- Weakened financial condition of original
equipment manufacturers and suppliers;
- Disruptions in the financial markets and its
impact on the availability and cost of credit;
- Excess capacity;
- Consolidation and globalization of OEMs and
their suppliers;
- Fluctuating costs for steel and other raw
materials;
- Higher energy and transportation
costs;
- OE pricing pressures;
- Pension and retiree medical health care
costs; and
- Currency exchange rate volatility.
We continue to implement and execute our long-term profit improvement and cost reduction initiative called “Performance Plus”, which was launched in fiscal year 2007. In addition, we further responded to the weakness in global business conditions in fiscal year 2009 by aggressively lowering our ‘break-even’ point through comprehensive restructuring and cost-reduction initiatives as discussed below. We continue to focus on improving cash flow by maintaining tight controls on global inventory, pursuing working capital improvements, reducing capital spending and significantly reducing discretionary spending. These initiatives were crucial to our success in fiscal year 2009 in weathering the global recession and preparing for future economic recovery. During this recessionary period we were able to complete the divestitures of certain businesses as discussed below and execute the other actions needed to enable us to meet covenants in our senior secured credit facility, and thus retain our availability of that facility. In September 2009, in anticipation of the expiration of our existing U.S. accounts receivable securitization arrangement, we entered into a new, two-year U.S. receivables financing arrangement. We also renewed significant factoring lines. We intend to remain focused on ensuring access to adequate liquidity throughout this challenging business climate and to fund future growth.
While we have been unable to fully offset recent market declines, we are focused on actions to improve our market share and diversification strategies to help offset the decline. These strategies are also expected to position us well as markets recover. We expect the lower cost base that we have established through the above disciplined approach to cost reductions to serve us well not only through the current difficult environment but also during an economic recovery in the future.
Cost Reduction Initiatives and Restructuring Actions
Since October 2008, we have implemented a number of immediate restructuring and cost reduction initiatives aimed at mitigating current market conditions. These actions include:
- Temporary or permanent workforce reductions
of approximately 3,000 employees, including full-time, contract and temporary workers;
- Plant level furlough programs, including
government supported programs;
- Extended shutdowns at all
plants;
- Temporary pay reductions for salaried
employees, which were achieved through temporary base salary adjustments and/or curtailed production
schedules;
- Temporary suspension of the matching
contribution for the U.S. 401(k) plan;
- Temporary suspension of fiscal year 2009
merit increases for all employees; and
- Temporary reduction of Board of Directors annual compensation by 10 percent.
The majority of these actions have already been completed. We have recognized in our continuing operations approximately $44 million of restructuring costs in connection with these actions for severance and related benefits, of which $36 million was paid in fiscal year 2009.
In fiscal year 2009, our Core Business achieved an estimated $195 million in savings related to these significant actions. We estimate approximately $48 million of these savings are related to temporary cost reduction measures associated with the suspension of annual variable incentive compensation, 401(k) employer matching contributions and salary reductions. In addition, approximately $50 million of these savings are related to variable labor which would be expected to increase as market volumes recover.
As part of Performance Plus, in fiscal year 2009, we closed our commercial vehicle manufacturing facility in Tilbury, Ontario, Canada (Tilbury). We recognized restructuring costs of approximately $30 million in the second quarter of fiscal year 2009 associated with the Tilbury closure for estimated employee severance benefits, including pension termination benefits under the terms of the Tilbury retirement plans and certain asset impairment charges. We expect a significant portion of the cash payments associated with this closure to be incurred in fiscal years 2010 through 2012. In the third fiscal quarter of 2009, the company announced the closure of its commercial vehicle facility in Carrollton, Kentucky and recognized approximately $2 million of restructuring costs. This facility is expected to close in the first quarter of fiscal year 2010.
29
Divestiture Activity
After significant strategic review, we announced in 2008 our intention to separate our Commercial Vehicle Systems (CVS) and Light Vehicle Systems (LVS) businesses. We subsequently attempted to complete the separation through a spin-off of the LVS business via a tax-free distribution to ArvinMeritor stockholders. During fiscal years 2009 and 2008, we incurred approximately $19 million and $9 million of costs, respectively, associated with these spin-off related activities, which are included in selling, general and administrative expenses in the consolidated statement of operations included in the Consolidated Financial Statements under Item 1. Financial Statements and Supplementary Data. The unprecedented challenges in the credit markets, deterioration in the automotive markets and other factors prompted us to investigate other alternatives for the separation, including a potential sale of all or portions of the LVS business. In the second quarter of fiscal year 2009, we announced our intention to reorganize the LVS business into separate product lines consisting of Body Systems, Chassis and Wheels, with the intention to pursue exit strategies as market and other conditions support such actions. In the third quarter of fiscal year 2009, we completed (or entered into agreements to complete) the sale of most of the Chassis businesses, as discussed below. In September 2009, we completed the sale of the Wheels business, also discussed below. The results of operations and cash flows of these businesses are presented in discontinued operations in the consolidated statements of operations and consolidated statement of cash flows and prior periods have been recasted to reflect this presentation. The Body Systems business is included in our continuing operations. We are continuing to strategically evaluate all options with respect to divesting our Body Systems business, including a sale of the entire business, multiple sales of portions of the business, shut downs of portions of the business or a combination of partial sales and shut downs. We expect that the divestiture process will extend until the end of 2010 or beyond. There are significant risks, uncertainties and costs inherent in any options we may pursue, including the terms upon which any sale agreement with respect to any portion of the business may be entered into (including potential substantial costs) and the amount of any exit costs. See Item 1A. Risk Factors.
In September 2009, we completed the sale of the Wheels business to Iochpe-Maxion, S. A., a Brazilian producer of wheels and frames for commercial vehicles, railway freight cars and castings, and affiliates. The gross purchase price was $180 million. Net proceeds after taxes and adjustments for working capital and net debt were $166 million (net of cash on hand of $3 million). The agreement also requires certain true-up payments for working capital and other miscellaneous adjustments, on a post-closing basis.
In fiscal year 2009, with respect to the LVS Chassis businesses, we accomplished the following:
- completed the sale of our 51 percent interest
in Gabriel de Venezuela to the joint venture partner;
- completed the sale of our Gabriel Ride
Control Products North America business;
- entered into a binding letter of intent to sell our 57 percent interest in Meritor Suspension Systems Company (MSSC) to the joint venture partner, a subsidiary of Mitsubishi Steel Mfg. Co., LTD (MSM). We completed the sale of our interest in MSSC on October 30, 2009.
These transactions largely complete the divestiture of our Chassis businesses. The remaining Chassis businesses primarily represent our suspension module assembly business which is expected to run-off over the next two years as various vehicle programs come to a conclusion. Sales from our remaining Chassis businesses were approximately $106 million in fiscal year 2009.
Change of Reporting Segments
As a result of the Chassis and Wheels divestitures described above, LVS now consists primarily of our body systems’ business composed of roofs and doors products. In order to better reflect the importance of our remaining core CVS businesses and a much smaller LVS business and to reflect the manner in which management reviews information regarding our business, we have revised our reporting segments as follows:
- The Commercial Truck segment
supplies drivetrain systems and components, including axles drivelines and braking and suspension systems,
primarily for medium- and heavy-duty trucks in North America, South America and Europe;
- The Industrial segment supplies
drivetrain systems including axles, brakes and drivelines and suspension for off-highway, military, construction, bus
and coach, fire and emergency, and other industrial applications. This segment also includes all of our business
in Asia Pacific, including all on- and
off-highway activities.
- The Aftermarket & Trailer segment supplies axles, brakes, drivelines, suspension parts and other replacement and remanufactured parts, including transmissions, to commercial vehicle aftermarket customers. This segment also supplies a wide variety of undercarriage products and systems for trailer applications; and
30
- The LVS segment includes our Body Systems business, which supplies roof and door systems for passenger cars to OEMs, and our remaining Chassis businesses.
We refer to our three segments other than LVS as, collectively, our “Core Business”. All prior period amounts have been recasted to reflect our revised reporting segments.
Liquidity
Our cash and liquidity needs have been impacted by the level, variability and timing of our customers’ worldwide vehicle production and other factors outside of our control. In addition, although our long term strategy is to become primarily a commercial vehicle and industrial company, the financial and economic environment has made this difficult to accomplish in its entirety in the short term and has left us with servicing the cash outflows of certain of our light vehicle businesses, which have been substantial. The divestiture of several of our light vehicle Chassis businesses, in addition to restructuring actions and other cost reductions taken during the fiscal year, are expected to limit the cash outflow of our LVS businesses going forward. However the cash needs of the remaining LVS businesses could be significant while we continue to operate these businesses. In addition, potential cash costs to sell or shut down all or portions of our Body Systems business may be substantial dependent on the timing and specific actions to complete this process.
Cash flow in fiscal year 2009 was negatively affected by decreased earnings due to lower sales and will continue to be negatively impacted due to continued lowered production and the current volatility in the financial markets, which could affect certain of our customers or vendors. We saw our usage of the revolving credit facility throughout the first six months of the fiscal year increase significantly to meet working capital requirements, including reductions in accounts receivable factoring programs. However, stronger cash flow, improved regional cash efficiencies and the sale of certain LVS businesses allowed us to reduce usage of the revolver, including letters of credit, by $300 million at fiscal year end as compared to second quarter end. At September 30, 2009, we had $95 million in cash and cash equivalents and an undrawn amount of $611 million under the revolving credit facility. Our availability under the revolving credit facility is subject to a senior secured debt to EBITDA ratio covenant, as defined in the agreement, which will likely limit our borrowings under the agreement as of each quarter end. As long as we are in compliance with this covenant as of the quarter end, we have full availability under the revolving credit facility every other day during the quarter. We were in compliance with this covenant as of September 30, 2009.
Our future liquidity is subject to a number of factors, including access to adequate funding under our senior secured credit facility, vehicle production schedules and customer demand and access to other borrowing arrangements such as factoring or securitization facilities. Even taking into account these and other factors, and with the assumption that the current trends in the commercial vehicle and automotive industries continue, management expects to have sufficient liquidity to fund our operating requirements through the term of our existing revolving credit facility in June 2011.
Other significant factors that could affect our results and liquidity in fiscal year 2010 include:
- Volatility in financial markets around the
world;
- Timing and extent of recovery of the
production and sales volumes in commercial and light vehicle markets around the world;
- A significant further deterioration or slow
down in economic activity in the key markets we operate;
- Further lower volume of orders from key
customers;
- The financial strength of our suppliers and
customers, including potential bankruptcies;
- Higher than planned price reductions to our
customers;
- Volatility in price and availability of steel
and other commodities;
- Any unplanned extended shutdowns or
production interruptions by us, our customers or our
suppliers;
- Our ability to successfully complete the
separation of our light vehicle businesses from our commercial vehicle business, with respect to our Body Systems
business;
- The impact of our recent
divestitures;
- Additional restructuring actions and the
timing and recognition of restructuring charges;
- Higher than planned warranty expenses,
including the outcome of known or potential recall campaigns;
- Our ability to implement planned productivity
and cost reduction initiatives;
- Significant contract awards or losses of
existing contracts;
- The impact of currency fluctuations on sales and
operating income; and
- The impact of any new accounting rules.
31
NON-GAAP MEASURES
In addition to the results reported in accordance with accounting principles generally accepted in the United States (GAAP), we have provided information regarding “segment EBITDA”. Segment EBITDA is defined as income (loss) from continuing operations before interest, income taxes, depreciation and amortization and loss on sale of receivables. We use segment EBITDA as the primary basis to evaluate the performance of each of our reportable segments. For a reconciliation of segment EBITDA to income (loss) from continuing operations see “Results of Operations” below.
Management believes segment EBITDA is a meaningful measure of performance as it is commonly utilized by management and investors to analyze operating performance and entity valuation. Management, the investment community and banking institutions routinely use segment EBITDA, together with other measures, to measure operating performance in our industry. Further, management uses segment EBITDA for planning and forecasting future periods.
Segment EBITDA should not be considered a substitute for the reported results prepared in accordance with GAAP and should not be considered as an alternative to net income as an indicator of our operating performance or to cash flows as a measure of liquidity. Segment EBITDA, as determined and presented by the company, may not be comparable to related or similarly titled measures reported by other companies.
32
Results of Operations
The following is a summary of our financial results for the last three fiscal years.
| Year Ended September 30, | ||||||||||||
| 2009 | 2008 | 2007 | ||||||||||
| (in millions, except per share amounts) | ||||||||||||
| Sales: | ||||||||||||
| Commercial Truck | $ | 1,566 | $ | 2,922 | $ | 2,621 | ||||||
| Industrial | 888 | 1,117 | 854 | |||||||||
| Aftermarket & Trailer | 954 | 1,183 | 1,090 | |||||||||
| Light Vehicle Systems | 1,033 | 1,571 | 1,515 | |||||||||
| Intersegment Sales | (333 | ) | (403 | ) | (360 | ) | ||||||
| SALES | $ | 4,108 | $ | 6,390 | $ | 5,720 | ||||||
| SEGMENT EBITDA: | ||||||||||||
| Commercial Truck | $ | (98 | ) | $ | 117 | $ | 16 | |||||
| Industrial | 124 | 128 | 93 | |||||||||
| Aftermarket & Trailer | 88 | 110 | 113 | |||||||||
| Light Vehicle Systems | (281 | ) | 5 | (43 | ) | |||||||
| SEGMENT EBITDA | (167 | ) | 360 | 179 | ||||||||
| Unallocated legacy and corporate costs (1) | (29 | ) | (56 | ) | (56 | ) | ||||||
| Loss on sale of receivables | (7 | ) | (22 | ) | (9 | ) | ||||||
| Depreciation and amortization | (81 | ) | (120 | ) | (111 | ) | ||||||
| Interest expense, net | (86 | ) | (80 | ) | (109 | ) | ||||||
| Benefit (provision) for income taxes | (707 | ) | (197 | ) | 13 | |||||||
| INCOME (LOSS) FROM CONTINUING OPERATIONS | (1,077 | ) | (115 | ) | (93 | ) | ||||||
| INCOME (LOSS) FROM DISCONTINUED OPERATIONS, net of tax | (135 | ) | 14 | (126 | ) | |||||||
| NET LOSS | $ | (1,212 | ) | $ | (101 | ) | $ | (219 | ) | |||
| DILUTED EARNINGS (LOSS) PER SHARE | ||||||||||||
| Continuing operations | $ | (14.86 | ) | $ | (1.60 | ) | $ | (1.32 | ) | |||
| Discontinued operations | (1.86 | ) | 0.20 | (1.79 | ) | |||||||
| Diluted loss per share | $ | (16.72 | ) | $ | (1.40 | ) | $ | (3.11 | ) | |||
| DILUTED AVERAGE COMMON SHARES OUTSTANDING | 72.5 | 72.1 | 70.5 | |||||||||
| (1) |
Unallocated legacy and corporate costs represent items that are not directly related to our business segments. These costs primarily include pension and retiree medical costs associated with recently sold businesses and other legacy costs for environmental and product liability. Fiscal year 2009 and 2008 unallocated legacy and corporate costs include $9 million and $19 million of costs, respectively, associated with the previously planned spin-off of the LVS business. Also included in unallocated legacy and corporate costs for fiscal years 2008 and 2007 are corporate costs previously allocated to sold businesses of $15 million and $44 million, respectively. |
33
2009 Compared to 2008
Sales
The following table reflects total company and business segment sales for fiscal years 2009 and 2008. The reconciliation is intended to reflect the trend in business segment sales and to illustrate the impact that changes in foreign currency exchange rates, volumes and other factors had on sales (in millions). Business segment sales include intersegment sales.
| Dollar Change Due To | |||||||||||||||||||||||
| Dollar | % | Volume | |||||||||||||||||||||
| 2009 | 2008 | Change | Change | Currency | / Other | ||||||||||||||||||
| Sales: | |||||||||||||||||||||||
| Commercial Truck | $ | 1,566 | $ | 2,922 | $ | (1,356 | ) | (46 | )% | $ | (204 | ) | $ | (1,152 | ) | ||||||||
| Industrial | 888 | 1,117 | (229 | ) | (21 | )% | (16 | ) | (213 | ) | |||||||||||||
| Aftermarket & Trailer | 954 | 1,183 | (229 | ) | (19 | )% | (57 | ) | (172 | ) | |||||||||||||
| Light Vehicle Systems | 1,033 | 1,571 | (538 | ) | (34 | )% | (100 | ) | (438 | ) | |||||||||||||
| Intersegment Sales | (333 | ) | (403 | ) | 70 | 17 | % | 54 | 16 | ||||||||||||||
| TOTAL SALES | $ | 4,108 | $ | 6,390 | $ | (2,282 | ) | (36 | )% | $ | (323 | ) | $ | (1,959 | ) | ||||||||
Commercial Truck sales were $1,566 million in fiscal year 2009, down 46 percent from fiscal year 2008. The effect of foreign currency translation decreased sales by $204 million. Excluding the effects of foreign currency, sales decreased by $1,152 million or 39 percent, primarily due to significantly lower OE production volumes in substantially all of the markets in which we participate. European heavy- and medium-duty truck production volumes decreased 56 percent compared to the prior year. Production volumes in the North American Class 8 commercial vehicle truck markets were lower by 34 percent compared to the prior year. Production volumes in South America were lower by 27 percent compared to the prior year.
Industrial sales were $888 million in fiscal year 2009, down 21 percent from fiscal year 2008. The effect of foreign currency translation decreased sales by $16 million. The decrease in sales is primarily due to lower sales in the Asia- Pacific region, which decreased approximately 47 percent from the prior year, primarily in India.
Aftermarket & Trailer sales were $954 million in fiscal year 2009, down 19 percent from fiscal year 2008. The effect of foreign currency translation decreased sales by $57 million. The decrease in sales is primarily due to lower sales of products for trailer applications, which decreased approximately 59 percent from the prior year. Sales of our aftermarket products were only down approximately three percent as higher sales of military service parts and growth in our remanufacturing businesses partially offset the decline in our aftermarket replacement products.
Light Vehicle Systems sales were $1,033 million in fiscal year 2009, down from $1,571 million in fiscal year 2008. The effect of foreign currency translation decreased sales by $100 million. Excluding the impact of foreign currency translation, sales decreased by $438 million or 28 percent compared to the prior year. We believe that the substantial uncertainty and significant deterioration in the worldwide credit markets, the global economic downturn and the current climate in the U.S. and other economies impacted the demand for light vehicles in the fiscal year. As a result, light vehicle production in most regions has declined significantly compared to the prior year. We expect production volumes in North America and Western Europe to remain at historically low levels into fiscal year 2010.
Also contributing to the decrease in sales are lower pass-through sales, which decreased by $56 million in fiscal year 2009 compared to the prior year. Pass-through sales are products sold to our customers where we acquire certain components and assemble them into the final product. These pass-through sales carry minimal margins, as we have little engineering or manufacturing responsibility.
Cost of Sales and Gross Profit
Cost of sales primarily represents materials, labor and overhead production costs associated with the company’s products and production facilities. Cost of sales for the fiscal year ended September 30, 2009 was $3,804 million compared to $5,828 million in the prior year, representing a decrease of 35 percent. The decrease in costs of sales is primarily due to the significantly reduced sales volumes discussed above.
Total cost of sales were approximately 93 percent of sales for the twelve months ended September 30, 2009 compared to approximately 91 percent for the prior year. The increase on a percentage basis is primarily due to fixed production costs, such as depreciation and certain overhead costs, which do not decrease at the same rate as sales.
34
The following table summarizes significant factors contributing to the changes in costs of sales compared to the prior year (in millions):
| Cost of Sales | ||||
| Fiscal year ended September 30, 2008 | $ | 5,828 | ||
| Volumes and mix | (1,465 | ) | ||
| Foreign exchange | (369 | ) | ||
| Depreciation expense | (39 | ) | ||
| Research, development and engineering costs | (19 | ) | ||
| Other cost reductions, net | (132 | ) | ||
| Fiscal year ended September 30, 2009 | $ | 3,804 | ||
Changes in the components of cost of sales year over year are summarized as follows:
| Lower material costs | $ | (1,498 | ) | |
| Lower labor and overhead costs | (488 | ) | ||
| Other | (38 | ) | ||
| Total decrease in costs of sales | $ | (2,024 | ) |
Material costs represent the majority of our cost of sales and include raw materials, composed primarily of steel and purchased components. Material costs decreased by approximately $1.5 billion compared to the prior year, primarily as a result of lower sales volumes. Material costs for much of fiscal year 2009 were negatively impacted by higher average steel prices, partially offset by improvements in material performance compared to the prior year. Steel indexes saw a rapid increase beginning in the second quarter of fiscal year 2008 and remained at relatively higher levels through the first three quarters of fiscal year 2009. More recently, steel indexes have declined to normalized levels. Recovery practices with customers are generally consistent with index movements in steel prices.
Labor and overhead costs decreased by $488 million compared to the prior year. The decrease was primarily due to the lower sales volumes. Other factors favorably impacting labor and overhead costs are savings associated with the company’s restructuring actions, continuous improvement and rationalization of operations, salaried pay reductions as well as government assistance in certain European jurisdictions. Depreciation expense was lower by $39 million compared to the prior year primarily due to the non-cash asset impairment charges recorded in our LVS segment in the first quarter of fiscal year 2009.
As a result of the above, gross profit for the fiscal year ended September 30, 2009 was $304 million compared to $562 million in the same period last year. Gross margins declined to 7 percent for the fiscal year ended September 30, 2009 compared to 9 percent last year.
Other Income Statement Items
Selling, general and administrative expenses for fiscal years 2009 and 2008 are summarized as follows (in millions):
| 2009 | 2008 | Increase (Decrease) | ||||||||||||||||||
| SG&A | Amount | % of sales | Amount | % of sales | ||||||||||||||||
| LVS separation costs | $ | (9 | ) | (0.2 | )% | $ | (19 | ) | (0.3 | )% | $ | (10 | ) | (0.1)pts | ||||||
| Loss on sale of receivables | (7 | ) | (0.2 | )% | (22 | ) | (0.3 | )% | (15 | ) | (0.1)pts | |||||||||
| Short- and long-term variable compensation | 10 | 0.2 | % | (51 | ) | (0.8 | )% | (61 | ) | (1.0)pts | ||||||||||
| All other SG&A | (284 | ) | (6.9 | )% | (323 | ) | (5.1 | )% | (39 | ) | 1.8pts | |||||||||
| Total SG&A | $ | (290 | ) | (7.1 | )% | $ | (415 | ) | (6.5 | )% | $ | (125 | ) | 0.6pts | ||||||
LVS separation costs are third-party transaction costs incurred in connection with the previously planned spin-off of the LVS business. Loss on sale of receivables decreased as the amount of receivables we sold during the current fiscal year were significantly lower than the prior year due to a decrease in our sales. Based on the current year financial results, we have eliminated substantially all variable incentive compensation pay for the current fiscal year. All other SG&A represents normal selling, general and administrative expenses. The decrease in all other SG&A compared to the prior year is a result of savings associated with various restructuring and other cost reduction initiatives, including reduced discretionary spending, salaried payroll reductions, suspension of matching contribution to the 401(k) plan and significant headcount reductions.
35
Asset and goodwill impairment charges for fiscal year 2009 were $153 million and $70 million, respectively. The non-cash impairment charges were recorded in the first quarter of fiscal year 2009 and primarily relate to our LVS segment. In the first fiscal quarter, management determined that certain asset impairment reviews were required due to declines in overall economic conditions, including significant reductions in current and forecasted production volumes for light and commercial vehicles.
Operating loss for fiscal year 2009 was $290 million, compared to operating income of $135 million in fiscal year 2008. The decrease in operating income in fiscal year 2009 is due to $223 million of asset impairment charges and $80 million of restructuring costs ($9 million in the prior year) recognized during fiscal year 2009 as well as the significant decrease in sales volumes during the current year compared to prior year.
Equity in earnings of affiliates was $15 million in fiscal year 2009, compared to $38 million in the prior year. The decrease is due to lower earnings primarily from our commercial vehicle affiliates in Brazil, the United States and India. Profitability of these joint ventures was impacted by lower commercial vehicle production volumes in each of the affiliate’s respective regions.
Interest expense, net was $86 million and $80 million in fiscal years 2009 and 2008, respectively. Unfavorably impacting interest expense in fiscal year 2009 were higher borrowings under our revolving credit facility. During the current fiscal year, we borrowed, on average, significantly higher amounts from our revolving credit facility to fund our operations compared to the prior year. We had $28 million outstanding on our revolving credit facility at September 30, 2009. There was no balance outstanding at September 30, 2008. Included in interest expense, net for the prior year were charges of $3 million related to a debt extinguishment in the first quarter of fiscal year 2008. These charges included legal and other professional fees, unamortized debt issuance costs and premiums paid to repurchase and pay down debt.
The provision for income taxes was $707 million in fiscal year 2009 compared to $197 million in fiscal year 2008. The current year tax provision includes non-cash income tax charges of $676 million related to establishing valuation allowances on certain previously recognized deferred tax assets, primarily in the U.S. and France, as well as other countries. Valuation allowances will generally be required on an ongoing basis in these countries until the company can establish historical and projected earnings in these tax jurisdictions to support recognition of tax assets. For countries with ongoing valuation allowances, we are unable to recognize any income tax benefit associated with fiscal year 2009. As a result, income tax expense recognized in fiscal year 2009 is primarily associated with taxable income in jurisdictions in which we have not previously recorded valuation allowances against deferred tax assets. Accordingly ongoing effective income tax rate will continue to be highly volatile depending on our mix of earnings.
The prior year tax provision was impacted by non-cash income tax charges of $137 million related to the repatriation of certain foreign subsidiary earnings in the U.S. and $46 million related to recording valuation allowances on certain foreign deferred tax assets.
Loss from continuing operations for fiscal year 2009 was $1,077 million, or $14.86 per diluted share, compared to $115 million, or $1.60 per diluted share in fiscal year 2008. The reasons for the significant loss in the current year are discussed above.
Loss from discontinued operations for fiscal year 2009 was $135 million, compared to income of $14 million in the prior year. Significant items included in results from discontinued operations in fiscal year 2009 and 2008 include the following:
| Year Ended September | ||||||||
| 30, | ||||||||
| 2009 | 2008 | |||||||
| Net loss on sale of businesses | $ | (10 | ) | $ | (16 | ) | ||
| Asset impairment charges | (56 | ) | — | |||||
| Charge for indemnity obligation | (28 | ) | — | |||||
| Restructuring costs | (21 | ) | (11 | ) | ||||
| Operating income (loss), net | (2 | ) | 57 | |||||
| Income (loss) before income taxes | (117 | ) | 30 | |||||
| Minority interest | (3 | ) | (4 | ) | ||||
| Provision for income taxes | (15 | ) | (12 | ) | ||||
| Income (loss) from discontinued operations | $ | (135 | ) | $ | 14 | |||
36
Net loss on sale of businesses: During fiscal year 2009 we sold our LVS Wheels business and recognized a $50 million pre-tax gain on the sale. Also in fiscal year 2009, we sold our 51 percent interest in Gabriel de Venezuela and our Gabriel North America Ride Control business. We recognized pre-tax losses on these sales of $23 million and $42 million, respectively. In fiscal year 2009 and 2008 we recorded approximately $5 million of pre-tax income and $16 million of additional pre-tax costs, respectively, primarily associated with the sale of our Emissions Technologies (ET) and Light Vehicle Aftermarket (LVA) businesses, including final adjustments related to changes in estimates for certain assets and liabilities.
Asset impairment charges: During fiscal year 2009 we recognized pre-tax non-cash impairment charges of $56 million associated with certain long-lived assets of the light vehicle Chassis businesses included in discontinued operations.
Charge for indemnity obligation: In December 2005, we guaranteed a third party’s obligation to reimburse another party for payment of health and prescription drug benefits to a group of retired employees. The retirees were former employees of a wholly-owned subsidiary of ArvinMeritor prior to it being acquired by the company. The wholly-owned subsidiary, which was part of our LVA business, was sold by us in fiscal year 2006. Prior to May 2009, except as set forth hereinafter, the third party met its obligations to reimburse the other party. In May 2009, the third party filed for bankruptcy protection under Chapter 11 of the U.S. Bankruptcy Code requiring us to recognize our obligations under the guarantee. Accordingly, we recorded a $28 million liability in the third quarter of fiscal year 2009, of which approximately $6 million relates to claims not reimbursed by the third party prior to its filing for bankruptcy protection, and $22 million relates to our best estimate of the future obligation under the guarantee.
Restructuring costs: During fiscal year 2009 we recognized $21 million of restructuring costs primarily associated with the closure of the coil spring operations in Milton, Ontario, Canada (Milton), which is part of MSSC. These costs primarily relate to employee severance and pension termination benefits. Restructuring charges in fiscal year 2008 primarily relate to employee severance benefits associated with certain plant closures.
Segment EBITDA and EBITDA Margins
The following table reflects segment EBITDA and EBITDA margins for fiscal years 2009 and 2008 (dollars in millions).
| Segment EBITDA | Segment EBITDA Margins | |||||||||||||||||||||
| 2009 | 2008 | $ Change | % Change | 2009 | 2008 | Change | ||||||||||||||||
| Commercial Truck | $ | (98 | ) | $ | 117 | $ | (215 | ) | (184 | )% | (6.3 | )% | 4.0 | % | (10.3)pts | |||||||
| Industrial | 124 | 128 | (4 | ) | (3 | )% | 14.0 | % | 11.5 | % | 2.5pts | |||||||||||
| Aftermarket & Trailer | 88 | 110 | (22 | ) | (20 | )% | 9.2 | % | 9.3 | % | (0.1)pts | |||||||||||
| LVS | (281 | ) | 5 | (286 | ) | (5720 | )% | (27.2 | )% | 0.3 | % | (27.5)pts | ||||||||||
| Segment EBITDA | $ | (167 | ) | $ | 360 | $ | (527 | ) | (146 | )% | (4.1 | )% | 5.6 | % | (9.7)pts | |||||||
Significant items impacting year over year segment EBITDA include the following:
| Commercial | Aftermarket | |||||||||||||||||||
| Truck | Industrial | & Trailer | LVS | TOTAL | ||||||||||||||||
| Segment EBITDA–Year ended September 30, 2008 | $ | 117 | $ | 128 | $ | 110 | $ | 5 | $ | 360 | ||||||||||
| Asset impairment charges | (8 | ) | — | — | (209 | ) | (217 | ) | ||||||||||||
| Increased restructuring costs | (53 | ) | (2 | ) | (1 | ) | (10 | ) | (66 | ) | ||||||||||
| Lower earnings from unconsolidated affiliates | (15 | ) | (4 | ) | (3 | ) | (1 | ) | (23 | ) | ||||||||||
| Lower (higher) warranty costs | 16 | 1 | 7 | (11 | ) | 13 | ||||||||||||||
| Lower pension and retiree medical costs | 14 | 3 | 4 | 4 | 25 | |||||||||||||||
| LVS stand-alone costs | — | — | — | (9 | ) | (9 | ) | |||||||||||||
| Prior year benefit for change in employee vacation policy | (7 | ) | (1 | ) | (2 | ) | (2 | ) | (12 | ) | ||||||||||
| Prior year change for contingency reserve | — | — | — | 14 | 14 | |||||||||||||||
| Volume, performance and other, net of cost reductions | (162 | ) | (1 | ) | (27 | ) | (62 | ) | (252 | ) | ||||||||||
| Segment EBITDA – Year ended September 30, 2009 | $ | (98 | ) | $ | 124 | $ | 88 | $ | (281 | ) | $ | (167 | ) | |||||||
37
Restructuring costs included in our business segment results during fiscal years 2009 and 2008 are as follows (in millions):
| Commercial | Aftermarket | ||||||||||||||||||||||||||||||||
| Truck | Industrial | & Trailer | LVS | Total | |||||||||||||||||||||||||||||
| 2009 | 2008 | 2009 | 2008 | 2009 | 2008 | 2009 | 2008 | 2009 | 2008 | ||||||||||||||||||||||||
| Performance Plus actions | $ | 32 | $ | — | $ | — | $ | — | $ | — | $ | — | $ | 4 | $ | 12 | $ | 36 | $ | 12 | |||||||||||||
| Fiscal year 2009 actions (reduction in workforce) | 20 | — | 2 | — | 1 | — | 15 | — | 38 | — | |||||||||||||||||||||||
| Total | 52 | — | 2 | — | 1 | — | 19 | 12 | 74 | 12 | |||||||||||||||||||||||
| Adjustments and reversals | — | (1 | ) | — | — | — | — | — | (3 | ) | — | (4 | ) | ||||||||||||||||||||
| Total restructuring costs (1) | $ | 52 | $ | (1 | ) | $ | 2 | $ | — | $ | 1 | $ | — | $ | 19 | $ | 9 | $ | 74 | $ | 8 | ||||||||||||
| (1) | Total segment restructuring costs do not include those recorded in unallocated corporate costs. These costs were $6 million in fiscal year 2009 and $1 million in fiscal year 2008, primarily related to employee termination benefits. |
Commercial Truck EBITDA was negative $98 million in fiscal year 2009, down $215 million compared to the prior year. The impact of lower commercial truck production volumes in all regions adversely impacted EBITDA in fiscal year 2009. Improvements in material and manufacturing performance partially offset the decrease in EBITDA resulting from lower commercial truck production volumes. Included in EBITDA for fiscal year 2009 are restructuring costs of $52 million. Total restructuring costs include $31 million for estimated employee severance benefits, $17 million primarily related to pension termination benefits and $4 million for asset impairment charges. Charges were primarily associated with the closure of our brakes plant in Tilbury, Canada as well as reductions in force implemented globally in fiscal year 2009. Separately, EBITDA results for the current year include $8 million of asset impairment charges associated with obsolete production equipment resulting from reduced production of our Carrollton, Tennessee facility.
Industrial EBITDA was $124 million in fiscal year 2009, down $4 million compared to the prior year. Despite a decrease in sales in our Industrial segment of 21 percent, EBITDA margin increased to 14.0 percent from 11.5 percent a year ago. The increase in EBITDA margin is primarily due to improved military sales.
Aftermarket & Trailer EBITDA was $88 million in fiscal year 2009, down $22 million compared to the prior year. EBITDA margin decreased to 9.2 percent from 9.3 percent a year ago. The impact on EBITDA of significantly lower sales of products for trailer applications was substantially offset by higher sales of military service parts.
LVS EBITDA was negative $281 million in fiscal year 2009, compared to EBITDA of $5 million in the prior year. Included in EBITDA in the current fiscal year are non-cash impairment charges of $209 million, of which $139 million relates to certain fixed assets and $70 million relates to goodwill. In the first quarter of fiscal year 2009, management determined an impairment review of goodwill and certain long-lived assets was required due to recent declines in overall economic conditions including tightening credit markets and significant reductions in current and forecasted production volumes for light vehicles. These events contributed to a significant decline in the fair value of our LVS business and related long-lived assets.
The impact of lower light vehicle production volumes in all regions along with higher material costs, primarily steel, also significantly impacted LVS EBITDA. Included in EBITDA for fiscal year 2009 are restructuring costs of $19 million, compared to $9 million in the prior year. Restructuring costs for fiscal year 2009 primarily relate to reductions in force actions implemented globally. The reductions in force primarily related to the elimination of the LVS corporate divisional structure. LVS’s segment EBITDA was also unfavorably impacted in fiscal year 2009 by $9 million of costs incurred to prepare LVS to be a stand alone business. These costs were related to certain information technology investments and headcount and were incurred in the first six months of the fiscal year 2009. The prior year segment EBITDA included a $14 million charge related to recording an additional contingency reserve for a legal and commercial dispute with a customer and a favorable impact of $2 million related to a change in our employee vacation policy.
38
2008 Compared to 2007
Sales
The following table reflects total company and geographical business segment sales for fiscal years 2008 and 2007. The reconciliation is intended to reflect the trend in business segment sales and to illustrate the impact that changes in foreign currency exchange rates, volumes and other factors had on sales (in millions). Business segment sales include intersegment sales.
| Dollar Change Due To | |||||||||||||||||||||||
| Dollar | % | Volume | |||||||||||||||||||||
| 2008 | 2007 | Change | Change | Currency | / Other | ||||||||||||||||||
| Sales: | |||||||||||||||||||||||
| Commercial Truck | $ | 2,922 | $ | 2,621 | $ | 301 | 11.5 | % | $ | 261 | $ | 40 | |||||||||||
| Industrial | 1,117 | 854 | 263 | 30.8 | % | 41 | 222 | ||||||||||||||||
| Aftermarket & Trailer | 1,183 | 1,090 | 93 | 8.5 | % | 53 | 40 | ||||||||||||||||
| Light Vehicle Systems | 1,571 | 1,515 | 56 | 3.7 | % | 196 | (140 | ) | |||||||||||||||
| Intersegment Sales | (403 | ) | (360 | ) | (43 | ) | (11.9 | )% | (72 | ) | 29 | ||||||||||||
| TOTAL SALES | $ | 6,390 | $ | 5,720 | $ | 670 | 11.7 | % | $ | 479 | $ | 191 | |||||||||||
Commercial Truck sales were $2,922 million in fiscal year 2008, up 12 percent from fiscal year 2007. The effect of foreign currency translation increased sales by $261 million. Higher sales reflect strong heavy- and medium-duty truck markets in all regions except North America. Volumes in the North American heavy-duty commercial vehicle truck markets (commonly referred to as Class 8) were lower in fiscal year 2008 primarily due to pre-buy activity during the first quarter of fiscal year 2007 associated with the adoption of new emissions standards in calendar year 2007 and general economic conditions currently affecting truck tonnage volume. Compared to fiscal year 2007, production volumes in North America for Class 8 trucks decreased approximately 22 percent. Continued sales strength in Europe throughout fiscal year 2008 reflected strong heavy- and medium-duty truck volumes in this region. Western European truck volumes increased 17 percent versus 2007. South America truck volumes increased during fiscal year 2008 by 24 percent.
Industrial sales were $1,117 million in fiscal year 2008, up 31 percent from fiscal year 2007. The increase primarily reflects higher sales of our military products primarily associated with the Mine Resistant Ambush Protection program during 2008. In addition, sales in China and other Asia Pacific areas increased approximately $125 million or 33 percent.
Aftermarket & Trailer sales were $1,183 million in fiscal year 2008, up 8 percent from fiscal year 2007. The effect of foreign currency translation increased sales by $53 million. The increase in sales is primarily due to growth of our aftermarket products, including our remanufacturing business. The acquisitions of Mascot and Trucktechnic in fiscal year 2008 increased sales by $31 million.
Light Vehicle Systems (LVS) sales were $1,571 million in fiscal year 2008, up from $1,515 million in fiscal year 2007. The effect of foreign currency translation increased sales by $196 million. Excluding the impact of foreign currency translation, sales decreased by $140 million or 9 percent compared to the prior year. Sales in North America decreased primarily due to lower sales in our suspension modules business, including lower pass-through sales, which were approximately $167 million in fiscal year 2008, compared to approximately $209 million in fiscal year 2007. These pass-through sales carry minimal margins, as we have little engineering or manufacturing responsibility. The closure of our door module facility in Brussels, Belgium in fiscal year 2007 unfavorably impacted sales by $36 million when compared to the prior year. Strong sales volumes in the Asia Pacific and South American regions partially offset lower volumes in North America.
Cost of Sales and Gross Profit
Cost of sales for the fiscal year ended September 30, 2008 was $5,828 million compared to $5,323 million in the prior year, representing an increase of 9 percent. The increase in costs of sales is primarily due to the increased sales volumes discussed above and the impact of foreign currency translation due to the weakening of the U.S. dollar in fiscal year 2008. Total cost of sales were approximately 91 percent of sales for the fiscal year ended September 30, 2008 compared to approximately 93 percent a year ago.
39
Changes in the components of cost of sales year over year are summarized as follows:
| Higher material costs | $ | 317 |
| Higher labor and overhead costs | 163 | |
| Other | 25 | |
| Total decrease in costs of sales | $ | 505 |
Material represents the majority of our cost of sales and includes raw materials, composed primarily of steel and purchased components. Material costs for much of fiscal year 2008 were negatively impacted by higher average steel prices, partially offset by improvements in material performance compared to the prior year. Steel indexes saw a rapid increase beginning in the second quarter of fiscal year 2008 and remained at relatively higher levels through the remainder of fiscal year 2008. Pricing recovery practices with customers are generally consistent with index movements in steel prices.
Labor and overhead costs increased by $163 million compared to the prior year. The increase was primarily due to the higher sales volumes and foreign currency translation. The impact of higher sales volumes and foreign currency exchange rates on labor and overhead costs was partially offset by savings associated with the company’s restructuring actions, continuous improvement and rationalization of operations.
Gross profit for the fiscal year ended September 30, 2008 was $562 million compared to $397 million in the same period last year. Gross margins increased to 9 percent for the fiscal year ended September 30, 2008 compared to 7 percent last year. The increase in gross margin is primarily attributable to the higher sales volumes, partially offset by the factors discussed above.
Other Income Statement Items
Selling, general and administrative expenses for fiscal years 2008 and 2007 are summarized as follows (in millions):
| 2008 | 2007 | Increase (Decrease) | |||||||||||||||||
| SG&A | Amount | % of sales | Amount | % of sales | |||||||||||||||
| LVS separation costs | $ | (19 | ) | 0.3 | % | $ | — | — | % | $ | 19 | 0.3pts | |||||||
| Loss on sale of receivables | (22 | ) | 0.3 | % | (9 | ) | 0.2 | % | 13 | 0.1pts | |||||||||
| All other SG&A | (374 | ) | 5.9 | % | (347 | ) | 6.0 | % | 27 | (0.1)pts | |||||||||
| Total SG&A | $ | (415 | ) | 6.5 | % | $ | (356 | ) | 6.2 | % | $ | 59 | 0.3pts | ||||||
LVS separation costs are third-party transaction costs incurred in connection with the previously planned spin-off of the LVS business. Loss on sale of receivables increased as the amount of receivables we sold during the current fiscal year were significantly higher than the prior year due to an increase in our sales. All other SG&A represents normal selling, general and administrative expenses. The increase in fiscal year 2008 primarily relates to higher labor costs (primarily due to higher variable incentive compensation costs in view of improved financial performance compared to targets) and marketing investments in our commercial vehicle aftermarket business. These increases were partially offset by a corresponding decrease in costs associated with our Performance Plus program compared to fiscal year 2007. Costs associated with our Performance Plus program decreased during fiscal year 2008 as most of the activities under this program were transferred to the respective business units. Savings generated by the program are primarily recorded in cost of sales in the consolidated statement of operations and are reflected in the segment EBITDA results previously discussed.
Operating income for fiscal year 2008 was $135 million, an increase of $157 million compared to fiscal year 2007. Operating margin was 2.1 percent, up from negative 0.4 percent in 2007.
Interest expense, net was $80 million, compared to $109 million in the prior year. The decrease in interest expense is primarily due to refinancing activities in recent years, which replaced higher interest rate debt with lower rate debt. Interest expense reductions also reflect increased use of off-balance sheet accounts receivable factoring programs during fiscal year 2008. The cost of these factoring programs is included within selling, general and administrative expenses discussed above. Also included in interest expense, net are net losses on debt extinguishments of $3 million and $6 million in the fiscal years 2008 and 2007, respectively. These losses include legal and other professional fees, unamortized debt issuance costs and premiums paid to repurchase and pay down debt.
40
The provision for income taxes in fiscal year 2008 was $197 million, representing a 212 percent effective tax rate, compared to a benefit of $13 million, or 13 percent effective tax rate, in the prior year. Included in the current year tax provision are non-cash income tax charges of $183 million of which $137 million related to the repatriation of certain foreign subsidiary earnings to the U.S. and $46 million related to recording valuation allowances on certain foreign deferred tax assets. During the fourth quarter of fiscal year 2008, the company made a strategic decision to repatriate earnings of certain foreign subsidiaries in the form of dividends. The repatriation provides the company with additional flexibility to reallocate funds to other operations as necessary based on working capital requirements and at the same time the ability to utilize deferred tax assets in the U.S., resulting in no additional cash tax expense. These non-cash income tax charges were partially offset in fiscal year 2008 by $12 million of net favorable tax items related to the conclusion and settlement of certain tax audits and expiration of the statute of limitations. Also impacting income tax expense in fiscal year 2008 are higher pre-tax earnings. The prior year tax provision was favorably impacted by increased earnings from foreign subsidiaries whose tax rates are less than the statutory rate and the favorable impact of enacted tax rate changes in certain foreign jurisdictions.
Loss from continuing operations for fiscal year 2008 was $115 million, or $1.60 per diluted share, compared to $93 million, or $1.32 per diluted share in fiscal year 2007. The increase in loss is primarily attributable to the higher income tax provision discussed above, partially offset by higher pre-tax earnings.
Income (loss) from discontinued operations was $14 million in fiscal year 2008 compared to a loss of $126 million in fiscal year 2007. Significant items included in results from discontinued operations in fiscal years 2008 and 2007 include the following:
| Year Ended September 30, | |||||||
| 2008 | 2007 | ||||||
| Loss on sale of businesses | $ | (16 | ) | $ | (200 | ) | |
| Restructuring costs | (11 | ) | (3 | ) | |||
| Other | — | 12 | |||||
| Operating income, net | 57 | 49 | |||||
| Income (loss) before income taxes | 30 | (142 | ) | ||||
| Minority interest | (4 | ) | (6 | ) | |||
| Benefit (provision) for income taxes | (12 | ) | 22 | ||||
| Income (loss) from discontinued operations | $ | 14 | $ | (126 | ) | ||
Loss on sale of businesses: In fiscal year 2008 we recorded additional expenses of approximately $16 million, net, primarily associated with the sale of our ET and LVA businesses, including final adjustments related to changes in estimates for certain retained assets and liabilities.
In fiscal year 2007 we sold our ET business and recognized a $180 million pre-tax loss on the sale. This loss on sale includes a $115 million ($90 million after-tax) non-cash impairment charge recorded in the second quarter of fiscal year 2007 to record ET at estimated fair value based upon the sale agreement. Also included in loss on sale of disposed businesses is a $20 million pre-tax loss on sale of our LVA European exhaust and filters business. The loss on sale includes an $8 million after-tax non-cash impairment charge recorded in the third quarter of fiscal year 2007 to record this business at estimated fair value.
Restructuring costs: We recorded restructuring costs in fiscal year 2008 and 2007 of $11 million and $3 million, respectively, primarily related to employee severance benefits associated with our Performance Plus program. Restructuring costs in fiscal year 2007 also include a reversal of $9 million of restructuring costs in ET related to employee severance benefits. Due to the sale of ET, it was determined that payment of these severance benefits was no longer probable.
Other: Included in loss from discontinued operations in fiscal year 2007 is a $12 million benefit related to the reversal of certain impairment reserves in the light vehicle aftermarket ride control business presented within continuing operations in fiscal year 2007 (this business was presented in discontinued operations prior to fiscal year 2007). This reversal is related to a $34 million impairment reserve recognized in fiscal year 2005 to record this business at its estimated fair value when it was classified as held for sale. At September 30, 2005, $11 million of the total impairment reserve was allocated to a portion of the long-lived assets and $23 million was considered a reserve for the estimated loss on sale. Subsequent to September 2005, an additional $7 million of this reserve was allocated to long-lived assets whose fair value had further deteriorated. Therefore, at March 31, 2007, the reserve for the estimated loss on sale had decreased to $16 million. As a result of the decision to retain the light vehicle aftermarket ride control business, the reserve for the loss on sale was no longer required and $12 million was reversed. The remaining portion of this reserve was not reversed and was allocated to reserves associated with certain current assets that were impaired as of March 31, 2007. This business was sold in fiscal year 2009 and its results of operations are included in discontinued operations for all periods.
41
Segment EBITDA and EBITDA Margins
The following table reflects segment EBITDA and EBITDA margins for fiscal years 2008 and 2007 (dollars in millions).
| Segment EBITDA | Segment EBITDA Margins | |||||||||||||||||||||
| 2008 | 2007 | $ Change | % Change | 2008 | 2007 | Change | ||||||||||||||||
| Commercial Truck | $ | 117 | $ | 16 | $ | 101 | 631 | % | 4.0 | % | 0.6 | % | 3.4pts | |||||||||
| Industrial | 128 | 93 | 35 | 38 | % | 11.5 | % | 10.9 | % | 0.6pts | ||||||||||||
| Aftermarket & Trailer | 110 | 113 | (3 | ) | (3 | )% | 9.3 | % | 10.4 | % | (1.1)pts | |||||||||||
| LVS | 5 | (43 | ) | 48 | 112 | % | 0.3 | % | (2.8 | )% | 3.1pts | |||||||||||
| Segment EBITDA | $ | 360 | $ | 179 | $ | 181 | 101 | % | 5.6 | % | 3.1 | % | 2.5pts | |||||||||
Significant items impacting year over year segment EBITDA include the following:
| Commercial | Aftermarket | |||||||||||||||||
| Truck | Industrial | & Trailer | LVS | TOTAL | ||||||||||||||
| Segment EBITDA–Year ended September 30, 2007 | $ | 16 | $ | 93 | $ | 113 | $ | (43 | ) | $ | 179 | |||||||
| Impact of prior year product disruptions and work stoppages | ||||||||||||||||||
| settlement, net | 4 | — | — | — | 4 | |||||||||||||
| Lower restructuring costs | 7 | 1 | 3 | 37 | 48 | |||||||||||||
| Charges for legal and commercial dispute | — | — | — | (14 | ) | (14 | ) | |||||||||||
| Impact of change in employee vacation policy | 7 | 1 | 2 | 2 | 12 | |||||||||||||
| Volume, pricing, performance and other, net | 83 | 33 | (8 | ) | 23 | 131 | ||||||||||||
| Segment EBITDA – Year ended September 30, 2008 | $ | 117 | $ | 128 | $ | 110 | $ | 5 | $ | 360 | ||||||||
Restructuring costs included in our business segment results during fiscal years 2008 and 2007 are as follows (in millions):
| Commercial | Aftermarket | ||||||||||||||||||||||||||||||||||
| Truck | Industrial | & Trailer | LVS | Total | |||||||||||||||||||||||||||||||
| 2008 | 2007 | 2008 | 2007 | 2008 | 2007 | 2008 | 2007 | 2008 | 2007 | ||||||||||||||||||||||||||
| Performance Plus actions | $ | — | $ | 6 | $ | — | $ | 1 | $ | — | $ | 3 | $ | 12 | $ | 47 | $ | 12 | $ | 57 | |||||||||||||||
| Adjustments and reversals | (1 | ) | — | — | — | — | — | (3 | ) | (1 | ) | (4 | ) | (1 | ) | ||||||||||||||||||||
| Total restructuring costs (1) | $ | (1 | ) | $ | 6 | $ | — | $ | 1 | $ | — | $ | 3 | $ | 9 | $ | 46 | $ | 8 | $ | 56 | ||||||||||||||
| (1) | Total segment restructuring costs do not include those recorded in unallocated corporate costs. These costs were $1 million in fiscal year 2008, primarily related to employee termination benefits, and $6 million in fiscal year 2007, primarily related to asset impairment charges. |
Commercial Truck EBITDA was $117 million in fiscal year 2008, up $101 million compared to the prior year. EBITDA margin increased to 4.0 percent from 0.6 percent a year ago. Higher commercial truck volumes in all regions, except North America, along with improved pricing, material and manufacturing performance contributed to the increase in EBITDA in fiscal year 2008. EBITDA in fiscal year 2007 was unfavorably impacted by $13 million due to production interruptions and higher costs at a European axle facility and the simultaneous launch of a new axle product line and the implementation of a new ERP system. This impact was partially offset by a $9 million favorable settlement of claims relating to a 2006 labor disruption.
Industrial EBITDA was $128 million in fiscal year 2008, up $35 million compared to the prior year. EBITDA margin increased to 11.5 percent from 10.9 percent a year ago. The increase in EBITDA is primarily attributable to the higher sales.
Aftermarket & Trailer EBITDA was $110 million in fiscal year 2008, down $3 million compared to the prior year. EBITDA margin decreased to 9.3 percent from 10.4 percent a year ago.
LVS EBITDA was $5 million in fiscal year 2008, compared to EBITDA of negative $43 million in the prior year. Included in EBITDA for fiscal year 2008 are restructuring costs of $9 million ($46 million in fiscal year 2007). The restructuring costs are part of our Performance Plus program and primarily relate to employee severance costs and asset impairment charges for certain planned facility closures. During fiscal year 2008, LVS realized certain savings related to prior restructuring and other cost reduction actions, which are reflected in “volume, pricing performance and other, net” in the above table. These savings were partially offset by the lower sales volumes and a $14 million charge related to recording an additional contingency reserve for a legal and commercial dispute with a customer which has been settled as of September 30, 2008.
42
Non-Consolidated Joint Ventures
At September 30, 2009, our continuing operations included investments in 9 joint ventures that were not majority-owned or controlled and were accounted for under the equity method of accounting. Our investments in non-consolidated joint ventures totaled $125 million and $134 million at September 30, 2009 and 2008, respectively.
These strategic alliances provide for sales, product design, development and manufacturing in certain product and geographic areas. Aggregate sales of our non-consolidated joint ventures were $929 million, $1,484 million and $1,182 million in fiscal years 2009, 2008 and 2007, respectively.
Our equity in the earnings of affiliates was $15 million, $38 million and $34 million in fiscal years 2009, 2008 and 2007, respectively. We received cash dividends from our affiliates of $25 million, $20 million and $22 million in fiscal years 2009, 2008 and 2007, respectively.
For more information about our non-consolidated joint ventures, see Note 13 of the Notes to Consolidated Financial Statements.
Financial Condition
Cash Flows (in millions)
| Fiscal Year Ended September 30, | |||||||||||
| 2009 | 2008 | 2007 | |||||||||
| OPERATING CASH FLOWS | |||||||||||
| Loss from continuing operations | $ | (1,077 | ) | $ | (115 | ) | $ | (93 | ) | ||
| Depreciation and amortization | 81 | 120 | 111 | ||||||||
| Asset impairment charges | 223 | — | — | ||||||||
| Deferred income tax expense (benefit) | 671 | 106 | (47 | ) | |||||||
| Pension and retiree medical expense | 74 | 99 | 121 | ||||||||
| Pension and retiree medical contributions | (100 | ) | (77 | ) | (193 | ) | |||||
| Restructuring costs, net of payments | 27 | (27 | ) | 32 | |||||||
| Proceeds from termination of interest rate swaps | — | 28 | — | ||||||||
| Decrease (increase) in working capital | 78 | (166 | ) | 13 | |||||||
| Changes in sale of receivables | (275 | ) | 120 | 108 | |||||||
| Other | 19 | 92 | (37 | ) | |||||||
| Cash flows provided by (used for) continuing operations | (279 | ) | 180 | 15 | |||||||
| Cash flows provided by (used for) discontinued operations | (16 | ) | (17 | ) | 21 | ||||||
| Cash flows provided by (used for) operating activities | $ | (295 | ) | $ | 163 | $ | 36 | ||||
Cash used for operating activities for fiscal year 2009 was $295 million (of which there was a use of $440 million in the first six months of fiscal year 2009), compared to cash provided by operating activities of $163 million in fiscal year 2008. The deterioration in cash flow in fiscal year 2009 is primarily attributable to lower earnings and certain working capital usage, driven by the reduction in off-balance sheet accounts receivable factoring and securitization balances, during the period. Changes in working capital balances (accounts receivable, inventories, accounts payable, and other current assets and liabilities) were in line with the overall sales volume reductions compared to the prior year. However, cash flows generated by working capital during 2009 were more than offset by reductions in accounts receivable securitization and factoring programs. In addition, investments in inventory remained at higher levels relative to current sales volumes due to volatility in customer order and production schedules.
Also unfavorably impacting current year cash flows were higher pension and retiree medical contributions, primarily related to a $28 million payment for the settlement of a retiree medical lawsuit, and a $25 million payment associated with a previously announced settlement of a commercial matter with a customer, both of which payments were made in our first quarter of fiscal year 2009.
Cash flows used for discontinued operations primarily relate to the operating cash flows of the light vehicle Chassis businesses included in discontinued operations, and certain payments associated with retained liabilities from the 2007 sale of our ET business, net of related cash collections.
43
The increase in cash flow in fiscal year 2008, compared to fiscal year 2007, is primarily attributable to higher cash earnings and lower pension and retiree medical contributions of $116 million, partially offset by higher utilization of cash by discontinued operations of $38 million. These increases were also offset by an increased level of working capital requirements compared to the prior year. Working capital levels reflect both an increase in inventory and receivable balances in non-US operations and a decrease in accounts payable balances in 2008. However, we were able to balance the increased requirements for working capital through operational improvements, cash collection efforts and higher utilization of our accounts receivables securitization and factoring programs. The lower accounts payable balance was due to paying at a more expeditious rate than previous practice. We have worked with our suppliers towards reaching payment term practices that meet supplier needs as well as create less volatility in the company’s working capital needs. Operating cash flows in fiscal year 2008 include proceeds of $28 million from the termination of our interest rate swaps.
| Fiscal Year Ended September 30, | |||||||||||
| 2009 | 2008 | 2007 | |||||||||
| INVESTING CASH FLOWS | |||||||||||
| Capital expenditures | $ | (111 | ) | $ | (138 | ) | $ | (86 | ) | ||
| Acquisitions of businesses and investments, net of cash acquired | — | (60 | ) | (2 | ) | ||||||
| Other investing cash flows | 10 | 14 | 19 | ||||||||
| Net cash provided by discontinued operations | 115 | 24 | 165 | ||||||||
| CASH PROVIDED BY (USED FOR) INVESTING ACTIVITIES | $ | 14 | $ | (160 | ) | $ | 96 | ||||
Cash provided by investing activities was $14 million in fiscal year 2009, compared to cash used of $160 million in fiscal year 2008 and cash provided of $96 million in fiscal year 2007. In fiscal year 2008, we used $60 million primarily to fund the acquisitions of Mascot and Trucktechnic and fund the deferred purchase obligation with AB Volvo. In fiscal year 2007, we received $19 million from the sale of selected assets, including marketable securities.
Capital expenditures decreased to $111 million in fiscal year 2009 from $138 million in fiscal year 2008. Fiscal year 2008 capital expenditures reflect increased investments in certain regions to address overall capacity constraints impacting our businesses, including the addition of two new facilities in our commercial vehicle business. In addition to capital investments, we continue to leverage our global supply base and affiliate partners where practical to maximize asset utilization.
Cash flow provided by discontinued operations was $115 million in fiscal year 2009 compared to $24 million in fiscal year 2008. Included in cash flows from discontinued operations in fiscal year 2009 are net proceeds of $166 million from the sale of our Wheels business. This was partially offset by a cash outflow of $18 million associated with the sale of our interest in our Gabriel de Venezuela joint venture. The cash flows in fiscal year 2008 primarily include delayed proceeds from the sale of our ET business. In fiscal year 2008, we received $28 million associated with the final working capital purchase price adjustment and $20 million associated with amounts held in escrow in connection with the delayed legal closings of certain ET businesses. We also received proceeds of $12 million in fiscal year 2008 from the sale of certain retained properties of our sold ET and LVA businesses. In fiscal year 2007 we received $218 million in net proceeds from the sale of ET and approximately $9 million of proceeds from the sale of our LVA European exhaust and filters businesses. Discontinued operations used $23 million for capital expenditures in fiscal year 2009 compared to $34 million in fiscal year 2008 and $63 million in fiscal year 2007.
| Fiscal Year September 30, | |||||||||||
| 2009 | 2008 | 2007 | |||||||||
| FINANCING CASH FLOWS | |||||||||||
| Borrowings (payments) on prior accounts receivable securitization program | $ | (111 | ) | $ | 111 | $ | (40 | ) | |||
| Borrowings on new accounts receivable securitization program | 83 | — | — | ||||||||
| Borrowings on revolving credit facility, net | 28 | — | — | ||||||||
| Proceeds from issuance of convertible notes and term loan | — | — | 200 | ||||||||
| Repayment of notes and term loan | (83 | ) | (5 | ) | (249 | ) | |||||
| Borrowings (payments) on lines of credit and other | (9 | ) | 13 | (4 | ) | ||||||
| Net change in debt | (92 | ) | 119 | (93 | ) | ||||||
| Cash dividends | (8 | ) | (29 | ) | (29 | ) | |||||
| Debt issuance and extinguishment costs | — | (6 | ) | (10 | ) | ||||||
| Proceeds from exercise of stock options | — | — | 28 | ||||||||
| Other financing activities | — | — | (1 | ) | |||||||
| Net cash provided by (used for) discontinued operations | (6 | ) | 13 | 7 | |||||||
| CASH PROVIDED BY (USED FOR) FINANCING ACTIVITIES | $ | (106 | ) | $ | 97 | $ | (98 | ) | |||
44
Cash used for financing activities was $106 million in fiscal year 2009 compared to cash provided of $97 million in fiscal year 2008. In February and March 2009, we repaid our $77 million outstanding 6.8 percent notes and our $6 million outstanding 7-1/8 percent notes, respectively, upon their respective maturity dates. In fiscal year 2009, our primary source of cash flow from financing activities was borrowings on our U.S. accounts receivable securitization program, of which $83 million was utilized as of September 30, 2009 and borrowings on our revolving credit facility. Additional information on our revolving credit facility and our accounts receivable securitization and factoring programs is provided in the “Liquidity” section below. In fiscal year 2008, our primary source of cash flow from financing activities was borrowings on our U.S. accounts receivable securitization program, of which $111 million was utilized as of September 30, 2008.
In February 2007, we issued $200 million of 4.00 percent convertible senior unsecured notes due 2027. Net proceeds from the issuance of these notes were used along with available cash to retire outstanding debt, including our $170 million outstanding Term Loan B under our senior secured credit facility and $39 million of our 9.5 percent subordinated debentures due 2027. We incurred $10 million of cash costs, including premiums paid, related to these transactions. In fiscal year 2007, we purchased, at a premium, $35 million of our outstanding 8-3/4 percent notes.
We paid dividends of $8 million in fiscal year 2009, $29 million in fiscal year 2008 and $29 million in fiscal year 2007. In fiscal year 2007, proceeds of $28 million were received from the exercise of stock options. In February 2009, the Board of Directors suspended the company’s quarterly dividend until further notice.
Contractual Obligations
As of September 30, 2009 we are contractually obligated to make payments as follows (in millions):
| 2013- | There- | ||||||||||||||||
| Total | 2010 | 2011 | 2012 | 2014 | after | ||||||||||||
| Total debt (1) | $ | 1,154 | $ | 97 | $ | 30 | $ | 276 | $ — | $ | 751 | ||||||
| Operating leases | 111 | 24 | 20 | 16 | 26 | 25 | |||||||||||
| Interest payments on long-term debt | 548 | 67 | 67 | 52 | 85 | 277 | |||||||||||
| Total | $ | 1,813 | $ | 188 | $ | 117 | $ | 344 | $ | 111 | $ | 1,053 | |||||
| (1) |
Excludes the unamortized gain on swap unwind of $23 million. |
We also sponsor defined benefit pension plans that cover most of our U.S. employees and certain non-U.S. employees. Our funding practice provides that annual contributions to the pension trusts will be at least equal to the minimum amounts required by ERISA in the U.S. and the actuarial recommendations or statutory requirements in other countries. Management expects funding for our retirement pension plans of approximately $51 million in fiscal year 2010.
We also sponsor retirement medical plans that cover the majority of our U.S. and certain non-U.S. employees, including certain employees of divested businesses, and provide for medical payments to eligible employees and dependents upon retirement. Management expects retiree medical plan benefit payments of approximately $49 million in each of fiscal years 2010 through 2014.
The table above does not reflect net unrecognized tax benefits of $45 million due to the high degree of uncertainty regarding the future cash outflows associated with these amounts. Refer to Note 22 in the Consolidated Financial Statements for additional discussion of unrecognized tax benefits.
Not included in the above table is a $28 million liability recorded in fiscal year 2009 related to a guarantee of a third party’s obligation to reimburse another party for payment of health and prescription drug benefits to a group of retired employees. We expect approximately $9 million of this obligation to be paid in fiscal year 2010 with the remaining amount paid over the remaining life of the retirees.
Liquidity
Our outstanding debt, net of discounts where applicable, is summarized as follows (in millions). For a detailed discussion of terms and conditions related to this debt, see Note 16 in the Notes to Consolidated Financial Statements.
| September 30, | |||||
| 2009 | 2008 | ||||
| Fixed-rate debt securities | $ | 527 | $ | 610 | |
| Fixed-rate convertible notes | 500 | 500 | |||
| Revolving credit facility | 28 | — | |||
| Borrowings under U.S. accounts receivable securitization program | 83 | 111 | |||
| Lines of credit and other | 39 | 82 | |||
| Total debt | $ | 1,177 | $ | 1,303 | |
45
Overview – Our principal operating and capital requirements are for working capital needs, capital expenditure requirements, debt service requirements and funding of restructuring and product development programs. We expect fiscal year 2010 capital expenditures for our business segments, including LVS, to be in the range of $90 million to $110 million. In addition, we expect restructuring cash costs to be approximately $25 million in fiscal year 2010. These cash costs relate to the $28 million of restructuring liabilities recorded at September 30, 2009 in the consolidated balance sheet.
We generally fund our operating and capital needs primarily with cash on hand, our various accounts receivable securitization and factoring arrangements and availability under our revolving credit facility. Cash in excess of local operating needs is generally used to reduce amounts outstanding under our revolving credit facility. Upon expiration of our current revolving facility in June 2011, we will require a new or renegotiated facility (which may be smaller and have less favorable terms than our current facility) or other financing arrangements. Our ability to access additional capital in the long-term will depend on availability of capital markets and pricing on commercially reasonable terms as well as our credit profile at the time we are seeking funds. In 2009, our credit rating decreased and we saw a significant decline in our stock price. We continuously evaluate our capital structure to ensure the most appropriate and optimal structure and may, from time to time, retire, exchange or redeem outstanding indebtedness, issue new equity or enter into new lending arrangements if conditions warrant.
Sources of liquidity as of September 30, 2009, in addition to cash on hand, are as follows:
| Total | Unused as of | Current | |||||
| Facility Size | 9/30/09 | Expiration | |||||
| On-balance sheet arrangements: | |||||||
| Revolving credit facility | $ | 666 | $ | 611 | June 2011 | ||
| Committed US securitization | 125 | 42 | September 2011 | ||||
| Total on-balance sheet arrangements | 791 | 653 | |||||
| Off-balance sheet arrangements: | |||||||
| Committed receivable factoring programs | 367 | 295 | October 2010 | ||||
| Other uncommitted factoring facilities | 159 | 138 | Various | ||||
| Total off-balance sheet arrangements | 526 | 433 | |||||
| Total available sources | $ | 1,317 | $ | 1,086 | |||
Cash and Liquidity Needs – Our cash and liquidity needs have been impacted by the level, variability and timing of our customers’ worldwide vehicle production and other factors outside of our control. In addition, although our long term strategy is to become primarily a commercial vehicle and industrial company, the financial and economic environment has made this difficult to accomplish in its entirety in the short term and has left us with servicing the cash outflows of certain of our light vehicle businesses, which have been substantial. The divestiture in the third quarter of several of our light vehicle Chassis businesses, in addition to restructuring actions and other cost reductions taken during the fiscal year, are expected to limit the cash outflow of our remaining LVS businesses going forward. However the cash needs of the remaining LVS businesses could be significant while we continue to operate these businesses. In addition, potential cash costs to sell or shut down all or portions of our Body Systems business may be substantial dependent on the timing and specific actions to complete this process.
Cash flow in fiscal year 2009 was negatively affected by decreased earnings due to lower sales and will continue to be negatively impacted due to continued lowered production and the current volatility in the financial markets, which could affect certain of our customers or vendors. We saw our usage of the revolving credit facility throughout the first six months of the fiscal year increase significantly to meet working capital and other operational needs. However, stronger cash flow, improved regional cash efficiencies and the sale of certain LVS businesses, allowed us to reduce usage of the revolver, including letters of credit, by $300 million at fiscal year end as compared to second quarter end. At September 30, 2009, we had $95 million in cash and cash equivalents and an undrawn amount of $611 million under the revolving credit facility. Our availability under the revolving credit facility is subject to a senior secured debt to EBITDA ratio covenant, as defined in the agreement, which will likely limit our borrowings under the agreement as of each quarter end. As long as we are in compliance with this covenant as of the quarter end, we have full availability under the revolving credit facility every other day during the quarter. We were in compliance with this covenant as of September 30, 2009.
Future Covenant Compliance – Our future liquidity is subject to a number of factors, including access to adequate funding under our senior secured credit facility, vehicle production schedules and customer demand and access to other borrowing arrangements such as factoring or securitization facilities. Even taking into account these and other factors, and with the assumption that the current trends in the commercial vehicle and automotive industries continue, management expects to have sufficient liquidity to fund our operating requirements through the term of our existing revolving credit facility.
46
Although we believe we will have sufficient liquidity, if amendments or waivers are needed due to unforeseen negative trends or developments, we would negotiate with the lenders under these facilities and believe we will receive such an amendment or waiver if required. However, there can be no assurances as to whether any such amendment or waiver may be obtained or, if obtained, whether the terms and restrictions of such amendment or waiver will be as favorable as current arrangements. Any amendment or waiver will contain commercial terms consistent with the current market which would likely include higher interest rates and an upfront amendment fee. If such amendments or waivers are needed and are not obtained, the lenders under these facilities could accelerate our obligations, which, through cross defaults, could allow acceleration of obligations under certain of our other debt arrangements, including our outstanding convertible notes and our U.S. accounts receivable securitization program.
Revolving Credit Facility – We have a $700 million revolving secured credit facility that matures in June 2011. Due to the bankruptcy of Lehman Brothers in fiscal year 2008, $34 million of these commitments are currently unavailable. The remaining amount of availability under this facility is dependent upon various factors, including principally performance against certain financial covenants. At September 30, 2009, $28 million was outstanding under this facility. No amount was outstanding at September 30, 2008. The $700 million revolving credit facility includes $150 million of availability for the issuance of letters of credit. At September 30, 2009 and September 30, 2008, approximately $27 million and $38 million letters of credit were issued, respectively.
In October and December 2007, we amended the revolving credit facility to modify certain financial covenants. Under the terms of the December amendment, the borrowing capacity of the credit facility was reduced to $700 million from $900 million. The amended facility replaced the existing financial covenants with new financial covenants based on (i) the ratio of the company’s senior secured indebtedness (consisting principally of amounts outstanding under the revolving credit facility) to EBITDA and (ii) the amount of annual capital expenditures. The company is required to maintain a total senior secured-debt-to-EBITDA ratio, as defined in the agreement, no greater than 2.0 to 1 on the last day of any fiscal quarter. At September 30, 2009, we were in compliance with the above noted covenants with a ratio of approximately 0.57x for the senior secured debt to EBITDA covenant. Certain of the company’s subsidiaries, as defined in the credit agreement, irrevocably and unconditionally guarantee amounts outstanding under the revolving credit facility.
Borrowings under the revolving credit facility are subject to interest based on quoted LIBOR rates plus a margin, and a commitment fee on undrawn amounts, both of which are based upon the company’s current credit rating for the senior secured facilities. At September 30, 2009, the margin over the LIBOR rate was 275 basis points, and the commitment fee was 50 basis points. Although a majority of our revolving credit loans are LIBOR based, overnight revolving credit loans are at the prime rate plus a margin of 175 basis points.
Accounts Receivable Securitization and Factoring – As of September 30, 2009, we participate in accounts receivable factoring and securitization programs with total amounts utilized of approximately $176 million of which $155 million were attributable to committed facilities by established banks. At September 30, 2009, of the total $176 million utilized, $93 million relates to off-balance sheet securitization and factoring arrangements (see “Off-Balance Sheet Arrangements”). In addition, $83 million was attributable to our U.S. securitization facility, which is provided on a committed basis by a syndicate of financial institutions led by GMAC Commercial Finance LLC and expires in September 2011.
U.S. Securitization Program: Since 2005 we participated in a U.S. accounts receivable securitization program to enhance financial flexibility and lower interest costs. In September 2009, in anticipation of the expiration of the existing facility, we entered into a new, two year $125 million U.S. receivables financing arrangement with a syndicate of financial institutions led by GMAC Commercial Finance LLC. Under this program, we sell substantially all of the trade receivables of certain U.S. subsidiaries to ArvinMeritor Receivables Corporation (ARC), a wholly-owned, special purpose subsidiary. The maximum borrowing capacity under this program is $125 million subject to adequate eligible accounts receivable. ARC funds these purchases with borrowings under a loan agreement with participating lenders. Amounts outstanding under this agreement are collateralized by eligible receivables purchased by ARC and are reported as short-term debt in the consolidated balance sheet. At September 30, 2009 $83 million was outstanding under this program. Borrowings under this arrangement are collateralized by approximately $133 million of receivables held at ARC at September 30, 2009. This program does not have specific financial covenants; however it does have a cross-default provision to our revolving credit facility agreement.
Credit Ratings – Standard & Poor’s corporate credit rating and senior secured credit rating for our company is CCC+ and B-, respectively. Moody’s Investors Service corporate credit rating and senior secured credit rating for our company is Caa1 and B1, respectively. Any further lowering of our credit ratings could increase our cost of future borrowings and could reduce our access to capital markets and result in lower trading prices for our securities.
Off-Balance Sheet Arrangements
Accounts Receivable Securitization and Factoring Arrangements – We participate in accounts receivable factoring programs with total amounts utilized at September 30, 2009, of approximately $93 million, of which $56 million and $16 million were attributable to a Swedish securitization facility and a French factoring facility, respectively, both of which involve the securitization or sale of Volvo AB accounts receivables. These programs are described in more detail below.
47
Swedish Securitization Facility: In March 2006, we entered into a European arrangement to sell trade receivables through one of our European subsidiaries. Under this arrangement, we can sell up to, at any point in time, €125 million of eligible trade receivables. Effective October 2009 the facility size was reduced to €90 million. The receivables under this program are sold at face value and excluded from the consolidated balance sheet. We had utilized, net of retained interests, €38 million ($56 million) and €114 million ($167 million) of this accounts receivable securitization facility as of September 30, 2009 and September 30, 2008, respectively.
French Factoring Facility: In November 2007, we entered into an arrangement to sell trade receivables through one of our French subsidiaries. Under this arrangement, we can sell up to, at any point in time, €125 million of eligible trade receivables. The receivables under this program are sold at face value and excluded from the consolidated balance sheet. We had utilized €10 million ($16 million) and €96 million ($141 million) of this accounts receivable securitization facility as of September 30, 2009 and September 30, 2008, respectively.
Both of the above facilities are backed by 364-day liquidity commitments from Nordea Bank which were renewed through October 2010. The commitments are subject to standard terms and conditions for these types of arrangements (including, in the case of the French commitment, a sole discretion clause whereby the bank retains the right to not purchase receivables, which to our knowledge has never been invoked).
In addition, several of our subsidiaries, primarily in Europe, factor eligible accounts receivables with financial institutions. The amount of factored receivables was $21 million and $102 million at September 30, 2009 and September 30, 2008, respectively.
Contingencies
Contingencies related to environmental, asbestos and other matters are discussed in Note 23 of the Notes to Consolidated Financial Statements.
Critical Accounting Policies
Critical accounting policies are those that are most important to the portrayal of the company’s financial condition and results of operations. These policies require management’s most difficult, subjective or complex judgments in the preparation of the financial statements and accompanying notes. Management makes estimates and assumptions about the effect of matters that are inherently uncertain, relating to the reporting of assets, liabilities, revenues, expenses and the disclosure of contingent assets and liabilities. Our most critical accounting policies are discussed below.
Pensions — Our pension obligations are determined annually on an actuarial basis and were measured as of September 30, 2009 and June 30, 2008. The U.S. plans include a qualified and non-qualified pension plan. Significant non-U.S. plans are located in the United Kingdom, Canada and Germany. The following are the significant assumptions used in the measurement of the projected benefit obligation (PBO) and net periodic pension expense:
| 2009 | 2008 | ||||||
| U.S. | Non-U.S. | U.S. | Non-U.S. | ||||
| Assumptions as of September 30, 2009 and June 30, 2008: | |||||||
| Discount rate | 5.70% | 3.00% – 6.25% | 7.10% | 3.50% – 6.75% | |||
| Assumed return on plan assets | 8.50% | 3.00% – 8.00% | 8.50% | 3.00% – 8.00% | |||
| Rate of compensation increase | 3.75% | 2.00% – 3.50% | 3.75% | 2.00% – 5.00% | |||
The discount rate is used to calculate the present value of the PBO. The rate is determined based on high-quality fixed income investments that match the duration of expected benefit payments. The company uses a portfolio of long-term corporate AA/Aa bonds that match the duration of the expected benefit payments to establish the discount rate for this assumption.
The assumed return on plan assets is used to determine net periodic pension expense. The rate of return assumptions are based on projected long-term market returns for the various asset classes in which the plans are invested, weighted by the target asset allocations. An incremental amount for active management, where appropriate, is included in the rate of return assumption. The return assumption is reviewed annually.
The rate of compensation increase represents the long-term assumption for expected increases to salaries for pay-related plans.
48
These assumptions reflect our historical experience and our best judgments regarding future expectations. The effects of the indicated increase and decrease in selected assumptions, assuming no changes in benefit levels and no amortization of gains or losses for the plans in 2009, are shown below (in millions):
| Effect on All Plans – September 30, 2009 | |||||||||
| Increase (Decrease) in | Increase (Decrease) in | ||||||||
| Percentage Point Change | PBO | Pension Expense | |||||||
| Assumption: | |||||||||
| Discount rate | -0.5 pts | $ | 129 | $ | 10 | ||||
| +0.5 pts | (117 | ) | (10 | ) | |||||
| Assumed return on plan | |||||||||
| assets | -1.0 pts | NA | 15 | ||||||
| +1.0 pts | NA | (15 | ) | ||||||
| NA — Not Applicable | |||||||||
In September 2006, the FASB issued guidance related to retirement benefits which requires an entity to recognize the funded status of its defined benefit pension plans and other postretirement benefit plans, such as a retiree health care plan, on the balance sheet and to recognize changes in the funded status that arise during the period but are not recognized as components of net periodic benefit cost, within other comprehensive income, net of income taxes. This guidance was effective for the company as of September 30, 2007. The initial adoption of the guidance resulted in a reduction in shareowners’ equity of $357 million. This reduction is net of taxes of $193 million and is recorded in Accumulated Other Comprehensive Loss in the Consolidated Statement of Shareowners’ Equity. The guidance also requires that companies measure the funded status of their defined benefit pension plans and other postretirement benefit plans as of the balance sheet date. We have elected to adopt the measurement date provisions of this retirement benefit guidance at October 1, 2008. Those provisions require the measurement date for plan assets and liabilities to coincide with the sponsor’s year end. Using the “one-measurement” approach, the impact of adopting the measurement date provisions as of October 1, 2008, is an increase to accumulated deficit of approximately $20 million ($20 million after-tax), representing the net periodic benefit cost for the period between the measurement date utilized in fiscal year 2008 and the beginning of fiscal year 2009, which previously would have been expensed in the first quarter of fiscal year 2009 on a delayed basis.
Accounting guidance applicable to pensions does not require immediate recognition of the effects of a deviation between actual and assumed experience and the revision of an estimate. This approach allows the favorable and unfavorable effects that fall within an acceptable range to be netted and disclosed as an unrecognized gain or loss in the footnotes. Based on the September 30, 2009 and June 30, 2008 measurement dates, we had an unrecognized loss of $762 million and $381 million, respectively, at September 30, 2009 and 2008. A portion of this loss was recognized into earnings in fiscal year 2009.
In recognition of the long-term nature of the liabilities of the pension plans, we have targeted an asset allocation strategy designed to promote asset growth while maintaining an acceptable level of risk over the long term. Asset-liability studies are performed periodically to validate the continued appropriateness of these asset allocation targets. The asset allocation for the U.S. plan is targeted at 50–70 percent equity investments, 20–40 percent fixed income investments, and 5–15 percent alternative investments. The target asset allocation ranges for the non-U.S. plans are 55–85 percent equity investments, 15–40 percent fixed income investments, and 0–5 percent real estate and alternative investments. The asset class mix and the percentage of securities in any asset class or market may vary as the risk/return characteristics of either individual market or asset classes vary over time.
The investment strategies for the pension plans are designed to achieve an appropriate diversification of investments as well as safety and security of the principal invested. Assets invested are allocated to certain global sub-asset categories within prescribed ranges in order to promote international diversification across security type, issuer type, investment style, industry group, and economic sector. Assets of the plans are both actively and passively managed. Policy limits are placed on the percentage of plan assets that can be invested in a security of any single issuer and minimum credit quality standards are established for debt securities. ArvinMeritor securities did not comprise any of the value of our worldwide pension assets as of September 30, 2009.
Based on current assumptions, the fiscal year 2010 pension expense is estimated to be approximately $35 million.
Retiree Medical — We have retirement medical plans that cover the majority of our U.S. and certain non-U.S. employees and provide for medical payments to eligible employees and dependents upon retirement. Our retiree medical obligations were measured as of September 30, 2009 and June 30, 2008.
49
The following are the significant assumptions used in the measurement of the accumulated postretirement benefit obligation (APBO):
| 2009 | 2008 | ||||
| Assumptions as of September 30, 2009 and June 30, 2008: | |||||
| Discount rate | 5.60 | % | 6.90 | % | |
| Health care cost trend rate (weighted average) | 7.85 | % | 7.60 | % | |
| Ultimate health care trend rate | 5.00 | % | 5.00 | % | |
| Year ultimate rate is reached | 2021 | 2021 | |||
The discount rate is the rate used to calculate the present value of the APBO. The rate is determined based on high-quality fixed income investments that match the duration of expected benefit payments. We used the corporate AA/Aa bond rate for this assumption.
The health care cost trend rate represents the company’s expected annual rates of change in the cost of health care benefits. The trend rate noted above represents a forward projection of health care costs as of the measurement date. Our projection for fiscal year 2010 is an increase in health care costs of 7.85 percent. For measurement purposes, the annual increase in health care costs was assumed to decrease gradually to 5.0 percent by fiscal year 2021 and remain at that level thereafter.
A one-percentage point change in the assumed health care cost trend rate for all years to, and including, the ultimate rate would have the following effects (in millions):
| 2009 | 2008 | ||||||
| Effect on total of service and interest cost | |||||||
| 1% Increase | $ | 4 | $ | 4 | |||
| 1% Decrease | (4 | ) | (4 | ) | |||
| Effect on APBO | |||||||
| 1% Increase | 65 | 59 | |||||
| 1% Decrease | (56 | ) | (50 | ) | |||
Based on current assumption, fiscal year 2010 retiree medical expense is estimated to be approximately $57 million.
Product Warranties — Our Core Business segments record estimated product warranty costs at the time of shipment of products to customers. Liabilities for product recall campaigns are recorded at the time the company’s obligation is known and can be reasonably estimated. Product warranties, including recall campaigns, not expected to be paid within one year are recorded as a non-current liability.
Our LVS segment records product warranty liabilities based on its individual customer or warranty-sharing agreements. Product warranties are recorded for known warranty issues when amounts can be reasonably estimated.
Significant factors and information used by management when estimating product warranty liabilities include:
- Past claims experience;
- Sales history;
- Product manufacturing and industry
developments; and
- Recoveries from third parties, where applicable.
Asbestos — Maremont Corporation (“Maremont”) — Maremont, a subsidiary of ArvinMeritor, manufactured friction products containing asbestos from 1953 through 1977, when it sold its friction product business. Arvin Industries, Inc., a predecessor of the company, acquired Maremont in 1986. Maremont and many other companies are defendants in suits brought by individuals claiming personal injuries as a result of exposure to asbestos-containing products. Although Maremont has been named in these cases, very few cases allege actual injury and, in the cases where actual injury has been alleged, very few claimants have established that a Maremont product caused their injuries. Plaintiffs’ lawyers often sue dozens or even hundreds of defendants in individual lawsuits on behalf of hundreds or thousands of claimants, seeking damages against all named defendants irrespective of the disease or injury and irrespective of any causal connection with a particular product. For these reasons, Maremont does not consider the number of claims filed or the damages alleged to be a meaningful factor in determining its asbestos-related liability.
50
Prior to February 2001, Maremont participated in the Center for Claims Resolution (“CCR”) and shared with other CCR members in the payment of defense and indemnity costs for asbestos-related claims. The CCR handled the resolution and processing of asbestos claims on behalf of its members until February 2001, when it was reorganized and discontinued negotiating shared settlements. Since the CCR was reorganized in 2001, Maremont has handled asbestos-related claims through its own defense counsel and has taken a more aggressive defensive approach that involves examining the merits of each asbestos-related claim. Although, we expect legal defense costs to continue at higher levels than when we participated in the CCR, we believe our litigation strategy has reduced the average indemnity cost per claim.
Maremont engages Bates White LLC (Bates White), a consulting firm with extensive experience estimating costs associated with asbestos litigation, to assist with determining the estimated cost of resolving pending and future asbestos-related claims that have been, and could reasonably be expected to be, filed against Maremont. Although it is not possible to estimate the full range of costs because of various uncertainties, Bates White advised Maremont that it would be possible to determine an estimate of a reasonable forecast of the probable settlement and defense costs of resolving pending and future asbestos-related claims, based on historical data and certain assumptions with respect to events that occur in the future.
Bates White provided an estimate of the reasonably possible range of Maremont’s obligation for asbestos personal injury claims over the next ten years of $58 million to $65 million. After consultation with Bates White, Maremont determined that as of September 30, 2009 the most likely and probable liability for pending and future claims over the next ten years is $58 million. The ultimate cost of resolving pending and future claims is estimated based on the history of claims and expenses for plaintiffs represented by law firms in jurisdictions with an established history with Maremont.
The following assumptions were made by Maremont after consultation with Bates White and are included in their study:
- Pending and future claims were estimated for
a ten year period ending in fiscal year 2019. The ten-year assumption
is considered appropriate as Maremont has
reached certain longer-term agreements with key plaintiff law firms and
filings of mesothelioma claims have been
relatively stable over the last few years resulting in an improvement in the
reliability of future projections over a
longer time period;
- Maremont believes that the litigation
environment will change significantly beyond ten years, and that the
reliability of estimates of future
probable expenditures in connection with asbestos-related personal injury
claims declines for each year further in
the future. As a result, estimating a probable liability beyond ten years is
difficult and uncertain;
- The ultimate cost of resolving pending and
future claims filed in Madison County, Illinois, a jurisdiction where a
substantial amount of Maremont’s claims are
filed, will decline to reflect average outcomes throughout the United
States;
- Defense and processing costs for pending and
future claims filed outside of Madison County, Illinois will be at the
level consistent with Maremont’s prior
experience; and
- The ultimate indemnity cost of resolving nonmalignant claims with plaintiff’s law firms in jurisdictions without an established history with Maremont cannot be reasonably estimated. Recent changes in tort law and insufficient settlement history make estimating a liability for these nonmalignant claims difficult and uncertain.
Maremont has insurance that reimburses a substantial portion of the costs incurred defending against asbestos-related claims. The coverage also reimburses Maremont for any indemnity paid on those claims. The coverage is provided by several insurance carriers based on insurance agreements in place. Incorporating historical information with respect to buy-outs and settlements of coverage, and excluding any policies in dispute, the insurance receivable related to asbestos-related liabilities is $43 million as of September 30, 2009. The difference between the estimated liability and insurance receivable is primarily related to proceeds received from settled insurance policies. Certain insurance policies have been settled in cash prior to the ultimate settlement of related asbestos liabilities. Amounts received from insurance settlements generally reduce recorded insurance receivables. Receivables for policies in dispute are not recorded.
The amounts recorded for the asbestos-related reserves and recoveries from insurance companies are based upon assumptions and estimates derived from currently known facts. All such estimates of liabilities and recoveries for asbestos-related claims are subject to considerable uncertainty because such liabilities and recoveries are influenced by variables that are difficult to predict. The future litigation environment for Maremont could change significantly from its past experience, due, for example, to changes in the mix of claims filed against Maremont in terms of plaintiffs’ law firm, jurisdiction and disease; legislative or regulatory developments; Maremont’s approach to defending claims; or payments to plaintiffs from other defendants. Estimated recoveries are influenced by coverage issues among insurers, and the continuing solvency of various insurance companies. If the assumptions with respect to the nature of pending and future claims, the cost to resolve claims and the amount of available insurance prove to be incorrect, the actual amount of liability for Maremont’s asbestos-related claims, and the effect on the company, could differ materially from current estimates and, therefore, could have a material impact on our financial position and results of operations.
Asbestos — Rockwell — ArvinMeritor, along with many other companies, has also been named as a defendant in lawsuits alleging personal injury as a result of exposure to asbestos used in certain components of Rockwell products many years ago. Liability for these claims was transferred to the company at the time of the spin-off of the automotive business to Meritor from Rockwell in 1997. Currently there are thousands of claimants in lawsuits that name us, together with many other companies, as defendants.
51
We do not consider the number of claims filed or the damages alleged to be a meaningful factor in determining asbestos-related liabilities. A significant portion of the claims do not identify any of Rockwell’s products or specify which of the claimants, if any, were exposed to asbestos attributable to Rockwell’s products, and past experience has shown that the vast majority of the claimants will likely never identify any of Rockwell’s products. For those claimants who do show that they worked with Rockwell’s products, we nevertheless believe we have meritorious defenses, in substantial part due to the integrity of the products involved and the lack of any impairing medical condition on the part of many claimants. We defend these cases vigorously. Historically, ArvinMeritor has been dismissed from the vast majority of similar claims filed in the past with no payment to claimants.
We also engage Bates White to assist with determining whether it would be possible to estimate the cost of resolving pending and future Rockwell legacy asbestos-related claims that have been, and could reasonably be expected to be, filed against the company. Although it is not possible to estimate the full range of costs because of various uncertainties, Bates White advised us that it would be able to determine an estimate of probable defense and indemnity costs which could be incurred to resolve pending and future Rockwell legacy asbestos-related claims. Accordingly, the company has recorded $16 million liability for defense and indemnity costs associated with these claims at September 30, 2009, and 2008. The accrual estimates are based on historical data and certain assumptions with respect to events that occur in the future. The uncertainties of asbestos claim litigation and resolution of the litigation with the insurance companies make it difficult to predict accurately the ultimate resolution of asbestos claims. That uncertainty is increased by the possibility of adverse rulings or new legislation affecting asbestos claim litigation or the settlement process.
Rockwell maintained insurance coverage that management believes covers indemnity and defense costs, over and above self-insurance retentions, for most of these claims. The company has initiated claims against these carriers to enforce the insurance policies. The company expects to recover some portion of defense and indemnity costs it has incurred to date, over and above self-insured retentions, and some portion of the costs for defending asbestos claims going forward. Accordingly, the company has recorded an insurance receivable related to Rockwell legacy asbestos-related liabilities of $12 million and $16 million at September 30, 2009 and 2008, respectively. The decrease in the receivable at September 30, 2009 is primarily related to revised estimates associated with the recovery from insurers of costs incurred to date. If the assumptions with respect to the nature of pending and future claims, the cost to resolve claims and the amount of available insurance prove to be incorrect, the actual amount of liability for Rockwell asbestos-related claims, and the effect on the company, could differ materially from current estimates and, therefore, could have a material impact on our financial condition and results of operations.
Environmental — We record liabilities for environmental issues in the accounting period in which they are considered to be probable and the cost can be reasonably estimated. At environmental sites in which more than one potentially responsible party has been identified, we record a liability for our allocable share of costs related to our involvement with the site, as well as an allocable share of costs related to insolvent parties or unidentified shares. At environmental sites in which we are the only potentially responsible party, a liability is recorded for the total estimated costs of remediation before consideration of recovery from insurers or other third parties. The ultimate cost with respect to our environmental obligations could significantly exceed the costs we have recorded as liabilities and therefore could have a material impact on our financial condition and results of operations.
Significant factors considered by management when estimating environmental reserves include:
- Evaluations of current law and existing
technologies;
- The outcome of discussions with regulatory
agencies;
- Pysical and scientific data at the
site;
- Government requirements and legal standards;
and
- Proposed remedies and technologies.
Goodwill — Goodwill is reviewed for impairment annually or more frequently if certain indicators arise. If business conditions or other factors cause the operating results and cash flows of a reporting unit to decline, we may be required to record impairment charges for goodwill at that time. The goodwill impairment review is a two-step process. Step one consists of a comparison of the fair value of a reporting unit with its carrying amount. An impairment loss may be recognized if the review indicates that the carrying value of a reporting unit exceeds its fair value. Estimates of fair value are primarily determined by using discounted cash flows and market multiples on earnings. If the carrying amount of a reporting unit exceeds its fair value, step two requires the fair value of the reporting unit to be allocated to the underlying assets and liabilities of that reporting unit, resulting in an implied fair value of goodwill. If the carrying amount of the goodwill of the reporting unit exceeds the implied fair value, an impairment charge is recorded equal to the excess.
52
The impairment review is highly judgmental and involves the use of significant estimates and assumptions. These estimates and assumptions have a significant impact on the amount of any impairment charge recorded. Discounted cash flow methods are dependent upon assumptions of future sales trends, market conditions and cash flows of each reporting unit over several years. Actual cash flows in the future may differ significantly from those previously forecasted. Other significant assumptions include growth rates and the discount rate applicable to future cash flows.
Impairment of Long-Lived Assets — Long-lived assets, excluding goodwill, to be held and used are reviewed for impairment whenever adverse events or changes in circumstances indicate a possible impairment. An impairment loss is recognized when the long-lived assets’ carrying value exceeds the fair value. If business conditions or other factors cause the operating results and cash flows to decline, we may be required to record impairment charges at that time. Long-lived assets held for sale are recorded at the lower of their carrying amount or fair value less cost to sell. Significant judgments and estimates used by management when evaluating long-lived assets for impairment include:
- An assessment as to whether an adverse event
or circumstance has triggered the need for an impairment
review;
- Undiscounted future cash flows generated by
the asset; and
- Probability and estimated future cash flows associated with alternative courses of action that are being considered to recover the carrying amount of a long-lived asset.
Income Taxes — Deferred income tax assets and liabilities are recognized for the future tax consequences attributable to differences between financial statement carrying amounts of existing assets and liabilities and their respective tax bases and operating loss and tax credit carryforwards. Deferred tax assets and liabilities are measured using enacted tax rates expected to apply to taxable income in the years in which those temporary differences are expected to be recovered or settled. If it is more likely than not that the deferred tax asset will be realized, no valuation allowance is recorded. Management judgment is required in determining the company’s provision for income taxes, deferred tax assets and liabilities and the valuation allowance recorded against the company’s net deferred tax assets. The valuation allowance would need to be adjusted in the event future taxable income is materially different than amounts estimated. Significant judgments, estimates and factors considered by management in its determination of the probability of the realization of deferred tax assets include:
- Historical operating
results;
- Expectations of future
earnings;
- Tax planning strategies; and
- The extended period of time over which retirement medical and pension liabilities will be paid.
In fiscal year 2009, the company recorded a non-cash charge of $676 million, of which $665 million was recorded in the first fiscal quarter, to establish valuation allowances against its U.S. net deferred tax assets and the net deferred tax assets of its 100% owned subsidiaries including France, Germany, Italy, and Sweden and certain other countries. As previously disclosed in the fiscal year 2008 Form 10-K, the company had determined in prior periods that a valuation allowance was not necessary for the deferred tax assets in the U.S. based on several factors including: (a) numerous restructuring initiatives the company undertook in fiscal years 2007 and 2008, generating significant savings in future periods; (b) the expected recovery of the commercial vehicle market; (c) the implementation of a major cost reduction and value creation program to generate additional improvements in earnings in future periods and (d) the repatriation of foreign earnings, which would generate significant taxable income in fiscal year 2009 and reduce future net interest expense in the U.S.
The company believes that these valuation allowances are now required due to events and developments that occurred during the first quarter of fiscal year 2009. In conducting the first quarter 2009 analysis, the company utilized a consistent approach which considers its three-year historical cumulative income (loss) including an assessment of the degree to which any losses were driven by items that are unusual in nature and incurred in order to achieve profitability in the future. In addition, the company reviewed changes in near-term market conditions and any other factors arising during the period which may impact future operating results. Both positive and negative evidence were considered in the analysis. Significant negative evidence exists due to the deterioration of the global markets. The analysis for the first quarter of fiscal year 2009 showed a three-year historical cumulative loss in the U.S., France, Germany, Italy and Sweden. The losses continue to exist even after adjusting the results to remove unusual items and charges, which is considered a significant factor in the analysis as it is objectively verifiable and therefore, significant negative evidence. In addition, the global market deterioration reduced the expected impact of tax planning strategies that were included in our analysis. Accordingly, based on a three year historical cumulative loss, combined with significant and inherent uncertainty as to the timing of when the company would be able to generate the necessary level of earnings to recover its deferred tax assets in the U.S., France, Germany, Italy and Sweden, the company concluded that valuation allowances were required.
53
During the fourth quarter of fiscal year 2008, we recognized a non-cash income tax charge of approximately $137 million related to repatriation of earnings of certain foreign subsidiaries of the company to the U.S. These actions have decreased the amount of our deferred tax assets in the U.S.
The expiration periods for $875 million of deferred tax assets related to net operating losses and tax credit carryforwards are as follows: $13 million between fiscal years 2010 and 2014; $138 million between fiscal years 2015 and 2024; $449 million between fiscal years 2025 and 2029; and $275 million can be carried forward indefinitely. The company has provided valuation allowances on these deferred tax assets of approximately $13 million, $138 million, $441 million and $273 million, respectively.
New Accounting Pronouncements
New accounting standards to be implemented:
On October 1, 2008, we partially adopted as required, Financial Accounting Standards Board (FASB) Accounting Standards Codification (ASC) Topic 820, “Fair Value Measurements and Disclosures” which provides a definition of fair value, establishes a framework for measuring fair value and requires expanded disclosures about fair value measurements (see “Accounting standards implemented in fiscal year 2009” below). In February 2008, the FASB approved additional guidance on this matter that permits companies to partially defer the effective date of Topic 820 for one year for non-financial assets and non-financial liabilities that are recognized or disclosed at fair value in the financial statements on a nonrecurring basis. The additional guidance does not permit companies to defer recognition and disclosure requirements for financial assets and financial liabilities or for non-financial assets and non-financial liabilities that are remeasured at least annually. We have elected to defer the adoption of Topic 820 with respect to certain non-financial assets and liabilities as permitted. We do not expect that the adoption of the guidance with respect to non-financial assets and liabilities will have any significant effect on our financial statements.
In December 2007, the FASB issued consolidation guidance that establishes accounting and reporting standards for the noncontrolling interest in a subsidiary and for the deconsolidation of a subsidiary. The guidance clarifies that a noncontrolling interest in a subsidiary should be reported as equity in the consolidated financial statements. The guidance also changes the way the consolidated income statement is presented by requiring consolidated net income to be reported at amounts that include the amounts attributable to both the parent and the noncontrolling interest. It also requires disclosure, on the face of the consolidated statement of income, of the amounts of consolidated net income attributable to the parent and to the noncontrolling interest. The statement also requires that a parent recognize a gain or loss in net income when a subsidiary is deconsolidated. If a parent retains a noncontrolling equity investment in the former subsidiary, that investment is measured at its fair value. This guidance is effective for our fiscal year beginning October 1, 2009 and, as required, will be applied prospectively, except for the presentation and disclosure requirements, which will be applied retrospectively for all periods presented. We will modify the presentation and disclosure of noncontrolling interests in accordance with the requirement of the statement. The adoption of this consolidation guidance is not expected to have any other significant effect on our financial statements.
In May 2008, the FASB issued guidance contained in ASC Topic 470-20, “Debt with Conversion and Other Option” which applies to all convertible debt instruments that have a “net settlement feature”, which means that such convertible debt instruments, by their terms, may be settled either wholly or partially in cash upon conversion. This topic requires issuers of convertible debt instruments that may be settled wholly or partially in cash upon conversion to separately account for the liability and equity components in a manner reflective of the issuers’ nonconvertible debt borrowing rate. Topic 470-20 is effective for financial statements issued for fiscal years beginning after December 15, 2008 and interim periods within those fiscal years. Early adoption is not permitted and retroactive application to all periods presented is required. The accounting for our outstanding $300 million and $200 million convertible notes due in fiscal years 2026 and 2027, respectively, will be impacted by this guidance. Upon adoption, we will account for the debt and equity components of these convertible notes separately and expect to recognize an equity component of the convertible notes in the range of $150 million to $200 million. The equity component will be amortized as non-cash interest expense over the term of the respective convertible notes using the effective interest method.
In June 2008, the FASB issued earnings per share guidance which addresses whether instruments granted in share-based payment transactions are participating securities prior to vesting and, therefore, need to be included in the earnings allocation in computing earnings per share under the two-class method. The guidance affects entities that accrue dividends on share-based payment awards during the awards’ service period when the dividends do not need to be returned if the employees forfeit the award. This guidance is effective for fiscal years beginning after December 15, 2008, and interim periods within those years, with early application not permitted. We do not expect this guidance to have a significant impact on our consolidated financial statements.
In December 2008, the FASB issued guidance on defined benefit plans that requires new disclosures on investment policies and strategies, categories of plan assets, fair value measurements of plan assets, and significant concentrations of risk, and is effective for fiscal years ending after December 15, 2009, with earlier application permitted. We will reflect the impact of this guidance in our consolidated financial statements upon adoption.
54
In June 2009, the FASB issued guidance on accounting for transfer of financial assets, which guidance changes the requirements for recognizing the transfer of financial assets and requires additional disclosures about a transferor’s continuing involvement in transferred financial assets. The guidance also eliminates the concept of a “qualifying special purpose entity” when assessing transfers of financial instruments. This guidance is effective for the first annual reporting period that begins after November 15, 2009 and for interim periods beginning in the first annual reporting period and periods thereafter. We are currently evaluating the impact, if any, of the new requirements on our consolidated financial statements.
In June 2009, the FASB issued guidance for the consolidation of variable interest entities (VIEs) to address the elimination of the concept of a qualifying special purpose entity. This guidance replaces the quantitative-based risks and rewards calculation for determining which enterprise has a controlling financial interest in a variable interest entity with an approach focused on identifying which enterprise has the power to direct the activities of variable interest entity, and the obligation to absorb losses of the entity or the right to receive benefits from the entity. Additionally, the new guidance requires any enterprise that holds a variable interest in a variable interest entity to provide enhanced disclosures that will provide users of financial statements with more transparent information about an enterprise’s involvement in a variable interest entity. This guidance is effective for the first annual reporting periods beginning after November 15, 2009, for interim periods within that first annual reporting period, and for interim and annual reporting periods thereafter. We are currently assessing what impact, if any, that this guidance will have on our financial position, results of operations and cash flows.
Accounting standards implemented in fiscal year 2009:
In September 2006, the FASB issued guidance pertaining to retirement benefits. We adopted the recognition requirements of this guidance related to the funded status of defined benefit pension plans and other postretirement benefit plans as of September 30, 2007. The guidance also requires that companies measure the funded status of their defined benefit pension plans and other postretirement benefit plans as of the balance sheet date. We elected to adopt the measurement date provisions at October 1, 2008. Prior to adopting these provisions, we used a measurement date of June 30 for our defined benefit and other postretirement benefit plans. Using the “one-measurement” approach, the impact of adopting the measurement date provisions as of October 1, 2008 was an increase to accumulated deficit of $20 million ($20 million after-tax), representing the net periodic benefit cost for the period between the measurement date utilized in fiscal year 2008 and the beginning of fiscal year 2009, which previously would have been expensed in the first quarter of fiscal year 2009 on a delayed basis.
On October 1, 2008, we partially adopted as required, FASB ASC Topic 820 “Fair Value Measurements and Disclosures” which provides a definition of fair value, establishes a framework for measuring fair value and requires expanded disclosures about fair value measurements. We adopted the measurement and disclosure requirements of this topic relating to our financial assets and financial liabilities which are measured on a recurring basis (at least annually). The adoption of Topic 820 did not have a material impact on our fair value measurements.
Topic 820 defines fair value as the price that would be received for an asset or paid to transfer a liability (an exit price) in the principal most advantageous market for the asset or liability in an orderly transaction between market participants. The topic establishes a fair value hierarchy, which prioritizes the inputs used in measuring fair value into the following levels:
Level 1 — Quoted prices in active markets for identical assets or liabilities.
Level 2 — Inputs, other than quoted prices in active markets, that are observable either directly or indirectly.
Level 3 — Unobservable inputs based on the entity’s own assumptions.
Our financial assets and liabilities recognized at fair value on a recurring basis at September 30, 2009 were not significant.
In October 2008, the FASB issued additional guidance related to fair value measurements and disclosures which clarifies the application of FASB ASC Topic 820 and key considerations in determining the fair value of a financial asset when the market for that financial asset is not active. This additional guidance is effective upon issuance, including prior periods for which financial statements have not been issued. The issuance of this guidance did not have any impact on our results of operations or financial position.
In April 2009, the FASB issued supplementary guidance pertaining to fair value measurements and disclosures which provides additional guidance for estimating fair value when the market activity for an asset or liability has declined significantly. This guidance is effective for interim and annual periods ending after June 15, 2009. There were no adjustments to our estimates of fair value for assets and liabilities measured at fair value upon adoption of this guidance.
On January 1, 2009, we adopted, as required, the FASB’s additional guidance on derivatives and hedging which requires expanded disclosures about derivative and hedging activities. This guidance has the same scope as previous guidance; however it changes the disclosure requirements for derivative instruments and hedging activities. Enhanced disclosures are required about (a) how and why an entity uses derivative instruments, (b) how derivative instruments and related hedged items are accounted for and (c) how derivative instruments and related hedged items affect an entity’s financial position, financial performance and cash flows. The adoption of this guidance did not have a material effect on our financial statements other than providing certain enhanced disclosures.
55
In May 2009, the FASB issued guidance on subsequent events which requires the disclosure of the date through which an entity has evaluated subsequent events and whether that date represents the date the financial statements were issued or were available to be issued. This guidance is effective for interim or annual financial periods ending after June 15, 2009, and is to be applied prospectively. We adopted this guidance effective June 30, 2009 and added appropriate disclosure in our consolidated financial statements consistent with the requirements of this guidance.
In June 2009, the FASB issued guidance which establishes the FASB Accounting Standards Codification (“Codification”) as the source of authoritative U.S. generally accepted accounting principles to be applied to nongovernmental entities and rules and interpretive releases of the SEC as authoritative GAAP for SEC registrants. This guidance is effective for financial statements issued for interim and annual periods ending after September 15, 2009 and supersedes all then-existing non-SEC accounting and reporting standards. All of the content in the Codification carries the same level of authority and all non-grandfathered non-SEC accounting literature not included in the codification is deemed nonauthoritative. The adoption of the codification did not have a significant effect on our consolidated financial statements or disclosures.
International Operations
Approximately 62 percent of the company’s total assets, excluding assets of discontinued operations, as of September 30, 2009, and 61 percent of fiscal 2009 sales from continuing operations were outside the U.S. Management believes that international operations have significantly benefited the financial performance of the company. However, our international operations are subject to a number of risks inherent in operating abroad. There can be no assurance that these risks will not have a material adverse impact on our ability to increase or maintain our foreign sales or on our financial condition or results of operations.
Item 7A. Quantitative and Qualitative Disclosures About Market Risk
We are exposed to certain global market risks, including foreign currency exchange risk and interest rate risk associated with our debt.
Foreign currency exchange risk is the possibility that our financial results could be better or worse than planned because of changes in foreign currency exchange rates. Accordingly, we use foreign currency forward contracts to minimize the earnings exposures arising from foreign currency exchange risk. Gains and losses on the underlying foreign currency exposures are partially offset with gains and losses on the foreign currency forward contracts. Under this cash flow hedging program, we have designated the foreign currency contracts (the contracts) as cash flow hedges of underlying foreign currency forecasted purchases and sales. The effective portion of changes in the fair value of the contracts is recorded in Accumulated Other Comprehensive Loss (AOCL) in the statement of shareowners’ equity and is recognized in operating income when the underlying forecasted transaction impacts earnings. The contracts generally mature within 12 months.
Interest rate risk relates to the gain/increase or loss/decrease we could incur in our debt balances and interest expense. To manage this risk, we enter into interest rate swaps from time to time to economically convert portions of our fixed-rate debt into floating rate exposure, ensuring that the sensitivity of the economic value of debt falls within our corporate risk tolerances. We had no outstanding interest rate swaps at September 30, 2009. It is our policy not to enter into derivative instruments for speculative purposes, and therefore, we hold no derivative instruments for trading purposes.
Included below is a sensitivity analyses to measure the potential gain (loss) in the fair value of financial instruments with exposure to market risk. The model assumes a 10% hypothetical change (increase or decrease) in exchange rates and instantaneous, parallel shifts of 50 basis points in interest rates.
| Market Risk | Assuming a | Assuming a | Favorable / | ||||||
| 10% Increase | 10% Decrease | (Unfavorable) | |||||||
| in Rates | in Rates | Impact on | |||||||
| Foreign Currency Sensitivity: | |||||||||
| Forward contracts in USD(1) | $ | — | $ | — | Fair Value | ||||
| Foreign currency denominated debt | 1.6 | (1.6 | ) | Fair Value | |||||
| Forward contracts in EUR(1) | (8.9 | ) | 8.9 | Fair Value | |||||
56
| Assuming a 50 | Assuming a 50 | Favorable / | ||||||
| BPS Increase in | BPS Decrease | (Unfavorable) | ||||||
| Rates | in Rates | Impact on | ||||||
| Interest Rate Sensitivity: | ||||||||
| Debt - fixed rate | $ | (25.3 | ) | $ | 26.8 | Fair Value | ||
| Debt - variable rate(2) | (0.6 | ) | 0.6 | Cash Flow | ||||
| (1) | Includes only the risk related to the derivative instruments and does not include the risk related to the underlying exposure. The analysis assumes overall derivative instruments and debt levels remain unchanged for each hypothetical scenario. | |
| (2) | Includes domestic and foreign debt. |
At September 30, 2009 a 10% decrease in quoted currency exchange rates would result in no change in forward contracts in USD, a potential loss of approximately $1.6 million in foreign currency denominated debt and a potential gain of approximately $8.9 million in forward contracts in EUR.
At September 30, 2009 the fair value of debt outstanding was approximately $982 million. A 50 basis points decrease in quoted interest rates would result in favorable impacts of $26.8 million and $0.6 million in fixed rate debt and variable rate debt, respectively.
57
Item 8. Financial Statements and Supplementary Data.
REPORT OF INDEPENDENT REGISTERED PUBLIC ACCOUNTING FIRM
To the Board of Directors and
Shareowners of ArvinMeritor, Inc.
Troy, Michigan
We have audited the accompanying consolidated balance sheets of ArvinMeritor, Inc. and subsidiaries (the “Company”) as of September 27, 2009 and September 28, 2008 and the related consolidated statements of operations, shareowners’ equity (deficit) and comprehensive loss, and cash flows for each of the three years in the period ended September 27, 2009. Our audits also included the consolidated financial statement schedule listed in the Index at Item 15(a)(2). These consolidated financial statements and financial statement schedule are the responsibility of the Company's management. Our responsibility is to express an opinion on the consolidated financial statements and financial statement schedule based on our audits.
We conducted our audits in accordance with the standards of the Public Company Accounting Oversight Board (United States). Those standards require that we plan and perform the audit to obtain reasonable assurance about whether the financial statements are free of material misstatement. An audit includes examining, on a test basis, evidence supporting the amounts and disclosures in the financial statements. An audit also includes assessing the accounting principles used and significant estimates made by management, as well as evaluating the overall financial statement presentation. We believe that our audits provide a reasonable basis for our opinion.
In our opinion, such consolidated financial statements present fairly, in all material respects, the financial position of the Company as of September 27, 2009 and September 28, 2008, and the results of their operations and their cash flows for each of the three years in the period ended September 27, 2009, in conformity with accounting principles generally accepted in the United States of America. Also, in our opinion, such consolidated financial statement schedule, when considered in relation to the basic consolidated financial statements taken as a whole, presents fairly, in all material respects, the information set forth therein.
As discussed in Note 2 to the consolidated financial statements, on September 29, 2008, the Company changed the measurement date of its defined benefit plan assets and liabilities to coincide with its year end. Also on September 30, 2007, the Company began to recognize the funded status of its defined benefit pension and postretirement plans in its consolidated balance sheet.
We have also audited, in accordance with the standards of the Public Company Accounting Oversight Board (United States), the Company's internal control over financial reporting as of September 27, 2009, based on the criteria established in Internal Control—Integrated Framework issued by the Committee of Sponsoring Organizations of the Treadway Commission and our report dated November 18, 2009 expressed an unqualified opinion on the Company's internal control over financial reporting.
Detroit, Michigan
November 18,
2009
58
ARVINMERITOR,
INC.
CONSOLIDATED STATEMENT OF
OPERATIONS
(In millions, except per share amounts)
| Year Ended September 30, | ||||||||||||
| 2009 | 2008 | 2007 | ||||||||||
| Sales | $ | 4,108 | $ | 6,390 | $ | 5,720 | ||||||
| Cost of sales | (3,804 | ) | (5,828 | ) | (5,323 | ) | ||||||
| GROSS MARGIN | 304 | 562 | 397 | |||||||||
| Selling, general and administrative | (290 | ) | (415 | ) | (356 | ) | ||||||
| Restructuring costs | (80 | ) | (9 | ) | (62 | ) | ||||||
| Asset impairment charges | (153 | ) | — | — | ||||||||
| Goodwill impairment charge | (70 | ) | — | — | ||||||||
| Other operating expense, net | (1 | ) | (3 | ) | (1 | ) | ||||||
| OPERATING INCOME (LOSS) | (290 | ) | 135 | (22 | ) | |||||||
| Equity in earnings of affiliates | 15 | 38 | 34 | |||||||||
| Interest expense, net | (86 | ) | (80 | ) | (109 | ) | ||||||
| INCOME (LOSS) BEFORE INCOME TAXES | (361 | ) | 93 | (97 | ) | |||||||
| Benefit (provision) for income taxes | (707 | ) | (197 | ) | 13 | |||||||
| Minority interest | (9 | ) | (11 | ) | (9 | ) | ||||||
| LOSS FROM CONTINUING OPERATIONS | (1,077 | ) | (115 | ) | (93 | ) | ||||||
| INCOME (LOSS) FROM DISCONTINUED OPERATIONS, net of tax | (135 | ) | 14 | (126 | ) | |||||||
| NET LOSS | $ | (1,212 | ) | $ | (101 | ) | $ | (219 | ) | |||
| BASIC EARNINGS (LOSS) PER SHARE | ||||||||||||
| Continuing operations | $ | (14.86 | ) | $ | (1.60 | ) | $ | (1.32 | ) | |||
| Discontinued operations | (1.86 | ) | 0.20 | (1.79 | ) | |||||||
| Basic loss per share | $ | (16.72 | ) | $ | (1.40 | ) | $ | (3.11 | ) | |||
| DILUTED EARNINGS (LOSS) PER SHARE | ||||||||||||
| Continuing operations | $ | (14.86 | ) | $ | (1.60 | ) | $ | (1.32 | ) | |||
| Discontinued operations | (1.86 | ) | 0.20 | (1.79 | ) | |||||||
| Diluted loss per share | $ | (16.72 | ) | $ | (1.40 | ) | $ | (3.11 | ) | |||
| Basic average common shares outstanding | 72.5 | 72.1 | 70.5 | |||||||||
| Diluted average common shares outstanding | 72.5 | 72.1 | 70.5 | |||||||||
See Notes to Consolidated Financial Statements. Amounts for prior periods have been recasted for discontinued operations.
59
ARVINMERITOR,
INC.
CONSOLIDATED BALANCE SHEET
(In millions)
| September 30, | ||||||||
| 2009 | 2008 | |||||||
| ASSETS | ||||||||
| CURRENT ASSETS: | ||||||||
| Cash and cash equivalents | $ | 95 | $ | 497 | ||||
| Receivables, trade and other, net | 694 | 1,114 | ||||||
| Inventories | 374 | 623 | ||||||
| Other current assets | 97 | 218 | ||||||
| Assets of discontinued operations | 56 | — | ||||||
| TOTAL CURRENT ASSETS | 1,316 | 2,452 | ||||||
| NET PROPERTY | 445 | 775 | ||||||
| GOODWILL | 438 | 522 | ||||||
| OTHER ASSETS | 309 | 925 | ||||||
| TOTAL ASSETS | $ | 2,508 | $ | 4,674 | ||||
| LIABILITIES AND SHAREOWNERS’ EQUITY (DEFICIT) | ||||||||
| CURRENT LIABILITIES: | ||||||||
| Short-term debt | $ | 97 | $ | 240 | ||||
| Accounts payable | 674 | 1,287 | ||||||
| Other current liabilities | 411 | 610 | ||||||
| Liabilities of discontinued operations | 107 | — | ||||||
| TOTAL CURRENT LIABILITIES | 1,289 | 2,137 | ||||||
| LONG-TERM DEBT | 1,080 | 1,063 | ||||||
| RETIREMENT BENEFITS | 1,077 | 690 | ||||||
| OTHER LIABILITIES | 310 | 247 | ||||||
| MINORITY INTERESTS | 29 | 75 | ||||||
| SHAREOWNERS’ EQUITY (DEFICIT): | ||||||||
| Common stock (September 30, 2009 and 2008, 74.0 and 73.8 shares issued and outstanding, | ||||||||
| respectively) | 72 | 72 | ||||||
| Additional paid-in capital | 632 | 625 | ||||||
| Accumulated deficit | (1,247 | ) | (7 | ) | ||||
| Treasury stock (September 30, 2009 and 2008, 0.1 shares) | — | (3 | ) | |||||
| Accumulated other comprehensive loss | (734 | ) | (225 | ) | ||||
| TOTAL SHAREOWNERS’ EQUITY (DEFICIT) | (1,277 | ) | 462 | |||||
| TOTAL LIABILITIES AND SHAREOWNERS’ EQUITY (DEFICIT) | $ | 2,508 | $ | 4,674 | ||||
See Notes to Consolidated Financial Statements.
60
ARVINMERITOR,
INC.
CONSOLIDATED STATEMENT OF
CASH FLOWS
(In millions)
| Year Ended September 30, | ||||||||||||
| 2009 | 2008 | 2007 | ||||||||||
| OPERATING ACTIVITIES | ||||||||||||
| CASH PROVIDED BY (USED FOR) OPERATING ACTIVITIES (see Note 26) | $ | (295 | ) | $ | 163 | $ | 36 | |||||
| INVESTING ACTIVITIES | ||||||||||||
| Capital expenditures | (111 | ) | (138 | ) | (86 | ) | ||||||
| Acquisitions of businesses and investments, net of cash acquired | — | (60 | ) | (2 | ) | |||||||
| Proceeds from disposition of property and businesses | 4 | 9 | 14 | |||||||||
| Proceeds from investments and sale of marketable securities | 6 | 5 | 5 | |||||||||
| Net investing cash flows used for continuing operations | (101 | ) | (184 | ) | (69 | ) | ||||||
| Net investing cash flows provided by discontinued operations | 115 | 24 | 165 | |||||||||
| CASH PROVIDED BY (USED FOR) INVESTING ACTIVITIES | 14 | (160 | ) | 96 | ||||||||
| FINANCING ACTIVITIES | ||||||||||||
| Borrowings (payments) on prior accounts receivable securitization program | (111 | ) | 111 | (40 | ) | |||||||
| Borrowings on new accounts receivable securitization program | 83 | — | — | |||||||||
| Borrowings on revolving credit facility, net | 28 | — | — | |||||||||
| Proceeds from issuance of convertible notes and term loan | — | — | 200 | |||||||||
| Repayment of notes and term loan | (83 | ) | (5 | ) | (249 | ) | ||||||
| Borrowings (payments) on lines of credit and other | (9 | ) | 13 | (4 | ) | |||||||
| Net change in debt | (92 | ) | 119 | (93 | ) | |||||||
| Cash dividends | (8 | ) | (29 | ) | (29 | ) | ||||||
| Debt issuance and extinguishment costs | — | (6 | ) | (10 | ) | |||||||
| Proceeds from exercise of stock options | — | — | 28 | |||||||||
| Other financing activities | — | — | (1 | ) | ||||||||
| Net financing cash flows provided by (used for) continuing operations | (100 | ) | 84 | (105 | ) | |||||||
| Net financing cash flows provided by (used for) discontinued operations | (6 | ) | 13 | 7 | ||||||||
| CASH PROVIDED BY (USED FOR) FINANCING ACTIVITIES | (106 | ) | 97 | (98 | ) | |||||||
| EFFECT OF CURRENCY EXCHANGE RATES ON CASH AND CASH EQUIVALENTS | (15 | ) | (12 | ) | 25 | |||||||
| CHANGE IN CASH AND CASH EQUIVALENTS | (402 | ) | 88 | 59 | ||||||||
| CASH AND CASH EQUIVALENTS AT BEGINNING OF YEAR | 497 | 409 | 350 | |||||||||
| CASH AND CASH EQUIVALENTS AT END OF YEAR | $ | 95 | $ | 497 | $ | 409 | ||||||
See Notes to Consolidated Financial Statements. Amounts for prior periods have been recasted for discontinued operations.
61
ARVINMERITOR,
INC.
CONSOLIDATED STATEMENTS OF
SHAREOWNERS’ EQUITY (DEFICIT)
AND COMPREHENSIVE LOSS
(In millions, except per share amounts)
| Year Ended September 30, | ||||||||||||
| 2009 | 2008 | 2007 | ||||||||||
| COMMON STOCK | ||||||||||||
| Beginning balance | $ | 72 | $ | 72 | $ | 71 | ||||||
| Exercise of stock options | — | — | 1 | |||||||||
| Ending balance | 72 | 72 | 72 | |||||||||
| ADDITIONAL PAID-IN CAPITAL | ||||||||||||
| Beginning balance | 625 | 618 | 587 | |||||||||
| Equity based compensation expense | 10 | 7 | 13 | |||||||||
| Exercise of stock options | — | — | 18 | |||||||||
| Issuance of restricted stock | (3 | ) | — | — | ||||||||
| Ending balance | 632 | 625 | 618 | |||||||||
| RETAINED EARNINGS (ACCUMULATED DEFICIT) | ||||||||||||
| Beginning balance | (7 | ) | 128 | 376 | ||||||||
| Net loss | (1,212 | ) | (101 | ) | (219 | ) | ||||||
| Cash dividends (per share $0.10: 2009; $0.40: 2008 and 2007) | (8 | ) | (29 | ) | (29 | ) | ||||||
| Adjustment upon adoption of income tax guidance | — | (5 | ) | — | ||||||||
| Adjustment upon adoption of retirement benefits guidance | (20 | ) | — | — | ||||||||
| Ending balance | (1,247 | ) | (7 | ) | 128 | |||||||
| TREASURY STOCK | ||||||||||||
| Beginning balance | (3 | ) | (3 | ) | (11 | ) | ||||||
| Exercise of stock options | — | — | 9 | |||||||||
| Issuance of restricted stock | 3 | — | — | |||||||||
| Other | — | — | (1 | ) | ||||||||
| Ending balance | — | (3 | ) | (3 | ) | |||||||
| ACCUMULATED OTHER COMPREHENSIVE LOSS | ||||||||||||
| Beginning balance | (225 | ) | (272 | ) | (79 | ) | ||||||
| Foreign currency translation adjustments | (63 | ) | (13 | ) | 36 | |||||||
| Minimum pension liability adjustment, net of tax of $52 | — | — | 126 | |||||||||
| Adjustments upon adoption of retirement benefits guidance, net of tax of $0 and $193 in | ||||||||||||
| fiscal years 2009 and 2007, respectively | 9 | — | (357 | ) | ||||||||
| Employee benefit related adjustments, net of tax of $2 and $44 in fiscal years 2009 and | ||||||||||||
| 2008, respectively | (465 | ) | 71 | — | ||||||||
| Unrealized gains (losses) | 10 | (11 | ) | 2 | ||||||||
| Ending balance | (734 | ) | (225 | ) | (272 | ) | ||||||
| TOTAL SHAREOWNERS’ EQUITY (DEFICIT) | $ | (1,277 | ) | $ | 462 | $ | 543 | |||||
| COMPREHENSIVE LOSS | ||||||||||||
| Net loss | $ | (1,212 | ) | $ | (101 | ) | $ | (219 | ) | |||
| Foreign currency translation adjustments | (63 | ) | (13 | ) | 36 | |||||||
| Minimum pension liability adjustment, net of tax | — | — | 126 | |||||||||
| Adjustments upon adoption of retirement benefits guidance, net of tax | 9 | — | — | |||||||||
| Employee benefit related adjustments, net of tax | (465 | ) | 71 | — | ||||||||
| Unrealized gains (losses) | 10 | (11 | ) | 2 | ||||||||
| TOTAL COMPREHENSIVE LOSS | $ | (1,721 | ) | $ | (54 | ) | $ | (55 | ) | |||
See Notes to Consolidated Financial Statements.
62
ARVINMERITOR, INC.
NOTES TO
CONSOLIDATED FINANCIAL STATEMENTS
1. BASIS OF PRESENTATION
ArvinMeritor, Inc. (the "company" or "ArvinMeritor"), headquartered in Troy, Michigan, is a premier global supplier of a broad range of integrated systems, modules and components to original equipment manufacturers (“OEMs”) and the aftermarket for the commercial vehicle, transportation and industrial sectors. The company serves commercial truck, trailer, off-highway, military, bus and coach and other industrial OEMs and certain aftermarkets, and light vehicle OEMs. The consolidated financial statements are those of the company and its consolidated subsidiaries.
Certain businesses are reported in discontinued operations in the consolidated statement of operations, statement of cash flows and related notes for all periods presented. Additional information regarding discontinued operations is discussed in Note 3.
The company’s fiscal year ends on the Sunday nearest September 30. The 2009, 2008 and 2007 fiscal years ended on September 27, 2009, September 28, 2008, and September 30, 2007. All year and quarter references relate to the company’s fiscal year and fiscal quarters, unless otherwise stated. For ease of presentation, September 30 is used consistently throughout this report to represent the fiscal year end.
Cash flow in fiscal year 2009 was negatively affected by decreased earnings due to lower sales and will continue to be negatively impacted due to continued lowered production and the current volatility in the financial markets, which could affect certain of the company’s customers or vendors. The company saw its usage of the revolving credit facility throughout the first six months of the fiscal year increase significantly to meet working capital requirements, including reductions in accounts receivable factoring programs. However, stronger cash flow, improved regional cash efficiencies and the sale of certain light vehicle businesses allowed the company to reduce usage of the revolver, including letters of credit, by $300 million at fiscal year end as compared to second quarter end. At September 30, 2009, the company had $95 million in cash and cash equivalents and an undrawn amount of $611 million under the revolving credit facility. Availability under the revolving credit facility is subject to a senior secured debt to EBITDA ratio covenant, as defined in the agreement, which will likely limit borrowings under the agreement as of each quarter end. As long as the company is in compliance with this covenant as of the quarter end, it has full availability under the revolving credit facility every other day during the quarter. The company was in compliance with this covenant as of September 30, 2009.
The company’s future liquidity is subject to a number of factors, including access to adequate funding under its senior secured credit facility, vehicle production schedules and customer demand and access to other borrowing arrangements such as factoring or securitization facilities. Even taking into account these and other factors, and with the assumption that the current trends in the commercial vehicle and automotive industries continue, management expects to have sufficient liquidity to fund the company’s operating requirements through the term of the existing revolving credit facility in June 2011. Accordingly, the accompanying financial statements have been prepared on a going concern basis.
The company has evaluated subsequent events through November 18, 2009, the date that the consolidated financial statements were issued. The subsequent events include the completion of the sale of the company’s 57 percent interest in Meritor Suspension Systems Company on October 30, 2009. In connection with the sale of the company’s interest in MSSC, the company provided certain indemnifications to the buyer for its share of obligations related to taxes, pension funding shortfall, environmental and other contingencies, and certain accounts receivable and inventories. The company’s exposure under these indemnities is approximately $24 million. See Note 3 for additional disclosures related to this matter.
2. SIGNIFICANT ACCOUNTING POLICIES
Use of Estimates
The preparation of financial statements in accordance with accounting principles generally accepted in the United States of America (U.S.) (GAAP) requires the use of estimates and assumptions related to the reporting of assets, liabilities, revenues, expenses and related disclosures. Actual results could differ from these estimates. Significant estimates and assumptions were used to value goodwill and other long-lived assets, including impairment charges (see Notes 3, 4 and 5), costs associated with the company’s restructuring actions (see Note 5), product warranty liabilities (see Note 14), long-term incentive compensation plan obligations (see Note 19), retiree medical and pension obligations (see Notes 20 and 21), income taxes (see Note 22), and contingencies including asbestos and environmental matters (see Note 23).
Consolidation and Joint Ventures
The consolidated financial statements include the accounts of the company and those subsidiaries in which the company has control. All significant intercompany balances and transactions are eliminated in consolidation. The balance sheet and results of operations of controlled subsidiaries where ownership is greater than 50 percent, but less than 100 percent, are included in the consolidated financial statements and are offset by a related minority interest expense and liability recorded for the minority interest ownership. Investments in affiliates that are not controlled or majority-owned are reported using the equity method of accounting (see Note 13).
63
ARVINMERITOR, INC.
NOTES TO
CONSOLIDATED FINANCIAL STATEMENTS — (Continued)
Foreign Currency
Local currencies are generally considered the functional currencies for operations outside the U.S. For operations reporting in local currencies, assets and liabilities are translated at year-end exchange rates with cumulative currency translation adjustments included as a component of Accumulated Other Comprehensive Loss in the consolidated balance sheet. Income and expense items are translated at average rates of exchange during the year.
Impairment of Long-Lived Assets
Long-lived assets, excluding goodwill, to be held and used are reviewed for impairment whenever adverse events or changes in circumstances indicate a possible impairment. An impairment loss is recognized when a long-lived asset’s carrying value exceeds the fair value. If business conditions or other factors cause the operating results and cash flows to decline, the company may be required to record impairment charges at that time (see Note 11).
Long-lived assets held for sale are recorded at the lower of their carrying amount or estimated fair value less cost to sell.
Discontinued Operations
A business component that either has been disposed of or is classified as held for sale is reported as discontinued operations if the cash flows of the component have been or will be eliminated from the ongoing operations of the company and the company will no longer have any significant continuing involvement in the business component. The results of discontinued operations are aggregated and presented separately in the consolidated statement of operations and consolidated statement of cash flows. Assets and liabilities of the discontinued operations, if included in the disposal group, are aggregated and reported separately as assets and liabilities of discontinued operations in the consolidated balance sheet (see Note 3).
Revenue Recognition
Revenues are recognized upon shipment of product and transfer of ownership to the customer. Provisions for customer sales allowances and incentives are recorded as a reduction of sales at the time of product shipment. The company recognizes “pass-through” sales for certain of its OEM customers. These pass-through sales occur when, at the direction of the OEM customers, the company purchases components from suppliers, uses them in the company’s manufacturing process, and sells them as part of a completed system.
Allowance for Doubtful Accounts
An allowance for uncollectible trade receivables is recorded when accounts are deemed uncollectible based on consideration of write-off history, aging analysis, and any specific, known troubled accounts.
Earnings per Share
Basic earnings (loss) per share is calculated using the weighted average number of shares outstanding during each year. The diluted earnings (loss) per share calculation includes the impact of dilutive common stock options, restricted stock, performance share awards and convertible securities, if applicable. Basic and diluted average common shares outstanding at September 30, 2009, 2008 and 2007 are 72.5 million, 72.1 million and 70.5 million, respectively.
The potential effects of restricted stock and stock options were excluded from the diluted earnings per share calculation for the fiscal years ended September 30, 2009, 2008 and 2007 because their inclusion in a net loss period would reduce the net loss per share. Therefore, at September 30, 2009, 2008, and 2007, options to purchase 1.7 million, 2.1 million and 2.4 million shares of common stock, respectively, were excluded from the computation of diluted earnings per share. In addition, 1.3 million, 1.5 million and 0.8 million shares of restricted stock were excluded from the computation of diluted earnings per share at September 30, 2009, 2008 and 2007. The company’s convertible senior unsecured notes are excluded from the computation of diluted earnings per share, as the company’s average stock price during the quarter is less than the conversion price.
Other
Other significant accounting policies are included in the related notes, specifically, inventories (Note 9), customer reimbursable tooling and engineering (Note 10), property and depreciation (Note 11), capitalized software (Note 12), product warranties (Note 14), financial instruments (Note 17), equity based compensation (Note 19), retirement medical plans (Note 20), retirement pension plans (Note 21), income taxes (Note 22) and environmental and asbestos-related liabilities (Note 23).
64
ARVINMERITOR, INC.
NOTES TO
CONSOLIDATED FINANCIAL STATEMENTS — (Continued)
New accounting standards to be implemented:
On October 1, 2008, the company partially adopted as required, FASB Accounting Standards Codification (ASC) Topic 820, “Fair Value Measurements and Disclosures” which provides a definition of fair value, establishes a framework for measuring fair value and requires expanded disclosures about fair value measurements (see “Accounting standards implemented in fiscal year 2009” below). In February 2008, the FASB approved additional guidance on this matter that permits companies to partially defer the effective date of Topic 820 for one year for non-financial assets and non-financial liabilities that are recognized or disclosed at fair value in the financial statements on a nonrecurring basis. The additional guidance does not permit companies to defer recognition and disclosure requirements for financial assets and financial liabilities or for non-financial assets and non-financial liabilities that are remeasured at least annually. The company has elected to defer the adoption of Topic 820 with respect to certain non-financial assets and liabilities as permitted. The adoption of the guidance with respect to certain non-financial assets and liabilities is not expected to have any significant effect on the company’s financial statements.
In December 2007, the FASB issued consolidation guidance that establishes accounting and reporting standards for the noncontrolling interest in a subsidiary and for the deconsolidation of a subsidiary. The guidance clarifies that a noncontrolling interest in a subsidiary should be reported as equity in the consolidated financial statements. The guidance also changes the way the consolidated income statement is presented by requiring consolidated net income to be reported at amounts that include the amounts attributable to both the parent and the noncontrolling interest. It also requires disclosure, on the face of the consolidated statement of income, of the amounts of consolidated net income attributable to the parent and to the noncontrolling interest. The statement also requires that a parent recognize a gain or loss in net income when a subsidiary is deconsolidated. If a parent retains a noncontrolling equity investment in the former subsidiary, that investment is measured at its fair value. This guidance is effective for the company for its fiscal year beginning October 1, 2009 and, as required, will be applied prospectively, except for the presentation and disclosure requirements, which will be applied retrospectively for all periods presented. The company will modify the presentation and disclosure of noncontrolling interests in accordance with the requirement of the statement. The adoption of this consolidation guidance is not expected to have any other significant effect on the company’s financial statements.
In May 2008, the FASB issued guidance contained in ASC Topic 470-20, “Debt with Conversion and Other Option” which applies to all convertible debt instruments that have a “net settlement feature”, which means that such convertible debt instruments, by their terms, may be settled either wholly or partially in cash upon conversion. This topic requires issuers of convertible debt instruments that may be settled wholly or partially in cash upon conversion to separately account for the liability and equity components in a manner reflective of the issuers’ nonconvertible debt borrowing rate. Topic 470-20 is effective for financial statements issued for fiscal years beginning after December 15, 2008 and interim periods within those fiscal years. Early adoption is not permitted and retroactive application to all periods presented is required. The company’s accounting for its outstanding $300 million and $200 million convertible notes due in fiscal years 2026 and 2027, respectively (see Note 16), will be impacted by this guidance. Upon adoption, the company will account for the debt and equity components of these convertible notes separately and expects to recognize an equity component of the convertible notes in the range of $150 million to $200 million. The equity component will be amortized as non-cash interest expense over the term of the respective convertible notes using the effective interest method.
In June 2008, the FASB issued earnings per share guidance which addresses whether instruments granted in share-based payment transactions are participating securities prior to vesting and, therefore, need to be included in the earnings allocation in computing earnings per share under the two-class method. The guidance affects entities that accrue dividends on share-based payment awards during the awards’ service period when the dividends do not need to be returned if the employees forfeit the award. This guidance is effective for fiscal years beginning after December 15, 2008, and interim periods within those years, with early application not permitted. The company does not expect this guidance to have a significant impact on its consolidated financial statements.
In December 2008, the FASB issued guidance on defined benefit plans that requires new disclosures on investment policies and strategies, categories of plan assets, fair value measurements of plan assets, and significant concentrations of risk, and is effective for fiscal years ending after December 15, 2009, with earlier application permitted. The impact of this guidance will be reflected in the company’s consolidated financial statements upon adoption.
In June 2009, the FASB issued guidance on accounting for transfer of financial assets, which guidance changes the requirements for recognizing the transfer of financial assets and requires additional disclosures about a transferor’s continuing involvement in transferred financial assets. The guidance also eliminates the concept of a “qualifying special purpose entity” when assessing transfers of financial instruments. This guidance is effective for the first annual reporting period that begins after November 15, 2009 and for interim periods beginning in the first annual reporting period and periods thereafter. The company is currently evaluating the impact, if any, of the new requirements on its consolidated financial statements.
In June 2009, the FASB issued guidance for the consolidation of variable interest entities (VIEs) to address the elimination of the concept of a qualifying special purpose entity. This guidance replaces the quantitative-based risks and rewards calculation for determining which enterprise has a controlling financial interest in a variable interest entity with an approach focused on identifying which enterprise has the power to direct the activities of variable interest entity, and the obligation to absorb losses of the entity or the right to receive benefits from the entity.
65
ARVINMERITOR, INC.
NOTES TO
CONSOLIDATED FINANCIAL STATEMENTS — (Continued)
Additionally, the new guidance requires any enterprise that holds a variable interest in a variable interest entity to provide enhanced disclosures that will provide users of financial statements with more transparent information about an enterprise’s involvement in a variable interest entity. This guidance is effective for the first annual reporting periods beginning after November 15, 2009, for interim periods within that first annual reporting period, and for interim and annual reporting periods thereafter. The company is currently assessing what impact, if any, that this guidance will have on its financial position, results of operations and cash flows.
Accounting standards implemented in fiscal year 2009:
In September 2006, the FASB issued guidance pertaining to retirement benefits. The recognition requirements of this guidance related to the funded status of defined benefit pension plans and other postretirement benefit plans were adopted by the company as of September 30, 2007. The guidance also requires that companies measure the funded status of their defined benefit pension plans and other postretirement benefit plans as of the balance sheet date. The company elected to adopt the measurement date provisions at October 1, 2008. Prior to adopting these provisions, the company used a measurement date of June 30 for its defined benefit and other postretirement benefit plans. Using the “one-measurement” approach, the impact of adopting the measurement date provisions as of October 1, 2008 was an increase to accumulated deficit of $20 million ($20 million after-tax), representing the net periodic benefit cost for the period between the measurement date utilized in fiscal year 2008 and the beginning of fiscal year 2009, which previously would have been expensed in the first quarter of fiscal year 2009 on a delayed basis.
On October 1, 2008, the company partially adopted as required, FASB ASC Topic 820 “Fair Value Measurements and Disclosures” which provides a definition of fair value, establishes a framework for measuring fair value and requires expanded disclosures about fair value measurements. The company adopted the measurement and disclosure requirements of this topic relating to its financial assets and financial liabilities which are measured on a recurring basis (at least annually). The adoption of Topic 820 did not have a material impact on the company’s fair value measurements.
Topic 820 defines fair value as the price that would be received for an asset or paid to transfer a liability (an exit price) in the principal most advantageous market for the asset or liability in an orderly transaction between market participants. The topic establishes a fair value hierarchy, which prioritizes the inputs used in measuring fair value into the following levels:
Level 1 — Quoted prices in active markets for identical assets or liabilities.
Level 2 — Inputs, other than quoted prices in active markets, that are observable either directly or indirectly.
Level 3 — Unobservable inputs based on the entity’s own assumptions.
The company’s financial assets and liabilities recognized at fair value on a recurring basis at September 30, 2009 were not significant. Refer to Note 17 for additional information on fair value measurements.
In October 2008, the FASB issued additional guidance related to fair value measurements and disclosures which clarifies the application of FASB ASC Topic 820 and key considerations in determining the fair value of a financial asset when the market for that financial asset is not active. This additional guidance is effective upon issuance, including prior periods for which financial statements have not been issued. The issuance of this guidance did not have any impact on the company’s results of operations or financial position.
In April 2009, the FASB issued supplementary guidance pertaining to fair value measurements and disclosures which provides additional guidance for estimating fair value when the market activity for an asset or liability has declined significantly. This guidance is effective for interim and annual periods ending after June 15, 2009. There were no adjustments to the company’s estimates of fair value for assets and liabilities measured at fair value upon adoption of this guidance.
On January 1, 2009, the company adopted, as required, the FASB’s additional guidance on derivatives and hedging which requires expanded disclosures about derivative and hedging activities. This guidance has the same scope as previous guidance, however it changes the disclosure requirements for derivative instruments and hedging activities. Enhanced disclosures are required about (a) how and why an entity uses derivative instruments, (b) how derivative instruments and related hedged items are accounted for and (c) how derivative instruments and related hedged items affect an entity’s financial position, financial performance and cash flows. The adoption of this guidance did not have a material effect on the company’s financial statements other than providing certain enhanced disclosures. Refer to Note 17 for additional disclosures on derivative instruments and hedging activities.
In May 2009, the FASB issued guidance on subsequent events which requires the disclosure of the date through which an entity has evaluated subsequent events and whether that date represents the date the financial statements were issued or were available to be issued. This guidance is effective for interim or annual financial periods ending after June 15, 2009, and is to be applied prospectively. The company adopted this guidance effective June 30, 2009 (see Note 1). The company has added appropriate disclosure in its consolidated financial statements consistent with the requirements of this guidance.
66
ARVINMERITOR, INC.
NOTES TO
CONSOLIDATED FINANCIAL STATEMENTS — (Continued)
In June 2009, the FASB issued guidance which establishes the FASB Accounting Standards Codification (“Codification”) as the source of authoritative U.S. generally accepted accounting principles to be applied to nongovernmental entities and rules and interpretive releases of the SEC as authoritative GAAP for SEC registrants. This guidance is effective for financial statements issued for interim and annual periods ending after September 15, 2009 and supersedes all then-existing non-SEC accounting and reporting standards. All of the content in the Codification carries the same level of authority and all non-grandfathered non-SEC accounting literature not included in the codification is deemed nonauthoritative. The adoption of the codification did not have a significant effect on the company’s consolidated financial statements or disclosures.
3. DISCONTINUED OPERATIONS
Results of the discontinued operations are summarized as follows (in millions):
| Year Ended September 30, | ||||||||||||
| 2009 | 2008 | 2007 | ||||||||||
| Sales | $ | 509 | $ | 784 | $ | 3,058 | ||||||
| Net loss on sales of businesses | $ | (10 | ) | $ | (16 | ) | $ | (200 | ) | |||
| Long-lived asset impairment charges | (56 | ) | — | — | ||||||||
| Charge for indemnity obligation (see Note 23) | (28 | ) | — | — | ||||||||
| Restructuring costs | (21 | ) | (11 | ) | (3 | ) | ||||||
| Other | — | — | 12 | |||||||||
| Operating income (loss), net | (2 | ) | 57 | 49 | ||||||||
| Income (loss) before income taxes | (117 | ) | 30 | (142 | ) | |||||||
| Benefit (provision) for income taxes | (15 | ) | (12 | ) | 22 | |||||||
| Minority interest | (3 | ) | (4 | ) | (6 | ) | ||||||
| Income (loss) from discontinued operations | $ | (135 | ) | $ | 14 | $ | (126 | ) | ||||
In conjunction with the company’s long-term strategic objective to focus on supplying the commercial vehicle on- and off-highway markets for original equipment manufacturers, aftermarket and industrial customers, the company previously announced its intent to divest the Light Vehicle Systems (LVS) business groups in their entirety. However, in light of the unprecedented challenges in the credit markets and the volume weakness in the automotive industry, it was determined that in the current financial environment the appropriate value could not be captured by divesting the business as a whole. The company has completed the following divestiture related activities, associated with its LVS segment, all of which are included in results of discontinued operations.
Wheels
In September 2009, we completed the sale of our Wheels business to Iochpe-Maxion S.A., a Brazilian producer of wheels and frames for commercial vehicles, railway freight cars and castings, and affiliates. The gross purchase price was $180 million. Net proceeds after taxes and adjustments for working capital and net debt were $166 million (net of cash on hand of $3 million). The agreement also requires certain true-up payments for working capital and other miscellaneous adjustments, on a post-closing basis. The company recognized a pre-tax gain on sale of approximately $50 million ($36 million after-tax), which is included in the results of discontinued operations in the consolidated statement of operations.
Gabriel de Venezuela
The company’s former consolidated subsidiary, Gabriel de Venezuela, supplied shock absorbers, struts, exhaust systems and suspension modules to light vehicle industry customers, primarily in Venezuela and Colombia. On June 5, 2009, the company sold its 51 percent interest in Gabriel de Venezuela to its joint venture partner. The company recognized a pre-tax loss on sale of approximately $23 million ($23 million after-tax) in the third quarter of fiscal year 2009. Charges associated with the sale of Gabriel de Venezuela are included in the results of discontinued operations in the consolidated statement of operations. In conjunction with the sale, $18 million of cash was retained by the joint venture and the company received dividends of approximately $1 million from the joint venture. The company was also released from its guarantees of approximately $11 million of letters of credit.
Gabriel Ride Control Products North America
The company’s Gabriel Ride Control Products North America (Gabriel Ride Control) business supplied motion control products, shock absorbers, struts, ministruts and corner modules, as well as other automotive parts to the passenger car, light truck and sport utility vehicle aftermarket industries. During fiscal year 2009, the company completed the sale of Gabriel Ride Control to Ride Control, LLC, a wholly owned subsidiary of OpenGate Capital, a private equity firm. The company recognized a pre-tax loss on sale of approximately $42 million ($42 million after-tax).
67
ARVINMERITOR, INC.
NOTES TO CONSOLIDATED FINANCIAL STATEMENTS — (Continued)
In the first quarter of fiscal year 2009, the company recognized a $19 million ($14 million after-tax) non-cash impairment charge associated with the long-lived assets of this business (see Note 5). Charges associated with the sale of Gabriel Ride Control are included in the results of discontinued operations in the consolidated statement of operations.
In connection with the sale, the company provided funding of $9 million to Ride Control, LLC. The terms of the sale agreement requires a purchase price adjustment based upon closing working capital. Settlement of the working capital purchase price adjustment is subject to negotiations and is expected to occur in the first quarter of fiscal year 2010. Included in receivables, trade and other, net, in the consolidated balance sheet is $7 million based upon management’s best estimate of this adjustment. The agreement also contains arrangements for royalties and other items which are not expected to materially impact the company in the future.
Meritor Suspension Systems Company (MSSC)
On June 24, 2009, the company entered into a binding letter of intent to sell its 57 percent interest in MSSC, a joint venture that manufactures and sells automotive coil springs, torsion bars and stabilizer bars in North America, to the joint venture partner, a subsidiary of Mitsubishi Steel Mfg. Co., LTD (MSM). The sale of the company’s interest in MSSC was completed on October 30, 2009 (see Note 1) for a purchase price of $13 million, which included a cash dividend of $12 million received by the company in fiscal year 2009. The company also recorded a dividend payable of $9 million to the minority partner as of September 30,2009. The dividend payable was recognized by ArvinMeritor as a charge to earnings and is included in loss from discontinued operations in the consolidated statement of operations.
In fiscal year 2009, the company announced the closure of its coil spring operations in Milton, Ontario, Canada (Milton), which is part of MSSC. In connection with the planned closure of Milton, the company recognized approximately $16 million of employee severance and pension termination benefits (see Note 5), which are included in loss from discontinued operations in the consolidated statement of operations. Also in the fiscal year 2009, the company recognized a $31 million non-cash impairment charge associated with the long-lived assets of MSSC (see Note 11) and an approximately $4 million non-cash income tax charge related to a valuation allowance recorded against deferred tax assets of MSSC that are no longer expected to be realized. These non-cash charges are included in loss from discontinued operations in the consolidated statement of operations.
The $9 million dividend payable and the minority interest partner’s share of losses were not recognized as part of minority interest in the consolidated statement of operations because prior to these transactions the minority interest’s equity in MSSC had been reduced to zero and the minority interest has no contractual obligation to fund the dividend and its share of losses.
Assets of MSSC are included in assets of discontinued operations in the consolidated balance sheet and primarily consist of current assets of $34 million, fixed assets of $13 million and other long term assets. Liabilities of MSSC included in liabilities of discontinued operations in the consolidated balance sheet primarily consist of short-term debt, accounts payable, restructuring reserves and approximately $69 million of accrued pension and post retirement benefits. Short-term debt relates to a $6 million, 6.5-percent loan with the minority partner and matures in March 2010 (see Note 16). Upon completion of the sale on October 30, 2009, all assets and liabilities of MSSC were transferred to the buyer.
Other businesses included in discontinued operations are as follows:
Emissions Technologies
The company’s Emissions Technologies (ET) business supplied exhaust systems and exhaust system components, including mufflers, exhaust pipes, catalytic converters, diesel particulate filters and exhaust manifolds, primarily to original equipment manufacturers. On May 17, 2007, the company sold its ET business to EMCON Technologies Holdings Limited (EMCON), a private equity affiliate of J.P. Morgan Securities Inc. Total consideration was $310 million, including cash, a $20 million note and the assumption of certain liabilities, and adjustments for working capital and other items (see below). The company recognized a pre-tax loss on sale of approximately $180 million ($146 million after-tax) in fiscal year 2007. The loss on sale included a $115 million ($90 million after-tax) non-cash impairment charge recorded in the second quarter of fiscal year 2007 to record ET at estimated fair value based upon the preliminary terms of the sale agreement. During fiscal year 2009 and 2008, the company recognized approximately $5 million of pre-tax income and $13 million of pre-tax costs, respectively, related to the sale of the ET business. These items primarily related to revised estimates for certain pre-sale liabilities retained by the company and are included in net loss on sales of businesses in the above table. The ET business and any charges associated with the sale of ET are reported in discontinued operations in the consolidated statement of operations, statement of cash flows and related notes for all periods presented.
Gross amounts due from EMCON were $1 million and $18 million at September 30, 2009 and 2008, respectively, and are included in receivables, trade and other, net in the consolidated balance sheet. Gross amounts due to EMCON were $3 million and $50 million at September 30, 2009 and 2008, respectively, and are included in other current liabilities (see Note 14). The amounts due from (to) EMCON primarily relate to amounts received (paid), or expected to be received (paid) by EMCON associated with certain assets and liabilities of ET that were retained by the company.
68
ARVINMERITOR, INC.
NOTES TO CONSOLIDATED FINANCIAL STATEMENTS — (Continued)
During fiscal year 2008, the company received the final working capital adjustment of $28 million, which was based upon closing working capital at the time of sale of ET. In addition, pre-sale funding obligations, which were recorded as a receivable from EMCON and an offsetting payable in the consolidated balance sheet at September 30, 2007, were settled in fiscal year 2008.
As of the May 17, 2007 closing date, assets and liabilities of certain businesses were not legally transferred to EMCON due to delays in certain procedures required to be completed by the buyer. Pursuant to the sale agreement, legal ownership was to be transferred upon receipt by the buyer of required licenses and establishment of appropriate entities to receive the transferred assets. Sale values were fixed and EMCON assumed operational control of the businesses as of the May 17, 2007 closing date. The steps required to complete the legal transfer were considered perfunctory by the company and the company recorded these assets and liabilities as sold and excluded them from the consolidated balance sheet effective on May 17, 2007. Consideration for these assets and assumed liabilities was deposited in an escrow account by EMCON. The legal transfer of these operations was completed and related proceeds were received by the company in fiscal year 2008.
Light Vehicle Aftermarket
In October 2004, the company announced plans to divest its Light Vehicle Aftermarket (LVA) businesses. This plan was part of the company’s long-term strategy to focus on core competencies and support its global light vehicle systems OEM customers and its commercial vehicle systems OEM and aftermarket customers. LVA supplied exhaust, ride control, motion control and filter products, as well as other automotive parts to the passenger car, light truck and sport utility vehicle aftermarket. As of September 30, 2007, the company had completed the sale of its LVA filters, exhaust and motion control businesses, and its Gabriel South Africa ride control business. These businesses represented a significant portion of the company’s combined LVA business and are reported as discontinued operations in the consolidated statement of operations for all periods presented.
In July 2007, the company completed the sale of LVA Europe. Cash proceeds from the sale were $9 million, resulting in a net pre-tax loss on sale of $12 million ($12 million after-tax). Based on the contemplated sale value, a non-cash impairment charge of $8 million was recorded in the third quarter of fiscal year 2007. The loss on sale and the impairment charge are recorded in loss from discontinued operations in the consolidated statement of operations.
4. GOODWILL
In accordance with FASB ASC Topic 350-20, “Intangibles – Goodwill and Other”, goodwill is reviewed for impairment annually during the fourth quarter of the fiscal year or more frequently if certain indicators arise. If business conditions or other factors cause the operating results and cash flows of the reporting unit to decline, the company may be required to record impairment charges for goodwill at that time. The goodwill impairment review is a two-step process. Step one consists of a comparison of the fair value of a reporting unit with its carrying amount. An impairment loss may be recognized if the review indicates that the carrying value of a reporting unit exceeds its fair value. Estimates of fair value are primarily determined by using discounted cash flows and market multiples on earnings. If the carrying amount of a reporting unit exceeds its fair value, step two requires the fair value of the reporting unit to be allocated to the underlying assets and liabilities of that reporting unit, resulting in an implied fair value of goodwill. If the carrying amount of the goodwill of the reporting unit exceeds the implied fair value, an impairment charge is recorded equal to the excess.
The impairment review is highly judgmental and involves the use of significant estimates and assumptions. These estimates and assumptions have a significant impact on the amount of any impairment charge recorded. Discounted cash flow methods are dependent upon assumptions of future sales trends, market conditions and cash flows of each reporting unit over several years. Actual cash flows in the future may differ significantly from those previously forecasted. Other significant assumptions include growth rates and the discount rate applicable to future cash flows.
During the first quarter of fiscal year 2009, both light and commercial vehicle industries experienced significant declines in overall economic conditions including tightening credit markets, stock market declines and significant reductions in current and forecasted production volumes for light and commercial vehicles. This, along with other factors, led to a significant decline in the company’s market capitalization subsequent to September 30, 2008. As a result, the company completed an impairment review of goodwill balances during the first quarter of fiscal year 2009 for each of its reporting units, which were Commercial Vehicle Systems (CVS) and LVS, at that time.
Step one of the company’s first quarter goodwill impairment review indicated that the carrying value of the LVS reporting unit significantly exceeded its estimated fair value. As a result of the step two goodwill impairment analysis, the company recorded a $70 million non-cash impairment charge in the first quarter of fiscal year 2009 to write-off the entire goodwill balance of its LVS reporting unit. The fair value of this reporting unit was estimated using earnings multiples and other available information, including indicated values from recent attempts to divest certain businesses. The company’s step one impairment review of goodwill associated with its CVS reporting unit did not indicate that an impairment existed as of December 31, 2008.
69
ARVINMERITOR, INC.
NOTES TO CONSOLIDATED FINANCIAL STATEMENTS — (Continued)
In connection with the changes in the company’s segment reporting (see Note 24) and reporting unit structure during the fourth quarter of fiscal year 2009, the company conducted a valuation to determine the assignment of goodwill to the new reporting units based on their estimated relative fair values. Following the allocation of goodwill to the new reporting units, the company performed a goodwill impairment review. Step one of this impairment review did not indicate an impairment in the carrying value of goodwill for any of the reporting units. A summary of the changes in the carrying value of goodwill and allocation of goodwill balances to the new reporting units are presented below (in millions):
| Commercial | Aftermarket | ||||||||||||||||||||
| Truck | Industrial | & Trailer | CVS | LVS | Total | ||||||||||||||||
| Balance at September 30, 2007 | $ | — | $ | — | $ | — | $ | 449 | $ | 71 | $ | 520 | |||||||||
| Foreign currency translation | — | — | — | (11 | ) | — | (11 | ) | |||||||||||||
| Acquisitions (see Note 6) | — | — | — | 13 | — | 13 | |||||||||||||||
| Balance at September 30, 2008 | — | — | — | 451 | 71 | 522 | |||||||||||||||
| Impairment charge | — | — | — | — | (70 | ) | (70 | ) | |||||||||||||
| Other, primarily foreign currency translation | — | — | — | (13 | ) | (1 | ) | (14 | ) | ||||||||||||
| Allocation to new reporting units | 154 | 109 | 175 | (438 | ) | — | — | ||||||||||||||
| Balance at September 30, 2009 | $ | 154 | $ | 109 | $ | 175 | $ | — | $ | — | $ | 438 | |||||||||
5. RESTRUCTURING COSTS
At September 30, 2009 and 2008, $28 million and $30 million, respectively, of restructuring reserves primarily related to unpaid employee termination benefits remained in the consolidated balance sheet. Asset impairment charges relate to manufacturing facilities that will be closed or sold and machinery and equipment that became idle and obsolete as a result of the facility closures. The following table summarizes changes in restructuring reserves (in millions).
| Employee | Plant | |||||||||||||||
| Termination | Asset | Shutdown | ||||||||||||||
| Benefits | Impairment | & Other | Total | |||||||||||||
| Balance at September 30, 2006 | $ | 40 | $ | — | $ | — | $ | 40 | ||||||||
| Activity during the period: | ||||||||||||||||
| Charges to continuing operations, net of reversals | 54 | 8 | — | 62 | ||||||||||||
| Charges to discontinued operations, net of reversals (1) | 3 | — | — | 3 | ||||||||||||
| Asset write-offs | — | (8 | ) | — | (8 | ) | ||||||||||
| Cash payments | (30 | ) | — | — | (30 | ) | ||||||||||
| Other (2) | (8 | ) | — | — | (8 | ) | ||||||||||
| Balance at September 30, 2007 | 59 | — | — | 59 | ||||||||||||
| Activity during the period: | ||||||||||||||||
| Charges to continuing operations, net of reversals | 7 | 1 | 1 | 9 | ||||||||||||
| Charges to discontinued operations, net of reversals(1) | 9 | 2 | — | 11 | ||||||||||||
| Asset write-offs | — | (3 | ) | — | (3 | ) | ||||||||||
| Cash payments | (35 | ) | — | (1 | ) | (36 | ) | |||||||||
| Other (2) | (10 | ) | — | — | (10 | ) | ||||||||||
| Balance at September 30, 2008 | 30 | — | — | 30 | ||||||||||||
| Activity during the period: | ||||||||||||||||
| Charges to continuing operations, net of reversals | 58 | 5 | 17 | 80 | ||||||||||||
| Charges to discontinued operations, net of reversals(1) | 12 | 1 | 8 | 21 | ||||||||||||
| Asset write-offs | — | (6 | ) | — | (6 | ) | ||||||||||
| Retirement plan curtailment charges (see Note 21) (3) | — | — | (24 | ) | (24 | ) | ||||||||||
| Reclassifications to liabilities of discontinued operations | (8 | ) | — | — | (8 | ) | ||||||||||
| Cash payments | (52 | ) | — | (1 | ) | (53 | ) | |||||||||
| Other (2) | (12 | ) | — | — | (12 | ) | ||||||||||
| Balance at September 30, 2009 | $ | 28 | $ | — | $ | — | $ | 28 | ||||||||
| (1) | Charges to discontinued operations reserves are included in discontinued operations in the consolidated statement of operations. |
70
ARVINMERITOR, INC.
NOTES TO CONSOLIDATED FINANCIAL STATEMENTS — (Continued)
| (2) | Includes $12 million, $8 million and $12 million of payments associated with discontinued operations included in restructuring reserves at September 30, 2009, 2008 and 2007, respectively. | |
| (3) | Retirement plan curtailment charges relate to pension termination benefits of $16 million and $8 million associated with the closure Tilbury and Milton, respectively. These amounts are included in retirement benefits and liabilities of discontinued operations in the consolidated balance sheet. | |
Restructuring costs included in our business segment results during fiscal years 2009, 2008 and 2007 are as follows (in millions):
| Commercial | Aftermarket | |||||||||||||||||
| Truck | Industrial | & Trailer | LVS | Total | ||||||||||||||
| Fiscal year 2009: | ||||||||||||||||||
| Performance Plus actions | $ | 32 | $ | — | $ | — | $ | 4 | $ | 36 | ||||||||
| Fiscal year 2009 actions (reduction in workforce) | 20 | 2 | 1 | 15 | 38 | |||||||||||||
| Total restructuring costs | $ | 52 | $ | 2 | $ | 1 | $ | 19 | $ | 74 | ||||||||
| Fiscal year 2008: | ||||||||||||||||||
| Performance Plus actions | $ | — | $ | — | $ | — | $ | 12 | $ | 12 | ||||||||
| Adjustments and reversals | (1 | ) | — | — | (3 | ) | (4 | ) | ||||||||||
| Total restructuring costs | $ | (1 | ) | $ | — | $ | — | $ | 9 | $ | 8 | |||||||
| Fiscal year 2007: | ||||||||||||||||||
| Performance Plus actions | $ | 6 | $ | 1 | $ | 3 | $ | 47 | $ | 57 | ||||||||
| Adjustments and reversals | — | — | — | (1 | ) | (1 | ) | |||||||||||
| Total restructuring costs | $ | 6 | $ | 1 | $ | 3 | $ | 46 | $ | 56 | ||||||||
| (1) | Total segment restructuring costs do not include those recorded in unallocated corporate costs. These costs were $6 million in fiscal year 2009 and $1 million in fiscal year 2008, primarily related to employee termination benefits and $6 million in fiscal year 2007, primarily related to asset impairment charges. |
Fiscal Year 2009 Actions: During fiscal year 2009, the company approved certain restructuring actions in response to a significant decline in global market conditions. These actions primarily related to the reduction of approximately 2,850 salaried, hourly and temporary positions worldwide. The company recorded restructuring costs of $44 million associated with these actions during fiscal year 2009. Many of these actions were completed in fiscal year 2009 with the remainder to be completed during fiscal year 2010.
Performance Plus: During fiscal year 2007, the company launched a long-term profit improvement and cost reduction initiative called “Performance Plus.” As part of this program, the company identified significant restructuring actions which would eliminate up to 2,800 positions in North America and Europe and consolidate and combine certain global facilities. The company’s Commercial Truck and LVS businesses recorded $32 million and $4 million, respectively, of costs associated with this restructuring program during fiscal year 2009. During fiscal year 2009, the company closed its Commercial Truck brakes plant in Tilbury, Ontario, Canada (Tilbury). Costs associated with the Tilbury closure included $10 million for estimated employee severance benefits, $16 million primarily associated with pension termination benefits (see Note 21) and $4 million associated with certain asset impairment charges. Also in fiscal year 2009, the company announced the closure of its Commercial Truck facility in Carrollton, Kentucky (Carrollton) and recognized approximately $2 million of restructuring costs. The company expects to complete this closure in the first quarter of fiscal year 2010.
Also in the second quarter of fiscal year 2009, the company announced the closure of its coil spring operations in Milton, Ontario, Canada (Milton), which is part of MSSC. As previously disclosed, costs associated with the Milton closure are included in loss from discontinued operations in the consolidated statement of operations and restructuring reserves are included in liabilities of discontinued operations in the consolidated balance sheet (see Note 3).
Cumulative restructuring costs recorded for this program, including amounts reported in discontinued operations, are $140 million as of September 30, 2009 and primarily relate to employee termination costs of $80 million, $16 million associated with pension termination benefits, asset impairment charges of $17 million and other shutdown costs of $27 million. Remaining costs of this restructuring program will be incurred over the next several years.
71
ARVINMERITOR, INC.
NOTES TO CONSOLIDATED FINANCIAL STATEMENTS — (Continued)
Adjustments and Reversals: In fiscal years 2008 and 2007, the company reversed $4 million and $1 million of restructuring costs, respectively, related to previously recorded employee severance benefits. Adjustments and reversals relate to changes in original facts and circumstances that result in revised estimates of the ultimate liability. Such circumstances would include the sale of a business, new labor arrangements and other similar matters that develop subsequent to the original determinations.
6. ACQUISITIONS
On December 19, 2007, the company’s Aftermarket & Trailer segment acquired Mascot Truck Parts Ltd (Mascot) for a cash purchase price of $19 million. Mascot remanufactures transmissions, drive axles, steering gears and drivelines. On July 2, 2008, the company’s Aftermarket & Trailer segment acquired Trucktechnic SA (Trucktechnic) based in Leige, Belgium for a cash purchase price of €11 million ($17 million). Trucktechnic is a supplier of remanufactured heavy-duty commercial vehicle parts including air valves, air compressors, disc brakes, steering pumps and related repair kits. These acquisitions did not have a material impact on the company’s consolidated financial position or results of operations for fiscal year 2008.
On October 4, 2004, the company formed two joint ventures in France with AB Volvo to manufacture and distribute axles. The company acquired its 51-percent interest for a purchase price of €19 million ($25 million). The company had an option to purchase and AB Volvo had an option to require the company to purchase the remaining 49-percent interest in one of the joint ventures beginning in the first quarter of fiscal year 2008 for €16 million ($23 million) plus interest at EURIBOR rates, plus a margin. In December 2007, this option was exercised and the related liability was settled. The option to purchase the minority interest was essentially a financing arrangement, as the minority shareholder did not participate in any profits or losses of the joint venture. Therefore, no minority interest was recognized in prior periods for the 49-percent interest in this joint venture.
7. ACCOUNTS RECEIVABLE SECURITIZATION AND FACTORING
Off-balance sheet arrangements
The company participates in an arrangement to sell trade receivables through certain of its European subsidiaries. Under the arrangement, the company can sell, at any point in time, up to €125 million of eligible trade receivables. The receivables under this program are sold at face value and are excluded from the company’s consolidated balance sheet. The company continues to perform collection and administrative functions related to these receivables. Costs associated with this securitization arrangement were $3 million, $8 million and $4 million in fiscal years 2009, 2008 and 2007, respectively, and are included in operating income (loss) in the consolidated statement of operations. The gross amount of proceeds received from the sale of receivables under this arrangement was $297 million and $609 million for fiscal years 2009 and 2008, respectively. The company’s retained interest in receivables sold was $6 million and $16 million at September 30, 2009 and 2008, respectively. The company had utilized, net of retained interests, €38 million ($56 million) and €114 million ($167 million) of this accounts receivable securitization facility as of September 30, 2009 and 2008, respectively.
In addition, several of the company’s subsidiaries, primarily in Europe, factor eligible accounts receivable with financial institutions. Certain receivables are factored without recourse to the company and are excluded from accounts receivable in the consolidated balance sheet. The amount of factored receivables excluded from accounts receivable was $37 million and $243 million at September 30, 2009 and 2008, respectively. Costs associated with these factoring arrangements were $4 million, $14 million and $5 million in the fiscal years ended September 30, 2009, 2008 and 2007, respectively, and are included in operating income (loss) in the consolidated statement of operations.
On-balance sheet arrangements
Since 2005 the company participated in a U.S. accounts receivable securitization program to enhance financial flexibility and lower interest costs. In September 2009, in anticipation of the expiration of the existing facility, the company entered into a new, two year $125 million U.S. receivables financing arrangement which is provided on a committed basis by a syndicate of financial institutions led by GMAC Commercial Finance LLC and expires in September 2011. Under this program, the company sells substantially all of the trade receivables of certain U.S. subsidiaries to ArvinMeritor Receivables Corporation (ARC), a wholly-owned, special purpose subsidiary. The maximum borrowing capacity under this program is $125 million. ARC funds these purchases with borrowings under a loan agreement with participating lenders. Amounts outstanding under this agreement are collateralized by eligible receivables purchased by ARC and are reported as short-term debt in the consolidated balance sheet. At September 30, 2009, $83 million was outstanding under this program. Borrowings under this arrangement are collateralized by approximately $133 million of receivables held at ARC at September 30, 2009. This program does not have specific financial covenants, however it does have a cross-default provision to the company’s revolving credit facility agreement. At September 30, 2008, $111 million was outstanding under the prior facility. No amount was outstanding under the prior facility at September 30, 2009.
72
ARVINMERITOR, INC.
NOTES TO CONSOLIDATED FINANCIAL STATEMENTS — (Continued)
8. OTHER OPERATING INCOME (EXPENSE), net
Other income (expense) is comprised of the following (in millions):
| Year Ended September 30, | ||||||||||||
| 2009 | 2008 | 2007 | ||||||||||
| Gain on divestitures and other | $ | — | $ | — | $ | 1 | ||||||
| Environmental remediation costs (see Note 23) | (1 | ) | (3 | ) | (2 | ) | ||||||
| Other expense, net | $ | (1 | ) | $ | (3 | ) | $ | (1 | ) | |||
9. INVENTORIES
Inventories are stated at the lower of cost (using FIFO or average methods) or market (determined on the basis of estimated realizable values) and are summarized as follows (in millions):
| September 30, | ||||||
| 2009 | 2008 | |||||
| Finished goods | $ | 149 | $ | 237 | ||
| Work in process | 54 | 102 | ||||
| Raw materials, parts and supplies | 171 | 284 | ||||
| Total | $ | 374 | $ | 623 | ||
10. OTHER CURRENT ASSETS
Other current assets are summarized as follows (in millions):
| September 30, | ||||||
| 2009 | 2008 | |||||
| Current deferred income tax assets (see Note 22) | $ | 19 | $ | 110 | ||
| Customer reimbursable tooling and engineering | 30 | 27 | ||||
| Asbestos-related recoveries (see Note 23) | 8 | 8 | ||||
| Deposits and collateral | 7 | 19 | ||||
| Prepaid income taxes | 20 | 31 | ||||
| Investment in debt defeasance trust | — | 6 | ||||
| Prepaid and other | 13 | 17 | ||||
| Other current assets | $ | 97 | $ | 218 | ||
Costs incurred for tooling and engineering, principally for light vehicle products, for which customer reimbursement is contractually guaranteed, are classified as customer reimbursable tooling and engineering. These costs are billed to the customer based on the terms of the contract. Provisions for losses are provided at the time management expects costs to exceed anticipated customer reimbursements.
11. NET PROPERTY AND IMPAIRMENTS OF LONG-LIVED ASSETS
Property is stated at cost. Depreciation of property is based on estimated useful lives, generally using the straight-line method. Estimated useful lives for buildings and improvements range from 10 to 50 years and estimated useful lives for machinery and equipment range from 3 to 20 years. Significant betterments are capitalized, and disposed or replaced property is written off. Maintenance and repairs are charged to expense period. Company-owned tooling is classified as property and depreciated over the shorter of its expected life or the life of the related vehicle platform, generally not to exceed three years.
In accordance with the FASB guidance on property, plant and equipment, the company reviews the carrying value of long-lived assets, excluding goodwill, to be held and used, for impairment whenever events or changes in circumstances indicate a possible impairment. An impairment loss is recognized when a long-lived asset’s carrying value is not recoverable and exceeds estimated fair value.
73
ARVINMERITOR, INC.
NOTES TO CONSOLIDATED FINANCIAL STATEMENTS — (Continued)
At December 31, 2008, management determined certain impairment reviews were required due to declines in overall economic conditions including tightening credit markets, stock market declines and significant reductions in current and forecasted production volumes for light and commercial vehicles. As a result, the company recognized pre-tax, non-cash impairment charges of $209 million in the first quarter of fiscal year 2009, primarily related to the LVS segment. A portion of this non-cash charge relates to businesses presented in discontinued operations and accordingly, $56 million is included in loss from discontinued operations in the consolidated statement of operations (see Note 3). The estimated fair value of long-lived assets was calculated based on probability weighted cash flows taking into account current expectations for asset utilization and life expectancy. In addition, liquidation values were considered where appropriate, as well as indicated values from divestiture activities.
The following table describes the significant components of long-lived asset impairments recorded in continuing operations during the first quarter of fiscal year 2009.
| Commercial | Aftermarket | ||||||||||||||
| Truck | Industrial | & Trailer | LVS | Total | |||||||||||
| Land and buildings | $ | 5 | $ | — | $ | — | $ | 34 | $ | 39 | |||||
| Other (primarily machinery and equipment) | 3 | — | — | 105 | 108 | ||||||||||
| Total assets impaired (1) | $ | 8 | $ | — | $ | — | $ | 139 | $ | 147 | |||||
| (1) | The company also recognized $6 million of non-cash impairment charges associated with certain corporate long-lived assets. |
Net property at September 30, 2009 and 2008 is summarized as follows (in millions):
| September 30, | ||||||||
| 2009 | 2008 | |||||||
| Property at cost: | ||||||||
| Land and land improvements | $ | 46 | $ | 66 | ||||
| Buildings | 254 | 368 | ||||||
| Machinery and equipment | 913 | 1,567 | ||||||
| Company-owned tooling | 163 | 231 | ||||||
| Construction in progress | 38 | 139 | ||||||
| Total | 1,414 | 2,371 | ||||||
| Less accumulated depreciation | (969 | ) | (1,596 | ) | ||||
| Net property | $ | 445 | $ | 775 | ||||
12. OTHER ASSETS
Other assets are summarized as follows (in millions):
| September 30, | ||||||
| 2009 | 2008 | |||||
| Non-current deferred income tax assets (see Note 22) | $ | 27 | $ | 530 | ||
| Investments in non-consolidated joint ventures (see Note 13) | 125 | 134 | ||||
| Assets for uncertain tax positions (see Note 22) | 11 | 34 | ||||
| Long-term receivables (see Note 15) | — | 45 | ||||
| Prepaid pension costs (see Note 21) | 9 | 25 | ||||
| Unamortized debt issuance costs (see Note 16) | 27 | 29 | ||||
| Capitalized software costs, net | 21 | 25 | ||||
| Asbestos-related recoveries (see Note 23) | 47 | 44 | ||||
| Note receivable due from EMCON, net of | ||||||
| discount | 16 | 13 | ||||
| Other | 26 | 46 | ||||
| Other assets | $ | 309 | $ | 925 | ||
The long-term receivable of $45 million at September 30, 2008 was related to certain Canadian income tax payments made by the company on behalf of Rockwell Automation, Inc. (Rockwell). Prior to the spin-off of the automotive business to Meritor (a predecessor of the company) from Rockwell International (now Rockwell Automation, Inc.) in fiscal year 1997, a Tax Allocation Agreement was signed between Rockwell and Meritor. Subsequent to the spin-off, the Canadian Revenue Agency (CRA) began performing a Canadian Tax audit over certain of the company’s financing activities. As a result, the CRA issued tax reassessments to ArvinMeritor, for which Rockwell was liable under the Tax Allocation Agreement. ArvinMeritor appealed the reassessments on behalf of Rockwell. Between fiscal years 2004 and 2008, Rockwell transferred funds to ArvinMeritor to cover the required tax payments while the appeal was pending. At that time, ArvinMeritor recorded a long-term receivable and corresponding liability (see Note 15) for these funds in the company’s consolidated balance sheet. During fiscal year 2009, the appeal was resolved and a majority of the long-term receivable and liability were settled.
74
ARVINMERITOR, INC.
NOTES TO CONSOLIDATED FINANCIAL STATEMENTS — (Continued)
The note receivable due from EMCON bears interest at a rate of 4 percent per annum and is payable in June 2012 or earlier upon a change in control. EMCON may prepay the note at any time. The company recorded the note, net of a $6 million and $8 million discount at September 30, 2009 and 2008, respectively, to reflect the difference between the stated rate per the agreement of 4 percent and the effective interest rate of approximately 9 percent. This discount is being amortized over the term of the note as interest income.
In accordance with FASB ASC Topic 350-40, costs relating to internally developed or purchased software in the preliminary project stage and the post-implementation stage are expensed as incurred. Costs in the application development stage that meet the criteria for capitalization are capitalized and amortized using the straight-line basis over the estimated economic useful life of the software.
13. INVESTMENTS IN NON-CONSOLIDATED JOINT VENTURES
The company’s non-consolidated joint ventures and related direct ownership interest at September 30, 2009 are as follows:
| Meritor WABCO Vehicle Control Systems | 50 | % |
| Master Sistemas Automotivos Limitada | 49 | % |
| Suspensys Sistemas Automotivos Ltda. (1) | 24 | % |
| Sistemas Automotrices de Mexico S.A. de C.V. | 50 | % |
| Ege Fren Sanayii ve Ticaret A.S. | 49 | % |
| Automotive Axles Limited | 36 | % |
| Shanghai ArvinMeritor Automotive Parts Co. Ltd | 50 | % |
| PHA Door Systems | 49 | % |
| TRW Gabriel | 49 | % |
| (1) | Total direct and indirect ownership interest of 50 percent. |
The company’s investments in non-consolidated joint ventures are as follows (in millions):
| September 30, | ||||||
| 2009 | 2008 | |||||
| Commercial Truck | $ | 88 | $ | 98 | ||
| Industrial | 13 | 14 | ||||
| Aftermarket & Trailer | 20 | 19 | ||||
| Light Vehicle Systems | 4 | 3 | ||||
| Total investments in non-consolidated joint ventures | $ | 125 | $ | 134 | ||
The company’s equity in earnings of non-consolidated joint ventures is as follows (in millions):
| Year Ended September 30, | ||||||||||
| 2009 | 2008 | 2007 | ||||||||
| Commercial Truck | $ | 8 | $ | 23 | $ | 26 | ||||
| Industrial | 1 | 5 | 4 | |||||||
| Aftermarket & Trailer | 6 | 9 | 5 | |||||||
| Light Vehicle Systems | — | 1 | (1 | ) | ||||||
| Total equity in earnings of affiliates | $ | 15 | $ | 38 | $ | 34 | ||||
75
ARVINMERITOR, INC.
NOTES TO CONSOLIDATED FINANCIAL STATEMENTS — (Continued)
The summarized financial information presented below represents the combined accounts of the company’s non-consolidated joint ventures (in millions):
| September 30, | ||||||
| 2009 | 2008 | |||||
| Current assets | $ | 347 | $ | 452 | ||
| Non-current assets | 227 | 204 | ||||
| Total assets | $ | 574 | $ | 656 | ||
| Current liabilities | $ | 186 | $ | 239 | ||
| Non-current liabilities | 100 | 117 | ||||
| Total liabilities | $ | 286 | $ | 356 | ||
| Year Ended September 30, | |||||||||
| 2009 | 2008 | 2007 | |||||||
| Sales | $ | 929 | $ | 1,484 | $ | 1,182 | |||
| Gross profit | 119 | 145 | 113 | ||||||
| Net income | 46 | 101 | 84 | ||||||
Dividends received from the company’s non-consolidated joint ventures were $25 million in fiscal year 2009, $20 million in fiscal year 2008 and $22 million in fiscal year 2007.
The company had sales to its non-consolidated joint ventures of approximately $21 million, $29 million and $14 million in fiscal years 2009, 2008 and 2007, respectively. The company had purchases from its non-consolidated joint ventures of approximately $503 million, $616 million and $347 million in fiscal years 2009, 2008 and 2007, respectively. Additionally, the company leases space and provides certain administrative and technical services to various non-consolidated joint ventures. The company collected $2 million, $1 million and $2 million for such leases and services during fiscal years 2009, 2008 and 2007, respectively.
Amounts due from the company’s non-consolidated joint ventures were $17 million and $19 million at September 30, 2009 and 2008, respectively, and are included in Receivables, trade and other, net. Amounts due to the company’s non-consolidated joint ventures were $49 million and $70 million at September 30, 2009 and 2008, respectively and are included in Accounts payable.
14. OTHER CURRENT LIABILITIES
Other current liabilities are summarized as follows (in millions):
| September 30, | ||||||
| 2009 | 2008 | |||||
| Compensation and benefits | $ | 144 | $ | 239 | ||
| Due to EMCON (see Note 3) | 3 | 50 | ||||
| Income taxes | 18 | 35 | ||||
| Taxes other than income taxes | 44 | 54 | ||||
| Product warranties | 58 | 58 | ||||
| Restructuring (see Note 5) | 28 | 30 | ||||
| Foreign currency hedge contracts (see Note 17) | 3 | 16 | ||||
| Reserve for commercial dispute | — | 25 | ||||
| Asbestos-related liabilities (see Note 23) | 16 | 15 | ||||
| Interest | 6 | 7 | ||||
| Indemnity obligations – current portion (see Note 23) | 9 | — | ||||
| Other | 82 | 81 | ||||
| Other current liabilities | $ | 411 | $ | 610 | ||
In fiscal year 2006, a light vehicle systems customer of the company initiated a field service campaign related in part to a product of the company, which covered approximately 750,000 vehicles. The customer filed suit against the company seeking reimbursement of costs associated with the field service campaign as well as other warranty costs. In fiscal year 2006, the company recorded a contingency reserve of approximately $11 million related to this matter. In fiscal year 2008, the company recognized an additional charge of approximately $14 million. During the fourth quarter of fiscal year 2008, the company reached final settlement with the customer for $25 million.
76
ARVINMERITOR, INC.
NOTES TO CONSOLIDATED FINANCIAL STATEMENTS — (Continued)
The company’s commercial vehicle segments record estimated product warranty costs at the time of shipment of products to customers. Warranty reserves are primarily based on factors that include past claims experience, sales history, product manufacturing and engineering changes and industry developments. Liabilities for product recall campaigns are recorded at the time the company’s obligation is known and can be reasonably estimated. Product warranties, including recall campaigns, not expected to be paid within one year are recorded as a non-current liability.
The company’s LVS segment records estimated product warranty liabilities based on individual customer or warranty-sharing agreements. Product warranties are recorded for known warranty issues when amounts can be reasonably estimated.
A summary of the changes in product warranties is as follows (in millions):
| 2009 | 2008 | |||||||
| Total product warranties - beginning of year | $ | 102 | $ | 103 | ||||
| Accruals for product warranties | 62 | 72 | ||||||
| Payments | (43 | ) | (70 | ) | ||||
| Change in estimates and other | (12 | ) | (3 | ) | ||||
| Total product warranties – end of year | 109 | 102 | ||||||
| Less: non-current product warranties (see Note 15) | (51 | ) | (44 | ) | ||||
| Product warranties – current | $ | 58 | $ | 58 | ||||
15. OTHER LIABILITIES
Other liabilities are summarized as follows (in millions):
| September 30, | ||||||
| 2009 | 2008 | |||||
| Asbestos-related liabilities (see Note 23) | $ | 61 | $ | 54 | ||
| Non-current deferred income tax liabilities (see Note 22) | 73 | 4 | ||||
| Liabilities for uncertain tax positions (see Note 22) | 64 | 52 | ||||
| Product warranties (see Note 14) | 51 | 44 | ||||
| Environmental (see Note 23) | 10 | 10 | ||||
| Indemnity obligations (see Note 23) | 19 | — | ||||
| Long-term payable (see Note 12) | — | 45 | ||||
| Other | 32 | 38 | ||||
| Other liabilities | $ | 310 | $ | 247 | ||
16. LONG-TERM DEBT
Long-Term Debt, net of discounts where applicable, is summarized as follows (in millions):
| September 30, | ||||||||
| 2009 | 2008 | |||||||
| 7-1/8 percent notes due 2009 | $ | — | $ | 6 | ||||
| 6.8 percent notes due 2009 | — | 77 | ||||||
| 8-3/4 percent notes due 2012 | 276 | 276 | ||||||
| 8-1/8 percent notes due 2015 | 251 | 251 | ||||||
| 4.625 percent convertible notes due 2026(1) | 300 | 300 | ||||||
| 4.0 percent convertible notes due 2027(1) | 200 | 200 | ||||||
| Revolving credit facility, expiring June 2011 | 28 | — | ||||||
| Accounts receivable securitization, expiring September 2011 (see Note 7) | 83 | 111 | ||||||
| Lines of credit and other | 16 | 52 | ||||||
| Unamortized gain on swap unwind | 23 | 30 | ||||||
| Subtotal | 1,177 | 1,303 | ||||||
| Less: current maturities | (97 | ) | (240 | ) | ||||
| Long-term debt | $ | 1,080 | $ | 1,063 | ||||
| (1) | The 4.625 percent and 4.0 percent convertible notes contain a put and call feature, which allows for earlier redemption beginning in 2016 and 2019, respectively (see Convertible Securities below). |
77
ARVINMERITOR, INC.
NOTES TO CONSOLIDATED FINANCIAL STATEMENTS — (Continued)
Debt Securities
In February and March 2009, the company repaid the $77 million outstanding 6.8 percent notes and the $6 million outstanding 7-1/8 percent notes, respectively. Both notes were repaid in full upon maturity and no gain or loss on debt extinguishment was recognized for either transaction.
Revolving Credit Facility
The company has a $700 million revolving credit facility, which matures in June 2011. Due to the bankruptcy of Lehman Brothers in 2008, $34 million of these commitments are currently unavailable. The remaining amount of availability under this facility is dependent upon various factors, including principally performance against certain financial covenants. These financial covenants are based on (i) the ratio of the company’s senior secured indebtedness to EBITDA and (ii) the amount of annual capital expenditures. The company is required to maintain a total senior secured-debt-to-EBITDA ratio, as defined in the agreement, no greater than 2.0 to 1 on the last day of any fiscal quarter. At September 30, 2009, the company was in compliance with all covenants with a ratio of approximately 0.57x for the senior secured debt to EBITDA covenant.
The revolving credit facility includes a $150 million limit on the issuance of letters of credit. At September 30, 2009 and 2008, approximately $27 million and $38 million of letters of credit were issued, respectively. The company had an additional $5 million and $13 million outstanding at September 30, 2009 and 2008, respectively, on letters of credit available through other facilities.
Borrowings under the revolving credit facility are collateralized by $491 million of the company’s assets, primarily consisting of eligible domestic U.S. accounts receivable, inventory, plant, property and equipment, intellectual property and the company’s investment in all or a portion of certain of its wholly-owned subsidiaries.
Borrowings under the revolving credit facility are subject to interest based on quoted LIBOR rates plus a margin, and a commitment fee on undrawn amounts, both of which are based upon the company’s current credit rating for the senior secured facility. At September 30, 2009, the margin over the LIBOR rate was 275 basis points, and the commitment fee was 50 basis points.
The company amended this revolving credit facility in December 2007 and recognized a $3 million loss on debt extinguishment associated with the write-off of debt issuance costs. This loss on debt extinguishment is recorded in interest expense, net in the consolidated statement of operations.
Certain of the company’s subsidiaries, as defined in the credit agreement, irrevocably and unconditionally guarantee amounts outstanding under the amended revolving credit facility. Similar subsidiary guarantees are provided for the benefit of the holders of the publicly-held notes outstanding under the company’s indentures (see Note 27).
Investment in Debt Defeasance Trust
The company had $6 million of U.S. government securities in an irrevocable trust, for the sole purpose of funding payments of principal and interest through the stated maturity on the $6 million of outstanding 7-1/8 percent notes due March 2009, in order to defease certain covenants under the associated indenture. As these securities were restricted and could only be withdrawn and used for payments of the principal and interest on the aforementioned notes, the assets of the trust were recorded in Other Current Assets (see Note 10) in the consolidated balance sheet. As this debt matured during the second quarter of fiscal year 2009, it was repaid with the securities in the trust.
Convertible Securities
In February 2007, the company issued $200 million of 4.00 percent convertible senior unsecured notes due 2027 (the 2007 convertible notes). In March 2006, the company issued $300 million of 4.625 percent convertible senior unsecured notes due 2026 (the 2006 convertible notes). The 2007 convertible notes bear cash interest at a rate of 4.00 percent per annum from the date of issuance through February 15, 2019, payable semi-annually in arrears on February 15 and August 15 of each year. After February 15, 2019, the principal amount of the notes will be subject to accretion at a rate that provides holders with an aggregate annual yield to maturity of 4.00 percent. The 2006 convertible notes bear cash interest at a rate of 4.625 percent per annum from the date of issuance through March 1, 2016, payable semi-annually in arrears on March 1 and September 1 of each year. After March 1, 2016, the principal amount of the notes will be subject to accretion at a rate that provides holders with an aggregate annual yield to maturity of 4.625 percent.
Conversion Features – convertible securities
The 2007 convertible notes are convertible into shares of the company’s common stock at an initial conversion rate, subject to adjustment, equivalent to 37.4111 shares of common stock per $1,000 initial principal amount of notes, which represents an initial conversion price of approximately $26.73 per share. If converted, the accreted principal amount will be settled in cash and the remainder of the company’s conversion obligation, if any, in excess of such accreted principal amount will be settled in cash, shares of common stock, or a combination thereof, at the company’s election. Holders may convert their notes at any time on or after February 15, 2025. The maximum number of shares of common stock the 2007 convertible notes are convertible into is approximately 7 million.
78
ARVINMERITOR, INC.
NOTES TO CONSOLIDATED FINANCIAL STATEMENTS — (Continued)
The 2006 convertible notes are convertible into shares of the company’s common stock at an initial conversion rate, subject to adjustment, equivalent to 47.6667 shares of common stock per $1,000 initial principal amount of notes, which represents an initial conversion price of approximately $20.98 per share. If converted, the accreted principal amount will be settled in cash and the remainder of the company’s conversion obligation, if any, in excess of such accreted principal amount will be settled in cash, shares of common stock, or a combination thereof, at the company’s election. Holders may convert their notes at any time on or after March 1, 2024. The maximum number of shares of common stock the 2006 convertible notes are convertible into is approximately 14 million.
Prior to February 15, 2025 (2007 convertible notes) and March 1, 2024 (2006 convertible notes), holders may convert their notes only under the following circumstances:
-
during any calendar quarter, if the closing price of the company’s common stock for 20 or more trading days in a period of 30 consecutive trading days ending on the last trading day of the immediately preceding calendar quarter exceeds 120 percent of the applicable conversion price;
-
during the five business day period after any five consecutive trading day period in which the average trading price per $1,000 initial principal amount of notes is equal to or less than 97 percent of the average conversion value of the notes during such five consecutive trading day period;
-
upon the occurrence of specified corporate transactions, including, without limitation, a Change of Control and Termination of Trading (as defined therein); or
-
if the notes are called by the company for redemption.
Redemption Features – convertible securities
On or after February 15, 2019, the company may redeem the 2007 convertible notes, in whole or in part, for cash at a redemption price equal to 100 percent of the accreted principal amount plus any accrued and unpaid interest. On each of February 15, 2019 and 2022, or upon certain fundamental changes (which include a Change of Control and Termination of Trading, as defined therein), holders may require the company to purchase all or a portion of their 2007 convertible notes at a purchase price in cash equal to 100 percent of the accreted principal amount plus any accrued and unpaid interest.
On or after March 1, 2016, the company may redeem the 2006 convertible notes, in whole or in part, for cash at a redemption price equal to 100 percent of the accreted principal amount plus any accrued and unpaid interest. On each of March 1, 2016, 2018, 2020, 2022 and 2024, or upon certain fundamental changes, holders may require the company to purchase all or a portion of their 2006 convertible notes at a purchase price in cash equal to 100 percent of the accreted principal amount plus any accrued and unpaid interest.
The 2007 and 2006 convertible notes are fully and unconditionally guaranteed by certain subsidiaries of the company that currently guarantee the company’s obligations under its senior secured credit facility and other publicly-held notes (see Senior Secured Credit Facilities above).
Accounts Receivable Securitization
Since 2005 the company participated in a U.S. accounts receivable securitization program to enhance financial flexibility and lower interest costs (see Note 7). In September 2009, in anticipation of the expiration of the existing facility, the company entered into a new, two year $125 million U.S. receivables financing arrangement which is provided on a committed basis by a syndicate of financial institutions led by GMAC Commercial Finance LLC and expires in September 2011. The weighted average interest rate on borrowings under this arrangement was approximately 7.50% percent at September 30, 2009. Amounts outstanding under this agreement are reported as short-term debt in the consolidated balance sheet and are collateralized by $133 million of eligible receivables purchased and held by ARC at September 30, 2009. This program does not have specific financial covenants, however it does have a cross-default provision to the company’s revolving credit facility agreement. At September 30, 2008, $111 million was outstanding under the prior facility. No amount was outstanding under the prior facility at September 30, 2009.
79
ARVINMERITOR, INC.
NOTES TO CONSOLIDATED FINANCIAL STATEMENTS — (Continued)
Related Parties
MSSC has a $6 million, 6.5-percent loan with its minority partner. This loan matures in March 2010. In June 2009, the company entered into a binding letter of intent to sell its interest in MSSC. Accordingly, at September 30, 2009, this loan is included in liabilities of discontinued operations in the consolidated balance sheet (see Note 3). On October 30, 2009, the company completed the sale of MSSC (see Note 1) and as a result this loan was assumed by the buyer upon closing of the sale transaction.
Interest Rate Swap Agreements
In January 2008, the company terminated all of its interest rate swap agreements and received proceeds from these terminations, including interest received, of $28 million. The unamortized fair value adjustment of the notes associated with these and previous interest rate swap terminations was $23 million and $30 million at September 30, 2009 and 2008, respectively. The fair value adjustment of the notes is classified as long-term debt in the consolidated balance sheet and is amortized to earnings as a reduction of interest expense over the remaining term of the debt.
Leases
The company has various operating leasing arrangements. Future minimum lease payments under these operating leases are $24 million in 2010, $20 million in 2011, $16 million in 2012, $14 million in 2013, $12 million in 2014 and $25 million thereafter.
17. FINANCIAL INSTRUMENTS
The company’s financial instruments include cash and cash equivalents, short-term debt, long-term debt and foreign exchange forward contracts. The company uses derivatives for hedging and non-trading purposes in order to manage its foreign exchange rate exposures.
Foreign Exchange Contracts
The company’s operations are exposed to global market risks, including the effect of changes in foreign currency exchange rates. The company has a foreign currency cash flow hedging program to reduce the company’s exposure to changes in exchange rates. The company uses foreign currency forward contracts to manage the company’s exposures arising from foreign currency exchange risk. Gains and losses on the underlying foreign currency exposures are partially offset with gains and losses on the foreign currency forward contracts.
Under this program, the company has designated the foreign exchange contracts (the “contracts”) as cash flow hedges of underlying forecasted foreign currency purchases and sales. The effective portion of changes in the fair value of the contracts is recorded in Accumulated Other Comprehensive Loss (AOCL) in the consolidated balance sheet and is recognized in operating income when the underlying forecasted transaction impacts earnings. The fair values of derivative instruments are presented on a gross basis as the company does not have any derivative contracts which are subject to master netting arrangements. The company did not have any hedges that required the posting of collateral as of September 30, 2009.
The company’s foreign exchange contracts generally mature within twelve months. At September 30, 2009 and 2008, the company had outstanding contracts with notional amounts of $89 million and $422 million, respectively. These notional values consist primarily of contracts for the European euro, British pound sterling and Swedish krona, and are stated in U.S. dollar equivalents at spot exchange rates at the respective dates.
Fair values of derivative instruments in the consolidated balance sheet at September 30, 2009 are $3 million and are included in other current liabilities (see Note 14). The effect of derivative instruments on comprehensive income (loss) for the twelve months ended September 30, 2009 is as follows (in millions):
| Location of | Amount of | ||||
| Gain (Loss) | Gain (Loss) | ||||
| Amount of gain (loss) recognized in AOCL | |||||
| (effective portion) | AOCL | $ | (15 | ) | |
| Amount of loss reclassified from AOCL into | |||||
| income (effective portion) | Cost of sales | $ | (20 | ) | |
| Amount of gain (loss) recognized in income on | |||||
| derivatives not designated as hedging | |||||
| instruments and on discontinuance of cash flow | |||||
| hedges | Cost of sales | $ | (3 | ) | |
80
ARVINMERITOR, INC.
NOTES TO CONSOLIDATED FINANCIAL STATEMENTS — (Continued)
At September 30, 2009 and 2008, there was a loss of $2 million and $10 million, respectively, recorded in AOCL. The company expects to reclassify the loss at September 30, 2009 from AOCL to operating income during the next twelve months as the forecasted hedged transactions are recognized in earnings.
The company classifies the cash flows associated with the contracts in cash flows from operating activities in the consolidated statement of cash flows. This is consistent with the classification of the cash flows associated with the underlying hedged item.
Fair Value
Fair values of financial instruments are summarized as follows (in millions):
| September 30, | September 30, | ||||||||||
| 2009 | 2008 | ||||||||||
| Carrying | Fair | Carrying | Fair | ||||||||
| Value | Value | Value | Value | ||||||||
| Cash and cash equivalents | $ | 95 | $ | 95 | $ | 497 | $ | 497 | |||
| Foreign exchange contracts - asset | — | — | 4 | 4 | |||||||
| Investment in debt defeasance trust | — | — | 6 | 6 | |||||||
| Foreign exchange contracts - liability | 3 | 3 | 16 | 16 | |||||||
| Short-term debt | 97 | 97 | 240 | 240 | |||||||
| Long-term debt | 1,080 | 885 | 1,063 | 882 | |||||||
Cash and cash equivalents — All highly liquid investments purchased with an original maturity of three months or less are considered to be cash equivalents. The carrying value approximates fair value because of the short maturity of these instruments.
Foreign exchange forward contracts — The company uses foreign exchange forward purchase and sale contracts with terms of two years or less to hedge its exposure to changes in foreign currency exchange rates. The fair value of foreign exchange forward contracts is based on a model which incorporates observable inputs including quoted spot rates, forward exchange rates and discounted future expected cash flows utilizing market interest rates with similar quality and maturity characteristics.
Short-term debt and long-term debt — Fair values are based on interest rates that would be currently available to the company for issuance of similar types of debt instruments with similar terms and remaining maturities.
18. SHAREOWNERS’ EQUITY
Common Stock
The company is authorized to issue 500 million shares of Common Stock, with a par value of $1 per share, and 30 million shares of Preferred Stock, without par value, of which two million shares are designated as Series A Junior Participating Preferred Stock (Junior Preferred Stock). Under the Company Rights Plan, a Preferred Share Purchase Right (Right) is attached to each share of Common Stock pursuant to which the holder may, in certain takeover-related circumstances, become entitled to purchase from the company 1/100th of a share of Junior Preferred Stock at a price of $100, subject to adjustment. Also, in certain takeover-related circumstances, each Right (other than those held by an acquiring person) will be exercisable for shares of Common Stock or stock of the acquiring person having a market value of twice the exercise price. In certain events, the company may exchange each Right for one share of Common Stock or 1/100th of a share of Junior Preferred Stock. The Rights will expire on July 7, 2010, unless earlier exchanged or redeemed at a redemption price of $0.01 per Right. Until a Right is exercised, the holder, as such, will have no voting, dividend or other rights as a shareowner of the company.
81
ARVINMERITOR, INC.
NOTES TO CONSOLIDATED FINANCIAL STATEMENTS — (Continued)
The company has reserved approximately 4.5 million shares of Common Stock in connection with its 1997 and 2007 Long-Term Incentives Plans (LTIPs), 2004 Directors Stock Plan, Incentive Compensation Plan, 1998 and 1988 Stock Benefit Plans (the “Existing Plans”), and Employee Stock Benefit Plan for grants of non-qualified stock options, incentive stock options, stock appreciation rights, restricted stock, performance shares, restricted share units and stock awards to key employees and directors. At September 30, 2009, there were 0.6 million shares available for future grants under these plans.
The company accounts for treasury stock at cost. There were no purchases of treasury stock in fiscal years 2009 and 2008. Treasury stock of $1 million was purchased in fiscal year 2007.
Accumulated Other Comprehensive Loss
The components of Accumulated Other Comprehensive Loss as reported in the Consolidated Balance Sheet and Statement of Shareowners’ Equity are as follows:
| Employee | |||||||||||||||
| Foreign | Benefit | ||||||||||||||
| Currency | Related | Unrealized | |||||||||||||
| Translation | Adjustments | Gains (Losses) | Total | ||||||||||||
| Balance at September 30, 2006 | $ | 179 | $ | (257 | ) | $ | (1 | ) | $ | (79 | ) | ||||
| 2007 adjustment | 169 | 126 | — | 295 | |||||||||||
| Impact of sale of businesses on foreign currency translation adjustment | (133 | ) | — | — | (133 | ) | |||||||||
| Adjustment upon adoption of retirement benefits guidance, net of tax of | |||||||||||||||
| $193 | — | (357 | ) | — | (357 | ) | |||||||||
| Deferred gain on cash flow hedges | — | — | 2 | 2 | |||||||||||
| Balance at September 30, 2007 | 215 | (488 | ) | 1 | (272 | ) | |||||||||
| 2008 adjustment | (13 | ) | 71 | — | 58 | ||||||||||
| Deferred loss on cash flow hedges | — | — | (11 | ) | (11 | ) | |||||||||
| Balance at September 30, 2008 | 202 | (417 | ) | (10 | ) | (225 | ) | ||||||||
| 2009 adjustment | (53 | ) | (465 | ) | — | (518 | ) | ||||||||
| Impact of sale of businesses on foreign currency translation adjustment | (10 | ) | — | — | (10 | ) | |||||||||
| Adjustment upon adoption of retirement benefits guidance | — | 9 | — | 9 | |||||||||||
| Deferred loss on cash flow hedges | — | — | 8 | 8 | |||||||||||
| Unrealized gain on investment | — | — | 2 | 2 | |||||||||||
| Balance at September 30, 2009 | $ | 139 | $ | (873 | ) | $ | — | $ | (734 | ) | |||||
19. EQUITY BASED COMPENSATION
Stock Options
Under the company’s incentive plans, stock options are granted at prices equal to the fair value on the date of grant and have a maximum term of 10 years. Stock options vest over a three year period from the date of grant. The company granted 300,000 stock options in fiscal year 2008. No stock options were granted during fiscal years 2009 and 2007.
Information related to stock options is as follows (shares in thousands, exercise price and remaining contractual term represent weighted averages and aggregate intrinsic values in millions):
| Remaining | Aggregate | ||||||||
| Exercise | Contractual | Intrinsic | |||||||
| Shares | Price | Life (years) | Value | ||||||
| Outstanding — beginning of year | 2,085 | $ | 18.29 | ||||||
| Granted | — | — | |||||||
| Exercised | — | — | |||||||
| Cancelled or expired | (331 | ) | 21.63 | ||||||
| Outstanding — end of year | 1,754 | $ | 17.66 | 3.8 | — | ||||
| Exercisable — end of year | 1,554 | $ | 18.28 | 3.1 | — | ||||
82
ARVINMERITOR, INC.
NOTES TO CONSOLIDATED FINANCIAL STATEMENTS — (Continued)
The following table provides additional information about outstanding stock options at September 30, 2009 (shares in thousands, exercise price represents a weighted average):
| Outstanding | Exercisable | ||||||||||
| Remaining | |||||||||||
| Contractual | Exercise | Exercise | |||||||||
| Shares | Life (years) | Price | Shares | Price | |||||||
| $12.00 to $16.00 | 525 | 6.1 | $ | 13.79 | 325 | $ | 14.42 | ||||
| $16.01 to $21.00 | 1,159 | 2.9 | 19.06 | 1,159 | 19.06 | ||||||
| $21.01 to $26.00 | 70 | 1.2 | 23.52 | 70 | 23.52 | ||||||
| 1,754 | 1,554 | ||||||||||
Compensation expense is recognized for the non-vested portion of previously issued stock options. Compensation expense associated with the expensing of stock options was not significant in fiscal year 2009 and 2008. The company recorded compensation expense of $1 million in fiscal years 2007, associated with the expensing of stock options. No options were exercised in fiscal year 2009. The total intrinsic value of options exercised in fiscal years 2008 and 2007 was less than $1 million and $9 million, respectively.
The weighted average fair value of options granted in fiscal year 2008 was $4.70 per share. The fair value of the options was estimated on the date of grant using the Black-Scholes pricing model and the following assumptions:
| 2008 | ||
| Average risk-free interest rate | 3.6 | % |
| Expected dividend yield | 3.1 | % |
| Expected volatility | 46.1 | % |
| Expected life (years) | 6.5 | |
Restricted Stock, Restricted Units, Performance Shares and Performance Share Units
The company has granted shares of restricted stock, performance shares and restricted and performance share units to certain employees and non-employee members of the Board of Directors in accordance with the Existing Plans. The company measures the grant price fair value of these stock based awards at the market price of the company’s common stock as of the date of the grant. Employee awards typically vest over three years and are subject to continued employment by the employee. Performance shares and share units are also subject to satisfaction of certain conditions related to the company’s financial performance. Compensation cost associated with stock based awards is recognized ratably over the vesting period. Cash dividends on the restricted stock are reinvested in additional shares of common stock during the vesting period.
In fiscal years 2009, 2008 and 2007, the company granted 2,507,700, 1,311,156 and 964,200 shares of stock based awards, respectively. The grant date fair value of these shares was $2.84, $11.46 and $17.51 for shares granted in fiscal years 2009, 2008 and 2007, respectively.
The company’s nonvested restricted shares and share units as of September 30, 2009, and the activity during fiscal year 2009 are summarized as follows (shares in thousands):
| Number of | Weighted-Average | |||||
| Nonvested Shares | Shares | Grant-Date Fair Value | ||||
| Nonvested - beginning of year | 1,198 | $ | 12.70 | |||
| Granted | 2,508 | 2.84 | ||||
| Vested | (1,324 | ) | 7.12 | |||
| Forfeited | (541 | ) | 9.69 | |||
| Nonvested - end of year | 1,841 | 4.17 | ||||
As of September 30, 2009, there was $8 million of total unrecognized compensation costs related to nonvested equity compensation arrangements. These costs are expected to be recognized over a weighted average period of 1 year. Total compensation expense recognized for restricted stock, restricted share units, performance shares and performance share units was $10 million in fiscal year 2009, $7 million in fiscal year 2008 and $12 million in fiscal year 2007.
83
ARVINMERITOR, INC.
NOTES TO CONSOLIDATED FINANCIAL STATEMENTS — (Continued)
20. RETIREMENT MEDICAL PLANS
The company has retirement medical plans that cover the majority of its U.S. and certain non-U.S. employees, including certain employees of divested businesses, and provide for medical payments to eligible employees and dependents upon retirement. These plans are unfunded. The company adopted the recognition and disclosure provisions of the FASB’s retirement benefits guidance as of September 30, 2007 and the measurement date provisions as of October 1, 2008 (see Note 2).
The company approved amendments to certain retiree medical plans in fiscal years 2002 and 2004. The cumulative effect of these amendments was a reduction in the accumulated postretirement benefit obligation (APBO) of $293 million, which was being amortized as a reduction of retiree medical expense over the average remaining service period of approximately 12 years. These plan amendments have been challenged in three separate class action lawsuits that have been filed in the United States District Court for the Eastern District of Michigan (District Court). The lawsuits allege that the changes breach the terms of various collective bargaining agreements entered into with the United Auto Workers (the UAW lawsuit) and the United Steel Workers (the USW lawsuit) at facilities that have either been closed or sold. The complaints also allege a companion claim under the Employee Retirement Income Security Act of 1974 (ERISA) essentially restating the alleged collective bargaining breach claims and seeking to bring them under ERISA. Plaintiffs sought injunctive relief requiring the company to provide lifetime retiree health care benefits under the applicable collective bargaining agreements.
On December 22, 2005, the District Court issued an order granting a motion by the UAW for a preliminary injunction. The order enjoined the company from implementing the changes to retiree health benefits that had been scheduled to become effective on January 1, 2006, and ordered the company to reinstate and resume paying the full cost of health benefits for the UAW retirees at the levels existing prior to the changes approved in 2002 and 2004. On August 17, 2006, the District Court denied a motion by the company and the other defendants for summary judgment; granted a motion by the UAW for summary judgment; and granted the UAW’s request to make the terms of the preliminary injunction permanent (the injunction). Due to the uncertainty related to the ongoing lawsuits and because the injunction has the impact of at least temporarily changing the benefits provided under the existing postretirement medical plans, the company has accounted for the injunction as a rescission of the 2002 and 2004 plan amendments that modified UAW retiree healthcare benefits. The company recalculated the APBO as of December 22, 2005, which resulted in an increase in the APBO of $168 million. The increase in APBO will offset the remaining unamortized negative prior service cost of the 2002 and 2004 plan amendments and will increase retiree medical expense over the average remaining service period associated with the original plan amendments of approximately 10 years. In addition, the increase in APBO resulted in higher interest cost, a component of retiree medical expense. The company began recording the impact of the injunction in March 2006. In addition, the injunction ordered the defendants to reimburse the plaintiffs for out-of-pocket expenses incurred since the date of the earlier benefit modifications. The company has recorded a $5 million reserve at September 30, 2009 and 2008 as the best estimate of its liability for these retroactive benefits. The company continues to believe it has meritorious defenses to these actions and has appealed the District Court’s order to the U.S. Court of Appeals for the Sixth Circuit. The ultimate outcome of the UAW lawsuit may result in future plan amendments. The impact of any future plan amendments cannot be currently estimated.
On November 12, 2008, the company settled the USW lawsuit with the United Steel Workers with respect to certain retiree medical plan amendments for approximately $28 million. This settlement was paid in November 2008 and increased the accumulated postretirement benefit obligation (APBO) by approximately $23 million. The increase in APBO has been reflected in the company’s September 30, 2009 actuarial valuation as an increase in actuarial losses and will be amortized into periodic retiree medical expense over an average expected remaining service life of approximately ten years.
The company’s retiree medical obligations are measured as of September 30, 2009 and June 30, 2008 and 2007. The following are the assumptions used in the measurement of the APBO and retiree medical expense:
| 2009 | 2008 | 2007 | ||||||
| Discount rate | 5.60 | % | 6.90 | % | 6.30 | % | ||
| Health care cost trend rate (weighted average) | 7.85 | % | 7.60 | % | 9.00 | % | ||
| Ultimate health care trend rate | 5.00 | % | 5.00 | % | 5.00 | % | ||
| Year ultimate rate is reached | 2021 | 2021 | 2015 | |||||
The assumptions noted above are used to calculate the APBO for each fiscal year end and retiree medical expense for the subsequent fiscal year.
The discount rate is used to calculate the present value of the APBO. This rate is determined based on high-quality fixed income investments that match the duration of expected retiree medical benefits. The company has used the corporate AA/Aa bond rate for this assumption. The health care cost trend rate represents the company’s expected annual rates of change in the cost of health care benefits. The trend rate noted above represents a projection of health care costs as of the measurement date through 2021, at which time the health care trend rate is projected to be 5 percent. The company’s projection for fiscal year 2010 is an increase in health care costs of 7.85 percent.
84
ARVINMERITOR, INC.
NOTES TO CONSOLIDATED FINANCIAL STATEMENTS — (Continued)
The APBO as of the September 30, 2009 and June 30, 2008 measurement dates are summarized as follows (in millions):
| 2009 | 2008 | ||||
| Retirees | $ | 598 | $ | 521 | |
| Employees eligible to retire | 14 | 15 | |||
| Employees not eligible to retire | 21 | 38 | |||
| Total | $ | 633 | $ | 574 | |
The following reconciles the change in APBO and the amounts included in the consolidated balance sheet for the 15 month period and 12 month period ended September 30, 2009 and June 30, 2008, respectively (in millions):
| 2009 | 2008 | ||||||
| APBO — beginning of year | $ | 574 | $ | 576 | |||
| Service cost (1) | 3 | 3 | |||||
| Interest cost (1) | 46 | 35 | |||||
| Participant contributions | 3 | 3 | |||||
| Plan amendments | (9 | ) | — | ||||
| Actuarial losses | 114 | 7 | |||||
| Curtailments (see Note 21) | (5 | ) | — | ||||
| Termination benefits | 2 | — | |||||
| Settlements | (28 | ) | — | ||||
| Foreign currency rate changes | (4 | ) | 2 | ||||
| Benefit payments | (63 | ) | (52 | ) | |||
| APBO — end of year | 633 | 574 | |||||
| Benefit payments made during the fourth quarter | — | (11 | ) | ||||
| Other (2) | 5 | 5 | |||||
| Retiree medical liability | $ | 638 | $ | 568 | |||
| (1) | The change in APBO for fiscal year 2009 includes $1 million in service cost and $9 million in interest cost resulting from the change in the measurement date from June to September to coincide with the company’s fiscal year end. | |
| (2) | The company recorded a $5 million reserve for retiree medical liabilities at September 30, 2009 and 2008 as its best estimate for retroactive benefits related to the previously mentioned injunction. |
Actuarial losses relate to changes in the discount rate and earlier than expected retirements due to certain plant closings and restructuring actions. In accordance with FASB ASC Topic 715, “Compensation – Retirement Benefits”, a portion of the actuarial losses is not subject to amortization. The actuarial losses that are subject to amortization are generally amortized over the average expected remaining service life, which is approximately 12 years. Union plan amendments are generally amortized over the contract period, or three years.
The Medicare Prescription Drug Improvement and Modernization Act of 2003 provides for a federal subsidy to sponsors of retiree health care benefit plans that provide a benefit at least actuarially equivalent to the benefit established by the law. The company provides retiree medical benefits for certain plans that exceed the value of the benefits that are provided by the Medicare Part D plan. Therefore, management concluded that these plans are at least actuarially equivalent to the Medicare Part D plan and the company is eligible for the federal subsidy. The impact of the subsidy was reflected as a reduction in the fiscal year 2009 and 2008 retiree medical expense of $6 million and $7 million, respectively.
The retiree medical liability is included in the consolidated balance sheet as follows (in millions):
| September 30, | |||||
| 2009 | 2008 | ||||
| Current — included in compensation and benefits | $ | 50 | $ | 48 | |
| Long-term — included in retirement benefits | 588 | 520 | |||
| Retiree medical liability | $ | 638 | $ | 568 | |
85
ARVINMERITOR, INC.
NOTES TO CONSOLIDATED FINANCIAL STATEMENTS — (Continued)
Amounts recorded in accumulated other comprehensive loss, net of tax, not yet recognized in net periodic retiree medical expense as of September 30 are as follows (in millions):
| 2009 | |||
| Net actuarial loss | $ | 285 | |
| Prior service benefit | (33 | ) | |
| Amounts recorded in accumulated other comprehensive loss | $ | 252 | |
The net actuarial loss and prior service benefit that is estimated to be amortized from accumulated other comprehensive loss in shareowners’ equity (deficit) into net periodic retiree medical expense in 2010 are $37 million and $9 million, respectively.
The components of retiree medical expense are as follows (in millions):
| 2009 | 2008 | 2007 | |||||||||
| Service cost | $ | 2 | $ | 3 | $ | 3 | |||||
| Interest cost | 37 | 35 | 37 | ||||||||
| Amortization of — | |||||||||||
| Prior service benefit | (9 | ) | (7 | ) | (8 | ) | |||||
| Actuarial gains and losses | 27 | 27 | 25 | ||||||||
| Termination benefits (1) | 2 | — | — | ||||||||
| Retiree medical expense – total company | 59 | 58 | 57 | ||||||||
| Less: Retiree medical expense of discontinued operations | 5 | 5 | 5 | ||||||||
| Retiree medical expense included in continuing operations | $ | 54 | $ | 53 | $ | 52 | |||||
| (1) |
In 2009, the company recorded termination benefits of $2 million associated with the announced closure of its Commercial Truck brakes plant in Tilbury, Ontario. This expense is included in restructuring costs (see Note 5) in the consolidated statement of operations. |
A one-percentage point change in the assumed health care cost trend rate for all years to, and including, the ultimate rate would have the following effects (in millions):
| 2009 | 2008 | ||||||
| Effect on total service and interest cost | |||||||
| 1% Increase | $ | 4 | $ | 4 | |||
| 1% Decrease | (4 | ) | (4 | ) | |||
| Effect on APBO | |||||||
| 1% Increase | 65 | 59 | |||||
| 1% Decrease | (56 | ) | (50 | ) | |||
The company expects future benefit payments as follows (in millions):
| Gross | |||||
| Gross | Medicare | ||||
| Benefit | Part D | ||||
| Payments | Receipts | ||||
| Fiscal 2010 | $ | 49 | $ | 3 | |
| Fiscal 2011 | 49 | 3 | |||
| Fiscal 2012 | 49 | 3 | |||
| Fiscal 2013 | 49 | 4 | |||
| Fiscal 2014 | 49 | 4 | |||
| Fiscal 2015 – 2019 | 238 | 21 | |||
21. RETIREMENT PENSION PLANS
The company sponsors defined benefit pension plans that cover most of its U.S. employees and certain non-U.S. employees. Pension benefits for salaried employees are based on years of credited service and compensation. Pension benefits for hourly employees are based on years of service and specified benefit amounts. The company’s funding policy provides that annual contributions to the pension trusts will be at least equal to the minimum amounts required by ERISA in the U.S. and the actuarial recommendations or statutory requirements in other countries. The company adopted the recognition and disclosure provisions of FASB’s retirement benefit guidance as of September 30, 2007 and the measurement date provisions as of October 1, 2008 (see Note 2).
86
ARVINMERITOR, INC.
NOTES TO CONSOLIDATED FINANCIAL STATEMENTS — (Continued)
On February 24, 2009, the company announced the closure of its commercial truck brakes plant in Tilbury, Ontario, Canada. All salaried and hourly employees at this facility participate in both a salaried or hourly pension plan and a retiree medical plan. The expected closure of this facility triggered plan curtailments requiring the remeasurement of each plan. The measurement date of these valuations was February 28, 2009. The FASB’s retirement benefits guidance requires a plan curtailment loss to be recognized in earnings when it is probable that a curtailment will occur and the effects are reasonably estimable. Including pension termination benefits of approximately $14 million required to be paid under the terms of the plans, the company recognized plan curtailment losses of approximately $16 million, which include $2 million of retiree medical benefits, recorded in restructuring costs (see Note 5) in the consolidated statement of operations.
On March 5, 2009, the company announced its plans to close its coil spring operations in Milton, Ontario, Canada, which is part of MSSC. As noted in Note 3, the company signed a binding letter of intent to sell its 57 percent interest in MSSC and MSSC is presented as held for sale and included in discontinued operations at September 30, 2009. The company recognized an $8 million curtailment charge, primarily related to pension termination benefits, which is included in loss from discontinued operations in the consolidated statement of operations.
In April 2007, the company announced a freeze of its defined benefit pension plan for salaried and non-represented employees in the United States, effective January 1, 2008. The change affected approximately 3,800 employees including certain employees who will continue to accrue benefits for an additional transition period, ending June 30, 2011. After these freeze dates, the company will instead make additional contributions to its defined contribution savings plan on behalf of the affected employees. The amount of the savings plan contribution will be based on a percentage of the employee’s pay, with the contribution percentage increasing as the employee ages. These changes do not affect current retirees or represented employees. The company began recording the impact of the plan freeze in the fourth quarter of fiscal year 2007.
Certain of the company’s non-U.S. subsidiaries provide limited non-pension benefits to retirees in addition to government-sponsored programs. The cost of these programs is not significant to the company. Most retirees outside the U.S. are covered by government-sponsored and administered programs.
The company’s pension obligations were measured as of September 30, 2009 and June 30, 2008 and 2007. The U.S. plans include a qualified and non-qualified pension plan. The non-U.S. plans include plans primarily in the United Kingdom, Canada, Germany and Switzerland.
The following are the assumptions used in the measurement of the projected benefit obligation (PBO) and net periodic pension expense:
| U.S. Plans | ||||||||
| 2009 | 2008 | 2007 | ||||||
| Discount Rate | 5.70 | % | 7.10 | % | 6.35 | % | ||
| Assumed return on plan assets | 8.50 | % | 8.50 | % | 8.50 | % | ||
| Rate of compensation increase | 3.75 | % | 3.75 | % | 3.75 | % | ||
| Non-U.S. Plans | |||||
| 2009 | 2008 | 2007 | |||
| Discount Rate | 3.00% — 6.25% | 3.50% — 6.75% | 5.25% — 6.00% | ||
| Assumed return on plan assets | 3.00% — 8.00% | 3.00% — 8.00% | 8.00% — 8.00% | ||
| Rate of compensation increase | 2.00% — 3.50% | 2.00% — 5.00% | 2.50% — 4.25% | ||
The assumptions noted above are used to calculate the PBO reported in each fiscal year and net periodic pension expense for the subsequent fiscal year.
The discount rate is used to calculate the present value of the PBO. The rate used reflects a rate of return on high-quality fixed income investments that match the duration of expected benefit payments. The company uses a portfolio of long-term corporate AA/Aa bonds that match the duration of the expected benefit payments to establish the discount rate for this assumption.
The assumed return on plan assets is used to determine net periodic pension expense. The rate of return assumptions are based on projected long-term market returns for the various asset classes in which the plans are invested, weighted by the target asset allocations. An incremental amount for active plan asset management, where appropriate, is included in the rate of return assumption. The return assumption is reviewed annually.
87
ARVINMERITOR, INC.
NOTES TO CONSOLIDATED FINANCIAL STATEMENTS — (Continued)
The rate of compensation increase represents the long-term assumption for expected increases to salaries for pay-related plans. The accompanying disclosures include pension obligations associated with businesses classified as discontinued operations.
The following table reconciles the change in the PBO, the change in plan assets and amounts included in the consolidated balance sheet for the 15 month period and 12 month period ended September 30, 2009 and June 30, 2008, respectively (in millions):
| 2009 | 2008 | |||||||||||||||||||||||
| U.S. | Non-U.S. | Total | U.S. | Non-U.S. | Total | |||||||||||||||||||
| PBO — beginning of year | $ | 883 | $ | 771 | $ | 1,654 | $ | 953 | $ | 878 | $ | 1,831 | ||||||||||||
| Service cost (1) | 8 | 14 | 22 | 11 | 17 | 28 | ||||||||||||||||||
| Interest cost (1) | 76 | 52 | 128 | 59 | 48 | 107 | ||||||||||||||||||
| Participant contributions | — | 2 | 2 | — | 2 | 2 | ||||||||||||||||||
| Actuarial loss (gain) | 157 | 80 | 237 | (81 | ) | (56 | ) | (137 | ) | |||||||||||||||
| Curtailments | — | — | — | — | (3 | ) | (3 | ) | ||||||||||||||||
| Termination benefits | — | 22 | 22 | — | — | — | ||||||||||||||||||
| Benefit payments | (77 | ) | (63 | ) | (140 | ) | (59 | ) | (50 | ) | (109 | ) | ||||||||||||
| Foreign currency rate changes | — | (72 | ) | (72 | ) | — | (65 | ) | (65 | ) | ||||||||||||||
| PBO — end of year | 1,047 | 806 | 1,853 | 883 | 771 | 1,654 | ||||||||||||||||||
| Change in plan assets | ||||||||||||||||||||||||
| Fair value of assets — beginning of year | 841 | 698 | 1,539 | 843 | 807 | 1,650 | ||||||||||||||||||
| Actual return on plan assets | (44 | ) | 25 | (19 | ) | 53 | (26 | ) | 27 | |||||||||||||||
| Employer contributions | 6 | 26 | 32 | 4 | 32 | 36 | ||||||||||||||||||
| Participant contributions | — | 2 | 2 | — | 2 | 2 | ||||||||||||||||||
| Curtailments | — | — | — | — | 2 | 2 | ||||||||||||||||||
| Benefit payments | (77 | ) | (63 | ) | (140 | ) | (59 | ) | (50 | ) | (109 | ) | ||||||||||||
| Foreign currency rate changes | — | (78 | ) | (78 | ) | — | (69 | ) | (69 | ) | ||||||||||||||
| Fair value of assets — end of year | 726 | 610 | 1,336 | 841 | 698 | 1,539 | ||||||||||||||||||
| Funded status | (321 | ) | (196 | ) | (517 | ) | (42 | ) | (73 | ) | (115 | ) | ||||||||||||
| Contributions made in the fourth quarter | — | — | — | 1 | 4 | 5 | ||||||||||||||||||
| Net amount recognized | $ | (321 | ) | $ | (196 | ) | $ | (517 | ) | $ | (41 | ) | $ | (69 | ) | $ | (110 | ) | ||||||
| (1) |
The change in PBO for fiscal year 2009 includes $4 million in service cost and $26 million in interest cost resulting from the change in the measurement date from June to September to coincide with the company’s year end. |
Amounts included in the consolidated balance sheet at September 30 are comprised of the following (in millions):
| 2009 | 2008 | ||||||||||||||||||||||
| U.S. | Non-U.S. | Total | U.S. | Non-U.S. | Total | ||||||||||||||||||
| Noncurrent assets | $ | — | $ | 9 | $ | 9 | $ | — | $ | 25 | $ | 25 | |||||||||||
| Current liabilities | (5 | ) | (3 | ) | (8 | ) | (4 | ) | (3 | ) | (7 | ) | |||||||||||
| Noncurrent liabilities | (316 | ) | (202 | ) | (518 | ) | (37 | ) | (91 | ) | (128 | ) | |||||||||||
| Net amount recognized | $ | (321 | ) | $ | (196 | ) | $ | (517 | ) | $ | (41 | ) | $ | (69 | ) | $ | (110 | ) | |||||
Amounts recorded in accumulated other comprehensive loss, net of tax, not yet recognized in net periodic pension expense as of September 30, 2009 are as follows (in millions):
| U.S. | Non-U.S. | Total | ||||||||
| Net actuarial loss | $ | 373 | $ | 253 | $ | 626 | ||||
| Prior service cost (benefit) | — | (5 | ) | (5 | ) | |||||
| Amounts recorded in accumulated other comprehensive loss | $ | 373 | $ | 248 | $ | 621 | ||||
The net actuarial loss and prior service benefit that are estimated to be amortized from accumulated other comprehensive loss into net periodic pension expense in fiscal year 2010 are $40 million and less than $1 million, respectively.
In recognition of the long-term nature of the liabilities of the pension plans, the company has targeted an asset allocation strategy that intends to promote asset growth while maintaining an acceptable level of risk over the long-term. Asset-liability studies are performed periodically to validate the continued appropriateness of these asset allocation targets. The target asset allocation ranges for the U.S. plan are 50–70 percent equity investments, 20–40 percent fixed income investments and 5–15 percent alternative investments. The target asset allocation ranges for the non-U.S. plans are 55–85 percent equity investments, 15–40 percent fixed income investments and 0–5 percent real estate and alternative investments. The asset class mix and the percentage of securities in any asset class or market may vary as the risk/return characteristics of either individual market or asset classes vary over time.
88
ARVINMERITOR, INC.
NOTES TO CONSOLIDATED FINANCIAL STATEMENTS — (Continued)
The investment strategies for the pension plans are designed to achieve an appropriate diversification of investments as well as safety and security of the principal invested. Assets invested are allocated to certain global sub-asset categories within prescribed ranges in order to promote international diversification across security type, issuer type, investment style, industry group and economic sector. Assets of the plans are actively managed. Policy limits are placed on the percentage of plan assets that can be invested in a security of any single issuer and minimum credit quality standards are established for debt securities. ArvinMeritor securities did not comprise any of the value of our worldwide pension assets during 2009 and 2008.
The weighted average asset allocation for the U.S. and non-U.S. pension plans are as follows:
| 2009 | 2008 | ||||||||||
| U.S. | Non-U.S. | U.S. | Non-U.S. | ||||||||
| Equity investments | 51.9 | % | 56.7 | % | 55.5 | % | 61.4 | % | |||
| Fixed income investments | 37.8 | % | 40.7 | % | 32.5 | % | 35.3 | % | |||
| Real estate | 0.0 | % | 2.1 | % | 0.5 | % | 3.3 | % | |||
| Other | 10.3 | % | 0.5 | % | 11.5 | % | 0.0 | % | |||
| Total | 100.0 | % | 100.0 | % | 100.0 | % | 100.0 | % | |||
The non-current portion of the pension liability is included in Retirement Benefits in the consolidated balance sheet as follows (in millions):
| September 30, | ||||||
| 2009 | 2008 | |||||
| Pension liability | $ | 498 | (1) | $ | 128 | |
| Retiree medical liability — long term (see Note 20) | 540 | (1) | 520 | |||
| Other | 39 | 42 | ||||
| Total retirement benefits | $ | 1,077 | $ | 690 | ||
| (1) |
The table above excludes pension and retiree medical liabilities of $20 million and $48 million, respectively, recorded in discontinued operations in the consolidated balance sheet. |
In accordance with FASB guidance, the PBO, accumulated benefit obligation (ABO) and fair value of plan assets is required to be disclosed for all plans where the ABO is in excess of plan assets. The difference between the PBO and ABO is that the PBO includes projected compensation increases.
Additional information is as follows (in millions):
| 2009 | 2008 | ||||||||||||||||
| ABO | Assets | ABO | Assets | ||||||||||||||
| Exceeds | Exceeds | Exceeds | Exceeds | ||||||||||||||
| Assets | ABO | Total | Assets | ABO | Total | ||||||||||||
| PBO | $ | 1,840 | $ | 13 | $ | 1,853 | $ | 217 | $ | 1,437 | $ | 1,654 | |||||
| ABO | 1,814 | 9 | 1,823 | 210 | 1,387 | 1,597 | |||||||||||
| Plan Assets | 1,318 | 18 | 1,336 | 65 | 1,474 | 1,539 | |||||||||||
The components of net periodic pension expense are as follows (in millions):
| 2009 | 2008 | 2007 | |||||||||
| Service cost | $ | 18 | $ | 28 | $ | 37 | |||||
| Interest cost | 102 | 107 | 101 | ||||||||
| Assumed rate of return on plan assets | (116 | ) | (123 | ) | (110 | ) | |||||
| Amortization of — | |||||||||||
| Prior service cost (1) | — | 2 | (14 | ) | |||||||
| Transition asset | — | — | (1 | ) | |||||||
| Actuarial losses | 19 | 33 | 43 | ||||||||
| Special termination benefits (2) | 21 | — | — | ||||||||
| Net periodic pension expense – total company | 44 | 47 | 56 | ||||||||
| Less: Net periodic pension expense of discontinued operations | 8 | 1 | (13 | ) | |||||||
| Net periodic pension expense included in continuing operations | $ | 36 | $ | 46 | $ | 69 | |||||
89
ARVINMERITOR, INC.
NOTES TO CONSOLIDATED FINANCIAL STATEMENTS — (Continued)
| (1) |
The company recorded a reduction in pension expense of $15 million in the third quarter of fiscal year 2007 to fully amortize negative prior service cost as a result of a pension curtailment triggered by the sale if its ET business. This reduction in pension expense was included in the loss on the sale of ET and recorded in discontinued operations in the consolidated statement of operations. | |
| (2) |
In 2009, the company recorded pension termination benefits of $14 million and $7 million associated with the announced closure of its Commercial Truck brakes plant in Tilbury and its coil spring operations in Milton, Ontario, respectively. The expense associated with the Tilbury plant closure is included in restructuring costs (see Note 5) in the consolidated statement of operations. The charge related to the Milton plant closure is recorded in discontinued operations in the consolidated statement of operations. |
Information about the expected cash flows for the U.S. and non-U.S. pension plans is as follows (in millions):
| U.S. | Non U.S. | Total | ||||||
| Expected employer contributions: | ||||||||
| Fiscal 2010 | $ | 13 | $ | 38 | $ | 51 | ||
| Expected benefit payments: | ||||||||
| Fiscal 2010 | 62 | 41 | 103 | |||||
| Fiscal 2011 | 62 | 42 | 104 | |||||
| Fiscal 2012 | 62 | 43 | 105 | |||||
| Fiscal 2013 | 63 | 52 | 115 | |||||
| Fiscal 2014 | 64 | 53 | 117 | |||||
| Fiscal 2015-2019 | 341 | 250 | 591 | |||||
The company also sponsors certain defined contribution savings plans for eligible employees. Expense related to these plans, including company matching contributions, was $3 million, $11 million and $9 million for fiscal years 2009, 2008 and 2007, respectively.
22. INCOME TAXES
The income tax provisions were calculated based upon the following components of income (loss) before income taxes (in millions):
| 2009 | 2008 | 2007 | ||||||||
| U.S. income (loss) | $ | (169 | ) | $ | 9 | $ | (74 | ) | ||
| Foreign income (loss) | (192 | ) | 84 | (23 | ) | |||||
| Total | $ | (361 | ) | $ | 93 | $ | (97 | ) | ||
The components of the benefit (provision) for income taxes are summarized as follows (in millions):
| 2009 | 2008 | 2007 | |||||||||
| Current tax benefit (expense): | |||||||||||
| U.S. | $ | 3 | $ | (10 | ) | $ | (1 | ) | |||
| Foreign | (40 | ) | (79 | ) | (32 | ) | |||||
| State and local | 1 | (2 | ) | (1 | ) | ||||||
| Total current tax expense | (36 | ) | (91 | ) | (34 | ) | |||||
| Deferred tax benefit (expense): | |||||||||||
| U.S. | (591 | ) | (95 | ) | 50 | ||||||
| Foreign | (81 | ) | (13 | ) | (7 | ) | |||||
| State and local | 1 | 2 | 4 | ||||||||
| Total deferred tax benefit (expense) | (671 | ) | (106 | ) | 47 | ||||||
| Income tax benefit (expense) | $ | (707 | ) | $ | (197 | ) | $ | 13 | |||
The deferred tax expense or benefit represents tax effects of current year deductions or items of income that will be recognized in future periods for tax purposes. The deferred tax benefit in fiscal year 2007 primarily represents the tax benefit of current year net operating losses and tax credits carried forward. The deferred tax expense in fiscal years 2009 and 2008, primarily represents the future taxes on repatriation of foreign earnings and establishment of valuation allowances.
90
ARVINMERITOR, INC.
NOTES TO CONSOLIDATED FINANCIAL STATEMENTS — (Continued)
Net current and non-current deferred income tax assets (liabilities) included in the consolidated balance sheet consist of the tax effects of temporary differences related to the following (in millions):
| September 30, | |||||||
| 2009 | 2008 | ||||||
| Accrued compensation and benefits | $ | 40 | $ | 58 | |||
| Accrued product warranties | 10 | 10 | |||||
| Inventory costs | 11 | 11 | |||||
| Receivables | 12 | 14 | |||||
| Accrued retirement medical costs | 205 | 175 | |||||
| Pensions | 176 | 36 | |||||
| Property | 32 | — | |||||
| Loss and credit carryforwards | 875 | 651 | |||||
| Investment basis difference | — | 71 | |||||
| Other | 38 | 89 | |||||
| Sub-total | 1,399 | 1,115 | |||||
| Less: Valuation allowances | (1,218 | ) | (271 | ) | |||
| Deferred income taxes - asset | $ | 181 | $ | 844 | |||
| Taxes on undistributed income | $ | (145 | ) | $ | (153 | ) | |
| Property | — | (7 | ) | ||||
| Intangible assets | (64 | ) | (52 | ) | |||
| Other | (2 | ) | — | ||||
| Deferred income taxes - liability | $ | (211 | ) | $ | (212 | ) | |
| Net deferred income tax assets (liabilities) | $ | (30 | ) | $ | 632 | ||
Net current and non-current deferred income tax assets (liabilities) are included in the consolidated balance sheet as follows (in millions):
| September 30, | |||||||
| 2009 | 2008 | ||||||
| Other current assets (see Note 10) | $ | 19 | $ | 110 | |||
| Other current liabilities (see Note 14) | (3 | ) | (4 | ) | |||
| Net current deferred income taxes — asset | 16 | 106 | |||||
| Other assets (see Note 12) | 27 | 530 | |||||
| Other liabilities (see Note 15) | (73 | ) | (4 | ) | |||
| Net non-current deferred income taxes — asset (liability) | $ | (46 | ) | $ | 526 | ||
In fiscal year 2009, the company recorded a charge of $676 million, of which $665 million was recorded in the first fiscal quarter, to establish valuation allowances against its U.S. net deferred tax assets and the net deferred tax assets of its 100% owned subsidiaries in France, Germany, Italy, and Sweden and certain other countries. In accordance with FASB’s income tax guidance, the company evaluates the deferred income taxes quarterly to determine if valuation allowances are required. The guidance requires that companies assess whether valuation allowances should be established against their deferred tax assets based on the consideration of all available evidence using a “more-likely-than-not” standard. In making such judgments, significant weight is given to evidence that can be objectively verified. As previously disclosed in the fiscal year 2008 Form 10-K, the company had determined in prior periods that a valuation allowance was not necessary for the deferred tax assets in the U.S based on several factors including: (a) numerous restructuring initiatives the company undertook in fiscal years 2007 and 2008, generating significant savings in future periods; (b) the expected recovery of the commercial vehicle market; (c) the implementation of a major cost reduction and value creation program to generate additional improvements in earnings in future periods and (d) the repatriation of foreign earnings, which would generate significant taxable income in fiscal year 2009 and reduce future net interest expense in the U.S.
91
ARVINMERITOR, INC.
NOTES TO CONSOLIDATED FINANCIAL STATEMENTS — (Continued)
The company believes that these valuation allowances are now required due to events and developments that occurred during the first quarter of fiscal year 2009. In conducting the first quarter 2009 analysis, the company utilized a consistent approach which considers its three-year historical cumulative income (loss) including an assessment of the degree to which any losses were driven by items that are unusual in nature and incurred in order to achieve profitability in the future. In addition, the company reviewed changes in near-term market conditions and any other factors arising during the period which may impact future operating results. Both positive and negative evidence were considered in the analysis. Significant negative evidence exists due to the ongoing deterioration of the global markets. The analysis for the first quarter of fiscal year 2009 showed a three-year historical cumulative loss in the U.S., France, Germany, Italy, and Sweden. The losses continue to exist even after adjusting the results to remove unusual items and charges, which is considered a significant factor in the analysis as it is objectively verifiable and therefore, significant negative evidence. In addition, the recent global market deterioration reduced the expected impact of tax planning strategies that were included in our analysis. Accordingly, based on a three year historical cumulative loss, combined with significant and inherent uncertainty as to the timing of when the company would be able to generate the necessary level of earnings to recover its deferred tax assets in the U.S., France, Germany, Italy, and Sweden, the company concluded that valuation allowances were required.
Income tax expense (benefit) is allocated between continuing operations, discontinued operations and other comprehensive income (OCI). Such allocation is applied by tax jurisdiction, and in periods in which there is a pre-tax loss from continuing operations and pre-tax income in another category, such as discontinued operations or OCI, income tax expense is first allocated to the other sources of income, with a related benefit recorded in continuing operations.
The expiration periods for $875 million of deferred tax assets related to net operating losses and tax credit carryforwards are as follows: $13 million between fiscal years 2010 and 2014; $138 million between fiscal years 2015 and 2024; $449 million between fiscal years 2025 and 2029; and $275 million can be carried forward indefinitely. The company has provided valuation allowances on these deferred tax assets of approximately $13 million, $138 million, $441 million and $273 million, respectively. Realization of deferred tax assets representing net operating loss carryforwards for which a valuation allowance has not been provided is dependent on generating sufficient taxable income prior to expiration of the loss carryforwards. Although realization is not assured, management believes it is more likely than not that all of such deferred tax assets will be realized. The amount of the deferred tax assets considered realizable, however, could be reduced in the near term if the company is unable to generate sufficient future taxable income during the carryforward period.
The company’s benefit (provision) for income taxes was different from the benefit (provision) for income taxes at the U.S. statutory rate for the reasons set forth below (in millions):
| 2009 | 2008 | 2007 | |||||||||
| Benefit (expense) for income taxes at statutory tax rate of 35% | $ | 126 | $ | (33 | ) | $ | 34 | ||||
| State and local income taxes | 2 | 1 | 3 | ||||||||
| Taxes on foreign income | (8 | ) | 33 | 20 | |||||||
| Tax audit settlements | — | 12 | — | ||||||||
| Recognition of basis differences | — | — | 7 | ||||||||
| Goodwill impairment | (27 | ) | — | — | |||||||
| Benefit (tax) on undistributed foreign earnings | (3 | ) | (137 | ) | 11 | ||||||
| Valuation allowances | (797 | ) | (70 | ) | (60 | ) | |||||
| Other | — | (3 | ) | (2 | ) | ||||||
| Income tax benefit (expense) | $ | (707 | ) | $ | (197 | ) | $ | 13 | |||
In fiscal year 2008 the company completed various tax audits of the company’s income tax returns and certain statutes of limitations expired. As a result, the company reduced its accrual for uncertain tax positions by $12 million.
In fiscal year 2008, a valuation allowance was taken against a United Kingdom (U.K.) deferred tax asset. The company concluded that a tax planning strategy was no longer prudent and feasible and therefore did not meet the criteria for use as a qualifying tax planning strategy in the determination as to whether it was more likely than not that the U.K. deferred tax asset would be utilized. The result was a $42 million tax expense.
In fiscal year 2008, the company reversed its determination on permanent reinvestment for undistributed earnings of certain foreign subsidiaries. This resulted in the establishment of a $137 million deferred tax liability for the basis differences related to these subsidiaries and a charge of $137 million to income tax expense.
For fiscal year 2007, the significant benefit for tax on undistributed foreign earnings was related to the reversal of a deferred tax liability for Mexican and Brazilian subsidiaries due to a planned legal entity restructuring that will allow the basis difference related to the undistributed earnings to reverse without tax cost.
For fiscal years 2009 and 2008, no provision has been made for U.S., state or additional foreign income taxes related to approximately $542 million and $470 million, respectively, of undistributed earnings of foreign subsidiaries that have been or are intended to be permanently reinvested. Quantification of the deferred tax liability, if any, associated with permanently reinvested earnings is not practicable.
92
ARVINMERITOR, INC.
NOTES TO CONSOLIDATED FINANCIAL STATEMENTS — (Continued)
Total amount of gross unrecognized tax benefits the company recorded in accordance with FASB ASC Topic 740 as of September 30, 2009 was $104 million, of which $45 million represents the amount, if recognized, would favorably affect the effective income tax rate in future periods.
A reconciliation of the total amounts of unrecognized tax benefits at the beginning and end of the period is as follows (in millions):
| 2009 | 2008 | ||||||
| Balance at beginning of the period | $ | 131 | $ | 207 | |||
| Additions to tax positions recorded during the current year | 8 | 15 | |||||
| Reductions to tax positions recorded in prior years | (35 | ) | (88 | ) | |||
| Reductions to tax positions due to lapse of statutory limits | (3 | ) | (3 | ) | |||
| Translation, other | 3 | — | |||||
| Balance at end of the period | $ | 104 | $ | 131 | |||
The company’s continuing practice is to recognize interest and penalties on uncertain tax positions in the provision for income taxes in the consolidated statement of operations. At September 30, 2009 and September 30, 2008, the company recorded $6 million and $3 million, respectively, of interest on uncertain tax positions in the consolidated balance sheet. In addition, penalties of $11 million and $12 million were recorded at September 30, 2009 and September 30, 2008, respectively. The impact of tax expense related to interest and penalties is immaterial to periods presented.
The company files tax returns in multiple jurisdictions and is subject to examination by taxing authorities throughout the world. The company’s U.S. federal income tax returns for fiscal years 2006 and 2007 are currently under audit. The company’s Canadian federal income tax returns for fiscal years 2003 through 2005 are currently under audit. The company’s Brazil subsidiary is currently under audit for calendar year 2004. The company’s German subsidiary is under audit for fiscal years 2002 through 2006. In addition, the company is under audit in various U.S. state tax jurisdictions for various years. It is reasonably possible that audit settlements, the conclusion of current examinations or the expiration of the statute of limitations in several jurisdictions could significantly change the company’s unrecognized tax benefits during the next twelve months. However, quantification of an estimated range cannot be made at this time.
In addition to the audits listed above, the company has open tax years primarily from 1999-2008 with various significant taxing jurisdictions including the United States, Brazil, Canada, France, Germany, Mexico and the U. K. These open years contain matters that could be subject to differing interpretations of applicable tax laws and regulations as they relate to the amount, timing or inclusion of revenue and expenses or the sustainability of income tax credits for a given audit cycle. The company has recorded a tax benefit only for those positions that meet the more likely than not standard.
23. CONTINGENCIES
Environmental
Federal, state and local requirements relating to the discharge of substances into the environment, the disposal of hazardous wastes and other activities affecting the environment have, and will continue to have, an impact on the operations of the company. The process of estimating environmental liabilities is complex and dependent upon evolving physical and scientific data at the sites, uncertainties as to remedies and technologies to be used and the outcome of discussions with regulatory agencies. The company records liabilities for environmental issues in the accounting period in which they are considered to be probable and the cost can be reasonably estimated. At environmental sites in which more than one potentially responsible party has been identified, the company records a liability for its allocable share of costs related to its involvement with the site, as well as an allocable share of costs related to insolvent parties or unidentified shares. At environmental sites in which ArvinMeritor is the only potentially responsible party, the company records a liability for the total probable and estimable costs of remediation before consideration of recovery from insurers or other third parties.
The company has been designated as a potentially responsible party at eight Superfund sites, excluding sites as to which the company’s records disclose no involvement or as to which the company’s liability has been finally determined. Management estimates the total reasonably possible costs the company could incur for the remediation of Superfund sites at September 30, 2009 to be approximately $20 million, of which $2 million is recorded as a liability. Environmental remediation costs recorded with respect to the Superfund sites were not significant in fiscal years 2009 and 2008 and no expense was recognized in fiscal year 2007.
93
ARVINMERITOR, INC.
NOTES TO CONSOLIDATED FINANCIAL STATEMENTS — (Continued)
In addition to the Superfund sites, various other lawsuits, claims and proceedings have been asserted against the company, alleging violations of federal, state and local environmental protection requirements, or seeking remediation of alleged environmental impairments, principally at previously disposed-of properties. For these matters, management has estimated the total reasonably possible costs the company could incur at September 30, 2009 to be approximately $30 million, of which $15 million is recorded as a liability. During fiscal year 2009, the company recorded environmental remediation costs of $3 million with respect to these matters, resulting from revised estimates to remediate these sites.
Included in the company’s environmental liabilities are costs for on-going operation, maintenance and monitoring at environmental sites in which remediation has been put into place. This liability is discounted using a discount rate of 5-percent and is approximately $7 million at September 30, 2009. The undiscounted estimate of these costs is approximately $11 million.
Following are the components of the Superfund and non-Superfund environmental reserves (in millions):
| Superfund Sites | Non-Superfund Sites | Total | |||||||||
| Balance at September 30, 2008 | $ | 3 | $ | 15 | $ | 18 | |||||
| Payments | (1 | ) | (3 | ) | (4 | ) | |||||
| Change in cost estimates (1) | — | 3 | 3 | ||||||||
| Balance at September 30, 2009 | $ | 2 | $ | 15 | $ | 17 | |||||
| (1) |
There was $2 million of environmental remediation costs recorded in loss from discontinued operations in the consolidated statement of operations for the fiscal year ended September 30, 2009. |
Environmental reserves are included in Other Current Liabilities (see Note 14) and Other Liabilities (see Note 15).
The actual amount of costs or damages for which the company may be held responsible could materially exceed the foregoing estimates because of uncertainties, including the financial condition of other potentially responsible parties, the success of the remediation, discovery of new contamination and other factors that make it difficult to predict actual costs accurately. However, based on management’s assessment, after consulting with outside advisors that specialize in environmental matters, and subject to the difficulties inherent in estimating these future costs, the company believes that its expenditures for environmental capital investment and remediation necessary to comply with present regulations governing environmental protection and other expenditures for the resolution of environmental claims will not have a material adverse effect on the company’s business, financial condition or results of operations. In addition, in future periods, new laws and regulations, changes in remediation plans, advances in technology and additional information about the ultimate clean-up remedies could significantly change the company’s estimates. Management cannot assess the possible effect of compliance with future requirements.
Asset Retirement Obligations
The company has identified conditional asset retirement obligations for which a reasonable estimate of fair value could not be made because the potential settlement dates cannot be determined at this time. Due to the long term, productive nature of the company’s manufacturing operations, absent plans or expectations of plans to initiate asset retirement activities, the company was not able to reasonably estimate the settlement date for the related obligations. Therefore, the company has not recognized conditional asset retirement obligations for which there are no plans or expectations of plans to retire the asset.
Asbestos
Maremont Corporation (“Maremont”), a subsidiary of ArvinMeritor, manufactured friction products containing asbestos from 1953 through 1977, when it sold its friction product business. Arvin Industries, Inc., a predecessor of the company, acquired Maremont in 1986. Maremont and many other companies are defendants in suits brought by individuals claiming personal injuries as a result of exposure to asbestos-containing products. Maremont had approximately 26,000 and 35,000 pending asbestos-related claims at September 30, 2009 and 2008, respectively. Although Maremont has been named in these cases, in the cases where actual injury has been alleged, very few claimants have established that a Maremont product caused their injuries. Plaintiffs’ lawyers often sue dozens or even hundreds of defendants in individual lawsuits on behalf of hundreds or thousands of claimants, seeking damages against all named defendants irrespective of the disease or injury and irrespective of any causal connection with a particular product. For these reasons, Maremont does not consider the number of claims filed or the damages alleged to be a meaningful factor in determining its asbestos-related liability.
94
ARVINMERITOR, INC.
NOTES TO CONSOLIDATED FINANCIAL STATEMENTS — (Continued)
Maremont’s asbestos-related reserves and corresponding asbestos-related recoveries are summarized as follows (in millions):
| September 30, | |||||
| 2009 | 2008 | ||||
| Pending claims | $ | 61 | $ | 53 | |
| Asbestos-related insurance recoveries | 43 | 36 | |||
A portion of the asbestos-related recoveries and reserves are included in Other Current Assets and Liabilities, with the majority of the amounts recorded in Other Assets and Liabilities (see Notes 10, 12, 14 and 15).
Prior to February 2001, Maremont participated in the Center for Claims Resolution (“CCR”) and shared with other CCR members in the payment of defense and indemnity costs for asbestos-related claims. The CCR handled the resolution and processing of asbestos claims on behalf of its members until February 2001, when it was reorganized and discontinued negotiating shared settlements. Since the CCR was reorganized in 2001, Maremont has handled asbestos-related claims through its own defense counsel and has taken a more aggressive defensive approach that involves examining the merits of each asbestos-related claim. Although the company expects legal defense costs to continue at higher levels than when it participated in the CCR, the company believes its litigation strategy has reduced the average indemnity cost per claim.
Pending and Future Claims: Maremont engages Bates White LLC (Bates White), a consulting firm with extensive experience estimating costs associated with asbestos litigation, to assist with determining the estimated cost of resolving pending and future asbestos-related claims that have been, and could reasonably be expected to be, filed against Maremont. Bates White prepares these cost estimates on a semi-annual basis in March and September each year. Although it is not possible to estimate the full range of costs because of various uncertainties, Bates White advised Maremont that it would be possible to determine an estimate of a reasonable forecast of the cost of the probable settlement and defense costs of resolving pending and future asbestos-related claims, based on historical data and certain assumptions with respect to events that may occur in the future.
Bates White provided an estimate of the reasonably possible range of Maremont’s obligation for asbestos personal injury claims over the next ten years of $58 million to $65 million. After consultation with Bates White, Maremont determined that as of September 30, 2009 the most likely and probable liability for pending and future claims over the next ten years is $58 million. The ultimate cost of resolving pending and future claims is estimated based on the history of claims and expenses for plaintiffs represented by law firms in jurisdictions with an established history with Maremont.
Assumptions: The following assumptions were made by Maremont after consultation with Bates White and are included in their study:
-
Pending and future claims were estimated for a ten year period ending in fiscal year 2019. The ten-year assumption is considered appropriate as Maremont has reached certain longer-term agreements with key plaintiff law firms and filings of mesothelioma claims have been relatively stable over the last few years resulting in an improvement in the reliability of future projections over a longer time period;
-
Maremont believes that the litigation environment will change significantly beyond ten years and that the reliability of estimates of future probable expenditures in connection with asbestos-related personal injury claims will decline for each year further in the future. As a result, estimating a probable liability beyond ten years is difficult and uncertain;
-
The ultimate cost of resolving pending and future claims filed in Madison County, Illinois, a jurisdiction where a substantial amount of Maremont’s claims are filed, will decline to reflect average outcomes throughout the United States;
-
Defense and processing costs for pending and future claims filed outside of Madison County, Illinois will be at the level consistent with Maremont’s prior experience; and
-
The ultimate indemnity cost of resolving nonmalignant claims with plaintiffs’ law firms in jurisdictions without an established history with Maremont cannot be reasonably estimated. Recent changes in tort law and insufficient settlement history make estimating a liability for these nonmalignant claims difficult and uncertain.
Recoveries: Maremont has insurance that reimburses a substantial portion of the costs incurred defending against asbestos-related claims. The coverage also reimburses Maremont for any indemnity paid on those claims. The coverage is provided by several insurance carriers based on insurance agreements in place. Incorporating historical information with respect to buy-outs and settlements of coverage, and excluding any policies in dispute, the insurance receivable related to asbestos-related liabilities is $43 million as of September 30, 2009. The difference between the estimated liability and insurance receivable is primarily related to proceeds received from settled insurance policies. Certain insurance policies have been settled in cash prior to the ultimate settlement of the related asbestos liabilities. Amounts received from insurance settlements generally reduce recorded insurance receivables. Receivables for policies in dispute are not recorded.
95
ARVINMERITOR, INC.
NOTES TO CONSOLIDATED FINANCIAL STATEMENTS — (Continued)
The amounts recorded for the asbestos-related reserves and recoveries from insurance companies are based upon assumptions and estimates derived from currently known facts. All such estimates of liabilities and recoveries for asbestos-related claims are subject to considerable uncertainty because such liabilities and recoveries are influenced by variables that are difficult to predict. The future litigation environment for Maremont could change significantly from its past experience, due, for example, to changes in the mix of claims filed against Maremont in terms of plaintiffs’ law firm, jurisdiction and disease; legislative or regulatory developments; Maremont’s approach to defending claims; or payments to plaintiffs from other defendants. Estimated recoveries are influenced by coverage issues among insurers and the continuing solvency of various insurance companies. If the assumptions with respect to the nature of pending and future claims, the cost to resolve claims and the amount of available insurance prove to be incorrect, the actual amount of liability for Maremont’s asbestos-related claims, and the effect on the company, could differ materially from current estimates and, therefore, could have a material impact on the company’s financial condition and results of operations.
Rockwell — ArvinMeritor, along with many other companies, has also been named as a defendant in lawsuits alleging personal injury as a result of exposure to asbestos used in certain components of Rockwell products many years ago. Liability for these claims was transferred to the company at the time of the spin-off of the automotive business to Meritor from Rockwell in 1997. Currently there are thousands of claimants in lawsuits that name the company, together with many other companies, as defendants. However, the company does not consider the number of claims filed or the damages alleged to be a meaningful factor in determining asbestos-related liabilities. A significant portion of the claims do not identify any of Rockwell’s products or specify which of the claimants, if any, were exposed to asbestos attributable to Rockwell’s products, and past experience has shown that the vast majority of the claimants will likely never identify any of Rockwell’s products. For those claimants who do show that they worked with Rockwell’s products, management nevertheless believes it has meritorious defenses, in substantial part due to the integrity of the products involved and the lack of any impairing medical condition on the part of many claimants. The company defends these cases vigorously. Historically, ArvinMeritor has been dismissed from the vast majority of similar claims filed in the past with no payment to claimants.
The company engages Bates White to assist with determining whether it would be possible to estimate the cost of resolving pending and future Rockwell legacy asbestos-related claims that have been, and could reasonably be expected to be, filed against the company. Although it is not possible to estimate the full range of costs because of various uncertainties, Bates White advised the company that it would be able to determine an estimate of probable defense and indemnity costs which could be incurred to resolve pending and future Rockwell legacy asbestos-related claims. Accordingly, the company has recorded a $16 million liability for defense and indemnity costs associated with these claims at both September 30, 2009 and 2008. The accrual estimates are based on historical data and certain assumptions with respect to events that may occur in the future. The uncertainties of asbestos claim litigation and resolution of the litigation with the insurance companies make it difficult to predict accurately the ultimate resolution of asbestos claims. That uncertainty is increased by the possibility of adverse rulings or new legislation affecting asbestos claim litigation or the settlement process.
Rockwell maintained insurance coverage that management believes covers indemnity and defense costs, over and above self-insurance retentions, for most of these claims. The company has initiated claims against these carriers to enforce the insurance policies. The company expects to recover some portion of defense and indemnity costs it has incurred to date, over and above self-insured retentions, and some portion of the costs for defending asbestos claims going forward. Accordingly, the company has recorded an insurance receivable related to Rockwell legacy asbestos-related liabilities of $12 million and $16 million at September 30, 2009 and 2008, respectively. The decrease in the receivable at September 30, 2009 is primarily related to revised estimates associated with the recovery from insurers of costs incurred to date. If the assumptions with respect to the nature of pending claims, the cost to resolve claims and the amount of available insurance prove to be incorrect, the actual amount of liability for Rockwell asbestos-related claims, and the effect on the company, could differ materially from current estimates and, therefore, could have a material impact on the company’s financial condition and results of operations.
Indemnifications
In December 2005, the company guaranteed a third party’s obligation to reimburse another party for payment of health and prescription drug benefits to a group of retired employees. The retirees were former employees of a wholly-owned subsidiary of the company prior to it being acquired by the company. The wholly-owned subsidiary, which was part of the company’s LVA business, was sold by the company in fiscal year 2006. Prior to May 2009, except as set forth hereinafter, the third party met its obligations to reimburse the other party. In May 2009, the third party filed for bankruptcy protection under Chapter 11 of the U.S. Bankruptcy Code requiring the company to recognize its obligations under the guarantee. Accordingly, the company recorded a $28 million liability in the third quarter of fiscal year 2009, of which approximately $6 million relates to claims not reimbursed by the third party prior to its filing for bankruptcy protection, and $22 million relates to the company’s best estimate of its future obligation under the guarantee. This charge is included in loss from discontinued operations in the consolidated statement of operations.
96
ARVINMERITOR, INC.
NOTES TO CONSOLIDATED FINANCIAL STATEMENTS — (Continued)
The company has provided indemnifications in conjunction with certain transactions, primarily divestitures. These indemnities address a variety of matters, which may include environmental, tax, asbestos and employment-related matters, and the periods of indemnification vary in duration. The company has been recently notified of a warranty matter associated with our previously divested ET business. Management is currently unable to estimate its range of exposure under such indemnification. The company’s maximum obligations under other indemnifications cannot be reasonably estimated. Except for the warranty matter, the company is not aware of any claims or other information that would give rise to material payments under such indemnifications. The company is expected to provide additional indemnifications in connection with the sale of its 57 percent interest in MSSC (see Note 1).
Other
On March 31, 2008, S&E Quick Lube, a filter distributor, filed suit in U.S. District Court for the District of Connecticut alleging that twelve filter manufacturers, including a prior subsidiary of the company, engaged in a conspiracy to fix prices, rig bids and allocate U.S. customers for aftermarket automotive filters. This suit is a purported class action on behalf of direct purchasers of filters from the defendants. Several parallel purported class actions, including on behalf of indirect purchasers of filters, have been filed by other plaintiffs in a variety of jurisdictions in the United States and Canada. On April 16, 2009, the Attorney General of the State of Florida filed a complaint with the U.S. District Court for the Northern District of Illinois based on these same allegations. The company intends to vigorously defend the claims raised in all of these actions. The Antitrust Division of the U.S. Department of Justice (DOJ) is also investigating the allegations raised in these suits. The DOJ has issued subpoenas to certain employees of the defendants, which include the company. The company is fully cooperating with the investigation. The company is unable to estimate a range of exposure, if any, at this time.
Various other lawsuits, claims and proceedings have been or may be instituted or asserted against the company, relating to the conduct of the company’s business, including those pertaining to product liability, warranty or recall claims, intellectual property, safety and health, contract and employment matters. Although the outcome of other litigation cannot be predicted with certainty, and some lawsuits, claims or proceedings may be disposed of unfavorably to the company, management believes the disposition of matters that are pending will not have a material adverse effect on the company’s business, financial condition or results of operations.
24. BUSINESS SEGMENT INFORMATION
The company defines its operating segments as components of its business where separate financial information is available and is evaluated regularly by the chief operating decision maker in deciding how to allocate resources and in assessing performance. The company’s chief operating decision maker (CODM) is the Chief Executive Officer.
As a result of the divestitures described in Note 3, LVS now consists primarily of Body Systems’ business, composed of roofs and doors products. In order to better reflect the importance of our remaining core CVS businesses and a much smaller LVS business and to reflect the manner in which management reviews information regarding our business, we have revised our reporting segments in the fourth quarter of fiscal year 2009 as follows:
-
The Commercial Truck segment supplies drivetrain systems and components, including axles drivelines and braking and suspension systems, primarily for medium- and heavy-duty trucks in North America, South America and Europe;
-
The Industrial segment supplies drivetrain systems including axles, brakes, drivelines and suspension for off-highway, military, construction, bus and coach, fire and emergency and other industrial applications. This segment also includes the company’s businesses in Asia Pacific, including all on- and off-highway activities;
-
The Aftermarket & Trailer segment supplies axles, brakes, drivelines, suspension parts and other replacement and remanufactured parts, including transmissions, to commercial vehicle aftermarket customers. This segment also supplies a wide variety of undercarriage products and systems for trailer applications; and
-
The LVS segment includes the Body Systems business, which supplies roof and door systems for passenger cars to OEMs and the company’s remaining Chassis businesses.
We refer to our three segments other than LVS as, collectively, our “Core Business”. All prior period amounts have been recasted to reflect the revised reporting segments.
97
ARVINMERITOR, INC.
NOTES TO CONSOLIDATED FINANCIAL STATEMENTS — (Continued)
The company measures segment operating performance based on earnings before interest, taxes, depreciation and amortization, and loss on sale of receivables (EBITDA). The company uses segment EBITDA as the primary basis for the CODM to evaluate the performance of each of the company’s reportable segments.
The accounting policies of the segments are the same as those applied in the Consolidated Financial Statements, except for the use of segment EBITDA. The company may allocate certain common costs, primarily corporate functions, between the segments differently than the company would for stand alone financial information prepared in accordance with GAAP. These allocated costs include expenses for shared services such as information technology, finance, communications, legal and human resources. The company does not allocate interest expense and certain legacy and other corporate costs not directly associated with the segments’ EBITDA. In anticipation of the planned separation of the light vehicles business from the company, LVS started building its own corporate functions during the second half of fiscal year 2008 and therefore only a nominal amount of corporate costs has been allocated to LVS.
All segment information has been recasted to reflect the company’s current reportable segment structure. Segment information is summarized as follows (in millions):
| Commercial | Aftermarket | ||||||||||||||||||
| Truck | Industrial | & Trailer | LVS | Eliminations | |||||||||||||||
| Fiscal year 2009 Sales: | |||||||||||||||||||
| External Sales | $ | 1,348 | $ | 778 | $ | 949 | $ | 1,033 | $ | — | $ | 4,108 | |||||||
| Intersegment Sales | 218 | 110 | 5 | — | (333 | ) | — | ||||||||||||
| Total Sales | $ | 1,566 | $ | 888 | $ | 954 | $ | 1,033 | $ | (333 | ) | $ | 4,108 | ||||||
| Fiscal year 2008 Sales: | |||||||||||||||||||
| External Sales | $ | 2,637 | $ | 1,007 | $ | 1,175 | $ | 1,571 | $ | — | $ | 6,390 | |||||||
| Intersegment Sales | 285 | 110 | 8 | — | (403 | ) | — | ||||||||||||
| Total Sales | $ | 2,922 | $ | 1,117 | $ | 1,183 | $ | 1,571 | $ | (403 | ) | $ | 6,390 | ||||||
| Fiscal year 2007 Sales: | |||||||||||||||||||
| External Sales | $ | 2,348 | $ | 779 | $ | 1,078 | $ | 1,515 | $ | — | $ | 5,720 | |||||||
| Intersegment Sales | 273 | 75 | 12 | — | (360 | ) | — | ||||||||||||
| Total Sales | $ | 2,621 | $ | 854 | $ | 1,090 | $ | 1,515 | $ | (360 | ) | $ | 5,720 | ||||||
| Segment EBITDA: | 2009 | 2008 | 2007 | |||||||||
| Commercial Truck | $ | (98 | ) | $ | 117 | $ | 16 | |||||
| Industrial | 124 | 128 | 93 | |||||||||
| Aftermarket & Trailer | 88 | 110 | 113 | |||||||||
| Light Vehicle Systems | (281 | ) | 5 | (43 | ) | |||||||
| Segment EBITDA | (167 | ) | 360 | 179 | ||||||||
| Unallocated legacy and corporate costs (1) | (29 | ) | (56 | ) | (56 | ) | ||||||
| Loss on sale of receivables | (7 | ) | (22 | ) | (9 | ) | ||||||
| Depreciation and amortization | (81 | ) | (120 | ) | (111 | ) | ||||||
| Interest expense, net | (86 | ) | (80 | ) | (109 | ) | ||||||
| Benefit (provision) for income taxes | (707 | ) | (197 | ) | 13 | |||||||
| Income (loss) from continuing operations | $ | (1,077 | ) | $ | (115 | ) | $ | (93 | ) | |||
|
(1) |
Unallocated legacy and corporate costs represent items that are not directly related to our business segments. These costs primarily include pension and retiree medical costs associated with recently sold businesses and other legacy costs for environmental and product liability. Fiscal years 2009 and 2008 unallocated legacy and corporate costs include $9 million and $19 million of costs, respectively, associated with the previously planned spin-off of the LVS business. Also included in unallocated legacy and corporate costs for fiscal years 2008 and 2007 are corporate costs previously allocated to sold businesses of $15 million and $44 million, respectively. |
98
ARVINMERITOR, INC.
NOTES TO CONSOLIDATED FINANCIAL STATEMENTS — (Continued)
| Depreciation and Amortization: | 2009 | 2008 | 2007 | ||||||
| Commercial Truck | $ | 53 | $ | 59 | $ | 58 | |||
| Industrial | 10 | 10 | 8 | ||||||
| Aftermarket & Trailer | 7 | 7 | 7 | ||||||
| Light Vehicle Systems | 11 | 44 | 38 | ||||||
| Total depreciation and amortization | $ | 81 | $ | 120 | $ | 111 | |||
| Capital Expenditures: | 2009 | 2008 | 2007 | ||||||
| Commercial Truck | $ | 68 | $ | 80 | $ | 31 | |||
| Industrial | 10 | 13 | 15 | ||||||
| Aftermarket & Trailer | 4 | 5 | 8 | ||||||
| Light Vehicle Systems | 29 | 40 | 32 | ||||||
| Total capital expenditures | $ | 111 | $ | 138 | $ | 86 | |||
| Segment Assets: | 2009 | 2008 | |||||||
| Commercial Truck | $ | 998 | $ | 1,409 | |||||
| Industrial | 355 | 322 | |||||||
| Aftermarket & Trailer | 483 | 409 | |||||||
| Light Vehicle Systems | 398 | 1,072 | |||||||
| Commercial Vehicle Systems goodwill(1) | — | 451 | |||||||
| Total segment assets | 2,234 | 3,663 | |||||||
| Corporate(2) | 218 | 1,011 | |||||||
| Discontinued operations | 56 | — | |||||||
| Total assets | $ | 2,508 | $ | 4,674 | |||||
| (1) |
In fiscal year 2009, the company reorganized its reporting units and allocated CVS goodwill to Commercial Truck, Industrial and Aftermarket & Trailer reporting units. Segment assets at September 30, 2008 do not reflect the allocation of goodwill, therefore, CVS goodwill in 2008 is presented separately. | |
| (2) |
Corporate assets consist primarily of cash, deferred income taxes and prepaid pension costs. For fiscal years 2009 and 2008, segment assets include $133 million and $212 million, respectively, of receivables sold to ARC under the accounts receivable securitization and factoring agreements (see Note 7). |
Sales by geographic area are based on the location of the selling unit. Information on the company’s geographic areas is summarized as follows (in millions):
Sales by Geographic Area:
| 2009 | 2008 | 2007 | |||||||
| U.S. | $ | 1,616 | $ | 1,993 | $ | 2,232 | |||
| Canada | 91 | 113 | 95 | ||||||
| Mexico | 246 | 314 | 351 | ||||||
| Total North America | 1,953 | 2,420 | 2,678 | ||||||
| Germany | 111 | 216 | 215 | ||||||
| Sweden | 204 | 509 | 381 | ||||||
| France | 437 | 944 | 733 | ||||||
| Other Europe | 615 | 1,063 | 829 | ||||||
| Total Europe | 1,367 | 2,732 | 2,158 | ||||||
| Asia/Pacific | 424 | 667 | 523 | ||||||
| South America, primarily Brazil | 364 | 571 | 361 | ||||||
| Total sales | $ | 4,108 | $ | 6,390 | $ | 5,720 | |||
99
ARVINMERITOR, INC.
NOTES TO CONSOLIDATED FINANCIAL STATEMENTS — (Continued)
Assets by Geographic Area (excludes assets of discontinued operations):
| 2009 | 2008 | |||||
| U.S. | $ | 943 | $ | 2,023 | ||
| Canada | 85 | 283 | ||||
| Mexico | 113 | 220 | ||||
| Total North America | 1,141 | 2,526 | ||||
| Germany | 51 | 99 | ||||
| Sweden | 250 | 349 | ||||
| France | 184 | 283 | ||||
| Other Europe | 303 | 459 | ||||
| Total Europe | 788 | 1,190 | ||||
| Asia/Pacific | 303 | 379 | ||||
| South America, primarily Brazil | 220 | 579 | ||||
| Total | $ | 2,452 | $ | 4,674 | ||
Sales to AB Volvo represented approximately 15 percent, 19 percent and 18 percent of the company’s sales in each of fiscal years 2009, 2008 and 2007, respectively. Sales to Navistar International Corporation represented approximately 10 percent of the company’s sales in fiscal year 2009. Freightliner represented approximately 10 percent of the company’s sales in fiscal year 2007. No other customer comprised 10 percent or more of the company’s sales in any of the three fiscal years ended September 30, 2009. These sales include pass-through components that are acquired and incorporated into our systems or modules at the customer’s request.
25. QUARTERLY FINANCIAL INFORMATION (UNAUDITED)
The following is a condensed summary of the company’s unaudited quarterly results of continuing operations for fiscal years 2009 and 2008. Amounts related to prior quarters have been recasted to reflect certain businesses in discontinued operations (see Note 3). Per share amounts are based on the weighted average shares outstanding for that quarter. Earnings per share for the year may not equal the sum of the four fiscal quarters’ earnings per share due to changes in basic and diluted shares outstanding.
| 2009 Fiscal Quarters (Unaudited) | ||||||||||||||||||||
| First | Second | Third | Fourth | 2009 | ||||||||||||||||
| (In millions, except share related data) | ||||||||||||||||||||
| Sales | $ | 1,220 | $ | 962 | $ | 942 | $ | 984 | $ | 4,108 | ||||||||||
| Cost of sales | (1,145 | ) | (885 | ) | (873 | ) | (901 | ) | (3,804 | ) | ||||||||||
| Benefit (provision) for income taxes | (662 | ) | 9 | (11 | ) | (43 | ) | (707 | ) | |||||||||||
| Loss from continuing operations | (950 | ) | (46 | ) | (32 | ) | (49 | ) | (1,077 | ) | ||||||||||
| Net loss | (991 | ) | (47 | ) | (162 | ) | (12 | ) | (1,212 | ) | ||||||||||
| Basic loss per share from continuing operations | $ | (13.14 | ) | $ | (0.64 | ) | $ | (0.44 | ) | $ | (0.68 | ) | $ | (14.86 | ) | |||||
| Diluted loss per share from continuing operations | $ | (13.14 | ) | $ | (0.64 | ) | $ | (0.44 | ) | $ | (0.68 | ) | $ | (14.86 | ) | |||||
Provision for income taxes in the fourth quarter includes non-cash income tax charges of $25 million to record valuation allowances related to foreign deferred tax assets and other items. Fourth quarter net loss included $36 million after tax gain on sale of the Wheels business. This amount is reported in discontinued operations in the company’s consolidated statement of operations.
The fourth quarter net loss was unfavorably impacted by approximately $10 million of adjustments related to prior periods, of which $7 million is included in loss from continuing operations and $3 million is included in discontinued operations. Management has evaluated the relevant qualitative and quantitative factors related to these adjustments and concluded that had the adjustments been recorded in the appropriate period the impact individually and in the aggregate would not have been material to the fourth quarter or to the previously reported financial information for any prior fiscal year or interim period.
Net loss in the third quarter included an after-tax loss on sale of businesses of $64 million. The loss on sale of businesses was related to the sale of Gabriel Ride Control and the company’s 51 percent interest in Gabriel de Venezuela. Loss from continuing operations for the second quarter included $45 million of pre-tax restructuring costs associated with the company’s Performance Plus and Fiscal Year 2009 restructuring actions. First quarter loss from continuing operations included $25 million of pre-tax restructuring costs, $223 million of non-cash impairment charges associated with long-lived assets and goodwill balances, primarily in the company’s LVS segment and a $665 million non-cash income tax charge to record valuation allowances against certain deferred tax assets. In addition, net loss in the first quarter included long-lived asset impairment charges of $56 million recorded in discontinued operations.
100
ARVINMERITOR, INC.
NOTES TO CONSOLIDATED FINANCIAL STATEMENTS — (Continued)
| 2008 Fiscal Quarters (Unaudited) | ||||||||||||||||||||
| First | Second | Third | Fourth | 2008 | ||||||||||||||||
| (In millions, except share related data) | ||||||||||||||||||||
| Sales | $ | 1,476 | $ | 1,595 | $ | 1,788 | $ | 1,531 | $ | 6,390 | ||||||||||
| Cost of sales | (1,363 | ) | (1,451 | ) | (1,625 | ) | (1,389 | ) | (5,828 | ) | ||||||||||
| Benefit (provision) for income taxes | (7 | ) | (10 | ) | 3 | (183 | ) | (197 | ) | |||||||||||
| Income (loss) from continuing operations | (2 | ) | 15 | 32 | (160 | ) | (115 | ) | ||||||||||||
| Net income (loss) | (12 | ) | 20 | 44 | (153 | ) | (101 | ) | ||||||||||||
| Basic earnings (loss) per share from continuing operations | $ | (0.03 | ) | $ | 0.21 | $ | 0.44 | $ | (2.22 | ) | $ | (1.60 | ) | |||||||
| Diluted earnings (loss) per share from continuing operations | $ | (0.03 | ) | $ | 0.21 | $ | 0.44 | $ | (2.22 | ) | $ | (1.60 | ) | |||||||
Provision for income taxes in the fourth quarter included non-cash income tax charges of $137 million related to repatriation of certain foreign subsidiary earnings to the U.S. and a $46 million non-cash charge to record valuation allowances primarily related to foreign deferred tax assets.
26. OPERATING CASH FLOWS AND OTHER SUPPLEMENTAL FINANCIAL INFORMATION
| Year Ended September 30, | ||||||||||||
| 2009 | 2008 | 2007 | ||||||||||
| OPERATING ACTIVITIES | ||||||||||||
| Net loss | $ | (1,212 | ) | $ | (101 | ) | $ | (219 | ) | |||
| Less: income (loss) from discontinued operations, net of tax | (135 | ) | 14 | (126 | ) | |||||||
| Loss from continuing operations | (1,077 | ) | (115 | ) | (93 | ) | ||||||
| Adjustments to loss from continuing operations to arrive at cash | ||||||||||||
| provided by operating activities: | ||||||||||||
| Depreciation and amortization | 81 | 120 | 111 | |||||||||
| Asset impairment charges | 223 | — | — | |||||||||
| Gain on divestitures | — | — | (3 | ) | ||||||||
| Restructuring costs, net of payments | 27 | (27 | ) | 32 | ||||||||
| Loss on debt extinguishment, net | — | 3 | 6 | |||||||||
| Deferred income tax expense (benefit) | 671 | 106 | (47 | ) | ||||||||
| Equity in earnings of affiliates, net of dividends | 10 | (18 | ) | (13 | ) | |||||||
| Stock compensation expense | 10 | 7 | 13 | |||||||||
| Provision for doubtful accounts | 12 | 11 | 16 | |||||||||
| Pension and retiree medical expense | 74 | 99 | 121 | |||||||||
| Pension and retiree medical contributions and settlements | (100 | ) | (77 | ) | (193 | ) | ||||||
| Proceeds from terminations of interest rate swaps | — | 28 | — | |||||||||
| Changes in off-balance sheet receivable securitization and factoring | (275 | ) | 120 | 108 | ||||||||
| Changes in assets and liabilities, excluding effects of acquisitions, divestitures, foreign | ||||||||||||
| currency adjustments and discontinued operations: | ||||||||||||
| Receivables | 503 | (47 | ) | (77 | ) | |||||||
| Inventories | 103 | (40 | ) | 15 | ||||||||
| Accounts payable | (395 | ) | (62 | ) | 100 | |||||||
| Other current assets and liabilities | (133 | ) | (17 | ) | (25 | ) | ||||||
| Other assets and liabilities | (13 | ) | 89 | (56 | ) | |||||||
| Operating cash flows provided by (used for) continuing operations | (279 | ) | 180 | 15 | ||||||||
| Operating cash flows provided by (used for) discontinued operations | (16 | ) | (17 | ) | 21 | |||||||
| CASH PROVIDED BY (USED FOR) OPERATING ACTIVITIES | $ | (295 | ) | $ | 163 | $ | 36 | |||||
101
ARVINMERITOR, INC.
NOTES TO CONSOLIDATED FINANCIAL STATEMENTS — (Continued)
| September 30, | ||||||||||||
| 2009 | 2008 | 2007 | ||||||||||
| (In millions) | ||||||||||||
| Balance sheet data: | ||||||||||||
| Allowance for doubtful accounts | $ | 18 | $ | 17 | $ | 23 | ||||||
| Statement of operations data: | ||||||||||||
| Maintenance and repairs expense | 46 | 70 | 63 | |||||||||
| Research, development and engineering expense | 103 | 122 | 116 | |||||||||
| Depreciation expense | 76 | 116 | 106 | |||||||||
| Provision for doubtful accounts | 12 | 11 | 16 | |||||||||
| Rental expense | 32 | 27 | 28 | |||||||||
| Interest income | 5 | 15 | 11 | |||||||||
| Interest expense | (91 | ) | (95 | ) | (120 | ) | ||||||
| Statement of cash flows data: | ||||||||||||
| Interest payments | 93 | 82 | 108 | |||||||||
| Income tax payments, net | 33 | 48 | 48 | |||||||||
| Non-cash investing activities - capital asset additions | 6 | 25 | 3 | |||||||||
27. SUPPLEMENTAL GUARANTOR CONDENSED CONSOLIDATING FINANCIAL STATEMENTS
Certain of the company’s wholly-owned subsidiaries, as defined in the credit agreement (the Guarantors) irrevocably and unconditionally guarantee amounts outstanding under the senior secured revolving credit facility. Similar subsidiary guarantees were provided for the benefit of the holders of the publicly-held notes outstanding under the company’s indentures (see Note 16).
In lieu of providing separate audited financial statements for the Guarantors, the company has included the accompanying condensed consolidating financial statements. These condensed consolidating financial statements are presented on the equity method. Under this method, the investments in subsidiaries are recorded at cost and adjusted for the parent’s share of the subsidiary’s cumulative results of operations, capital contributions and distributions and other equity changes. The Guarantor subsidiaries are combined in the condensed consolidating financial statements.
102
ARVINMERITOR, INC.
NOTES TO CONSOLIDATED FINANCIAL STATEMENTS — (Continued)
CONDENSED CONSOLIDATING
STATEMENT OF OPERATIONS
(In millions)
| Fiscal Year Ended September 30, 2009 | ||||||||||||||||||||
| Non- | ||||||||||||||||||||
| Parent | Guarantors | Guarantors | Elims | Consolidated | ||||||||||||||||
| Sales | ||||||||||||||||||||
| External | $ | — | $ | 1,663 | $ | 2,445 | $ | — | $ | 4,108 | ||||||||||
| Subsidiaries | — | 96 | 134 | (230 | ) | — | ||||||||||||||
| Total sales | — | 1,759 | 2,579 | (230 | ) | 4,108 | ||||||||||||||
| Cost of sales | (45 | ) | (1,526 | ) | (2,463 | ) | 230 | (3,804 | ) | |||||||||||
| GROSS MARGIN | (45 | ) | 233 | 116 | — | 304 | ||||||||||||||
| Selling, general and administrative | (76 | ) | (80 | ) | (134 | ) | — | (290 | ) | |||||||||||
| Restructuring costs | (6 | ) | (17 | ) | (57 | ) | — | (80 | ) | |||||||||||
| Asset impairment charges | (188 | ) | (99 | ) | 64 | — | (223 | ) | ||||||||||||
| Other income (expense) | (1 | ) | — | — | — | (1 | ) | |||||||||||||
| OPERATING INCOME (LOSS) | (316 | ) | 37 | (11 | ) | — | (290 | ) | ||||||||||||
| Equity in earnings of affiliates | — | 3 | 12 | — | 15 | |||||||||||||||
| Other income (expense), net | 112 | 5 | (117 | ) | — | — | ||||||||||||||
| Interest expense, net and other | (116 | ) | 45 | (15 | ) | — | (86 | ) | ||||||||||||
| INCOME (LOSS) BEFORE INCOME TAXES | (320 | ) | 90 | (131 | ) | — | (361 | ) | ||||||||||||
| Provision for income taxes | (470 | ) | (125 | ) | (112 | ) | (707 | ) | ||||||||||||
| Minority interest | — | — | (9 | ) | — | (9 | ) | |||||||||||||
| Equity income from continuing operations of subsidiaries | (287 | ) | (255 | ) | — | 542 | — | |||||||||||||
| LOSS FROM CONTINUING OPERATIONS | (1,077 | ) | (290 | ) | (252 | ) | 542 | (1,077 | ) | |||||||||||
| LOSS FROM DISCONTINUED OPERATIONS, net of tax | (135 | ) | (306 | ) | (35 | ) | 341 | (135 | ) | |||||||||||
| NET LOSS | $ | (1,212 | ) | $ | (596 | ) | $ | (287 | ) | $ | 883 | $ | (1,212 | ) | ||||||
103
ARVINMERITOR, INC.
NOTES TO CONSOLIDATED FINANCIAL STATEMENTS — (Continued)
CONDENSED CONSOLIDATING
STATEMENT OF OPERATIONS
(In millions)
| Fiscal Year Ended September 30, 2008 | ||||||||||||||||||||
| Non- | ||||||||||||||||||||
| Parent | Guarantors | Guarantors | Elims | Consolidated | ||||||||||||||||
| Sales | ||||||||||||||||||||
| External | $ | — | $ | 2,107 | $ | 4,283 | $ | — | $ | 6,390 | ||||||||||
| Subsidiaries | — | 123 | 90 | (213 | ) | — | ||||||||||||||
| Total sales | — | 2,230 | 4,373 | (213 | ) | 6,390 | ||||||||||||||
| Cost of sales | (49 | ) | (1,990 | ) | (4,002 | ) | 213 | (5,828 | ) | |||||||||||
| GROSS MARGIN | (49 | ) | 240 | 371 | — | 562 | ||||||||||||||
| Selling, general and administrative | (110 | ) | (144 | ) | (161 | ) | — | (415 | ) | |||||||||||
| Restructuring costs | — | — | (9 | ) | — | (9 | ) | |||||||||||||
| Other income (expense) | (3 | ) | — | — | — | (3 | ) | |||||||||||||
| OPERATING INCOME (LOSS) | (162 | ) | 96 | 201 | — | 135 | ||||||||||||||
| Equity in earnings of affiliates | — | 18 | 20 | — | 38 | |||||||||||||||
| Other income (expense), net | 42 | 53 | (95 | ) | — | — | ||||||||||||||
| Interest expense, net and other | (83 | ) | 10 | (7 | ) | — | (80 | ) | ||||||||||||
| INCOME (LOSS) BEFORE INCOME TAXES | (203 | ) | 177 | 119 | — | 93 | ||||||||||||||
| Provision for income taxes | 85 | (214 | ) | (68 | ) | — | (197 | ) | ||||||||||||
| Minority interest | — | — | (11 | ) | — | (11 | ) | |||||||||||||
| Equity income from continuing operations of subsidiaries | 3 | 8 | — | (11 | ) | — | ||||||||||||||
| INCOME (LOSS) FROM CONTINUING OPERATIONS | (115 | ) | (29 | ) | 40 | (11 | ) | (115 | ) | |||||||||||
| INCOME (LOSS) FROM DISCONTINUED OPERATIONS, net | ||||||||||||||||||||
| of tax | 14 | 29 | (4 | ) | (25 | ) | 14 | |||||||||||||
| NET INCOME (LOSS) | $ | (101 | ) | $ | — | $ | 36 | $ | (36 | ) | $ | (101 | ) | |||||||
104
ARVINMERITOR, INC.
NOTES TO CONSOLIDATED FINANCIAL STATEMENTS — (Continued)
CONDENSED CONSOLIDATING
STATEMENT OF OPERATIONS
(In millions)
| Fiscal Year Ended September 30, 2007 | ||||||||||||||||||||
| Non- | ||||||||||||||||||||
| Parent | Guarantors | Guarantors | Elims | Consolidated | ||||||||||||||||
| Sales | ||||||||||||||||||||
| External | $ | — | $ | 2,457 | $ | 3,263 | $ | — | $ | 5,720 | ||||||||||
| Subsidiaries | — | 128 | 104 | (232 | ) | — | ||||||||||||||
| Total sales | — | 2,585 | 3,367 | (232 | ) | 5,720 | ||||||||||||||
| Cost of sales | (18 | ) | (2,365 | ) | (3,172 | ) | 232 | (5,323 | ) | |||||||||||
| GROSS MARGIN | (18 | ) | 220 | 195 | — | 397 | ||||||||||||||
| Selling, general and administrative | (115 | ) | (104 | ) | (137 | ) | — | (356 | ) | |||||||||||
| Restructuring costs | (6 | ) | (7 | ) | (49 | ) | — | (62 | ) | |||||||||||
| Other income (expense) | (1 | ) | (4 | ) | 4 | — | (1 | ) | ||||||||||||
| OPERATING INCOME (LOSS) | (140 | ) | 105 | 13 | — | (22 | ) | |||||||||||||
| Equity in earnings of affiliates | — | 24 | 10 | — | 34 | |||||||||||||||
| Other income (expense), net | 14 | 23 | (37 | ) | — | — | ||||||||||||||
| Interest expense, net and other | (103 | ) | 34 | (40 | ) | — | (109 | ) | ||||||||||||
| INCOME (LOSS) BEFORE INCOME TAXES | (229 | ) | 186 | (54 | ) | — | (97 | ) | ||||||||||||
| Benefit (provision) for income taxes | 94 | (58 | ) | (23 | ) | — | 13 | |||||||||||||
| Minority interest | — | (4 | ) | (5 | ) | — | (9 | ) | ||||||||||||
| Equity income from continuing operations of subsidiaries | 42 | (53 | ) | — | 11 | — | ||||||||||||||
| INCOME (LOSS) FROM CONTINUING OPERATIONS | (93 | ) | 71 | (82 | ) | 11 | (93 | ) | ||||||||||||
| INCOME (LOSS) FROM DISCONTINUED OPERATIONS, net | ||||||||||||||||||||
| of tax | (126 | ) | (82 | ) | (73 | ) | 155 | (126 | ) | |||||||||||
| NET INCOME (LOSS) | $ | (219 | ) | $ | (11 | ) | $ | (155 | ) | $ | 166 | $ | (219 | ) | ||||||
105
ARVINMERITOR, INC.
NOTES TO CONSOLIDATED FINANCIAL STATEMENTS — (Continued)
CONDENSED CONSOLIDATING BALANCE
SHEET
(In millions)
| September 30, 2009 | ||||||||||||||||||||
| Non- | ||||||||||||||||||||
| Parent | Guarantors | Guarantors | Elims | Consolidated | ||||||||||||||||
| CURRENT ASSETS | ||||||||||||||||||||
| Cash and cash equivalents | $ | 7 | $ | 6 | $ | 82 | $ | — | $ | 95 | ||||||||||
| Receivables, net | 11 | 37 | 646 | — | 694 | |||||||||||||||
| Inventories | — | 133 | 241 | — | 374 | |||||||||||||||
| Other current assets | 2 | 13 | 82 | — | 97 | |||||||||||||||
| Assets of discontinued operations | — | — | 56 | — | 56 | |||||||||||||||
| TOTAL CURRENT ASSETS | 20 | 189 | 1,107 | — | 1,316 | |||||||||||||||
| NET PROPERTY | 9 | 131 | 305 | — | 445 | |||||||||||||||
| GOODWILL | — | 275 | 163 | — | 438 | |||||||||||||||
| OTHER ASSETS | 46 | 149 | 114 | — | 309 | |||||||||||||||
| INVESTMENTS IN SUBSIDIARIES | 724 | 133 | — | (857 | ) | — | ||||||||||||||
| TOTAL ASSETS | $ | 799 | $ | 877 | $ | 1,689 | $ | (857 | ) | $ | 2,508 | |||||||||
| CURRENT LIABILITIES | ||||||||||||||||||||
| Short-term debt | $ | 2 | $ | — | $ | 95 | $ | — | $ | 97 | ||||||||||
| Accounts payable | 44 | 174 | 456 | — | 674 | |||||||||||||||
| Other current liabilities | 111 | 35 | 265 | — | 411 | |||||||||||||||
| Liabilities of discontinued operations | — | — | 107 | — | 107 | |||||||||||||||
| TOTAL CURRENT LIABILITIES | 157 | 209 | 923 | — | 1,289 | |||||||||||||||
| LONG-TERM DEBT | 1,078 | — | 2 | — | 1,080 | |||||||||||||||
| RETIREMENT BENEFITS | 853 | — | 224 | — | 1,077 | |||||||||||||||
| INTERCOMPANY PAYABLE (RECEIVABLE) | (101 | ) | (242 | ) | 343 | — | — | |||||||||||||
| OTHER LIABILITIES | 89 | 186 | 35 | — | 310 | |||||||||||||||
| MINORITY INTERESTS | — | — | 29 | — | 29 | |||||||||||||||
| SHAREOWNERS’ EQUITY (DEFICIT) | (1,277 | ) | 724 | 133 | (857 | ) | (1,277 | ) | ||||||||||||
| TOTAL LIABILITIES AND SHAREOWNERS’ | ||||||||||||||||||||
| EQUITY (DEFICIT) | $ | 799 | $ | 877 | $ | 1,689 | $ | (857 | ) | $ | 2,508 | |||||||||
106
ARVINMERITOR, INC.
NOTES TO CONSOLIDATED FINANCIAL STATEMENTS — (Continued)
CONDENSED CONSOLIDATING BALANCE
SHEET
(In millions)
| September 30, 2008 | ||||||||||||||||||||
| Non- | ||||||||||||||||||||
| Parent | Guarantors | Guarantors | Elims | Consolidated | ||||||||||||||||
| CURRENT ASSETS | ||||||||||||||||||||
| Cash and cash equivalents | $ | 174 | $ | 24 | $ | 299 | $ | — | $ | 497 | ||||||||||
| Receivables, net | (1 | ) | 86 | 1,029 | — | 1,114 | ||||||||||||||
| Inventories | — | 207 | 416 | — | 623 | |||||||||||||||
| Other current assets | 37 | 68 | 113 | — | 218 | |||||||||||||||
| TOTAL CURRENT ASSETS | 210 | 385 | 1,857 | — | 2,452 | |||||||||||||||
| NET PROPERTY | 10 | 185 | 580 | — | 775 | |||||||||||||||
| GOODWILL | — | 345 | 177 | — | 522 | |||||||||||||||
| OTHER ASSETS | 484 | 149 | 292 | — | 925 | |||||||||||||||
| INVESTMENTS IN SUBSIDIARIES | 1,516 | 608 | — | (2,124 | ) | — | ||||||||||||||
| TOTAL ASSETS | $ | 2,220 | $ | 1,672 | $ | 2,906 | $ | (2,124 | ) | $ | 4,674 | |||||||||
| CURRENT LIABILITIES | ||||||||||||||||||||
| Short-term debt | $ | 85 | $ | — | $ | 155 | $ | — | $ | 240 | ||||||||||
| Accounts payable | 57 | 275 | 955 | — | 1,287 | |||||||||||||||
| Other current liabilities | 99 | 95 | 416 | — | 610 | |||||||||||||||
| TOTAL CURRENT LIABILITIES | 241 | 370 | 1,526 | — | 2,137 | |||||||||||||||
| LONG-TERM DEBT | 1,060 | — | 3 | — | 1,063 | |||||||||||||||
| RETIREMENT BENEFITS | 504 | — | 186 | — | 690 | |||||||||||||||
| INTERCOMPANY PAYABLE (RECEIVABLE) | (144 | ) | (419 | ) | 563 | — | — | |||||||||||||
| OTHER LIABILITIES | 97 | 130 | 20 | — | 247 | |||||||||||||||
| MINORITY INTERESTS | — | — | 75 | — | 75 | |||||||||||||||
| SHAREOWNERS’ EQUITY | 462 | 1,591 | 533 | (2,124 | ) | 462 | ||||||||||||||
| TOTAL LIABILITIES AND SHAREOWNERS’ | ||||||||||||||||||||
| EQUITY | $ | 2,220 | $ | 1,672 | $ | 2,906 | $ | (2,124 | ) | $ | 4,674 | |||||||||
107
ARVINMERITOR, INC.
NOTES TO
CONSOLIDATED FINANCIAL STATEMENTS — (Continued)
CONDENSED CONSOLIDATING
STATEMENT OF CASH FLOWS
(In millions)
| Fiscal Year Ended September 30, 2009 | ||||||||||||||||||
| Non- | ||||||||||||||||||
| Parent | Guarantors | Guarantors | Elims | Consolidated | ||||||||||||||
| CASH FLOWS PROVIDED BY (USED FOR) | ||||||||||||||||||
| OPERATING ACTIVITIES | $ | 66 | $ | 5 | $ | (366 | ) | $ | — | $ | (295 | ) | ||||||
| INVESTING ACTIVITIES | ||||||||||||||||||
| Capital expenditures | (1 | ) | (30 | ) | (80 | ) | — | (111 | ) | |||||||||
| Proceeds from investments | 6 | — | — | — | 6 | |||||||||||||
| Proceeds from disposition of property and businesses | — | — | 4 | — | 4 | |||||||||||||
| Net cash flows provided by discontinued operations | — | 7 | 108 | — | 115 | |||||||||||||
| CASH PROVIDED BY (USED FOR) INVESTING | ||||||||||||||||||
| ACTIVITIES | 5 | (23 | ) | 32 | — | 14 | ||||||||||||
| FINANCING ACTIVITIES | ||||||||||||||||||
| Borrowings on revolving credit facility, net | 28 | — | — | — | 28 | |||||||||||||
| Payments on prior accounts receivable securitization | ||||||||||||||||||
| program | — | — | (111 | ) | — | (111 | ) | |||||||||||
| Borrowings on new accounts receivable securitization | ||||||||||||||||||
| program | — | — | 83 | — | 83 | |||||||||||||
| Repayment of notes and term loan | (83 | ) | — | — | — | (83 | ) | |||||||||||
| Payments on lines of credit and other | (2 | ) | — | (7 | ) | — | (9 | ) | ||||||||||
| Net financing cash flows used for discontinued operations | — | — | (6 | ) | (6 | ) | ||||||||||||
| Intercompany advances | (173 | ) | — | 173 | — | — | ||||||||||||
| Cash dividends | (8 | ) | — | — | — | (8 | ) | |||||||||||
| CASH PROVIDED BY (USED FOR) FINANCING | ||||||||||||||||||
| ACTIVITIES | (238 | ) | — | 132 | — | (106 | ) | |||||||||||
| EFFECT OF FOREIGN CURRENCY EXCHANGE | ||||||||||||||||||
| RATES ON CASH AND CASH EQUIVALENTS | — | — | (15 | ) | — | (15 | ) | |||||||||||
| CHANGE IN CASH AND CASH EQUIVALENTS | (167 | ) | (18 | ) | (217 | ) | — | (402 | ) | |||||||||
| CASH AND CASH EQUIVALENTS AT BEGINNING | ||||||||||||||||||
| OF YEAR | 174 | 24 | 299 | — | 497 | |||||||||||||
| CASH AND CASH EQUIVALENTS AT END OF YEAR | $ | 7 | $ | 6 | $ | 82 | $ | — | $ | 95 | ||||||||
108
ARVINMERITOR, INC.
NOTES TO
CONSOLIDATED FINANCIAL STATEMENTS — (Continued)
CONDENSED CONSOLIDATING
STATEMENT OF CASH FLOWS
(In millions)
| Fiscal Year Ended September 30, 2008 | ||||||||||||||||||
| Non- | ||||||||||||||||||
| Parent | Guarantors | Guarantors | Elims | Consolidated | ||||||||||||||
| CASH FLOWS PROVIDED BY OPERATING | ||||||||||||||||||
| ACTIVITIES | $ | 73 | $ | 41 | $ | 49 | $ | — | $ | 163 | ||||||||
| INVESTING ACTIVITIES | ||||||||||||||||||
| Capital expenditures | (4 | ) | (25 | ) | (109 | ) | — | (138 | ) | |||||||||
| Acquisitions of businesses and investments, net of cash | ||||||||||||||||||
| acquired | — | — | (60 | ) | — | (60 | ) | |||||||||||
| Proceeds from investments | 5 | — | — | — | 5 | |||||||||||||
| Proceeds from disposition of property and businesses | 7 | — | 2 | — | 9 | |||||||||||||
| Net cash flows provided by discontinued operations | — | 3 | 21 | — | 24 | |||||||||||||
| CASH PROVIDED BY (USED FOR) INVESTING | ||||||||||||||||||
| ACTIVITIES | 8 | (22 | ) | (146 | ) | — | (160 | ) | ||||||||||
| FINANCING ACTIVITIES | ||||||||||||||||||
| Borrowings on prior accounts receivable securitization | ||||||||||||||||||
| program | — | — | 111 | 111 | ||||||||||||||
| Repayment of notes and term loan | (5 | ) | — | — | — | (5 | ) | |||||||||||
| Borrowings on lines of credit and other | — | — | 13 | — | 13 | |||||||||||||
| Debt issuance and extinguishment costs | (6 | ) | — | — | — | (6 | ) | |||||||||||
| Intercompany advances | (49 | ) | — | 49 | — | — | ||||||||||||
| Net financing cash flows provided by discontinued | ||||||||||||||||||
| operations | — | — | 13 | 13 | ||||||||||||||
| Cash dividends | (29 | ) | — | — | — | (29 | ) | |||||||||||
| CASH PROVIDED BY (USED FOR) FINANCING | ||||||||||||||||||
| ACTIVITIES | (89 | ) | — | 186 | — | 97 | ||||||||||||
| EFFECT OF FOREIGN CURRENCY EXCHANGE | ||||||||||||||||||
| RATES ON CASH AND CASH EQUIVALENTS | — | — | (12 | ) | — | (12 | ) | |||||||||||
| CHANGE IN CASH AND CASH EQUIVALENTS | (8 | ) | 19 | 77 | — | 88 | ||||||||||||
| CASH AND CASH EQUIVALENTS AT BEGINNING | ||||||||||||||||||
| OF YEAR | 182 | 5 | 222 | — | 409 | |||||||||||||
| CASH AND CASH EQUIVALENTS AT END OF YEAR | $ | 174 | $ | 24 | $ | 299 | $ | — | $ | 497 | ||||||||
109
ARVINMERITOR, INC.
NOTES TO
CONSOLIDATED FINANCIAL STATEMENTS — (Continued)
CONDENSED CONSOLIDATING
STATEMENT OF CASH FLOWS
(In millions)
| Fiscal Year Ended September 30, 2007 | ||||||||||||||||||
| Non- | ||||||||||||||||||
| Parent | Guarantors | Guarantors | Elims | Consolidated | ||||||||||||||
| CASH FLOWS PROVIDED BY (USED FOR) | ||||||||||||||||||
| OPERATING ACTIVITIES | $ | (28 | ) | $ | (123 | ) | $ | 187 | $ | — | $ | 36 | ||||||
| INVESTING ACTIVITIES | ||||||||||||||||||
| Capital expenditures | (1 | ) | (25 | ) | (60 | ) | — | (86 | ) | |||||||||
| Acquisitions of businesses and investments, net of cash | ||||||||||||||||||
| acquired | — | — | (2 | ) | — | (2 | ) | |||||||||||
| Proceeds from marketable securities | — | — | 5 | — | 5 | |||||||||||||
| Proceeds from disposition of property and businesses | 3 | — | 11 | — | 14 | |||||||||||||
| Net cash flows provided by discontinued operations | — | 150 | 15 | — | 165 | |||||||||||||
| CASH PROVIDED BY (USED FOR) INVESTING | ||||||||||||||||||
| ACTIVITIES | 2 | 125 | (31 | ) | — | 96 | ||||||||||||
| FINANCING ACTIVITIES | ||||||||||||||||||
| Borrowings on prior accounts receivable securitization | ||||||||||||||||||
| program | — | — | (40 | ) | — | (40 | ) | |||||||||||
| Repayment of notes and term loan | (249 | ) | — | — | — | (249 | ) | |||||||||||
| Borrowings on lines of credit and other | 1 | — | (5 | ) | — | (4 | ) | |||||||||||
| Debt issuance and extinguishment costs | (10 | ) | — | — | — | (10 | ) | |||||||||||
| Proceeds from issuance of convertible notes and term loan | 200 | — | — | — | 200 | |||||||||||||
| Proceeds from exercise of stock options | 28 | — | — | — | 28 | |||||||||||||
| Intercompany advances | 171 | — | (171 | ) | — | — | ||||||||||||
| Net financing cash flows provided by discontinued | ||||||||||||||||||
| operations | — | — | 7 | — | 7 | |||||||||||||
| Cash dividends | (29 | ) | — | — | — | (29 | ) | |||||||||||
| Other financing activities | (1 | ) | — | — | — | (1 | ) | |||||||||||
| CASH PROVIDED BY (USED FOR) FINANCING | ||||||||||||||||||
| ACTIVITIES | 111 | — | (209 | ) | — | (98 | ) | |||||||||||
| EFFECT OF FOREIGN CURRENCY EXCHANGE | ||||||||||||||||||
| RATES ON CASH AND CASH EQUIVALENTS | — | — | 25 | — | 25 | |||||||||||||
| CHANGE IN CASH AND CASH EQUIVALENTS | 85 | 2 | (28 | ) | — | 59 | ||||||||||||
| CASH AND CASH EQUIVALENTS AT BEGINNING | ||||||||||||||||||
| OF YEAR | 97 | 3 | 250 | — | 350 | |||||||||||||
| CASH AND CASH EQUIVALENTS AT END OF YEAR | $ | 182 | $ | 5 | $ | 222 | $ | — | $ | 409 | ||||||||
110
Item 9. Changes in and Disagreements with Accountants on Accounting and Financial Disclosure.
None.
Item 9A. Controls and Procedures.
Disclosure Controls and Procedures
As required by Rule 13a-15 under the Securities Exchange Act of 1934 (the “Exchange Act”), management, with the participation of the chief executive officer and chief financial officer, evaluated the effectiveness of our disclosure controls and procedures as of September 30, 2009. Based upon that evaluation, the chief executive officer and the chief financial officer have concluded that, as of September 30, 2009, our disclosure controls and procedures were effective to ensure that information required to be disclosed in the reports we file or submit under the Exchange Act is recorded, processed, summarized and reported within the time periods specified in the SEC’s rules and forms. These disclosure controls and procedures include, without limitation, controls and procedures designed to ensure that information required to be disclosed by us in the reports we file or submit is accumulated and communicated to management, including the Chief Executive Officer and Chief Financial Officer, as appropriate to allow timely decisions regarding required disclosure.
Management Report on Internal Control over Financial Reporting
ArvinMeritor’s management is responsible for establishing and maintaining adequate internal control over financial reporting for the company, as defined in Rules 13a-15(f) and 15d-15(f) under the Exchange Act. ArvinMeritor’s internal control system is designed to provide reasonable assurance regarding the reliability of financial reporting and the preparation of financial statements for external purposes, in accordance with accounting principles generally accepted in the United States of America.
All internal control systems, no matter how well designed, have inherent limitations and may not prevent or detect misstatements. Also, projections of any evaluation of effectiveness to future periods are subject to the risk that controls may become inadequate because of changes in conditions, or that the degree of compliance with the policies or procedures may deteriorate.
ArvinMeritor’s management, with the participation of the chief executive officer and chief financial officer, evaluated the effectiveness of its internal control over financial reporting as of September 30, 2009. This evaluation was based on the criteria set forth in Internal Control – Integrated Framework issued by the Committee of Sponsoring Organizations of the Treadway Commission (“COSO”). Based on management’s evaluation and the criteria set forth by COSO, ArvinMeritor’s management concluded that the internal control over financial reporting maintained by the company, as of September 30, 2009, was effective.
Deloitte & Touche LLP, ArvinMeritor’s independent registered public accounting firm, has issued an attestation report on ArvinMeritor’s internal control over financial reporting, which follows.
November 18, 2009
111
REPORT OF INDEPENDENT REGISTERED PUBLIC ACCOUNTING FIRM
To the Board of Directors and
Shareowners of ArvinMeritor, Inc.
Troy, Michigan
We have audited the internal control over financial reporting of ArvinMeritor, Inc. and subsidiaries (the "Company") as of September 27, 2009 based on criteria established in Internal Control — Integrated Framework issued by the Committee of Sponsoring Organizations of the Treadway Commission. The Company's management is responsible for maintaining effective internal control over financial reporting and for its assessment of the effectiveness of internal control over financial reporting, included in the accompanying Management Report on Internal Control over Financial Reporting. Our responsibility is to express an opinion on the Company's internal control over financial reporting based on our audit.
We conducted our audit in accordance with the standards of the Public Company Accounting Oversight Board (United States). Those standards require that we plan and perform the audit to obtain reasonable assurance about whether effective internal control over financial reporting was maintained in all material respects. Our audit included obtaining an understanding of internal control over financial reporting, assessing the risk that a material weakness exists, testing and evaluating the design and operating effectiveness of internal control based on the assessed risk, and performing such other procedures as we considered necessary in the circumstances. We believe that our audit provides a reasonable basis for our opinion.
A company's internal control over financial reporting is a process designed by, or under the supervision of, the company's principal executive and principal financial officers, or persons performing similar functions, and effected by the company's board of directors, management, and other personnel to provide reasonable assurance regarding the reliability of financial reporting and the preparation of financial statements for external purposes in accordance with generally accepted accounting principles. A company's internal control over financial reporting includes those policies and procedures that (1) pertain to the maintenance of records that, in reasonable detail, accurately and fairly reflect the transactions and dispositions of the assets of the company; (2) provide reasonable assurance that transactions are recorded as necessary to permit preparation of financial statements in accordance with generally accepted accounting principles, and that receipts and expenditures of the company are being made only in accordance with authorizations of management and directors of the company; and (3) provide reasonable assurance regarding prevention or timely detection of unauthorized acquisition, use, or disposition of the company's assets that could have a material effect on the financial statements.
Because of the inherent limitations of internal control over financial reporting, including the possibility of collusion or improper management override of controls, material misstatements due to error or fraud may not be prevented or detected on a timely basis. Also, projections of any evaluation of the effectiveness of the internal control over financial reporting to future periods are subject to the risk that the controls may become inadequate because of changes in conditions, or that the degree of compliance with the policies or procedures may deteriorate.
In our opinion, the Company maintained, in all material respects, effective internal control over financial reporting as of September 27, 2009, based on the criteria established in Internal Control — Integrated Framework issued by the Committee of Sponsoring Organizations of the Treadway Commission.
We have also audited, in accordance with the standards of the Public Company Accounting Oversight Board (United States), the consolidated financial statements and financial statement schedule listed in the Index at Item 15(a)(2) as of and for the year ended September 27, 2009 of the Company and our report dated November 18, 2009 expressed an unqualified opinion on those consolidated financial statements and financial statement schedule and included an explanatory paragraph relating to the Company’s change in the measurement date of its defined benefit plan assets and liabilities to coincide with its year end.
Detroit, Michigan
November 18,
2009
112
Changes in Internal Control Over Financial Reporting
Management, with the participation of the chief executive officer and chief financial officer, has evaluated any change in our internal control over financial reporting (as such term is defined in Rules 13a-15(f) and 15d-15(f) under the Exchange Act) during the fiscal quarter ended September 30, 2009, and found no change that has materially affected or is reasonably likely to materially affect our internal control over financial reporting.
Item 9B. Other Information.
None.
PART III
Item 10. Directors, Executive Officers and Corporate Governance.
INFORMATION AS TO DIRECTORS
The following information, as reported to us as of the date of this Form 10-K, is shown below for each of our directors: name, age and principal occupation; period during which he or she has served as a director of ArvinMeritor and its predecessor, Meritor Automotive, Inc. (“Meritor”), which merged with Arvin Industries, Inc. (“Arvin”) into ArvinMeritor on July 7, 2000 (the “merger”); position, if any, with ArvinMeritor; business experience; other directorships held; and the standing committees of the Board of Directors on which the nominee or continuing director serves.
CLASS I –TERMS EXPIRING IN 2010
| IVOR J. EVANS | ||
| Retired Vice Chairman, Union Pacific Corporation (Railroad Company) | ||
| Age 67 |
Mr. Evans, a director since May 2005, is a member of the Audit Committee and the Compensation and Management Development Committee. He served as Vice Chairman of Union Pacific Corporation from January 2004 until his retirement in March 2005, and served as a member of the Union Pacific board of directors from 1999 to 2005. He had served as President and Chief Operating Officer of Union Pacific Railroad from 1998 until January 2004. From 1989 to 1998, he served in various executive positions at Emerson Electric Company (technology and engineering applications), including Senior Vice President, Industrial Components and Equipment. Prior to that, he was President of Blackstone Corp. (automotive components and systems) from 1985 to 1989 and, prior to that, spent 20 years serving in key operations roles for General Motors Corporation (automotive). He is also a director of Textron Inc., Cooper Industries and Spirit AeroSystems and an operating partner of Thayer Capital Partners. | |
| CHARLES G. McCLURE, JR. | ||
| Chairman of the Board, Chief Executive Officer and President of ArvinMeritor | ||
| Age 56 |
Mr. McClure has been a director since August 2004 when he was elected to his current position. Prior to joining the Company, he served Federal-Mogul Corporation (automotive supplier) as Chief Executive Officer and a member of the Board of Directors from July 2003 to July 2004, and as President and Chief Operating Officer and a member of the Board of Directors from January 2001 to July 2003. He served Detroit Diesel Corporation (designer and manufacturer of diesel engines) as President, Chief Executive Officer and a member of the Board of Directors from 1997 to December 2000, and held a number of management positions with Johnson Controls, Inc. (automotive supplier) from 1983 to 1997, including President of the Americas Region; Vice President and Managing Director of European Operations; and Vice President and General Manager of Joint Ventures. From 1983 to 1985, Mr. McClure was employed at Hoover Universal (which was acquired by Johnson Controls in 1985) as Operations Director of Material Handling Products. Before that, he spent four years at Ford Motor Company (automotive) as a heavy-duty truck sales engineer and field service engineer. He served as a lieutenant (jg) on a U.S. Navy destroyer from 1975 to 1979. Mr. McClure is a director of R. L. Polk & Company and serves on the boards of various business and civic organizations. | |
113
| WILLIAM R. NEWLIN | ||
|
Chairman, Newlin Investment Company, LLC (Investment Management Firm) | ||
| Age 69 |
Mr. Newlin, a director since July 2003, is the Board’s Presiding Director, Chair of the Compensation and Management Development Committee and a member of the Corporate Governance and Nominating Committee. He is currently the Chairman of Newlin Investment Company, LLC and Chairman of Plextronics, Inc., (a private international technology company specializing in printed solar lighting and other electronics) since May 2008 and a director since June 2005. He served Dick’s Sporting Goods, Inc. (sporting goods) as Executive Vice President and Chief Administrative Officer from October 2003 until his retirement in March 2007. He served as Chairman and CEO of Buchanan Ingersoll Professional Corporation (law firm) from 1980 to October 2003. Mr. Newlin is a director of Kennametal Inc. and Calgon Carbon Corporation. | |
CLASS II –TERMS EXPIRING IN 2011
|
JOSEPH B. ANDERSON, JR. | ||
|
Chairman of the Board and Chief Executive Officer, TAG Holdings LLC (Automotive Components) | ||
| Age 66 |
Mr. Anderson, a director since July 2000 and a director of Meritor from September 1997 until the merger, is Chair of the Environmental and Social Responsibility Committee and a member of the Corporate Governance and Nominating Committee. He has served as Chairman of the Board and Chief Executive Officer of TAG Holdings LLC since 2003, and of its subsidiaries, Vibration Control Technologies, LLC since 2002; A&D Technologies, LLC and North American Assemblies, LLC since 2003; and Great Lakes Assemblies, LLC since 2005. He was Chairman of the Board and Chief Executive Officer of Chivas Industries LLC (and its predecessor, Chivas Products, Ltd.) (automotive components) from October 1994 until March 2002. From December 1992 to July 1993, Mr. Anderson was President and Chief Executive Officer of Composite Energy Management Systems, Inc. (automotive components). Mr. Anderson served in a variety of positions, primarily in manufacturing, with General Motors Corporation (automotive) from 1979 until December 1992. He also served as an assistant to the U.S. Secretary of Commerce from 1977 to 1979. Mr. Anderson is a director of Quaker Chemical Corporation, Rite Aid Corporation, NV Energy and Valassis Communications, Inc. | |
|
RHONDA L. BROOKS | ||
|
President, R. Brooks Advisors, Inc. (Business Consultant) | ||
| Age 57 |
Ms. Brooks, a director since July 2000 and a director of Meritor from July 1999 until the merger, is Chair of the Corporate Governance and Nominating Committee and a member of the Environmental and Social Responsibility Committee. She is currently the President of R. Brooks Advisors, Inc., a consultant for start-up firms and an advisor for a private equity company. She served Owens Corning, Inc. (building materials and fiberglass composites) as President of the Exterior Systems Business from June 2000 to July 2002; as President of the Roofing Systems Business from December 1997 to June 2000; as Vice President, Investor Relations from January to December 1997; and as Vice President-Marketing of the Composites Division from 1995 to 1996. She served as Senior Vice President and General Manager of PlyGem Industries, Inc. (building and remodeling products) from 1994 to 1995, and as Vice President – Oral Care and New Product Strategies, and Vice President – Marketing and Sales of Warner Lambert Company (pharmaceuticals and consumer products) from 1990 to 1994. She was with General Electric Company from 1976 to 1990. She is a director of Menasha Corporation. | |
|
STEVEN G. ROTHMEIER | ||
|
Chairman and Chief Executive Officer, Great Northern Capital (Investment Management Firm) | ||
| Age 63 |
Mr. Rothmeier, a director of ArvinMeritor since November 2004, is Chair of the Audit Committee and a member of the Corporate Governance and Nominating Committee. He is the Chairman and Chief Executive Officer of Great Northern Capital. He founded the St. Paul, Minnesota investment management firm in 1993, after serving as president of a Twin Cities venture capital and merchant banking firm from 1990 to 1993. Mr. Rothmeier began his career with Northwest Airlines, Inc. in 1973 as a corporate financial analyst and served in a number of positions of increasing leadership, including Director of Economic Planning in the Regulatory Proceedings Division; Vice President of Finance and Treasurer; Executive Vice President of Finance and Administration; Chief Financial Officer; and President and Chief Operating Officer. He was named Chairman and Chief Executive Officer of NWA, Inc. and the airline in 1985 and served in that position until 1989. He is also a director of Precision Castparts, Inc. and Waste Management, Inc. He is a Trustee of the University of Chicago and serves on the boards of a number of civic, business and charitable organizations. | |
114
CLASS III –TERMS EXPIRING IN 2012
| DAVID W. DEVONSHIRE | ||
|
Retired Executive Vice President and Chief Financial Officer, Motorola, Inc. (Communications Technologies and Electronics Products) | ||
| Age 64 |
Mr. Devonshire, a director since July 2004, is a member of the Audit Committee and the Compensation and Management Development Committee. He was Executive Vice President and Chief Financial Officer of Motorola, Inc. from 2002 to March 2007, and Executive Vice President of Motorola from March 2007 until his retirement in December 2007. He had previously served as Executive Vice President and Chief Financial Officer for Ingersoll-Rand Company (industrial components) from 1998 to 2002; Senior Vice President and Chief Financial Officer for Owens Corning, Inc. (building materials and fiberglass composites) from 1993 to 1998; Corporate Vice President of Finance for Honeywell (diversified manufacturing and technology) from 1992 to 1993; and Corporate Vice President and Controller for Honeywell from 1990 to 1992. Prior to that, Mr. Devonshire served in financial positions with Mead Corporation (forest products), Baxter International, Inc. (medical devices and biotechnology) and KPMG (public accounting), where he began his career in 1968. Mr. Devonshire serves on the boards of Roper Industries, Arbitron Inc. and Career Education and the advisory boards of CFO Magazine and LEK Consulting, and is a member of the Board of Trustees of the John G. Shedd Aquarium of Chicago. | |
| VICTORIA B. JACKSON | ||
|
President, Victoria Bellé, Inc. (Design, Manufacturing and Marketing of Specialty Retail Products) | ||
| Age 54 |
Ms. Jackson, a director since July 2000 and a director of Meritor from July 1999 until the merger, is a member of the Audit Committee and the Environmental and Social Responsibility Committee. She currently serves as President of Victoria Bellé, Inc., a designer, manufacturer and marketer of specialty retail products. She was President and Chief Executive Officer of DSS/Prodiesel, Inc. (transportation components) from 1979 until 1998, when the company was sold to TransCom USA. She served as a consultant to TransCom USA from 1998 to February 2000. Ms. Jackson is a member of the Advisory Board of Stratco Global. | |
| JAMES E. MARLEY | ||
|
Retired Chairman of the Board, AMP Inc. (Electrical and Electronics Components and Cabling Products) | ||
| Age 74 |
Mr. Marley, a director since July 2000 and a director of Meritor from April 1999 until the merger, is a member of the Compensation and Management Development Committee and a member of the Environmental and Social Responsibility Committee. He is the retired Chairman of the Board of AMP Inc., serving in that position from 1993 to 1998. He served AMP as President and Chief Operating Officer from 1990 to 1992, as President from 1986 to 1990, and in a variety of engineering and executive positions from 1963, when he joined AMP, until 1986. He is a director of a number of business, educational and civic organizations, and is a member of a number of engineering and management professional associations. | |
See also the information with respect to executive officers of ArvinMeritor under Item 4A of Part I of this Form 10-K. No director of ArvinMeritor was selected pursuant to any arrangement or understanding between him or her and any person other than ArvinMeritor. There are no family relationships, as defined in Item 401 of Regulation S-K, between any executive officer, director or person nominated to become a director or executive officer of ArvinMeritor. No person who has served as a director or executive officer of ArvinMeritor at any time since October 1, 2008 has any substantial interest, direct or indirect, in any matter to be acted on at the 2010 Annual Meeting, other than election of directors to office.
There have been no material changes to the procedures by which security holders may recommend nominees to ArvinMeritor’s Board of Directors since those described in ArvinMeritor’s Proxy Statement for the 2009 Annual Meeting.
SECTION 16(a) BENEFICIAL OWNERSHIP REPORTING COMPLIANCE
Section 16(a) of the Exchange Act requires our officers and directors, and persons who own more than ten percent of a registered class of ArvinMeritor equity securities, to file reports of ownership and changes in ownership on Forms 3, 4 and 5 with the SEC and the New York Stock Exchange. Officers, directors and greater than ten percent shareowners are required by SEC regulation to furnish us with copies of all Forms 3, 4 and 5 they file.
Based solely on our review of the copies of such forms we have received and information and representations furnished by our officers and directors, we believe that all our officers, directors and greater than ten percent beneficial owners have filed with the SEC on a timely basis all required forms with respect to transactions in ArvinMeritor securities in fiscal year 2009.
115
CODE OF ETHICS
All ArvinMeritor employees, including our chief executive officer, chief financial officer, controller and other executive officers, are required to comply with our corporate policies regarding Standards of Business Conduct and Conflicts of Interest. These policies have been in place since the Company was formed in a spin-off from Rockwell International Corporation (now Rockwell Automation, Inc. and referred to in this proxy statement as “Rockwell”) in 1997. The purpose of these corporate policies is to ensure to the greatest possible extent that our business is conducted in a consistently legal and ethical manner. The Audit Committee has oversight responsibility with respect to compliance by employees. The Board of Directors is also required to comply with these policies, and the Corporate Governance and Nominating Committee is responsible for monitoring compliance by directors.
Employees may submit concerns or complaints regarding ethical issues on a confidential basis to our Helpline, by means of a toll-free telephone call or e-mail. The Office of the General Counsel investigates all concerns and complaints. Employees may also contact the Board of Directors directly on these issues. See Communications with the Board of Directors below.
ArvinMeritor’s ethics manual, including the text of the policies on Standards of Business Conduct and Conflicts of Interest, is posted in the section headed “Investors – Corporate Governance” on our website, www.arvinmeritor.com, and paper copies will be provided upon request to the Office of the Secretary, ArvinMeritor, Inc., 2135 West Maple Road, Troy, MI 48084. We will post on our website any amendment to, or waiver from, a provision of our policies that applies to our chief executive officer, chief financial officer or controller, and that relates to any of the following elements of these policies: honest and ethical conduct; disclosure in reports or documents filed by the Company with the SEC; compliance with applicable laws, rules and regulations; prompt internal reporting of code violations; and accountability for adherence to the policies.
COMMUNICATIONS WITH THE BOARD OF DIRECTORS
We have established procedures for shareowners and other interested parties to communicate directly with non-management members of the Board of Directors on a confidential basis. You can contact the Board by mail at: ArvinMeritor Board of Directors, 330 East Maple Road, PMB 335, Birmingham, MI 48009. All communications made by this means will be received directly by the Chair of the Corporate Governance and Nominating Committee and will not be screened or reviewed by any ArvinMeritor personnel.
If you have concerns involving internal controls, accounting or auditing, you can contact the Audit Committee directly, on a confidential basis, by mail at: ArvinMeritor Audit Committee, 330 East Maple Road, PMB 407, Birmingham, MI 48009. All communications made by these means will be received directly by the Chair of the Audit Committee and will not be screened or reviewed by any ArvinMeritor personnel.
AUDIT COMMITTEE
ArvinMeritor has a separately designated standing audit committee established in accordance with Section 3(a)(58)(A) of the Exchange Act. The current members of the Audit Committee are Steven G. Rothmeier (chairman), David W. Devonshire, Ivor J. Evans and Victoria B. Jackson. The Board of Directors has determined that ArvinMeritor has at least two individuals who qualify as an “audit committee financial expert” (as defined in Item 407(d)(5) of Regulation S-K), David W. Devonshire and Steven G. Rothmeier, serving on the Audit Committee. Mr. Devonshire and Mr. Rothmeier are each “independent,” as defined in the listing standards of the NYSE.
ArvinMeritor’s chief executive officer and chief financial officer have filed certifications, as required by the Sarbanes-Oxley Act of 2002 and Rule 13a-14(a) and (b) under the Exchange Act, as exhibits to each Quarterly Report on Form 10-Q filed with the SEC during fiscal year 2009 and to this Annual Report on Form 10-K. The company’s chief executive officer also filed with the NYSE in February 2009 a certification that he was not aware of any violation by the company of the NYSE listing standards.
116
Item 11. Executive Compensation.
DIRECTOR COMPENSATION
The following table reflects compensation for the fiscal year ended September 30, 2009* awarded to, earned by or paid to each non-employee director who served during the fiscal year. Mr. McClure did not receive any compensation for his service as a director.
| Fees Earned | Option | All Other | ||||||||||
| or Paid in | Stock Awards2,4 | Awards3,4 | Compensation5 | Total | ||||||||
| Name | Cash1 ($) | ($) | ($) | ($) | ($) | |||||||
| Joseph B. Anderson, Jr. | $ | 85,000 | 32,780 | 0 | 34,797 | 152,577 | ||||||
| Rhonda L. Brooks | 87,500 | 38,905 | 0 | 31,735 | 158,140 | |||||||
| David W. Devonshire | 93,000 | 54,697 | 0 | 31,381 | 179,078 | |||||||
| Ivor J. Evans | 87,750 | 46,283 | 0 | 34,900 | 168,933 | |||||||
| Victoria B. Jackson | 84,000 | 38,905 | 0 | 31,735 | 154,640 | |||||||
| James E. Marley | 86,750 | 54,697 | 0 | 31,735 | 173,182 | |||||||
| William R. Newlin | 115,250 | 59,462 | 0 | 32,131 | 206,843 | |||||||
| Steven G. Rothmeier | 97,000 | 52,408 | 0 | 32,034 | 181,442 | |||||||
* Please note that the Company’s fiscal year ends on the Sunday nearest September 30. For example, fiscal year 2009 ended on September 27, 2009, fiscal year 2008 ended on September 28, 2008 and fiscal year 2007 ended on September 30, 2008. For ease of presentation, September 30 is utilized consistently throughout to represent the fiscal year end.
____________________
| 1 |
This column includes retainer fees, chairman fees, meeting fees and, for Mr. Newlin, the presiding director fee. This column does not include cash amounts paid in 2009 if such amounts were earned and reported in prior years, but deferred for future payment pursuant to the Deferred Compensation Policy for Non-Employee Directors. | |
| 2 |
This column includes the amount of compensation cost that was recognized for financial reporting purposes for fiscal year 2009 for restricted share units, restricted shares and shares of common stock, in accordance with the FASB’s compensation guidance. These amounts include costs recognized with respect to awards made in fiscal year 2009 and earlier, adjusted to eliminate estimates of forfeitures related to service-based vesting conditions. None of the restricted shares or restricted share units reported in this column have been forfeited. Information on the assumptions used in valuation of the grants is included in Note 19 of the Notes to Consolidated Financial Statements in the Company’s Annual Report on Form 10-K for the fiscal year ended September 30, 2009 (“Form 10-K”), which is incorporated herein by reference. These amounts may not reflect the actual value realized upon settlement or vesting. | |
|
For fiscal 2009, there was a grant of 3,500 shares to each director, except for directors who elected to forego the stock grant as part of a 10% reduction in fees. The difference between the fair market value on the date of grant of the 3,500 shares and $80,000 (the intended value of the equity award) was paid in cash, reduced as set forth below under Narrative Description of Director Compensation -Reduction in Compensation. The grant date fair value of each director’s grant, computed in accordance with the FASB’s compensation guidance, was $6,125. Information on the assumptions used in valuation of the grants is included in Note 19 of the Notes to Consolidated Financial Statements in this Form 10-K. | ||
| 3 |
In accordance with the FASB’s compensation guidance, the Company recognizes compensation cost with respect to the unvested portion of stock options. All stock options issued by the Company under the 1997 Directors Stock Plan vested over a three year period. The Company has not granted stock options to non-employee directors since fiscal year 2003, and therefore no expense was recorded in fiscal year 2009. | |
| 4 |
The non-employee directors held the following restricted shares of Common Stock, restricted share units and options to purchase Common Stock, granted under the 1997 Directors Stock Plan or the 2004 Directors Stock Plan, as applicable, at September 30, 2009. Some restricted share units and restricted shares reported in the table below (for Ms. Jackson and Messrs. Anderson, Devonshire, Marley and Newlin) were granted in lieu of annual stock grants or cash retainer fees, at the election of the director, in periods prior to fiscal year 2009. | |
117
| Name | Restricted Shares | Restricted Share Units | Stock Options | |||
| Joseph B. Anderson, Jr. | 750 | 15,900 | 11,437 | |||
| Rhonda L. Brooks | 0 | 15,900 | 12,938 | |||
| David W. Devonshire | 10,107 | 15,934 | 0 | |||
| Ivor J. Evans | 0 | 18,982 | 0 | |||
| Victoria B. Jackson | 1,000 | 15,900 | 12,938 | |||
| James E. Marley | 16,423 | 15,900 | 13,500 | |||
| William R. Newlin | 11,818 | 18,054 | 2,250 | |||
| Steven G. Rothmeier | 0 | 20,707 | 0 | |||
| 5 |
This column includes: (a) the cash amount paid in fiscal 2009 in lieu of the balance of the annual equity award as further described below under Narrative Description of Director Compensation-Equity based Awards in the amount of $32,250 for Messrs. Anderson and Evans and $29,188 for the each of the other directors; (b) dividends paid on outstanding restricted shares of Common Stock and (c) dividend equivalents accrued with respect to outstanding restricted share units. Perquisites did not exceed a value of $10,000 for any director in fiscal year 2009 and therefore are not included in this column. |
Narrative Description of Director Compensation
Only non-employee directors receive compensation for Board service. Directors who are also employees of ArvinMeritor or a subsidiary do not receive compensation for serving as a director. The following types of compensation were earned by or paid to non-employee directors in fiscal year 2009.
Retainer Fees. Non-employee directors of ArvinMeritor receive a cash retainer at the rate of $75,000 per year for Board service. The chairs of the four standing Board committees receive additional cash retainers in the following amounts per year: Audit Committee - $10,000; Compensation Committee - $7,000; and Corporate Governance and Nominating Committee and Environmental and Social Responsibility Committee - $5,000. The Presiding Director receives an additional annual retainer in the amount of $20,000.
Committee Meeting Fees. Non-employee directors receive fees of $1,500 for attendance at each standing and special committee meeting ($750 for each telephone meeting).
Equity-Based Awards. As part of our director compensation, each non-employee director is entitled to receive, immediately after the Annual Meeting of Shareowners, an equity grant equal to a value of approximately $80,000, in the form of shares of common stock, restricted stock or restricted share units, at the director’s discretion. The restricted shares vest three years from the date of grant. The restricted share units vest upon the earliest of (a) six years from the date of grant, (b) ten days after the director retires after reaching age 72 and having served at least three years as a director, or (c) the date the director resigns or ceases to be a director under circumstances the Board determines not to be adverse to the best interests of the Company. Upon vesting, the holder is entitled to one share of Common Stock for each unit. Upon vesting of restricted share units, non-employee directors generally are entitled to receive a cash payment for dividend equivalents plus interest accrued during the vesting period. There were not sufficient shares remaining available under the 2004 Directors Plan, however, for a 2009 annual grant equal to $80,000. Accordingly, for fiscal 2009, there was a grant of 3,500 shares per director (subject to the reduction discussed below). The difference between the fair market value on the date of grant of the 3,500 shares and $80,000 (the intended value of the equity award) was paid quarterly in cash, reduced as set forth below.
Reduction in Compensation. In January 2009, in response to worsening economic conditions, the Board of Directors of ArvinMeritor reduced the amount of their annual compensation by 10% until further notice. As set forth above, their annual compensation consists of (i) a cash retainer of $75,000 plus (ii) an annual grant valued at $80,000 (to be comprised in the current year of cash and 3,500 shares of stock). The 10% reduction was achieved, at the director’s election, either through foregoing the stock grant and deducting the balance of the $15,500 from the cash payment or through deducting the entire $15,500 from the cash payment. At a meeting held on November 6, 2009, the Board of Directors voted to reinstate their pay. The 2010 Long-term Incentive Plan, if approved by the shareowners at the 2010 Annual Meeting, is expected to have sufficient shares of common stock available to make the annual equity grants to directors for 2010.
Deferrals. A director may elect to defer payment of all or part of the cash retainer and meeting fees to a later date, with interest on deferred amounts accruing quarterly at a rate equal to 120% of the Federal long-term rate set each month by the Secretary of the Treasury. Each director also has the option each year (provided sufficient shares are available under a plan covering director equity grants to accommodate this deferral option at the time of its election) to defer all or any portion of the cash retainer and meeting fees by electing to receive restricted shares of Common Stock or restricted share units that could be forfeited if certain conditions are not satisfied. The restricted shares or restricted share units in lieu of the cash retainer and meeting fees are valued at the closing price of ArvinMeritor Common Stock on the New York Stock Exchange – Composite Transactions reporting system (the “NYSE Closing Price”) on the date the fee payment would otherwise be made in cash. In fiscal year 2009, no director deferred cash payments to a later date (although one director received cash payments due to prior deferrals), and no directors elected to receive restricted shares or restricted share units in lieu of cash payments.
118
Compensation and Management Development Committee. The four members of the Compensation and Management Development Committee (the “Compensation Committee”), William R. Newlin (chair), David W. Devonshire, Ivor J. Evans and James E. Marley, are non-employee directors who meet the criteria for independence specified in the listing standards of the New York Stock Exchange and are not eligible to participate in any of the plans or programs that are administered by the Committee.
EXECUTIVE COMPENSATION
COMPENSATION COMMITTEE REPORT
The Compensation and Management Development Committee has reviewed and discussed with management the Compensation Discussion and Analysis required by Item 402(b) of Regulation S-K, and based on such review and discussions, recommended to the Board of Directors that such Compensation Discussion and Analysis be included in herein.
Compensation and Management Development Committee
William R. Newlin, Chairman
David W. Devonshire
Ivor J.
Evans
James E. Marley
COMPENSATION DISCUSSION AND ANALYSIS
The purpose of this section is to provide the information you need to understand our compensation policies and how they relate to the compensation of the Named Executive Officers. The Named Executive Officers are the senior members of management listed or discussed in the detailed compensation tables and other data included in this executive compensation section. You should read this section in conjunction with those tables and other data.
Administration of Executive Compensation Program
The Compensation Committee has overall responsibility for executive compensation, including administration of equity compensation plans. (See Board of Directors and Committees above for information on the Compensation Committee’s members, charter and meetings in fiscal year 2009.) As part of this responsibility, the Compensation Committee evaluates the performance of the Chief Executive Officer and determines his compensation in light of the goals and objectives of the Company and the executive compensation program.
In discharging its duties, the Compensation Committee retains a compensation consultant (the “consultant”), Hewitt Associates L.L.C. The consultant provides information on current compensation trends, develops competitive market data and provides objective recommendations as to design of the compensation program, including the form and mix of award vehicles and the nature and level of performance criteria and targets. The Compensation Committee directly engages the consultant. Management also retains Hewitt Associates L.L.C. to provide actuarial and administrative services with respect to pensions and retiree medical benefits.
The Compensation Committee seeks and considers input from senior management in many of its decisions, and the consultant confers and collaborates with senior management in developing its compensation recommendations. Senior management regularly participates in the Committee’s activities in the following specific respects:
-
The Chief Executive Officer reports to the Compensation Committee with respect to his evaluation of the performance of the Company’s senior executives, including the other Named Executive Officers. Together with the Senior Vice President and General Counsel, who has responsibility for overseeing the Human Resources department, the Chief Executive Officer makes recommendations as to compensation decisions for these individuals, including base salary levels and the amount and mix of incentive awards.
-
The Senior Vice President and General Counsel participates in the development of the compensation program, including formulation of performance objectives and targets for incentive compensation, and oversees its implementation and interpretation, in each case carrying out the direction of the Compensation Committee and the recommendations of the consultant. He also assists the Chairman of the Compensation Committee in developing meeting agenda and oversees preparation and distribution of pre-meeting informational materials on the matters to be considered.
119
-
The Chief Financial Officer is responsible for evaluating the tax, financial and accounting aspects of compensation decisions. He participates in developing financial objectives and targets for performance-based incentive compensation, and oversees calculation of payout and vesting levels, in accordance with plan design and the direction of the Compensation Committee.
Compensation Environment in 2009
As we entered fiscal year 2009, the global recession broadened dramatically and negatively impacted the Company, particularly since our business relies heavily on consumer discretionary spending. In response, the Company aggressively implemented necessary actions to align the business with external realities, including extensive cost reductions and the pay-cuts referenced below. While the Committee felt the Company performed well in view of the economic downturn, and responded aggressively and appropriately to the downturn, the Compensation Committee’s “pay for performance” philosophy (as discussed below) meant that compensation paid (or rather not paid) to the executive officers for 2009 had to reflect the challenging environment. So you will see in the remainder of this executive compensation section that the “pay for performance” philosophy was demonstrated clearly in 2009 through the failure to pay out 2009 performance-based compensation and compensation for performance cycles ending in 2009.
The primary components of ArvinMeritor’s executive compensation program are base salary, annual incentives and long-term incentives (“direct compensation”). The direct compensation paid in cash to the Named Executive Officers who are current executive officers decreased approximately 50-70% in 2009 from their direct cash compensation in 2008 as set forth below:
Direct Cash Compensation in 2009 Compared to 2008
| Non-Equity | ||||||||||||||
| Incentive Plan | ||||||||||||||
| Fiscal | Salary | Bonus | Compensation | Total | ||||||||||
| Name | Year | ($) | ($) | ($) | ($) | |||||||||
| Charles G. McClure, Jr. | 2009 | $ | 1,068,542 | $ | 0 | $ | 0 | $ | 1,068,542 | |||||
| 2008 | 1,120,833 | 0 | 2,743,000 | 3,863,833 | ||||||||||
| Jeffrey A Craig | 2009 | 397,683 | 0 | 0 | 397,683 | |||||||||
| 2008 | 398,833 | 0 | 453,101 | 851,934 | ||||||||||
| Vernon G. Baker, II | 2009 | 464,583 | 0 | 0 | 464,583 | |||||||||
| 2008 | 485,417 | 0 | 611,150 | 1,096,567 | ||||||||||
| Carsten J. Reinhardt | 2009 | 511,042 | 0 | 0 | 511,042 | |||||||||
| 2008 | 520,833 | 25,025 | 738,950 | 1,284,808 | ||||||||||
| James D. Donlon, III | 2009 | 653,948 | 0 | 0 | 653,948 | |||||||||
| 2008 | 696,900 | 0 | 1,017,383 | 1,714,283 | ||||||||||
Executive Compensation Philosophy and Objectives
The Compensation Committee’s compensation philosophy is to “pay for performance.” The fundamental objectives of the Company’s executive compensation program are: (1) to attract, retain and motivate the high caliber of executives necessary for ArvinMeritor’s leadership and growth; (2) to recognize individual and team performance through evaluation of each executive’s effectiveness in meeting strategic and operating plan goals; and (3) to foster the creation of shareowner value through close alignment of the financial interests of executives with those of ArvinMeritor’s shareowners.
The Compensation Committee uses several basic practices and policies to carry out its philosophy and to meet the objectives of ArvinMeritor’s executive compensation program:
-
Competitive Compensation Packages. In order to attract and retain talented individuals, the Compensation Committee designs total compensation packages to be competitive with those of other companies with which ArvinMeritor competes for talent, using benchmarking studies to determine market levels of compensation, as described below.
120
-
Performance-Based Compensation. A significant portion of each Named Executive Officer’s total potential compensation is at risk because it is contingent on achieving strategic and operating plan goals that are intended to improve shareowner return. These goals are established to recognize business group and company performance against specified targets. A significant portion of the target annual compensation of the Named Executive Officers is made up of performance-based compensation, with the remainder comprised of base salary and service-based restricted shares or restricted share units.
-
Equity Awards and Stock Ownership Requirements. A significant portion of incentive compensation for executives is comprised of equity and equity-based awards, or is tied to metrics that reward creation of shareowner value, which is intended to align the interests of the Company’s executives with those of shareowners. In addition, senior executives are required under the Company’s stock ownership guidelines to own a specified number of shares of ArvinMeritor Common Stock.
Market Analysis and Benchmarking
The Compensation Committee assesses the competitiveness of ArvinMeritor’s compensation program, using data and studies compiled and provided by the consultant. The consultant provides a detailed competitive pay study periodically, with limited updates in the intervening years. As part of the assessment process, the Committee compares the amount of each component and the total amount of direct compensation (defined below) for each executive officer with that of other companies in the durable goods manufacturing sector, including companies in the automotive sector, which have executive officer positions comparable to the Company’s and with which the Company may compete for talented executives. The peer group for the competitive analysis in fiscal year 2009 included the following 35 companies (“peer group”):
| AGCO Corporation | ITT Corporation |
| American Axle & Manufacturing Holdings, Inc. | Johnson Controls, Inc. |
| BorgWarner Inc. | Joy Global Inc. |
| Caterpillar Inc. | Kennametal Inc. |
| Cummins Inc. | Lear Corporation |
| Dana Holding Corp. | Modine Manufacturing Company |
| Danaher Corporation | Navistar International Corporation |
| Deere & Company | Oshkosh Corp. |
| Delphi Corporation | PACCAR Inc. |
| Donaldson Co Inc. | Parker-Hannifin Corporation |
| Dover Corporation | Rockwell Automation, Inc. |
| Eaton Corporation | Sauer-Danfoss Inc. |
| Federal-Mogul Corporation | Tenneco Inc. |
| Federal Signal Corporation | Terex Corporation |
| Fleetwood Enterprises, Inc. | The Timken Company |
| Flowserve Corporation | TRW Automotive Holdings Corporation |
| Hayes-Lemmerz International, Inc. | Visteon Corporation |
| Ingersoll-Rand Company Limited |
See “Elements of the ArvinMeritor Compensation Program – Overview and Analysis” below for information on how the Compensation Committee uses this peer group data in setting compensation.
The Compensation Committee (or the Board of Directors, as appropriate) may also consider practices at other companies with respect to other elements of compensation, such as perquisites, retirement plans and health and welfare benefits, in assessing the competitiveness and cost effectiveness of the Company’s programs. Any such studies are done on a case-by-case basis, as needed, and may use a group of comparator companies identified at the time by the consultant or other advisors.
Elements of the ArvinMeritor Compensation Program
Overview and Analysis
As discussed above, the primary components of ArvinMeritor’s executive compensation program are base salary, annual incentives and long-term incentives, referred to herein as “direct compensation”. Each of these components, and the relative levels of equity and non-equity compensation that comprise direct compensation, are generally set in relation to competitive market rates among peer group companies, as described above, with subsequent adjustments to take into account individual performance and characteristics and internal pay equity.
121
-
The Compensation Committee approves variations from peer group revenue-adjusted median, or 50th percentile, base salary levels for some individuals based on their responsibilities, experience, expertise and performance. In addition, when recruiting new executives, base salary is often set at a premium above the median of the peer group, in order to attract outstanding candidates.
-
The Compensation Committee believes that individuals should have an opportunity to earn above-market rewards for superior performance over the longer term. Therefore, while the Committee looks at the median of the peer group in terms of the target long-term incentive award for each position, it identifies a maximum potential payout for each position that would be significantly above-market. The range of potential payouts on long-term incentives is described below, under the heading “Components – Long-Term Incentives.” There is no particular target proportion among these components or between equity and non-equity awards. However, the program contemplates that a significant portion of each executive’s direct compensation is performance-based and therefore is at risk. Performance-based awards, whether in the form of equity or non-equity, are tied to achievement of goals that are intended to improve, or reflect improvements in, shareowner value (see the performance-based awards described under the heading “Components” below).
-
The Compensation Committee divides executive officers into four separate “bands” for the purposes of establishing the levels of annual and long-term incentive awards. A “band” consists of officers in one or more salary grades who are grouped together for incentive compensation purposes and receive the same target incentive awards. These target awards represent a blend of the market rates for the positions within the band. The chief executive officer (Mr. McClure) is in the first band; the business segment heads (Messrs. Reinhardt and, formerly, Mr. Martens) are in the second band; the chief financial officer and the executive vice president (Messrs. Craig and Donlon) are in the third band; and the general counsel (Mr. Baker) is in the fourth band. One purpose of the salary bands is to equalize incentive opportunities for individuals with similar levels of responsibility, regardless of their salary grades. This practice is intended to improve internal pay equity among the officer group. Considerations of internal pay equity among officers are also factored into the consultant’s studies and the market data with respect to direct compensation.
The Committee did not specifically discuss the effect of prior years’ compensation in conjunction with setting 2009 compensation. However, the Committee was aware of the potential value of outstanding long-term incentives, including the likelihood of their payout and vesting (based on achievement of performance objectives to date and on levels of payout and vesting of past awards), and this information was also implicit in the overall plan design used by the consultants in making recommendations for 2009 compensation.
In addition to direct compensation, special hiring or retention incentives have been put in place for certain executives, to motivate them to join the Company or to continue their employment. Executive officers also receive health and welfare benefits and are entitled to participate in the Company’s defined benefit pension plans and savings plans on substantially the same basis as other employees.
Each component of the executive compensation program is discussed below.
Components
Base Salary. The Compensation Committee generally reviews base salaries for executive officers (including the Named Executive Officers) at the beginning of each fiscal year. Annual salary increases, which are generally effective on February 1 of each year but may be effective later, are based on evaluation of each individual’s performance and on his level of pay compared to that for similar positions at peer group companies, as indicated by the consultant’s reports and survey data. In recognition of worsening economic conditions, the Compensation Committee did not award any increases in the base salary of Named Executive officers for fiscal year 2009. On the contrary, in January 2009, the salaries of all executive officers (including the Named Executive Officers) were reduced by 10% as part of the Company’s cost-cutting measures, and the Company match under the qualified savings plan was suspended in February 2009. Salaries were not be reinstated to their former level until November 1, 2009 and the match was not reinstated until November 16, 2009. The Compensation Committee also reviews and adjusts base salaries for executive officers at the time of any promotion or change in responsibilities.
Annual Incentives. The Incentive Compensation Plan, as amended (“ICP”), was last approved by the Company’s shareowners in 2005. The performance goals of the ICP are being submitted to shareowners at the 2010 annual meeting for the purposes of 162(m) of the Internal Revenue Code of 1986, as amended (“IRC”). Under the ICP, executives (including the Named Executive Officers) can earn annual bonuses based on Company and/or business segment performance against goals established by the Compensation Committee at the beginning of the fiscal year.
122
The annual incentive goals for fiscal year 2009 were based on the levels of EBITDA and free cash flow from continuing operations that are achieved for the year, measured against target levels specified in the Company’s annual operating plan (“AOP”). These two components (EBITDA and free cash flow) are equally weighted for the purposes of potential annual incentives. EBITDA is defined as earnings before interest, taxes, depreciation and amortization, and free cash flow is defined as net cash provided by operating activities minus capital expenditures. The Compensation Committee chose these measures because they are commonly used by the investment community to analyze operating performance and entity valuation and, as such, they are factors in the value of shareowners’ investment in the Company. The EBITDA and free cash flow targets are tied to the AOP, rather than to prior periods’ results, to provide incentives that are primarily driven by actual performance and not by the effect of industry cycles. On a Company-wide basis, our 2009 annual operating performance target for EBITDA was $304 million and target free cash flow was $25 million (including for this purpose the Wheels business, but excluding the remainder of our Light Vehicle Systems business). The target EBITDA for the Light Vehicle Systems business segment (excluding the Wheels business) was $79 million and target free cash flow was $(9) million.
The Compensation Committee also established target awards, stated as a percentage of base salary, for key employees, including the Named Executive Officers. The percentage applicable to a Named Executive Officer, and other executive officers, is determined by his salary band (as discussed above under “Overview and Analysis”). Based on these salary bands, target awards for fiscal year 2009 were 100% of base salary for Mr. McClure; 65% for Messrs. Craig, Donlon and Reinhardt; and 55% for Mr. Baker. See the table under the heading Grants of Plan-Based Awards for information on the target and maximum awards for each Named Executive Officer for fiscal year 2009.
To determine the amounts that are paid as bonuses, performance is measured against AOP goals for each of the applicable components of the award calculation. No payouts are made with respect to any part of the calculation in which performance is less than 70% of AOP goals. For each part of the calculation for which performance exceeds that threshold, the portion of an individual’s target award that is paid out is dependent on, and increases with, the percentage of the AOP goal that is achieved. The calculated award for an individual cannot exceed 200% of his target award. The following chart summarizes payout calculations for each portion of the incentive payment:
| Performance as a Percentage of | Payout as a Percentage | |||
| Annual Operating Plan | of Target | |||
| Threshold for Payment | 70% | 25 | % | |
| 80 | 50 | |||
| 90 | 75 | |||
| Target Payment | 100 | 100 | ||
| 110 | 150 | |||
| Maximum Payment | 120 or higher | 200 | ||
The Committee also has discretion to adjust any award (either upward or downward +/- 50%), or to make an additional award, to reflect individual performance or special achievements. However, any discretionary increase in an award, or special award, to a Named Executive Officer could have tax consequences under Section 162(m) of the IRC, as described below. Under the terms of the Company’s Deferred Compensation Plan, an executive may elect to defer receipt of all or a portion of payouts of his annual incentive bonus. Deferred bonuses accrue interest during the deferral period and are paid out either in a lump sum or in not more than ten annual installments, as elected by the executive, beginning the January after termination of employment.
For fiscal year 2009, the Company achieved less than 70% of the performance targets discussed above. Accordingly, no annual incentive bonus payouts were made to the Named Executive Officers for fiscal year 2009.
Long-Term Incentives
Overview. The Compensation Committee provides long-term incentives to key employees, including the Named Executive Officers, which are tied to various performance or service objectives over three-year cycles. Each year, the Compensation Committee considers the types of award vehicles to be used and the performance or service objectives and targets on which payout of each type of award depends. The Company has used a number of long-term incentive plans for awards in the past, including the Company’s 1997 Long-Term Incentives Plan, as amended (“1997 LTIP”), the Stock Benefit Plan, as amended, and the 2007 Long-Term Incentive Plan (the “2007 LTIP”). The Company’s shareowners approved the 2007 LTIP in 2007 to govern awards going forward. As insufficient shares remain available under this plan, a new 2010 long-term incentive plan is being proposed for shareowner approval at the 2010 annual meeting.
The Compensation Committee selects the types and mix of awards for long-term incentives each year after reviewing the consultant’s report and survey data on peer group compensation, market practices, shares available for grant under the Company’s long-term incentive plans, and goals to be achieved. The Compensation Committee has used a combination of three types of awards in the past three years, as described below. Each type of award is either equity-based or is tied to metrics that reward creation of shareowner value, which is intended to align management’s interests with those of shareowners.
123
-
Performance Shares. Performance shares are units valued by reference to a designated number of shares of Common Stock. For years in which performance shares are granted, the Compensation Committee grants a target number of performance shares and establishes performance objectives that, for recent grants, have been based on the Company’s return on invested capital (“ROIC”) over a three-year performance period. ROIC is defined to mean the sum of the Company’s net income for the three fiscal years in the performance cycle (before cumulative effect of accounting changes, gains and losses on sale of businesses, minority interest, tax-effected interest expense and tax-effected restructuring expense) divided by the sum of the average invested capital (total debt, including preferred capital securities, minority interests and shareowners’ equity) for the three fiscal years in the performance period. The Compensation Committee selected this performance measure because ROIC improvement was a key corporate focus, which was communicated to investors and analysts on a regular basis. Improvements in ROIC are believed to help the Company achieve higher margins, stronger cash flow and debt reduction. Performance shares were part of the long-term incentive awards for the 2007-2009 three year performance period, but have not been part of the long-term incentive awards since then.
Participants may earn awards at the end of the three-year performance period based on actual performance against target levels of ROIC. Award payments can vary from 0% to 200% of the target award of shares, and no awards will be earned unless the Company’s return on invested capital is at least a stated threshold percentage over the period. No dividends or dividend equivalents are paid or accrued prior to payout of the performance shares. The value of the earned award may be paid out in the form of Common Stock, cash or any combination thereof, in the discretion of the Compensation Committee.
The following chart summarizes the potential payouts at different levels of ROIC for grants made for the 2007 – 2009 performance period:
| 2009 | % of Award Earned and Paid Out | |||
| Threshold for Payout | 10% | 50 | % | |
| Target Payout | 12.5% | 100 | % | |
| Maximum Payout | 15% or higher | 200 | % | |
The threshold for payout was not met for the 2007 - 2009 performance period and all performance shares were forfeited.
-
Awards under Cash Performance Plans. When the Compensation Committee establishes a performance plan, it designates a three-year performance period and establishes performance objectives for the plan. Objectives for the 2007-2009 performance period were based on the Company’s total shareholder return (“TSR”) over the performance period compared to that of a selected group of other automotive suppliers. TSR is defined to reflect cumulative stock price appreciation plus dividends and is intended to assess the Company’s shareowner value creation relative to other companies in the same industry. Objectives for the 2008 -2010 performance period were based on ROIC. ROIC, as discussed above, is believed to help the Company achieve higher margins, stronger cash flow and debt reduction. For the 2009 – 2011 cash performance plan, the Compensation Committee believed that the global economic recession and uncertainty at the time of setting targets made setting a three year performance target extremely difficult. Accordingly, for 2009 – 2011, the Compensation Committee adopted a three year plan with separate one-year targets determined at the beginning of each fiscal year within the plan. For the 2009 fiscal year, this target was based on ROIC. For fiscal year 2010, this target will be based on EBITDA margins.
The Compensation Committee also establishes target awards, stated as dollar amounts, for each of the Named Executive Officers under each performance cycle. Participants can earn awards at the end of the three-year performance period, which may vary from 0% to 200% of target awards (300% for the 2007 – 2009 period), based on actual performance against specified levels. No awards under this plan may be earned unless the threshold for payout over the period is met as set forth below. The award payments are further multiplied by the percentage change in the price of ArvinMeritor Common Stock over the three-year performance period, which may increase the payment finally awarded up to a maximum of 200% of the original amount or reduce it down to a minimum of 50% of the original amount. This further ties payments to stock price appreciation. No earnings are accrued or paid on these awards. At the discretion of the Compensation Committee, payments may be made wholly or partly by delivering shares of Common Stock valued at the fair market value on the last trading day of the week preceding the day the Compensation Committee determines to make payments in the form of shares.
124
The following chart summarizes the potential payouts at different levels of performance of the applicable objective:
2007 – 2009 Performance Period1
| Range of Possible | |||||||
| TSR Relative to the | Percentage of Target | Percentages Earned After | |||||
| Comparator Group over | Award Earned | Giving Effect to Stock | |||||
| the Performance Period | and Paid Out | Price Multiplier | |||||
| Threshold for Payout | 35th percentile | 25 | % | 12.5 – 50 | % | ||
| Target Payout | 50th percentile | 100 | % | 50 – 200 | % | ||
| 75th percentile | 200 | % | 100 – 400 | % | |||
| Maximum Payout | 90th percentile or higher | 300 | % | 150 – 600 | % | ||
| 1 | The threshold for payout was not met and no payout under the long-term incentive cash performance plan was made for this performance period. |
2008 – 2010 Performance Period
| Range of Possible | |||||||
| Percentages Earned After | |||||||
| ROIC over Performance Period | % of Award Earned | Giving Effect to Stock Price | |||||
| ending September 30, 2010 | and Paid Out | Multiplier | |||||
| Threshold for Payout | 8% | 50 | % | 25 – 100 | % | ||
| Target Payout | 10.5% | 100 | % | 50 – 200 | % | ||
| Maximum Payout | 13% or higher | 200 | % | 100 – 400 | % | ||
2009 Portion of 2009 – 2011 Performance Period
| Range of Possible | ||||||
| Percentages Earned After | ||||||
| % of Award Earned | Giving Effect to Stock Price | |||||
| ROIC for Fiscal Year 2009 | and Paid Out | Multiplier | ||||
| Threshold for Payout | 3.5% | 50 | % | 25 – 100% | ||
| Target Payout | 5% | 100 | % | 50 – 200% | ||
| Maximum Payout | 6.5% or higher | 200 | % | 100 – 400% | ||
-
Restricted Shares or Restricted Share Units. The Compensation Committee grants restricted shares of Common Stock or restricted share units that are subject to forfeiture if the grantee does not continue as an employee of ArvinMeritor or a subsidiary or affiliate for a restricted period of at least three years (subject to certain exceptions in the event of death, disability or retirement). The period under which an employee receives severance is included for the purposes of vesting. Restricted shares have all the attributes of outstanding shares during the restricted period, including voting and dividend rights, except that the shares are held by the Company and cannot be transferred by the grantee. Cash dividends during the restricted period are reinvested in additional restricted shares of Common Stock, which will vest or be forfeited at the same time as the underlying shares. Restricted share units represent the right to receive one share of common stock upon the vesting date, subject to terms and conditions. Dividends during the restricted period are not paid or accrued on restricted share units.
The amount of the target award under cash incentive plans, and the number of any performance and restricted shares awarded to each Named Executive Officer, is determined based on his salary band, as described above under “Overview and Analysis.”
Fiscal Year 2009 Payouts. The Compensation Committee provided long-term incentives to the Named Executive Officers under the 1997 LTIP in the form of grants of performance shares and restricted shares of Common Stock and target awards under a three-year cash performance plan for the period ended September 30, 2009. Each type of equity grant represented one-fourth and the cash performance plan represented one-half of the total value of the long-term incentive opportunity awarded to the individual in that year, based on an assumed share price of $15 per share. The allocation among the three types of grants was intended primarily to award achievement of performance objectives, but also to reward continued employment, without regard for performance levels, during a difficult period in the automotive industry.
125
In view of the economic downturn and global financial crisis, the Company failed to achieve key operational objectives for the three year period ending September 30, 2009 as follows:
-
Performance Shares. The Compensation Committee reviewed the Company’s ROIC over the performance period and determined that it did not meet the threshold level necessary for a payout of performance shares. Accordingly, the target grant of performance shares was forfeited.
-
Cash Performance Plans. The Compensation Committee reviewed the Company’s TSR for the performance period compared to those of the comparator group, and determined that it did not meet the threshold level necessary for a payout. Accordingly, no cash payout was made for the performance period.
While the Committee felt the Company performed well in view of the economic downturn, and responded aggressively and appropriately to the downturn, the Committee’s actions were consistent with our highly results-oriented compensation strategy. The component of the long-term incentive program rewarding continued employment was paid out as follows:
-
Restricted Shares. The restricted shares of Common Stock awarded to the Named Executive Officers in fiscal year 2007 vested on December 1, 2009 for each of the Named Executive Officers who continued to be employed on that date. Pursuant to the terms of the grant, cash dividends on these restricted shares during the restricted period which were reinvested in additional restricted shares of Common Stock vested at the same time as the underlying shares.
Fiscal Year 2009 Awards. In fiscal year 2009, long-term incentives were provided to the Named Executive Officers in the form of grants of restricted shares of Common Stock and target awards under cash performance plans, as described below. The equity grant represents one-half, and the cash performance plan represents one-half, of the total value of the long-term incentive opportunity for the individual in that year.
-
Restricted Share Units. The Compensation Committee awarded restricted share units to the Named Executive Officers that will vest upon the grantee’s continued employment with ArvinMeritor through the end of the three year restricted period and be paid out on January 2, 2012. Pursuant to the terms of the grant, dividends are not paid or accrued on these restricted share units during the restricted period. The grant was made based on an assumed share price of $3.88 per share, which was the closing price on the date of grant. The Compensation Committee endeavored to provide the executives with the same value for their long-term incentive equity component as in prior years, despite a dramatically reduced stock price at the time of award. This resulted in larger awards of shares than in past years in order to give comparable value.
-
Cash Performance Plans. The Compensation Committee established a performance plan with a three-year performance period ending September 30, 2011, granted target awards, expressed as cash payments, to the Named Executive Officers and established performance objectives for the first year of the plan based on the Company’s ROIC, as described above. No earnings are accrued or paid on these awards.
See the table under the heading Grants of Plan-Based Awards for information on the specific grants of restricted shares and cash awards under performance plans to each of the Named Executive Officers in fiscal year 2009. See also the narrative under Employment Agreements thereafter for a description of agreements entered into in 2009 with Messrs. Martens and Donlon relating to their termination from the Company.
The Compensation Committee’s practice in recent years with respect to timing of annual equity-based awards has been to establish December 1 as the standard grant date, whenever possible. In the two most recent fiscal years, however, long-term incentive grants for the three year cycles were not approved by the Compensation Committee until a special meeting in December. Accordingly, all equity-based long-term incentive awards for these cycles were granted at the Compensation Committee’s December meeting and effective on the following January 2. The timing of the grant date does not impact the terms of the grant of restricted shares or performance shares. However, under the FASB’s compensation guidance, the Company measures the fair value of stock-based awards, which is recognized in the Company’s financial statements, based on the market value of the Common Stock on the grant date. The purpose of establishing a standard grant date for the Company’s annual grant of equity-based long-term incentive awards is to avoid any issue of whether a grant precedes or follows public disclosure of material information. The Company normally announces its fiscal year earnings in mid-November, and use of December 1, or January 2, as the case may be, as a standard grant date provides the market sufficient time to absorb and reflect the information, whether positive or negative, prior to measurement of fair value for accounting purposes.
Annual equity-based awards in the fiscal year 2010 were granted as of December 1, 2009 under the 2010 Long Term Incentive Plan, which is being proposed for shareowner approval at the Annual Meeting. These grants were made subject to shareholder approval and will be forfeited if the plan is not approved by the shareowners.
126
Pension and Retirement Plans. The Company maintains a tax-qualified defined contribution savings plan, as well as a supplemental savings plan that provides for contributions without regard to the limitations imposed by the IRC on qualified defined contribution plans. All of the Named Executive Officers may participate in the Company’s qualified and supplemental savings plans on the same basis as other eligible employees.
Under the qualified savings plan, a participant can defer up to 20% of his eligible pay, on a before-tax or after-tax basis, subject to annual IRC limits, and the Company matches deferrals at the rate of 100% on the first 3% and 50% on the next 3% of eligible pay. This match was temporarily suspended from February 1, 2009 through November 16, 2009 due to worsening economic conditions. “Eligible pay” includes base salary and annual bonus under the ICP. If an executive elects to participate in the supplemental savings plan, he can continue to contribute on a before-tax basis, even though his qualified savings plan contributions or his eligible pay have reached the annual IRC limits. Both participant contributions and Company matching contributions to the qualified and supplemental savings plans are always 100% vested.
The Named Executive Officers participate in both the qualified and supplemental savings plans. Employee contributions made by Named Executive Officers to the savings plans in fiscal year 2009 are included in the column headed “Salary”, and the Company’s matching contributions are included in the column headed “All Other Compensation,” in each case in the table under Summary Compensation Table below.
The Company maintains a tax-qualified, non-contributory defined benefit pension plan that covers eligible employees hired before October 1, 2005, and a supplemental pension plan that provides benefits to the participants without regard to the limitations imposed by the IRC on qualified pension plans. Messrs. McClure, Donlon and Baker participate in these plans on the same basis as other employees, except that, pursuant to the terms of his original employment agreement, Mr. McClure earned two years of pension service for each year he was employed through December 31, 2007 when his benefit under this defined benefit plan was frozen. The present value of accumulated pension benefits for these Named Executive Officers is reported in the table under the heading Pension Benefits below.
Employees hired on or after October 1, 2005, including Messrs. Craig and Reinhardt, are not eligible to participate in the defined benefit pension plans, and the Company instead makes additional contributions each year (ranging from 2% to 4% of base salary plus annual bonus, depending on age) to their accounts in the Company’s qualified and supplemental savings plans. The amounts contributed by the Company to the savings plans on behalf of Messrs. Craig and Reinhardt as pension contributions are included in the column headed “All Other Compensation” in the table under Summary Compensation Table below.
Benefits under the Company’s defined benefit pension plans were frozen, beginning January 1, 2008, and replaced with additional annual Company contributions (ranging from 2% to 4% of base salary plus annual bonus, depending on age) to the savings plans and supplemental savings plans for the accounts of eligible employees, including Messrs. McClure, Baker and Donlon. See Pension Benefits below for further information on this change. In order to compensate Mr. McClure for the elimination of the special service credit under the defined benefit program, the Compensation Committee approved additional defined contributions to the supplemental savings plan on his behalf in an amount equal to five times what he would otherwise be entitled to receive.
Perquisites. In fiscal year 2006, the Compensation Committee determined to phase out most perquisite programs (including company cars, club memberships, and reimbursement for financial services) and related gross-ups for payment of income taxes, and replace them with uniform cash payments (see the column headed “All Other Compensation” in the table under Summary Compensation Table below). As a result, the only perquisites that were received by the Named Executive Officers in fiscal year 2009 were: (a) Company-paid executive physicals for Messrs. McClure, Baker and Martens; (b) Company-paid excess liability insurance policies for officers; and (c) very limited spousal travel (i.e. accompanying the Named Executive officer on business-related travel), each as reported under the column headed “All Other Compensation” and the related footnote in the table under Summary Compensation Table below.
Health and Welfare Benefits. The Company maintains health and welfare benefits, including medical, dental, vision, disability and life insurance programs, and the Named Executive Officers are entitled to participate in these programs on the same basis as other employees. Providing these benefits is necessary for the Company to remain competitive with other employers.
Employment Agreements and Retention Awards. The Compensation Committee believes it is appropriate to enter into agreements with executive officers relating to certain terms of their employment (including the effects of termination without cause), and in some cases to make special retention awards of service-based restricted shares of Common Stock. The purpose of these agreements and awards is to provide incentives to attract candidates for officer positions and to motivate key individuals to continue their services. The current employment agreements with the Named Executive Officers are described below under the heading Employment Agreements. Special retention awards of restricted shares of Common Stock made to the Named Executive Officers are reported in the table under Outstanding Equity Awards at Fiscal Year-End 2009.
127
Stock Ownership Guidelines
As noted above, alignment of the financial interests of ArvinMeritor’s key executives with those of its shareowners is a fundamental objective of the Compensation Committee’s program and helps to carry out its “pay for performance” philosophy. Accordingly, it has set minimum ownership guidelines that require each officer and other executive to own the following number of shares of ArvinMeritor Common Stock:
| Minimum Number of Shares Owned | |||||
| · | Chief Executive Officer | 250,000 | |||
| · | Business Presidents and Executive Vice President | 75,000 | |||
| · | Other Executive Officers in Salary Grades 25 and above (including the Chief Financial Officer) | 50,000 | |||
| · | Other Executive Officers | 25,000 | |||
| · | Other Executives subject to the guidelines | 10,000 | |||
Shares owned directly (including restricted shares of Common Stock) or through savings plans of ArvinMeritor and restricted share units are considered in determining whether an executive meets the ownership guidelines. Shares subject to unexercised stock options are not considered. The ownership guidelines provide a transition period during which executives may achieve compliance. In general, this period ends as of the date that is five years after the date the ownership guidelines become applicable to the executive. As of October 31, 2009, all of the Named Executive Officers have satisfied their ownership requirements, taking into account the transition period.
Tax Deductibility of Executive Compensation
Section 162(m) of the IRC generally limits the deductibility of compensation paid to each Named Executive Officer to $1,000,000 per year. An exception to this rule exists for any compensation that is “performance based,” as defined in the IRC. Annual and long-term incentive awards are designed to be “performance based” for purposes of Section 162(m) and would not be subject to the deductibility limit (provided, in the case of awards made under the annual incentive and long-term incentive plan being submitted at this meeting, are approved by the shareowners). However, salaries, service-based restricted shares or restricted share units, special employment and retention incentives, and special annual bonus payments do not qualify as “performance based” compensation for this purpose.
Although the Compensation Committee’s policy is to structure compensation arrangements when possible in a manner that will avoid limits on deductibility, it is not a primary objective of the Company’s compensation program. In the view of the Committee, meeting the objectives stated above is more important than the ability to deduct the compensation for tax purposes.
Cautionary Statement
The information appearing in this Compensation Discussion and Analysis, and elsewhere in this form 10-K, as to performance metrics, objectives and targets relates only to incentives established for the purpose of motivating executives to achieve results that will help to enhance shareowner value. This information is not related to the Company’s expectations of future financial performance, and should not be mistaken for or correlated with any guidance issued by the Company regarding its future earnings, free cash flow or other financial measures.
128
SUMMARY COMPENSATION TABLE
The information set forth below reflects compensation, from all sources, awarded to, earned by or paid to our chief executive officer, chief financial officer, former chief financial officer, and the other three most highly compensated executive officers of the Company (“Named Executive Officers”) for the fiscal years ended September 30, 2007 (except as noted), September 30, 2008 and September 30, 2009. The compensation reported below is for services rendered in all capacities to ArvinMeritor and its subsidiaries.
| Change in | ||||||||||||||||||||||||||
| Pension Value | ||||||||||||||||||||||||||
| and Non- | ||||||||||||||||||||||||||
| Qualified | ||||||||||||||||||||||||||
| Non-Equity | Deferred | |||||||||||||||||||||||||
| Option | Incentive Plan | Compensation | All Other | |||||||||||||||||||||||
| Name and Principal | Fiscal | Salary2 | Bonus3 | Stock Awards4 | Awards5 | Compensation6 | Earnings7 | Compensation8 | Total | |||||||||||||||||
| Position1 | Year | ($) | ($) | ($) | ($) | ($) | ($) | ($) | ($) | |||||||||||||||||
| Charles G. McClure, Jr. | 2009 | $ | 1,068,542 | $ | 0 | $ | 1,784,043 | $ | 475,000 | $ | 0 | $ | 305,741 | $ | 629,953 | $ | 4,263,279 | |||||||||
| Chairman of the | ||||||||||||||||||||||||||
| Board, Chief | 2008 | 1,120,833 | 0 | 1,279,603 | 78,333 | 2,743,000 | 30,633 | 338,789 | 5,591,191 | |||||||||||||||||
| Executive Officer | ||||||||||||||||||||||||||
| and President | 2007 | 1,083,333 | 0 | 1,368,507 | 192,500 | 1,652,000 | 467,312 | 162,517 | 4,926,169 | |||||||||||||||||
| (principal executive | ||||||||||||||||||||||||||
| officer) | ||||||||||||||||||||||||||
| Jeffrey A Craig | 2009 | 397,683 | 0 | 318,119 | 0 | 0 | 0 | 77,336 | 793,138 | |||||||||||||||||
| Senior Vice | ||||||||||||||||||||||||||
| President, Chief | 2008 | 398,833 | 0 | 326,660 | 0 | 453,101 | 0 | 87,570 | 1,266,164 | |||||||||||||||||
| Financial Officer | ||||||||||||||||||||||||||
| (principal financial | ||||||||||||||||||||||||||
| officer) | ||||||||||||||||||||||||||
| Vernon G. Baker, II | 2009 | 464,583 | 0 | 324,676 | 0 | 0 | 118,582 | 91,149 | 998,990 | |||||||||||||||||
| Senior Vice | ||||||||||||||||||||||||||
| President and | 2008 | 485,417 | 0 | 485,451 | 0 | 611,150 | 5,147 | 95,915 | 1,683,080 | |||||||||||||||||
| General Counsel | ||||||||||||||||||||||||||
| 2007 | 454,250 | 75,000 | 467,606 | 9,500 | 395,463 | 96,104 | 91,487 | 1,589,410 | ||||||||||||||||||
| Carsten J. Reinhardt | 2009 | 511,042 | 0 | 872,470 | 0 | 0 | 0 | 97,123 | 1,480,635 | |||||||||||||||||
| Senior Vice | ||||||||||||||||||||||||||
| President and Chief | 2008 | 520,833 | 25,025 | 396,566 | 0 | 738,950 | 0 | 105,464 | 1,786,838 | |||||||||||||||||
| Operating Officer | ||||||||||||||||||||||||||
| 2007 | 500,000 | 0 | 213,163 | 0 | 297,150 | 0 | 330,923 | 1,341,236 | ||||||||||||||||||
| James D. Donlon, III | 2009 | 653,948 | 0 | 661,605 | 0 | 0 | 36,964 | 128,230 | 1,480,747 | |||||||||||||||||
| Executive Vice | ||||||||||||||||||||||||||
| President | 2008 | 696,900 | 0 | 564,482 | 0 | 1,017,383 | 35,122 | 123,951 | 2,437,838 | |||||||||||||||||
| 2007 | 653,500 | 0 | 513,967 | 0 | 663,945 | 178,804 | 90,878 | 2,101,094 | ||||||||||||||||||
| Philip R. Martens | 2009 | 175,000 | 0 | 678,164 | 0 | 0 | 0 | 477,560 | 1,330,724 | |||||||||||||||||
| Former Senior Vice | ||||||||||||||||||||||||||
| President and | 2008 | 570,833 | 0 | 449,519 | 0 | 540,050 | 0 | 130,903 | 1,691,305 | |||||||||||||||||
| President, Light | ||||||||||||||||||||||||||
| Vehicle Systems | 2007 | 550,000 | 0 | 266,115 | 0 | 494,799 | 0 | 95,378 | 1,406,292 | |||||||||||||||||
| 1 |
The table reflects the positions held with ArvinMeritor at September 30, 2009. Prior to May 2008, Mr. Donlon served as Executive Vice President and Chief Financial Officer and Mr. Craig served as Senior Vice President and Controller. Mr. Craig was not a Named Executive Officer in fiscal year 2007. Accordingly, his compensation information for that year is not included. | |
| 2 |
This column includes amounts contributed by the Named Executive Officers to the Company’s tax-qualified 401(k) savings plan and the related nonqualified supplemental savings plan (see Non-qualified Deferred Compensation below). | |
| 3 |
This column includes special awards made to Mr. Reinhardt and Mr. Baker, respectively, in recognition of a special achievement during the fiscal year. See Compensation Discussion and Analysis above. | |
| 4 |
This column includes the amount of compensation cost that was recognized for financial reporting purposes for fiscal year 2007, 2008 and 2009 for performance shares and restricted shares of Common Stock, in accordance with the FASB’s compensation guidance. These amounts include costs with respect to awards made in the current and prior fiscal years, adjusted to eliminate estimates of forfeitures related to service-based vesting conditions. A portion of the performance shares granted in fiscal years 2005 and 2006, representing 22% and 43%, respectively, of each target award, was forfeited after the end of the three-year performance period. All of the performance shares granted in fiscal year 2007 (which would have been payable in 2009 had performance targets been met) were forfeited. These forfeitures are not reflected in the amount reported in this column. See Grants of Plan-Based Awards and Outstanding Equity Awards at Fiscal Year-End 2009 below for further information. Information on the assumptions used in valuation of the grants is included in Note 19 of the Notes to Consolidated Financial Statements in this Form 10-K. These amounts may not reflect the actual value realized upon vesting or settlement. | |
| 5 |
In accordance with the FASB’s compensation guidance, the Company recognizes compensation cost with respect to the unvested portion of stock options. All stock options issued by the Company vest over a three year period. Information on the assumptions used in valuation of the grants is included in Note 19 of the Notes to Consolidated Financial Statements in this Form 10-K. These amounts may not reflect the actual value realized upon exercise, if any. | |
129
| 6 |
This column includes cash payouts under (a) a cash performance plan established pursuant to the 1997 LTIP with respect to three-year performance periods ended September 30, 2007 and 2008, and (b) the ICP with respect to annual bonuses for fiscal year 2007 and 2008, in the amounts set forth below. There were no cash payouts under any long term incentive plan with respect to the three-year performance period ended September 30, 2009 or under the ICP with respect to annual bonuses for fiscal year 2009. |
| Name | 2008 LTIP Payout | 2008 ICP Payout | ||||
| Charles G. McClure, Jr. | $ | 1,144,500 | $ | 1,598,500 | ||
| Jeffrey A. Craig | 125,895 | 327,206 | ||||
| Vernon G. Baker, II | 228,900 | 382,250 | ||||
| Philip R. Martens | 267,050 | 273,000 | ||||
| Carsten J. Reinhardt | 267,050 | 471,900 | ||||
| James D. Donlon, III | 381,500 | 635,883 | ||||
| Name | 2007 LTIP Payout | 2007 ICP Payout | ||||
| Charles G. McClure, Jr. | $ | 1,245,000 | $ | 407,000 | ||
| Vernon G. Baker, II | 298,800 | 96,663 | ||||
| Philip R. Martens | 174,300 | 320,499 | ||||
| Carsten J. Reinhardt | 174,300 | 122,850 | ||||
| James D. Donlon, III | 498,000 | 165,945 | ||||
|
No earnings were paid or accrued on outstanding awards during the fiscal year. All payouts were in the form of cash. (See Compensation Discussion and Analysis above and Grants of Plan-Based Awards below for information on long-term incentive target awards made in fiscal year 2009 for the three-year performance period ending in fiscal year 2011 and annual bonus targets for fiscal year 2009.) | ||
| 7 |
This column includes the change in actuarial present value of accumulated pension benefits of the Named Executive Officers under all defined benefit pension plans accrued during the period between the pension plan measurement dates used for financial statement reporting purposes for the reported fiscal year and the prior year. The amounts used for 2008 and 2007 were based on a measurement date of June 30. Effective as of September 30, 2009, the Company changed its measurement date for accounting purposes from June 30 to September 30. As a result, the amounts for fiscal year 2009 were measured as of September 30, 2009, and the net increase in the present value of accrued benefits has been pro-rated by 12/15ths to account for 15 months of benefit growth from the prior fiscal year's information. See the Pension Benefits table that follows for additional information. There were no above-market or preferential earnings on compensation that was deferred on a basis that is not tax-qualified during the fiscal year for the Named Executive Officers. See Pension Benefits below for information on years of service and accumulated pension benefits for Messrs. McClure, Donlon and Baker under the Company’s tax-qualified and non-qualified defined benefit retirement plans. Messrs. Craig, Martens and Reinhardt are not eligible to participate in these plans. | |
| 8 |
This column includes the following amounts for 2009: (a) amounts contributed by the company to the accounts of the Named Executive Officers under the employee savings plan and related supplemental savings plan, including additional amounts contributed in lieu of participation in the Company’s defined benefit retirement plans (see Pension Benefits below); (b) cash allowances in lieu of perquisites (see Compensation Discussion and Analysis – Elements of the ArvinMeritor Compensation Program – Components – Perquisites above); (c) the value of perquisites; (d) any amounts reimbursed to the Named Executive Officers for the payment of income taxes on the value of perquisites (“gross-ups”); (e) in the case of Mr. Martens, severance and (f) dividends on unvested restricted shares that were not factored into the grant date fair value reported in the table under the heading Grants of Plan-Based Awards; in each case, in the amounts disclosed in the table below: | |
| Type of Compensation | McClure | Craig | Baker | Martens | Reinhardt | Donlon | ||||||||||||
| Employer savings plan contributions | $ | 555,699 | $ | 42,811 | $ | 54,247 | $ | 33,600 | $ | 60,748 | 90,355 | |||||||
| Cash allowances in lieu of perquisites | $ | 34,000 | $ | 27,000 | $ | 27,000 | $ | 7,875 | $ | 27,000 | 27,000 | |||||||
| Perquisites*: | ||||||||||||||||||
| · Group excess liability insurance premium | $ | 2,475 | 825 | 825 | 825 | 825 | 825 | |||||||||||
| · Spousal travel | 1,261 | 0 | 32 | 00 | 0 | 0 | ||||||||||||
| · Company-paid physical examination | 418 | 0 | 1,095 | 210 | 0 | 0 | ||||||||||||
| Total perquisites | $ | 593,853 | $ | 70,636 | $ | 83,199 | $ | 42,510 | $ | 88,573 | 118,180 | |||||||
| Severance Payment | 0 | 0 | 0 | 425,000 | 0 | 0 | ||||||||||||
| Gross-ups | $ | 0 | $ | 0 | $ | 0 | $ | 0 | $ | 0 | 0 | |||||||
| Dividends on unvested restricted shares | $ | 36,100 | $ | 6,700 | $ | 7,950 | $ | 10,050 | $ | 8,550 | 10,050 | |||||||
| * |
“Spousal travel” involves spouses accompanying Named Executive Officers on business-related trips. If a commercial flight is used, then this is valued at the actual cost of the airfare. In the case of a charter aircraft already flying to the same destination for a business purpose, only the direct variable costs associated with the additional passenger (for example, catering) are included in determining the aggregate cost of the use to the Company. Each other perquisite is valued at its actual cost to the Company. The Compensation Committee has determined to phase out most perquisite programs and related gross-ups. See Compensation Discussion and Analysis above. |
130
GRANTS OF PLAN-BASED AWARDS
The Compensation Committee made the following grants to the Named Executive Officers under the ICP and the 2007 LTIP in fiscal year 2009. No consideration was paid by the Named Executive Officers for these awards. No ICP payouts for fiscal year 2009 were made as the performance targets necessary for a payout were not met.
| Date of | Estimated Future Payouts Under Non- | Grant Date Fair | |||||||||||||||||
| Compensation | Equity Incentive Plan Awards1 | All Other | Value of Stock | ||||||||||||||||
| Plan | Grant | Committee | Threshold | Target | Maximum | Stock Awards | and Option | ||||||||||||
| Name | Name | Date | Action | Type of Award | ($) | ($) | ($) | (# of shares)2 | Awards3 | ||||||||||
| Charles G. McClure, Jr. | 2007 | 1/02/09 | 12/05/08 | Restricted Share units | 387,000 | 1,087,470 | |||||||||||||
| LTIP | |||||||||||||||||||
| 2007 | Cash performance plan targets | 0 | 1,500,000 | 3,000,000 | |||||||||||||||
| LTIP | |||||||||||||||||||
| ICP | Annual incentive plan targets | 0 | 1,035,000 | 2,070,000 | |||||||||||||||
| Jeffrey A Craig | 2007 | 1/02/09 | 12/05/08 | Restricted share units | 129,000 | 362,490 | |||||||||||||
| LTIP | |||||||||||||||||||
| 2007 | Cash performance plan targets | 0 | 500,000 | 1,000,000 | |||||||||||||||
| LTIP | |||||||||||||||||||
| ICP | Annual incentive plan targets | 0 | 250,380 | 500,760 | |||||||||||||||
| Vernon G. Baker, II | 2007 LTIP | 1/02/09 | 12/05/08 | Restricted share units | 77,000 | 216,370 | |||||||||||||
| 2007 LTIP | Cash performance plan targets | 0 | 300,000 | 600,000 | |||||||||||||||
| ICP | Annual incentive plan targets | 0 | 247,500 | 495,000 | |||||||||||||||
| Carsten J. Reinhardt | 2007 LTIP | 1/02/09 | 12/05/08 | Restricted share units | 155,000 | 435,550 | |||||||||||||
| 2007 LTIP | Cash performance plan targets | 0 | 600,000 | 1,200,000 | |||||||||||||||
| ICP | Annual incentive plan targets | 0 | 321,750 | 643,500 | |||||||||||||||
| James D. Donlon, III | 2007 LTIP | 9/14/09 | 9/14/09 | Restricted shares | 129,000 | 1,168,740 | |||||||||||||
| 2007 LTIP | Cash performance plan targets | 0 | 500,000 | 1,000,000 | |||||||||||||||
| ICP | Annual incentive plan targets | 0 | 411,723 | 823,446 | |||||||||||||||
| Philip R. Martens4 | 2007 | Restricted share units | 0 | 0 | 0 | ||||||||||||||
| LTIP | |||||||||||||||||||
| 2007 | Cash performance plan targets | 0 | 0 | 0 | |||||||||||||||
| LTIP | |||||||||||||||||||
| ICP | Annual incentive plan targets | 0 | 175,000 | 350,000 | |||||||||||||||
131
____________________
| 1 |
These columns include target amounts for awards under three-year cash performance plans established pursuant to the 2007 LTIP, and target amounts for annual incentive awards under the ICP. Potential payout amounts for target and maximum performance are expressed as dollar amounts and, in the case of 2007 LTIP cash performance plans, are stated before application of the stock price change multiplier. Awards may, at the discretion of the Compensation Committee, be paid out in the form of shares of Common Stock, with the number of shares determined based on the market price at the time of payout. See Compensation Discussion and Analysis above for further information on the terms of ICP and 2007 LTIP awards in fiscal year 2009. No actual ICP payouts for fiscal year 2009 were made as the performance targets necessary for a payout were not met. | |
| 2 |
This column includes grants of service-based restricted share units or, in the case of Mr. Donlon, service-based restricted shares (see Compensation Discussion and Analysis above). | |
| 3 |
This column includes the grant date fair value of restricted shares of Common Stock and options granted in fiscal year 2009, computed in accordance with the FASB’s compensation guidance. Information on the assumptions used in valuation of the grants is included in Note 19 of the Notes to Consolidated Financial Statements in the Form 10-K, which is incorporated herein by reference. The value of dividends on restricted stock is not reflected in this calculation, and the amount of dividends paid on restricted shares in fiscal year 2009 is included in the column headed “All Other Compensation” in the table under Summary Compensation Table above. | |
Employment Agreements
2009 Officer Employment Letters. The officers of the Company (with the exception of Mr. Donlon, as discussed below) entered into employment letters with the Company in fiscal year 2009, which replaced any previous employment letters with such officers. Under the terms of these letters, if the Company terminates the executive’s employment without cause, the executive will receive:
-
any accrued and unpaid compensation;
-
monthly severance pay for a period of 36 months for Mr. McClure, 30 months for each of Messrs. Craig and Reinhardt, and 24 months for Mr. Baker;
-
pro rata participation in the current year annual bonus;
-
pro rata participation in the cash portion of long-term incentive cycles under the terms of the applicable plan (which provide payout for only those existing long-term incentive cycles that began more than a year before the last day employed), based on the portion of the performance cycle that has elapsed as of the last day employed;
-
continuation of health and welfare benefits (other than accidental death and dismemberment (“ADD”) and long-term and short-term disability coverage) throughout the severance period (or until the executive becomes subsequently employed and covered by the health plan of the new employer);
-
vesting or forfeiture of special grants of service-based restricted shares, performance shares or RSUs as determined under the agreement relating to the grant (which in Mr. Craig’s and Mr. Reinhardt’s case provide for full vesting of those special awards);
-
vesting or forfeiture of all other restricted shares, performance shares or restricted share units based on the terms of the applicable plans, which provide for vesting based on the portion of the restricted period that has elapsed as of the end of the severance period for restricted shares or restricted share units and forfeiture for performance shares; and
-
outplacement services for twelve months not to exceed $10,000.
The 2009 officer employment letters also provide for vesting in accordance with the terms of the applicable plans for all equity grants in the event of a Change in Control (as defined in those plans) as well as the severance benefits described above if a separation of service results from a Change in Control or within one year thereafter (provided the full target amount of annual bonus will be paid in that event rather than a pro rata portion). The 2009 officer employment agreements also provide for payments in the event of death and disability which are comparable to those provided under prior agreements. These are described further under Potential Payments Upon Termination or Change in Control below.
132
Mr. Donlon Termination Agreement
Effective as of September 15, 2009, the Company entered into an agreement with Mr. Donlon regarding his continued employment and termination of employment, which supersedes his earlier agreement. The agreement provides that Mr. Donlon will continue to be employed through January 16, 2010 (the “Termination Date”). Upon termination of his employment on the Termination Date, Mr. Donlon will receive:
-
monthly severance pay equal to $58,650 per month for a period of 24 months, which will be paid in equal semi-monthly installments;
-
continued health and certain other benefit coverage through the severance period (although with respect to health, such coverage will terminate if he subsequently becomes covered by a health plan of a new employer);
-
full vesting on January 16, 2010 of all of his outstanding restricted shares;
-
continued eligibility for a pro rated annual incentive award for 2010 (at his current target award of 65% of his base salary) based on time actually worked, payable in accordance with the terms of the Company’s annual incentive compensation plan;
-
continued eligibility for a target cash award, if any, of $500,000 under the Company’s long term incentive plan for the fiscal year 2007-2009, 2008-2010 and 2009-2011 cycles, in accordance with the terms of such plan, subject to approval of the Committee; and
-
outplacement assistance for twelve months not to exceed $10,000.
Mr. Donlon’s agreement also provides for vesting in accordance with the terms of the applicable plans for all equity grants in the event of a Change in Control (as defined in those plans) as well as the severance benefits described above if a separation of service results from a Change in Control or within one year thereafter (provided the full target amount of annual bonus will be paid in that event rather than a pro rata portion). The 2009 Agreement also provides for payments in the event of death and disability which are comparable to those provided for under the prior agreement with Mr. Donlon.
The terms of these agreements are subject to modification to the extent necessary to comply with the requirements of Section 409A of the Internal Revenue Code relating to deferred compensation.
Mr. Martens Termination Agreement
The Company entered into a termination agreement with Mr. Martens on January 21, 2009 that provided for the termination of his employment effective January 15, 2009 and the following benefits:
-
monthly severance pay equal to $50,000 per month for a period of 30 months, which will be paid in equal semi-monthly installments;
-
continued health and life insurance coverage through a period of 18 months;
-
full vesting on January 27, 2009 of all of his outstanding restricted shares;
-
continued eligibility for a pro rated annual incentive award for 2009 (at his current target award of 65% of his base salary) based on time actually worked, payable in accordance with the terms of the Company’s annual incentive compensation plan;
-
continued eligibility for a target cash award, if any, of $500,000 under the Company’s long term incentive plan for the fiscal year 2007-2009 and 2008-2010 cycles, in accordance with the terms of such plan, subject to approval of the Committee; and
-
outplacement assistance for twelve months not to exceed $10,000.
See Potential Payments Upon Termination or Change in Control below for information on the amounts that would be payable to the Named Executive Officers if their employment had been terminated at the end of fiscal year 2009.
Description of Plan-Based Awards
See Compensation Discussion and Analysis–Elements of the ArvinMeritor Compensation Program–Components–Annual Incentives and –Long-Term Incentives above for information on the types of plan-based awards that were made in fiscal year 2009 and are reported in the table above, the applicable performance objectives, and how payouts are calculated. No annual bonus payments for fiscal year 2009 or payouts for long-term incentive for the performance period ended September 30, 2009 were made because the performance targets necessary for a payout were not met.
133
OUTSTANDING EQUITY AWARDS AT FISCAL YEAR-END 2009
The following unexercised stock options, unvested restricted shares of Common Stock and unvested restricted share units were held by the Named Executive Officers as of September 30, 2009.
| Option Awards | Stock Awards | |||||||||||||||||
| Equity | ||||||||||||||||||
| Equity | Incentive | |||||||||||||||||
| Incentive | Plan Awards: | |||||||||||||||||
| Plan Awards: | Market or | |||||||||||||||||
| Market | Number of | Payout Value | ||||||||||||||||
| Number | Value of | Unearned | of Unearned | |||||||||||||||
| of Shares | Shares or | Shares, Units | Shares, Units | |||||||||||||||
| Number of securities | or Units of | Units of | or Other | or Other | ||||||||||||||
| underlying unexercised | Option | Stock That | Stock That | Rights That | Rights That | |||||||||||||
| options1 | Exercise | Option | Have Not | Have Not | Have Not | Have Not | ||||||||||||
| (#) | Price | Expiration | Vested2 | Vested3 | Vested4 | Vested4 | ||||||||||||
| Name | Exercisable | Unexercisable | ($) | Date | (#) | ($) | (#) | ($) | ||||||||||
| Charles G. McClure, Jr. | 100,000 | 0 | $ | 18.48 | 8/9/2014 | — | — | — | — | |||||||||
| — | — | — | — | — | ||||||||||||||
| — | — | — | — | |||||||||||||||
| 0 | 300,000 | $ | 12.78 | 7/25/18 | ||||||||||||||
| 763,480 | 5,916,970 | |||||||||||||||||
| 0 | 0 | |||||||||||||||||
| Jeffrey A. Craig | — | — | — | — | 192,426 | 1,491,302 | ||||||||||||
| — | — | — | — | 0 | 0 | |||||||||||||
| Vernon G. Baker, II | 33,000 | 0 | 14.81 | 11/10/2010 | ||||||||||||||
| 60,000 | 0 | 19.85 | 1/21/2012 | |||||||||||||||
| 30,000 | 0 | 15.32 | 11/22/2012 | |||||||||||||||
| 30,000 | 0 | 17.94 | 11/17/2013 | |||||||||||||||
| — | — | — | — | 135,130 | 1,047,258 | |||||||||||||
| Carsten J. Reinhardt | — | — | — | — | 241,334 | 1,870,339 | ||||||||||||
| 0 | 0 | |||||||||||||||||
| James D. Donlon, III | — | — | — | — | 203,205 | 1,574,839 | ||||||||||||
| 0 | 0 | |||||||||||||||||
| Philip R. Martens | — | — | — | — | — | — | — | — | ||||||||||
| — | — | — | — | — | — | — | — | |||||||||||
| 1 |
This column includes options granted to the Messrs. McClure and Baker in fiscal year 2004 and earlier, all of which have vested, and a grant to Mr. McClure in July 2008. Other than the grant to Mr. McClure, the Company has not granted stock options to employees since fiscal year 2004, and Messrs. Craig, Donlon, Martens and Reinhardt do not hold any stock options. | |
| 2 |
This column includes the following separate grants of restricted shares of Common Stock or restricted share units that vest upon continuation of employment through the end of the restricted period. The number of shares of restricted stock held as of September 30, 2009 includes the original grant, plus additional shares of restricted stock purchased through reinvestment of dividends (excluding fractional shares). | |
134
| Number of | |||||||||
| Shares | |||||||||
| Held as of | |||||||||
| Name | Type of Grant | Grant Date | Vesting Date | 9/30/09 | |||||
| Charles G. McClure, Jr. | Restricted share units | 1/02/2009 | 1/02/2012 | 387,000 | |||||
| Restricted shares (retention award) | 7/25/2008 | 7/25/2011 | 154,403 | ||||||
| Restricted shares | 1/2/2008 | 1/2/2011 | 163,098 | ||||||
| Restricted shares | 12/1/2006 | 12/1/2009 | 58,979 | ||||||
| Jeffrey A. Craig | Restricted share units | 1/02/09 | 1/02/2012 | 129,000 | |||||
| Restricted shares | 1/2/2008 | 1/2/2011 | 32,411 | ||||||
| Restricted shares (retention award) | 05/01/2006 | One-third on 05/01/2010 And remainder on 5/01/11 |
24,582 | ||||||
| Restricted shares | 12/1/2006 | 12/1/2009 | 6,434 | ||||||
| Vernon G. Baker, II | Restricted share units | 1/02/2009 | 1/02/2012 | 77,000 | |||||
| Restricted shares | 1/2/2008 | 1/2/2011 | 32,411 | ||||||
| Restricted shares( retention award) | 7/25/2005 | 7/25/2010 | 13,923 | ||||||
| Restricted shares | 12/1/2006 | 12/1/2009 | 11,796 | ||||||
| Carsten J. Reinhardt | Restricted share units | 1/2/2009 | 1/2/2012 | 155,000 | |||||
| Restricted shares | 1/2/2008 | 1/2/2011 | 54,366 | ||||||
| Restricted shares (retention award) | 9/11/2006 | One-third on 9/11/2010 And remainder on 9/11/11 |
12,130 | ||||||
| Restricted shares | 12/1/2006 | 12/1/2009 | 19,839 | ||||||
| James D. Donlon, III | Restricted shares | 1/2/2008 | 1/16/2010 | 54,366 | |||||
| Restricted shares | 12/1/2006 | 12/1/2009 | 19,839 | ||||||
| Restricted shares | 9/14/2009 | 1/16/2010 | 129,000 | ||||||
| 3 |
Based on the number of shares held multiplied by the NYSE Closing Price on September 25, 2009 ($7.75 per share), which is the last trading day in the Company’s 2009 fiscal year. | |
| 4 |
Column relates to performance shares that were granted for the three year performance cycle ending September 30, 2009. It was determined following fiscal year end that all of these performance shares would be forfeited as the performance goals for the cycle were not met. Accordingly, zero is shown. See Compensation Discussion and Analysis above for information on the performance objectives with respect to performance shares. The following sets forth each separate grant of performance shares that was forfeited. | |
135
| Target | |||||||||
| Number of | |||||||||
| Shares, | |||||||||
| End of the | All of which were | ||||||||
| Performance | forfeited | ||||||||
| Name | Type of Grant | Grant Date | Period | Following FY End | |||||
| Charles G. McClure, Jr. | Performance shares | 12/1/2006 | 9/30/2009 | 55,000 | |||||
| Jeffrey A. Craig | Performance shares | 12/1/2006 | 9/30/2009 | 6,000 | |||||
| Vernon G. Baker, II | Performance shares | 12/1/2006 | 9/30/2009 | 11,000 | |||||
| Carsten J. Reinhardt | Performance shares | 12/1/2006 | 9/30/2009 | 18,500 | |||||
| James D. Donlon, III | Performance shares | 12/1/2006 | 9/30/2009 | 18,500 | |||||
| Philip R. Martens | Performance shares | 12/1/2006 | 9/30/2009 | 18,500 | |||||
OPTIONS EXERCISED AND STOCK VESTED
The following table includes information with respect to service-based restricted shares of Common Stock held by certain of the Named Executive Officers that vested during the fiscal year ended September 30, 2009. The Named Executive Officers did not exercise any stock options during the 2009 fiscal year.
| Stock Awards | |||||||
| Number of Shares | |||||||
| Acquired on Vesting1 | |||||||
| (#) | Value Realized | ||||||
| Name of | Restricted | Performance | Upon Vesting2 | ||||
| Executive Officer | Shares | Shares | ($) | ||||
| Charles G. McClure, Jr. | 0 | 0 | 0 | ||||
| Jeffrey A. Craig | 8,194 | 0 | 9,833 | ||||
| Vernon G. Baker, II | 13,922 | 0 | 72,394 | ||||
| Carsten J. Reinhardt | 4,043 | 0 | 35,983 | ||||
| James D. Donlon, III | 8,398 | 0 | 7,474 | ||||
| Philip R. Martens | 106,552 | 0 | 210,973 | ||||
| 1 |
The number of shares acquired on vesting of restricted shares includes the number of restricted shares originally granted plus additional shares purchased periodically through reinvestment of quarterly dividends during the restricted period. No performance shares were earned based on the level of the Company’s performance over the three-year performance period ended September 30, 2009 (see Compensation Discussion and Analysis – Elements of the ArvinMeritor Compensation Program – Components - Long-Term Incentives – Fiscal Year 2009 Payouts). | |
| 2 |
The amount in the table is based on the number of shares acquired upon vesting of restricted shares multiplied by the NYSE Closing Price on the date of vesting of restricted shares. If such date is not a trading date, the trading day next preceding the date is used. | |
PENSION BENEFITS
ArvinMeritor has a tax-qualified defined benefit retirement plan covering salaried and non-represented U.S. employees hired prior to October 1, 2005. Sections 401(a)(17) and 415 of the Internal Revenue Code limit the annual benefits that may be paid from a tax-qualified retirement plan. As permitted by the Employee Retirement Income Security Act of 1974, the Company has established a supplemental non-qualified plan that authorizes the payment out of the Company’s general funds of any benefits calculated under provisions of the tax-qualified retirement plan that may be above limits under these sections. Participation in ArvinMeritor’s defined benefit retirement plans was terminated on December 31, 2007 and benefits were frozen as of a specified date, as described below.
136
The following table shows the years of credited service and the actuarial present value of the accumulated benefit under ArvinMeritor’s qualified and nonqualified defined benefit retirement plans for Messrs. McClure, Donlon and Baker as of September 30, 2009 (the pension plan measurement date used for financial statement reporting purposes), assuming retirement at age 62. Effective as of September 30, 2009, the Company changed its measurement date for accounting purposes from June 30 to September 30. No payments were made during the fiscal year ended September 30, 2009. Because they were hired after October 1, 2005, Messrs. Craig, Martens and Reinhardt are not eligible to participate in the defined benefit retirement plans.
| Present Value | |||||||||
| Number of Years | of Accumulated | ||||||||
| Credited Service | Benefit1 | ||||||||
| Name of Executive Officer | Plan Name | (#) | ($) | ||||||
| Charles G. McClure, Jr. | ArvinMeritor Retirement Plan | 7 | 2 | $ | 85,625 | ||||
| ArvinMeritor Supplemental | 7 | 2 | 1,473,528 | ||||||
| Retirement Plan | |||||||||
| Jeffrey A. Craig | ArvinMeritor Retirement Plan | — | — | ||||||
| ArvinMeritor Supplemental | — | — | |||||||
| Retirement Plan | |||||||||
| Vernon G. Baker, II | ArvinMeritor Retirement Plan | 9 | 205,048 | ||||||
| ArvinMeritor Supplemental | 9 | 401,722 | |||||||
| Retirement Plan | |||||||||
| Retirement Plan | |||||||||
| Carsten J. Reinhardt | ArvinMeritor Retirement Plan | — | — | ||||||
| ArvinMeritor Supplemental | — | — | |||||||
| Retirement Plan | |||||||||
| James D. Donlon, III | ArvinMeritor Retirement Plan | 3 | 98,435 | ||||||
| ArvinMeritor Supplemental | 3 | 347,169 | |||||||
| Retirement Plan | |||||||||
| Philip R. Martens | ArvinMeritor Retirement Plan | — | — | ||||||
| ArvinMeritor Supplemental | — | — | |||||||
| 1 |
Information on the valuation method and material assumptions applied in quantifying the present value of the current accrued benefits is included in Note 21 of the Notes to Consolidated Financial Statements in the Form 10-K, which is incorporated herein by reference. | |
| 2 |
Through the date of termination of participation in the defined benefit retirement plans, Mr. McClure earned two years of credited service for each year served, pursuant to the terms of his employment agreement (see Employment Agreements above). The additional credited service increases the amount reported above as actuarial present value of accumulated benefit under the ArvinMeritor Supplemental Retirement Plan by $779,566. | |
The plans provide for annual retirement benefits payable on a straight life annuity basis to participating employees, reduced to reflect the cost of Social Security benefits related to service with the Company. The amount of a participant’s annual benefit generally is calculated as 1.5% of the number that is the average of covered compensation for the highest five consecutive years of the ten years preceding retirement, multiplied by years of service, less the Social Security reduction.
Covered compensation includes base salary for the portion of fiscal year 2008 prior to December 31, 2007 when benefits under this plan were frozen. Covered compensation for fiscal year 2008 was $275,000 for Mr. McClure; $172,500 for Mr. Donlon; and $118,750 for Mr. Baker. The plan credits participants with service earned with ArvinMeritor and its predecessor companies, as applicable. The plan also includes “grandfathering” provisions under which the retirement benefits payable to certain long-term employees will be adjusted in some cases to reflect differences between the benefits earned under the plan and those earned under predecessor plans of Arvin, Meritor or Rockwell.
Participants may generally elect to retire under the plans any time after reaching age 55, with the annual benefit reduced by 6% for each year that the participant receives benefit payments prior to his reaching age 62. As of the last day of fiscal year 2009, only Messrs. Baker, McClure and Donlon were eligible for early retirement under this provision.
In the event of the participant’s death, the plans also provide for the payment of benefits to an employee’s surviving spouse or other beneficiary. The amount of the survivor’s benefit is 60% of the participant’s benefit under the nonqualified plan, and can range from 60% to 100% of the participant’s benefit under the qualified plan, depending on the participant’s election as to benefit payment options.
See Note 21 of the Notes to Consolidated Financial Statements in the Form 10-K for information on the funded status of the qualified plan. The non-qualified plan is currently unfunded.
New non-union employees hired on or after October 1, 2005, including Messrs. Craig, Martens and Reinhardt, are not eligible to participate in the defined benefit retirement plans. In addition, the defined benefit retirement plans were amended, effective December 31, 2007, to provide that benefits were frozen for all participating employees as of specified dates. Most participating employees ceased accruing benefits effective January 1, 2008. Some participating employees, who either have at least 20 years of service or are age 50 or older with at least 10 years of service, will continue to accrue benefits for an additional transition period, ending June 30, 2011. None of the Named Executive Officers qualifies for this transitional accrual period. For those not eligible to participate in, or whose benefits have been frozen under, the defined benefit retirement plan, the Company makes additional defined contributions to the savings plans on behalf of these individuals, with the amount of the contribution depending on the individual’s salary and age.
137
As noted above, Mr. McClure earned two years of credited service under the defined benefit retirement plans for each year served, pursuant to the terms of his employment agreement. The purpose of this additional accrual was to provide Mr. McClure with retirement benefits comparable to those he received at his last employer. To replace this provision when Mr. McClure’s benefit under the defined benefit retirement plan was frozen on December 31, 2007, the Company began making additional defined contributions to the supplemental savings plan on his behalf in an amount equal to five times what he would otherwise be entitled to receive.
NON-QUALIFIED DEFERRED COMPENSATION
The following table reflects contributions made by the Named Executive Officers and the Company to the Company’s non-qualified supplemental savings plan in fiscal year 2009, together with earnings on the accounts of the Named Executive Officers under that plan during the fiscal year.
| Executive | Registrant | Aggregate | Aggregate | Aggregate | |||||||||
| contributions in | contributions in | earnings in | withdrawals/ | balance at last | |||||||||
| last fiscal year1 | last fiscal year2 | last fiscal year3 | distributions | fiscal year end | |||||||||
| Name of Executive Officer | ($) | ($) | ($) | ($) | ($)(4) | ||||||||
| Charles G. McClure, Jr. | $ | 166,674 | 543,027 | 165,431 | 0 | 1,185,441 | |||||||
| Jeffrey A. Craig | 32,458 | 33,936 | 14,175 | 0 | 157,210 | ||||||||
| Vernon G. Baker, II | 58,483 | 43,890 | (75,708 | ) | 0 | 589,798 | |||||||
| Carsten J. Reinhardt | 46,014 | 51,438 | 27,837 | 0 | 201,016 | ||||||||
| James D. Donlon, III | 50,470 | 78,326 | 35,869 | 0 | 386,076 | ||||||||
| Philip R. Martens | 44,800 | 31,725 | (13,298 | ) | 224,851 | 0 | |||||||
| 1 |
The amounts reported in this column are included in the amounts reported in the column headed “Salary” for 2009 under Summary Compensation Table above. | |
| 2 |
The amounts reported in this column are included in the amounts reported in the column headed “All Other Compensation” for 2009 under Summary Compensation Table above. | |
| 3 |
“Earnings” reflects changes in aggregate account value at the end of fiscal year 2009 compared to 2008 that do not result from contributions or distributions, including interest, dividends, appreciation or depreciation in stock price and similar items. None of these earnings are reported in the table under Summary Compensation Table. | |
| 4 |
The amounts reported in this column previously were reported as compensation to the Named Executive Officers in the Summary Compensation Table for previous years. | |
Description of Non-Qualified Supplemental Savings Plan
The ArvinMeritor Supplemental Savings Plan allows certain executives of the Company, including the Named Executive Officers, to defer amounts that cannot be contributed to the tax-qualified 401(k) plan due to deferral and compensation limits imposed by the IRC. Under the 401(k) plan, a participant can defer up to 20% of his eligible pay, on a before-tax or after-tax basis, subject to IRC limits, and the Company matches deferrals at the rate of 100% on the first 3% and 50% on the next 3% of eligible pay (except for the period from February through [November 16], 2009 when such matches were suspended). “Eligible pay” includes base salary and annual bonus under the ICP. If an executive elects to participate in the Supplemental Savings Plan, he can continue to contribute on a before-tax basis, even though his 401(k) plan contributions or his eligible pay have reached the annual IRC limits. Both participant contributions and Company matching contributions to the Supplemental Savings Plan are always 100% vested.
The Company also makes pension contributions to the 401(k) plan for certain employees who are not eligible to participate in the Company’s defined benefit retirement plans, and these contributions would be made to the Supplemental Savings Plan when eligible pay reaches statutory limits. Company pension contributions to the Supplemental Savings Plan vest 20% after two years of employment and 20% each year thereafter, with full vesting occurring after six years of employment.
138
The plan administrator keeps track of contributions under the Supplemental Savings Plan as if they were invested in investment options selected by the participant. These options include a variety of mutual funds and Company Common Stock. Growth of the participant’s account depends on the investment results of the selected mutual funds and/or on the market price of, and the payment of dividends on, Company Common Stock. Earnings for each investment vehicle for fiscal year 2009 were as follows:
| Name of Investment Fund | 2009 Rate of Return | ||||
| T. Rowe Price Prime Reserve Fund | 0.71 | % | |||
| T. Rowe Price Stable Value Fund | 3.89 | % | |||
| PIMCO Total Return Fund | 18.08 | % | |||
| T. Rowe Price Retirement Income Fund | 6.78 | % | |||
| T. Rowe Price Retirement 2005 Fund | 6.10 | % | |||
| T. Rowe Price Retirement 2010 Fund | 5.06 | % | |||
| T. Rowe Price Retirement 2015 Fund | 4.36 | % | |||
| T. Rowe Price Retirement 2020 Fund | 3.46 | % | |||
| T. Rowe Price Retirement 2025 Fund | 2.72 | % | |||
| T. Rowe Price Retirement 2030 Fund | 2.01 | % | |||
| T. Rowe Price Retirement 2035 Fund | 1.56 | % | |||
| T. Rowe Price Retirement 2040 Fund | 1.58 | % | |||
| T. Rowe Price Retirement 2045 Fund | 1.54 | % | |||
| T. Rowe Price Retirement 2050 Fund | 1.58 | % | |||
| T. Rowe Price Retirement 2055 Fund | 1.46 | % | |||
| AllianceBernstein Value Fund | -10.06 | % | |||
| Goldman Sachs Structured International Equity Fund | 2.13 | % | |||
| Lord Abbett Small-Cap Value Series | -7.00 | % | |||
| T. Rowe Price Growth and Income Fund | -4.04 | % | |||
| T. Rowe Price Growth Stock Fund | 0.27 | % | |||
| Vanguard Institutional Index Fund | -6.76 | % | |||
| T. Rowe Price Mid-Cap Growth Fund | 3.63 | % | |||
| ArvinMeritor Common Stock | -37.78 | % | |||
Distributions from the Supplemental Savings Plan are made in cash under one of three options, as elected by the participant: (a) a lump sum payment six months following termination of employment; (b) a lump sum payment at the later of age 55 or six months following termination of employment; or (c) ten annual installments payable on January 1 of each year beginning the year after the later of age 55 or six months after termination of employment.
POTENTIAL PAYMENTS UPON TERMINATION OR CHANGE IN CONTROL
The narrative and tables below describe and quantify potential compensation that could be paid to each of the Named Executive Officers by the Company upon termination of his employment as of September 30, 2009, voluntarily or for cause, without cause, upon a change of control, and upon retirement, death or disability. Except as noted below, the amounts disclosed in the table are based on actual compensation through September 30, 2009 and estimates of future compensation. The actual amounts that could be paid to the Named Executive Officers are subject to a number of variables and can only be determined after occurrence of a termination event. Mr. Martens’ employment with the Company was severed effective January 15, 2009 and accordingly, the table reflects only the amounts actually accrued or paid to him and the discussion below applies to him only with respect to termination without cause and not the other termination events.
Voluntary Termination of Employment or Involuntary Termination of Employment with Cause
A Named Executive Officer would be entitled to the following under the Company’s current policies, plans and employment letters upon voluntary termination of employment or involuntary termination of employment with cause. “Cause” is defined as a continued and willful failure to perform duties; gross misconduct that is materially and demonstrably injurious to the Company; or conviction of or pleading guilty (or no contest) to a felony or to another crime that materially and adversely affects the Company.
Compensation and Benefits. If a Named Executive Officer were to voluntarily resign from his position or be terminated for cause, he would be entitled only to accrued and unpaid compensation. Participation in benefit plans would cease upon termination.
139
Incentive Plan Payments and Equity Awards. Upon voluntary termination or termination with cause, a Named Executive Officer would not be entitled to annual bonus or long-term incentive cash plan participation and all unvested equity grants (including unvested restricted shares of Common Stock, restricted share units and performance shares) would be forfeited. Stock options would be exercisable for three months after the termination date (or until their expiration date, if earlier), after which they would be forfeited.
Savings Plan Distributions. Participants in the qualified savings plan are generally entitled to a lump sum distribution of the vested interest in their savings plan accounts upon any termination of service. Participants in the supplemental (non-qualified) savings plan are entitled to receive distributions of the vested portion of their accounts, either in a lump sum or in ten annual installments, at age 55 or six months after any termination of employment, depending on the election made by the participant. All participant contributions and Company matching contributions to the savings plans, and any related earnings, are immediately 100% vested. Retirement contributions made by the Company to the savings plans in lieu of participation in the defined benefit retirement plans vest 20% for each full year of the participant’s employment beginning with the second year, with full vesting of accounts after completion of six years of service.
The Named Executive Officers would be entitled to receive a distribution of all of their employee and Company-matching contributions, and any related earnings, from their savings plan accounts upon voluntary termination or termination with cause. The Company also makes savings plan contributions on behalf of Messrs. Craig and Reinhardt, and beginning January 1, 2008, Messrs. McClure, Baker and Donlon, in lieu of participation in the defined benefit retirement plans. As of September 30, 2009, these additional retirement contributions had vested (and the Named Executive Officers would be eligible to receive a distribution of their accounts with respect to these distributions upon voluntary termination or termination with cause) in the following amounts: 100% for Mr. Baker; 80% for Mr. McClure; 60% for Mr. Donlon; and 40% for each of Messrs. Craig and Reinhardt.
Termination of Employment without Cause
Upon termination without cause, a Named Executive Officer’s compensation and benefits would be governed by the terms of his 2009 employment or termination letter, as the case may be, as follows:
2009 Employment Letters. Messrs. McClure, Craig, Baker and Reinhardt entered into employment letters with the Company in fiscal year 2009, which replaced any previous employment letters with such officers. Under the terms of these letters, if the Company terminates the executive’s employment without cause, the executive would receive any accrued and unpaid compensation, together with the following severance payments and benefits:
-
Severance pay: The executive would receive severance pay, at his then-current salary, for a severance period of 36 months for Mr. McClure, 30 months for each of Messrs. Craig and Reinhardt and 24 months for Mr. Baker.
-
Annual bonus: The executive would participate in the current year annual bonus on a pro rata basis, for the portion of the year during which he was actively employed.
-
Long-term incentives (see Grants of Plan-Based Awards and Compensation Discussion and Analysis above for further information on the different types of long-term incentive awards that are currently outstanding):
-
Cash performance plans: The executive would participate in the cash portion of each existing long-term incentive cycle that began more than a year before the last day employed on a pro rata basis, for the portion of the three-year performance period during which he was actively employed.
-
Equity grants:
-
Stock options: The executive’s outstanding stock options would remain exercisable for three months after the end of the severance period (but not beyond the original option expiration date).
-
Restricted shares and Restricted Share Units: The executive’s outstanding unvested restricted shares and restricted share units would vest through the vesting date or the end of the severance period, whichever is earlier. To the extent not vested by the end of the severance period, unvested restricted shares and restricted share units would be forfeited (except for certain special hiring or retention grants, which would vest in full).
-
Performance shares: Under the terms of the incentive plans under which they were granted, the executive’s outstanding performance shares would be forfeited.
-
-
-
Benefits: The executive would be entitled to continuation of health and welfare benefits (other than ADD and long-term and short-term disability coverage) throughout the severance period (or until the executive becomes subsequently employed and covered by the health plan of the new employer). The executive also would receive continued life insurance coverage through the end of the severance period.
140
-
Retirement plans: Savings plan participation (including additional contributions in lieu of defined benefit plan participation) would cease at the end of employment.
-
Outplacement services: The executive would receive outplacement services at Company expense for twelve months in an amount not to exceed $10,000.
No perquisites are provided to the executive or paid for by the Company during the severance period. Bonus payments and long-term incentive payouts would occur at the time applicable for all participating employees. All other amounts would be payable periodically over the severance period, with timing of some payments delayed to comply with Section 409A of the IRC.
Mr. Donlon’s Termination Agreement. Mr. Donlon entered into an agreement, which provides that Mr. Donlon will continue to be employed through January 16, 2010 (the “Termination Date”). Upon termination of his employment on the Termination Date, Mr. Donlon will receive:
-
Severance pay. Mr. Donlon will receive monthly severance pay equal to $58,650 per month for a period of 24 months, which will be paid in equal semi-monthly installments.
-
Annual bonus. Mr. Donlon will receive a pro rated annual incentive award for 2010 (at his current target award of 65% of his base salary) based on time actually worked, payable in accordance with the terms of the Company’s annual incentive compensation plan.
-
Long-term incentives (see Grants of Plan-Based Awards and Compensation Discussion and Analysis above for further information on the different types of long-term incentive awards that are currently outstanding):
-
Cash performance plans: Mr. Donlon will continue to be eligible for a target cash award, if any, of $500,000 under the Company’s long term incentive plan for the 2008-2010 and 2009-2011 cycles, in accordance with the terms of such plan on a pro rata basis, for the portion of the three-year performance period during which he was employed.
-
Equity grants:
-
Restricted shares: The executive’s outstanding unvested restricted shares will vest in full.
-
Performance shares: Under the terms of the incentive plans under which they were granted, the executive’s outstanding performance shares will be forfeited.
-
-
-
Benefits. Mr. Donlon would continue to receive health and certain other benefit coverage through the severance period (although with respect to health, such coverage will terminate if he subsequently becomes covered by a health plan of a new employer). He would also receive continued life insurance coverage, car allowance and financial counseling allowance through the end of the severance period.
-
Outplacement. Mr. Donlon will receive outplacement assistance for twelve months not to exceed $10,000.
Mr. Martens Termination Agreement. The Company entered into a termination agreement with Mr. Martens on January 21, 2009 that provided for the termination of his employment without cause effective January 15, 2009 and the following benefits:
-
Severance pay. Mr. Martens receives monthly severance pay equal to $50,000 per month for a period of 30 months, paid in equal semi-monthly installments.
-
Annual Bonus. Although Mr. Martens was entitled to a pro rated portion of any annual bonus for 2009, no bonus was paid for that period.
-
Long-term Incentives (see Grants of Plan-Based Awards and Compensation Discussion and Analysis above for further information on the different types of long-term incentive awards that are currently outstanding):
-
Cash performance plans: Mr. Martens will be eligible for a pro rated cash award (15/36), if any, of $500,000 under the Company’s long term incentive plan for the fiscal years 2008-2010 cycle, in accordance with the terms of such plan, subject to approval of the Committee. Although he was entitled to the same under the 2007 – 2009 cycle, no long-term incentive cash payment was made for that period.
-
Equity grants:
-
Restricted shares: Mr. Martens’ outstanding unvested restricted shares vested in full on January 27, 2009.
-
Performance shares: Under the terms of the incentive plans under which they were granted, Mr. Martens’ outstanding performance shares were forfeited.
-
-
-
Benefits. Mr. Martens continues to receive health and life insurance coverage through a period of 18 months.
-
Outplacement. Mr. Martens received $10,000 in lieu of outplacement assistance for twelve months.
Savings Plan Distributions. Upon termination without cause, the Named Executive Officers would also be entitled to a distribution of certain amounts in their savings plan accounts, as described above under “Voluntary Termination of Employment or Involuntary Termination of Employment with Cause.”
141
Termination of Employment upon Change of Control
Under their employment letters, the current officers (including Mr. Donlon) would receive substantially the same salary payments and benefits in the case of a termination of employment upon change of control (or within one year thereafter) as those outlined above for a termination of employment without cause, except that the annual bonus for the current year would be paid in full rather than pro rated. As a result, the amounts for long-term incentive payout and vesting of restricted shares and performance shares, as well as the totals, would increase to the amounts stated in the tables below if termination of employment occurred on the last day of fiscal year 2009 upon a change of control.
Payouts with respect to cash performance plans and all equity-based awards are governed by the provisions of the long term incentive plan under which they were granted. The terms of the 2007 LTIP (which covers awards or payouts for the 2008 - 2010 and 2009 – 2011 performance cycles) provide for immediate vesting and payout of all equity and non-equity long-term incentive awards at target levels upon a change of control. The provisions of the 1997 LTIP apply to long-term incentive awards made for the 2007 – 2009 performance cycle. Under the terms of the 1997 LTIP, equity and non-equity-based awards would be paid out or vest immediately upon a change of control at maximum amounts, rather than target. However, the Committee modified the change of control provisions applicable to these awards to provide for payouts at target levels (rather than any maximum) in the event of a change of control.
Retirement
Upon retirement, a Named Executive Officer may be eligible for the following payments and benefits:
Defined Benefit Retirement Plan. Messrs. McClure, Donlon and Baker participate in the Company’s defined benefit retirement plans. The present value of each of their accumulated benefits, assuming retirement at age 62, is disclosed above in the table under the heading Pension Benefits. Each of these executives were eligible to retire under the defined benefit retirement plans as of the last day of fiscal year 2009. In the event of the death of Mr. Baker, Mr. Donlon or Mr. McClure, his spouse would receive a portion of his pension benefit paid monthly for the remainder of her life. Messrs. Craig and Reinhardt do not participate in the defined benefit retirement plans.
Savings Plan Distributions. Upon retirement, the Named Executive Officers would be entitled to a distribution of amounts in their savings plan accounts, including any vested Company contributions in lieu of defined benefit pension plan participation, as described above under “Voluntary Termination of Employment Termination of Employment with Cause.”
Retiree Medical Benefits. Messrs. Craig, McClure, Donlon and Reinhardt were hired after January 1, 2001 and therefore are not eligible for benefits under the Company’s retiree medical program. Since Mr. Baker is age 55 and has at least 10 years of service, he will be eligible for retiree medical benefits for the period from the date of his retirement to the date of his eligibility for Medicare. The value of these benefits as of September 30, 2009 is included in the table below.
Incentive Plan Payments and Equity Awards. Upon retirement, Messrs. Baker, Donlon and McClure would be entitled to participate in any annual bonuses on a pro rated basis. They would also be entitled to cash payouts under the 1997 LTIP and the 2007 LTIP for each three-year performance plan, and full vesting of performance shares at the end of the performance period for each grant, on the same basis and to the same extent as if employed for the entire period. Service-based restricted stock would vest in full if granted at least one year prior to retirement, but would be forfeited if granted less than a year prior to retirement. The other Named Executive Officers are not eligible to retire under the Company’s retirement plans at the end of fiscal year 2009 and, therefore, would not be entitled to vesting and payout of these awards.
Death
In the event of his death, a Named Executive Officer’s beneficiary would receive the following benefits:
Insurance. The Named Executive Officer’s beneficiary would be entitled to the proceeds of Company-sponsored life insurance policies.
Compensation and Benefits. In addition to any accrued and unpaid compensation, the Named Executive Officer’s spouse and other dependents would be eligible for continuation of medical benefits for a period of six months.
Incentive Plan Payments and Equity Awards. The Named Executive Officer’s beneficiary would be entitled to a pro rata portion of any annual bonus, based on the portion of the year that he was employed. She would also be entitled to pro rata cash payouts under the long term incentive plan for each three-year performance plan and full vesting of restricted shares or restricted share units (either immediately or at the end of the restricted period for each grant). Outstanding stock options would be exercisable for three years after the date of death or until the expiration of the option, whichever is earlier. She would be entitled to a pro rata portion of any performance shares (to the extent any are earned) based on actual time worked by the Named Executive Officer prior to death.
Savings Plan Distributions. Upon the death of a Named Executive Officer, his beneficiary would be entitled to distribution of amounts in his savings plan accounts, including any vested Company contributions in lieu of defined benefit pension plan participation, as described above under “Voluntary Termination of Employment or Involuntary Termination of Employment with Cause.”
142
Disability
In the event of his disability, which is defined as the inability to perform the duties of his current job as a result of disease or injury, a Named Executive Officer would be entitled to the following benefits:
Compensation and Benefits. The Named Executive Officer would be entitled to continuation of his full or partial salary (depending on years of service) for a period of six months, as short-term disability benefits, after which he would receive either 50% or 60% of his salary, depending on his benefit election (with a monthly maximum of $20,000), under the long-term disability program. After 1½ years on long-term disability benefits, continued eligibility would be based on the inability to perform any job for which he is qualified by education, training or experience. Medical, dental, vision and life insurance benefits would continue during the period he is receiving long-term disability benefits as if he were still employed.
Incentive Plan Payments and Equity Awards. The Named Executive Officer would be entitled to a pro rata portion of any annual bonus, and pro rata participation in any existing three-year cash performance plans, based on the portion of the year or the performance period during which he was employed or on short-term disability. For each grant of restricted shares and performance shares made under a plan prior to the 2007 LTIP, he would also be entitled to full vesting at the end of the restricted or performance period, on the same basis and to the same extent as if the Named Executive Officer had been employed for the entire period. Under Mr. McClure’s July 2008 retention grant of restricted stock, he would also be entitled to full vesting. For any other grants under the 2007 LTIP, the Named Executive Officer would be entitled to a pro rata portion of the restricted stock, restricted share units or performance shares based on actual time worked. Outstanding stock options would continue to be exercisable as provided in their grant terms.
Savings Plan Distributions. A Named Executive Officer would be entitled to distributions under the savings plans, as described above under “Voluntary Termination of Employment or Involuntary Termination of Employment with Cause.”
Potential Payments
Assuming termination for the stated reasons on the last day of fiscal year 2009, and giving effect to the agreements and plan provisions described above, the Named Executive Officers would receive the following estimated payments and benefits under the agreements and plans described above. Amounts attributable to savings plan distributions, life and disability insurance, and health and welfare benefits in the event of death and disability are not included in the tables below because they are available to the Named Executive Officers on the same basis as other salaried employees.
| Charles G. McClure, Jr. |
Severance Pay1 |
Pension Enhancement |
Annual Bonus2 |
Long- Term Incentive Payout |
Vesting
of Restricted Shares, Options and Performance Shares |
Health
and Welfare Benefits |
Outplacement Services |
Gross-up of Excise Taxes |
Total | ||||||||||||||||||
| Voluntary | $ | 0 | $ | 0 | $ | 0 | $ | 0 | $ | 0 | $ | 0 | $ | 0 | $ | 0 | $ | 0 | |||||||||
| Termination | |||||||||||||||||||||||||||
| or Termination | |||||||||||||||||||||||||||
| with Cause | |||||||||||||||||||||||||||
| Termination | 3,450,000 | 1,473,528 | 0 | 1,500,0003 | 5,916,9704 | 41,613 | 10,000 | 0 | 12,392,111 | ||||||||||||||||||
| without Cause | |||||||||||||||||||||||||||
| Termination | 3,450,000 | 1,473,528 | 0 | 4,500,0005 | 6,343,2206 | 41,613 | 10,000 | 0 | 15,818,361 | ||||||||||||||||||
| Upon Change | |||||||||||||||||||||||||||
| Of Control | |||||||||||||||||||||||||||
| Retirement | 0 | 1,473,528 | 0 | 3,000,0003 | 2,917,7204 | 0 | 0 | 0 | 7,391,248 | ||||||||||||||||||
| Death | 0 | 0 | 0 | 1,500,0003 | 5,916,9704 | 0 | 0 | 0 | 7,416,970 | ||||||||||||||||||
| Disability | 0 | 0 | 0 | 1,500,0003 | 3,140,8664 | 0 | 0 | 0 | 4,640,866 | ||||||||||||||||||
143
| Jeffrey
A. Craig |
Severance Pay1 |
Pension Enhancement |
Annual Bonus2 |
Long- Term Incentive Payout |
Vesting
of Restricted Shares, Options and Performance Shares |
Health
and Welfare Benefits |
Outplacement Services |
Gross-up of Excise Taxes |
Total | ||||||||||||||||||
| Voluntary | $ | 0 | $ | 0 | $ | 0 | $ | 0 | $ | 0 | $ | 0 | $ | 0 | $ | 0 | $ | 0 | |||||||||
| Termination | |||||||||||||||||||||||||||
| or Termination | |||||||||||||||||||||||||||
| with Cause | |||||||||||||||||||||||||||
| Termination | 1,070,000 | 0 | 0 | 366,6673 | 1,491,3024 | 32,753 | 10,000 | 0 | 2,970,722 | ||||||||||||||||||
| without Cause | |||||||||||||||||||||||||||
| Termination | 1,070,000 | 0 | 0 | 965,0005 | 1,537,8076 | 32,753 | 10,000 | 0 | 3,615,560 | ||||||||||||||||||
| Upon Change | |||||||||||||||||||||||||||
| Of Control | |||||||||||||||||||||||||||
| Retirement | NA | NA | NA | NA | NA | NA | NA | NA | NA | ||||||||||||||||||
| Death | 0 | 0 | 0 | 366,6673 | 1,491,3024 | 0 | 0 | 0 | 1,857,969 | ||||||||||||||||||
| Disability | 0 | 0 | 0 | 366,6673 | 636,8334 | 0 | 0 | 0 | 1,003,500 | ||||||||||||||||||
| Vernon G. Baker, II |
Severance Pay1 |
Pension Enhancement |
Annual Bonus2 |
Long- Term Incentive Payout |
Vesting of Restricted Shares, Options and Performance Shares |
Health and Welfare Benefits |
Outplacement Services |
Gross-up of Excise Taxes |
Total | ||||||||||||||||||
| Voluntary | $ | 0 | $ | 0 | $ | 0 | $ | 0 | $ | 0 | $ | 0 | $ | 0 | $ | 0 | $ | 0 | |||||||||
| Termination | |||||||||||||||||||||||||||
| or Termination | |||||||||||||||||||||||||||
| with Cause | |||||||||||||||||||||||||||
| Termination | 1,000,000 | 0 | 0 | 300,0003 | 450,5084 | 26,356 | 10,000 | 0 | 1,786,864 | ||||||||||||||||||
| without Cause | |||||||||||||||||||||||||||
| Termination | 1,000,000 | 0 | 0 | 900,0005 | 1,132,5086 | 26,356 | 10,000 | 0 | 3,068,864 | ||||||||||||||||||
| Upon Change | |||||||||||||||||||||||||||
| Of Control | |||||||||||||||||||||||||||
| Retirement | 0 | 0 | 0 | 600,0003 | 450,5084 | 113,481 | 0 | 0 | 1,163,989 | ||||||||||||||||||
| Death | 0 | 0 | 0 | 300,0003 | 1,047,2584 | 0 | 0 | 0 | 1,347,258 | ||||||||||||||||||
| Disability | 0 | 0 | 0 | 300,0003 | 495,0314 | 0 | 0 | 0 | 795,031 | ||||||||||||||||||
144
| Carsten
J. Reinhardt |
Severance Pay1 |
Pension Enhancement |
Annual Bonus2 |
Long- Term Incentive Payout |
Vesting
of Restricted Shares, Options and Performance Shares |
Health
and Welfare Benefits |
Outplacement Services |
Gross-up of Excise Taxes |
Total | ||||||||||||||||||
| Voluntary | $ | 0 | $ | 0 | $ | 0 | $ | 0 | $ | 0 | $ | 0 | $ | 0 | $ | 0 | $ | 0 | |||||||||
| Termination | |||||||||||||||||||||||||||
| or Termination | |||||||||||||||||||||||||||
| with Cause | |||||||||||||||||||||||||||
| Termination | 1,375,000 | 0 | 0 | 533,3333 | 1,870,3394 | 33,078 | 10,000 | 0 | 3,821,750 | ||||||||||||||||||
| without Cause | |||||||||||||||||||||||||||
| Termination | 1,375,000 | 0 | 0 | 1,600,0005 | 2,013,7146 | 33,078 | 10,000 | 0 | 5,031,792 | ||||||||||||||||||
| Upon Change | |||||||||||||||||||||||||||
| Of Control | |||||||||||||||||||||||||||
| Retirement | NA | NA | NA | NA | NA | NA | NA | NA | NA | ||||||||||||||||||
| Death | 0 | 0 | 0 | 533,3333 | 1,870,3394 | 0 | 0 | 0 | 2,403,672 | ||||||||||||||||||
| Disability | 0 | 0 | 0 | 533,3333 | 793,8334 | 0 | 0 | 0 | 1,327,166 | ||||||||||||||||||
| James D. Donlon, III |
Severance Pay1 |
Pension Enhancement |
Annual Bonus2 |
Long- Term Incentive Payout |
Vesting
of Restricted Shares, Options and Performance Shares |
Health
and Welfare Benefits |
Outplacement Services |
Gross-up of Excise Taxes |
Total | ||||||||||||||||||
| Voluntary | $ | 0 | $ | 0 | $ | 0 | $ | 0 | $ | 0 | $ | 0 | $ | 0 | $ | 0 | $ | 0 | |||||||||
| Termination | |||||||||||||||||||||||||||
| or Termination | |||||||||||||||||||||||||||
| with Cause | |||||||||||||||||||||||||||
| Termination | 1,407,600 | 0 | 0 | 500,0003 | 1,574,8394 | 60,180 | 10,000 | 0 | 3,552,619 | ||||||||||||||||||
| without Cause | |||||||||||||||||||||||||||
| Termination | 1,407,600 | 0 | 0 | 1,500,0005 | 1,718,2146 | 60,180 | 10,000 | 0 | 4,695,994 | ||||||||||||||||||
| Upon Change | |||||||||||||||||||||||||||
| Of Control | |||||||||||||||||||||||||||
| Retirement | 0 | 0 | 0 | 1,000,0003 | 575,0894 | 0 | 0 | 0 | 1,575,089 | ||||||||||||||||||
| Death | 0 | 0 | 0 | 500,0003 | 1,574,8394 | 0 | 0 | 0 | 2,074,839 | ||||||||||||||||||
| Disability | 0 | 0 | 0 | 500,0003 | 1,574,8394 | 0 | 0 | 0 | 2,074,839 | ||||||||||||||||||
145
| Philip
R. Martens7 |
Severance Pay1 |
Pension Enhancement |
Annual Bonus2 |
Long- Term Incentive Payout |
Vesting
of Restricted Shares, Options and Performance Shares |
Health
and Welfare Benefits |
Outplacement Services |
Gross-up of Excise Taxes |
Total | ||||||||||||||||||
| Voluntary | NA | NA | NA | NA | NA | NA | NA | NA | NA | ||||||||||||||||||
| Termination | |||||||||||||||||||||||||||
| or Termination | |||||||||||||||||||||||||||
| with Cause | |||||||||||||||||||||||||||
| Termination | $ | 1,800,000 | 0 | 0 | $ | 208,333 | $ | 210,973 | $ | 18,914 | $ | 10,000 | $ | 0 | $ | 2,248,220 | |||||||||||
| without Cause | |||||||||||||||||||||||||||
| Termination | NA | NA | NA | NA | NA | NA | NA | NA | NA | ||||||||||||||||||
| Upon Change | |||||||||||||||||||||||||||
| Of Control | |||||||||||||||||||||||||||
| Retirement | NA | NA | NA | NA | NA | NA | NA | NA | NA | ||||||||||||||||||
| Death | NA | NA | NA | NA | NA | NA | NA | NA | NA | ||||||||||||||||||
| Disability | NA | NA | NA | NA | NA | NA | NA | NA | NA | ||||||||||||||||||
| 1 | Based on annual salary as of September 30, 2009. For the purposes of this table, however, severance amounts contemplate reinstatement of the executive’s full salary at year end (i.e. not including the 10% reduction that was actually in effect on September 30, 2009). | |
| 2 | The executive would be entitled to annual incentive bonus participation for the 2009 fiscal year, based on time actually worked, in accordance with the terms of the ICP. Since no ICP payouts were made for fiscal year 2009 (as the performance goals were not met), the executive would have received no payment in respect of his annual bonus if he had actually been terminated on the last day of fiscal year 2009. | |
| 3 | Since no long-term incentive payouts were made for the three-year performance cycle ended September 30, 2009 (as the performance goals were not met), the executive would have received no payment in respect of this long-term incentive cycle if he had actually been terminated on the last day of fiscal year 2009. Payments for the cash performance plans with three-year performance cycles ending September 30, 2010 and 2011 were estimated based on target awards and an assumed stock price multiplier of 1. For termination without cause, death and disability, these cycles are pro rated for time worked prior to the event, and for retirement (if applicable) a full award is paid. All payments would be made at the time the award would otherwise be paid. | |
| 4 | Based, as applicable, on (a) the number of unvested restricted shares (plus any additional shares purchased with reinvested dividends through September 30, 2009) that would vest by the end of the executive’s separation period and (b) the number of unvested restricted share units that would vest by the end of the executive’s separation period. Performance shares were not earned for the three-year performance cycle ended September 30, 2009 based on the level of the Company’s performance during that cycle, and were not awarded for the three year performance periods ending September 30, 2010 and 2011. In addition, in the case of retirement for Messrs. Baker, Donlon and McClure, the number of unvested restricted shares does not include those granted within less than a year. Although any unvested options would also vest, the exercise price of such options exceeded the closing Price on September 25, 2009 and accordingly, no value was assigned to the vesting. | |
| 5 | Based on payout at 100% of cash targets, multiplied by an assumed stock price multiplier of 1 for the three-year performance periods ending September 30, 2009, 2010 and 2011, respectively. | |
| 6 | Based on (a) the number of unvested restricted shares granted plus additional restricted shares purchased with reinvested dividends through September 30, 2009; (b) the number of unvested restricted share units granted and (c) 100% of the target award number of performance shares granted for the performance period ending September 30, 2009, in each case multiplied by the NYSE Closing Price on September 25, 2009 ($7.75), the last trading day in fiscal year 2009. Although any unvested options would also vest, the exercise price of such options exceeded the closing Price on September 25, 2009 and accordingly, no value was assigned to the vesting. | |
| 7 | Since Mr. Martens’ employment was terminated without cause effective January 15, 2009, the amounts in this table represent only the amounts actually accrued or paid to him in the event of his termination without cause and not the other termination events as they are no longer applicable to Mr. Martens. | |
146
Item 12. Security Ownership of Certain Beneficial Owners and Management and Related Stockholder Matters.
Security Ownership of Certain Beneficial Owners and Management
OWNERSHIP BY MANAGEMENT OF EQUITY SECURITIES
The following table shows the beneficial ownership, reported to us as of October 31, 2009, of ArvinMeritor Common Stock of (a) each director, (b) each executive officer listed in the table under Executive Compensation - Summary Compensation Table above and (c) such persons and other executive officers as a group. See Voting Securities below for information on beneficial holders of more than 5% of outstanding ArvinMeritor Common Stock.
Beneficial Ownership as of October 31, 2009
| Percent of Outstanding | |||||||
| Name | Number of Shares(1)(2) | Common Stock(3) | |||||
| Joseph B. Anderson, Jr. | 22,232 | (4)(5) | * | ||||
| Rhonda L. Brooks | 27,357 | (5) | * | ||||
| David W. Devonshire | 10,107 | (4)(5) | * | ||||
| Ivor J. Evans | See footnote 8 below | * | |||||
| Victoria B. Jackson | 27,357 | (4)(5) | * | ||||
| James E. Marley | 37,629 | (4)(5) | * | ||||
| Charles G. McClure, Jr. | 645,256 | (4)(5)(6) | * | ||||
| William R. Newlin | 27,593 | (4)(5)(7) | * | ||||
| Steven G. Rothmeier | 106,500 | (5) | * | ||||
| Jeffrey A. Craig | 72,650 | (4)(5) | * | ||||
| James D. Donlon, III | 203,552 | (4)(6) | * | ||||
| Vernon G. Baker, II | 273,245 | (4)(5)(6) | * | ||||
| Carsten J. Reinhardt | 88,727 | (4)(5) | * | ||||
| All of the above and other executive officers | |||||||
| as a group (16 persons) | 1,696,446 | (4)(5)(6)(7) | 2.28 | % | |||
| * |
Less than one percent. | |
| (1) | Each person has sole voting and investment power with respect to the shares listed unless otherwise indicated. | |
| (2) | In accordance with Rule 13d-3(d)(1) under the Exchange Act, the number of shares owned includes the following numbers of shares of Common Stock which may be acquired upon exercise of options that were exercisable or would become exercisable within 60 days: 11,437 shares for Mr. Anderson; 12,938 shares for each of Ms. Brooks and Ms. Jackson; 0 shares for each of Messrs. Devonshire, Evans and Rothmeier; 13,500 shares for Mr. Marley; 2,250 shares for Mr. Newlin; 100,000 shares for Mr. McClure; 153,000 for Mr. Baker; and 0 shares for Messrs. Craig, Donlon and Reinhardt, respectively; and 347,002 shares for all directors and executive officers as a group. | |
| (3) | For purposes of computing the percentage of outstanding shares beneficially owned by each person, the number of shares owned by that person and the number of shares outstanding include shares as to which such person has a right to acquire beneficial ownership within 60 days (for example, through the exercise of stock options, conversions of securities or through various trust arrangements), in accordance with Rule 13d-3(d)(1) under the Exchange Act. | |
| (4) | Includes restricted shares of Common Stock awarded under the directors stock plans or the Company’s long-term incentive plans, as applicable. Restricted shares are held by the Company until certain conditions are satisfied. | |
| (5) | Does not include the following restricted share units granted under the directors stock plans and held as of October 31, 2009: 15,900 units for each of Ms. Brooks, Ms. Jackson, and Messrs. Anderson and Marley; 15,934 units for Mr. Devonshire; 18,982 units for Mr. Evans; 18,054 units for Mr. Newlin; 20,707 units for Mr. Rothmeier; 77,000 units for Mr. Baker; 129,000 units for Mr. Craig; 387,000 for Mr. McClure; 155,000 for Mr. Reinhardt and 1,018,177 units for all directors and executive officers as a group. | |
| (6) | Includes shares beneficially owned under the Company’s Savings Plans. Does not include 18,794 share equivalents held for Mr. Baker and 23,089 share equivalents for all directors and executive officers as a group under the Company’s supplemental savings plan on October 31, 2009. | |
147
| (7) | Includes 700 shares held in the name of Mr. Newlin’s spouse and 6,860 shares held by a trust of which Mr. Newlin’s spouse is beneficiary. Mr. Newlin disclaims beneficial ownership of these shares. | |
| (8) | Mr. Evans holds his equity interest in the Company in the form of 18,982 restricted stock units, which are not included in this table. | |
VOTING SECURITIES
On November 2, 2009, we had outstanding 74,269,521 shares of Common Stock, par value $1 per share, of ArvinMeritor (“Common Stock”). Each holder of Common Stock is entitled to one vote for each share held.
As of November 2, 2009, T. Rowe Price Trust Company, as directed trustee under the ArvinMeritor savings plans for its participating employees, owned the following shares of Common Stock:
| Percent of Outstanding | |||||
| Name and address | Number of Shares | Common Stock | |||
| T. Rowe Price Trust Company | 5,572,491 | 7.5% | |||
| 4555 Painters Mill Road | |||||
| Owings Mills, MD 21117 | |||||
In addition, the following entities reported beneficial ownership of more than 5% of the outstanding shares of ArvinMeritor Common Stock as of the dates noted below. This information is based on Schedules 13G and 13G/A that were filed with the SEC.
| Percent of | |||||
| Outstanding | |||||
| Name and address | Number of Shares | Common Stock | |||
| Dimensional Fund Advisors LP | 5,835,669 | 7.89% | |||
| 1299 Ocean Avenue, | (as of December 31, | ||||
| Santa Monica, CA 90401 | 2008) | ||||
| Glenhill Advisors, LLC, Glenn J. Krevlin and | 4,146,107 | 5.6% | |||
| Glenhill Capital Management, LLC | (as of March 9, 2009) | ||||
| 598 Madison Avenue, 12th Floor, | |||||
| New York, NY 10022 | |||||
| Glenview Capital Management, LLC and | 4,139,362 | 5.6% | |||
| Lawrence M. Robbins | (as of February 17, | ||||
| 767 Fifth Avenue, 44th Floor | 2009) | ||||
| New York, NY 10153 | |||||
| AXA Assurances I.A.R.D Mutuelle and AXA Assurances Vie | 3,856,421 | 5.2% | |||
| Mutuelle, 26, rue Drouot 75009 Paris, France, AXA | (as of December 31, | ||||
| Courtage Assurance Mutuelle, 26, rue Drouot 75009 | 2008) | ||||
| Paris, France as a group, AXA, 25, avenue Matignon | |||||
| 75008 Paris, France, and AXA Financial, Inc., 1290 | |||||
| Avenue of the Americas, New York, New York 10104 | |||||
148
Securities Authorized for Issuance under Equity Compensation Plans
The number of stock options outstanding under our equity compensation plans, the weighted average exercise price of outstanding options, and the number of securities remaining available for issuance, as of September 30, 2008, were as follows:
| (column a) | (column c) | |||||
| Number of securities | (column b) | Number of securities remaining | ||||
| to be issued upon | Weighted average | available for future issuance | ||||
| exercise of outstanding | exercise price of | under equity compensation plans | ||||
| options, warrants and | outstanding options, | (excluding securities reflected in | ||||
| Plan Category | rights1 | warrants and rights | column a) | |||
| Equity compensation plans approved by security holders | 1,459,226 | 17.34 | 577,414 | |||
| Equity compensation plans not approved by security holders2 | 295,102 | 19.21 | – | |||
| Total | 1,754,3283 | 17.663 | 577,4144 |
| 1 | In addition to stock options, shares of Common Stock, restricted shares of Common Stock, restricted share units and performance shares have been awarded under the Company’s equity compensation plans and were outstanding at September 30, 2009. | |
| 2 | All of our equity compensation plans under which grants are outstanding, except the Employee Stock Benefit Plan, were approved by the shareholders of ArvinMeritor or by the shareholders of Meritor or Arvin prior to their merger into ArvinMeritor. The Employee Stock Benefit Plan was adopted by the Arvin board of directors in 1998 and was terminated in January 2007. It was intended to provide compensation arrangements that would attract, retain and reward key non-officer employees and to provide these employees with a proprietary interest in the company. This Plan provided for the issuance of incentive awards to non-officer employees in the form of stock options, tandem or non-tandem stock appreciation rights, restricted shares of Common Stock, performance shares or performance units. For further information, see the Plan document, which is filed as Exhibit 10-j to this Annual Report on Form 10-K. | |
| 3 | The table includes options granted under Arvin’s 1988 Stock Benefit Plan, 1998 Stock Benefit Plan and Employee Stock Benefit Plan, which we assumed in 2000 in connection with the merger of Arvin and Meritor. A total of 3,118,255 options, with a weighted average exercise price of $28.10, were assumed at the time of the merger. | |
| 4 |
The following number of shares remained available for issuance under our equity compensation plans at September 30, 2009. Grants under these plans may be in the form of any of the listed types of awards. | |
| Plan | Number of shares | Type of award | ||
| 2007 Long-Term Incentive Plan* | 494,000 | Stock options, stock appreciation rights, stock awards | ||
| and other stock-based awards | ||||
| Incentive Compensation Plan | 75,740 | Common stock, restricted shares | ||
| 2004 Directors Stock Plan | 7,674 | Stock options, common stock, restricted shares, | ||
| restricted share units, stock appreciation rights |
| * | The 2007 Long-Term Incentive Plan was approved by the company’s shareowners on January 26, 2007. At that time, the 1997 Long-Term Incentives Plan, 1998 Stock Benefit Plan and Employee Stock Benefit Plan were terminated, and no further awards will be made under these plans. |
Item 13. Certain Relationships and Related Transactions, and Director Independence.
BOARD OF DIRECTORS AND COMMITTEES
The Board of Directors has established independence standards for directors, which are set forth in the Company’s Guidelines on Corporate Governance and are identical to the standards prescribed in the corporate governance rules of the New York Stock Exchange. The Board determined that Ms. Brooks, Ms. Jackson, and Messrs. Anderson, Devonshire, Evans, Marley, Newlin, and Rothmeier have no material relationship with ArvinMeritor, either directly or as a partner, shareholder or officer of an organization that has a relationship with ArvinMeritor, and are therefore independent within the meaning of the Guidelines on Corporate Governance and the New York Stock Exchange listing standards. In addition, although Mr. Devonshire serves on the audit committee of more than three publicly traded companies, the Board of Directors determined that such simultaneous service does not impair his ability to serve on ArvinMeritor’s Audit Committee. There were no transactions, relationships or arrangements involving the Company and any director in fiscal year 2009 that were considered by the Board in determining the independence of these directors under the Guidelines on Corporate Governance and the New York Stock Exchange listing standards.
149
The Board has established four standing committees (Audit; Compensation and Management Development; Corporate Governance and Nominating; and Environmental and Social Responsibility), the principal functions of which are briefly described below. The charters of these committees are posted on our website, www.arvinmeritor.com, in the section headed “Investors – Corporate Governance,” and paper copies will be provided upon request to the Office of the Secretary, ArvinMeritor, Inc., 2135 West Maple Road, Troy, MI 48084. The Board also establishes special committees from time to time for specific limited purposes or duration.
Audit Committee. ArvinMeritor has a separately designated standing audit committee established in compliance with applicable provisions of the Exchange Act. The Audit Committee is currently composed of four non-employee directors, Steven G. Rothmeier (chair), David W. Devonshire, Ivor J. Evans and Victoria B. Jackson, each of whom meets the criteria for independence specified in the listing standards of the New York Stock Exchange. The Board of Directors has determined that the Company has at least two individuals who qualify as an “audit committee financial expert” (as defined by the SEC), David W. Devonshire and Steven G. Rothmeier, serving on the Audit Committee. The Board of Directors has adopted a written charter for the Audit Committee, which is reviewed and reassessed annually for compliance with rules of the New York Stock Exchange. The Audit Committee held five regularly scheduled meetings and one telephonic meeting in fiscal year 2009.
The Audit Committee is charged with monitoring the integrity of the Company’s financial statements, compliance with legal and regulatory requirements, and the independence, qualifications and performance of the Company’s internal audit function and independent accountants. The Audit Committee has sole authority to select and employ (subject to approval of the shareowners), and to terminate and replace where appropriate, the independent public accountants for the Company and also has authority to:
-
approve and cause the Company to pay all audit engagement fees;
-
review the scope of and procedures used in audits and reviews of the Company’s financial statements by the independent public accountants;
-
review the Company’s annual and quarterly financial statements before their release;
-
review any significant issues related to the audit activities of the independent public accountants and oversee the resolution of any disagreements between them and management;
-
review at least annually a report from the independent public accountants describing the firm’s internal quality control procedures;
-
review and approve in advance the scope and extent of any non-audit services performed by the independent public accountants and the fees charged for these services, and receive and evaluate at least annually a report by the independent public accountants as to their independence;
-
review significant internal control matters, the adequacy of the Company’s system of internal controls and recommendations of the independent public accountants with respect to internal controls;
-
review the internal audit charter, the scope of the annual internal audit plan and the results of internal audits;
-
consult with management as to the appointment and removal of the internal auditor charged with auditing and evaluating the Company’s system of internal controls;
-
review in advance the type and presentation of financial information and earnings guidance provided to analysts and rating agencies;
-
monitor matters related to compliance by employees with the Company’s standards of business conduct policies;
-
monitor policies with respect to risk assessment and risk management and initiatives to control risk exposures;
-
review any disclosure made in connection with annual and quarterly certifications by the chief executive officer and chief financial officer in filed documents;
-
consult with the Company’s general counsel regarding significant contingencies that could impact the financial statements and regarding legal compliance matters;
-
review any findings by regulatory agencies with respect to the Company’s activities;
150
-
investigate matters brought to its attention within the scope of its duties;
-
engage outside consultants, independent counsel or other advisors;
-
establish procedures for the receipt, retention and handling of complaints regarding accounting, internal controls or auditing matters, including procedures for the confidential and anonymous submission by employees of concerns regarding accounting or auditing matters;
-
establish the Company’s policies with respect to hiring former employees of the independent public accountants;
-
consult with management on the structure and composition of the finance organization; and
-
review annually the Committee’s performance.
As part of each regularly scheduled meeting, the Audit Committee meets in separate executive sessions with the independent public accountants, the internal auditors and senior management, and as a Committee without members of management.
Compensation and Management Development Committee. The four members of the Compensation and Management Development Committee (the “Compensation Committee”), William R. Newlin (chair), David W. Devonshire, Ivor J. Evans and James E. Marley, are non-employee directors who meet the criteria for independence specified in the listing standards of the New York Stock Exchange and are not eligible to participate in any of the plans or programs that are administered by the Committee. The Compensation Committee held four regularly scheduled meetings in fiscal year 2009 and one telephonic meeting. Under the terms of its charter, the Compensation Committee has the authority to:
-
review and approve the goals and objectives relevant to the Chief Executive Officer’s compensation, evaluate his performance against these goals and objectives, and set his compensation accordingly;
-
fix salaries of all of the Company’s other officers and review the salary plan for other Company executives;
-
evaluate the performance of the Company’s senior executives and plans for management succession and development;
-
review the design and competitiveness of the Company’s compensation plans and medical benefit plans, and make recommendations to the Board of Directors;
-
administer the Company’s incentive, deferred compensation, stock option and long-term incentives plans (except with respect to any equity grants to directors, which are administered by the Corporate Governance and Nominating Committee);
-
review all material amendments to the Company’s pension plans and make recommendations to the Board concerning these amendments;
-
hire outside consultants and independent counsel; and
-
review annually the Committee’s performance.
See Executive Compensation - Compensation Discussion and Analysis below for further information on the scope of authority of the Compensation Committee and the role of management and compensation consultants in determining or recommending the amount or form of executive compensation.
Corporate Governance and Nominating Committee. The Corporate Governance and Nominating Committee is currently composed of four non-employee directors, Rhonda L. Brooks (chair), Joseph B. Anderson, Jr., William R. Newlin and Steven G. Rothmeier, all of whom meet the criteria for independence specified in the listing standards of the New York Stock Exchange. The Corporate Governance and Nominating Committee held four regularly scheduled meetings in fiscal year 2009. Under the terms of its charter, this Committee has the authority to:
-
screen and recommend to the Board qualified candidates for election as directors of the Company;
-
periodically prepare and submit to the Board for adoption the Committee’s selection criteria for director nominees;
-
recommend to the Board and management a process for new Board member orientation;
-
periodically assess the performance of the Board;
-
consider matters of corporate governance and Board practices and recommend improvements to the Board;
151
-
review periodically the Company’s charter and by-laws in light of statutory changes and current best practices;
-
review periodically the charter, responsibilities, membership and chairmanship of each committee of the Board and recommend appropriate changes;
-
review periodically outside directors’ compensation and make recommendations to the Board;
-
review director independence, conflicts of interest, qualifications and conduct and recommend to the Board removal of a director when appropriate;
-
engage search firms and other consultants and independent counsel; and
-
review annually the Committee’s performance.
In discharging its duties with respect to review of director compensation, the Corporate Governance and Nominating Committee retains a compensation consultant, Hewitt Associates L.L.C., to provide information on current trends, develop market data and provide objective recommendations as to the amount and form of director compensation. Management has no role in determining or recommending the amount or form of director compensation.
Environmental and Social Responsibility Committee. The Environmental and Social Responsibility Committee is composed of four non-employee directors, Joseph B. Anderson, Jr. (chair), Rhonda L. Brooks, Victoria B. Jackson and James E. Marley. This Committee held one regularly scheduled meeting in fiscal year 2009. Under the terms of its charter, the Committee reviews and assesses the Company’s policies and practices in the following areas and recommends revisions as appropriate: employee relations, with emphasis on equal employment opportunity and advancement; the protection and enhancement of the environment and energy resources; product integrity and safety; employee health and safety; and community and civic relations, including programs for and contributions to health, educational, cultural and other social institutions. The Committee also reviews its performance annually.
CERTAIN RELATIONSHIPS AND RELATED TRANSACTIONS
Since October 1, 2008 (the beginning of fiscal year 2009), there have been no transactions or currently proposed transactions, in which the Company was or is to be a participant and the amount involved exceeds $120,000, and in which any director, officer or member of their immediate family had or will have a direct or indirect material interest.
Various means are employed to solicit information about relationships or transactions involving officers and directors that could raise questions of conflict of interest. Annual questionnaires solicit information from directors and officers regarding transactions and relationships that could trigger SEC rules on disclosure of related person transactions, as well as relationships and transactions that could impair a director’s independence under the rules of the New York Stock Exchange. Directors and officers have a continuing duty to update the information should any changes occur during the year. In addition, all salaried employees, including officers and directors, have a duty to report any known conflicts of interest that would violate the Company’s code of ethics (including policies regarding standards of business conduct and conflicts of interest; see Code of Ethics above). A toll-free employee Helpline is available for that purpose. Salaried employees, including officers, are also required to complete an annual certification that they are unaware of, or have reported, any such conflict of interest.
We have no written policy regarding review, approval or ratification of related person transactions. The Business Standards Compliance Committee (which is made up of management personnel) and the Audit Committee have responsibility for review of compliance by officers and other employees with the code of ethics, including conflict of interest provisions, and the Corporate Governance and Nominating Committee has similar responsibility with respect to compliance by directors. If a transaction or relationship involving an officer or director were to be reported through the employee Helpline, annual compliance certifications, questionnaires or otherwise, the appropriate Committee would investigate and consider all relevant facts and circumstances, including the nature, amount and terms of the transaction; the nature and amount of the related person’s interest in the transaction; the importance of the transaction to the related person and to the Company; whether the transaction would impair the judgment of a director or officer to act in the Company’s best interest; and any other facts involving the transaction that the Committee deems significant, and would then take appropriate action. Transactions will not be approved under the code of ethics if they are not in the Company’s best interests. Any Committee member who is a related person in connection with a transaction would not participate in the Committee’s consideration.
152
Item 14. Principal Accountant Fees and Services.
INDEPENDENT ACCOUNTANTS’ FEES
During the last two fiscal years, Deloitte & Touche LLP billed ArvinMeritor and its subsidiaries the following fees for its services:
| Fiscal Year Ending September 30, | |||||
| 2008 | 2009 | ||||
| Audit fees(a) | $ | 7,818,000 | $ | 6,321,000 | |
| Audit-related fees(b) | 2,099,000 | 246,000 | |||
| Tax fees(c) | 5,022,000 | 3,045,000 | |||
| All other fees | 100,000 | — | |||
| TOTAL | $ | 15,039,000 | $ | 9,612,000 | |
| (a) | Includes fees related to compliance with Section 404 of the Sarbanes-Oxley Act of 2002. | |
| (b) | Includes fees for employee benefit plan audits and data validation procedures. | |
| (c) | Includes fees for tax consulting and compliance. | |
Pursuant to its charter, the Audit Committee is responsible for selection, approving compensation and overseeing the independence, qualifications and performance of the independent accountants. The Audit Committee’s policy is to pre-approve all audit and permissible non-audit services provided by the independent accountants. Pre-approval is generally provided for up to one year, is detailed as to the particular service or category of services and is generally subject to a specific budget. The Audit Committee may also pre-approve particular services on a case-by-case basis. In assessing requests for services by the independent accountants, the Audit Committee considers whether such services are consistent with the auditor’s independence; whether the independent accountants are likely to provide the most effective and efficient service based upon their familiarity with the Company; and whether the service could enhance the Company’s ability to manage or control risk or improve audit quality.
All of the audit-related, tax and other services provided by Deloitte in fiscal years 2008 and 2009 (described in the footnotes to the table above) and related fees were approved in advance by the Audit Committee.
PART IV
Item 15. Exhibits and Financial Statement Schedules.
(a) Financial Statements, Financial Statement Schedules and Exhibits.
(1) Financial Statements (all financial statements listed below are those of the company and its consolidated subsidiaries):
Consolidated Statement of Operations, years ended September 30, 2009, 2008 and 2007.
Consolidated Balance Sheet, September 30, 2009 and 2008.
Consolidated Statement of Cash Flows, years ended September 30, 2009, 2008 and 2007.
Consolidated Statement of Shareowners' Equity, years ended September 30, 2009, 2008 and 2007.
Notes to Consolidated Financial Statements.
Report of Independent Registered Public Accounting Firm.
153
(2) Financial Statement Schedule for the years ended September 30, 2009, 2008 and 2007.
| Page | ||
| Schedule II - Valuation and Qualifying Accounts | S-1 |
Schedules not filed with this Annual Report on Form 10-K are omitted because of the absence of conditions under which they are required or because the information called for is shown in the financial statements or related notes.
(3) Exhibits
| 3-a |
Restated Articles of Incorporation of ArvinMeritor, filed as Exhibit 4.01 to ArvinMeritor’s Registration Statement on Form S-4, as amended (Registration Statement No. 333-36448) ("Form S-4"), is incorporated by reference. |
|
3-b |
By-laws of ArvinMeritor, filed as Exhibit 3 to ArvinMeritor's Quarterly Report on Form 10-Q for the quarterly period ended June 29, 2003 (File No. 1-15983), is incorporated by reference. |
|
4-a |
Rights Agreement, dated as of July 3, 2000, between ArvinMeritor and The Bank of New York (successor to EquiServeTrust Company, N.A.), as rights agent, filed as Exhibit 4.03 to the Form S-4, is incorporated by reference. |
|
4-b |
Indenture, dated as of April 1, 1998, between ArvinMeritor and The Bank of New York Mellon Trust Company (as successor to BNY Midwest Trust Company as successor to The Chase Manhattan Bank), as trustee, filed as Exhibit 4 to Meritor's Registration Statement on Form S-3 (Registration No. 333-49777), is incorporated by reference. |
|
4-b-1 |
First Supplemental Indenture, dated as of July 7, 2000, to the Indenture, dated as of April 1, 1998, between ArvinMeritor and The Bank of New York Mellon Trust Company (as successor to BNY Midwest Trust Company as successor to The Chase Manhattan Bank), as trustee, filed as Exhibit 4-b-1 to ArvinMeritor's Annual Report on Form 10-K for the fiscal year ended September 30, 2000 (File No. 1-15983) (“2000 Form 10-K”), is incorporated by reference. |
|
4-b-2 |
Third Supplemental Indenture, dated as of June 23, 2006, to the Indenture, dated as of April 1, 1998, between ArvinMeritor and The Bank of New York Mellon Trust Company (as successor to BNY Midwest Trust Company as successor to The Chase Manhattan Bank), as trustee (including Subsidiary Guaranty dated as of June 23, 2006), filed as Exhibit 4.2 to ArvinMeritor’s Current Report on Form 8-K, dated June 23, 2006 and filed on June 27, 2006 (File No. 1-15983)(“June 23, 2006 Form 8-K”), is incorporated by reference. |
|
4-c |
Indenture dated as of July 3, 1990, as supplemented by a First Supplemental Indenture dated as of March 31, 1994, between ArvinMeritor and The Bank of New York Mellon Trust Company (as successor to BNY Midwest Trust Company as successor to Harris Trust and Savings Bank), as trustee, filed as Exhibit 4-4 to Arvin's Registration Statement on Form S-3 (Registration No. 33-53087), is incorporated by reference. |
|
4-c-1 |
Second Supplemental Indenture, dated as of July 7, 2000, to the Indenture dated as of July 3, 1990, between ArvinMeritor and The Bank of New York Mellon Trust Company (as successor to BNY Midwest Trust Company as successor to Harris Trust and Savings Bank), as trustee, filed as Exhibit 4-c-1 to the 2000 Form 10-K, is incorporated by reference. |
|
4-c-2 |
Fourth Supplemental Indenture, dated as of June 23, 2006, to the Indenture, dated as of July 3, 1990, between ArvinMeritor and The Bank of New York Mellon Trust Company (as successor to BNY Midwest Trust Company as successor to Harris Trust and Savings Bank), as trustee (including Subsidiary Guaranty dated as of June 23, 2006), filed as Exhibit 4.3 to the June 23, 2006 Form 8-K, is incorporated by reference. |
|
4-d |
Indenture, dated as of March 7, 2006, between ArvinMeritor and The Bank of New York Mellon Trust Company (as successor to BNY Midwest Trust Company) as trustee, filed as Exhibit 4.1 to ArvinMeritor’s Current Report on Form 8-K, dated March 7, 2006 and filed on March 9, 2006 (File No. 1-15983), is incorporated by reference. |
|
4-d-1 |
First Supplemental Indenture, dated as of June 23, 2006, to the Indenture, dated as of March 7, 2006, between ArvinMeritor and The Bank of New York Mellon Trust Company (as successor to BNY Midwest Trust Company) as trustee (including Subsidiary Guaranty dated as of June 23, 2006), filed as Exhibit 4.1 to the June 23, 2006 Form 8-K, is incorporated by reference. |
|
4-e |
Indenture, dated as of February 8, 2007, between ArvinMeritor and The Bank of New York Trust Company, N.A., as trustee (including form of Subsidiary Guaranty dated as of February 8, 2007), filed as Exhibit 4-a to ArvinMeritor’s Quarterly Report on Form 10-Q for the quarterly period ended April 1, 2007 (File No. 1-15983), is incorporated by reference. |
154
| 10-a |
Credit Agreement, dated as of June 23, 2006, by and among ArvinMeritor, ArvinMeritor Finance Ireland, the institutions from time to time parties thereto as lenders, JP Morgan Chase Bank, National Association, as Administrative Agent, Citicorp North America, Inc. and UBS Securities LLC, as Syndication Agents, ABN AMRO Bank N.V., BNP Paribas and Lehman Commercial Paper Inc., as Documentation Agents, and J.P. Morgan Securities Inc. and Citigroup Global Markets, as Joint Lead Arrangers and Joint Book Runners, filed as Exhibit 10.1 to the June 23, 2006 Form 8-K, is incorporated by reference. |
|
10-a-1 |
Subsidiary Guaranty, dated as of June 23, 2006, by and among the subsidiary guarantors and JPMorgan Chase Bank, National Association, as Administrative Agent, for the benefit of itself, the lenders and other holders of guaranteed obligations, filed as Exhibit 10.2 to the June 23, 2006 Form 8-K, is incorporated by reference. |
| 10-a-2 |
Pledge and Security Agreement, dated as of June 23, 2006, by and among ArvinMeritor, the subsidiaries named therein and JPMorgan Chase Bank, National Association, as Administrative Agent, filed as Exhibit 10.3 to the June 23, 2006 Form 8-K, is incorporated by reference. |
| 10-a-3 |
Amendment No. 1 to Credit Agreement, dated as of February 23, 2007, among ArvinMeritor, the financial institutions party thereto and JPMorgan Chase Bank, National Association, as Administrative Agent, filed as Exhibit 10 to the Current Report on Form 8-K dated and filed on February 23, 2007 (File No. 1-15983), is incorporated by reference. |
| 10-a-4 |
Amendment No. 2 to Credit Agreement, dated as of October 2, 2007, among ArvinMeritor, the financial institutions party thereto and JPMorgan Chase Bank, National Association, as Administrative Agent, filed as Exhibit 10 to the Current Report on Form 8-K dated October 2, 2007 and filed on October 3, 2007 (File No. 1-15983), is incorporated by reference. |
| 10-a-5 |
Amendment No. 3 to Credit Agreement, dated as of October 26, 2007, among ArvinMeritor, the financial institutions party thereto and JPMorgan Chase Bank, National Association, as Administrative Agent, filed as Exhibit 10 to the Current Report on Form 8-K dated October 26, 2007 and filed on October 30, 2007 (File No. 1-15983), is incorporated by reference. |
| 10-a-6 |
Amendment No. 4 to Credit Agreement, dated as of December 10, 2007, among ArvinMeritor, the financial institutions party thereto and JPMorgan Chase Bank, National Association, as Administrative Agent, filed as Exhibit 10 to the Current Report on Form 8-K filed on December 11, 2007 is incorporated herein by reference. |
| *10-b-1 |
1997 Long-Term Incentives Plan, as amended and restated, filed as Exhibit 10 to ArvinMeritor’s Current Report on Form 8-K dated and filed on April 20, 2005 (File No. 1-15983), is incorporated by reference. |
| *10-b-2 |
Form of Restricted Stock Agreement under the 1997 Long-Term Incentives Plan, filed as Exhibit 10-a-2 to Meritor’s Annual Report on Form 10-K for the fiscal year ended September 30, 1997 (File No. 1-13093), is incorporated by reference. |
| *10-b-3 |
Form of Option Agreement under the 1997 Long-Term Incentives Plan, filed as Exhibit 10(a) to Meritor's Quarterly Report on Form 10-Q for the quarterly period ended March 31, 1998 (File No. 1-13093), is incorporated by reference. |
| *10-b-4 |
Form of Performance Share Agreement under the 1997 Long-Term Incentives Plan, filed as Exhibit 10-b to ArvinMeritor’s Current Report on Form 8-K, dated December 7, 2004 and filed on December 9, 2004 (File No. 1-15983), is incorporated by reference. |
| *10-b-5 |
Description of Performance Goals Established in connection with 2009-2011 Cash Performance Plan under the 1997 Long-Term Incentives Plan, filed as Exhibit 10-a to ArvinMeritor’s Current Report on Form 8-K, dated December 9, 2008 (File No. 1-15983), is incorporated by reference. |
| *10-b-6 |
Description of Performance Goals Established in connection with 2008-2010 Cash Performance Plan under the 2007 Long Term Incentive Plan, filed as Exhibit 10a to the Current Report on Form 8-K filed on December 19, 2007 is incorporated herein by reference. |
| *10-b-7 |
Description of Annual Incentive Goals Established for Fiscal year 2010 under the Incentive Compensation Plan, filed as Exhibit 10a to the Current Report on Form 8-K filed on November 12, 2009 is incorporated herein by reference. |
155
| *10-b-7a |
Description of Performance Goals established in connection with 2010-2012 Cash Performance Plan, filed as Exhibit 10-b to Current Report on Form 8-K filed on November 12, 2009 is incorporated herein by reference. |
| *10-c |
2007 Long-Term Incentive Plan, as amended, filed as Exhibit 10-a to ArvinMeritor’s Quarterly Report on Form 10-Q for the quarterly period ended April 1, 2007 (File No. 1-15983), is incorporated by reference. |
| *10-c-1 |
Form of Restricted Stock Agreement under the 2007 Long-Term Incentive Plan, filed as Exhibit 10-c-1 to ArvinMeritor’s Annual Report on Form 10-K for the fiscal year ended September 30, 2007. |
| *10-d |
Description of Compensation of Non-Employee Directors. |
| *10-e |
2004 Directors Stock Plan, filed as Exhibit 10-a to ArvinMeritor’s Quarterly Report on Form 10-Q for the quarterly period ended March 28, 2004 (File No. 1-15983), is incorporated by reference. |
| *10-e-1 |
Form of Restricted Share Unit Agreement under the 2004 Directors Stock Plan, filed as Exhibit 10-c-3 to ArvinMeritor’s Annual Report on Form 10-K for the fiscal year ended October 3, 2004 (File No. 1-15983), is incorporated by reference. |
| *10-e-2 |
Form of Restricted Stock Agreement under the 2004 Directors Stock Plan, filed as Exhibit 10-c-4 to ArvinMeritor’s Annual Report on Form 10-K for the fiscal year ended October 2, 2005 (Filed No. 1-15983), is incorporated by reference. |
| *10-e-3 |
Option Agreement under the 2007 Long-Term Incentive Plan between ArvinMeritor and Charles G. McClure filed as Exhibit 10-c to ArvinMeritor’s Quarterly report on Form 10-Q for the quarterly period ended June 30, 2008 is incorporated herein by reference. |
| *10-e-4 |
Restricted Stock Agreement under the 2007 Long-term Incentive Plan between ArvinMeritor and Charles G. McClure filed as Exhibit 10-d to ArvinMeritor’s Quarterly Report on form 10-Q for the quarterly period ended June 30, 2008 is incorporated herein by reference. |
| *10-f |
Incentive Compensation Plan, as amended and restated as of November 6, 2009. |
| *10-f-1 |
Form of Deferred Share Agreement, filed as Exhibit 10-a to ArvinMeritor’s Quarterly Report on Form 10-Q for the quarterly period ended January 2, 2005 (File No. 1-15983), is incorporated by reference. |
| *10-g |
Copy of resolution of the Board of Directors of ArvinMeritor, adopted on July 6, 2000, providing for its Deferred Compensation Policy for Non-Employee Directors, filed as Exhibit 10-f to the 2000 Form 10-K, is incorporated by reference. |
| *10-h |
Deferred Compensation Plan, filed as Exhibit 10-e-1 to Meritor's Annual Report on Form 10-K for the fiscal year ended September 30, 1998 (File No. 1-13093), is incorporated by reference. |
| *10-i |
1998 Stock Benefit Plan, as amended, filed as Exhibit (d)(2) to ArvinMeritor's Schedule TO, Amendment No. 3 (File No. 5-61023), is incorporated by reference. |
| *10-j |
Employee Stock Benefit Plan, as amended, filed as Exhibit (d)(3) to ArvinMeritor’s Schedule TO, Amendment No. 3 (File No. 5-61023), is incorporated by reference. |
| *10-k |
1988 Stock Benefit Plan, as amended, filed as Exhibit 10 to Arvin's Quarterly Report on Form 10-Q for the quarterly period ended July 3, 1988, and as Exhibit 10(E) to Arvin's Quarterly Report on Form 10-Q for the quarterly period ended July 4, 1993 (File No. 1-302), is incorporated by reference. |
| 10-l |
Loan and Security Agreement dated as of September 8, 2009 among ArvinMeritor Receivables Corporation, ArvinMeritor, Inc., GMAC Commercial Finance LLC, and the Lenders from time to time party thereto (the "Loan Agreement"), dated September 8, 2009 and filed as exhibit 10a to ArvinMeritor’s Current Report on Form 8-K filed on September 10, 2009, is incorporated herein by reference. |
156
|
10-m |
Third Amended and Restated Purchase and Sale Agreement dated as of September 8, 2009 (the "Purchase Agreement") among ArvinMeritor Receivables Corporation and Meritor Heavy Vehicle Braking Systems (U.S.A.), Inc. and Meritor Heavy Vehicle Systems LLC, filed as exhibit 10b to ArvinMeritor’s Current Report on Form 8-K, dated September 8, 2009 and filed on September 10, 2009, is incorporated herein by reference. |
| *10-n |
Employment agreement between the company and Charles G. McClure, Jr., dated as of September 14, 2009 |
| *10-o |
Employment agreement between the company and James D. Donlon, III, filed as Exhibit 10b to ArvinMeritor’s Current Report on Form 8-K, dated September 14, 2009 and filed on September 18, 2009 (File No. 1-15983), is incorporated by reference. |
| *10-q |
Employment agreement between ArvinMeritor and Carsten J. Reinhardt, dated as of September 14, 2009. |
| *10-r |
Employment agreement, dated as of September 14, 2009, between ArvinMeritor and Jeffrey A. Craig. |
| *10-s |
Employment agreement, dated as of September 14, 2009, between ArvinMeritor and Vernon Baker. |
| *10-t |
Employment agreement, dated as of September 14, 2009, between ArvinMeritor and Mary Lehmann. |
| *10-u |
Employment agreement, dated as of September 14, 2009, between ArvinMeritor and Lin Cummins. |
| *10-v |
Employment agreement, dated as of September 14, 2009, between ArvinMeritor and Barbara Novak. |
| *10-w |
Form of employment letter between ArvinMeritor and its executives, filed as Exhibit 10-a to ArvinMeritor’s Current Report on Form 8-K, dated September 14, 2009 and filed on September 18, 2009 (File No. 1-15983), is incorporated by reference. |
| 10-x |
Receivables Purchase Agreement dated November 19, 2007 between ArvinMeritor CVS Axles France and Viking Asset Purchaser and CitiCorp Trustee Company Limited, filed as Exhibit 10-t to ArvinMeritor’s Report on Form 10-K for the fiscal year ended September 30, 2008 is incorporated herein by reference. |
| 10-y |
Receivables Purchase Agreement dated March 13, 2006 between Meritor HVS AB and Nordic Finance Limited and CitiCorp Trustee Company Limited filed as Exhibit 10-u to ArvinMeritor’s Report on Form 10-K for the fiscal year ended September 30, 2008 is incorporated herein by reference |
| 10-z |
Amendment, dated July 25, 2007, to Receivables Purchase Agreement dated March 13, 2006 between Meritor HVS AB and Nordic Finance Limited and CitiCorp Trustee Company Limited filed as Exhibit 10-v to ArvinMeritor’s Report on Form 10-K for the fiscal year ended September 30, 2008 is incorporated herein by reference. |
| 10-zz |
Purchase and Sale Agreement dated August 4, 2009 among ArvinMeritor, Iochpe-Maxion, S.A. and the other parties listed therein, filed as Exhibit 10 to ArvinMeritor’s Report on Form 10-Q for the Quarter ended June 28, 2009 is incorporated by reference. |
| 12 |
Computation of ratio of earnings to fixed charges. |
| 21 |
List of subsidiaries of ArvinMeritor. |
| 23-a |
Consent of Vernon G. Baker, II, Esq., Senior Vice President and General Counsel of ArvinMeritor. |
| 23-b |
Consent of Deloitte & Touche LLP, independent registered public accounting firm. |
| 23-c |
Consent of Bates White LLC. |
| 24 |
Power of Attorney authorizing certain persons to sign this Annual Report on Form 10-K on behalf of certain directors and officers of ArvinMeritor. |
| 31-a |
Certification of the Chief Executive Officer pursuant to Rule 13a-14(a) under the Exchange Act. |
157
|
31-b |
Certification of the Chief Financial Officer pursuant to Rule 13a-14(a) under the Exchange Act. |
|
32-a |
Certification of the Chief Executive Officer pursuant to Rule 13a-14(b) under the Exchange Act and 18 U.S.C. Section 1350. |
|
32-b |
Certification of the Chief Financial Officer pursuant to Rule 13a-14(b) under the Exchange Act and 18 U.S.C. Section 1350. |
____________________
* Management contract or compensatory plan or arrangement.
158
SIGNATURES
Pursuant to the requirements of Section 13 or 15(d) of the Securities Exchange Act of 1934, the registrant has duly caused this report to be signed on its behalf by the undersigned, thereunto duly authorized.
|
ARVINMERITOR, INC. | ||
| By: |
/s/ Vernon G. Baker, II | |
|
Vernon G. Baker, II | ||
|
Senior Vice President and General Counsel | ||
Date: November 18, 2009
Pursuant to the requirements of the Securities Exchange Act of 1934, this report has been signed below on the XXst day of November, 2009 by the following persons on behalf of the registrant and in the capacities indicated.
|
Charles G. McClure, Jr.* |
Chairman of the Board, Chief
Executive Officer and President | |
|
Joseph B. Anderson, Jr.,
Rhonda L. Brooks, |
Directors | |
|
Jeffrey A. Craig* |
Senior Vice President and Chief Financial Officer | |
|
Daniel R. Hopgood* |
Controller (principal accounting officer) |
|
* By: |
/s/ Barbara Novak |
|
Barbara Novak | |
|
Attorney-in-fact** |
** By authority of powers of attorney filed herewith.
159
SCHEDULE II
ARVINMERITOR, INC.
VALUATION AND QUALIFYING ACCOUNTS
For the Year Ended
September 30, 2009, 2008, 2007
| Balance at | Charged to costs | Other | Balance at End | |||||||||||
| Description (In millions) | Beginning of Year | and expenses | Deductions | of year | ||||||||||
| Year ended September 30, 2009: | ||||||||||||||
| Allowance for doubtful accounts | $ | 17 | $ | 12 | $ | (11 | ) | (a) | $ | 18 | ||||
| Deferred tax asset valuation allowance | 271 | 797 | 150 | (b) | 1,218 | |||||||||
| Year ended September 30, 2008: | ||||||||||||||
| Allowance for doubtful accounts | $ | 23 | $ | 11 | $ | (17 | ) | (a) | $ | 17 | ||||
| Deferred tax asset valuation allowance | 204 | 70 | (3 | ) | 271 | |||||||||
| Year ended September 30, 2007: | ||||||||||||||
| Allowance for doubtful accounts | $ | 13 | $ | 16 | $ | (6 | ) | (a) | $ | 23 | ||||
| Deferred tax asset valuation allowance | 143 | 60 | 1 | 204 | ||||||||||
(a) Uncollectible accounts written off
(b) Primarily relates to revaluation of defined pension and retiree medical obligations
S-1