Attached files
| file | filename |
|---|---|
| 8-K - FORM 8-K - Orchids Paper Products CO /DE | form8k.htm |
Exhibit 99.1
![]()
Forward-looking statements
This presentation contains certain forward-looking statements. The forward-looking statements reflect the Company’s views about future events and are subject to risks, uncertainties, assumptions and changes in circumstances that may cause actual results to differ materially. For a list and description of such risks and uncertainties, see the reports filed by the Company with the Securities and Exchange Commission, including the Company’s Form 10-K for the year ended December 31, 2008 and the Company’s Form 10-Q for the quarter ended June 30, 2009. Although the Company believes the expectations reflected in such forward-looking statements are based on reasonable assumptions, it can give no assurance that its expectations will be realized. The Company disclaims any intention or obligation to update or revise any forward-looking statements, whether as a result of new information, future events or otherwise.
|
Expansion project update | ||
| Expansion project on track | ||
| New converting line progress | ||
|
- |
Successful speed trials completed | |
|
-
|
New BT micro emboss provides significant improvement in softness and “look” | |
| Warehouse progress | ||
|
- |
Building construction underway | |
|
- |
Occupancy of first half of warehouse by mid-May 2010 | |
|
- |
Projected 100% completion by mid-July | |
1
Follow-on offering a success
- Offering closed in August
- Net proceeds of $14.8 million
Strong sales trends
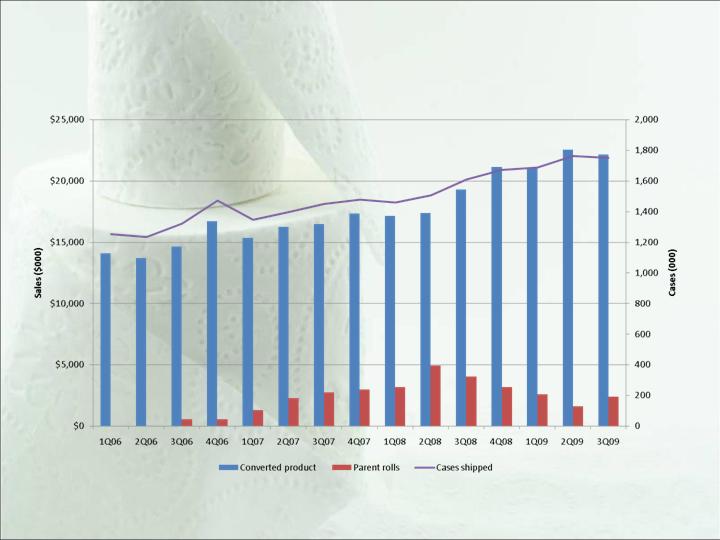
Positive sales and earnings trends

Net debt trends
$ millions
| 1Q06 | 2Q06 | 3Q06 | 4Q06 | 1Q07 | 2Q07 | 3Q07 | 4Q07 | |||||||||||||||||
| Total debt | $ | 27.0 | $ | 31.1 | $ | 32.1 | $ | 32.0 | $ | 32.3 | $ | 30.4 | $ | 27.7 | $ | 25.2 | ||||||||
| Cash& ST investments | $ | - | $ | - | $ | - | $ | - | $ | - | $ | - | $ | - | $ | - | ||||||||
| Net debt | $ | 27.0 | $ | 31.1 | $ | 32.1 | $ | 32.0 | $ | 32.3 | $ | 30.4 | $ | 27.7 | $ | 25.2 | ||||||||
| 1Q08 | 2Q08 | 3Q08 | 4Q08 | 1Q09 | 2Q09 | 3Q09 | ||||||||||||||||||
| Total debt | $ | 25.8 | $ | 24.9 | $ | 25.4 | $ | 24.1 | $ | 21.9 | $ | 22.6 | $ | 24.1 | ||||||||||
| Cash& ST investments | $ | - | $ | - | $ | - | $ | - | $ | 1.6 | $ | 4.3 | $ | 22.8 | ||||||||||
| Net debt | $ | 25.8 | $ | 24.9 | $ | 25.4 | $ | 24.1 | $ | 20.3 | $ | 18.3 | $ | 1.2 | ||||||||||
5
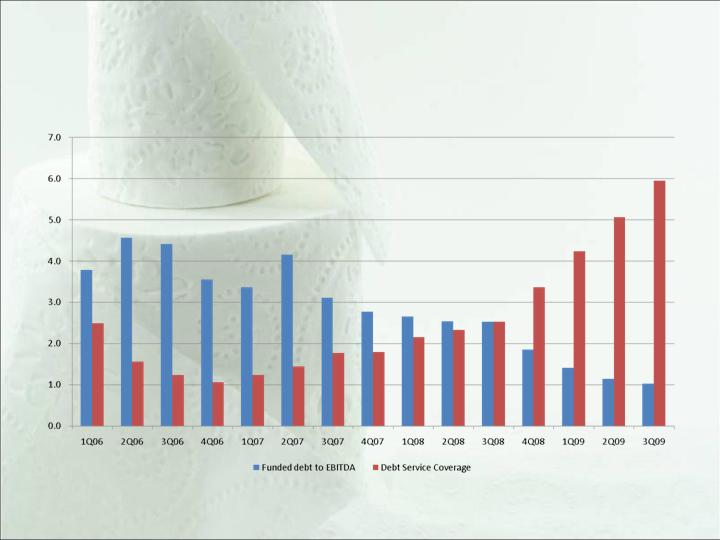
Positive financial ratio trends
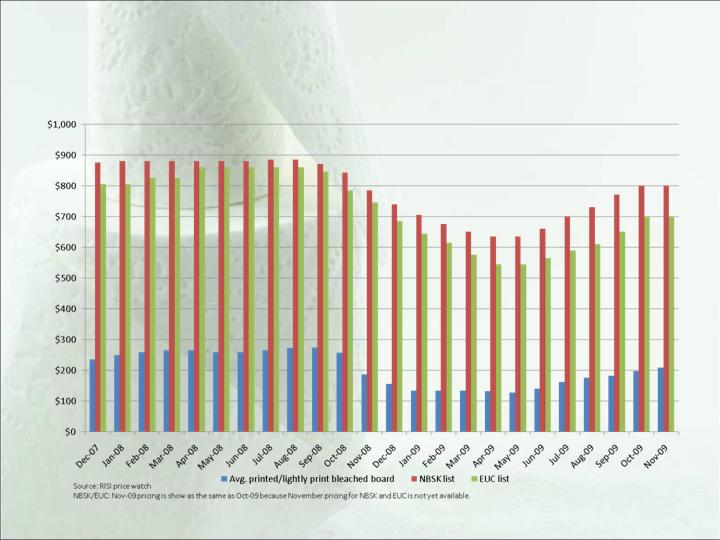
Waste paper has cost advantage to
purchased Kraft – price trends increasing
Non-GAAP explanation
In addition to our Generally Accepted Accounting Principles ("GAAP") results, we also consider non-GAAP measures of our performance for a number of purposes. We use Net Debt as a supplemental measure of our leverage that is not required by, or presented in accordance with, GAAP. Net Debt represents total debt minus cash and short term investments. The table on page 5 reconciles Net Debt to GAAP figures.
We also use Earnings before Interest, Taxes, Depreciation, and Amortization ("EBITDA") as a supplemental measure of our performance that is not required by, or presented in accordance with, GAAP. EBITDA represents net income before net interest expense, income tax expense, depreciation and amortization. The table on the next page reconciles EBITDA to net income for each reported quarter from 1Q 2006 to 3Q 2009:
8
Reconciliation of non-GAAP
measures
| 1Q06 | 2Q06 | 3Q06 | 4Q06 | 1Q07 | 2Q07 | 3Q07 | 4Q07 | 1Q08 | 2Q08 | 3Q08 | 4Q08 | 1Q09 | 2Q09 | 3Q09 | |||||||||||||||||||||||||||||||
| (In thousands) | |||||||||||||||||||||||||||||||||||||||||||||
| EBITDA Reconciliation: | |||||||||||||||||||||||||||||||||||||||||||||
| Net Income | $ | 182 | $ | (292 | ) | $ | (151 | ) | $ | 993 | $ | (131 | ) | $ | 743 | $ | 1,136 | $ | 850 | $ | 611 | $ | 887 | $ | 1,423 | $ | 2,270 | $ | 2,797 | $ | 3,775 | $ | 3,815 | ||||||||||||
| Plus: Interest Expense | 47 | 243 | 836 | 854 | 873 | 708 | 635 | 612 | 411 | 320 | 310 | 321 | 159 | 135 | 174 | ||||||||||||||||||||||||||||||
| Plus: Income Tax Expense | 98 | (174 | ) | 65 | (553 | ) | (49 | ) | 139 | 156 | 61 | 283 | 429 | 513 | 978 | 1,649 | 1,832 | 1,673 | |||||||||||||||||||||||||||
| Plus: Depreciation | 393 | 392 | 697 | 772 | 749 | 749 | 750 | 753 | 754 | 772 | 783 | 812 | 804 | 834 | 1,003 | ||||||||||||||||||||||||||||||
| Earnings Before Interest, Income Tax, Depreciation and Amortization |
$ | 720 | $ | 169 | $ | 1,447 | $ | 2,066 | $ | 1,442 | $ | 2,339 | $ | 2,677 | $ | 2,276 | $ | 2,059 | $ | 2,408 | $ | 3,029 | $ | 4,381 | $ | 5,409 | $ | 6,576 | $ | 6,665 |