Attached files
| file | filename |
|---|---|
| 8-K - FORM 8-K - FMC CORP | d8k.htm |
 * * * * * * * * * * * FMC Corporation Ingalls & Snyder LLC Seminar for Specialty Chemicals Companies New York, NY November 17, 2009 W. Kim Foster Senior Vice President and CFO Exhibit 99.1 |
 1 Disclaimer Safe Harbor Statement under the Private Securities Litigation Reform Act of 1995 These slides and the accompanying presentation contain “forward-looking
statements” that represent management’s best judgment as of the date hereof based on information currently available. Actual results of the Company may differ materially from those contained in the forward-looking statements.
Additional information concerning factors that may cause results to differ materially from those in the forward-looking statements is contained in the
Company’s periodic reports filed under the Securities Exchange Act of 1934,
as amended. The Company undertakes no obligation to update or revise these forward- looking statements to reflect new events or uncertainties. Non-GAAP Financial Terms These slides contain certain “non-GAAP financial terms” which are defined in the appendix. In addition, we have provided reconciliations of non-GAAP terms
to the closest GAAP term in the appendix. |
 2 FMC Corporation LTM ending September 30, 2009 ($ millions) FMC CORPORATION Revenue: $2,842 EBITDA:
$599 Margin*:
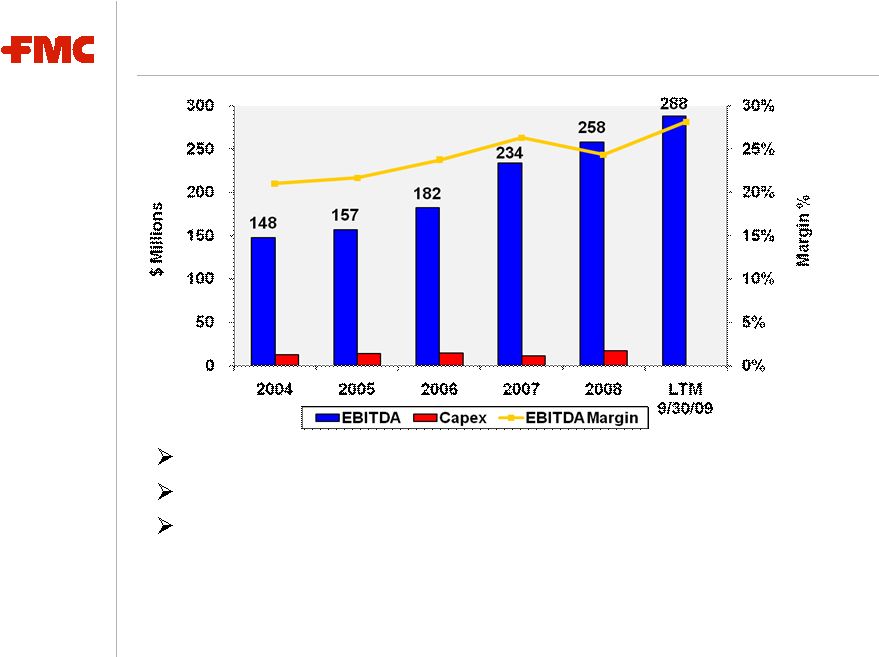
21.1% INDUSTRIAL CHEMICALS Revenue: $1,075 EBITDA: $180 Margin*: 16.7% AGRICULTURAL PRODUCTS Revenue: $1,023 EBITDA: $288 Margin*: 28.1% SPECIALTY CHEMICALS Revenue: $749 EBITDA: $186 Margin*: 24.8% * EBITDA margin Leading Market Positions Diverse End Markets - Low Correlation to Economic Cycles Diversified and Integrated Cost Structure Limited Dependence on Petrochemical Feedstocks |
 3 Realizing the inherent operating leverage within FMC • Sustaining earnings growth > 10% per year (1) • Maintaining return on capital > 12% Focusing the portfolio on higher growth businesses • Managing Specialty Chemicals and Agricultural Products for growth • Managing Industrial Chemicals for cash Maintaining financial strength and flexibility • Solid balance sheet, conservative liquidity profile, strong cash flow • Investing in higher growth businesses • Pursuing external growth opportunities • Returning cash to shareholders – dividend and share repurchase Disciplined Approach to Unlocking Value (1) Earnings before restructuring and other income and charges |
 4 Agricultural Products Strong niche positions in the Americas, Europe and Asia Proprietary, branded insecticides and herbicides Strategic Focus: • Selected products, crops and regions • Shifting to significantly shorter innovation cycle • Reducing global supply chain and overhead costs |
 5 Specialty Chemicals BioPolymers – pharmaceutical and food ingredients Lithium focus on specialties – pharmaceuticals and energy storage Strategic Focus: • Growing core market segments • Commercializing new technology platforms • Pursuing financially attractive bolt-on acquisitions |
 6 Industrial Chemicals #1 North American manufacturer of soda ash and peroxygens Low cost, proprietary production technologies Strategic Focus: • Managing for cash generation • Continued top line growth driven primarily by higher selling prices • Aggressive cost management |
 7 FMC in Summary Great businesses, each with EBITDA >$180 million Sustained double-digit earnings growth (1) • Diverse end-markets, low correlation to economic cycles • Diversified and integrated cost structure • Products aligned with global secular growth trends Strategic and financial flexibility • Solid balance sheet • Conservative liquidity profile • Strong cash flow Disciplined approach to unlocking value (1) Earnings before restructuring and other income and charges
|
 FMC
Corporation * * * * * * * * * * |
 FMC
Corporation Glossary of Financial Terms & Reconciliations of GAAP to Non-GAAP * * * * * * * * * * * |
 10 Non-GAAP Financial Terms These slides contain certain “non-GAAP financial terms” which are defined below. In addition, we have provided reconciliations of non-GAAP terms to the closest GAAP term in the appendix of this presentation. EBITDA (Earnings Before Interest, Taxes, Depreciation and Amortization) is the sum of Income (loss) from continuing operations before income taxes and Depreciation and Amortization. EBITDA Margin is the quotient of EBITDA (defined above) divided by Revenue. ROIC (Return on Invested Capital) is the sum of Earnings from continuing operations before restructuring and other income and charges and after- tax Interest expense divided by the sum of Short-term debt, Current portion of long-term debt, Long-term debt and Total shareholders’ equity.
|
 11 Segment Financial Terms These slides contain references to segment financial items. Some of the segment financial terms are “non-GAAP financial terms” and are defined below. In addition, we have provided reconciliations of non-GAAP terms to the closest GAAP term in the appendix of this presentation. EBITDA (Earnings Before Interest, Taxes, Depreciation and Amortization) for a segment is the sum of Income (loss) from continuing operations before income taxes for that segment and Depreciation and Amortization for that segment. EBITDA Margin for a segment is the quotient of EBITDA (defined above) divided by Revenue for that segment. |
 12 Reconciliation of consolidated income from continuing operations before income taxes (a GAAP measure) to EBITDA (a Non-GAAP measure) EBITDA Reconciliation: LTM 9/30/2009 (Unaudited, in $ millions) LTM 9/30/2009 Income (loss) from continuing operations before income taxes $336.0 Net Income attributable to non-controlling interests (11.2) Restructuring and other charges/(income), net 116.5 Impairment of Perorsa Joint Venture 1.4 Purchase accounting inventory fair value impact and other related inventory adjustments 6.0 Interest expense, net 27.1 Depreciation and amortization 123.4 EBITDA (Non-GAAP) $599.2 |
 13 Reconciliation of Segment Operating Profit (a GAAP measure) to EBITDA (a Non-GAAP measure) Segment EBITDA Reconciliation: LTM 9/30/2009 (Unaudited, in $ millions) LTM 9/30/2009 Segment Industrial Chemicals Specialty Chemicals Agricultural Products Segment Operating Profit (GAAP) $110.3 $154.6 $275.9 Add: Depreciation and Amortization 69.5 30.9 11.8 EBITDA (Non-GAAP) $179.8 $185.5 $287.7 |
 FMC
Corporation * * * * * * * * * * |