Attached files
| file | filename |
|---|---|
| EX-21 - EXHIBIT 21 - TETRA TECH INC | a2195448zex-21.htm |
| EX-23 - EXHIBIT 23 - TETRA TECH INC | a2195448zex-23.htm |
| EX-32.1 - EXHIBIT 32.1 - TETRA TECH INC | a2195448zex-32_1.htm |
| EX-31.2 - EXHIBIT 31.2 - TETRA TECH INC | a2195448zex-31_2.htm |
| EX-32.2 - EXHIBIT 32.2 - TETRA TECH INC | a2195448zex-32_2.htm |
| EX-31.1 - EXHIBIT 31.1. - TETRA TECH INC | a2195448zex-31_1.htm |
| EX-10.18 - EXHIBIT 10.18 - TETRA TECH INC | a2195448zex-10_18.htm |
Use these links to rapidly review the document
TABLE OF CONTENTS
Item 8. Financial Statements and Supplementary Data
UNITED STATES
SECURITIES AND EXCHANGE COMMISSION
Washington, D.C. 20549
FORM 10-K
| (Mark One) | ||
| ý | ANNUAL REPORT PURSUANT TO SECTION 13 OR 15(d) OF THE SECURITIES EXCHANGE ACT OF 1934 | |
For the Fiscal Year Ended September 27, 2009 |
||
or |
||
o |
TRANSITION REPORT PURSUANT TO SECTION 13 OR 15(d) OF THE SECURITIES EXCHANGE ACT OF 1934 |
|
For the Transition Period from to |
||
Commission File Number 0-19655 |
||
TETRA TECH, INC.
(Exact name of registrant as specified in its charter)
| Delaware | 95-4148514 | |
| (State or other jurisdiction of incorporation or organization) |
(I.R.S. Employer Identification No.) |
|
3475 East Foothill Boulevard, Pasadena, California 91107 (Address of principal executive offices) (Zip Code) |
||
(626) 351-4664 (Registrant's telephone number, including area code) |
||
Securities registered pursuant to Section 12(b) of the Act: |
||
Common Stock, $.01 par value |
The NASDAQ Stock Market LLC |
|
| (Title of class) | (Name of exchange) | |
Securities registered pursuant to Section 12(g) of the Act: |
||
None |
||
Indicate by check mark if the registrant is a well-known seasoned issuer, as defined in Rule 405 of the Securities Act. Yes ý No o
Indicate by check mark if the registrant is not required to file reports pursuant to Section 13 or 15(d) of the Act. Yes o No ý
Indicate by check mark whether the registrant (1) has filed all reports required to be filed by Section 13 or 15(d) of the Securities Exchange Act of 1934 during the preceding 12 months (or for such shorter period that the registrant was required to file such reports), and (2) has been subject to such filing requirements for the past 90 days. Yes ý No o
Indicate by check mark whether the registrant has submitted electronically and posted on its corporate Website, if any, every Interactive Data File required to be submitted and posted pursuant to Rule 405 of Regulation S-T (§232.405 of this chapter) during the preceding 12 months (or for such shorter period that the registrant was required to submit and post such files). Yes ý No o
Indicate by check mark if disclosure of delinquent filers pursuant to Item 405 of Regulation S-K (§229.405 of this chapter) is not contained herein, and will not be contained, to the best of registrant's knowledge, in definitive proxy or information statements incorporated by reference in Part III of this Form 10-K or any amendment to this Form 10-K. o
Indicate by check mark whether the registrant is a large accelerated filer, an accelerated filer, a non-accelerated filer, or a smaller reporting company. See the definitions of "large accelerated filer", "accelerated filer" and "smaller reporting company" in Rule 12b-2 of the Exchange Act.
| Large accelerated filer ý | Accelerated filer o | Non-accelerated filer o (Do not check if a smaller reporting company) |
Smaller reporting company o |
Indicate by check mark whether the registrant is a shell company (as defined in Rule 12b-2 of the Act). Yes o No ý
The aggregate market value of the registrant's common stock held by non-affiliates on March 30, 2009 was $1.2 billion (based upon the closing price of a share of registrant's common stock as reported by the Nasdaq National Market on that date).
On November 9, 2009, 61,271,004 shares of the registrant's common stock were outstanding.
DOCUMENT INCORPORATED BY REFERENCE
Portions of registrant's Proxy Statement for its 2010 Annual Meeting of Stockholders are incorporated by reference in Part III of this report where indicated.
2
3
This Annual Report on Form 10-K ("Report"), including the "Management's Discussion and Analysis of Financial Condition and Results of Operations," contains forward-looking statements regarding future events and our future results that are subject to the safe harbors created under the Securities Act of 1933 (the "Securities Act") and the Securities Exchange Act of 1934 (the "Exchange Act"). All statements other than statements of historical facts are statements that could be deemed forward-looking statements. These statements are based on current expectations, estimates, forecasts and projections about the industries in which we operate and the beliefs and assumptions of our management. Words such as "expects," "anticipates," "targets," "goals," "projects," "intends," "plans," "believes," "estimates," "seeks," "continues," "may," variations of such words, and similar expressions are intended to identify such forward-looking statements. In addition, statements that refer to projections of our future financial performance, our anticipated growth and trends in our businesses, and other characterizations of future events or circumstances, are forward-looking statements. Readers are cautioned that these forward-looking statements are only predictions and are subject to risks, uncertainties and assumptions that are difficult to predict, including those identified below under "Risk Factors," and elsewhere herein. Therefore, actual results may differ materially and adversely from those expressed in any forward-looking statements. We undertake no obligation to revise or update publicly any forward-looking statements for any reason.
We are a leading provider of consulting, engineering, program management, construction and technical services focusing on resource management, infrastructure and the environment. We serve our clients by providing cost-effective and innovative solutions to fundamental needs for water, environmental and energy services. We typically begin at the earliest stage of a project by applying science to problems and developing solutions tailored to our clients' needs and resources. Our solutions may span the entire life cycle of the project and include applied science, research and technology, engineering, design, construction management, construction, operations and maintenance, and information technology.
We are a full-service company with a global reach in the areas of water programs, environmental management and remediation, alternative energy and supporting infrastructure. Engineering News-Record ("ENR"), the leading trade journal for our industry, ranked us the nation's number one water services firm in its April 20, 2009, "Top 500 Design Firms" issue. Over the past year, ENR has also ranked us number one in water treatment/desalination, water transmission lines and aqueducts, and environmental management. Throughout the year, ENR has ranked Tetra Tech among the top 10 firms in several other service lines, including environmental science, dams and reservoirs, sanitary/storm sewers, clean air compliance, chemical and soil remediation, engineering/design, green design, education, hazardous waste, nuclear waste, marine and port facilities, auto plants, and manufacturing. We focus on both organic and acquisitive growth to expand our geographic reach, diversify our client base and increase the breadth and depth of our service offerings to address existing and emerging markets. As of fiscal 2009 year-end, we had approximately 10,000 employees worldwide, located primarily in North America.
We were incorporated in Delaware in February 1988 and are headquartered in Pasadena, California. Our predecessor company (the Water Management Group of Tetra Tech, Inc.) was a subsidiary of Honeywell, Inc. and was incorporated in 1966. The mailing address of our headquarters is 3475 East Foothill Boulevard, Pasadena, California 91107, and the telephone number at that location is (626) 351-4664. Our corporate website is located at www.tetratech.com. Through a link in the Investor Relations section of our website, we make available our filings with the Securities and Exchange Commission ("SEC") free of charge.
4
Our mission is to be the premier worldwide consulting and engineering firm focusing on natural resources, infrastructure and the environment. The following core principles form the underpinning of how we work together to serve our clients:
- •
- Service. We put our clients first. We listen closely to
better understand our clients' needs and deliver smart, cost-effective solutions that meet those needs.
- •
- Value. We take on our clients' problems as if they were
our own. We develop and implement real-world solutions that are cost-effective, efficient and practical.
- •
- Excellence. We bring superior technical capability,
disciplined project management, and excellence in safety and quality to all of our services.
- •
- Opportunity. Our people are our number one asset. Our workforce is diverse and includes leading experts in our fields. Our entrepreneurial nature and commitment to success provide challenges and opportunities for all of our associates.
Tetra Tech is part of the global consulting and engineering industry that serves public and private clients by addressing the fundamental needs for water, environmental services and renewable energy. Our industry provides technical studies, planning, design, and construction services that address clients' requirements for infrastructure, environmental restoration and protection, and the development of new sources of renewable energy. The industry's clients vary in size and scope from small local public agencies to national governments and large multi-national corporations. These clients seek service firms with high-caliber technical expertise, practical experience and multi-disciplinary capabilities to analyze their problems and develop the most appropriate and cost-effective solutions.
Many government and commercial organizations today face new, complex challenges due to increased competition for water resources, newly understood threats to human health and the environment, aging infrastructure, and the emerging demand for renewable energy sources. As a global company, we provide the breadth of technical knowledge and capabilities and the global reach to address our clients' needs in the areas of water, the environment and energy. We work for a wide variety of clients to solve diverse and challenging problems. Our water market consists primarily of government agencies that are responsible for managing water resources in a given area, including large regional planning studies and local water supply treatment and wastewater services. For commercial clients, we support the development of water supplies and management of water to help these clients meet federal and local government requirements and policies. Our environmental market consists of both government and commercial clients that work to restore contaminated areas and protect uncontaminated areas. Our energy market consists of both government and commercial clients that are developing renewable sources of energy, improving energy efficiency, retrofitting buildings or processes, or transmitting energy.
Increasingly over the past several years, the consulting and engineering industry is being asked to provide integrated solutions in a global marketplace. Large firms that typically have over $1 billion in annual revenue can offer fully integrated services, from upfront science and planning through construction management or construction. Large firms that offer integrated solutions differentiate themselves from smaller firms that generally offer niche services by providing turn-key solutions intended to save time and money. As a large company with a history of providing interdisciplinary services, we have benefited from this trend and have increased our market share in each of the last several years.
5
Many scientific discoveries and public policy forces are now shaping changes to our industry. Public concern over environmental issues, especially water quality, has been a driving force behind numerous regulations and changes in public policies and practices. Our government and commercial clients are increasingly focused on environmental stewardship and infrastructure needs while responding to public pressure to attain operating efficiencies. Fluctuation in weather patterns and extreme events such as droughts or flooding are driving concerns over the reliability of water supplies and the need to protect coastal areas and water infrastructure services. Energy policies, resource limitations and concern over climate change have encouraged rapid implementation of energy conservation measures, retrofits of existing structures, upgrades to transmission capabilities, and the development of renewable energy sources. Many governments of developed countries are now choosing international development as a foreign policy tool to assist developing nations in conjunction with diplomacy and defense. We support international development by providing in-country assistance in making water supplies accessible, protecting human health, supplying emergency humanitarian assistance, and enhancing the ability of government institutions to implement these changes.
To continue our successful growth and competitive position, we have implemented the following strategy that has led to our success and is integral to our future growth:
Serve the Entire Project Life Cycle. We typically start with science at the onset of a project, building on our staff's strong technical foundation in natural and physical sciences. This strength allows us to effectively evaluate and recommend potential solutions to our clients' problems. We can support our clients through the entire project life cycle by providing consulting, engineering, construction, operations and maintenance, and information technology services. We offer these services individually or as part of our full-service approach to problem solving.
Capitalize on our Extensive Technical and Multi-Disciplinary Experience. Since our inception, we have provided innovative consulting and engineering services, focusing on cost-effective solutions to water resource management and environmental problems. We have been successful in leveraging this foundation of scientific and engineering capabilities into other market areas, including transportation and educational facilities. Our services are provided by a wide range of professionals, including archaeologists, biologists, chemical engineers, chemists, civil engineers, computer scientists, economists, electrical engineers, environmental engineers, environmental scientists, geologists, hydrogeologists, mechanical engineers, oceanographers, project managers and toxicologists. Because of the experience that we have gained from thousands of completed projects, we have a broad perspective and are often able to apply proven solutions to our clients' problems effectively and efficiently.
Provide Broad Geographic Coverage and Local Expertise. We believe that proximity to our clients is instrumental to understanding their needs and delivering comprehensive services. We have significantly broadened our geographic presence in recent years through strategic acquisitions and internal growth. We currently have domestic operations in 45 states and significant operations throughout Canada. We have also increased our international presence with regional offices in Europe, Asia, Central America and the Middle East. These new offices provide a platform from which we can respond to the global need for responsible economic development and management while ensuring communities have access to basic services in a secure environment. We are actively working in more than 60 countries in support of the U.S. government, the private sector and development assistance agencies to address complex infrastructure and environmental challenges in an environmentally-responsible manner.
Leverage Existing Client Base. We believe that we can effectively expand our service offerings to existing clients, resulting in more comprehensive services and, ultimately, to an increase in our revenue. Often, we have been able to secure construction management contracts after having dealt with clients
6
on the scientific evaluation and engineering design phases of a project. By expanding our role with existing clients, we can address larger problems and provide integrated solutions. For our global clients, we also focus on expanding from localized geographic services to broader national and international support in multiple locations.
Identify and Expand into New Business Areas. We use our consulting services and specialized technical services as entry points to evaluate adjacent business areas. After our consulting practice is established in a new business area, we can expand our operations by offering additional technical services. For example, based on our work in watershed management consulting services, we have identified and expanded into water infrastructure engineering services.
Focus on Large, Complex and Interdisciplinary Projects. We continue to focus on expanding our public and private sector services and bidding for complex projects that are at the leading edge of policy and technology development. Our interdisciplinary capabilities in water, environmental, alternative energy and infrastructure services provide the opportunity to develop integrated and sustainable solutions. Our combination of technical expertise with practical applications provides challenging and rewarding opportunities for our employees, thus enhancing our ability to serve other public and commercial clients.
Focus on Cash Generation. We take a disciplined approach to monitoring, managing and improving our return on investment in each of our business areas through our attempts to negotiate appropriate contract terms, manage our contract performance to minimize schedule delays and cost overruns, and promptly bill and collect accounts receivable.
Actively Attract and Recruit Strategic Hires. We focus on attracting and retaining top-quality individuals who provide technical skills, innovative solutions and long-term client relationships. Our full-service capabilities, internal coordination and networking opportunities, entrepreneurial environment and global project portfolio help to attract highly qualified individuals who support our long-term growth.
Invest in Strategic Acquisitions. We believe that strategic acquisitions will allow us to continue our growth in selected business areas, broaden our service offerings and extend our geographic presence. We intend to make acquisitions that will enable us to strengthen our position in certain emerging business areas or to further strengthen our position in our more established service offerings. We believe that our reputation makes us an attractive partner. Our effective integration of acquisitions can continue to enhance our ability to compete technically and geographically.
In the first quarter of fiscal 2009, we began reporting under four new reportable segments with reclassification of the prior year segment results to conform to the new basis of presentation. Each of the new reportable segments is comprised of similar activities that focus on the services it provides, the markets it serves, the distribution method of its services, its contracting mechanisms, the organization and execution of its projects, the education and discipline of its workforce, and the metrics by which its client projects and staff are measured. In addition, each of our operating groups, which are also our reportable segments, is managed by its own president, who has responsibility for the segment's reporting units. Each segment president directly reports to our Chief Executive Officer, who is our chief operating decision maker ("CODM"). The CODM regularly reviews the four reportable segments, allocates resources to these segments and assesses each segment's performance.
7
The following table presents the approximate percentage of our revenue, net of subcontractor costs, by reportable segment:
| |
Fiscal Year | |||||
|---|---|---|---|---|---|---|
| Reportable Segment | 2009 | 2008 | 2007 | |||
Environmental Consulting Services |
32.0% | 28.0% | 29.9% | |||
Technical Support Services |
22.7 | 22.4 | 17.7 | |||
Engineering and Architecture Services |
16.9 | 20.8 | 23.4 | |||
Remediation and Construction Management |
28.4 | 28.8 | 29.0 | |||
|
100.0% | 100.0% | 100.0% | |||
For more information concerning our reportable segments, see Note 15 (Reportable Segments) of the "Notes to Consolidated Financial Statements" included in Item 8.
Environmental Consulting Services ("ECS")
ECS provides front-end science and consulting services and project management in the areas of water resources, groundwater services, watershed management, mining and geotechnical sciences, environmental management, and information technology and modeling consulting.
Surface Water. Public concern with the quality of rivers, lakes, streams, and coastal and marine waters, and the ensuing legislative and regulatory response, is driving demand for our services. More recently, competition for water resources and climate variations such as those that cause droughts and flooding have raised the visibility of surface water management. Over the past 40 years, we have developed a specialized set of technical skills that position us to compete effectively for surface water and watershed management projects. We provide water resource services to U.S. federal government clients such as the U.S. Environmental Protection Agency ("EPA"), the U.S. Department of Defense ("DoD") and the U.S. Department of Energy ("DOE"). We also provide these services to a broad base of commercial clients, including those in the aerospace, chemical, alternative energy, mining, petroleum, pharmaceutical, retail and utility industries. Further, we provide surface water services to state and local government agencies, particularly in the areas of watershed management, stormwater management and combined sewer overflows ("CSOs").
Groundwater. Groundwater is a critical source of drinking water and a substantial portion of the water used for residential, industrial and agricultural purposes. Our activities in the groundwater field include projects such as evaluating the adequacy of water supplies, investigating and identifying the sources of chemical contamination, examining the extent of contamination, analyzing the speed and direction of contamination migration, and designing and evaluating remedial alternatives. In addition, we conduct monitoring studies to assess the effectiveness of groundwater treatment and extraction wells.
Waste Management. We provide a wide range of engineering and consulting services for hazardous waste contamination and remediation projects, from initial site assessment through design and implementation phases of remedial solutions. In addition, we perform risk assessments to determine the probability of adverse health effects that may result from exposure to toxic substances. We also provide waste minimization and pollution prevention services and evaluate the effectiveness of innovative technologies and novel solutions to environmental problems.
Mining and Geotechnical Services. Our mining and geotechnical staff provide environmental and construction services including feasibility analyses, design, permitting, operations, and closure of mining facilities. Our geotechnical practice includes geotechnical engineers, soils technicians and drillers who
8
investigate, analyze and develop geotechnical engineering recommendations and designs for simple to complex problems relating to groundwater, soil or rock.
Systems Support and Security. We provide technology systems integration to improve national security, principally for U.S. federal infrastructure. Our projects range from infrastructure vulnerability assessments to security engineering, design and project management services. We provide systems analysis and information management to optimize the U.S. commercial aviation system, and outsourced technical services to improve national security.
Technical Support Services ("TSS")
TSS advises clients through the study, design and implementation of projects. TSS conducts research in the areas of remedial planning, disaster management, sustainable solutions including climate change and carbon management, technical government staffing services, and program management for complex U.S. federal government and international development projects.
Remedial and Environmental Planning. We provide comprehensive services for environmental planning, cleanup, and reuse of sites contaminated with hazardous materials, toxic chemicals, and oil and petroleum products. Our services cover all phases of the remedial planning process, starting from emergency response and initial site discovery through removal actions and remedial design and implementation management. Sites range from small properties undergoing voluntary cleanup to brownfields redevelopment projects to DoD installations to some of the largest and most complex Superfund sites in the U.S. We support both industry and governmental clients in planning and implementing remedial activities at numerous sites around the world. We also provide a broad range of environmental analysis and planning services to ensure that our clients are implementing their operations in a sustainable manner. Our services include air quality management, regulatory compliance, information management and geographic information systems ("GIS"), radiation protection/health physics, risk management, pollution prevention/control, radioactive and hazardous waste management, National Environmental Policy Act ("NEPA") services and environmental response training.
Disaster Management. Our disaster management staff provides services in prevention, preparedness, protection, response, mitigation and recovery. We bring real world experience to our clients based on our response to more than 2,000 chemical, biological, radiological, nuclear, and explosive releases and natural hazards, such as hurricanes, tsunamis, earthquakes, floods and tornadoes. Our disaster management services for private industry and federal, state, local and international agencies include emergency preparedness and response, public health preparedness, risk analysis, training and exercises, infrastructure protection, strategic planning and program management.
Carbon Management. In a carbon-constrained world, our experts assist clients in identifying, reducing and strategically managing their carbon footprint to provide cost savings, mitigate regulatory impacts, institute operational efficiencies, develop new business opportunities, and promote corporate responsibility. Our services support our clients' efforts to become carbon neutral and sustainable by "greening" energy supplies, implementing energy efficiency and resource conservation, using alternative fuels, sequestering and capturing carbon, and purchasing carbon offsets. Our experience has demonstrated that clients can reduce their carbon and environmental impacts and save money at the same time. Our services include climate change and strategic management consulting, greenhouse gas inventory assessment, certification, reduction and management, and project implementation.
International Development. We provide services to many donor agencies such as the U.S. Agency for International Development ("USAID"), the World Bank, the Asian Development Bank, the Inter-American Development Bank, and New Zealand's International Aid and Development Agency to support the eradication of poverty, improve livelihoods, promote democracy and increase economic
9
growth. We plan, design, implement, research and monitor projects in the broad areas of agriculture and rural development, governance and institutional development, natural resources and the environment, infrastructure, economic growth, rule of law and justice systems development, and public-private partnerships training and consulting.
Government Staffing and Facilities Support. We provide a broad spectrum of professional and technical services, including advisory and assistance services, to supplement and support the organic staff of our federal government clients. Our service offerings include facility planning and operational support, infrastructure development and management, human resource management, program and logistics management, engineering, test and evaluation, administrative support and information technology disciplines.
Engineering and Architecture Services ("EAS")
EAS provides engineering and architecture design services, including Leadership in Energy and Environmental Design ("LEED") services, together with technical and program administration services for projects related to water infrastructure, buildings and land development, and transportation.
Water Infrastructure. Our design and technical services are applied to numerous aspects of water quality and quantity management, including major water and wastewater treatment plants, combined sewer storage and separation, and drainage and flood control. Our experience includes planning, permitting, design and construction management services for water treatment facilities, desalination facilities, and distribution systems including pipelines and pump stations.
Buildings and Facilities. We provide planning, architectural, engineering and construction management services for federal, state and local government and commercial facilities including military housing, educational, institutional, corporate headquarters, healthcare and research facilities. We specialize in designing and constructing sustainable facilities that minimize environmental impact, typically by minimizing water and power usage. Our projects include high-rise office buildings, museums, hotels, parks, visitor centers, marinas, and entertainment and leisure facilities. We provide engineering services for high-end environmentally sensitive or "green" buildings, including integrated interior systems for heat, light, security and communications. We have designed complex aquatic life support systems and provided structural, civil and mechanical engineering and design of interpretive exhibits for a series of large aquarium projects. We have completed engineering and construction management projects for a wide range of clients with specialized needs such as security systems, training and audiovisual facilities, clean rooms, laboratories, medical facilities and emergency preparedness facilities.
Transportation and Land Development. We provide engineering, architecture, construction management and technical services for transportation projects that improve public safety and mobility. Our transportation projects include roadway improvements, commuter railway stations, airport expansions, bridges and major highways. We also repair, replace and upgrade older transportation facilities. We provide land development services that include the planning, permitting, design and construction of water-related redevelopment projects, parks and river corridor restoration, as well as state, local and mixed use commercial, industrial and residential developments.
Remediation and Construction Management ("RCM")
RCM provides a wide array of services, including program management, engineering, procurement and construction, construction management, and operations and maintenance. RCM is focused on federal construction, environmental remediation including unexploded ordnance ("UXO") and wetland
10
restoration, energy projects including wind, nuclear engineering and other alternative energies, and communications development and construction.
Environmental Remediation and Management. We provide environmental remediation and reconstruction services to evaluate and restore lands and sediments to beneficial use. Environmental remediation includes activities to identify, evaluate and destroy UXO, both domestically and internationally. Under the Base Realignment and Closure ("BRAC") Act, we perform construction services to build energy efficient facilities at military locations in the U.S. and abroad. We also provide environmental management and planning support to evaluate and mitigate impacts from human activities on the natural environment. We develop watershed and regional plans, and recommend management approaches to help conserve and restore our natural resources.
Alternative Energy. To meet the escalating demand for alternative energy and energy independence, we provide energy management, conservation assessments and the full range of services for alternative energy development. For wind power development and upgrade projects, we provide environmental, engineering, construction services, and operations and maintenance for all phases of project development. Our capabilities include site evaluation, planning, biological assessments, permitting, engineering, construction and transmission services. We also provide services for other emerging alternative energy technologies including geothermal, solar, biogeneration and hydropower.
11
The following table presents brief examples of current projects in our four segments:
| Segment | Representative Projects | |
|---|---|---|
ECS |
• Supporting environmental activities at U.S. Air Force installations worldwide to assist the U.S. Air Force in its environmental mission in the areas of environmental conservation and planning, environmental quality, environmental restoration, and design and construction. |
|
|
• Assisting the EPA Office of Wastewater Management in conducting the Clean Water Needs Survey to assess financial needs for constructing wastewater treatment plants and other water-related infrastructure. |
|
|
• Providing engineering, project management and construction management to help reconstruct facilities in Iraq for the U.S. Air Force and the U.S. Army Corps of Engineers ("USACE"). |
|
|
• Providing environmental operations and maintenance services at Vandenberg Air Force Base in California. Also providing operations and maintenance services for a wastewater treatment plant and a hazardous waste collection plant, air monitoring and other services. |
|
|
• Providing watershed planning and modeling services for the Milwaukee Metropolitan Sewerage District to address regional water quality and CSO impacts on Lake Michigan. |
|
TSS |
• Supporting environmental activities at U.S. Navy installations primarily throughout the United States to assist the U.S. Navy in protecting the coastal and marine environment. |
|
|
• Serving as prime contractor for NEPA studies at DOE facilities to ensure that the DOE's proposed defense and energy-related actions comply with applicable environmental regulations. |
|
|
• Providing support on behalf of USAID to developing countries in establishing effective institutions essential to achieving economic growth and social development. |
|
|
• Strategic planning to the City of Los Angeles, City of Long Beach and County of Los Angeles for improving readiness capabilities during emergencies, including natural and manmade disasters. |
|
|
• Conducting a risk assessment for the Pennsylvania Department of Conservation and Natural Resources to evaluate carbon capture and sequestration throughout the state. |
|
|
• Providing engineering, staff augmentation and technical support services to federal government agencies such as the U.S. Missile Defense Agency, the U.S. Air Force and the Transportation Security Administration ("TSA"). |
12
| Segment | Representative Projects | |
|---|---|---|
EAS |
• Providing architectural and engineering design services for numerous U.S. government facilities, including military housing and overhead protection systems. |
|
|
• Providing mechanical, electrical, plumbing and fire protection engineering design services for buildings, including major corporate headquarters buildings, museums, universities and schools. |
|
|
• Designing a nanofiltration and reverse osmosis water treatment facility for the City of North Miami Beach, Florida. |
|
|
• Designing and engineering wastewater management facilities in Huntsville, Alabama. |
|
|
• Designing site plans and stormwater retrofits using green practices for the City of Los Angeles, California. |
|
|
• Providing architectural and engineering design services for new K-12 educational facilities throughout New York. |
|
|
• Designing fiber optic cable network systems for the Port of Long Beach, California. |
|
RCM |
• Providing program management services for environmental restoration of the Rocky Mountain Arsenal, a former chemical weapons manufacturing plant. |
|
|
• Providing design-build of energy-efficient facilities and environmental restoration services at BRAC sites for various agencies within the DoD. |
|
|
• Providing turn-key solutions for utilities and developers, including environmental studies, permitting, engineering, design, construction, and operations and maintenance services for wind farms and solar facilities throughout the United States. |
|
|
• Providing turn-key design, construction, dredging and treatment services for the Lower Fox River remediation and clean-up. |
|
|
• Assisting a leading provider of broadband services with the deployment and maintenance of a high-capacity broadband fiber optic network in the western and midwestern United States. |
|
|
• Providing engineering, design and installation services for fiber-to-the-premise networks. |
13
We provide services to a diverse base of federal, state and local government agencies, as well as commercial and international clients. The following table presents the approximate percentage of our revenue, net of subcontractor costs, by client sector:
| |
Fiscal Year | |||||
|---|---|---|---|---|---|---|
| Client Sector | 2009 | 2008 | 2007 | |||
Federal government |
45.3% | 43.3% | 43.9% | |||
State and local government |
15.0 | 17.8 | 20.2 | |||
Commercial |
32.2 | 37.9 | 35.0 | |||
International(1) |
7.5 | 1.0 | 0.9 | |||
|
100.0% | 100.0% | 100.0% | |||
- (1)
- Includes all revenue generated from our foreign operations and revenue generated from our international clients that is performed by our domestic operations. Revenue related to projects performed by our domestic operations in foreign countries for U.S. federal government and domestic commercial clients was reported as part of our U.S. federal government and commercial client sectors, respectively.
U.S. federal government agencies are our most significant clients. The DoD accounted for 25.6%, 25.4% and 29.4% of our revenue, net of subcontractor costs, in fiscal 2009, 2008 and 2007, respectively. We typically support multiple programs within a single federal government agency, both domestically and internationally. We also assist state and local government clients in a variety of jurisdictions across the country. Our commercial clients include companies in the chemical, energy, mining, pharmaceutical, retail, aerospace, automotive, petroleum, communications and utility industries. No single commercial client accounted for more than 10% of our revenue, net of subcontractor costs, in fiscal 2009.
The following table presents a list of representative clients in our four segments.
| |
Representative Clients | |||||||
|---|---|---|---|---|---|---|---|---|
| Reportable Segment |
Federal Government | State and Local Governments |
Commercial | International | ||||
| ECS | DoD; DOE; EPA; Federal Aviation Administration ("FAA"); U.S. Air Force; USACE; U.S. Bureau of Reclamation; U.S. General Services Administration; U.S. Navy | City of San Diego, California; Los Angeles County, California; Port of Los Angeles, California; State of Wyoming; Ventura County, California | AIG Domestic Claims, Inc.; Carson Marketplace, LLC; ConocoPhillips Company; Ford Motor Company; Intrepid Potash-New Mexico, LLC; Lockheed Martin Corporation; McClellan Business Park, LLC; Mosaic Fertilizer, LLC; Newmont Mining Corporation; Southern California Gas Company; Sunflower Redevelopment, LLC | Cameco Corporation; Hydro One Remote Communities Inc.; The Mosaic Company; Ontario Power Generation Inc; Terrane Metals Corp.; Winnipeg Airport Authority Inc.; Yukon Zinc Corporation | ||||
14
| |
Representative Clients | |||||||
|---|---|---|---|---|---|---|---|---|
| Reportable Segment |
Federal Government | State and Local Governments |
Commercial | International | ||||
| TSS | DoD; EPA; Federal Emergency Management Agency; National Aeronautics and Space Administration ("NASA"); TSA; USAID; U.S. Air Force; USACE; U.S. Coast Guard; U.S. Missile Defense Agency; U.S. Navy | City of Chicago, Illinois; City of Jacksonville, Florida; City of Los Angeles, California; Kansas City, Missouri; Port of San Diego, California; States of California, Missouri, Montana and Pennsylvania; University of California, Berkeley | Artesian Water Company; Bechtel Power Corporation; Chartis Inc.; D.R. Horton, Inc.; Kinder Morgan; PPG Industries; Range Resources-Appalachia, LLC; Southern Natural Gas Company; Target Corporation; Texas Energy Group, LLC | SK Energy Co., Ltd. | ||||
EAS |
U.S. Air Force; USACE; U.S. Coast Guard; U.S. Fish and Wildlife Service; U.S. Forest Service; U.S. Navy; U.S. Postal Service |
Allegheny County Sanitary Authority; Boston Water and Sewer Commission; City of Fruita Public Works Department; City of Lansing, Michigan; City of Tulsa, Oklahoma; Connecticut Department of Transportation; Cortland City School District; Irvine Ranch Water District; King County, Washington; Michigan Department of Transportation; Oklahoma Department of Transportation; Orange County Public Works; Orange County Utilities Department; Port of Long Beach, California; Toho Water Authority; Whitesboro Central School District |
Absher Construction Company; Flad and Associates, Inc.; General Motors Corp.; Genzyme Corporation; Goldman Sachs; Kendall/Heaton Associates, Inc.; Lowes; Poseidon Resources Corporation; Skidmore, Owings and Merrill LLP; Tutor Perini Corporation; Vail Resort Development Company |
EnCana Corporation; Gensler; New Songdo City Development, LLC; Rafael Vinoly Architects PC; Societe d'Entreprise & de Gestion; TRO Jung--Brannen, Inc.; Wenzel + Wenzel |
||||
15
| |
Representative Clients | |||||||
|---|---|---|---|---|---|---|---|---|
| Reportable Segment |
Federal Government | State and Local Governments |
Commercial | International | ||||
| RCM | DoD; DOE; U.S. Air Force; USACE; U.S. Coast Guard; U.S. Forest Service; U.S. Navy |
New York State Department of Transportation; New York State Office of General Services; South Florida Water Management District; State University Construction Fund | AT&T Inc.; Ahtna Government Services Corporation; Alcoa, Inc.; Castle & Cook, Inc.; Cogentrix Energy, LLC; Comcast Corporation; Denver International Airport; Actus Lend Lease; Idaho Power Company; Lower Fox River Remediation LLC; M+W Zander; New Cure, Inc.; NextEra Energy Resources, LLC; Noble Constructors, LLC; PacifiCorp; Rockies Express Pipeline LLC; Sheldon Energy LLC; Verizon Communications Inc. | Eni SpA; Iberdrola S.A.; Kuwait Oil Company; Suez Environnement S.A.; Veolia Environnement SA | ||||
Our services are performed under three principal types of contracts with our clients: fixed-price, time-and-materials, and cost-plus. The following table presents the approximate percentage of our revenue, net of subcontractor costs, by contract type:
| |
Fiscal Year | |||||
|---|---|---|---|---|---|---|
| Contract Type | 2009 | 2008 | 2007 | |||
Fixed-price |
37.9% | 37.1% | 33.2% | |||
Time-and-materials |
41.4 | 42.3 | 45.6 | |||
Cost-plus |
20.7 | 20.6 | 21.2 | |||
|
100.0% | 100.0% | 100.0% | |||
Our clients select the type of contract we enter into for a particular engagement. Under a fixed-price contract, the client agrees to pay a specified price for our performance of the entire contract or a specified portion of the contract. Fixed-price contracts carry certain inherent risks, including risks of losses from underestimating costs, delays in project completion, problems with new technologies, price increases for materials, and economic and other changes that may occur over the contract period. Consequently, the profitability, if any, of fixed-price contracts may vary substantially. Under our time-and-materials contracts, we are paid for labor at negotiated hourly billing rates and for other expenses. Profitability on these contracts is driven by billable headcount and cost control. Many of our time-and-materials contracts are subject to maximum contract values and, accordingly, revenue related to these contracts is recognized as if these contracts were fixed-price contracts. Under our cost-plus contracts, we are reimbursed for allowable costs and fees, which may be fixed or performance-based. If our costs exceed the contract ceiling or are not allowable, we may not be able to obtain full reimbursement. Further, the amount of the fee received for a cost-plus award fee contract partially depends upon the client's discretionary periodic assessment of our performance on that contract.
16
Some contracts with the U.S. federal government are subject to annual funding approval. U.S. federal government agencies may impose spending restrictions that limit the continued funding of our existing contracts and may limit our ability to obtain additional contracts. These limitations, if significant, could have a material adverse effect on us. All contracts with the U.S. federal government may be terminated by the government at any time, with or without cause.
Federal government agencies have formal policies against continuing or awarding contracts that would create actual or potential conflicts of interest with other activities of a contractor. These policies may prevent us from bidding for or performing government contracts resulting from or related to certain work we have performed. In addition, services performed for a commercial or government sector client may create conflicts of interest that preclude or limit our ability to obtain work for a private organization. We attempt to identify actual or potential conflicts of interest and to minimize the possibility that such conflicts could affect our work under current contracts or our ability to compete for future contracts. We have, on occasion, declined to bid on a project because of an existing or potential conflict of interest.
Our contracts with the U.S. federal government are subject to audit by the government, primarily by the Defense Contract Audit Agency ("DCAA"). The DCAA generally seeks to (i) identify and evaluate all activities that contribute to, or have an impact on, proposed or incurred costs of government contracts; (ii) evaluate the contractor's policies, procedures, controls and performance; and (iii) prevent or avoid wasteful, careless and inefficient production or service. To accomplish this, the DCAA examines our internal control systems, management policies and financial capability; evaluates the accuracy, reliability and reasonableness of our cost representations and records; and assesses our compliance with Cost Accounting Standards ("CAS") and defective-pricing clauses found within the Federal Acquisition Regulation ("FAR"). The DCAA also performs the annual review of our overhead rates and assists in the establishment of our final rates. This review focuses on the allowability of cost items and the applicability of CAS. The DCAA also audits cost-based contracts, including the close-out of those contracts.
The DCAA also reviews all types of U.S. federal government proposals, including those of award, administration, modification and re-pricing. The DCAA considers our cost accounting system, estimating methods and procedures, and specific proposal requirements. Operational audits are also performed by the DCAA. A review of our operations at every major organizational level is conducted during the proposal review period. During the course of its audit, the DCAA may disallow costs if it determines that we accounted for such costs in a manner inconsistent with CAS. Under a government contract, only those costs that are reasonable, allocable and allowable are recoverable. A disallowance of costs by the DCAA could have a material adverse effect on us.
In accordance with our corporate policies, we maintain controls to minimize any occurrence of fraud or other unlawful activities that could result in severe legal remedies, including the payment of damages and/or penalties, criminal and civil sanctions, and debarment. In addition, we maintain preventative audit programs and mitigation measures to ensure that appropriate control systems are in place.
We provide our services under contracts, purchase orders or retainer letters. Our policy provides that all contracts must be in writing. We bill our clients in accordance with the contract terms and periodically based on costs incurred, on either an hourly-fee basis or on a percentage-of-completion basis, as the project progresses. Most of our agreements permit our clients to terminate the agreements without cause upon payment of fees and expenses through the date of the termination. Generally, our contracts do not require that we provide performance bonds. If required, a performance bond, issued by a surety company, guarantees the contractor's performance under the contract. If the contractor defaults under the contract, the surety will, in its discretion, complete the job or pay the client the amount of the bond. If the contractor does not have a performance bond and defaults in the
17
performance of a contract, the contractor is responsible for all damages resulting from the breach of contract. These damages include the cost of completion, together with possible consequential damages such as lost profits.
Marketing and Business Development
Our corporate management team establishes the scope and range of services we provide and our overall business strategy. The centralized business development support group develops corporate marketing materials, market research, and promotional and professional activities, including appearances at trade shows, direct mailings, advertising and public relations. Business development activities are implemented by our technical and professional management staff. We believe that these personnel have the best understanding of a client's needs and the effect of local or client-specific issues, laws and regulations. The professional staff holds frequent meetings with existing and potential clients, and federal, state or local government agencies; gives presentations to civic and professional organizations; and presents seminars on current technical topics. Essential to the effective development of business is each staff member's access to all of our service offerings through the technical and geographic network we provide. We facilitate a strong internal network, along with our client and service offerings, to provide professional staff with opportunities to provide new services to existing clients and broaden our client base in core services. We market throughout the organizations and service sectors we target, focusing on delivering solutions to emerging programs and providing full-service support.
For our major focus areas, we have established company-wide initiatives that reinforce internal coordination across the enterprise, track the development of new programs, identify and coordinate collective resources for major bids, and build interdisciplinary teams. These initiatives provide a forum for cross-sector collaboration and the development of interdisciplinary solutions. We continuously identify new markets that are consistent with our service offerings and leverage our full-service capabilities and internal coordination structure to develop and implement strategies to research, anticipate and position for future procurements.
We continuously evaluate the marketplace for strategic acquisition opportunities. Due to our reputation, size, financial resources, geographic presence and range of services, we have numerous opportunities to acquire both privately held companies and subsidiaries of publicly held companies. During our evaluation, we examine the effect an acquisition may have on our long-range business strategy and results of operations. Generally, we proceed with an acquisition if we believe that it would have a positive effect on future operations and could strategically expand our service offerings. As successful integration and implementation are essential to achieving favorable results, no assurance can be given that all acquisitions will provide accretive results. Our strategy is to position ourselves to address existing and emerging markets. We view acquisitions as a key component of our growth strategy, and we intend to use both cash and securities, as we deem appropriate, to fund acquisitions. We may acquire other businesses that we believe are synergistic and will ultimately increase our revenue and net income, strengthen our ability to achieve our strategic goals, provide critical mass with existing clients and further expand our lines of service. Because we typically acquire service businesses with limited tangible assets, our acquisitions generally result in the recognition of goodwill and other identifiable intangible assets. Acquisitions are inherently risky, and no assurance can be given that our previous or future acquisitions will be successful or will not have a material adverse effect on our financial position, results of operations or cash flow. All acquisitions require the approval of our Board of Directors, and those in excess of a certain size require the approval of our lenders.
In the third quarter of fiscal 2007, we acquired (i) all of the outstanding shares of Delaney Construction Corporation, Delaney Crushed Stone Products, Inc. and Delaney Leasing Company, Inc.,
18
and (ii) all of the limited liability company interests of Delaney Properties, LLC (collectively, "DGI"). DGI provides planning, development and construction services for wind energy programs, BRAC projects, and water and wastewater treatment and conveyance facilities to its broad-based clients. This acquisition enables us to provide a wider range of services to our current and prospective wind energy clients, as DGI offers complementary capabilities and client relationships. In fiscal 2007, we also made other acquisitions that enhanced our service offerings to our clients.
In the first quarter of fiscal 2008, we acquired ARD, Inc. ("ARD"), which provides applied research, planning, design and implementation services focused on a range of water, energy, environmental and governance challenges. ARD manages large, complex international development projects for its clients, predominantly USAID. This acquisition continues our international expansion as it increases our professional workforce in new geographic areas and technical specialties around the world. In fiscal 2008, we also made other acquisitions that enhanced our service offerings and expanded our geographic presence.
In the second quarter of fiscal 2009, we acquired Wardrop Engineering, Inc. ("Wardrop"), a Canadian firm that specializes in resource management, energy and infrastructure design. This acquisition significantly expanded our worldwide presence, adding 13 offices throughout Canada and offices in the United Kingdom and India. In fiscal 2009, we made other acquisitions that enhanced our service offerings to broad-based clients, including USAID.
The market for our services is generally highly competitive. We often compete with many other firms ranging from small regional firms to large international firms.
We perform a broad spectrum of consulting, engineering and technical services across our ECS, TSS, EAS and RCM segments. Services within these segments are provided to a client base that includes U.S. federal government agencies, including the DoD, USAID, DOE, EPA, NASA and FAA, state and local government agencies, and the commercial sector. Our competition varies and is a function of the business areas in which, and client sectors for which, we perform our services. The number of competitors for any procurement can vary widely, depending upon technical qualifications, the relative value of the project, geographic location, the financial terms and risks associated with the work, and any restrictions placed upon competition by the client. Historically, clients have chosen among competing firms by weighing the quality, innovation and timeliness of the firm's service versus its cost to determine which firm offers the best value. When less work becomes available in a given market, price becomes an increasingly important factor.
We believe that our principal competitors include the following firms, in alphabetical order: AECOM Technology Corporation; AMEC PLC; Arcadis NV; Black & Veatch Corporation; Brown & Caldwell; CH2M Hill Companies Ltd.; Camp Dresser & McKee, Inc.; Chemonics; ICF International, Inc.; Jacobs Engineering Group Inc.; MWH Global, Inc.; Science Applications International Corporation; The Shaw Group Inc.; Stantec Inc.; TRC Companies, Inc.; URS Corporation; and Weston Solutions, Inc.
As of fiscal 2009 year-end, our backlog was $1.6 billion, a decrease of 4.0% compared to fiscal 2008 year-end. The decline was driven primarily by the wind-down of our Iraq-related projects with the DoD, the timing of funding on our USAID contracts, the wind-down of certain wind energy contracts with commercial clients, and contract delays and cancellations by certain commercial and state and local government clients resulting from the economic environment. The overall decline was partially offset by backlog associated with our fiscal 2009 acquisitions, increased funding on BRAC programs
19
with the DoD, a large construction project with a state and local government client, and demand for our water, engineering and development services by commercial clients.
We include in our backlog only those contracts for which funding has been provided and work authorization has been received. We estimate that approximately 70% of our backlog as of fiscal 2009 year-end will be recognized as revenue in fiscal 2010, as work is performed. However, we cannot guarantee that the revenue projected in our backlog will be realized or, if realized, will result in profits. In addition, project cancellations or scope adjustments may occur, from time to time, with respect to contracts reflected in our backlog. For example, certain of our contracts with the U.S. federal government and other clients are terminable at the discretion of the client with or without cause. These types of backlog reductions could adversely affect our revenue and margins. Accordingly, our backlog as of any particular date is an uncertain indicator of our future earnings.
We engage in various service activities that are subject to government oversight, including environmental laws and regulations, general government procurement laws and regulations, and other regulations and requirements imposed by specific government agencies with which we conduct business.
Environmental. A substantial portion of our business involves planning, design, program management and construction management of pollution control facilities, as well as assessment and management of remediation activities at hazardous waste or Superfund sites and military bases. In addition, we contract with U.S. federal government entities to destroy hazardous materials, including weapons stockpiles. These activities require us to manage, handle, remove, treat, transport, and dispose of toxic or hazardous substances.
Some environmental laws, such as the Superfund law and similar state statutes, can impose liability for the entire cost of clean-up for contaminated facilities or sites upon present and former owners and operators, as well as generators, transporters and persons arranging for the treatment or disposal of such substances. In addition, while we strive to handle hazardous and toxic substances with care and in accordance with safe methods, the possibility of accidents, leaks, spills and the events of force majeure always exist. Humans exposed to these materials, including workers or subcontractors engaged in the transportation and disposal of hazardous materials and persons in affected areas, may be injured or become ill, resulting in lawsuits that expose us to liability that may result in substantial damage awards. Liabilities for contamination or human exposure to hazardous or toxic materials, or a failure to comply with applicable regulations, could result in substantial costs, including clean-up costs, fines, civil or criminal sanctions, third party claims for property damage or personal injury, or cessation of remediation activities.
Certain of our business operations are covered by Public Law 85-804, which provides for government indemnification against claims and damages arising out of unusually hazardous activities performed at the request of the government. Due to changes in public policies and law, however, government indemnification may not be available in the case of any future claims or liabilities relating to other hazardous activities that we perform.
Government Procurement. The services we provide to the U.S. federal government are subject to FAR and other rules and regulations applicable to government contracts. These rules and regulations, among other things:
- •
- Require certification and disclosure of all cost and pricing data in connection with the contract negotiations under
certain contract types;
- •
- Impose accounting rules that define allowable and unallowable costs and otherwise govern our right to reimbursement under certain cost-based government contracts; and
20
- •
- Restrict the use and dissemination of information classified for national security purposes and the exportation of certain products and technical data.
In addition, services provided to the DoD are monitored by the Defense Contract Management Agency and audited by the DCAA. Our government clients can also terminate any of their contracts, and many of our government contracts are subject to renewal or extension annually.
We experience seasonal trends in our business. Our revenue is typically lower in the first half of our fiscal year, primarily due to the Thanksgiving, Christmas and New Year's holidays. Many of our clients' employees, as well as our own employees, take vacations during these holiday periods. Further, seasonal inclement weather conditions occasionally cause some of our offices to close temporarily or may hamper our project field work. These occurrences result in fewer billable hours worked on projects and, correspondingly, less revenue recognized. Our revenue is typically higher in the second half of the fiscal year, due to favorable weather conditions during spring and summer months that result in higher billable hours. In addition, our revenue is typically higher in the fourth fiscal quarter due to the U.S. federal government's fiscal year-end spending.
Potential Liability and Insurance
Our business activities could expose us to potential liability under various environmental laws and under workplace health and safety regulations. In addition, we occasionally assume liability by contract under indemnification agreements. We cannot predict the magnitude of such potential liabilities.
We maintain a comprehensive general liability policy with an umbrella policy that covers losses beyond the general liability limits. We also maintain professional errors and omissions liability and contractor's pollution liability insurance policies. Both policies provide adequate coverage for our business. When we perform higher-risk work, such as fixed-price remediation with insurance or UXO services, we obtain the necessary types of insurance coverages for such activities, as is typically required by our clients.
We obtain insurance coverage through a broker that is experienced in the professional liability field. The broker and our risk manager regularly review the adequacy of our insurance coverage. Because there are various exclusions and retentions under our policies, or an insurance carrier may become insolvent, there can be no assurance that all potential liabilities will be covered by our insurance policies or paid by our carrier.
We evaluate the risk associated with claims. If we determine that a loss is probable and reasonably estimable, we establish an appropriate reserve. A reserve is not established if we determine that a claim has no merit or is not probable or reasonably estimable. Our historic levels of insurance coverage and reserves have been adequate. However, partially or completely uninsured claims, if successful and of significant magnitude, could have a material adverse effect on our business.
Our principal asset is our employees. As of September 27, 2009, we had approximately 10,000 employees, and a large percentage of our employees have technical and professional backgrounds and undergraduate and/or advanced degrees. Our professional staff includes archaeologists, biologists, chemical engineers, chemists, civil engineers, computer scientists, economists, electrical engineers, environmental engineers, environmental scientists, geologists, hydrogeologists, mechanical engineers, oceanographers, project managers and toxicologists. As of September 27, 2009, we had approximately 360 employees represented by approximately 30 labor organizations. We consider the relationships with our employees to be favorable. We believe that our ability to retain and expand our staff of qualified
21
professionals will be an important factor in determining our future growth and success. To date, we believe that we have been successful in recruiting qualified employees, but there is no assurance that we will continue to be successful in the future. On certain engagements, we supplement our consultants with independent contractors. We believe that the practice of retaining independent contractors on an engagement basis provides us with significant flexibility in adjusting professional personnel levels in response to changes in demand for our services.
Executive Officers of the Registrant
The following table shows the name, age and position as of November 9, 2009 of each of our executive officers:
| Name | Age | Position | ||
|---|---|---|---|---|
Dan L. Batrack |
51 | Chairman, Chief Executive Officer and President | ||
|
Mr. Batrack joined our predecessor in 1980 and was named Chairman in January 2008. He has served as our Chief Executive Officer and a director since November 2005, and as our President since October 2008. Mr. Batrack has served in numerous capacities over the last 29 years, including project scientist, project manager, operations manager, senior vice president and president of an operating unit. He has managed complex programs for many small and Fortune 500 clients, both in the United States and internationally. Mr. Batrack holds a B.A. degree in Business Administration from the University of Washington. |
|||
David W. King |
53 |
Executive Vice President, Chief Financial Officer and Treasurer |
||
|
Mr. King joined us in November 2002 as Executive Vice President of Finance. He was named Chief Financial Officer and Treasurer in January 2003. Previously, Mr. King served as the Vice President of Finance and Operations at Walt Disney Imagineering in Los Angeles. From 1996 to 1999, he was the Vice President and Chief Financial Officer of the Asia Pacific region for Bechtel Group, Inc., based in Hong Kong. Prior to his position at Bechtel, Mr. King had a decade of professional experience with Price Waterhouse in Seattle, Los Angeles and Hong Kong, specializing in international transactions. Mr. King holds a B.A. degree in Business Administration from the University of Washington and is a Certified Public Accountant. |
22
| Name | Age | Position | ||
|---|---|---|---|---|
Donald I. Rogers, Jr. |
65 |
Senior Vice President and President of Remediation and Construction Management |
||
|
Mr. Rogers was named Senior Vice President and President of Remediation and Construction Management in December 2005. He joined us in March 2003 in connection with our acquisition of Foster Wheeler Environmental Corporation, which is currently known as Tetra Tech EC, Inc. ("ECI"). Mr. Rogers joined ECI in December 1992 and currently serves as its President. He has nearly 35 years of experience in engineering and construction, including management responsibility for divisions performing environmental restoration and hazardous waste site remediation programs in 40 states and international locations. Mr. Rogers was previously Vice President of Enserch Development Corporation and Vice President of Ebasco Constructors. He earned a B.A. in Economics from the University of Bridgeport, an M.A. in Economics from the New School for Social Research, and an Advanced Executive M.B.A. from the Wharton School of Business at the University of Pennsylvania. |
|||
Douglas G. Smith |
60 |
Senior Vice President and President of Engineering and Architecture Services |
||
|
Mr. Smith was named Senior Vice President and President of Engineering and Architecture Services in November 2005. He has nearly 35 years of infrastructure industry experience focused on water infrastructure engineering. Mr. Smith joined us from MWH Global, Inc., where he was Senior Vice President of Strategic Planning. He spent the previous 24 years, from 1980 to 2004, at Black & Veatch, where he was promoted to President of the Europe Water Division. While at Black & Veatch, Mr. Smith focused on large program business development and acquisition integration. From 1976 to 1979, Mr. Smith was an adjunct professor of Civil Engineering at the University of Colorado, Boulder, and a director of Public Utilities for the City of Boulder. Mr. Smith holds a B.S. in Engineering from Kansas State University, an M.S. in Civil Engineering from the University of Colorado, and a J.D. from the University of Denver. |
23
| Name | Age | Position | ||
|---|---|---|---|---|
Ronald J. Chu |
52 |
Senior Vice President and President of Technical Support Services |
||
|
Mr. Chu was named Senior Vice President and President of Technical Support Services in June 2007. He has more than 14 years of experience with us and has served in various technical and management capacities, including project and program manager, office manager, regional manager, and most recently, chief operating officer for TSS. Mr. Chu was named a Vice President in 2001. He began his career as a civil/sanitary engineer in 1981 and entered the environmental consulting field in 1984. His career has included management of major assessment, engineering and remediation programs for the DoD, the EPA, state and local government agencies, and commercial clients. Mr. Chu is a registered professional engineer in several states and has authored numerous technical articles. He holds a B.S. in Civil Engineering from Northeastern University and an M.S. in Environmental Engineering from the University of Southern California. |
|||
James R. Pagenkopf |
58 |
Senior Vice President and President of Environmental Consulting Services |
||
|
Mr. Pagenkopf was named Senior Vice President and President of Environmental Consulting Services in September 2009. He has 33 years of experience with us in both technical and management roles, including project and program manager, office manager, group manager, Vice President, and President of ECS' largest operating unit. Mr. Pagenkopf's academic and professional background is in the development and application of hydrodynamic and water quality models, which he has applied in more than 200 projects throughout the U.S. and internationally. He has served as program manager on several large technical support contracts for the EPA's Office of Water, and more recently has led our strategic water initiative to focus our growth in the Louisiana/Gulf Coast and Panama Canal water resources markets. Mr. Pagenkopf holds a B.S. in Civil Engineering from Valparaiso University and an M.S. in Civil Engineering from the Massachusetts Institute of Technology. |
24
| Name | Age | Position | ||
|---|---|---|---|---|
William R. Brownlie |
56 |
Senior Vice President and Chief Engineer |
||
|
Dr. Brownlie was named Senior Vice President and Chief Engineer in September 2009. From December 2005 to September 2009, he served as President of Environmental Consulting Services. Dr. Brownlie joined our predecessor in 1981 and was named a Senior Vice President in December 1993. He has been a vice president since 1988. Previously, Dr. Brownlie managed various operating units and programs focusing on water resources and environmental services, including work with USACE, the U.S. Air Force, Bureau of Reclamation and DOE. Dr. Brownlie is a registered Professional Engineer and has a strong technical background in water resources. He holds B.S. and M.S. degrees in Civil Engineering from the State University of New York at Buffalo and a Ph.D. in Civil Engineering from the California Institute of Technology. |
|||
Richard A. Lemmon |
50 |
Senior Vice President, Corporate Administration |
||
|
Mr. Lemmon joined our predecessor in 1981 in a technical capacity and became a member of its corporate staff in a management position in 1985. In 1988, at the time of our predecessor's divestiture from Honeywell, Inc., Mr. Lemmon structured and managed many of our corporate functions. In 1990, he was promoted to Director of Administration. Mr. Lemmon was elected a vice president in November 1995. He is responsible for insurance, human resources and facilities. |
|||
Steven M. Burdick |
45 |
Senior Vice President, Corporate Controller |
||
|
Mr. Burdick was named Senior Vice President and Corporate Controller in March 2007. He joined us in April 2003 as Vice President, Management Audit, and was named Vice President, Controller in January 2004. Previously, Mr. Burdick served as the Executive Vice President and Chief Financial Officer for Aura Systems, Inc. From 2000 through 2002 he was the Chief Financial Officer for TRW Ventures. Prior to this, Mr. Burdick held the position of Senior Manager with Ernst & Young LLP in Los Angeles. Mr. Burdick holds a B.S. degree in Business Administration from Santa Clara University and is a Certified Public Accountant. |
|||
Janis B. Salin |
56 |
Vice President, General Counsel and Secretary |
||
|
Ms. Salin joined us in February 2002 and was named Vice President and General Counsel in November 2002. She was elected Secretary in November 2003. For the prior 17 years, Ms. Salin was a Principal with the law firm of Riordan & McKinzie (which merged into Bingham McCutchen LLP in July 2003) and served as Managing Principal of that firm from 1990 to 1992. She served as our outside counsel from the time of our formation in 1988. Ms. Salin holds B.A. and J.D. degrees from the University of California at Los Angeles. |
25
| Name | Age | Position | ||
|---|---|---|---|---|
Craig L. Christensen |
56 |
Vice President, Chief Information Officer |
||
|
Mr. Christensen joined us in 1998 through the acquisition of our Tetra Tech NUS, Inc. ("NUS") subsidiary, and was named Vice President in November 2002. Mr. Christensen is responsible for our information services and technologies, including the implementation of our enterprise resource planning ("ERP") system and management of our shared service organization. Previously, Mr. Christensen held positions at NUS, Brown and Root Services, and Landmark Graphics subsidiaries of Halliburton Company where his responsibilities included contracts administration, finance and system development. Prior to his service at Halliburton, Mr. Christensen held positions at Burroughs Corporation and Apple Computer. Mr. Christensen holds B.A. and M.B.A. degrees from Brigham Young University. |
|||
Michael A. Bieber |
41 |
Vice President, Corporate Development |
||
|
Mr. Bieber joined us in 1996 and was named Vice President, Corporate Development in November 2005. He is responsible for driving strategic growth through the leadership of our mergers and acquisitions program. He has overseen our investor relations function since 2000. From 1996 to 2000, he was a proposal manager in our corporate marketing group. From 1994 to 1996, Mr. Bieber served as a strategic business development consultant to large defense, infrastructure, and environmental firms at CRC, Inc. and its successor. Prior to that, Mr. Bieber worked for IT Corporation (now The Shaw Group, Inc.), where he served as project manager and engineer on government nuclear and petrochemical projects. Mr. Bieber holds a B.S. degree in Civil Engineering from the Tennessee Technological University. |
|||
Leslie L. Shoemaker |
52 |
Vice President, Strategic Initiatives |
||
|
Dr. Shoemaker joined us in 1991 and was named Vice President, Strategic Initiatives in August 2007. She is responsible for our strategic planning, business development, and corporate communications functions. Dr. Shoemaker coordinates our corporate Initiatives Program, which supports companywide collaboration on key services in our major growth markets. She also leads the water resources modeling and systems development team and consults on the development of policy and programs for watershed management and sustainable communities. Dr. Shoemaker has more than 25 years of industry experience and has previously served in various technical and management capacities including project engineer, project manager, vice president, and technical practice leader. Dr. Shoemaker holds a B.A. degree in Mathematics from Hamilton College, a Master of Engineering from Cornell University and a Ph.D. in Agricultural Engineering from the University of Maryland. |
26
Set forth below and elsewhere in this report and in other documents we file with the SEC are descriptions of the risks and uncertainties that could cause our actual results to differ materially from the results contemplated by the forward-looking statements contained in this report.
Our operating results may be adversely impacted by worldwide political and economic uncertainties and specific conditions in the markets we address
General worldwide economic conditions have recently experienced a downturn due to the lack of available credit, slower economic activity, concerns about inflation and deflation, increased energy costs, decreased consumer confidence, reduced corporate profits and capital spending, and adverse business conditions. These conditions make it extremely difficult for our clients, our vendors and us to accurately forecast and plan future business activities and could cause businesses to slow spending on services. We cannot predict the timing, strength or duration of any economic slowdown or subsequent economic recovery worldwide or in our industry. If the economy or markets in which we operate deteriorate from the level experienced in fiscal 2009, our business, financial condition and results of operations may be materially and adversely affected.
Our annual revenue, expenses and operating results may fluctuate significantly
Our annual revenue, expenses and operating results may fluctuate significantly because of numerous factors, including:
- •
- General economic or political conditions;
- •
- Unanticipated changes in contract performance that may affect profitability, particularly with contracts that are
fixed-price or have funding limits;
- •
- Seasonality of the spending cycle of our public sector clients, notably the U.S. federal government, the spending patterns
of our commercial sector clients, and weather conditions;
- •
- Budget constraints experienced by our federal, state and local government clients;
- •
- Acquisitions or the integration of acquired companies;
- •
- Divestiture or discontinuance of operating units;
- •
- Employee hiring, utilization and turnover rates;
- •
- The number and significance of client contracts commenced and completed during a quarter;
- •
- Creditworthiness and solvency of clients;
- •
- The ability of our clients to terminate contracts without penalties;
- •
- Delays incurred in connection with a contract;
- •
- The size, scope and payment terms of contracts;
- •
- Contract negotiations on change orders and collections of related accounts receivable;
- •
- The timing of expenses incurred for corporate initiatives;
- •
- Reductions in the prices of services offered by our competitors;
- •
- Threatened or pending litigation;
- •
- The impairment of goodwill or identifiable intangible assets; and
- •
- Changes in accounting rules.
27
Variations in any of these factors could cause significant fluctuations in our operating results from period to period, result in a net loss, and could have a negative effect on our stock price.
Demand for our state and local government services is cyclical and vulnerable to economic downturns; if the economy weakens, then our revenues, profits and our financial condition may deteriorate
Demand for our state and local government services is cyclical and vulnerable to economic downturns, which may result in clients delaying, curtailing or canceling proposed and existing projects. Our business traditionally lags the overall recovery in the economy; therefore, our business may not recover immediately when the economy improves. If the economy weakens, then our revenues, profits and overall financial condition may deteriorate. Our state and local government clients may face budget deficits that prohibit them from funding new or existing projects. In addition, our existing and potential clients may either postpone entering into new contracts or request price concessions. Difficult financing and economic conditions may cause some of our clients to demand better pricing terms or delay payments for services we perform, thereby increasing the average number of days our receivables are outstanding. Further, these conditions may result in the inability of some of our clients to pay us for services that we have already performed. If we are not able to reduce our costs quickly enough to respond to the revenue decline from these clients, our operating results may be adversely affected. Accordingly, these factors affect our ability to forecast our future revenues and earnings from business areas that may be adversely impacted by market conditions.
Our revenue from commercial clients is significant, and the credit risks associated with certain of these clients could adversely affect our operating results
In fiscal 2009, we generated 32.2% of our revenue, net of subcontractor costs, from commercial clients. Due to the continuing weakness in general economic conditions, our commercial business may be at risk as we rely upon the financial stability and creditworthiness of our clients. To the extent the credit quality of these clients deteriorates or these clients seek bankruptcy protection, our ability to collect our receivables, and ultimately our operating results, may be adversely affected.
We derive a majority of our revenue from government agencies, and any disruption in government funding or in our relationship with those agencies could adversely affect our business
In fiscal 2009, we generated 60.3% of our revenue, net of subcontractor costs, from contracts with federal, state and local government agencies. U.S. federal government agencies are among our most significant clients. We generated 45.3% of our revenue, net of subcontractor costs, in fiscal 2009 from the following agencies: 25.6% from DoD agencies, 9.0% from USAID and 10.7% from other U.S. federal government agencies. A significant amount of this revenue is derived under multi-year contracts, many of which are appropriated on an annual basis. As a result, at the beginning of a project, the related contract may be only partially funded, and additional funding is normally committed only as appropriations are made in each subsequent year. These appropriations, and the timing of payment of appropriated amounts, may be influenced by numerous factors as noted below. Our backlog includes only the projects that have funding appropriated.
The demand for our government-related services is generally driven by the level of government program funding. Accordingly, the success and further development of our business depends, in large part, upon the continued funding of these government programs, and upon our ability to obtain contracts and perform well under these programs. There are several factors that could materially affect our government contracting business, including the following:
- •
- Changes in and delays or cancellations of government programs, requirements or appropriations;
- •
- Budget constraints or policy changes resulting in delay or curtailment of expenditures related to the services we provide;
28
- •
- Re-competes of government contracts;
- •
- The timing and amount of tax revenue received by federal, state and local governments, and the overall level of government
expenditures;
- •
- Curtailment of the use of government contracting firms;
- •
- Delays associated with a lack of a sufficient number of government staff to oversee contracts;
- •
- The increasing preference by government agencies for contracting with small and disadvantaged businesses;
- •
- Competing political priorities and changes in the political climate with regard to the funding or operation of the
services we provide;
- •
- The adoption of new laws or regulations affecting our contracting relationships with the federal, state or local
governments;
- •
- Unsatisfactory performance on government contracts by us or one of our subcontractors, negative government audits, or
other events that may impair our relationship with the federal, state or local governments;
- •
- A dispute with or improper activity by any of our subcontractors; and
- •
- General economic or political conditions.
These and other factors could cause government agencies to delay or cancel programs, to reduce their orders under existing contracts, to exercise their rights to terminate contracts or not to exercise contract options for renewals or extensions. Any of these actions could have a material adverse effect on our revenue or timing of contract payments from these agencies.
A significant shift in U.S. defense spending could harm our operations and significantly reduce our future revenues
Revenue under contracts with the DoD represented 25.6% of our revenue, net of subcontractor costs, in fiscal 2009. We experienced a significant revenue decline in fiscal 2009 for project management reconstruction and UXO services in Iraq compared to the same period last year. While spending authorization for defense-related programs has increased significantly in recent years due to greater homeland security and foreign military commitments, as well as the trend to outsource U.S. federal government jobs to the private sector, these spending levels may not be sustainable. Future levels of expenditures and authorizations for these programs may decrease, remain constant or shift to other programs in areas in which we do not currently provide service. As a result, a general decline in U.S. defense spending or a change in budgetary priorities could harm our operations and significantly reduce our future revenues.
A delay in the completion of the budget process of the U.S. government could delay procurement of our services and have an adverse effect on our future revenues
When the U.S. government does not complete its budget process before its fiscal year-end on September 30, government operations are typically funded by means of a continuing resolution that authorizes agencies of the U.S. government to continue to operate, but does not authorize new spending initiatives. When the U.S. government operates under a continuing resolution, government agencies may delay the procurement of services, which could reduce our future revenues.
29
As a government contractor, we are subject to a number of procurement laws, regulations and government audits; a violation of any such laws and regulations could result in sanctions, contract termination, forfeiture of profit, harm to our reputation or loss of our status as an eligible government contractor
We must comply with and are affected by federal, state, local and foreign laws and regulations relating to the formation, administration and performance of government contracts. For example, we must comply with FAR, the Truth in Negotiations Act, CAS and DoD security regulations, as well as many other rules and regulations. These laws and regulations affect how we do business with our clients and, in some instances, impose additional costs on our business operations. Although we take precautions to prevent and deter fraud, misconduct and non-compliance, we face the risk that our employees or outside partners may engage in misconduct, fraud or other improper activities. Government agencies, such as the DCAA, routinely audit and investigate government contractors. These government agencies review and audit a government contractor's performance under its contracts and cost structure, and evaluate compliance with applicable laws, regulations and standards. In addition, during the course of its audits, the DCAA may question our incurred project costs. If the DCAA believes we have accounted for such costs in a manner inconsistent with the requirements for FAR or CAS, the DCAA auditor may recommend our U.S. government corporate administrative contracting officer to disallow such costs. Historically, we have not experienced significant disallowed costs as a result of government audits. However, we can provide no assurance that the DCAA or other government audits will not result in material disallowance for incurred costs in the future. Government contract violations could result in the imposition of civil and criminal penalties or sanctions, contract termination, forfeiture of profit and/or suspension of payment, any of which could make us lose our status as an eligible government contractor. We could also suffer serious harm to our reputation.
Because we depend on federal, state and local governments for a significant portion of our revenue, our inability to win or renew government contracts during regulated procurement processes could harm our operations and significantly reduce or eliminate our profits
Government contracts are awarded through a regulated procurement process. The U.S. federal government has increasingly relied upon multi-year contracts with pre-established terms and conditions, such as indefinite delivery/indefinite quantity ("IDIQ") contracts, which generally require those contractors who have previously been awarded the IDIQ to engage in an additional competitive bidding process before a task order is issued. The increased competition, in turn, may require us to make sustained efforts to reduce costs in order to realize revenues and profits under government contracts. If we are not successful in reducing the amount of costs we incur, our profitability on government contracts will be negatively impacted. Moreover, even if we are qualified to work on a government contract, we may not be awarded the contract because of existing government policies designed to protect small businesses and underrepresented minority contractors. Our inability to win or renew government contracts during regulated procurement processes could harm our operations and significantly reduce or eliminate our profits.
Our government contracts may give the government the right to modify, delay, curtail or terminate our contracts at its convenience at any time prior to their completion, and if we do not replace these contracts, we may suffer a decline in revenues
Government projects in which we participate as a contractor or subcontractor may extend for several years. Generally, government contracts include the right to modify, delay, curtail or terminate contracts and subcontracts at the government's convenience any time prior to their completion. Any decision by a government client to modify, delay, curtail or terminate our contracts at its convenience may result in a decline in revenues.
30
Our failure to properly manage projects may result in additional costs or claims
Our engagements often involve large-scale, complex projects. The quality of our performance on such projects depends in large part upon our ability to manage the relationship with our clients and our ability to effectively manage the project and deploy appropriate resources, including third-party contractors and our own personnel, in a timely manner. If we miscalculate the resources or time we need to complete a project with capped or fixed fees, or the resources or time we need to meet contractual milestones, our operating results could be adversely affected. Further, any defects or errors, or failures to meet our clients' expectations, could result in claims for damages against us. Our contracts generally limit our liability for damages that arise from negligent acts, errors, mistakes or omissions in rendering services to our clients. However, we cannot be sure that these contractual provisions will protect us from liability for damages in the event we are sued. Prior to fiscal 2006, we experienced significant project cost overruns on the performance of certain fixed-price construction work, other than that associated with our U.S. federal government projects. Although we have implemented procedures intended to address these issues, no assurance can be given that we will not experience project management issues in the future.
The loss of key personnel or our inability to attract and retain qualified personnel could significantly disrupt our business
As primarily a professional and technical services company, we are labor-intensive and therefore our ability to attract, retain and expand our senior management and our professional and technical staff is an important factor in determining our future success. With limited exceptions, we do not have employment agreements with any of these individuals. The loss of the services of any of these key personnel could adversely affect our business. Although we have obtained non-compete agreements from certain principals and stockholders of companies we have acquired, we generally do not have non-compete or employment agreements with key employees who were once equity holders of these companies. Further, many of our non-compete agreements have expired. We do not maintain key-man life insurance policies on any of our executive officers or senior managers.
The market for the qualified scientists and engineers is competitive and we may not be able to attract and retain such professionals. In addition, it may be difficult to attract and retain qualified individuals in the timeframe demanded by our clients. For example, some of our government contracts may require us to employ only individuals who have particular government security clearance levels. In an effort to attract key employees, we often grant them stock options, and a reduction in our stock price could impact our ability to retain these professionals.
Our actual results could differ from the estimates and assumptions that we use to prepare our financial statements, which may significantly reduce or eliminate our profits
To prepare financial statements in conformity with generally accepted accounting principles ("GAAP") in the United States, management is required to make estimates and assumptions as of the date of the financial statements. These estimates and assumptions affect the reported values of assets, liabilities, revenues and expenses, as well as disclosures of contingent assets and liabilities. Areas requiring significant estimates by our management include:
- •
- The application of the percentage-of-completion method of accounting and revenue recognition on
contracts, change orders and contract claims;
- •
- Provisions for uncollectible receivables and client claims and recoveries of costs from subcontractors, vendors and
others;
- •
- Provisions for income taxes and related valuation allowances;
- •
- Value of goodwill and recoverability of other intangible assets;
31
- •
- Valuations of assets acquired and liabilities assumed in connection with business combinations;
- •
- Valuation of employee benefit plans;
- •
- Valuation of stock-based compensation expense; and
- •
- Accruals for estimated liabilities, including litigation and insurance reserves.
Our actual results could differ from those estimates, which may significantly reduce or eliminate our profits.
Our use of the percentage-of-completion method of accounting could result in reduction or reversal of previously recorded revenue and profits
We account for most of our contracts on the percentage-of-completion method of accounting. Generally, our use of this method results in recognition of revenue and profit ratably over the life of the contract, based on the proportion of costs incurred to date to total costs expected to be incurred for the entire project. The effect of revisions to revenue and estimated costs, including the achievement of award and other fees, is recorded when the amounts are known and can be reasonably estimated. Such revisions could occur in any period and their effects could be material. The uncertainties inherent in the estimating process make it possible for actual costs to vary materially from estimates, including reductions or reversals of previously recorded revenue and profit.
Our business and operating results could be adversely affected by our inability to accurately estimate the overall risks, revenue or costs on a contract
We generally enter into three principal types of contracts with our clients: fixed-price, time-and-materials and cost-plus. Under our fixed-price contracts, we receive a fixed price irrespective of the actual costs we incur and, consequently, we are exposed to a number of risks. These risks include underestimation of costs, problems with new technologies, unforeseen costs or difficulties, delays beyond our control, price increases for materials, and economic and other changes that may occur during the contract period. Under our time-and-materials contracts, we are paid for labor at negotiated hourly billing rates and for other expenses. Profitability on these contracts is driven by billable headcount and cost control. Many of our time-and-materials contracts are subject to maximum contract values and, accordingly, revenue relating to these contracts is recognized as if these contracts were fixed-price contracts. Under our cost-plus contracts, some of which are subject to contract ceiling amounts, we are reimbursed for allowable costs and fees, which may be fixed or performance-based. If our costs exceed the contract ceiling or are not allowable under the provisions of the contract or any applicable regulations, we may not be able to obtain reimbursement for all such costs.
Accounting for a contract requires judgments relative to assessing the contract's estimated risks, revenue, costs and other technical issues. Due to the size and nature of many of our contracts, the estimation of overall risk, revenue and cost at completion is complicated and subject to many variables. Changes in underlying assumptions, circumstances or estimates may also adversely affect future period financial performance. If we are unable to accurately estimate the overall revenue or costs on a contract, then we may experience a lower profit or incur a loss on the contract.
Our failure to win new contracts and renew existing contracts with private and public sector clients could adversely affect our profitability
Our business depends on our ability to win new contracts and renew existing contracts with private and public sector clients. Contract proposals and negotiations are complex and frequently involve a lengthy bidding and selection process that is affected by a number of factors. These factors include market conditions, financing arrangements and required governmental approvals. For example, a client may require us to provide a bond or letter of credit to protect the client should we fail to perform
32
under the terms of the contract. If negative market conditions arise, or if we fail to secure adequate financial arrangements or the required governmental approval, we may not be able to pursue particular projects, which could adversely affect our profitability.
There are risks associated with our acquisition strategy that could adversely impact our business and operating results
A key part of our growth strategy is to acquire other companies that complement our lines of business or that broaden our technical capabilities and geographic presence. We expect to continue to acquire companies as an element of our growth strategy; however, our ability to make acquisitions is restricted under our credit agreement. Acquisitions involve certain known and unknown risks that could cause our actual growth or operating results to differ from our expectations or the expectations of securities analysts. For example:
- •
- We may not be able to identify suitable acquisition candidates or to acquire additional companies on acceptable terms;
- •
- We are pursuing international acquisitions, which inherently pose more risk than domestic acquisitions;
- •
- We compete with others to acquire companies which may result in decreased availability of, or increased price for,
suitable acquisition candidates;
- •
- We may not be able to obtain the necessary financing, on favorable terms or at all, to finance any of our potential
acquisitions;
- •
- We may ultimately fail to consummate an acquisition even if we announce that we plan to acquire a company;
- •
- We may not be able to retain key employees of an acquired company, which could negatively impact that company's future
performance;
- •
- We may fail to successfully integrate or manage these acquired companies due to differences in business backgrounds or
corporate cultures;
- •
- If we fail to successfully integrate any acquired company, our reputation could be damaged. This could make it more
difficult to market our services or to acquire additional companies in the future; and
- •
- Acquired companies may not perform as we expect, and we may fail to realize anticipated revenue and profits.
In addition, our acquisition strategy may divert management's attention away from our existing businesses, result in the loss of key clients or key employees, and expose us to unanticipated problems or legal liabilities, including responsibility as a successor-in-interest for undisclosed or contingent liabilities of acquired businesses or assets.
Further, acquisitions may also cause us to:
- •
- Issue common stock that would dilute our current stockholders' ownership percentage;
- •
- Assume liabilities, including environmental liabilities, for which we do not have indemnification from the former owners.
Further, indemnification obligations may be subject to dispute or concerns regarding the creditworthiness of the former owners;
- •
- Record goodwill that will be subject to impairment testing and potential impairment charges;
- •
- Incur amortization expenses related to certain intangible assets;
33
- •
- Lose existing or potential contracts as a result of conflict of interest issues;
- •
- Incur large and immediate write-offs; or
- •
- Become subject to litigation.
Finally, acquired companies that derive a significant portion of their revenue from the U.S. federal government and that do not follow the same cost accounting policies and billing practices that we follow may be subject to larger cost disallowances for greater periods than we typically encounter. If we fail to determine the existence of unallowable costs and do not establish appropriate reserves in advance of an acquisition, we may be exposed to material unanticipated liabilities, which could have a material adverse effect on our business.
If our goodwill or other intangible assets become impaired, then our profits may be significantly reduced
Because we have historically acquired a significant number of companies, goodwill and other intangible assets have represented a substantial portion of our assets. As of September 27, 2009, our goodwill was $319.7 million and other intangible assets were $33.8 million. We are required to perform a goodwill and indefinite-lived intangible asset impairment test for potential impairment at least on an annual basis. The goodwill impairment test requires us to determine the fair value of our reporting units which are the components of our business one level below our four reportable segments. In determining fair value, we make significant judgments and estimates, including assumptions about our strategic plans with regard to our operations, as well as to interpret current economic indicators and market valuations. To the extent economic conditions that would impact the future operations of our reporting units change, our goodwill may be deemed to be impaired, and we would be required to record a non-cash charge that could result in a material adverse effect on our financial position or results of operations. Two of our reporting units that have recorded an aggregate of $54.0 million of our goodwill have fair values in excess of their carrying values by approximately 39% and 13%. It is reasonably possible that future changes in the judgments, assumptions and estimates we made in determining the fair value could cause goodwill related to these or other reporting units to become impaired.
If we are not able to successfully manage our growth strategy, our business and results of operations may be adversely affected
Our expected future growth presents numerous managerial, administrative, operational and other challenges. Our ability to manage the growth of our operations will require us to continue to improve our management information systems and our other internal systems and controls. In addition, our growth will increase our need to attract, develop, motivate and retain both our management and professional employees. The inability of our management to effectively manage our growth or the inability of our employees to achieve anticipated performance could have a material adverse effect on our business.
Adverse resolution of an Internal Revenue Service ("IRS") or other tax authority examination process may harm our financial results
We remain in the appeals process with the IRS for fiscal years 2002 through 2004 related to research and experimentation credits ("R&E Credits") and our tax accounting method for revenue recognition. We are also under examination by the California Franchise Tax Board ("FTB") for fiscal years 2001 through 2003 related to R&E Credits. Management believes that it is reasonably possible we will reach a resolution of these audits within the next 12 months. We have completed R&E Credit studies and analyses for the tax years subsequent to fiscal 2004 and are in the process of filing amended returns to claim federal and state R&E Credits for certain years. There is a high probability
34
that the claims will be examined by taxing authorities. If the resolution of these pending and anticipated examinations is more favorable than expected, the change in unrecognized tax benefits could be significant. However, if the resolution is less favorable than expected, there may be a material increase in our income tax expense in the period in which the determination is made.
Our backlog is subject to cancellation and unexpected adjustments, and is an uncertain indicator of future operating results
Our backlog as of September 27, 2009 was $1.6 billion. We include in backlog only those contracts for which funding has been provided and work authorizations have been received. We cannot guarantee that the revenue projected in our backlog will be realized or, if realized, will result in profits. In addition, project cancellations or scope adjustments may occur, from time to time, with respect to contracts reflected in our backlog. For example, certain of our contracts with the U.S. federal government and other clients are terminable at the discretion of the client with or without cause. These types of backlog reductions could adversely affect our revenue and margins. Accordingly, our backlog as of any particular date is an uncertain indicator of our future earnings.
Our international operations expose us to risks such as different business cultures, laws and regulations
During fiscal 2009, we generated 7.5% of our revenue, net of subcontractor costs, from international clients. The different business cultures associated with international operations may not be fully appreciated before we sign an agreement, and thereby expose us to risk. Likewise, prior to signing a contract, we need to understand international laws and regulations, such as foreign tax and labor laws, and U.S. laws and regulations applicable to companies engaging in business outside of the United States, such as the Foreign Corrupt Practices Act. For these reasons, pricing and executing international contracts is more difficult and carries more risk than pricing and executing domestic contracts. Our experience has also shown that it is typically more difficult to collect on international work that has been performed and billed.
Our international operations expose us to foreign currency risk
A majority of our transactions are in U.S. dollars; however, a few foreign subsidiaries conduct businesses in various foreign currencies. Therefore, we are subject to currency exposures and volatility because of currency fluctuations, inflation changes and economic conditions in these countries. We currently have no foreign currency hedges. We attempt to minimize our exposure to foreign currency fluctuations by matching our revenues and expenses in the same currency for our contracts.
If our business partners fail to perform their contractual obligations on a project, we could be exposed to legal liability, loss of reputation and profit reduction or loss on the project
We routinely enter into subcontracts and, occasionally, teaming arrangements and other contractual arrangements so that we can jointly bid and perform on a particular project. Success under these arrangements depends in large part on whether our business partners fulfill their contractual obligations satisfactorily. If any of our business partners fail to satisfactorily perform their contractual obligations as a result of financial or other difficulties, we may be required to incur additional costs and provide additional services in order to make up for our business partners' shortfall. If we are unable to adequately address our business partners' performance issues, then our client could terminate the joint project, exposing us to legal liability, loss of reputation and reduced profit or loss on the project.
35
In conducting our business, we depend on other contractors and subcontractors. If these parties fail to satisfy their obligations to us or other parties, or if we are unable to maintain these relationships, our revenue, profitability and growth prospects could be adversely affected
We depend on contractors and subcontractors in conducting our business. There is a risk that we may have disputes with our subcontractors arising from, among other things, the quality and timeliness of work performed by the subcontractor, client concerns about the subcontractor, or our failure to extend existing task orders or issue new task orders under a subcontract. In addition, if any of our subcontractors fail to deliver on a timely basis the agreed-upon supplies, fail to perform the agreed-upon services or go out of business, then our ability to fulfill our obligations as a prime contractor may be jeopardized.
We also rely on relationships with other contractors when we act as their subcontractor or joint venture partner. The absence of qualified subcontractors with whom we have a satisfactory relationship could adversely affect the quality of our service and our ability to perform under some of our contracts. Our future revenue and growth prospects could be adversely affected if other contractors eliminate or reduce their subcontracts or teaming arrangement relationships with us, or if a government agency terminates or reduces these other contractors' programs, does not award them new contracts or refuses to pay under a contract.
Changes in existing environmental laws, regulations and programs could reduce demand for our environmental services, which could cause our revenue to decline
A significant amount of our business is generated either directly or indirectly as a result of existing U.S. federal and state laws, regulations and programs related to pollution and environmental protection. Accordingly, a relaxation or repeal of these laws and regulations, or changes in governmental policies regarding the funding, implementation or enforcement of these programs, could result in a decline in demand for environmental services that may have a material adverse effect on our revenue.
Changes in capital markets could adversely affect our access to capital and negatively impact our business
Our results could be adversely affected by a reduction in the volume of debt securities issued in domestic and/or global capital markets or an inability to access our $300 million revolving credit facility. Unfavorable financial or economic conditions that either reduce investor demand for debt securities or reduce issuers' willingness or ability to issue such securities could reduce the number and dollar volume of debt issuance as well as impact certain issuers' willingness or ability to fund our revolving credit facility. In addition, increases in interest rates or credit spreads, volatility in financial markets or the interest rate environment, significant political or economic events, defaults of significant issuers and other market and economic factors may negatively impact the general level of debt issuance, the debt issuance plans of certain categories of borrowers, the types of credit-sensitive products being offered, and/or a sustained period of market decline or weakness could have a material adverse effect on us.
Restrictive covenants in our credit agreement may restrict our ability to pursue certain business strategies
Our credit agreement restricts our ability to, among other things:
- •
- Incur additional indebtedness;
- •
- Create liens securing debt or other encumbrances on our assets;
- •
- Make loans or advances;
36
- •
- Pay dividends or make distributions to our stockholders;
- •
- Purchase or redeem our stock;
- •
- Repay indebtedness that is junior to indebtedness under our credit agreement;
- •
- Acquire the assets of, or merge or consolidate with, other companies; and
- •
- Sell, lease or otherwise dispose of assets.
Our credit agreement also requires that we maintain certain financial ratios, which we may not be able to achieve.
Our industry is highly competitive and we may be unable to compete effectively
Our industry is highly fragmented and intensely competitive. Our competitors are numerous, ranging from small private firms to multi-billion-dollar public companies. In addition, the technical and professional aspects of our services generally do not require large upfront capital expenditures and provide limited barriers against new competitors. Some of our competitors have achieved greater market penetration in some of the markets in which we compete, and some have substantially more financial resources and/or financial flexibility than we do. Our clients may select one of our competitors on a project due to competitive pricing or a specific skill set. These competitive forces could force us to make price concessions or otherwise reduce prices for our services, thereby causing a material adverse effect on our business, financial condition and results of operations.
The value of our common stock could be volatile
Our common stock has previously experienced substantial price volatility. In addition, the stock market has experienced extreme price and volume fluctuations that have affected the market price of many companies and that have often been unrelated to the operating performance of these companies. The overall market and the price of our common stock may fluctuate greatly. The trading price of our common stock may be significantly affected by various factors, including:
- •
- Quarter-to-quarter variations in our financial results, including revenue, profits, days sales
outstanding, backlog, and other measures of financial performance or financial condition;
- •
- Our announcements or our competitors' announcements of significant events, including acquisitions;
- •
- Resolution of threatened or pending litigation;
- •
- Changes in investors' and analysts' perceptions of our business or any of our competitors' businesses;
- •
- Investors' and analysts' assessments of reports prepared or conclusions reached by third parties;
- •
- Changes in environmental legislation;
- •
- Investors' perceptions of our performance of services in countries in which the U.S. military is engaged, including Iraq
and Afghanistan;
- •
- Broader market fluctuations; and
- •
- General economic or political conditions.
Additionally, volatility or a lack of positive performance in our stock price may adversely affect our ability to retain key employees, many of whom are granted stock options and shares of restricted stock, the value of which is dependent on the performance of our stock price.
37
Our services expose us to significant risks of liability and it may be difficult to obtain or maintain adequate insurance coverage
Our services involve significant risks of professional and other liabilities that may substantially exceed the fees we derive from our services. Our business activities could expose us to potential liability under various environmental laws and under workplace health and safety regulations. In addition, we sometimes assume liability by contract under indemnification agreements. We cannot predict the magnitude of such potential liabilities.
We obtain insurance from third parties to cover our potential risks and liabilities. It is possible that we may not be able to obtain adequate insurance to meet our needs, may have to pay an excessive amount for the insurance coverage we want, or may not be able to acquire any insurance for certain types of business risks.
Our liability for damages due to legal proceedings may harm our operating results or financial condition
We are a party to lawsuits in the normal course of business. Various legal proceedings are currently pending against us and certain of our subsidiaries alleging, among other things, breach of contract or tort in connection with the performance of professional services. We cannot predict the outcome of these proceedings with certainty. In some actions, parties are seeking damages that exceed our insurance coverage or for which we are not insured. If we sustain damages that exceed our insurance coverage or that are not covered by insurance, there could be a material adverse effect on our business, operating results or financial condition.
Our inability to obtain adequate bonding could have a material adverse effect on our future revenues and business prospects
Many of our clients require bid bonds and performance and payment bonds. These bonds indemnify the client should we fail to perform our obligations under a contract. If a bond is required for a particular project and we are unable to obtain an appropriate bond, we cannot pursue that project. In some instances, we are required to co-venture with a small or disadvantaged business to pursue certain U.S. federal or state government contracts. In connection with these ventures, we are sometimes required to utilize our bonding capacity to cover all of the payment and performance obligations under the contract with the client. We have a bonding facility but, as is typically the case, the issuance of bonds under that facility is at the surety's sole discretion. Moreover, due to events that can negatively affect the insurance and bonding markets, bonding may be more difficult to obtain or may only be available at significant additional cost. There can be no assurance that bonds will continue to be available to us on reasonable terms. Our inability to obtain adequate bonding and, as a result, to bid on new work could have a material adverse effect on our future revenues and business prospects.
Our business activities may require our employees to travel to and work in countries where there are high security risks, which may result in employee death or injury, repatriation costs or other unforeseen costs
Certain of our contracts may require our employees travel to and work in high-risk countries that are undergoing political, social and economic upheavals resulting in war, civil unrest, criminal activity or acts of terrorism. For example, we currently have employees working in Afghanistan and Iraq. As a result, we may be subject to costs related to employee death or injury, repatriation or other unforeseen circumstances.
38
Our failure to implement and comply with our safety program could adversely affect our operating results or financial condition
Our safety program is a fundamental element of our overall approach to risk management, and the implementation of the safety program is a significant issue in our dealings with our clients. We maintain an enterprise-wide group of health and safety professionals to help ensure that the services we provide are delivered safely and in accordance with standard work processes. Unsafe job sites and office environments have the potential to increase employee turnover, increase the cost of a project to our clients, expose us to types and levels of risk that are fundamentally unacceptable, and raise our operating costs. The implementation of our safety processes and procedures are monitored by various agencies and rating bureaus, and may be evaluated by certain clients in cases in which safety requirements have been established in our contracts. If we fail to meet these requirements or do not properly implement and comply with our safety program, there could be a material adverse effect on our business, operating results or financial condition.
We may be precluded from providing certain services due to conflict of interest issues
Many of our clients are concerned about potential or actual conflicts of interest in retaining management consultants. U.S. federal government agencies have formal policies against continuing or awarding contracts that would create actual or potential conflicts of interest with other activities of a contractor. These policies, among other things, may prevent us from bidding for or performing government contracts resulting from or relating to certain work we have performed. In addition, services performed for a commercial or government client may create a conflict of interest that precludes or limits our ability to obtain work from other public or private organizations. We have, on occasion, declined to bid on projects due to conflict of interest issues.
Force majeure events, including natural disasters and terrorists' actions could negatively impact the economies in which we operate or disrupt our operations, which may affect our financial condition, results of operations or cash flows
Force majeure events, including natural disasters and terrorist attacks, could negatively impact the economies in which we operate by causing the closure of offices, interrupting projects and forcing the relocation of employees. Further, despite our implementation of network security measures, our servers are vulnerable to computer viruses, break-ins and similar disruptions from unauthorized tampering with our computer systems. We typically remain obligated to perform our services after a terrorist action or natural disaster unless the contract contains a force majeure clause that relieves us of our contractual obligations in such an extraordinary event. If we are not able to react quickly to force majeure, our operations may be affected significantly, which would have a negative impact on our financial condition, results of operations or cash flows.
We have only a limited ability to protect our intellectual property rights, and our failure to protect our intellectual property rights could adversely affect our competitive position
Our success depends, in part, upon our ability to protect our proprietary information and other intellectual property. We rely principally on trade secrets to protect much of our intellectual property where we do not believe that patent or copyright protection is appropriate or obtainable. However, trade secrets are difficult to protect. Although our employees are subject to confidentiality obligations, this protection may be inadequate to deter or prevent misappropriation of our confidential information. In addition, we may be unable to detect unauthorized use of our intellectual property or otherwise take appropriate steps to enforce our rights. Failure to obtain or maintain trade secret protection would adversely affect our competitive business position. In addition, if we are unable to prevent third parties from infringing or misappropriating our trademarks or other proprietary information, our competitive position could be adversely affected.
39
If we do not successfully complete the ERP system, our cash flows may be impaired and we may incur further costs to integrate or upgrade our systems; any sudden loss, disruption or unexpected costs to maintain our ERP system or other third-party software could significantly increase our operational expense and disrupt the management of our business operations
In fiscal 2004, we began implementation of a new company-wide ERP system, principally for accounting and project management. During fiscal 2009, we converted a few operating units into our ERP system, and we plan to complete the conversion process including our recent acquisitions, in fiscal 2012. In the event we do not complete the project successfully, we may experience difficulty in reporting certain revenue and costs data in an accurate and timely manner. During the ERP implementation process, we have experienced reduced cash flows due to temporary delays in issuing invoices to our clients, which have adversely affected the timely collection of cash. Further, it is possible that the cost of completing this project could exceed our current projections and negatively impact future operating results.
In addition, we rely on third-party software vendors to provide long-term software maintenance support for our information systems. Software vendors may decide to discontinue further development, integration or long-term software maintenance support for our information systems, which may increase our operational expense as well as disrupt the management of our business operation.
Item 1B. Unresolved Staff Comments
None.
Our corporate headquarters is located in Pasadena, California. This leased facility contains approximately 68,000 square feet of office space. Substantially all of our properties are leased in approximately 280 office locations in the United States and abroad. We own facilities located in Gloversville, New York; Casper, Wyoming; Virginia Beach, Virginia and Shreveport, Louisiana that are used for operations. In total, our facilities contain approximately 2.3 million square feet of domestic office space and more than 230,000 square feet of foreign office space. Our significant lease agreements expire at various dates through 2016. We also lease a number of warehouse and laboratory spaces, and rent additional office space on a month-to-month basis.
We believe that our current facilities are adequate for the operation of our business and that suitable additional space in various local markets is available to accommodate any needs that may arise. None of our facilities are individually material to our operations.
We are subject to certain claims and lawsuits typically filed against the engineering, consulting and construction profession, alleging primarily professional errors or omissions. We carry professional liability insurance, subject to certain deductibles and policy limits, against such claims. However, in some actions, parties are seeking damages that exceed our insurance coverage or for which we are not insured. While management does not believe that the resolution of these claims will have a material adverse effect on our financial position, results of operations or cash flows, management acknowledges the uncertainty surrounding the ultimate resolution of these matters.
In May 2003, Innovative Technologies Corporation ("ITC") filed a lawsuit in Montgomery County, Ohio against Advanced Management Technology, Inc. ("AMT") and other defendants for misappropriation of trade secrets, among other claims. In June 2004, we purchased all the outstanding shares of AMT. As part of the purchase agreement, the former owners of AMT agreed to indemnify us for all costs and damages related to this lawsuit. In December 2007, the case went to trial and the jury
40
awarded $5.8 million in compensatory damages against AMT. In addition, the jury awarded $17 million in punitive damages against AMT plus reasonable attorneys fees. In July 2008, the Common Pleas Court of Montgomery County denied AMT's motion for judgment notwithstanding the verdict and conditionally denied AMT's motion for a new trial. Further, the court remitted the verdict to $2.0 million in compensatory damages and $5.8 million in punitive damages. ITC accepted the remittitur, and AMT appealed. The appellate court remanded the matter to the trial court for ruling on ITC's motion for prejudgment interest and attorneys' fees. The trial court has not yet ruled on ITC's motion. We expect that appeals will follow the court's ruling. We believe that a reasonably possible range of exposure, including our attorneys' fees, is from $0 to approximately $14.5 million. As of September 27, 2009, we have recorded a liability representing our best estimate of a probable loss. Further, for the same amount, we have recorded a receivable from the former owners of AMT as we believe it is probable they will fully honor their indemnification agreement with us for any and all costs and damages related to this lawsuit.
Item 4. Submission of Matters to a Vote of Security Holders
None.
41
Item 5. Market for Registrant's Common Equity, Related Stockholder Matters and Issuer Purchases of Equity Securities
Our common stock is traded on the NASDAQ Global Select Market under the symbol TTEK. There were 2,102 stockholders of record as of November 9, 2009. The high and low sales prices per share for the common stock for the last two fiscal years, as reported by the NASDAQ Global Select Market, are set forth in the following tables.
| |
Prices | ||||||
|---|---|---|---|---|---|---|---|
| |
High | Low | |||||
| Fiscal Year 2009 | |
|
|||||
First quarter |
$ | 24.80 | $ | 14.20 | |||
Second quarter |
26.13 | 19.83 | |||||
Third quarter |
29.99 | 20.00 | |||||
Fourth quarter |
32.00 | 24.62 | |||||
Fiscal Year 2008 |
|||||||
First quarter |
$ | 24.24 | $ | 20.03 | |||
Second quarter |
22.07 | 13.89 | |||||
Third quarter |
27.38 | 18.94 | |||||
Fourth quarter |
30.15 | 20.38 | |||||
We have not paid any cash dividends since our inception and do not intend to pay any cash dividends on our common stock in the foreseeable future. Our credit agreement restricts the extent to which cash dividends may be declared or paid.
Stock-Based Compensation Plans
Information regarding our stock-based compensation awards outstanding and available for future grants as of September 27, 2009 is presented in the "Notes to Consolidated Financial Statements" in Item 8.
None.
The following graph shows a comparison of our cumulative total returns with those of the NASDAQ Composite Index and our self-constructed Peer Group Index (as defined below). The graph assumes that the value of an investment in our common stock and in each such index was $100 on October 4, 2004, and that all dividends have been reinvested. No cash dividends have been declared on shares of our common stock. Our self-constructed Peer Group Index includes the following companies: AECOM Technology Corporation; ICF International, Inc.; The Shaw Group, Inc.; and Stantec, Inc. We believe that the companies included in the Peer Group Index are among our primary competitors.
The comparison in the graph below is based on historical data and is not intended to forecast the possible future performance of our common stock.
42
COMPARISON OF 5-YEAR CUMULATIVE TOTAL RETURN
AMONG TETRA TECH, INC.
NASDAQ COMPOSITE INDEX AND PEER GROUP INDEX
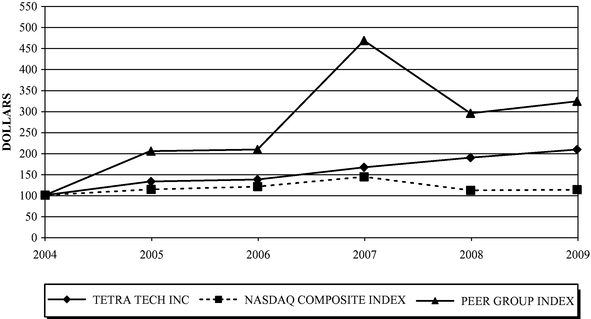
ASSUMES
$100 INVESTED ON OCTOBER 4, 2004
ASSUMES DIVIDEND REINVESTED
FISCAL YEAR ENDED SEPTEMBER 27, 2009
| |
2004 | 2005 | 2006 | 2007 | 2008 | 2009 | |||||||||||||
|---|---|---|---|---|---|---|---|---|---|---|---|---|---|---|---|---|---|---|---|
Tetra Tech, Inc. |
100.00 | 132.75 | 137.49 | 166.69 | 189.90 | 209.39 | |||||||||||||
NASDAQ Composite Index |
100.00 | 113.76 | 120.51 | 144.01 | 111.56 | 112.97 | |||||||||||||
Peer Group Index |
100.00 | 205.50 | 209.39 | 470.54 | 296.13 | 324.97 | |||||||||||||
The performance graph above and related text are being furnished solely to accompany this annual report on Form 10-K pursuant to Item 201(e) of Regulation S-K, and are not being filed for purposes of Section 18 of the Securities Exchange Act of 1934, as amended, and are not to be incorporated by reference into any of our filings with the SEC, whether made before or after the date hereof, regardless of any general incorporation language in such filing.
43
Item 6. Selected Financial Data
SELECTED FIVE-YEAR CONSOLIDATED FINANCIAL DATA
(in thousands, except per share data)
| |
Fiscal Year Ended | |||||||||||||||||
|---|---|---|---|---|---|---|---|---|---|---|---|---|---|---|---|---|---|---|
| |
September 27, 2009(1)(2) |
September 28, 2008(2)(3) |
September 30, 2007(2)(4) |
October 1, 2006(2) |
October 2, 2005 |
|||||||||||||
| Statements of Operations Data | |
|
|
|
|
|||||||||||||
Revenue |
$ |
2,287,484 |
$ |
2,145,254 |
$ |
1,553,888 |
$ |
1,414,704 |
$ |
1,279,531 |
||||||||
Subcontractor costs |
(901,347 | ) | (899,709 | ) | (540,973 | ) | (456,063 | ) | (368,629 | ) | ||||||||
Revenue, net of subcontractor costs |
1,386,137 | 1,245,545 | 1,012,915 | 958,641 | 910,902 | |||||||||||||
Other contract costs |
(1,108,512 |
) |
(991,358 |
) |
(812,270 |
) |
(776,768 |
) |
(758,554 |
) |
||||||||
Gross profit |
277,625 | 254,187 | 200,645 | 181,873 | 152,348 | |||||||||||||
Selling, general and administrative expenses |
(155,736 |
) |
(147,787 |
) |
(114,348 |
) |
(112,378 |
) |
(120,635 |
) |
||||||||
Impairment of goodwill and other intangible assets(5) |
— | — | — | — | (105,612 | ) | ||||||||||||
Income (loss) from operations |
121,889 | 106,400 | 86,297 | 69,495 | (73,899 | ) | ||||||||||||
Interest expense—net |
(2,684 |
) |
(2,987 |
) |
(2,290 |
) |
(5,098 |
) |
(11,165 |
) |
||||||||
Loss on retirement of debt |
— | — | (4,226 | ) | — | — | ||||||||||||
Income (loss) from continuing operations before income tax (expense) benefit |
119,205 | 103,413 | 79,781 | 64,397 | (85,064 | ) | ||||||||||||
Income tax (expense) benefit(6) |
(32,177 |
) |
(42,507 |
) |
(33,437 |
) |
(27,933 |
) |
11,026 |
|||||||||
Income (loss) from continuing operations |
87,028 | 60,906 | 46,344 | 36,464 | (74,038 | ) | ||||||||||||
Income (loss) from discontinued operations, net of tax(7) |
— |
— |
9 |
140 |
(25,431 |
) |
||||||||||||
Net income (loss) |
$ | 87,028 | $ | 60,906 | $ | 46,353 | $ | 36,604 | $ | (99,469 | ) | |||||||
Basic earnings (loss) per share: |
||||||||||||||||||
Income (loss) from continuing operations |
$ | 1.45 | $ | 1.04 | $ | 0.80 | $ | 0.64 | $ | (1.30 | ) | |||||||
Loss from discontinued operations, net of tax |
— | — | — | — | (0.45 | ) | ||||||||||||
Net income (loss) |
$ | 1.45 | $ | 1.04 | $ | 0.80 | $ | 0.64 | $ | (1.75 | ) | |||||||
Diluted earnings (loss) per share: |
||||||||||||||||||
Income (loss) from continuing operations |
$ | 1.43 | $ | 1.02 | $ | 0.79 | $ | 0.63 | $ | (1.30 | ) | |||||||
Loss from discontinued operations, net of tax |
— | — | — | — | (0.45 | ) | ||||||||||||
Net income (loss) |
$ | 1.43 | $ | 1.02 | $ | 0.79 | $ | 0.63 | $ | (1.75 | ) | |||||||
Weighted-average common shares outstanding: |
||||||||||||||||||
Basic |
60,135 | 58,813 | 57,948 | 57,376 | 56,736 | |||||||||||||
Diluted |
60,994 | 59,632 | 58,553 | 57,892 | 56,736 | |||||||||||||
Balance Sheet Data(8) |
||||||||||||||||||
Working capital |
$ | 223,654 | $ | 232,154 | $ | 194,375 | $ | 150,313 | $ | 121,614 | ||||||||
Total assets |
1,097,905 | 1,056,545 | 847,487 | 701,679 | 648,135 | |||||||||||||
Long-term obligations, excluding current portion |
6,530 | 53,292 | 81,080 | 57,608 | 74,185 | |||||||||||||
Stockholders' equity |
646,478 | 511,514 | 415,703 | 354,803 | 304,616 | |||||||||||||
- (1)
- Includes the results of operations and financial position of Wardrop Engineering, Inc. (acquired January 28, 2009) and other acquisitions (acquired throughout fiscal 2009) from their respective acquisition dates.
44
- (2)
- Includes
stock-based compensation expense of $9.4 million ($5.6 million, net of tax), $8.3 million ($5.0 million,
net of tax), $5.8 million ($3.5 million, net of tax) and $4.8 million ($4.3 million, net of tax) in fiscal 2009, 2008, 2007 and 2006, respectively.
- (3)
- Includes
the results of operations and financial position of ARD, Inc. (acquired October 1, 2007) and other acquisitions
(acquired throughout fiscal 2008) from their respective acquisition dates.
- (4)
- Includes
the results of operations and financial position of The Delaney Group (acquired April 16, 2007) and other acquisitions
(acquired throughout fiscal 2007) from their respective acquisition dates.
- (5)
- Represents
the non-cash goodwill impairment charge in the EAS segment, which resulted from our annual goodwill testing in fiscal
2005.
- (6)
- Reflects
a tax settlement with the IRS and the recognition of previously unclaimed R&E Credits in fiscal 2009 based on completed studies and
analyses.
- (7)
- Reflects
tax expense of $0.1 million and tax benefit of $1.0 million and $16.1 million in fiscal 2007, 2006 and 2005,
respectively.
- (8)
- Includes both continuing and discontinued operations as of the end of each reporting period.
45
Item 7. Management's Discussion and Analysis of Financial Condition and Results of Operations
MANAGEMENT'S DISCUSSION AND ANALYSIS OF
FINANCIAL CONDITION AND RESULTS OF OPERATIONS
We are a leading provider of consulting, engineering, program management, construction and technical services focusing on resource management, infrastructure and the environment. We serve our clients by providing cost-effective and innovative solutions to fundamental needs for water, environmental and energy services. We typically begin at the earliest stage of a project by applying science to problems and developing solutions tailored to our clients' needs and resources. Our solutions may span the entire life cycle of the project and include applied science, research and technology, engineering, design, construction management, construction, operations and maintenance, and information technology.
We derive our revenue from fees for professional, technical, project management and construction services. As primarily a service-based company, we are labor-intensive rather than capital-intensive. Our revenue is driven by our ability to attract and retain qualified and productive employees, identify business opportunities, secure new and renew existing client contracts, provide outstanding services to our clients and execute projects successfully. We provide our services to a diverse base of federal and state and local government agencies, as well as commercial and international clients. The following table presents the approximate percentage of our revenue, net of subcontractor costs, by client sector:
| |
Fiscal Year | |||||
|---|---|---|---|---|---|---|
| Client Sector | 2009 | 2008 | 2007 | |||
Federal government |
45.3% | 43.3% | 43.9% | |||
State and local government |
15.0 | 17.8 | 20.2 | |||
Commercial |
32.2 | 37.9 | 35.0 | |||
International(1) |
7.5 | 1.0 | 0.9 | |||
|
100.0% | 100.0% | 100.0% | |||
- (1)
- Includes all revenue generated from our foreign operations and revenue generated from our international clients that is performed by our domestic operations. Revenue related to projects performed by our domestic operations in foreign countries for U.S. federal government and domestic commercial clients was reported as part of our U.S. federal government and commercial client sectors, respectively.
In the first quarter of fiscal 2009, we began reporting under four new reportable segments with reclassification of the prior year segment results to conform to the new basis of presentation. Each of the new reportable segments is comprised of similar activities that focus on the services it provides, the markets it serves, the distribution method of its services, its contracting mechanisms, the organization and execution of its projects, the education and discipline of its workforce, and the metrics by which its client projects and staff are measured. In addition, each of our operating groups, which are also our reportable segments, is managed by its own president, who has responsibility for the segment's reporting units. Each segment president directly reports to our Chief Executive Officer, who is our CODM. The CODM regularly reviews the four reportable segments, allocates resources to these segments and assesses each segment's performance. The reportable segments are as follows:
Environmental Consulting Services. ECS provides front-end science and consulting services and project management in the areas of water resources, groundwater services, watershed management, mining and geotechnical sciences, environmental management, and information technology and modeling consulting.
46
Technical Support Services. TSS advises clients through the study, design and implementation of projects. TSS conducts research in the areas of remedial planning, disaster management, sustainable solutions including climate change and carbon management, technical government staffing services, and program management for complex U.S. federal government and international development projects.
Engineering and Architecture Services. EAS provides engineering and architecture design services, including LEED services, together with technical and program administration services for projects related to water infrastructure, buildings and land development, and transportation.
Remediation and Construction Management. RCM provides a wide array of services, including program management, engineering, procurement and construction, construction management, and operations and maintenance. RCM is focused on federal construction, environmental remediation including UXO and wetland restoration, energy projects including wind, nuclear engineering and other alternative energies, and communications development and construction.
The following table presents the approximate percentage of our revenue, net of subcontractor costs, by reportable segment:
| |
Fiscal Year | |||||
|---|---|---|---|---|---|---|
| Reportable Segment | 2009 | 2008 | 2007 | |||
ECS |
32.0% | 28.0% | 29.9% | |||
TSS |
22.7 | 22.4 | 17.7 | |||
EAS |
16.9 | 20.8 | 23.4 | |||
RCM |
28.4 | 28.8 | 29.0 | |||
|
100.0% | 100.0% | 100.0% | |||
For more information, see Note 15 (Reportable Segments) of the "Notes to Consolidated Financial Statements" included in Item 8.
Our services are provided under three principal types of contracts: fixed-price, time-and-materials and cost-plus. The following table presents the percentage of our revenue, net of subcontractor costs, by contract type:
| |
Fiscal Year | |||||
|---|---|---|---|---|---|---|
| Contract Type | 2009 | 2008 | 2007 | |||
Fixed-price |
37.9% | 37.1% | 33.2% | |||
Time-and-materials |
41.4 | 42.3 | 45.6 | |||
Cost-plus |
20.7 | 20.6 | 21.2 | |||
|
100.0% | 100.0% | 100.0% | |||
Management review of fiscal 2009 and outlook for the future. Fiscal 2009 was a very challenging year due to unprecedented weakness in the economy brought about by the global financial crisis that began in 2008. Despite these economic challenges, we continued to deliver solid financial results in fiscal 2009 that reflected improvement compared to fiscal 2008. Our performance was driven by our continuing focus on long-term value creation through the execution of our growth strategy. We invested in business development activities to grow our business organically and made strategic acquisitions to enhance our service offerings and further expand our geographic presence. In addition, we continued to implement and enforce project management policies and programs that focused on contract execution and risk management controls. We also focused on cost control and the strategic management of our
47
portfolio of businesses. Our cost control efforts helped to mitigate the higher costs we experienced in fiscal 2009 from losses on certain contracts and receivables in certain parts of our commercial business as a result of the economic downturn.
While we foresee a continued period of considerable weakness in the economy and a slow and gradual economic recovery, we anticipate that our revenue will grow modestly in fiscal 2010. In addition, we expect that the U.S. federal government's stimulus plan contained in the American Recovery and Reinvestment Act of 2009 ("ARRA") should provide us with additional business opportunities. However, because the timing and magnitude of any potential benefit to our business from the ARRA are uncertain, we cannot predict how meaningful such contributions may be in fiscal 2010. Our backlog at the end of fiscal 2009 declined 4.0% compared to last fiscal year-end. This decline was caused by funding delays in federal government projects attributed to ARRA-related administrative and contracting burdens placed upon federal government agencies, as well as reduced funding for wind energy projects. We recognize that the economic conditions that have severely impacted both the domestic and international economies could adversely affect our future work for the U.S. federal government, state and local governments, and commercial and international clients, which constituted approximately 51%, 12%, 32% and 5% of our fiscal 2009 revenue, respectively.
Federal Government. Our federal government business grew 7.9% in fiscal 2009 compared to fiscal 2008. The revenue growth resulted from our recent acquisitions and increased activity on our domestic projects with U.S. federal government clients including the DoD, USAID, DOE, FAA, NASA and EPA. However, the wind-down of our Iraq-related projects for the DoD partially offset our growth in fiscal 2009. During periods of economic volatility, our federal government business has historically been the most stable and predictable. Overall, our revenue from federal government projects is anticipated to increase moderately in fiscal 2010. However, we continue to experience some delays in existing and near-term projects due to the diversion of attention to ARRA project planning and contracting efforts at some federal contracting offices.
State and Local Government. Our state and local government business declined 11.1% in fiscal 2009 compared to fiscal 2008. The revenue decline resulted primarily from the continuing difficult economic conditions. Many state and local government agencies are continuing to face economic challenges, including budget deficits, declining tax revenues and difficult cost-cutting decisions. Simultaneously, states are facing major long-term infrastructure needs, including the need for maintenance, repair and upgrading of existing critical infrastructure and the need to build new facilities. The funding risks associated with our state and local government programs are partially mitigated by the regulatory requirements driving some of these programs, such as regulatory-mandated consent decrees, as well as demographic shifts and increasing demand for water and wastewater services. As a result, some programs will generally progress despite budget pressures. We anticipate ongoing economic weakness across most states and remain uncertain regarding the timing and magnitude of ARRA funds that may eventually benefit some of our state and local government business. However, due to significant infrastructure projects that recently commenced, we expect that our state and local government revenue will increase moderately in fiscal 2010.
Commercial. In fiscal 2009, our commercial business grew 0.7% compared to fiscal 2008. The slight revenue growth was primarily attributable to the demand for our wind energy and water services. However, this was largely offset by project delays, cancellations and reduced workload in our real estate development, mining and industrial sectors resulting from the current economic conditions. Overall, we anticipate that our commercial business will decline in fiscal 2010 compared to fiscal 2009 due primarily to the reduced backlog of wind energy projects.
International. Our international business grew $87.0 million, or 497.5%, compared to fiscal 2008 primarily from our Wardrop acquisition in fiscal 2009. To a lesser extent, this growth was driven by demand for our engineering design services overseas. We anticipate that our international business will
48
continue to grow in fiscal 2010 compared to fiscal 2009. However, global economic weakness could result in lower revenue than anticipated if planned mining or energy projects are delayed or cancelled due to declining commodity and energy prices.
Acquisitions. We continuously evaluate the marketplace for strategic acquisition opportunities. Due to our reputation, size, financial resources, geographic presence and range of services, we have numerous opportunities to acquire both privately held companies and subsidiaries of publicly held companies. During our evaluation, we examine the effect an acquisition may have on our long-range business strategy and results of operations. Generally, we proceed with an acquisition if we believe that it would have a positive effect on future operations and could strategically expand our service offerings. As successful integration and implementation are essential to achieving favorable results, no assurance can be given that all acquisitions will provide accretive results. Our strategy is to position ourselves to address existing and emerging markets. We view acquisitions as a key component of our growth strategy, and we intend to use both cash and securities, as we deem appropriate, to fund acquisitions. We may acquire other businesses that we believe are synergistic and will ultimately increase our revenue and net income, strengthen our ability to achieve our strategic goals, provide critical mass with existing clients and further expand our lines of service. Because we typically acquire service businesses with limited tangible assets, our acquisitions generally result in the recognition of goodwill and other identifiable intangible assets.
In the third quarter of fiscal 2007, we acquired DGI, which provides planning, development and construction services for wind energy programs, BRAC projects, and water and wastewater treatment and conveyance facilities to its broad-based clients. This acquisition enables us to provide a wider range of services to our current and prospective wind energy clients, as DGI offers complementary capabilities and client relationships. DGI is part of our RCM segment. In fiscal 2007, we also made other acquisitions that were integrated into our EAS and ECS segments and enhanced our service offerings to clients.
In the first quarter of fiscal 2008, we acquired ARD, which provides applied research, planning, design and implementation services focused on a range of water, energy, environmental and governance challenges. ARD manages large, complex international development projects for its clients, predominantly USAID. This acquisition continues our international expansion as it increases our professional workforce in new geographic areas and technical specialties around the world. ARD is part of our TSS segment. In fiscal 2008, we also made other acquisitions in our EAS and ECS segments that enhanced our service offerings and expanded our geographic presence.
In the second quarter of fiscal 2009, we acquired Wardrop, a Canadian firm that specializes in resource management, energy and infrastructure design and is part of our ECS segment. This acquisition significantly expanded our worldwide presence, adding 13 offices throughout Canada and offices in the United Kingdom and India. In fiscal 2009, we made other acquisitions in our ECS, TSS and RCM segments that expanded our service offerings to broad-based clients, including USAID.
For analytical purposes only, we categorize our revenue into two types: acquisitive and organic. Acquisitive revenue consists of revenue derived from newly acquired companies that are reported individually as separate operating units during the first 12 months following their respective acquisition dates. Organic revenue consists of our total revenue less any acquisitive revenue.
Divestitures. To complement our acquisition strategy and our focus on internal growth, we regularly review and evaluate our existing operations to determine whether our business model should change through the divestiture of certain businesses. Accordingly, from time to time, we may continue to divest certain non-core businesses and reallocate our resources to businesses that better align with our long-term strategic direction. In fiscal 2007, 2008 and 2009, we did not have any divestitures.
49
Overall, our results for fiscal 2009 improved compared to fiscal 2008 due to our focus on organic growth and the strategic acquisition of firms that enhanced our service offerings and expanded our geographic presence. Our growth was primarily driven by our recent acquisitions and increased activity on BRAC, USAID and other domestic federal government programs. In addition, demand for our wind energy, water, and engineering and development services by commercial clients fueled our organic growth. The overall growth was partially offset by the wind-down of our Iraq-related projects with the DoD, the completion of several large contracts, funding and contract delays, and cancellations by certain commercial, and state and local government clients as a result of the continuing difficult economic conditions.
Fiscal 2009 Compared to Fiscal 2008
Consolidated Results
| |
Fiscal Year Ended | ||||||||||||
|---|---|---|---|---|---|---|---|---|---|---|---|---|---|
| |
|
|
Change | ||||||||||
| |
September 27, 2009 |
September 28, 2008 |
|||||||||||
| |
$ | % | |||||||||||
| |
($ in thousands) |
||||||||||||
Revenue |
$ | 2,287,484 | $ | 2,145,254 | $ | 142,230 | 6.6 | % | |||||
Subcontractor costs |
(901,347 | ) | (899,709 | ) | (1,638 | ) | (0.2 | ) | |||||
Revenue, net of subcontractor costs |
1,386,137 | 1,245,545 | 140,592 | 11.3 | |||||||||
Other contract costs |
(1,108,512 | ) | (991,358 | ) | (117,154 | ) | (11.8 | ) | |||||
Gross profit |
277,625 | 254,187 | 23,438 | 9.2 | |||||||||
Selling, general and administrative expenses |
(155,736 | ) | (147,787 | ) | (7,949 | ) | (5.4 | ) | |||||
Income from operations |
121,889 | 106,400 | 15,489 | 14.6 | |||||||||
Interest expense—net |
(2,684 | ) | (2,987 | ) | 303 | 10.1 | |||||||
Income before income tax expense |
119,205 | 103,413 | 15,792 | 15.3 | |||||||||
Income tax expense |
(32,177 | ) | (42,507 | ) | 10,330 | 24.3 | |||||||
Net income |
$ | 87,028 | $ | 60,906 | $ | 26,122 | 42.9 | % | |||||
The following table presents the percentage relationship of certain items to our revenue, net of subcontractor costs:
| |
Fiscal Year Ended | ||||||
|---|---|---|---|---|---|---|---|
| |
September 27, 2009 |
September 28, 2008 |
|||||
Revenue, net of subcontractor costs |
100.0 | % | 100.0 | % | |||
Other contract costs |
(80.0 | ) | (79.6 | ) | |||
Gross profit |
20.0 | 20.4 | |||||
Selling, general and administrative expenses |
(11.2 | ) | (11.9 | ) | |||
Income from operations |
8.8 | 8.5 | |||||
Interest expense—net |
(0.2 | ) | (0.2 | ) | |||
Income before income tax expense |
8.6 | 8.3 | |||||
Income tax expense |
(2.3 | ) | (3.4 | ) | |||
Net income |
6.3 | % | 4.9 | % | |||
50
Revenue and revenue, net of subcontractor costs, increased due to our strategic acquisitions, particularly Wardrop, which enhanced our international business. In addition, our U.S. federal government business grew as a result of increased activity on BRAC, USAID, DOE, FAA, NASA, EPA and other domestic projects. We also experienced increased demand for our wind energy, water, and engineering and development services in our commercial business. However, the overall growth was partially offset by the wind-down of Iraq-related projects. To a lesser extent, we experienced revenue declines in our state and local government business, and in certain areas of our commercial business because of budget and spending constraints.
Revenue, net of subcontractor costs, increased at a higher growth rate than our revenue due to contract mix, because subcontractor services can change significantly from project to project and from period to period. More specifically, we experienced a decline in subcontracting activity, as a percentage of revenue, due to the wind-down of Iraq-related contracts, which were largely subcontracted. Overall, our subcontracting activities remained high due to wind energy, BRAC and certain water programs. Further, our program management activities on U.S. federal government contracts typically result in higher levels of subcontracting that are partially driven by government-mandated small business set-aside requirements.
The increase in gross profit substantially corresponded to the growth in revenue, net of subcontractor costs. As a percentage, gross profit decreased slightly due to increased costs on certain new programs, regulatory and project delays, subcontractor issues, and provision for losses on certain accounts receivable from commercial clients. The percentage decrease was largely mitigated by improved contract performance on a few large fixed-price contracts related to wind energy, water, and engineering and development projects.
The increase in selling, general and administrative ("SG&A") expenses resulted from our business growth, including the additional amortization expense of intangible assets related to our recent acquisitions and higher business development activities. The increase was partially mitigated by lower litigation costs.
Net interest expense decreased due to lower interest expense driven by lower interest rates and lower average borrowings. Similarly, we recognized lower interest income from short-term cash investments due to lower interest rates.
Income tax expense decreased due to a tax settlement with the IRS and the recognition of previously unclaimed R&E Credits based on completed studies and analyses. Our effective tax rates were 27.0% and 41.1% for fiscal years 2009 and 2008, respectively.
Results of Operations by Reportable Segment
Environmental Consulting Services
| |
Fiscal Year Ended | ||||||||||||
|---|---|---|---|---|---|---|---|---|---|---|---|---|---|
| |
|
|
Change | ||||||||||
| |
September 27, 2009 |
September 28, 2008 |
|||||||||||
| |
$ | % | |||||||||||
| |
($ in thousands) |
||||||||||||
Revenue, net of subcontractor costs |
$ | 443,401 | $ | 348,374 | $ | 95,027 | 27.3 | % | |||||
Other contract costs |
(362,303 | ) | (279,433 | ) | (82,870 | ) | (29.7 | ) | |||||
Gross profit |
$ | 81,098 | $ | 68,941 | $ | 12,157 | 17.6 | % | |||||
Gross profit percentage |
18.3 |
% |
19.8 |
% |
|||||||||
51
The growth in revenue, net of subcontractor costs, was driven by our strategic acquisitions, particularly Wardrop which enhanced our international business. This segment also experienced organic growth in its federal, and state and local government businesses. Further, increased workload on a large environmental engineering and development project for a commercial client contributed to the growth. However, this segment's commercial business declined on an overall basis due to reduced demand for geotechnical and mining services resulting from the economic downturn.
The increase in gross profit largely corresponded to the growth in revenue, net of subcontractor costs. However, on a percentage basis, gross profit declined due to increased costs during the first half of fiscal 2009 on certain fixed-price projects caused by inclement weather, regulatory delays and subcontractor issues. The lower gross profit percentage was partially offset by improved project performance on a large environmental engineering and development project.
Technical Support Services
| |
Fiscal Year Ended | ||||||||||||
|---|---|---|---|---|---|---|---|---|---|---|---|---|---|
| |
|
|
Change | ||||||||||
| |
September 27, 2009 |
September 28, 2008 |
|||||||||||
| |
$ | % | |||||||||||
| |
($ in thousands) |
||||||||||||
Revenue, net of subcontractor costs |
$ | 314,885 | $ | 279,327 | $ | 35,558 | 12.7 | % | |||||
Other contract costs |
(251,480 | ) | (227,007 | ) | (24,473 | ) | (10.8 | ) | |||||
Gross profit |
$ | 63,405 | $ | 52,320 | $ | 11,085 | 21.2 | % | |||||
Gross profit percentage |
20.1 |
% |
18.7 |
% |
|||||||||
The growth in revenue, net of subcontractor costs, was driven by increased demand for our services from the DoD, USAID and other federal government clients. More than half of this growth was contributed by our recent acquisitions. The overall growth was partially offset by a revenue decline in our state and local government business.
The increase in gross profit substantially corresponded to the growth in revenue, net of subcontractor costs. On a percentage basis, gross profit increased as a result of improved project performance on certain fixed-price contracts and our focus on overhead cost control on discretionary expenses.
Engineering and Architecture Services
| |
Fiscal Year Ended | ||||||||||||
|---|---|---|---|---|---|---|---|---|---|---|---|---|---|
| |
|
|
Change | ||||||||||
| |
September 27, 2009 |
September 28, 2008 |
|||||||||||
| |
$ | % | |||||||||||
| |
($ in thousands) |
||||||||||||
Revenue, net of subcontractor costs |
$ | 234,841 | $ | 259,393 | $ | (24,552 | ) | (9.5 | )% | ||||
Other contract costs |
(187,903 | ) | (209,387 | ) | 21,484 | 10.3 | |||||||
Gross profit |
$ | 46,938 | $ | 50,006 | $ | (3,068 | ) | (6.1 | )% | ||||
Gross profit percentage |
20.0 |
% |
19.3 |
% |
|||||||||
Revenue, net of subcontractor costs, decreased due to weakness in the commercial business resulting from the slowdown in the real estate development and industrial markets. Our state and local
52
government business also experienced a revenue decline caused by budget and spending constraints. The overall revenue decline was partially mitigated by demand for our engineering design services overseas from our international clients, increased project activity with the DoD and a full-year of revenue in fiscal 2009 from acquisitions in late fiscal 2008.
The decrease in gross profit substantially corresponded to the decline in revenue, net of subcontractor costs. On a percentage basis, gross profit increased slightly due to the reduction in overhead, labor and other employee-related expenses that corresponded to the revenue decline in this segment. We aggressively focused on overhead cost reduction due to the continued revenue decline. The cost reductions were partially offset by higher provisions for accounts receivable on certain real estate development and other commercial projects resulting from the continuing economic downturn.
Remediation and Construction Management
| |
Fiscal Year Ended | ||||||||||||
|---|---|---|---|---|---|---|---|---|---|---|---|---|---|
| |
|
|
Change | ||||||||||
| |
September 27, 2009 |
September 28, 2008 |
|||||||||||
| |
$ | % | |||||||||||
| |
($ in thousands) |
||||||||||||
Revenue, net of subcontractor costs |
$ | 393,010 | $ | 358,451 | $ | 34,559 | 9.6 | % | |||||
Other contract costs |
(306,826 | ) | (275,531 | ) | (31,295 | ) | (11.4 | ) | |||||
Gross profit |
$ | 86,184 | $ | 82,920 | $ | 3,264 | 3.9 | % | |||||
Gross profit percentage |
21.9 |
% |
23.1 |
% |
|||||||||
The growth in revenue, net of subcontractor costs, was driven by demand for wind energy and water services from our commercial clients. Our federal government business also grew due to increased activity on BRAC, DOE and other federal government programs, largely offset by the wind-down of Iraq-related projects. Further, this segment's growth was partially offset by its revenue decline in the state and local government business as a result of budget constraints and the completion of certain large contracts, as well as the conclusion of a fiber-to-the-premise contract in the second quarter of fiscal 2008. The overall growth was also partially offset by reduced commercial activities in our telecommunications business.
Gross profit did not grow in proportion to the increase in revenue, net of subcontractor costs, due to project start-up costs related to certain new programs; additional contract costs caused by inclement weather, subcontractor issues and scheduling delays; and provision for losses on certain accounts receivable from commercial clients. However, the overall gross profit benefited from favorable claim settlements and higher margins on certain commercial wind energy and water projects.
53
Fiscal 2008 Compared to Fiscal 2007
Consolidated Results
| |
Fiscal Year Ended | ||||||||||||
|---|---|---|---|---|---|---|---|---|---|---|---|---|---|
| |
|
|
Change | ||||||||||
| |
September 28, 2008 |
September 30, 2007 |
|||||||||||
| |
$ | % | |||||||||||
| |
($ in thousands) |
||||||||||||
Revenue |
$ | 2,145,254 | $ | 1,553,888 | $ | 591,366 | 38.1 | % | |||||
Subcontractor costs |
(899,709 | ) | (540,973 | ) | (358,736 | ) | (66.3 | ) | |||||
Revenue, net of subcontractor costs |
1,245,545 | 1,012,915 | 232,630 | 23.0 | |||||||||
Other contract costs |
(991,358 | ) | (812,270 | ) | (179,088 | ) | (22.0 | ) | |||||
Gross profit |
254,187 | 200,645 | 53,542 | 26.7 | |||||||||
Selling, general and administrative expenses |
(147,787 | ) | (114,348 | ) | (33,439 | ) | (29.2 | ) | |||||
Income from operations |
106,400 | 86,297 | 20,103 | 23.3 | |||||||||
Interest expense—net |
(2,987 | ) | (2,290 | ) | (697 | ) | (30.4 | ) | |||||
Loss on retirement of debt |
— | (4,226 | ) | 4,226 | 100.0 | ||||||||
Income from continuing operations before income tax expense |
103,413 | 79,781 | 23,632 | 29.6 | |||||||||
Income tax expense |
(42,507 | ) | (33,437 | ) | (9,070 | ) | (27.1 | ) | |||||
Income from continuing operations |
60,906 | 46,344 | 14,562 | 31.4 | |||||||||
Income from discontinued operation, net of tax |
— | 9 | (9 | ) | (100.0 | ) | |||||||
Net income |
$ | 60,906 | $ | 46,353 | $ | 14,553 | 31.4 | % | |||||
The following table presents the percentage relationship of certain items to our revenue, net of subcontractor costs:
| |
Fiscal Year Ended | ||||||
|---|---|---|---|---|---|---|---|
| |
September 28, 2008 |
September 30, 2007 |
|||||
Revenue, net of subcontractor costs |
100.0 | % | 100.0 | % | |||
Other contract costs |
(79.6 | ) | (80.2 | ) | |||
Gross profit |
20.4 | 19.8 | |||||
Selling, general and administrative expenses |
(11.9 | ) | (11.3 | ) | |||
Income from operations |
8.5 | 8.5 | |||||
Interest expense—net |
(0.2 | ) | (0.2 | ) | |||
Loss on retirement of debt |
— | (0.4 | ) | ||||
Income from continuing operations before income tax expense |
8.3 | 7.9 | |||||
Income tax expense |
(3.4 | ) | (3.3 | ) | |||
Income from continuing operations |
4.9 | 4.6 | |||||
Income from discontinued operation, net of tax |
— | — | |||||
Net income |
4.9 | % | 4.6 | % | |||
Revenue and revenue, net of subcontractor costs increased in fiscal 2008 compared to fiscal 2007. We experienced broad-based growth in all client sectors and all reportable segments from both organic
54
and acquisitive revenue. Our U.S. federal government business continued to grow primarily as a result of the international development projects for USAID associated with our ARD acquisition, and increased workload on our Iraq-related and domestic projects for the DoD. This growth was partially offset by the completion of several large contracts in late fiscal 2007 with the DOE and NASA. Our state and local government business grew due to increased workload on our CSO projects and additional revenue from our strategic acquisitions. This growth was slightly offset by the conclusion of a large fiber-to-the-premises project. Our commercial business experienced strong growth due to increased demand for our wind and other alternative energy services, and to a lesser extent, wastewater treatment, landfill development, environmental engineering and telecommunications infrastructure projects.
The growth rate for revenue, net of subcontractor costs, was lower than that for revenue due to our increased use of subcontractors, and in some cases, higher subcontracting requirements for certain U.S. federal government work, particularly our reconstruction and UXO projects in Iraq and our USAID projects. Further, our program management activities on U.S. federal government contracts typically resulted in higher levels of subcontracting activities that were partially driven by government-mandated small business set-aside requirements.
Other contract costs increased in fiscal 2008 compared to fiscal 2007. On a percentage basis, the increase substantially corresponded to the increase in revenue, net of subcontractor costs. Additionally, our direct non-labor costs, as a percentage of revenue, net of subcontractor costs, increased primarily due to construction and international development projects. The increase was partially mitigated by favorable contract adjustments due to effective contract execution and risk management, as well as claim settlements.
Gross profit increased compared to fiscal year 2007 for the reasons described above. As a percentage of revenue, net of subcontractor costs, gross profit was 20.4% and 19.8% in fiscal 2008 and 2007, respectively. The percentage increase resulted from higher-margin wind projects and improved performance on large fixed-priced contracts. This was partially offset by lower profit margins on the procurement of materials and supplies for construction and international development projects.
SG&A expenses increased compared to fiscal 2007. The increase resulted from supporting the growth of our business, our investment in marketing and business development efforts and an increase in employee profit-sharing compensation. To a lesser extent, we recognized additional SG&A expenses related to our new acquisitions and resolution of certain litigation claims. For fiscal 2007, our SG&A expenses were reduced by $5.7 million as a result of a favorable resolution of an outstanding litigation liability.
Net interest expense increased compared to fiscal 2007. The increase resulted from lower interest income from short-term cash investments, partially offset by lower interest expense on our debt due to lower interest rates.
In the first quarter of fiscal 2007, we elected to retire our senior secured notes and paid off the remaining principal balance of $72.9 million. In connection with this debt retirement, we incurred pre-payment premiums of $3.1 million and expensed the remaining unamortized deferred financing costs of $1.1 million. We reported an aggregate charge of $4.2 million related to early retirement of debt as part of our income from continuing operations.
Income tax expense increased $9.1 million compared to fiscal 2007 primarily due to an increase in pre-tax income. Our effective tax rate was 41.1% and 41.9% for fiscal 2008 and 2007, respectively.
55
Results of Operations by Reportable Segment
Environmental Consulting Services
| |
Fiscal Year Ended | ||||||||||||
|---|---|---|---|---|---|---|---|---|---|---|---|---|---|
| |
|
|
Change | ||||||||||
| |
September 28, 2008 |
September 30, 2007 |
|||||||||||
| |
$ | % | |||||||||||
| |
($ in thousands) |
||||||||||||
Revenue, net of subcontractor costs |
$ | 348,374 | $ | 302,671 | $ | 45,703 | 15.1 | % | |||||
Other contract costs |
(279,433 | ) | (244,902 | ) | (34,531 | ) | (14.1 | ) | |||||
Gross profit |
$ | 68,941 | $ | 57,769 | $ | 11,172 | 19.3 | % | |||||
Gross profit percentage |
19.8 |
% |
19.1 |
% |
|||||||||
Revenue, net of subcontractor costs, grew across all client sectors from organic revenue. In our federal government business, the growth was driven by increased activity on domestic projects for the DoD, DOE and FAA, partially offset by the completion of a large NASA contract in late fiscal 2007. The growth in our commercial business was driven by increased demand for our landfill development, environmental engineering and geotechnical services. In addition, our state and local government business grew primarily as a result of our strategic acquisitions.
The increase in gross profit substantially corresponded to the growth in revenue, net of subcontractor costs. On a percentage basis, gross profit increased slightly from fiscal 2007 due to improved performance on certain large fixed-priced contracts and the completion of the low-margin NASA project in the prior year.
Technical Support Services
| |
Fiscal Year Ended | ||||||||||||
|---|---|---|---|---|---|---|---|---|---|---|---|---|---|
| |
|
|
Change | ||||||||||
| |
September 28, 2008 |
September 27, 2007 |
|||||||||||
| |
$ | % | |||||||||||
| |
($ in thousands) |
||||||||||||
Revenue, net of subcontractor costs |
$ | 279,327 | $ | 178,738 | $ | 100,589 | 56.3 | % | |||||
Other contract costs |
(227,007 | ) | (143,373 | ) | (83,634 | ) | (58.3 | ) | |||||
Gross profit |
$ | 52,320 | $ | 35,365 | $ | 16,955 | 47.9 | % | |||||
Gross profit percentage |
18.7 |
% |
19.8 |
% |
|||||||||
Our TSS segment experienced strong growth in revenue, net of subcontractor costs, which was driven by the international development projects for USAID associated with our ARD acquisition and, to a lesser extent, increased workload with the DoD and EPA.
The increase in gross profit substantially corresponded to the growth in revenue, net of subcontractor costs. However, on a percentage basis, gross profit declined due to the lower profit margin on international development projects.
56
Engineering and Architecture Services
| |
Fiscal Year Ended | ||||||||||||
|---|---|---|---|---|---|---|---|---|---|---|---|---|---|
| |
|
|
Change | ||||||||||
| |
September 28, 2008 |
September 30, 2007 |
|||||||||||
| |
$ | % | |||||||||||
| |
($ in thousands) |
||||||||||||
Revenue, net of subcontractor costs |
$ | 259,393 | $ | 237,500 | $ | 21,893 | 9.2 | % | |||||
Other contract costs |
(209,387 | ) | (187,565 | ) | (21,822 | ) | (11.6 | ) | |||||
Gross profit |
$ | 50,006 | $ | 49,935 | $ | 71 | 0.1 | % | |||||
Gross profit percentage |
19.3 |
% |
21.0 |
% |
|||||||||
Revenue, net of subcontractor costs, grew in fiscal 2008 due primarily to increased workload on our civil infrastructure projects from commercial clients. However, this growth was partially offset by reduced activity on school design and land redevelopment projects caused by the slowdown in the residential housing market.
Gross profit did not grow in proportion to the increase in revenue, net of subcontractor costs, due to the fixed costs that remained in certain business areas such as school design and land redevelopment, which experienced revenue declines due to the slowdown in the housing market.
Remediation and Construction Management
| |
Fiscal Year Ended | ||||||||||||
|---|---|---|---|---|---|---|---|---|---|---|---|---|---|
| |
|
|
Change | ||||||||||
| |
September 28, 2008 |
September 30, 2007 |
|||||||||||
| |
$ | % | |||||||||||
| |
($ in thousands) |
||||||||||||
Revenue, net of subcontractor costs |
$ | 358,451 | $ | 294,006 | $ | 64,445 | 21.9 | % | |||||
Other contract costs |
(275,531 | ) | (236,430 | ) | (39,101 | ) | (16.5 | ) | |||||
Gross profit |
$ | 82,920 | $ | 57,576 | $ | 25,344 | 44.0 | % | |||||
Gross profit percentage |
23.1 |
% |
19.6 |
% |
|||||||||
The growth in revenue, net of subcontractor costs, was driven by increased demand for our wind and other alternative energy services, as well as wastewater treatment and telecommunications services, for our commercial clients. Our state and local government business also experienced growth due to a strategic acquisition in the second half of fiscal 2007. This increase was partially offset by the wind-down of several large domestic projects for federal government clients such as the DoD, DOE and EPA, and the conclusion of a large fiber-to-the-premises project in the second quarter of fiscal 2008.
Gross profit grew 44.0% in fiscal 2008 due to the increase in revenue, net of subcontractor costs, favorable claim settlements, improvements in contract execution and containment of overhead costs, and recognition of a gain related to project equipment disposals following the close-out of certain contracts. Further, the increase in gross profit reflected our higher-margin wind projects and a large telecommunications infrastructure project, as well as improved performance on other large fixed-priced contracts. The overall increase was partially offset by lower profit margins on the procurement of materials and supplies for certain construction projects.
57
FINANCIAL CONDITION, LIQUIDITY AND CAPITAL RESOURCES
Capital Requirements. Our capital requirements are to fund working capital needs, capital expenditures, and debt services requirements, as well as to fund acquisitions. It is anticipated that operating cash flow, together with available borrowings under the credit agreement described below, will be sufficient to meet our capital requirements for the next 12 months.
Working Capital. Our working capital decreased $8.5 million, or 3.7%, compared to the 2008 fiscal year-end. The decrease resulted primarily from the use of cash to pay for business acquisitions and pay down our long-term debt. Our cash and cash equivalents balance of $89.2 million increased $38.3 million, or 75.2%, compared to the 2008 fiscal year-end.
Operating Activities. For fiscal 2009, our net cash provided by operating activities was $198.2 million, an increase of $129.9 million, or 189.9%, compared to fiscal 2008. The increase was driven primarily by substantial cash collections on certain large commercial fixed-price contracts, an IRS tax settlement refund and higher net income. The overall increase was partially offset by large payments related to subcontractor accruals, and decreased liability related to advance payments received on contract work. Further, accrued employee compensation and other liabilities were reduced due to payments made prior to fiscal year-end.
Investing Activities. For fiscal 2009, our net cash used in investing activities was $133.3 million, an increase of $43.5 million, or 48.4%, compared to fiscal 2008. In fiscal 2009, we used more cash to pay for business acquisitions, particularly Wardrop. Further, our capital expenditures were $19.8 million, an increase of $2.0 million, or 11.5%, compared to fiscal 2008. New equipment was purchased to replace obsolete equipment and satisfy requirements for project execution.
Financing Activities. For fiscal 2009, our net cash used in financing activities was $28.1 million, an increase of $23.7 million, or 540.2%, compared to fiscal 2008. The increase resulted from debt repayment, partially offset by cash proceeds from our issuance of common stock.
Debt Financing. In March 2007, we entered into an Amended and Restated Credit Agreement. Under the credit agreement, our revolving credit facility ("Facility") was increased from $150.0 million to $300.0 million, and the term of the agreement was extended for five years through March 30, 2012. As part of the Facility, we may request financial letters of credit up to an aggregate sum of $50.0 million and standby letters of credit up to the full amount of the Facility. Other than the increased capacity under the Facility and improved pricing rate structure, the terms and conditions relating to the Facility are substantially similar to those of the prior facility. In May 2008 and January 2009, we entered into amendments to the credit agreement solely to provide additional flexibility and to clarify certain administrative matters with respect to potential future acquisitions. There was no change to the overall size of the Facility. As of September 27, 2009, we had no outstanding borrowings, $13.0 million in standby letters of credit and $287.0 million in availability under the Facility.
The credit agreement requires us to comply with various financial and operating covenants. Specifically, (i) the maximum consolidated leverage ratio (defined as the ratio of funded debt to rolling four-quarter adjusted earnings before interest, tax, depreciation and amortization ("EBITDA") is 2.50x for each quarter, and (ii) the minimum fixed charge coverage ratio (defined as the ratio of rolling four-quarter EBITDA minus capital expenditures to interest expense plus taxes and principal payments) is 1.25x for each quarter. As of September 27, 2009, our consolidated leverage ratio was 0.20x, and our fixed charge coverage ratio was 2.34x. Further, the credit agreement contains other restrictions, including but not limited to, the creation of liens and the payment of dividends on our capital stock (other than stock dividends). Borrowings under the credit agreement are collateralized by our accounts receivable, the stock of our significant subsidiaries and our cash, deposit accounts, investment property and financial assets. As of September 27, 2009, we met all compliance requirements, and we expect to be in compliance over the next 12 months.
58
Inflation. We believe our operations have not been, and, in the foreseeable future, are not expected to be, materially adversely affected by inflation or changing prices due to the average duration of our projects and our ability to negotiate prices as contracts end and new contracts begin. However, the current weak general economic conditions may impact our client base, our clients' creditworthiness and our ability to collect cash to meet our operating needs.
Tax Claims. In fiscal 2009, we received an IRS tax settlement refund of approximately $40 million. We remain in the appeals process with the IRS for fiscal years 2002 through 2004 related to R&E Credits and our tax accounting method for revenue recognition. We are also under examination by the FTB for fiscal years 2001 through 2003 related to R&E Credits. Management believes that it is reasonably possible we will reach a resolution of these audits within the next 12 months. We have completed studies and analyses for the tax years subsequent to fiscal 2004 and are in the process of filing amended returns to claim federal and state R&E Credits for certain years. There is a high probability that the claims will be examined by taxing authorities. If the resolution of these pending and anticipated examinations is more favorable than expected, the change in unrecognized tax benefits could be significant. However, if the resolution is less favorable than expected, there may be a material increase in our income tax expense in the period in which the determination is made.
Contractual Obligations. The following sets forth our contractual obligations as of September 27, 2009:
| |
Total | Year 1 | Years 2 - 3 | Years 4 - 5 | Beyond | ||||||||||||
|---|---|---|---|---|---|---|---|---|---|---|---|---|---|---|---|---|---|
| |
(in thousands) |
||||||||||||||||
Debt: |
|||||||||||||||||
Other debt(1) |
$ | 7,844 | $ | 3,198 | $ | 4,606 | $ | 40 | $ | — | |||||||
Interest on debt obligations(2) |
479 | 362 | 117 | — | — | ||||||||||||
Capital leases(3) |
3,007 | 1,122 | 1,533 | 352 | — | ||||||||||||
Operating leases |
174,896 | 47,879 | 71,394 | 39,468 | 16,155 | ||||||||||||
Deferred compensation liability |
6,247 | — | — | — | 6,247 | ||||||||||||
Unrecognized tax benefits(4) |
10,245 | — | — | — | 10,245 | ||||||||||||
Total |
$ | 202,718 | $ | 52,561 | $ | 77,650 | $ | 39,860 | $ | 32,647 | |||||||
- (1)
- Includes short-term portion.
- (2)
- Interest related to credit facility is based on a weighted average interest rate as of September 27, 2009, borrowings that are presently outstanding and the timing of payments indicated in the above table.
- (3)
- Includes short-term portion and imputed interest.
- (4)
- Represents liabilities for unrecognized tax benefits related to uncertain tax positions. We are unable to reasonably predict the timing of tax settlements, as tax audits can involve complex issues and the resolution of those issues may span multiple years, particularly if subject to negotiation or litigation. For more information, see Note 6 (Income Taxes) of the "Notes to Consolidated Financial Statements" included in Item 8.
Our consolidated financial statements have been prepared in accordance with U.S. GAAP. The preparation of these financial statements requires us to make assumptions and estimates about future events and to apply judgments that affect the reported amounts of assets, liabilities, revenue, expenses and related disclosures. We based our assumptions, estimates and judgments on historical experience, current trends and other factors that management believed to be relevant at the time our consolidated financial statements were prepared. On a regular basis, management reviews the accounting policies, assumptions, estimates and judgments to ensure that our financial statements are presented in accordance with U.S. GAAP. However, because future events and their effects cannot be determined
59
with certainty, actual results may differ from our assumptions and estimates, and such differences may be material.
Our significant accounting policies are discussed in the "Notes to Consolidated Financial Statements" included in Item 8. Highlighted below are the accounting policies that management considers significant to understanding the operations of our business.
Revenue Recognition and Contract Costs
We recognize revenue when persuasive evidence of an arrangement exists, services have been rendered, the contract price is fixed or determinable, and collectibility is probable. We have a standard internal process that we use to determine whether all required criteria for revenue recognition have been met. We recognize revenue for most of our contracts using the percentage-of-completion method based on contract costs incurred compared to total estimated contract costs. This method of revenue recognition requires us to prepare estimates of cost to complete contracts in progress. In making such estimates, judgments are required to evaluate contingencies such as potential variances in schedule, the cost of materials and labor productivity, the impact of change orders, liability claims, contract disputes, and achievement of contractual performance standards. Changes in total estimated contract cost and losses, if any, are recognized in full in the period in which they are determined.
In the ordinary course of business, and at a minimum on a quarterly basis, we prepare updated estimates of our total forecasted contract revenue, costs and profit or loss. The cumulative effect of revisions in estimates of the total forecasted revenue and costs during the course of the work, including unapproved change orders and claims, is reflected in the accounting period in which the facts that caused the revision become evident. The financial impact of these revisions to any one contract is a function of both the amount of the revision and the percentage-of-completion of the contract.
Our revenues are derived primarily from fee-based professional and technical services under three major types of contracts: fixed-price, time-and-materials and cost-plus. Within each of the major contract types are variations on the basic contract mechanism. Fixed-price contracts generally present us with the highest level of financial and performance risk, but often also provide the highest potential financial returns. Time-and-materials contracts generally represent the time spent by our professional staff at stated or negotiated billing rates. Cost-plus contracts present us with lower risk, but generally provide lower returns and often include more onerous terms and conditions.
For long-term contracts related to performance of construction-type and certain production-type contracts, we apply the percentage-of-completion method. For time-and-material contracts, revenue is recognized to the extent of billable rates multiplied by hours delivered plus material and other reimbursable costs incurred. Revenue is recognized at a rate per unit as the units are delivered, or by other methods to measure services provided. Revenue from other long-term fixed-price contracts is recognized ratably over the contract period or by other appropriate methods to measure services provided. Contract costs are expensed as incurred. Revenue for cost reimbursable contracts is recorded as costs are incurred, including an estimated share of the applicable contractual fees earned. For certain performance-based fees under cost reimbursable contracts, we recognize the relevant portion of the expected fee to be awarded by the client at the time such fee can be reasonably estimated, based on factors such as our prior award experience and communications with the client regarding performance. Within the overall context of the three major types of contracts discussed above, certain of our contracts are service contracts (i.e., providing operations and maintenance services and a variety of technical assistance services). Our service contracts are accounted for on the proportional performance method, under which revenue is recognized in proportion to the number of service activities performed, in proportion to the direct costs of performing the service activities, or evenly across the period of performance depending upon the nature of the services provided.
60
In the course of providing our services, we routinely subcontract services and, under certain USAID programs, issue grants. Generally, these subcontractor costs and grants are passed through to our clients and, in accordance with industry practice and U.S. GAAP, are included in our revenue when it is our responsibility to procure or manage these activities under a contract. The grants are reported as part of our subcontractor costs on our consolidated statement of income. Because subcontractor services can change significantly from project to project and period to period, changes in revenue may not be indicative of our business trends. Accordingly, we also report revenue, net of subcontractor costs.
Once contract performance is underway, we may experience changes in conditions, client requirements, specifications, designs, materials and expectations regarding the period of performance. Such changes are "change orders" and may be initiated by us or by our clients. Costs related to change orders are recognized when they are incurred. A change order is included in total estimated contract revenue when it is probable that the change order will result in a bona fide addition to contract value and can be reliably estimated.
Claims are amounts in excess of the agreed contract price that we seek to collect from our clients or others for delays, errors in specifications and designs, contract terminations, change orders in dispute or unapproved as to both scope and price or other causes of unanticipated additional costs. Claim costs are recognized when it is probable that the claim will result in a bona fide addition to contract value that can be reliably estimated. No profit is recognized on a claim until final settlement occurs. This can lead to a situation in which costs are recognized in one period and revenues are recognized in a subsequent period when a client agreement is obtained or a claims resolution occurs.
We have contracts with the U.S. government that contain provisions requiring compliance with FAR and CAS. These regulations are generally applicable to all of our U.S. federal government contracts and are partially or fully incorporated in many state and local government agency contracts. They limit the recovery of certain specified indirect costs on contracts subject to FAR. Cost-plus contracts covered by FAR and certain state and local government agencies provide for upward or downward adjustments if actual recoverable costs differ from the estimate billed under forward pricing arrangements. Most of our U.S. federal government contracts are subject to termination at the convenience of the client. Contracts typically provide for reimbursement of costs incurred and payment of fees earned through the date of such termination. U.S. federal government contracts are subject to FAR, and some state and local government agencies require audits, which are performed primarily by the DCAA. The DCAA audits our overhead rates, cost proposals, incurred government contract costs, and internal control systems. During the course of its audits, the DCAA may disallow certain incurred costs if it determines that we have improperly accounted for such costs in a manner inconsistent with the requirements of FAR and CAS. Historically, we have not had any material disallowed costs as a result of such audits. However, we can provide no assurance that DCAA audits will not result in material disallowances of incurred costs in the future.
Allowance for Uncollectible Accounts Receivable
We record an allowance against our accounts receivable for those amounts that, in the future, may become uncollectible. We determine our estimated allowance for uncollectible amounts based on management's evaluation of the contracts involved and the financial condition of our clients. We regularly evaluate the adequacy of the allowance for doubtful accounts by considering the following factors:
- •
- Type of client—government agency or commercial sector;
- •
- Trends in actual and forecasted credit quality of the client, including delinquency and payment history;
61
- •
- General economic and particular industry conditions that may affect a client's ability to pay; and
- •
- Contract performance and our change order/claim analysis.
Insurance Matters, Litigation and Contingencies
In the normal course of business, we are subject to certain contractual guarantees and litigation. Generally, such guarantees relate to project schedules and performance. Most of the litigation involves us as a defendant in contractual disagreements, workers' compensation, personal injury and other similar lawsuits. We maintain insurance coverage for various aspects of our business and operations. However, we have elected to retain a portion of losses that may occur through the use of various deductibles, limits and retentions under our insurance programs. This practice may subject us to some future liability for which we are only partially insured or are completely uninsured.
We record in our consolidated balance sheets amounts representing our estimated liability for claims and litigation. We utilize actuarial analyses to assist in determining the level of reserves to establish for both claims that are known and have been asserted against us, as well as for claims that are believed to have been incurred based on actuarial analysis but have not yet been reported to our claims administrators as of the balance sheet date. We include any adjustments to such insurance reserves in our consolidated results of operations. Except as described in Note 14 of the "Notes to Consolidated Financial Statements" included in Item 8, we have not been affected by any litigation or other contingencies that have had, or are currently anticipated to have, a material impact on our results of operations or financial position. As additional information about current or future litigation or other contingencies becomes available, management will assess whether such information warrants the recording of additional expenses relating to those contingencies. Such additional expenses could potentially have a material impact on our results of operations and financial position.
We performed our annual testing of goodwill for impairment as of June 29, 2009 (i.e., the first day of our fiscal fourth quarter) which indicated that we had no impairment of goodwill. In addition to our annual test, we regularly evaluate whether events and circumstances have occurred that may indicate a potential impairment of goodwill. The process of testing goodwill for impairment involves the determination of the fair value of our reporting units, which for us are the components one level below our reportable segments. This process requires us to make significant judgments and estimates, including assumptions about our strategic plans with regard to our operations as well as the interpretation of current economic indicators and market valuations. To the extent economic conditions that would impact the future operations of our reporting units change, our goodwill may be deemed to be impaired and an impairment charge could result in a material adverse effect on our financial position or results of operations.
We utilize two methods to determine the fair value of our reporting units: (i) the Income Approach and (ii) the Market Approach. While each of these approaches is initially considered in the valuation of the business enterprises, the nature and characteristics of the reporting units indicate which approach, or approaches, is most applicable. The Income Approach utilizes the discounted cash flow method, which focuses on the expected cash flow of the reporting unit. In applying this approach, the cash flow available for distribution is calculated for a finite period of years. Cash flow available for distribution is defined, for purposes of this analysis, as the amount of cash that could be distributed as a dividend without impairing the future profitability or operations of the reporting unit. The cash flow available for distribution and the terminal value (the value of the reporting unit at the end of the estimation period) are then discounted to present value to derive an indication of value of the business enterprise. The Market Approach is comprised of the guideline company and the similar transactions methods. The guideline company method focuses on comparing the reporting unit to select reasonably
62
similar (or "guideline") publicly traded companies. Under this method, valuation multiples are (i) derived from the operating data of selected guideline companies; (ii) evaluated and adjusted based on the strengths and weaknesses of the reporting units relative to the selected guideline companies; and (iii) applied to the operating data of the reporting unit to arrive at an indication of value. In the similar transactions method, consideration is given to prices paid in recent transactions that have occurred in the reporting unit's industry or in related industries. For our annual impairment tests, we weighted the Income Approach and the Market Approach at 70% and 30%, respectively. The Income Approach was given a higher weight because it has the most direct correlation to the specific economics of the reporting unit, as compared to the Market Approach, which is based on multiples of broad-based (i.e., less comparable) companies.
Our stock-based compensation plans include stock options, restricted stock, and an employee stock purchase plan for our eligible employees and outside directors. Stock-based compensation cost is measured at the grant date based on the fair value of the award and is recognized as expense over the requisite service period. Determining the fair value of stock-based awards at the grant date requires management to make assumptions and apply judgment to determine the fair value of our awards. These assumptions and judgments include estimating the future volatility of our stock price, future employee turnover rates, future stock option exercise behaviors, and for performance based awards, the achievement of company performance goals. If actual results differ significantly from these estimates, stock-based compensation expense and our results of operations could be impacted.
We file a consolidated U.S. federal income tax return and combined California franchise tax return. In addition, we file other returns that are required in the states and jurisdictions in which we do business. We account for certain income and expense items differently for financial reporting and income tax purposes. Deferred tax assets and liabilities are computed for the differences between the financial statement and tax bases of assets and liabilities that will result in taxable or deductible amounts in the future based on enacted tax laws and rates applicable to the periods in which the differences are expected to reverse. In determining the need for a valuation allowance, management reviews both positive and negative evidence, including current and historical results of operations, future income projections, and potential tax planning strategies.
On October 1, 2007, we adopted authoritative guidance on accounting for uncertainty in income taxes and did not record any cumulative effect adjustment to retained earnings as a result of this adoption. Under this guidance, we may recognize the tax benefit from an uncertain tax position only if it is more likely than not that the tax position will be sustained on examination by the taxing authorities based on the technical merits of the position. The tax benefits recognized in the financial statements from such a position should be measured based on the largest benefit that has a greater than 50.0% likelihood of being realized upon ultimate settlement. This guidance also provides guidance on de-recognition, classification, interest and penalties on income taxes, accounting in interim periods and disclosure requirements for uncertain tax positions.
RECENTLY ISSUED FINANCIAL ACCOUNTING STANDARDS
In June 2009, the Financial Accounting Standard Board ("FASB") issued authoritative guidance that establishes the FASB Accounting Standards Codification ("Codification" or "ASC"), as the single source of authoritative United States accounting and reporting standards applicable for all non-government entities, with the exception of guidance promulgated by the SEC and its staff. The Codification, which changes the referencing of financial standards, is effective for interim or annual financial periods ending after September 15, 2009. We implemented the guidance effective in fiscal
63
2009, and all references made to U.S. GAAP use the new Codification numbering system prescribed by the FASB.
In September 2006, the FASB issued authoritative guidance on fair value measurements that defines fair value, establishes a framework for measuring fair value and expands disclosures about fair value measurements. This guidance was effective for financial statements issued for fiscal years beginning after November 15, 2007, and interim periods within those fiscal years except for all nonrecurring fair value measurements of nonfinancial assets and liabilities, which is effective for financial statements issued for fiscal years beginning after November 15, 2008. In October 2008, the FASB clarified the application of its authoritative guidance, related to a market that is not active and provided an example to illustrate key considerations in determining the fair value of a financial asset when the market of that financial asset is not active. Revisions resulting from a change in valuation technique or its application should be accounted for as a change in accounting estimate, and any effects on fair-value measurement would be recognized in the period of adoption. Our adoption of this guidance on September 29, 2008 was limited to financial assets and liabilities and had no impact on our consolidated financial statements in fiscal 2009. We are currently evaluating the anticipated effect of this statement on our non-financial assets and non-financial liabilities.
In February 2007, the FASB issued authoritative guidance that provides companies with an option to measure, at specified election dates, many financial instruments and certain other items at fair value that are not currently measured at fair value. A company that adopts this guidance will report unrealized gains and losses on items for which the fair value option has been elected in earnings at each subsequent reporting date. This guidance also establishes presentation and disclosure requirements designed to facilitate comparisons between entities that choose different measurement attributes for similar types of assets and liabilities. This guidance became effective for us at the beginning of our fiscal year 2009. We did not elect the fair value option for any financial assets or liabilities during the first quarter of fiscal 2009.
In December 2007, the FASB issued authoritative guidance that establishes the principles and requirements for how an acquirer (i) recognizes and measures in its financial statements the identifiable assets acquired, the liabilities assumed, and any noncontrolling interest in the acquiree; (ii) recognizes and measures the goodwill acquired in the business combination or a gain from a bargain purchase; and (iii) determines what information to disclose to enable users of the financial statements to evaluate the nature and financial effects of the business combination. This guidance makes significant changes to existing accounting practices for acquisitions, including the requirement to expense transaction costs and to reflect the fair value of contingent purchase price adjustments at the date of acquisition. In April 2009, the FASB issued an amendment to amend and clarify the guidance on business combinations to require that an acquirer recognize at fair value, at the acquisition date, an asset acquired or a liability assumed in a business combination that arises from a contingency if the acquisition-date fair value of that asset or liability can be determined during the measurement period. If the acquisition-date fair value of such an asset acquired or liability assumed cannot be determined, the acquirer should apply the provisions of the guidance on business combinations to determine whether the contingency should be recognized at the acquisition date or after it. The guidance is effective for business combinations for which the acquisition date is after the beginning of the first annual reporting period beginning after December 15, 2008, which is effective for us in fiscal 2010. For any acquisitions completed after fiscal 2009, we expect the adoption of the guidance will have an impact on our consolidated financial statements; however, the magnitude of the impact will depend upon the nature, terms and size of the acquisitions we consummate.
In December 2007, the FASB issued authoritative guidance that establishes accounting and reporting standards that require (i) noncontrolling interests to be reported as a component of equity; (ii) changes in a parent's ownership interest while the parent retains its controlling interest to be accounted for as equity transactions; and (iii) any retained noncontrolling equity investment upon the
64
deconsolidation of a subsidiary to be initially measured at fair value. We do not currently have any less than wholly-owned consolidated subsidiaries. The guidance is to be applied prospectively at the beginning of the first annual reporting period on or after December 15, 2008. We will implement the new standard effective in fiscal 2010. We do not believe that the adoption of the guidance will have a material effect on our consolidated financial statements.
In December 2007, the Emerging Issues Task Force ("EITF") issued authoritative guidance that prescribes the accounting for collaborations. It requires certain transactions between collaborators to be recorded in the financial statements on either a gross or net basis when certain characteristics exist in the collaboration relationship. This guidance is effective in fiscal 2010 for all of our collaborations. We do not believe that the adoption of the guidance will have a material effect on our consolidated financial statements.
In April 2008, the FASB issued authoritative guidance that revises the factors that should be considered in developing renewal or extension assumptions in determining the useful life of a recognized intangible asset under the guidance. This guidance will be effective for fiscal years beginning after December 15, 2008. We will implement the guidance effective in fiscal 2010. We are currently assessing the effect of the guidance on our consolidated financial statements.
In June 2008, the FASB issued authoritative guidance that states that unvested share-based payment awards that contain non-forfeitable rights to dividends or dividend equivalents (whether paid or unpaid) are participating securities and must be included in the computation of earnings per share pursuant to the two-class method. The guidance, which is applied retrospectively, is effective for us in fiscal 2010. We do not believe that the adoption of the guidance will have a material effect on our consolidated financial statements.
In May 2009, the FASB issued authoritative guidance that was effective June 15, 2009 and establishes general standards of accounting for and disclosure of events that occur after the balance sheet date but before financial statements are issued or are available to be issued. This guidance is currently effective for us and the adoption of the guidance did not have a material effect on our consolidated financial statements. We evaluated subsequent events through November 13, 2009, the date our financial statements were issued.
Item 7A. Quantitative and Qualitative Disclosures About Market Risk
We are exposed to interest rate risk under our credit agreement. We may borrow on our Facility, at our option, at either (a) a base rate (the greater of the U.S. federal funds rate plus 0.50% per annum or the bank's reference rate) plus a margin which ranges from 0.0% to 1.25% per annum; or (b) a Eurodollar rate plus a margin that ranges from 1.0% to 2.25% per annum. Borrowings at the base rate have no designated term and may be repaid without penalty any time prior to the Facility's maturity date. Borrowings at a Eurodollar rate have a term no less than 30 days and no greater than 90 days. Typically, at the end of such term, such borrowings may be rolled over at our discretion into either a borrowing at the base rate or a borrowing at a Eurodollar rate with similar terms, not to exceed the maturity date of the Facility. The Facility matures on March 30, 2012, or earlier at our discretion upon payment in full of loans and other obligations. As of September 27, 2009, we had no borrowings outstanding under the Facility and utilized no derivative financial instruments that would expose us to significant market risk.
65
Item 8. Financial Statements and Supplementary Data
INDEX TO FINANCIAL STATEMENTS AND FINANCIAL STATEMENT SCHEDULE
66
REPORT OF INDEPENDENT REGISTERED PUBLIC ACCOUNTING FIRM
To the Stockholders of Tetra Tech, Inc.:
In our opinion, the accompanying consolidated balance sheets and the related consolidated statements of income, of stockholders' equity and of cash flows present fairly, in all material respects, the financial position of Tetra Tech, Inc. and its subsidiaries as of September 27, 2009 and September 28, 2008, and the results of their operations and their cash flows for each of the three years in the period ended September 27, 2009 in conformity with accounting principles generally accepted in the United States of America. In addition, in our opinion, the financial statement schedule listed in the accompanying index presents fairly, in all material respects, the information set forth therein when read in conjunction with the related consolidated financial statements. Also in our opinion, the Company maintained, in all material respects, effective internal control over financial reporting as of September 27, 2009, based on criteria established in Internal Control—Integrated Framework issued by the Committee of Sponsoring Organizations of the Treadway Commission (COSO). The Company's management is responsible for these financial statements and financial statement schedule, for maintaining effective internal control over financial reporting and for its assessment of the effectiveness of internal control over financial reporting, included in Management's Report on Internal Control over Financial Reporting, appearing under Item 9A of this Form 10-K. Our responsibility is to express opinions on these financial statements, on the financial statement schedule, and on the Company's internal control over financial reporting based on our integrated audits. We conducted our audits in accordance with the standards of the Public Company Accounting Oversight Board (United States). Those standards require that we plan and perform the audits to obtain reasonable assurance about whether the financial statements are free of material misstatement and whether effective internal control over financial reporting was maintained in all material respects. Our audits of the financial statements included examining, on a test basis, evidence supporting the amounts and disclosures in the financial statements, assessing the accounting principles used and significant estimates made by management, and evaluating the overall financial statement presentation. Our audit of internal control over financial reporting included obtaining an understanding of internal control over financial reporting, assessing the risk that a material weakness exists, and testing and evaluating the design and operating effectiveness of internal control based on the assessed risk. Our audits also included performing such other procedures as we considered necessary in the circumstances. We believe that our audits provide a reasonable basis for our opinions.
As discussed in Note 2 to the consolidated financial statements, the Company changed its method of accounting for uncertain tax positions as of October 1, 2007.
A company's internal control over financial reporting is a process designed to provide reasonable assurance regarding the reliability of financial reporting and the preparation of financial statements for external purposes in accordance with generally accepted accounting principles. A company's internal control over financial reporting includes those policies and procedures that (i) pertain to the maintenance of records that, in reasonable detail, accurately and fairly reflect the transactions and dispositions of the assets of the company; (ii) provide reasonable assurance that transactions are recorded as necessary to permit preparation of financial statements in accordance with generally accepted accounting principles, and that receipts and expenditures of the company are being made only in accordance with authorizations of management and directors of the company; and (iii) provide reasonable assurance regarding prevention or timely detection of unauthorized acquisition, use, or disposition of the company's assets that could have a material effect on the financial statements.
Because of its inherent limitations, internal control over financial reporting may not prevent or detect misstatements. Also, projections of any evaluation of effectiveness to future periods are subject to the risk that controls may become inadequate because of changes in conditions, or that the degree of compliance with the policies or procedures may deteriorate.
/s/ PRICEWATERHOUSECOOPERS LLP
Los Angeles,
California
November 13, 2009
67
TETRA TECH, INC.
Consolidated Balance Sheets
(in thousands, except par value)
| |
September 27, 2009 |
September 28, 2008 |
|||||||
|---|---|---|---|---|---|---|---|---|---|
ASSETS |
|||||||||
CURRENT ASSETS: |
|||||||||
Cash and cash equivalents |
$ | 89,185 | $ | 50,902 | |||||
Accounts receivable—net |
506,316 | 625,786 | |||||||
Prepaid expenses and other current assets |
55,167 | 36,774 | |||||||
Income taxes receivable |
5,222 | 4,275 | |||||||
Deferred income taxes |
— | 2,316 | |||||||
Total current assets |
655,890 | 720,053 | |||||||
PROPERTY AND EQUIPMENT: |
|||||||||
Land and buildings |
10,555 | 7,588 | |||||||
Equipment, furniture and fixtures |
126,249 | 112,780 | |||||||
Leasehold improvements |
13,740 | 10,804 | |||||||
Total |
150,544 | 131,172 | |||||||
Accumulated depreciation and amortization |
(79,616 | ) | (69,784 | ) | |||||
PROPERTY AND EQUIPMENT—NET |
70,928 | 61,388 | |||||||
DEFERRED INCOME TAXES |
— |
6,498 |
|||||||
INCOME TAXES RECEIVABLE |
— | 14,953 | |||||||
GOODWILL |
319,685 | 221,545 | |||||||
INTANGIBLE ASSETS—NET |
33,769 | 14,609 | |||||||
OTHER ASSETS |
17,633 | 17,499 | |||||||
TOTAL ASSETS |
$ | 1,097,905 | $ | 1,056,545 | |||||
LIABILITIES AND STOCKHOLDERS' EQUITY |
|||||||||
CURRENT LIABILITIES: |
|||||||||
Accounts payable |
$ | 149,352 | $ | 223,304 | |||||
Accrued compensation |
88,793 | 101,699 | |||||||
Billings in excess of costs on uncompleted contracts |
105,162 | 100,336 | |||||||
Deferred income taxes |
9,645 | — | |||||||
Current portion of long-term obligations |
4,320 | 3,926 | |||||||
Other current liabilities |
74,964 | 58,634 | |||||||
Total current liabilities |
432,236 | 487,899 | |||||||
DEFFERED INCOME TAXES |
4,615 |
— |
|||||||
LONG-TERM OBLIGATIONS |
6,530 | 53,292 | |||||||
OTHER LONG-TERM LIABILITIES |
8,046 | 3,840 | |||||||
COMMITMENTS AND CONTINGENCIES |
|||||||||
STOCKHOLDERS' EQUITY: |
|||||||||
Preferred stock—Authorized, 2,000 shares of $0.01 par value; no shares issued and outstanding as of September 27, 2009 and September 28, 2008 |
— | — | |||||||
Common stock—Authorized, 150,000 shares of $0.01 par value; issued and outstanding, 61,257 and 59,875 shares as of September 27, 2009 and September 28, 2008, respectively |
613 | 599 | |||||||
Additional paid-in capital |
350,571 | 314,860 | |||||||
Accumulated other comprehensive income |
12,226 | 15 | |||||||
Retained earnings |
283,068 | 196,040 | |||||||
TOTAL STOCKHOLDERS' EQUITY |
646,478 | 511,514 | |||||||
TOTAL LIABILITIES AND STOCKHOLDERS' EQUITY |
$ |
1,097,905 |
$ |
1,056,545 |
|||||
See accompanying Notes to Consolidated Financial Statements.
68
TETRA TECH, INC.
Consolidated Statements of Income
(in thousands, except per share data)
| |
Fiscal Year Ended | ||||||||||
|---|---|---|---|---|---|---|---|---|---|---|---|
| |
September 27, 2009 |
September 28, 2008 |
September 30, 2007 |
||||||||
Revenue |
$ | 2,287,484 | $ | 2,145,254 | $ | 1,553,888 | |||||
Subcontractor costs |
(901,347 | ) | (899,709 | ) | (540,973 | ) | |||||
Revenue, net of subcontractor costs |
1,386,137 | 1,245,545 | 1,012,915 | ||||||||
Other contract costs |
(1,108,512 | ) | (991,358 | ) | (812,270 | ) | |||||
Gross profit |
277,625 | 254,187 | 200,645 | ||||||||
Selling, general and administrative expenses |
(155,736 | ) | (147,787 | ) | (114,348 | ) | |||||
Income from operations |
121,889 | 106,400 | 86,297 | ||||||||
Interest income |
554 | 2,029 | 2,984 | ||||||||
Interest expense |
(3,238 | ) | (5,016 | ) | (5,274 | ) | |||||
Loss on retirement of debt |
— | — | (4,226 | ) | |||||||
Income from continuing operations before income tax expense |
119,205 | 103,413 | 79,781 | ||||||||
Income tax expense |
(32,177 | ) | (42,507 | ) | (33,437 | ) | |||||
Income from continuing operations |
87,028 | 60,906 | 46,344 | ||||||||
Income from discontinued operation, net of tax |
— | — | 9 | ||||||||
Net income |
$ | 87,028 | $ | 60,906 | $ | 46,353 | |||||
Earnings per share: |
|||||||||||
Basic |
$ | 1.45 | $ | 1.04 | $ | 0.80 | |||||
Diluted |
$ | 1.43 | $ | 1.02 | $ | 0.79 | |||||
Weighted-average common shares outstanding: |
|||||||||||
Basic |
60,135 | 58,813 | 57,948 | ||||||||
Diluted |
60,994 | 59,632 | 58,553 | ||||||||
See accompanying Notes to Consolidated Financial Statements.
69
TETRA TECH, INC.
Consolidated Statements of Stockholders' Equity
Fiscal Years Ended September 30, 2007, September 28, 2008 and September 27, 2009
(in
thousands)
| |
Common Stock | |
Accumulated Other Comprehensive Income (Loss) |
|
|
|||||||||||||||
|---|---|---|---|---|---|---|---|---|---|---|---|---|---|---|---|---|---|---|---|---|
| |
Additional Paid-in Capital |
Retained Earnings |
|
|||||||||||||||||
| |
Shares | Amount | Total | |||||||||||||||||
BALANCE AS OF OCTOBER 1, 2006 |
57,676 | $ | 577 | $ | 265,444 | $ | 1 | $ | 88,781 | $ | 354,803 | |||||||||
Comprehensive income: |
||||||||||||||||||||
Net income |
46,353 | 46,353 | ||||||||||||||||||
Foreign currency translation adjustment |
(38 | ) | (38 | ) | ||||||||||||||||
Comprehensive income |
46,315 | |||||||||||||||||||
Stock-based compensation |
5,763 | 5,763 | ||||||||||||||||||
Stock options exercised |
711 | 7 | 7,546 | 7,553 | ||||||||||||||||
Tax benefit for stock options |
1,269 | 1,269 | ||||||||||||||||||
BALANCE AS OF SEPTEMBER 30, 2007 |
58,387 | 584 | 280,022 | (37 | ) | 135,134 | 415,703 | |||||||||||||
Comprehensive income: |
||||||||||||||||||||
Net income |
60,906 | 60,906 | ||||||||||||||||||
Foreign currency translation adjustment |
52 | 52 | ||||||||||||||||||
Comprehensive income |
60,958 | |||||||||||||||||||
Stock-based compensation |
8,296 | 8,296 | ||||||||||||||||||
Stock options exercised |
1,342 | 14 | 20,485 | 20,499 | ||||||||||||||||
Shares issued for Employee Stock Purchase Plan |
146 | 1 | 2,625 | 2,626 | ||||||||||||||||
Tax benefit for stock options |
3,432 | 3,432 | ||||||||||||||||||
BALANCE AS OF SEPTEMBER 28, 2008 |
59,875 | 599 | 314,860 | 15 | 196,040 | 511,514 | ||||||||||||||
Comprehensive income: |
||||||||||||||||||||
Net income |
87,028 | 87,028 | ||||||||||||||||||
Foreign currency translation adjustment |
12,211 | 12,211 | ||||||||||||||||||
Comprehensive income |
99,239 | |||||||||||||||||||
Stock-based compensation |
9,392 | 9,392 | ||||||||||||||||||
Stock options exercised |
1,219 | 12 | 19,824 | 19,836 | ||||||||||||||||
Shares issued for Employee Stock Purchase Plan |
163 | 2 | 3,338 | 3,340 | ||||||||||||||||
Tax benefit for stock options |
3,157 | 3,157 | ||||||||||||||||||
BALANCE AS OF SEPTEMBER 27, 2009 |
61,257 | $ | 613 | $ | 350,571 | $ | 12,226 | $ | 283,068 | $ | 646,478 | |||||||||
See accompanying Notes to Consolidated Financial Statements.
70
TETRA TECH, INC.
Consolidated Statements of Cash Flows
(in thousands)
| |
Fiscal Year Ended | |||||||||||
|---|---|---|---|---|---|---|---|---|---|---|---|---|
| |
September 27, 2009 |
September 28, 2008 |
September 30, 2007 |
|||||||||
CASH FLOWS FROM OPERATING ACTIVITIES: |
||||||||||||
Net income |
$ |
87,028 |
$ |
60,906 |
$ |
46,353 |
||||||
Adjustments to reconcile net income to net cash provided by operating activities: |
||||||||||||
Depreciation and amortization |
27,256 | 18,639 | 13,723 | |||||||||
Stock-based compensation |
9,392 | 8,296 | 5,763 | |||||||||
Excess tax benefits from stock-based compensation |
(2,025 | ) | (1,663 | ) | (491 | ) | ||||||
Deferred income taxes |
(3,772 | ) | 10,662 | (1,785 | ) | |||||||
Write-off of unamortized debt financing costs |
— | — | 1,069 | |||||||||
Provision for losses on contracts and related receivables |
24,207 | 6,571 | 3,581 | |||||||||
Exchange gain |
(20 | ) | (234 | ) | — | |||||||
Gain on sale of discontinued operation |
— | — | (414 | ) | ||||||||
Gain on disposal of property and equipment |
(296 | ) | (1,220 | ) | (732 | ) | ||||||
Changes in operating assets and liabilities, net of effects of acquisitions: |
||||||||||||
Accounts receivable |
156,174 | (156,139 | ) | (85,611 | ) | |||||||
Prepaid expenses and other assets |
(10,769 | ) | (9,377 | ) | (6,110 | ) | ||||||
Accounts payable |
(104,268 | ) | 58,401 | 44,813 | ||||||||
Accrued compensation |
(12,935 | ) | 19,440 | 10,416 | ||||||||
Billings in excess of costs on uncompleted contracts |
(5,102 | ) | 42,110 | 6,226 | ||||||||
Other liabilities |
(3,180 | ) | 19,453 | 1,969 | ||||||||
Income taxes receivable/payable |
36,558 | (7,465 | ) | 7,906 | ||||||||
Net cash provided by operating activities |
198,248 | 68,380 | 46,676 | |||||||||
CASH FLOWS FROM INVESTING ACTIVITIES: |
||||||||||||
Capital expenditures |
(19,803 | ) | (17,768 | ) | (13,141 | ) | ||||||
Payments for business acquisitions, net of cash acquired |
(114,743 | ) | (77,771 | ) | (31,343 | ) | ||||||
Proceeds from sale of discontinued operation |
192 | 3,614 | 3,901 | |||||||||
Proceeds from sale of property and equipment |
1,055 | 2,089 | 896 | |||||||||
Net cash used in investing activities |
(133,299 | ) | (89,836 | ) | (39,687 | ) | ||||||
CASH FLOWS FROM FINANCING ACTIVITIES: |
||||||||||||
Payments on long-term obligations |
(168,711 | ) | (41,713 | ) | (130,677 | ) | ||||||
Proceeds from borrowings under long-term obligations |
118,290 | 15,000 | 128,000 | |||||||||
Payment of deferred financing fees |
— | — | (1,032 | ) | ||||||||
Excess tax benefits from stock-based compensation |
2,025 | 1,663 | 491 | |||||||||
Net proceeds from issuance of common stock |
20,336 | 20,667 | 7,617 | |||||||||
Net cash (used in) provided by financing activities |
(28,060 | ) | (4,383 | ) | 4,399 | |||||||
EFFECT OF EXCHANGE RATE CHANGES ON CASH |
1,394 |
— |
— |
|||||||||
NET INCREASE (DECREASE) IN CASH AND CASH EQUIVALENTS |
38,283 |
(25,839 |
) |
11,388 |
||||||||
CASH AND CASH EQUIVALENTS AT BEGINNING OF PERIOD |
50,902 | 76,741 | 65,353 | |||||||||
CASH AND CASH EQUIVALENTS AT END OF PERIOD |
$ | 89,185 | $ | 50,902 | $ | 76,741 | ||||||
SUPPLEMENTAL CASH FLOW INFORMATION: |
||||||||||||
Cash paid (received) during the year for: |
||||||||||||
Interest |
$ | 2,475 | $ | 3,977 | $ | 6,564 | ||||||
Income taxes, net of refunds received |
$ | (152 | ) | $ | 34,228 | $ | 27,852 | |||||
See accompanying Notes to Consolidated Financial Statements.
71
TETRA TECH, INC.
NOTES TO CONSOLIDATED FINANCIAL STATEMENTS
1. Description of Business
Tetra Tech, Inc. and its wholly-owned subsidiaries ("we," "us" or "our") is a leading provider of consulting, engineering, program management, construction and technical services focusing on resource management, infrastructure and the environment. We serve our clients by providing cost-effective and innovative solutions to fundamental needs for water, environmental and energy services. We typically begin at the earliest stage of a project by applying science to problems and developing solutions tailored to our clients' needs and resources. Our solutions may span the entire life cycle of the project and include applied science, research and technology, engineering, design, construction management, construction, operations and maintenance, and information technology.
2. Basis of Presentation and Preparation
Principles of Consolidation and Presentation. The accompanying consolidated financial statements include the accounts of Tetra Tech, Inc. and its wholly-owned subsidiaries. All significant intercompany balances and transactions have been eliminated in consolidation. Certain prior year amounts, including those of our reportable segments, have been reclassified to conform to the current year presentation.
Fiscal Year. We report results of operations based on 52 or 53-week periods ending near September 30 of each year. Fiscal years 2009, 2008 and 2007 each contained 52 weeks.
Use of Estimates. The preparation of financial statements in conformity with U.S. GAAP requires us to make estimates and assumptions. These estimates and assumptions affect the reported amounts in our consolidated balance sheets and statements of income as well as related disclosures during the reporting period. Actual results could differ from those estimates. On an ongoing basis, management reviews its estimates based on information that was available at that time. Changes in facts and circumstances may cause us to revise our estimates.
Revenue Recognition and Contract Cost. We recognize revenue when persuasive evidence of an arrangement exists, services have been rendered, the contract price is fixed or determinable, and collectibility is probable. We have a standard internal process that we use to determine whether all required criteria for revenue recognition have been met. We recognize revenue for most of our contracts using the percentage-of-completion method based on contract costs incurred compared to total estimated contract costs. This method of revenue recognition requires us to prepare estimates of costs to complete contracts in progress. In making such estimates, judgments are required to evaluate contingencies such as potential variances in schedule, the cost of materials and labor productivity, and the impact of change orders, liability claims, contract disputes, and achievement of contractual performance standards. Changes in total estimated contract costs and losses, if any, are recognized in full in the period in which they are determined.
In the ordinary course of business, and at a minimum on a quarterly basis, we prepare updated estimates of our total forecasted contract revenue, costs and profit or loss. The cumulative effect of revisions in estimates of the total forecasted revenue and costs during the course of the work, including unapproved change orders and claims, is reflected in the accounting period in which the facts that caused the revision become evident. The financial impact of these revisions to any one contract is a function of both the amount of the revision and the percentage-of- completion of the contract.
Our revenues are derived primarily from fee-based professional and technical services under three major types of contracts: fixed-price, time-and-materials and cost-plus. Within each of the major contract types are variations on the basic contract mechanism. Fixed-price contracts generally present
72
TETRA TECH, INC.
NOTES TO CONSOLIDATED FINANCIAL STATEMENTS (Continued)
2. Basis of Presentation and Preparation (Continued)
us with the highest level of financial and performance risk, but often also provide the highest potential financial returns. Time-and-materials contracts generally represent the time spent by our professional staff at stated or negotiated billing rates. Cost-plus contracts present us with lower risk, but generally provide lower returns and often include more onerous terms and conditions.
For long-term contracts related to performance of construction-type and certain production-type contracts or other appropriate accounting literature, we apply the percentage-of-completion method. For time-and-material contracts, revenue is recognized to the extent of billable rates multiplied by hours delivered plus material and other reimbursable costs incurred. Revenue is recognized at a rate per unit as the units are delivered, or by other methods to measure services provided. Revenue from other long-term fixed-price contracts is recognized ratably over the contract period or by other appropriate methods to measure services provided. Contract costs are expensed as incurred. Revenue for cost reimbursable contracts is recorded as costs are incurred, including an estimated share of the applicable contractual fees earned. For certain performance-based fees under cost reimbursable contracts, we recognize the relevant portion of the expected fee to be awarded by the client at the time such fee can be reasonably estimated, based on factors such as our prior award experience and communications with the client regarding performance. Within the overall context of the three major types of contracts discussed above, certain of our contracts are service contracts (i.e., providing operations and maintenance services and a variety of technical assistance services). Our service contracts are accounted for on the proportional performance method, under which revenue is recognized in proportion to the number of service activities performed, in proportion to the direct costs of performing the service activities, or evenly across the period of performance depending upon the nature of the services provided.
In the course of providing our services, we routinely subcontract services and, under certain USAID programs, issue grants. Generally, these subcontractor costs and grants are passed through to our clients and, in accordance with industry practice and U.S. GAAP, are included in our revenue when it is our responsibility to procure and manage these activities under a contract. The grants are reported as part of our subcontractor costs on our consolidated statement of income. Because subcontractor services can change significantly from project to project and period to period, changes in revenue may not be indicative of our business trends. Accordingly, we also report revenue, net of subcontractor costs.
Once contract performance is underway, we may experience changes in conditions, client requirements, specifications, designs, materials and expectations regarding the period of performance. Such changes are "change orders" and may be initiated by us or by our clients. Costs related to change orders are recognized when they are incurred. A change order is included in total estimated contract revenue when it is probable that the change order will result in a bona fide addition to contract value and can be reliably estimated.
Claims are amounts in excess of agreed contract price that we seek to collect from our clients or others for delays, errors in specifications and designs, contract terminations, change orders in dispute or unapproved as to both scope and price or other causes of unanticipated additional costs. Claim costs are recognized when it is probable that the claim will result in a bona fide addition to contract value that can be reliably estimated. No profit is recognized on a claim until final settlement occurs. This can lead to a situation in which costs are recognized in one period and revenues are recognized in a subsequent period when a client agreement is obtained or a claims resolution occurs.
73
TETRA TECH, INC.
NOTES TO CONSOLIDATED FINANCIAL STATEMENTS (Continued)
2. Basis of Presentation and Preparation (Continued)
We have contracts with the U.S. federal government that contain provisions requiring compliance with FAR and CAS. These regulations are generally applicable to all of our U.S. federal government contracts and are partially or fully incorporated in many state and local government agency contracts. They limit the recovery of certain specified indirect costs on contracts subject to FAR. Cost-plus contracts covered by FAR and certain state and local government agencies provide for upward or downward adjustments if actual recoverable costs differ from the estimate billed under forward pricing arrangements. Most of our U.S. federal government contracts are subject to termination at the convenience of the client. Contracts typically provide for reimbursement of costs incurred and payment of fees earned through the date of such termination. U.S. federal government contracts are subject to FAR, and some state and local government agencies require audits, which are performed primarily by the DCAA. The DCAA audits our overhead rates, cost proposals, incurred government contract costs, and internal control systems. During the course of its audits, the DCAA may disallow certain incurred costs if it determines that we have improperly accounted for such costs in a manner inconsistent with the requirements of FAR and CAS. Historically, we have not had any material disallowed costs as a result of such audits. However, we can provide no assurance that DCAA audits will not result in material disallowances of incurred costs in the future.
Allowance for Uncollectible Accounts Receivable. We record an allowance against our accounts receivable for those amounts that, in the future, may become uncollectible. We determine our estimated allowance for uncollectible amounts based on management's evaluation of the contracts involved and the financial condition of our clients. We regularly evaluate the adequacy of the allowance for doubtful accounts by considering the following factors:
- •
- Type of client—government agency or commercial sector;
- •
- Trends in actual and forecasted credit quality of the client, including delinquency and payment history;
- •
- General economic and particular industry conditions that may affect a client's ability to pay; and
- •
- Contract performance and our change order/claim analysis.
Selling, General and Administrative Expenses. SG&A expenses are expensed in the period incurred. SG&A expenses are comprised primarily of marketing and bid and proposal costs, and our corporate headquarters' costs related to the executive offices, finance, accounting, administration and information technology. In addition, we include the non-contract related portion of stock-based compensation, depreciation of property and equipment, and the amortization of identifiable intangible assets in SG&A expenses. Most of these costs are unrelated to specific clients or projects and can vary as expenses are incurred to support corporate activities and initiatives.
Cash and Cash Equivalents. Cash equivalents include all highly liquid investments with initial or remaining maturities of 90 days or less at the time of purchase.
Property and Equipment. Property and equipment are recorded at cost and are depreciated over their estimated useful lives using the straight-line method. Expenditures for maintenance and repairs are expensed as incurred. Generally, estimated useful lives range from three to ten years for equipment, furniture and fixtures. Leasehold improvements are amortized on a straight-line basis over the shorter of their estimated useful lives or the remaining terms of the leases.
74
TETRA TECH, INC.
NOTES TO CONSOLIDATED FINANCIAL STATEMENTS (Continued)
2. Basis of Presentation and Preparation (Continued)
Long-Lived Assets. Our policy regarding long-lived assets is to evaluate the recoverability of our assets when the facts and circumstances suggest that the assets may be impaired. This assessment is performed based on the estimated undiscounted cash flows compared to the carrying value of the assets. If the future cash flows (undiscounted and without interest charges) are less than the carrying value, a write-down would be recorded to reduce the related asset to its estimated fair value.
Goodwill and Intangibles. Goodwill consists of amounts paid for new business acquisitions in excess of the fair value of net assets acquired. Following an acquisition, we perform an analysis to value the acquired company's tangible and identifiable intangible assets and liabilities. With respect to identifiable intangible assets, we consider backlog, non-compete agreements, client relations, patents and other assets.
We perform our annual goodwill testing on the first day of our fiscal fourth quarter (June 29, 2009 in fiscal 2009). Our reporting units are the components one level below our reportable segments. The annual impairment test is a two-step process. As the first step, we estimate the fair value of the reporting unit and compare that amount to the sum of the carrying values of the reporting unit's goodwill and other net assets. If the fair value of the reporting unit is determined to be less than the carrying value, a second step is performed to compare the current implied fair value of the goodwill to the current carrying value of the goodwill and any resulting decrease is recorded as an impairment of goodwill.
Stock-Based Compensation. We recognize the fair value of our share-based compensation awards as compensation expense on a straight-line basis over the requisite service period of the award (or to an employee's eligible retirement date, if earlier.)
Deferred Compensation. We maintain a non-qualified defined contribution supplemental retirement plan for certain key employees that is accounted for in accordance with applicable authoritative guidance on accounting for deferred compensation arrangements where amounts earned are held in a rabbi trust and invested. Employee deferrals and our match are deposited into a rabbi trust, and the funds are generally invested in individual variable life insurance contracts that we own and that are specifically designed to informally fund savings plans of this nature. Our consolidated balance sheets reflect our investment in variable life insurance contracts in "Other assets". Our obligation to participating employees is reflected in "Other long-term liabilities". All income and expenses related to the rabbi trust are reflected in our consolidated statement of income.
Income Taxes. We file a consolidated U.S. federal income tax return and combined California franchise tax return. In addition, we file other returns that are required in the states and jurisdictions in which we do business. We account for certain income and expense items differently for financial reporting and income tax purposes. Deferred tax assets and liabilities are computed for the difference between the financial statement and tax bases of assets and liabilities that will result in taxable or deductible amounts in the future based on enacted tax laws and rates applicable to the periods in which the differences are expected to reverse. In determining the need for a valuation allowance, management reviews both positive and negative evidence, including current and historical results of operations, future income projections, and potential tax planning strategies.
On October 1, 2007, we adopted authoritative guidance on accounting for uncertainty in income taxes and did not record any cumulative effect adjustment to retained earnings as a result of this adoption. Under this guidance, we may recognize the tax benefit from an uncertain tax position only if
75
TETRA TECH, INC.
NOTES TO CONSOLIDATED FINANCIAL STATEMENTS (Continued)
2. Basis of Presentation and Preparation (Continued)
it is more likely than not that the tax position will be sustained on examination by the taxing authorities based on the technical merits of the position. The tax benefits recognized in the financial statements from such a position should be measured based on the largest benefit that has a greater than 50.0% likelihood of being realized upon ultimate settlement. This guidance also provides guidance on de-recognition, classification, interest and penalties on income taxes, accounting in interim periods and disclosure requirements for uncertain tax positions.
Earnings Per Share. Basic earnings per share ("EPS") is computed by dividing net income available to common stockholders by the weighted-average number of common shares outstanding, less unvested restricted stock. Diluted EPS is computed by dividing net income by the weighted-average number of common shares outstanding and dilutive potential common shares for the period. Potential common shares include the weighted-average dilutive effects of outstanding stock options and unvested restricted stock using the treasury stock method.
Fair Value of Financial Instruments. The carrying amounts of cash and cash equivalents, accounts receivable and accounts payable approximate fair value because of the short maturities of these instruments. Any borrowings under our revolving credit facility approximate fair value because the interest rates are based upon variable reference rates.
Concentration of Credit Risk. Financial instruments that subject us to credit risk consist primarily of cash and cash equivalents and net accounts receivable. We place our temporary cash investments with lower risk financial institutions and, by policy, limit the amount of investment exposure to any one financial institution. Approximately 35% of accounts receivable was due from various agencies of the U.S. federal government for both periods ended September 27, 2009 and September 28, 2008. The remaining accounts receivable are generally diversified due to the large number of organizations comprising our client base and their geographic dispersion. We perform ongoing credit evaluations of our clients and maintain an allowance for potential credit losses.
Foreign Currency Transactions. Our international operating units have functional currencies that are different than our reporting currency. Their functional currencies are typically based upon the currencies of the primary country in which they operate. Translation of assets and liabilities to U.S. dollars is based on exchange rates at the balance sheet date. Translation of revenue and expenses to U.S. dollars is based on the average rate during the period. Translation gains or losses are reported as a component of "Accumulated other comprehensive income". Gains or losses from foreign currency transactions are included in results of operations, with the exception of intercompany foreign transactions that represent a long-term investment, which are recorded in "Accumulated other comprehensive income" on our consolidated balance sheet.
Recently Issued Accounting Pronouncements. In June 2009, the FASB issued authoritative guidance that establishes the Codification or ASC, as the single source of authoritative United States accounting and reporting standards applicable for all non-government entities, with the exception of guidance promulgated by the SEC and its staff. The Codification, which changes the referencing of financial standards, is effective for interim or annual financial periods ending after September 15, 2009. We implemented the guidance effective in fiscal 2009, and all references made to U.S. GAAP use the new Codification numbering system prescribed by the FASB.
In September 2006, the FASB issued authoritative guidance on fair value measurements that defines fair value, establishes a framework for measuring fair value and expands disclosures about fair
76
TETRA TECH, INC.
NOTES TO CONSOLIDATED FINANCIAL STATEMENTS (Continued)
2. Basis of Presentation and Preparation (Continued)
value measurements. This guidance was effective for financial statements issued for fiscal years beginning after November 15, 2007, and interim periods within those fiscal years except for all nonrecurring fair value measurements of nonfinancial assets and liabilities, which is effective for financial statements issued for fiscal years beginning after November 15, 2008. In October 2008, the FASB clarified the application of authoritative guidance, which in a market that is not active and provided an example to illustrate key considerations in determining the fair value of a financial asset when the market of that financial asset is not active. Revisions resulting from a change in valuation technique or its application should be accounted for as a change in accounting estimate, and any effects on fair-value measurement would be recognized in the period of adoption. Our adoption of this guidance on September 29, 2008 was limited to financial assets and liabilities and had no impact on our consolidated financial statements in fiscal 2009. We are currently evaluating the anticipated effect of this statement on our non-financial assets and non-financial liabilities.
In February 2007, the FASB issued authoritative guidance that provides companies with an option to measure, at specified election dates, many financial instruments and certain other items at fair value that are not currently measured at fair value. A company that adopts this guidance will report unrealized gains and losses on items for which the fair value option has been elected in earnings at each subsequent reporting date. This guidance also establishes presentation and disclosure requirements designed to facilitate comparisons between entities that choose different measurement attributes for similar types of assets and liabilities. This guidance became effective for us at the beginning of our fiscal year 2009. We did not elect the fair value option for any financial assets or liabilities during the first quarter of fiscal 2009.
In December 2007, the FASB issued authoritative guidance that establishes the principles and requirements for how an acquirer (i) recognizes and measures in its financial statements the identifiable assets acquired, the liabilities assumed, and any noncontrolling interest in the acquiree; (ii) recognizes and measures the goodwill acquired in the business combination or a gain from a bargain purchase; and (iii) determines what information to disclose to enable users of the financial statements to evaluate the nature and financial effects of the business combination. This guidance makes significant changes to existing accounting practices for acquisitions, including the requirement to expense transaction costs and to reflect the fair value of contingent purchase price adjustments at the date of acquisition. In April 2009, the FASB issued an amendment to amend and clarify the guidance on business combinations to require that an acquirer recognize at fair value, at the acquisition date, an asset acquired or a liability assumed in a business combination that arises from a contingency if the acquisition-date fair value of that asset or liability can be determined during the measurement period. If the acquisition-date fair value of such an asset acquired or liability assumed cannot be determined, the acquirer should apply the provisions of the guidance on business combinations to determine whether the contingency should be recognized at the acquisition date or after it. The guidance is effective for business combinations for which the acquisition date is after the beginning of the first annual reporting period beginning after December 15, 2008, which is effective for us in fiscal 2010. For any acquisitions completed after fiscal 2009, we expect the adoption of the guidance will have an impact on our consolidated financial statements; however, the magnitude of the impact will depend upon the nature, terms and size of the acquisitions we consummate.
In December 2007, the FASB issued authoritative guidance that establishes accounting and reporting standards that require (i) noncontrolling interests to be reported as a component of equity; (ii) changes in a parent's ownership interest while the parent retains its controlling interest to be
77
TETRA TECH, INC.
NOTES TO CONSOLIDATED FINANCIAL STATEMENTS (Continued)
2. Basis of Presentation and Preparation (Continued)
accounted for as equity transactions; and (iii) any retained noncontrolling equity investment upon the deconsolidation of a subsidiary to be initially measured at fair value. We do not currently have any less than wholly-owned consolidated subsidiaries. The guidance is to be applied prospectively at the beginning of the first annual reporting period on or after December 15, 2008. We will implement the new standard effective in fiscal 2010. We do not believe that the adoption of the guidance will have a material effect on our consolidated financial statements.
In December 2007, the EITF issued authoritative guidance that prescribes the accounting for collaborations. It requires certain transactions between collaborators to be recorded in the financial statements on either a gross or net basis when certain characteristics exist in the collaboration relationship. This guidance is effective in fiscal 2010 for all of our collaborations. We do not believe that the adoption of the guidance will have a material effect on our consolidated financial statements.
In April 2008, the FASB issued authoritative guidance that revises the factors that should be considered in developing renewal or extension assumptions determining the useful life of a recognized intangible asset under the guidance. This guidance will be effective for fiscal years beginning after December 15, 2008. We will implement the guidance effective in fiscal 2010. We are currently assessing the effect of the guidance on our consolidated financial statements.
In June 2008, the FASB issued authoritative guidance that states that unvested share-based payment awards that contain non-forfeitable rights to dividends or dividend equivalents (whether paid or unpaid) are participating securities and must be included in the computation of earnings per share pursuant to the two-class method. The guidance, which is applied retrospectively, is effective for us in fiscal 2010. We do not believe that the adoption of the guidance will have a material effect on our consolidated financial statements.
In May 2009, the FASB issued authoritative guidance that was effective June 15, 2009 and establishes general standards of accounting for and disclosure of events that occur after the balance sheet date but before financial statements are issued or are available to be issued. This guidance is currently effective for us and the adoption of the guidance did not have a material effect on our consolidated financial statements. We evaluated subsequent events through November 13, 2009, the date our financial statements were issued.
78
TETRA TECH, INC.
NOTES TO CONSOLIDATED FINANCIAL STATEMENTS (Continued)
3. Accounts Receivable—Net
Net accounts receivable and billing in excess of costs on uncompleted contracts consisted of the following as of September 27, 2009 and September 28, 2008:
| |
Fiscal Year Ended | |||||||
|---|---|---|---|---|---|---|---|---|
| |
September 27, 2009 |
September 28, 2008 |
||||||
| |
(in thousands) |
|||||||
Billed |
$ | 299,935 | $ | 379,948 | ||||
Unbilled |
222,322 | 246,715 | ||||||
Contract retentions |
14,952 | 20,649 | ||||||
Total accounts receivable—gross |
537,209 | 647,312 | ||||||
Allowance for doubtful accounts |
(30,893 |
) |
(21,526 |
) |
||||
Total accounts receivable—net |
$ | 506,316 | $ | 625,786 | ||||
Billings in excess of costs on uncompleted contracts |
$ |
105,162 |
$ |
100,336 |
||||
Billed accounts receivable represent amounts billed to clients that have not been collected. Unbilled accounts receivable represent revenue recognized but not yet billed pursuant to contract terms or billed after the period end date. Substantially all unbilled receivables as of September 27, 2009 are expected to be billed and collected within 12 months. Contract retentions represent amounts withheld by clients until certain conditions are met or the project is completed, which may be several months or years. The allowances for doubtful accounts was determined based on a review of client-specific accounts, bankruptcy filings by clients, and contract issues resulting from current events and economic circumstances.
Billed accounts receivables related to U.S. federal government contracts were $97.3 million and $100.2 million as of September 27, 2009 and September 28, 2008, respectively. Federal government unbilled receivables, net of progress payments, were $68.1 million and $88.6 million as of September 27, 2009 and September 28, 2008, respectively. Other than the U.S. federal government, no single client accounted for more than 10% of our accounts receivable as of September 27, 2009. The U.S. federal government and one commercial client each accounted for more than 10% of our accounts receivable as of September 28, 2008.
4. Mergers and Acquisitions
All of the acquisitions described below were accounted for as business combinations. Accordingly, the purchase prices were allocated to the assets acquired and liabilities assumed based on their fair values. None of the fiscal 2007, 2008 and 2009 acquisitions, except for ARD in 2008, were considered material, individually or in the aggregate, as they did not have a material impact on our consolidated financial position or results of operations for the respective reporting periods. The results for each acquisition were included in our consolidated financial statements from the closing date of that acquisition.
In fiscal 2007, we acquired DGI, which provides planning, development and construction services for wind energy programs, BRAC projects, and water and wastewater treatment and conveyance
79
TETRA TECH, INC.
NOTES TO CONSOLIDATED FINANCIAL STATEMENTS (Continued)
4. Mergers and Acquisitions (Continued)
facilities to its broad-based clients. The purchase price consisted of cash payments of $32.5 million. In addition, the former shareholders will receive, over a four-year period from the acquisition date, guaranteed deferred cash payments in the aggregate amount of $9.0 million and contingent earn-out payments up to an aggregate maximum of $12.0 million upon achievement of certain financial objectives. In the third quarter of fiscal 2008 and 2009, we paid $2.3 million as a portion of the guaranteed deferred cash payment and $1.2 million and $3.0 million, respectively, as a contingent earn-out payment to the former shareholders. DGI is part of our RCM segment. In fiscal 2007, we also acquired other businesses to enhance our service offerings and expand our geographic presence in our ECS and EAS segments. As of September 27, 2009, the total purchase price for these acquisitions consisted of cash payments of $8.7 million and aggregate maximum contingent earn-out payments of $2.2 million upon achievement of certain financial objectives over a three or four-year period from their respective acquisition dates. To date, $0.8 million has been earned by and paid to the former shareholders.
In fiscal 2008, we acquired all of the outstanding shares of capital stock of ARD, which provides applied research, planning, design and implementation services focused on a range of water, energy, environmental and institutional issues. ARD manages large, complex international development projects for its clients, predominantly USAID. This acquisition continues our international expansion as it increases our professional workforce in new geographic areas and technical specialties around the world. ARD is part of our TSS segment. The purchase price consisted of $41.5 million in cash payments. The following table summarizes the estimated fair values of the assets acquired and liabilities assumed as of the date of acquisition:
| |
Amount | |||
|---|---|---|---|---|
| |
(in thousands) |
|||
Current assets |
$ | 31,846 | ||
Property and equipment |
195 | |||
Goodwill |
17,905 | |||
Intangible and other assets |
8,110 | |||
Current liabilities |
(16,528 | ) | ||
Net assets acquired |
$ | 41,528 | ||
80
TETRA TECH, INC.
NOTES TO CONSOLIDATED FINANCIAL STATEMENTS (Continued)
4. Mergers and Acquisitions (Continued)
No pro forma information is presented for fiscal 2008 as the ARD acquisition closed on the first day of our fiscal year. The table below presents summarized unaudited pro forma consolidated operating results, assuming we had purchased ARD at the beginning of fiscal 2007:
| |
Fiscal Year Ended | ||||
|---|---|---|---|---|---|
| |
September 30, 2007 | ||||
| |
(in thousands, except per share data) |
||||
Revenue |
$ | 1,678,763 | |||
Revenue, net of subcontractor costs |
1,086,217 | ||||
Income from operations |
89,323 | ||||
Net income |
46,479 | ||||
Earnings per share: |
|||||
Basic |
$ | 0.80 | |||
Diluted |
$ | 0.79 | |||
Weighted-average shares outstanding: |
|||||
Basic |
57,948 | ||||
Diluted |
58,553 | ||||
In fiscal 2008, we also made other acquisitions that enhanced our service offerings and expanded our geographic reach in our EAS, ECS and TSS segments. The total initial purchase price for these acquisitions was $31.3 million in cash and the aggregate maximum contingent earn-out payments were approximately $9.4 million upon achievement of certain financial objectives over a two- to four-year period. In fiscal 2009, $3.0 million was earned and paid to these sellers.
In fiscal 2009, we acquired Wardrop, a Canadian firm that specializes in resource management, energy and infrastructure design and is included in our ECS segment. This acquisition significantly expanded our worldwide presence, adding 13 offices throughout Canada and offices in the United Kingdom and India. The purchase price consisted of cash payments of $91.2 million. In addition, the former shareholders will receive over a three-year period from the acquisition date contingent earn-out payments up to an aggregate maximum of $27.5 million upon achievement of certain financial objectives. In fiscal 2009, we made other acquisitions in our ECS, TSS and RCM segments that enhanced our service offerings to broad-based clients, including USAID. The aggregate purchase price for these other acquisitions was approximately $29.7 million plus aggregate maximum contingent earn-out payments of $24.7 million upon achievement of certain financial objectives. One of these acquisitions resulted in an excess of $2.4 million of the fair value of identifiable assets acquired and liabilities assumed over the purchase price. Due to a contingent consideration agreement that will likely result in a recognition of additional purchase price upon resolution, the excess amount of $2.4 million was recognized as a liability as part of "Other current liabilities" on our consolidated balance sheet as of September 27, 2009.
81
TETRA TECH, INC.
NOTES TO CONSOLIDATED FINANCIAL STATEMENTS (Continued)
5. Goodwill and Intangibles
Our goodwill was $319.7 million as of September 27, 2009 and $221.5 million as of September 28, 2008. Our acquired identifiable intangible assets had a net book value of $33.8 million as of September 27, 2009 and $14.6 million as of September 28, 2008.
The following table summarizes the changes in the carrying value of goodwill:
| |
September 28, 2008 |
Goodwill Additions |
Goodwill Adjustments |
September 27, 2009 |
|||||||||
|---|---|---|---|---|---|---|---|---|---|---|---|---|---|
| |
(in thousands) |
||||||||||||
ECS |
$ | 99,096 | $ | 79,122 | $ | 11,198 | $ | 189,416 | |||||
TSS |
53,552 | 3,704 | — | 57,256 | |||||||||
EAS |
14,854 | — | 1,116 | 15,970 | |||||||||
RCM |
54,043 | — | 3,000 | 57,043 | |||||||||
Total |
$ | 221,545 | $ | 82,826 | $ | 15,314 | $ | 319,685 | |||||
The goodwill additions are attributable to the fiscal 2009 acquisitions described above. Substantially all of the goodwill additions are not deductible for income tax purposes. The goodwill adjustments reflect earn-out payments, a guaranteed deferred cash payment, foreign currency translation adjustments, agreed upon net asset value adjustments, and the final purchase price allocations associated with prior acquisitions. The purchase price allocations related to the Wardrop acquisition and certain recent acquisitions are preliminary, and subject to adjustment based on the valuation and final determination of the net assets acquired. We do not believe any adjustments will have a material effect on our consolidated results of operations.
The gross amount and accumulated amortization of our acquired identifiable intangible assets with finite useful lives included in "Intangible assets—net" on the consolidated balance sheets, were as follows:
| |
|
September 27, 2009 | September 28, 2008 | |||||||||||||
|---|---|---|---|---|---|---|---|---|---|---|---|---|---|---|---|---|
| |
Weighted- Average Remaining Life (in years) |
Gross Amount |
Accumulated Amortization |
Gross Amount |
Accumulated Amortization |
|||||||||||
| |
|
($ in thousands) |
||||||||||||||
Non-compete agreements |
3.1 | $ | 3,825 | $ | (1,118 | ) | $ | 1,472 | $ | (368 | ) | |||||
Client relations |
6.1 | 24,791 | (3,632 | ) | 5,746 | (897 | ) | |||||||||
Backlog |
1.9 | 27,057 | (17,154 | ) | 19,310 | (10,654 | ) | |||||||||
Total |
$ | 55,673 | $ | (21,904 | ) | $ | 26,528 | $ | (11,919 | ) | ||||||
In fiscal 2009, non-compete agreements, client relations and backlog increased $2.4 million, $19.0 million and $7.7 million in gross amounts, respectively, due to our aforementioned acquisitions and, to a lesser extent, foreign currency translation adjustments. Amortization expense for these intangible assets for fiscal 2009, 2008 and 2007 was $9.8 million, $5.6 million and $1.8 million, respectively. In fiscal 2009, accumulated amortization decreased by approximately $0.2 million as a
82
TETRA TECH, INC.
NOTES TO CONSOLIDATED FINANCIAL STATEMENTS (Continued)
5. Goodwill and Intangibles (Continued)
result of a foreign currency translation adjustment. Estimated amortization expense for the succeeding five years and beyond is as follows:
| |
Amount | |||
|---|---|---|---|---|
| |
(in thousands) |
|||
2010 |
$ | 10,689 | ||
2011 |
8,116 | |||
2012 |
5,061 | |||
2013 |
3,223 | |||
2014 |
2,728 | |||
Beyond |
3,952 | |||
6. Income Taxes
Income tax expense for fiscal 2009, 2008 and 2007 consisted of the following:
| |
Fiscal Year Ended | |||||||||||
|---|---|---|---|---|---|---|---|---|---|---|---|---|
| |
September 27, 2009 |
September 28, 2008 |
September 30, 2007 |
|||||||||
| |
(in thousands) |
|||||||||||
Current: |
||||||||||||
Federal |
$ | 25,526 | $ | 25,925 | $ | 29,025 | ||||||
State |
10,423 | 5,920 | 6,345 | |||||||||
Total current income tax expense |
35,949 | 31,845 | 35,370 | |||||||||
Deferred: |
||||||||||||
Federal |
(2,803 | ) | 8,628 | (1,670 | ) | |||||||
State |
(969 | ) | 2,034 | (263 | ) | |||||||
Total deferred income tax (benefit) expense |
(3,772 | ) | 10,662 | (1,933 | ) | |||||||
Total income tax expense |
$ | 32,177 | $ | 42,507 | $ | 33,437 | ||||||
83
TETRA TECH, INC.
NOTES TO CONSOLIDATED FINANCIAL STATEMENTS (Continued)
6. Income Taxes (Continued)
Total income tax expense was different from the amount computed by applying the U.S. federal statutory rate to pre-tax income as follows:
| |
Fiscal Year Ended | ||||||||||||||||||
|---|---|---|---|---|---|---|---|---|---|---|---|---|---|---|---|---|---|---|---|
| |
September 27, 2009 | September 28, 2008 | September 30, 2007 | ||||||||||||||||
| |
($ in thousands) |
||||||||||||||||||
Tax at federal statutory rate |
$ | 41,722 | 35.0 | % | $ | 36,194 | 35.0 | % | $ | 27,924 | 35.0 | % | |||||||
State taxes, net of federal benefit |
5,685 | 4.8 | 5,170 | 5.0 | 3,953 | 5.0 | |||||||||||||
IRS settlement |
(3,312 | ) | (2.8 | ) | — | — | — | — | |||||||||||
R&E Credits |
(11,700 | ) | (9.8 | ) | — | — | — | — | |||||||||||
Other |
(218 | ) | (0.2 | ) | 1,143 | 1.1 | 1,560 | 1.9 | |||||||||||
Total income tax expense |
$ |
32,177 |
27.0 |
% |
$ |
42,507 |
41.1 |
% |
$ |
33,437 |
41.9 |
% |
|||||||
The decrease in income tax expense to 27.0% in fiscal 2009 was primarily due to an IRS settlement and the recognition of prior year R&E Credits.
In the second quarter of fiscal 2009, we received notification from the IRS that our appeals settlement for fiscal years 1997 through 2001 was approved. The IRS approved refunds for a tax accounting method change for revenue recognition and refund claims for R&E Credits. In the third quarter of fiscal 2009, we received a cash refund of $39.8 million from the IRS settlement for these years, which included interest. The amount of the settlement exceeded the amount of the receivable previously recognized in our financial statements. We recorded a benefit of $3.3 million in our income tax expense in the second quarter of fiscal 2009 to reflect the settlement adjustment and an adjustment to certain unrecognized tax benefits (including related interest) for the fiscal years subsequent to the settlement.
In the third quarter of fiscal 2009, we completed R&E Credit studies and analyses for the tax years subsequent to 2004. In order to claim an R&E Credit, we had to perform a detailed study to determine those activities that qualified for credits in any fiscal year. The tax regulations are complex and our business activities change from year to year. Prior to the IRS appeals settlement for fiscal years 1997 through 2001, there was uncertainty about whether and to what extent the IRS would approve our study methodology and any credit we claimed. As a result, we deferred the cost of studies until we believed the credit ultimately sustainable under examination would exceed the cost of the study. Based upon the IRS settlement and the completed studies and analyses, we now have sufficient information to reasonably estimate the income tax benefits for R&E Credits for fiscal years subsequent to fiscal 2004. We recorded a benefit of approximately $9.7 million in our income tax expense in the third quarter of fiscal 2009 to reflect the estimated amount of previously unclaimed R&E Credits for periods prior to fiscal 2009.
We remain in the appeals process with the IRS for fiscal years 2002 through 2004 related to R&E Credits and our tax accounting method for revenue recognition. We are also under examination by the FTB for fiscal years 2001 through 2003 related to R&E Credits. Management believes that it is reasonably possible we will reach a resolution of these audits within the next twelve months. If the resolution is more favorable than expected, the change in unrecognized tax benefits could be
84
TETRA TECH, INC.
NOTES TO CONSOLIDATED FINANCIAL STATEMENTS (Continued)
6. Income Taxes (Continued)
significant. However, if the resolution is less favorable than expected, there may be a material increase in our income tax expense in the period in which the determination is made. With few exceptions, we are no longer subject to U.S. federal, state and local, or non-U.S. income tax examinations for fiscal years before 2001.
Temporary differences comprising the net deferred income tax asset (liability) shown on the accompanying consolidated balance sheets were as follows:
| |
Fiscal Year Ended | ||||||||
|---|---|---|---|---|---|---|---|---|---|
| |
September 27, 2009 |
September 28, 2008 |
|||||||
| |
(in thousands) |
||||||||
Deferred Tax Asset: |
|||||||||
State taxes |
$ | 1,232 | $ | 937 | |||||
Reserves and contingent liabilities |
9,307 | 5,644 | |||||||
Allowance for doubtful accounts |
7,880 | 6,306 | |||||||
Accrued liabilities |
15,708 | 14,044 | |||||||
Stock-based compensation |
5,544 | 4,355 | |||||||
Capital loss carry-forward |
11,836 | 11,853 | |||||||
Valuation allowance on capital loss carry-forward |
(11,313 | ) | (11,313 | ) | |||||
Total deferred tax asset |
40,194 | 31,826 | |||||||
Deferred Tax Liability: |
|||||||||
Unbilled revenue |
(30,903 | ) | (14,395 | ) | |||||
Prepaid expense |
(3,570 | ) | (2,068 | ) | |||||
Intangibles |
(10,682 | ) | (751 | ) | |||||
Cash-to-accrual adjustments |
(1,181 | ) | (573 | ) | |||||
Property and equipment |
(8,118 | ) | (5,225 | ) | |||||
Total deferred tax liability |
(54,454 | ) | (23,012 | ) | |||||
Net deferred tax (liability) asset |
$ |
(14,260 |
) |
$ |
8,814 |
||||
The previous years' sale of operating units generated a net capital loss. We evaluated our ability to use the capital loss by offsetting it with capital gains. As a result, a valuation allowance of $28.3 million ($11.3 million, tax-effected) has been placed against the capital loss carry-forward. The capital losses can be carried forward for five years and will expire in fiscal 2010 and 2011. We have performed an assessment of positive and negative evidence regarding the realization of the other deferred tax assets. This assessment included the evaluation of scheduled reversals of deferred tax liabilities, availability of carry-backs, and estimates of projected future taxable income. Although realization is not assured, based on our assessment, we have concluded that it is more likely than not that the assets other than the capital loss carry-forwards will be realized. As such, no additional valuation allowance has been provided.
On October 1, 2007, we adopted authoritative guidance on accounting for uncertainty in income taxes and did not record any cumulative effect adjustment to retained earnings as a result of this
85
TETRA TECH, INC.
NOTES TO CONSOLIDATED FINANCIAL STATEMENTS (Continued)
6. Income Taxes (Continued)
adoption. As of September 27, 2009, we had $20.5 million of unrecognized tax benefits. Included in the balance of unrecognized tax benefits at the end of fiscal year 2009 were $15.4 million of tax benefits that, if recognized, would affect our effective tax rate. A reconciliation of the beginning and ending amount of unrecognized tax benefits is as follows:
| |
Fiscal Year Ended | ||||||
|---|---|---|---|---|---|---|---|
| |
September 27, 2009 |
September 28, 2008 |
|||||
| |
(in thousands) |
||||||
Beginning balance |
$ | 38,912 | $ | 32,080 | |||
Additions for current year tax positions |
7,306 | 23,509 | |||||
Additions for prior year tax positions |
9,208 | — | |||||
Reductions for prior year tax positions |
(24,955 | ) | (16,677 | ) | |||
Settlements |
(9,941 | ) | — | ||||
Ending balance |
$ | 20,530 | $ | 38,912 | |||
Upon the adoption of the guidance, we chose to recognize potential interest and penalties related to unrecognized tax benefits in income tax expense. The amount of interest expense (net of interest income) accrued as of September 27, 2009 was $3.7 million.
7. Long-Term Obligations
Long-term obligations consisted of the following:
| |
Fiscal Year Ended | |||||||
|---|---|---|---|---|---|---|---|---|
| |
September 27, 2009 |
September 28, 2008 |
||||||
| |
(in thousands) |
|||||||
Credit facility |
$ | — | $ | 45,000 | ||||
Other |
10,850 | 12,218 | ||||||
Total long-term obligations |
10,850 | 57,218 | ||||||
Less: Current portion of long-term obligations |
(4,320 |
) |
(3,926 |
) |
||||
Long-term obligations, less current portion |
$ |
6,530 |
$ |
53,292 |
||||
Under our credit agreement, we have a revolving credit facility amounting to $300.0 million, and the term of the agreement is through March 30, 2012. As part of the Facility, we may request financial letters of credit up to the aggregate sum of $50.0 million and standby letters of credit up to the full amount of the Facility. In May 2008 and January 2009, we entered into amendments to the credit agreement solely to provide additional flexibility and to clarify certain administrative matters with respect to potential future acquisitions. As of September 27, 2009, we had no outstanding borrowings, $13.0 million in standby letters of credit and $287.0 million in availability under the Facility.
86
TETRA TECH, INC.
NOTES TO CONSOLIDATED FINANCIAL STATEMENTS (Continued)
7. Long-Term Obligations (Continued)
The credit agreement requires us to comply with various financial and operating covenants. Specifically, (i) the maximum consolidated leverage ratio (defined as the ratio of funded debt to rolling four-quarter adjusted EBITDA) is 2.50x for each quarter, and (ii) the minimum fixed charge coverage ratio (defined as the ratio of rolling four-quarter EBITDA minus capital expenditures to interest expense plus taxes and principal payments) is 1.25x for each quarter. As of September 27, 2009, our consolidated leverage ratio was 0.20x, and our fixed charge coverage ratio was 2.34x. Further, the credit agreement contains other restrictions, including but not limited to, the creation of liens and the payment of dividends on our capital stock (other than stock dividends). Borrowings under the credit agreement are collateralized by our accounts receivable, the stock of our significant subsidiaries and our cash, deposit accounts, investment property and financial assets. As of September 27, 2009, we met all compliance requirements of these covenants.
Other obligations include capital leases of $3.0 million and $2.6 million in fiscal 2009 and 2008, respectively. In connection with our DGI acquisition, fiscal 2009 and 2008 included $4.3 million and $6.2 million of guaranteed deferred cash payments, respectively. The remaining other obligations consisted of property and equipment loans for $3.5 million and $3.4 million in fiscal 2009 and 2008, respectively.
The following table presents scheduled maturities of our long-term obligations:
| |
Amount | |||
|---|---|---|---|---|
| |
(in thousands) |
|||
2010 |
$ | 4,320 | ||
2011 |
5,422 | |||
2012 |
716 | |||
2013 |
264 | |||
2014 |
128 | |||
Beyond |
— | |||
In December 2006, we retired our senior secured notes and paid off the remaining principal balance of $72.9 million. In connection with this debt retirement, we incurred pre-payment premiums of $3.1 million and expensed the remaining unamortized deferred financing costs of $1.1 million in the first quarter of fiscal 2007. We reported an aggregate charge of $4.2 million as part of our income from continuing operations.
8. Stockholders' Equity and Stock Compensation Plans
As of September 27, 2009, we had the following share-based compensation plans:
- •
- 1992 Incentive Stock Plan. Key employees were granted
options to purchase an aggregate of 7,202,147 shares of our common stock. The 1992 Incentive Stock Plan was terminated in December 2002, except as to the outstanding options. These options
became exercisable one year from the date of grant, became fully vested no later than five years, and expire no later than ten years from the date of grant.
- •
- 1992 Stock Option Plan for Non-Employee Directors. Non-employee directors were granted options to purchase an aggregate of 178,808 shares of our common stock at prices not less than
87
TETRA TECH, INC.
NOTES TO CONSOLIDATED FINANCIAL STATEMENTS (Continued)
8. Stockholders' Equity and Stock Compensation Plans (Continued)
- •
- 2003 Outside Director Stock Option
Plan. Non-employee directors may be granted options to purchase an aggregate of up to 400,000 shares of our common stock at
prices not less than 100% of the market value on the date of grant. Exercise prices of all options granted were at the market value on the date of grant. These options vest and become exercisable on
the first anniversary of the date of grant if the director has not ceased to be a director prior to such date, and expire no later than ten years from the grant date.
- •
- 2005 Equity Incentive Plan. Key employees may be granted
options to purchase an aggregate of 6,086,216 shares of our common stock. This plan amended, restated and renamed the 2002 Stock Option Plan. Options granted before March 6, 2006 vest at 25% on
the first anniversary of the grant date, and the balance vests monthly thereafter, such that these options become fully vested no later than four years from the date of grant. These options expire no
later than ten years from the date of grant. Options granted on and after March 6, 2006 vest at 25% on each anniversary of the grant date. These options expire no later than eight years from
the grant date.
- •
- Restricted Stock Program. In accordance with our Executive
Compensation Policy, our Compensation Committee may grant long-term incentive awards in the form of restricted stock issued under the 2005 Equity Incentive Plan. Restricted stock grants
will generally vest over a minimum three-year period, and may be either performance-based, determined by EPS growth, or service-based. Restricted stock will typically not be granted to
employees who are not executive officers. Under our current policy for non-employee director compensation, restricted stock will be granted to non-employee directors.
- •
- Employee Stock Purchase Plan ("ESPP"). Purchase rights to purchase common stock are granted to our eligible full and part-time employees, and shares of common stock are issued upon exercise of the purchase rights. An aggregate of 2,373,290 shares may be issued pursuant to such exercise. The maximum amount that an employee can contribute during a purchase right period is $5,000. The exercise price of a purchase right is the lesser of 100% of the fair market value of a share of common stock on the first day of the purchase right period or 85% of the fair market value on the last day of the purchase right period (calendar year).
100% of market value on the date of grant. This plan was terminated in December 2002, except as to the outstanding options. Exercise prices of all options granted were at market value on the date of grant. These options are fully vested and expire no later than ten years from the date of grant.
The stock-based compensation and related income tax benefits were as follows:
| |
Fiscal Year Ended | ||||||||||
|---|---|---|---|---|---|---|---|---|---|---|---|
| |
September 27, 2009 |
September 28, 2008 |
September 30, 2007 |
||||||||
| |
(in thousands) |
||||||||||
Total stock-based compensation |
$ | 9,392 | $ | 8,296 | $ | 5,763 | |||||
Income tax benefit related to stock-based compensation |
(3,796 | ) | (3,328 | ) | (2,290 | ) | |||||
Stock-based compensation, net of tax benefit |
$ | 5,596 | $ | 4,968 | $ | 3,473 | |||||
88
TETRA TECH, INC.
NOTES TO CONSOLIDATED FINANCIAL STATEMENTS (Continued)
8. Stockholders' Equity and Stock Compensation Plans (Continued)
Stock option activity for the fiscal year ended September 27, 2009 was as follows:
| |
Number of Options (in thousands) |
Weighted- Average Exercise Price per Share |
Weighted- Average Remaining Contractual Term (in years) |
Aggregate Intrinsic Value (in thousands) |
||||||||||
|---|---|---|---|---|---|---|---|---|---|---|---|---|---|---|
Outstanding on September 28, 2008 |
4,763 | $ | 18.90 | |||||||||||
Granted |
1,037 | 17.27 | ||||||||||||
Exercised |
(1,167 | ) | 17.32 | |||||||||||
Cancelled |
(140 | ) | 19.79 | |||||||||||
Outstanding as of September 27, 2009 |
4,493 | $ | 18.92 | 5.3 | $ | 30,607 | ||||||||
Vested or expected to vest as of September 27, 2009 |
4,232 |
$ |
18.89 |
5.2 |
$ |
28,949 |
||||||||
Exercisable on September 27, 2009 |
2,303 |
$ |
18.57 |
4.9 |
$ |
16,507 |
||||||||
The aggregate intrinsic value in the table above represents the total intrinsic value (the difference between our closing stock price on the last trading day of fiscal 2009 and the exercise price, times the number of shares) that would have been received by the in-the-money option holders if they had exercised their options on September 27, 2009. This amount will change based on the fair market value of our stock. As of September 27, 2009, we expect to recognize $11.5 million of unrecognized compensation cost related to stock option grants over a weighted-average period of 2.3 years.
The weighted-average fair value of stock options granted during fiscal 2009, 2008 and 2007 was $7.60, $8.94 and $7.24, respectively. The aggregate intrinsic value of options (the amount by which the market price of the stock on a specific valuation date exceeded the market price of the stock on the date of grant) exercised during fiscal 2009, 2008 and 2007 was $13.2 million, $11.6 million and $4.0 million, respectively.
The fair value of our stock options was estimated on the date of grant using the Black-Scholes option pricing model. The following assumptions were used in the calculation:
| |
Fiscal Year Ended | |||||
|---|---|---|---|---|---|---|
| |
September 27, 2009 |
September 28, 2008 |
September 30, 2007 |
|||
Dividend yield |
— | — | — | |||
Expected stock price volatility |
48.8% | 37.0% - 39.4% | 37.7% - 39.8% | |||
Risk-free rate of return, annual |
1.6 - 2.6% | 2.5% - 4.2% | 4.4% - 4.9% | |||
Expected life (in years) |
4.4 - 5.6 | 4.3 - 5.5 | 4.5 - 5.6 | |||
For purposes of the Black-Scholes model, forfeitures were estimated based on historical experience. For the fiscal years ended September 27, 2009, September 28, 2008 and September 30, 2007, we based our expected stock price volatility on historical volatility behavior and current implied volatility behavior. Our risk-free rate of return was based on constant maturity rates provided by the U.S. Treasury. The expected life was based on historical experience.
89
TETRA TECH, INC.
NOTES TO CONSOLIDATED FINANCIAL STATEMENTS (Continued)
8. Stockholders' Equity and Stock Compensation Plans (Continued)
Net cash proceeds from the exercise of stock options were $20.3 million, $20.7 million and $7.6 million for fiscal 2009, 2008 and 2007, respectively. Our policy is to issue shares from our authorized shares upon the exercise of stock options. The actual income tax benefit realized from exercises of nonqualified stock options and disqualifying dispositions of qualified options for fiscal 2009, 2008 and 2007 was $5.7 million, $4.8 million and $1.3 million, respectively.
The following table summarizes shares purchased, weighted-average purchase price, cash received, and the aggregate intrinsic value for shares purchased under the ESPP:
| |
Fiscal Year Ended | ||||||
|---|---|---|---|---|---|---|---|
| |
September 27, 2009 |
September 28, 2008 |
|||||
| |
($ in thousands, except for share purchase) |
||||||
Shares purchased |
163 | 146 | |||||
Weighted-average purchase price |
$ | 20.53 | $ | 17.86 | |||
Cash received from exercise of purchase rights |
$ | 3,343 | $ | 2,626 | |||
Aggregate intrinsic value |
$ | 590 | $ | 532 | |||
No shares were purchased under the ESPP during fiscal 2007.
The grant date fair value of each award granted under the ESPP was estimated using the Black-Scholes option pricing model with the following assumptions:
| |
Fiscal Year Ended | |||||||||
|---|---|---|---|---|---|---|---|---|---|---|
| |
September 27, 2009 |
September 28, 2008 |
September 30, 2007 |
|||||||
Dividend yield |
— | — | — | |||||||
Expected stock price volatility |
68.2 | % | 36.3 | % | 30.7 | % | ||||
Risk-free rate of return, annual |
0.4 | % | 3.3 | % | 4.9 | % | ||||
Expected life (in years) |
1 | 1 | 1 | |||||||
For fiscal 2009, 2008 and 2007, we based our expected stock price volatility on historical volatility behavior and current implied volatility behavior. The risk-free rate of return was based on constant maturity rates provided by the U.S. Treasury. The expected life was based on the ESPP terms and conditions.
Included in stock-based compensation expense for fiscal 2009, 2008 and 2007 was a charge of $1.0 million, $0.5 million and $0.3 million, respectively, related to the ESPP. The unrecognized stock-based compensation costs for awards granted under the ESPP for fiscal 2009 and 2008 were $0.2 million and $0.1 million for each period, respectively. As of September 27, 2009, ESPP participants had accumulated $3.0 million to purchase our common stock.
Restricted Stock Program
In fiscal 2009, 72,200 shares of restricted stock were awarded to certain of our executive officers. Of these awards, 62,200 are performance-based and vest over a three-year period. The number of shares that ultimately vest is based on the growth in our earnings per share. The balance of 10,000
90
TETRA TECH, INC.
NOTES TO CONSOLIDATED FINANCIAL STATEMENTS (Continued)
8. Stockholders' Equity and Stock Compensation Plans (Continued)
shares of restricted stock are time-based, dependent on employment with us, and vest over a four-year period.
In fiscal 2008, 85,400 shares of restricted stock were awarded to certain of our executive officers. Of these awards, 65,400 shares are performance-based and vest over a three-year period. The number of shares that ultimately vest is based on the growth in our earnings per share. The balance of 20,000 shares of restricted stock are time-based, dependent on employment with us, and vest over a four-year period.
In fiscal 2007, 124,500 shares of restricted stock were awarded to certain of our executive officers. Of these awards, 51,500 are performance-based and vest over a three-year period. The number of shares that ultimately vest is based on the growth in our earnings per share. The balance of 73,000 shares of restricted stock are time-based, dependent on employment with us, and vest over a three-year period.
The fair value of the restricted stock grants was based upon the market price of the underlying common stock as of the date of grant. Restricted stock grants are amortized over their applicable vesting period using the straight-line method.
Activity in the restricted stock program for the fiscal year ended September 27, 2009 was as follows:
| |
Number of Shares (in thousands) |
Weighted- Average Grant Date Fair Value |
Weighted- Average Remaining Contractual Term (in years) |
Aggregate Intrinsic Value (in thousands) |
||||||||||
|---|---|---|---|---|---|---|---|---|---|---|---|---|---|---|
Nonvested balance as of September 28, 2008 |
172 | $ | 20.55 | 1.6 | $ | 850 | ||||||||
Granted |
72 | 16.98 | ||||||||||||
Vested |
(73 | ) | 19.71 | |||||||||||
Forfeited |
— | |||||||||||||
Nonvested balance as of September 27, 2009 |
171 | $ | 19.40 | 1.5 | $ | 1,083 | ||||||||
Vested or expected to vest as of September 27, 2009 |
171 |
$ |
19.40 |
1.5 |
$ |
1,083 |
||||||||
The aggregate intrinsic value in the table above represents the total pre-tax intrinsic value (the difference between our closing stock price on the last trading day of fiscal 2009 and the exercise price, times the number of shares) that would have been received if the restricted stock had vested on September 27, 2009. The aggregate intrinsic value of the restricted stock (the amount by which the market price of the stock on the vesting date exceeded the market price of the stock on the date of grant) vested during fiscal 2009 was $0.
As of September 27, 2009, there was $2.1 million of unrecognized compensation costs related to the restricted stock program to be recognized over a weighted-average period of 1.4 years. The stock-based compensation expense related to the restricted stock program for fiscal years 2009, 2008 and 2007 was $2.0 million, $1.5 million and $0.7 million, respectively, and was included in the total stock-based compensation expense.
91
TETRA TECH, INC.
NOTES TO CONSOLIDATED FINANCIAL STATEMENTS (Continued)
9. Earnings Per Share
Basic EPS is computed by dividing net income available to common stockholders by the weighted-average number of common shares outstanding, less unvested restricted stock for the period. Diluted EPS is computed by dividing net income by the weighted-average number of common shares outstanding and dilutive potential common shares for the period. Potential common shares include the weighted-average dilutive effects of outstanding stock options and unvested restricted stock using the treasury stock method.
As of September 27, 2009, 171,161 shares of restricted stock issued to employees were unvested, and therefore were excluded from the calculation of basic EPS for the fiscal year ended September 27, 2009.
The following table sets forth the number of weighted-average shares used to compute basic and diluted EPS:
| |
Fiscal Year Ended | ||||||||||
|---|---|---|---|---|---|---|---|---|---|---|---|
| |
September 27, 2009 |
September 28, 2008 |
September 30, 2007 |
||||||||
| |
(in thousands, except per share data) |
||||||||||
Net income |
$ | 87,028 | $ | 60,906 | $ | 46,353 | |||||
Denominator for basic earnings per share |
60,135 |
58,813 |
57,948 |
||||||||
Denominator for diluted earnings per share: |
|||||||||||
Denominator for basic earnings per share |
60,135 | 58,813 | 57,948 | ||||||||
Potential common shares—stock options and unvested restricted stock |
859 | 819 | 605 | ||||||||
Denominator for diluted earnings per share |
60,994 | 59,632 | 58,553 | ||||||||
Earnings per share: |
|||||||||||
Basic |
$ | 1.45 | $ | 1.04 | $ | 0.80 | |||||
Diluted |
$ | 1.43 | $ | 1.02 | $ | 0.79 | |||||
For fiscal 2009, 2008 and 2007, 1.3 million, 1.5 million and 3.9 million options were excluded from the calculation of dilutive potential common shares, respectively. These options were not included in the computation of dilutive potential common shares because the assumed proceeds per share exceeded the average market price per share for that period. Therefore, their inclusion would have been anti-dilutive.
92
TETRA TECH, INC.
NOTES TO CONSOLIDATED FINANCIAL STATEMENTS (Continued)
10. Leases
We lease office and field equipment, vehicles and buildings under various operating leases. In fiscal 2009, 2008 and 2007, we recognized $58.9 million, $47.7 million and $48.0 million of expense associated with operating leases, respectively. Amounts payable under non-cancelable operating and capital lease commitments are as follows during the following fiscal years:
| |
Operating | Capital | ||||||
|---|---|---|---|---|---|---|---|---|
| |
(in thousands) |
|||||||
2010 |
$ | 47,879 | $ | 1,122 | ||||
2011 |
38,846 | 905 | ||||||
2012 |
32,548 | 628 | ||||||
2013 |
23,214 | 224 | ||||||
2014 |
16,254 | 128 | ||||||
Beyond |
16,155 | — | ||||||
Total |
$ | 174,896 | 3,007 | |||||
Less: Imputed interest |
(141 |
) |
||||||
Net present value |
$ | 2,866 | ||||||
We calculated the above imputed interest using the historical weighted-average borrowing interest rate of 2.32%.
11. Retirement Plans
We and our subsidiaries have established defined contribution plans including 401(k) plans. Generally, employees are eligible to participate in the defined contribution plans upon completion of one year of service and in the 401(k) plans upon commencement of employment. For fiscal 2009, 2008 and 2007, employer contributions related to the plans were $13.6 million, $17.4 million and $13.3 million, respectively.
We have established a non-qualified deferred compensation plan (the "Deferred Compensation Plan") for certain key employees and non-employee directors. Eligible employees and non-employee directors may elect to defer receipt of salary, incentive payments and Board of Directors' fees, which are generally invested by us in individual variable life insurance contracts we own that are designed to informally fund savings plans of this nature. As of September 27, 2009 and September 28, 2008, the consolidated balance sheet reflects assets of $6.3 million and $4.0 million, respectively, related to the Deferred Compensation Plan in "Other assets", and liabilities of $6.2 million and $3.8 million, respectively, related to the Deferred Compensation Plan in "Other long-term liabilities".
12. Pension Plan
In connection with the Wardrop acquisition, we assumed the assets and obligations under Wardrop's defined benefit pension plan, which primarily covered a group of active and inactive employees and a limited number of retirees. No new employees are eligible to participate in this plan. Pursuant to the Wardrop purchase agreement, Wardrop agreed to terminate this plan as soon as practical. Further, an escrow account was established under the purchase agreement to fully fund the defined benefit pension settlement liability and all post-closing expenses. We assumed the initial net liability of approximately $5.7 million (net of plan assets of approximately $11.3 million) as of the
93
TETRA TECH, INC.
NOTES TO CONSOLIDATED FINANCIAL STATEMENTS (Continued)
12. Pension Plan (Continued)
acquisition date. Through September 27, 2009, Wardrop purchased insurance annuities for existing pensioners and inactive employees, and settled the obligations with these participants for approximately $12.4 million. This amount was paid with plan assets and a portion of funds from the purchase agreement escrow account. The remaining net liability for active employees was estimated to be approximately $1.7 million (net of remaining plan assets of approximately $3.5 million) which is reported as part of "Other current liabilities" on our consolidated balance sheet as of September 27, 2009. There is a corresponding asset related to the escrow account that is reported as part of our "Prepaid expenses and other current assets" on our consolidated balance sheet as of September 27, 2009. We expect final settlement and plan termination to occur in fiscal 2010. The net periodic benefit expense for fiscal year ended September 27, 2009 was immaterial.
13. Comprehensive Income
Comprehensive income is comprised of net income and other comprehensive income, which includes translation gains and losses from foreign subsidiaries with functional currencies different than our reporting currency. The following summarizes our comprehensive income:
| |
Fiscal Year Ended | ||||||||||
|---|---|---|---|---|---|---|---|---|---|---|---|
| |
September 27, 2009 |
September 28, 2008 |
September 30, 2007 |
||||||||
| |
(in thousands) |
||||||||||
Net income |
$ | 87,028 | $ | 60,906 | $ | 46,533 | |||||
Other comprehensive income: |
|||||||||||
Foreign currency translation gain (loss) |
12,211 | 52 | (38 | ) | |||||||
Total comprehensive income |
$ | 99,239 | $ | 60,958 | $ | 46,315 | |||||
14. Commitments and Contingencies
We are subject to certain claims and lawsuits typically filed against the engineering, consulting and construction profession, alleging primarily professional errors or omissions. We carry professional liability insurance, subject to certain deductibles and policy limits, against such claims. However, in some actions, parties are seeking damages that exceed our insurance coverage or for which we are not insured. While management does not believe that the resolution of these claims will have a material adverse effect on our financial position, results of operations or cash flows, management acknowledges the uncertainty surrounding the ultimate resolution of these matters.
In May 2003, ITC filed a lawsuit in Montgomery County, Ohio against AMT and other defendants for misappropriation of trade secrets, among other claims. In June 2004, we purchased all the outstanding shares of AMT. As part of the purchase agreement, the former owners of AMT agreed to indemnify us for all costs and damages related to this lawsuit. In December 2007, the case went to trial and the jury awarded $5.8 million in compensatory damages against AMT. In addition, the jury awarded $17 million in punitive damages against AMT plus reasonable attorneys fees. In July 2008, the Common Pleas Court of Montgomery County denied AMT's motion for judgment notwithstanding the verdict and conditionally denied AMT's motion for a new trial. Further, the court remitted the verdict to $2.0 million in compensatory damages and $5.8 million in punitive damages. ITC accepted the remittitur, and AMT appealed. The appellate court remanded the matter to the trial court for ruling
94
TETRA TECH, INC.
NOTES TO CONSOLIDATED FINANCIAL STATEMENTS (Continued)
14. Commitments and Contingencies (Continued)
on ITC's motion for prejudgment interest and attorneys' fees. The trial court has not yet ruled on ITC's motion. We expect that appeals will follow the court's ruling. We believe that a reasonably possible range of exposure, including our attorneys' fees, is from $0 to approximately $14.5 million. As of September 27, 2009, we have recorded a liability representing our best estimate of a probable loss. Further, for the same amount, we have recorded a receivable from the former owners of AMT as we believe it is probable they will fully honor their indemnification agreement with us for any and all costs and damages related to this lawsuit.
15. Reportable Segments
In the first quarter of fiscal 2009, we began reporting under four new reportable segments with reclassification of the prior year segment results to conform to the new basis of presentation. Each of the new reportable segments is comprised of similar activities that focus on the services it provides, the markets it serves, the distribution method of its services, its contracting mechanisms, the organization and execution of its projects, the education and discipline of its workforce, and the metrics by which its client projects and staff are measured. In addition, each of our operating groups, which are also our reportable segments, is managed by its own president, who has responsibility for the segment's reporting units. Each president directly reports to our Chief Executive Officer, who is our CODM. The CODM regularly reviews the four reportable segments, allocates resources to these segments and assesses each segment's performance. The reportable segments are as follows:
Environmental Consulting Services. ECS provides front-end science and consulting services and project management in the areas of water resources, groundwater services, watershed management, mining and geotechnical sciences, environmental management, and information technology and modeling consulting.
Technical Support Services. TSS advises clients through the study, design and implementation of projects. TSS conducts research in the areas of remedial planning, disaster management, sustainable solutions including climate change and carbon management, technical government staffing services, and program management for complex U.S. federal government and international development projects.
Engineering and Architecture Services. EAS provides engineering and architecture design services, including LEED services, together with technical and program administration services for projects related to water infrastructure, buildings and land development, and transportation.
Remediation and Construction Management. RCM provides a wide array of services, including program management, engineering, procurement and construction, construction management, and operations and maintenance. RCM is focused on federal construction, environmental remediation including UXO and wetland restoration, energy projects including wind, nuclear engineering and other alternative energies, and communications development and construction.
Management evaluates the performance of these reportable segments based upon their respective income from operations before the effect of amortization expense related to acquisitions and other unallocated corporate expenses. We account for inter-segment sales and transfers as if the sales and transfers were to third parties; that is, by applying a negotiated fee onto the costs of the services performed. All intercompany balances and transactions are eliminated in consolidation.
95
TETRA TECH, INC.
NOTES TO CONSOLIDATED FINANCIAL STATEMENTS (Continued)
15. Reportable Segments (Continued)
The following tables set forth summarized financial information concerning our reportable segments:
Reportable Segments:
| |
ECS | TSS | EAS | RCM | Total | |||||||||||
|---|---|---|---|---|---|---|---|---|---|---|---|---|---|---|---|---|
| |
(in thousands) |
|||||||||||||||
| Fiscal year ended September 27, 2009: | |
|
|
|
|
|||||||||||
Revenue |
$ | 601,317 | $ | 522,748 | $ | 299,691 | $ | 951,604 | $ | 2,375,360 | ||||||
Revenue, net of subcontractor costs |
443,401 | 314,885 | 234,841 | 393,010 | 1,386,137 | |||||||||||
Gross profit |
81,098 | 63,405 | 46,938 | 86,184 | 277,625 | |||||||||||
Segment income from operations |
47,095 | 37,584 | 13,599 | 38,156 | 136,434 | |||||||||||
Depreciation expense |
3,819 | 712 | 2,197 | 7,811 | 14,539 | |||||||||||
Fiscal year ended September 28, 2008: |
||||||||||||||||
Revenue |
$ | 500,006 | $ | 440,155 | $ | 319,435 | $ | 966,369 | $ | 2,225,965 | ||||||
Revenue, net of subcontractor costs |
348,374 | 279,327 | 259,393 | 358,451 | 1,245,545 | |||||||||||
Gross profit |
68,941 | 52,320 | 50,006 | 82,920 | 254,187 | |||||||||||
Segment income from operations |
39,641 | 30,567 | 18,809 | 32,638 | 121,655 | |||||||||||
Depreciation expense |
2,282 | 883 | 2,199 | 5,778 | 11,142 | |||||||||||
Fiscal year ended September 30, 2007: |
||||||||||||||||
Revenue |
$ | 421,337 | $ | 222,095 | $ | 294,764 | $ | 676,985 | $ | 1,615,181 | ||||||
Revenue, net of subcontractor costs |
302,671 | 178,738 | 237,500 | 294,006 | 1,012,915 | |||||||||||
Gross profit |
57,769 | 35,365 | 49,935 | 57,576 | 200,645 | |||||||||||
Segment income from operations |
29,680 | 17,936 | 18,866 | 20,664 | 87,146 | |||||||||||
Depreciation expense |
1,928 | 940 | 1,933 | 4,890 | 9,691 | |||||||||||
Total assets by segment were as follows:
| |
September 27, 2009 |
September 28, 2008 |
September 30, 2007 |
||||||||
|---|---|---|---|---|---|---|---|---|---|---|---|
| |
(in thousands) |
||||||||||
ECS |
$ | 486,002 | $ | 314,331 | $ | 270,340 | |||||
TSS |
223,177 | 205,981 | 135,353 | ||||||||
EAS |
91,646 | 92,886 | 78,873 | ||||||||
RCM |
351,247 | 368,452 | 263,600 | ||||||||
Total assets |
$ | 1,152,072 | $ | 981,650 | $ | 748,166 | |||||
96
TETRA TECH, INC.
NOTES TO CONSOLIDATED FINANCIAL STATEMENTS (Continued)
15. Reportable Segments (Continued)