Attached files
| file | filename |
|---|---|
| 8-K - FORM 8-K - IBERIABANK CORP | d8k.htm |
| EX-99.1 - EXHIBIT 99.1 - IBERIABANK CORP | dex991.htm |
 Acquisition of Orion Bank and Century Bank, FSB Supplemental Materials November 13, 2009 Exhibit 99.2 |
 2 Forward Looking Statements Forward Looking Statements Safe Harbor Safe Harbor Statements contained in this presentation which are Statements contained in this presentation which are not historical facts and which pertain to future not historical facts and which pertain to future operating results of IBERIABANK Corporation and its operating results of IBERIABANK Corporation and its subsidiaries constitute “forward-looking statements” subsidiaries constitute “forward-looking statements” within the meaning of the Private Securities Litigation within the meaning of the Private Securities Litigation Reform Act of 1995. These forward-looking Reform Act of 1995. These forward-looking statements involve significant risks and uncertainties. statements involve significant risks and uncertainties. Actual results may differ materially from the results Actual results may differ materially from the results discussed in these forward-looking statements. discussed in these forward-looking statements. Factors that might cause such a difference include, Factors that might cause such a difference include, but are not limited to, those discussed in the but are not limited to, those discussed in the Company’s periodic filings with the SEC. Company’s periodic filings with the SEC. |
 3 Strategic Opportunity Strategic Opportunity Transaction Overview Transaction Overview IBERIABANK Has Purchased Certain Assets And Assumed IBERIABANK Has Purchased Certain Assets And Assumed Certain Liabilities From The FDIC As Receiver Of Both Certain Liabilities From The FDIC As Receiver Of Both Orion Bank And Century Bank, FSB Orion Bank And Century Bank, FSB Assumed $3.1 Billion Of Total Assets; $2.5 of Total Loans Assumed $3.1 Billion Of Total Assets; $2.5 of Total Loans Billion (Before Loan Discount And FDIC Receivables) Billion (Before Loan Discount And FDIC Receivables) All Loans Covered By FDIC Loss Protection All Loans Covered By FDIC Loss Protection No Holding Company Assets Or Liabilities Were Included No Holding Company Assets Or Liabilities Were Included All Required Approvals Were Received And The All Required Approvals Were Received And The Transaction Has Closed Transaction Has Closed Branches Will Be Open For Business On Saturday, Branches Will Be Open For Business On Saturday, November 14 And Monday, November 16 November 14 And Monday, November 16 |
 4 Strategic Opportunity Strategic Opportunity IBKC in Florida IBKC in Florida Focused Primarily On Urban And Suburban Markets Focused Primarily On Urban And Suburban Markets Deploy Full Product Set – Deploy Full Product Set – Private Banking, Wealth Private Banking, Wealth Management, Consumer, Credit Card, and Small Business Management, Consumer, Credit Card, and Small Business FDIC-Assisted Transactions Provide Distribution and FDIC-Assisted Transactions Provide Distribution and Deposits With Limited Credit Risk From Acquired Assets Deposits With Limited Credit Risk From Acquired Assets IBKC’s Ability To Recruit Top Talent Provides A Strategic IBKC’s Ability To Recruit Top Talent Provides A Strategic Advantage In Markets Where We Deploy Commercial Market Advantage In Markets Where We Deploy Commercial Market Strategy Strategy In Those Commercial Oriented Markets, Our Successful In Those Commercial Oriented Markets, Our Successful Business Model And The Evolving Banking Environment Business Model And The Evolving Banking Environment Will Produce Future Lending Opportunities Over Time Will Produce Future Lending Opportunities Over Time Consistent With Our Credit Culture Consistent With Our Credit Culture |
 5 Our Markets Our Markets Distribution System Distribution System |
 6 Our Markets Our Markets Distribution System – Distribution System – SW Florida SW Florida |
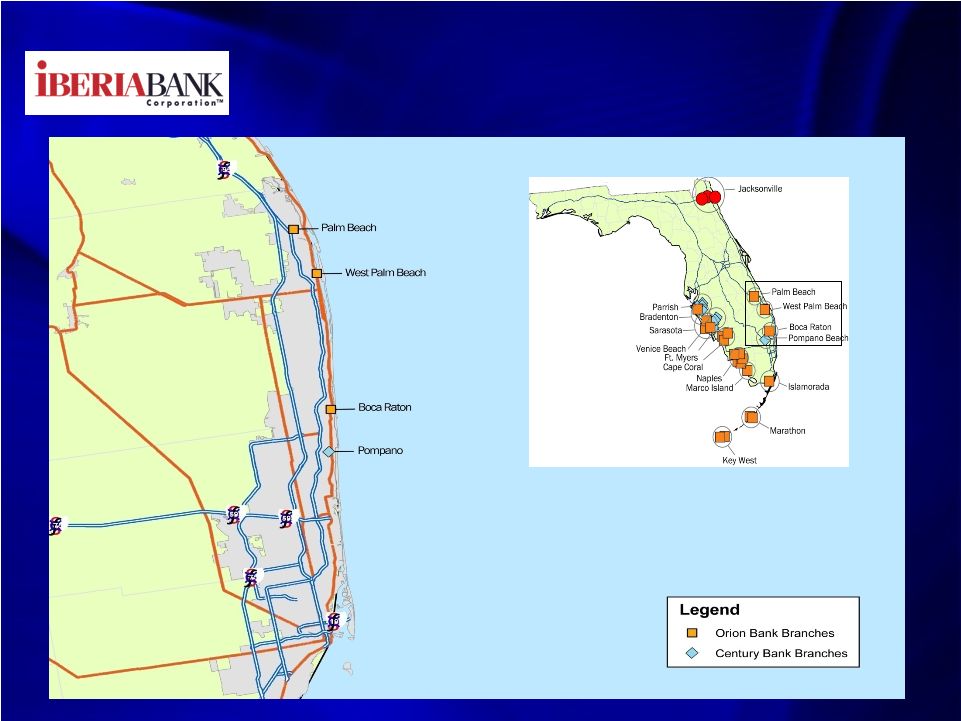 7 Our Markets Our Markets Distribution System – Distribution System – SE Florida Coast SE Florida Coast |
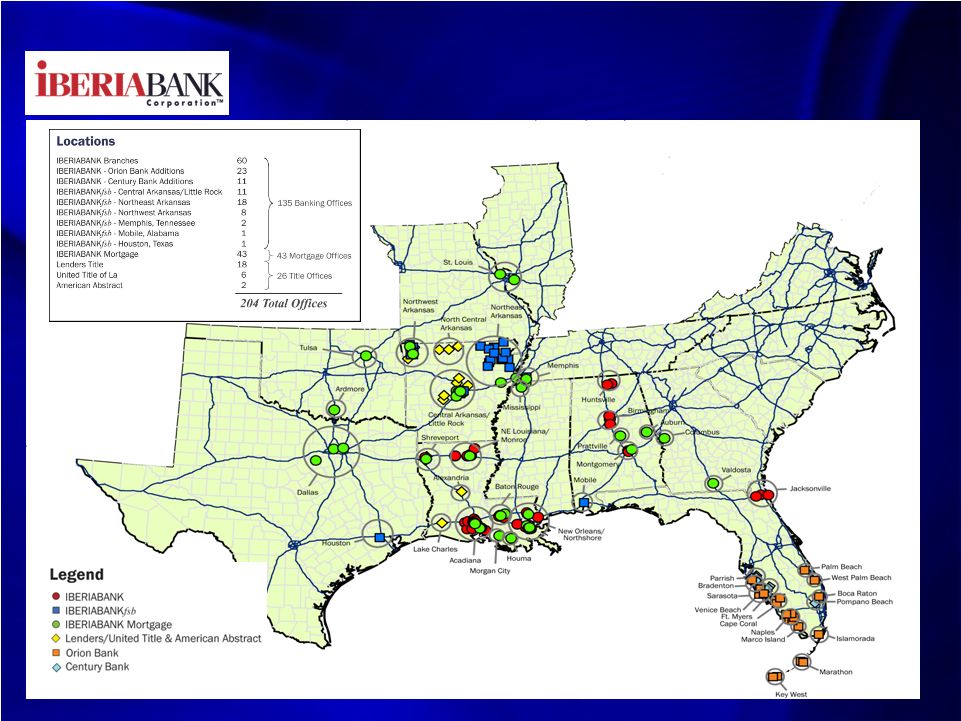
  8 IBERIABANK IBERIABANK Our Markets By State Our Markets By State Deposit data as of September 30, 2009 • 204 IBKC Offices Operating in 11 States • 135 Banking Offices • 43 Mortgage Offices • 26 Title Offices • Acquisitions of Orion Bank and Century Bank Make Florida IBKC’s Second Largest Deposit Market State Rank Branches Deposits Louisiana 5 50 3,207,116 $ Florida 20 37 2,568,801 Arkansas 12 37 984,601 Alabama 23 8 365,296 Tennessee 145 2 111,047 Texas na 1 414 135 7,237,275 $ IBERIABANK - TOTAL DEPOSITS BY STATE Louisiana 44% Florida 35% Arkansas 14% Alabama 5% Tennessee 2% |
 9 IBERIABANK IBERIABANK Florida Market Share Florida Market Share Rank Company Branches Deposits Mkt Share % 1 Bank of America Corp. (NC) 664 72,758,277 18.52 2 Wells Fargo & Co. (CA) 721 64,256,750 16.36 3 SunTrust Banks Inc. (GA) 567 39,902,616 10.16 4 Regions Financial Corp. (AL) 426 17,449,995 4.44 5 BB&T Corp. (NC) 307 16,447,119 4.19 6 JPMorgan Chase & Co. (NY) 240 10,765,960 2.74 7 Citigroup Inc. (NY) 52 8,915,841 2.27 8 BU Financial Corp. (FL) 85 8,303,473 2.11 9 Fifth Third Bancorp (OH) 167 7,609,986 1.94 10 PNC Financial Services Group (PA) 112 6,034,456 1.54 11 EverBank Financial (FL) 5 5,752,713 1.46 12 Northern Trust Corp. (IL) 30 5,071,085 1.29 13 AmTrust Financial Corporation (OH) 25 4,805,144 1.22 14 BankAtlantic Bancorp Inc. (FL) 101 4,076,885 1.04 15 Ocean Bankshares Inc. (FL) 21 4,043,670 1.03 16 Mercantil Servicios 15 3,807,862 0.97 17 Synovus Financial Corp. (GA) 61 3,441,333 0.88 18 HSBC Holdings plc 19 3,319,692 0.84 19 South Financial Group Inc. (SC) 67 3,060,065 0.78 20 IBERIABANK - Proforma 37 2,962,490 0.75 21 Riverside Banking Company (FL) 60 2,756,237 0.70 22 Caja Madrid 22 2,729,320 0.69 23 Royal Bank of Canada 88 2,685,447 0.68 24 TFS Financial Corp (MHC) (OH) 15 2,575,503 0.66 25 Orion Bancorp Inc. (FL) 23 2,140,184 0.54 55 Century Financial Group Inc. (FL) 11 689,740 0.18 215 IBERIABANK Corp. (LA) 3 132,566 0.03 Total For Institutions In Market 5,829 392,871,126 Florida - State Market Share • Existing IBKC = $132 Million in Deposits From Previous CapitalSouth Bank Acquisition • Acquisition of Orion Bank And Century Bank Will Add Approximately $2.7 Billion in Deposits • Resulting IBKC Franchise Will Hold The 20 th Ranked Market Share With $2.9 Billion in Deposits Source: SNL Financial – June 30, 2009 data |
 10 IBERIABANK IBERIABANK Florida Market Share - Florida Market Share - MSAs MSAs Source: SNL Financial – June 30, 2009 data Rank Company Branches Deposits Mkt Share % Rank Company Branches Deposits Mkt Share % 1 Fifth Third Bancorp (OH) 21 1,977,049 16.93 1 First State Bk of the FL Keys (FL) 11 534,275 24.00 2 Bank of America Corp. (NC) 17 1,571,101 13.45 2 TIB Financial Corp. (FL) 9 507,304 22.79 3 Wells Fargo & Co. (CA) 19 1,341,835 11.49 3 Bank of America Corp. (NC) 8 339,100 15.23 4 Orion Bancorp Inc. (FL) 7 1,260,813 10.79 4 Home BancShares Inc. (AR) 9 206,167 9.26 5 KeyCorp (OH) 1 688,091 5.89 5 Orion Bancorp Inc. (FL) 5 186,951 8.40 6 Regions Financial Corp. (AL) 14 557,421 4.77 6 BB&T Corp. (NC) 3 132,438 5.95 7 Bank of Florida Corp. (FL) 3 409,154 3.50 7 Gibraltar Private Bk & Tr Co. (FL) 1 112,830 5.07 8 Florida Community Banks Inc (FL) 3 406,445 3.48 8 Wells Fargo & Co. (CA) 2 100,020 4.49 9 BU Financial Corp. (FL) 3 369,138 3.16 9 Key West Bancgroup Inc. (FL) 1 61,076 2.74 10 Northern Trust Corp. (IL) 4 366,152 3.13 10 Cmnty Bk of South FL Inc. (FL) 2 46,290 2.08 Total For Institutions In Market 158 11,680,468 Total For Institutions In Market 51 Rank Company Branches Deposits Mkt Share % Rank Company 2,226,451 Mkt Braches Share % 1 Bank of America Corp. (NC) 38 3,675,155 20.34 1 Wells Fargo & Co. (CA) 37 1,854,458 15.22 2 Wells Fargo & Co. (CA) 33 3,005,570 16.63 2 Bank of America Corp. (NC) 30 1,752,328 14.38 3 SunTrust Banks Inc. (GA) 35 2,032,448 11.25 3 SunTrust Banks Inc. (GA) 27 1,579,773 12.97 4 BB&T Corp. (NC) 23 959,861 5.31 4 BB&T Corp. (NC) 23 1,086,516 8.92 5 IBERIABANK Pro Forma 14 928,434 5.14 5 Fifth Third Bancorp (OH) 19 943,784 7.75 6 Fifth Third Bancorp (OH) 16 726,759 4.02 6 First Citizens BancShares Inc. (NC) 4 466,307 3.83 7 Century Financial Group Inc. (FL) 10 648,985 3.59 7 Southwest FL Community Bancorp (FL) 10 432,720 3.55 8 Regions Financial Corp. (AL) 22 631,028 3.49 8 BU Financial Corp. (FL) 3 392,160 3.22 9 Marshall & Ilsley Corp. (WI) 11 579,170 3.21 9 Regions Financial Corp. (AL) 15 374,953 3.08 10 Northern Trust Corp. (IL) 4 489,394 2.71 10 TIB Financial Corp. (FL) 9 337,444 2.77 16 Orion Bancorp Inc. (FL) 4 279,449 1.55 17 Orion Bancorp Inc. (FL) 4 174,194 1.43 Total For Institutions In Market 329 18,069,727 Total For Institutions In Market 245 12,184,691 Rank Company Branches Deposits Mkt Share % Rank Company Branches Deposits Mkt Share % 1 Wells Fargo & Co. (CA) 225 26,035,757 17.04 1 Bank of America Corp. (NC) 37 13,793,482 38.81 2 Bank of America Corp. (NC) 209 24,658,473 16.14 2 Wells Fargo & Co. (CA) 60 6,057,486 17.05 3 SunTrust Banks Inc. (GA) 106 10,637,975 6.96 3 EverBank Financial (FL) 5 5,752,713 16.19 4 Citigroup Inc. (NY) 51 8,909,313 5.83 4 SunTrust Banks Inc. (GA) 33 1,748,971 4.92 5 JPMorgan Chase & Co. (NY) 130 7,617,076 4.99 5 Banco Bilbao Vizcaya Argent SA 25 1,141,779 3.21 6 BU Financial Corp. (FL) 61 5,840,902 3.82 6 Regions Financial Corp. (AL) 28 678,251 1.91 7 AmTrust Financial Corporation (OH) 22 4,709,336 3.08 7 Synovus Financial Corp. (GA) 7 496,856 1.40 8 Regions Financial Corp. (AL) 81 4,431,197 2.90 8 Fifth Third Bancorp (OH) 9 453,585 1.28 9 Ocean Bankshares Inc. (FL) 21 4,043,670 2.65 9 BB&T Corp. (NC) 15 435,577 1.23 10 BB&T Corp. (NC) 69 4,015,396 2.63 26 IBERIABANK Corp. (LA) 3 132,566 0.37 54 IBERIABANK Pro Forma 4 279,532 0.19 Total For Institutions In Market 328 35,537,013 59 Orion Bancorp Inc. (FL) 3 238,777 0.16 107 Century Financial Group Inc. (FL) 1 40,755 0.03 Total For Institutions In Market 1,660 152,799,523 Jacksonville, FL Naples-Marco Island, FL Bradenton-Sarasota-Venice, FL Miami-Fort Lauderdale-Pompano Beach-Homestead, FL Key West, FL Cape Coral-Fort Myers, FL Deposits |
 MSA IBKC Market Rank IBKC Offices IBKC Deposits IBKC Dep Mkt. Share (%) Percent of IBKC Franchise Market Population Population Change 2000-09 (%) Projected Population Change 2009-14 (%) Median HH Income 2009 ($) HH Income Change 2000-09 (%) Projected HH Income Change 2009-14 (%) FLORIDA Naples-Marco Island, FL 4 7 1,260,813 10.79 16.63 331,285 31.79 10.67 63,299 30.75 5.13 Bradenton-Sarasota-Venice, FL 5 14 928,434 1.55 12.25 721,598 22.31 8.45 52,726 29.60 6.01 Miami-Fort Lauderdale-Pompano Beach-Homestead, FL 54 4 279,532 0.16 3.69 5,549,666 10.83 3.49 52,512 30.34 4.03 Key West, FL 5 5 186,951 8.40 2.47 73,639 (7.48) (4.11) 54,614 27.82 (0.02) Cape Coral-Fort Myers, FL 17 4 174,194 1.43 2.30 645,899 46.50 17.89 52,154 29.34 5.02 Jacksonville, FL 26 3 132,566 0.37 1.75 1,392,346 24.01 10.33 55,237 29.52 4.49 LOUISIANA Lafayette, LA 1 13 1,149,488 22.72 15.17 260,628 9.01 4.00 41,287 16.34 3.26 New Iberia, LA 1 4 538,043 37.70 7.10 75,954 3.67 1.18 35,547 14.44 1.11 New Orleans-Metairie-Kenner, LA 12 12 477,850 1.79 6.30 1,166,214 (11.42) 11.89 42,739 21.00 (1.80) Baton Rouge, LA 6 4 312,764 2.14 4.13 782,691 10.87 5.21 43,138 15.25 3.29 Monroe, LA 4 7 297,896 11.53 3.93 173,860 2.24 0.70 36,070 13.68 4.15 Shreveport-Bossier City, LA 7 2 130,931 2.39 1.73 393,983 4.79 1.82 38,191 15.09 2.36 Ruston, LA 2 2 101,101 10.26 1.33 58,032 11 IBERIABANK IBERIABANK IBKC Market Demographics IBKC Market Demographics Source: SNL Financial 0.22 (0.37) 30,974 12.44 1.60 Crowley, LA 4 2 53,818 7.39 0.71 61,376 4.27 1.64 30,304 13.63 0.37 Abbeville, LA 9 2 45,285 5.33 0.60 56,905 5.76 2.08 32,473 10.30 1.26 Bastrop, LA 6 2 17,901 6.53 0.24 29,521 (4.84) (3.32) 28,280 12.55 1.06 Houma-Bayou Cane-Thibodaux, LA 13 1 15,277 0.39 0.20 204,970 5.40 1.43 40,199 14.56 4.23 ARKANSAS Little Rock-North Little Rock-Conway, AR 9 11 400,326 3.15 5.28 686,372 12.42 5.94 51,839 33.16 4.95 Jonesboro, AR 4 6 177,513 7.62 2.34 118,164 9.65 4.59 40,548 30.35 7.34 Fayetteville-Springdale-Rogers, AR-MO 19 8 106,203 1.44 1.40 456,132 31.43 13.38 49,287 36.00 4.35 Paragould, AR 8 1 11,528 1.61 0.15 41,326 10.70 5.46 39,417 27.77 6.28 TENNESSEE Memphis, TN-MS-AR 33 2 101,656 0.46 1.34 1,321,291 9.63 4.39 52,209 31.81 4.71 ALABAMA Birmingham-Hoover, AL 13 4 246,572 0.93 3.25 1,124,423 6.86 3.26 45,864 20.69 4.91 Montgomery, AL 14 2 82,324 1.06 1.09 371,467 7.20 3.67 44,553 19.70 3.98 Huntsville, AL 13 2 77,960 1.10 1.03 397,307 16.04 7.87 52,034 20.52 3.14 Mobile, AL 19 1 4,191 0.07 0.06 410,457 2.65 1.41 39,943 18.48 4.39 Aggregate: National 96.46 309,731,508 10.06 4.63 54,719 29.78 4.06 ` |
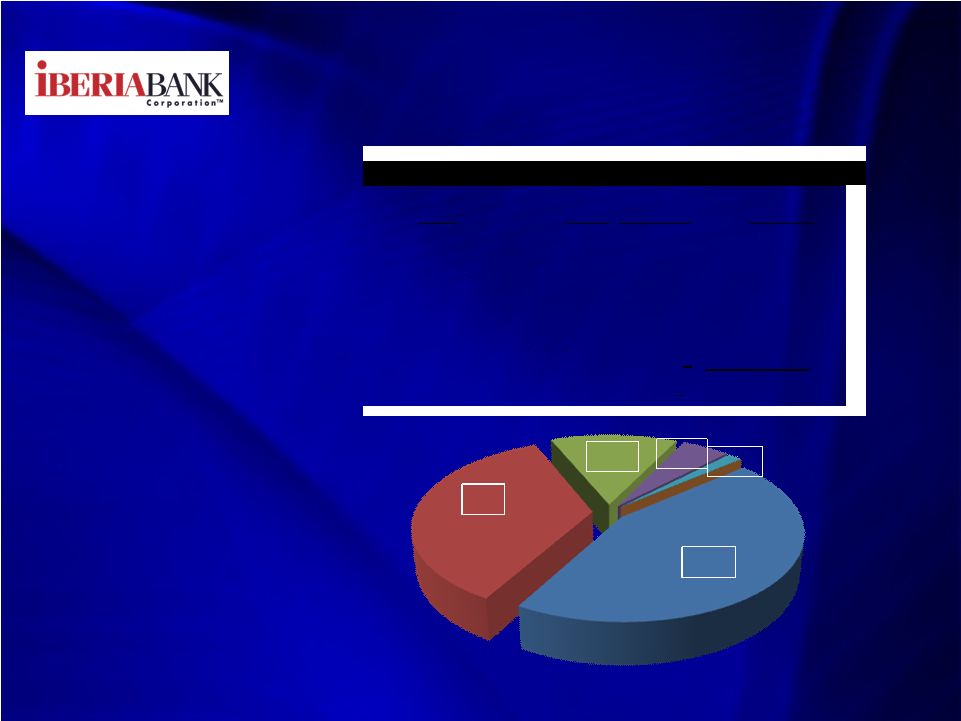
 12 Deposits Deposits IBKC Deposit data as of September 30, 2009 adjusted for acquired deposits. Acquired Deposits assumes acquisition of all deposits. DDA 13% 20% Svgs 5% 23% CDs 39% IBKC DDA 7% 14% 3% 27% 33% 16% Orion & Century DDA 11% NOW 18% Svgs 5% MMDA 24% CDs 37% Brokered 5% IBKC - Pro Forma NOW Acquired Pro Forma IBKC Deposits IBKC DDA 628,804 $ 158,550 $ 787,354 $ NOW 959,041 341,876 1,300,917 Svgs 253,769 84,001 337,770 MMDA 1,072,434 669,219 1,741,653 CDs 1,861,690 810,098 2,671,788 Brokered - 397,795 397,795 4,775,738 $ 2,461,539 $ 7,237,277 $ Brokered NOW Svgs CDs MMDA MMDA |
 13 Acquired Branches Acquired Branches Based on branch deposit data as of June 30, 2009
|
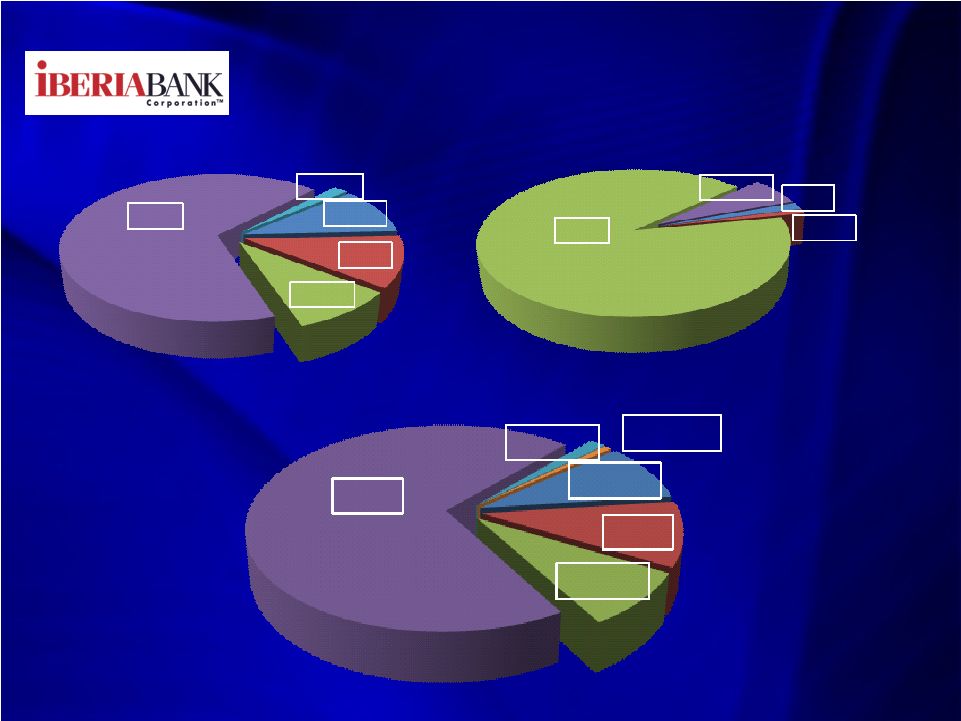
 14 Loan Portfolio Loan Portfolio Gross portfolios balances estimated at date of acquisition. Does not include loan discounts which will reduce balances. C&D 37% CRE 27% Res Re 29% C&I 6% Consumer 0% Orion Bank C&D 19% CRE 0% Res Re 63% C&I 4% Consumer 1% Other 13% Century Bank, FSB C&D 33% CRE 20% Res Re 38% C&I 5% Consumer 0% Other 4% Acquired Portolio Composition |
 15 Loan Portfolio – Loan Portfolio – Pro Forma Covered Loans Pro Forma Covered Loans September 30, 2009 data adjusted for acquired assets IBKC 65% Orion 25% Century 10% Pro Forma Portfolio Not Covered 58% Covered 42% IBKC Pro Forma - Covered Loans |
 16 Loans By State Loans By State September 30, 2009 data adjusted for acquired assets – does not incorporate loan discounts Louisiana 71% Arkansas 15% Alabama 12% Tennessee 2% IBKC Louisiana 45% Arkansas 10% Alabama 8% Florida 36% Tennessee 1% Pro Forma |
 17 Acquired Securities Acquired Securities Note: Book Value of Securities 9% 10% 8% Fixed CMO 70% 2% 1% Total Acquired Securities Fixed MBS 2% Floating MBS 1% Fixed CMO 91% Fixed Corporate 6% Century Bank, FSB Fixed Agency 11% Fixed MBS 11% Floating MBS 9% Fixed CMO 67% Taxfree Munis 2% Orion Bank Taxfree Munis Fixed Corporate Fixed Agency Fixed MBS Floating MBS |
 18 Orion Bank Orion Bank Naples, Florida Naples, Florida |
 19 Orion Bank Orion Bank Highlights Highlights Federal Reserve Member; Bank is Headquartered in Federal Reserve Member; Bank is Headquartered in Naples, Florida Naples, Florida Established in 1977 as The First Bank of Marathon Established in 1977 as The First Bank of Marathon Franchise with 23 Offices in Five Florida MSA’s Franchise with 23 Offices in Five Florida MSA’s 24 24 th Ranked Deposit Market Share in Florida with $2.1 Ranked Deposit Market Share in Florida with $2.1 Billion in Deposits Billion in Deposits At June 30, 2009 - At June 30, 2009 - $2.7 Billion in Assets, $2.0 Billion in $2.7 Billion in Assets, $2.0 Billion in Loans, and $2.1 Billion in Deposits Loans, and $2.1 Billion in Deposits NPAs/Assets = 9.36%; Texas Ratio = 254% NPAs/Assets = 9.36%; Texas Ratio = 254% 260 FTE Employees 260 FTE Employees September 18, 2009 – September 18, 2009 – Federal Reserve of Atlanta Issued Federal Reserve of Atlanta Issued a Cease & Desist Order for Orion Bank a Cease & Desist Order for Orion Bank |
 20 Orion Bank Orion Bank Balance Sheet History Balance Sheet History Source: SNL Financial (Dollars in Thousands) 12/31/05 12/31/06 12/31/07 12/31/08 3/31/09 6/30/09 Balance Sheet Highlights Total Assets 1,739,901 $ 2,555,707 $ 2,674,036 $ 2,862,938 $ 2,827,273 $ 2,691,214 $ Total Securities 122,833 428,166 435,071 437,257 360,129 318,318 Total Loans & Leases 1,487,032 1,962,678 2,050,248 2,002,559 1,964,939 1,963,759 Total Deposits 1,280,345 1,639,689 1,662,405 2,237,481 2,197,239 2,137,698 Total Equity 83,080 111,309 121,041 61,670 58,537 70,324 Loans/ Assets (%) 85.5 76.8 76.7 70.0 69.5 73.0 Loans/Deposits (%) 116.1 119.7 123.3 89.5 89.4 91.9 Equity Cap/ Total Assets (%) 4.77 4.36 4.53 2.15 2.07 2.61 Tang Common Eq/ Tang Assets (%) 4.77 4.36 4.53 2.15 2.07 2.15 Leverage Ratio (%) 6.98 5.93 6.19 3.22 3.34 4.09 |
 21 Orion Bank Orion Bank Income Statement History Income Statement History Source: SNL Financial YTD (Dollars in Thousands) 2005 2006 2007 2008 6/30/09 Income Statement Interest Income 93,572 $ 163,983 $ 186,164 $ 151,587 $ 55,541 $ Interest Expense 30,887 79,039 107,070 92,501 38,748 Net Interest Income (FTE) 62,685 84,944 79,094 59,086 16,793 Loan Loss Provisions 2,100 2,625 18,550 54,650 9,801 Total Noninterest Income 7,147 7,283 7,437 5,733 1,042 Realized Sec Gns/(Loss) - - - 40 2,680 Total Noninterest Expense 30,723 39,288 41,785 52,501 27,245 Net Income - Pre Tax 37,009 50,314 26,196 (42,292) (16,531) Income Taxes (14,007) (19,159) (9,676) 16,874 6,529 Net Income - After Tax 23,002 31,155 16,520 (25,418) (10,002) |
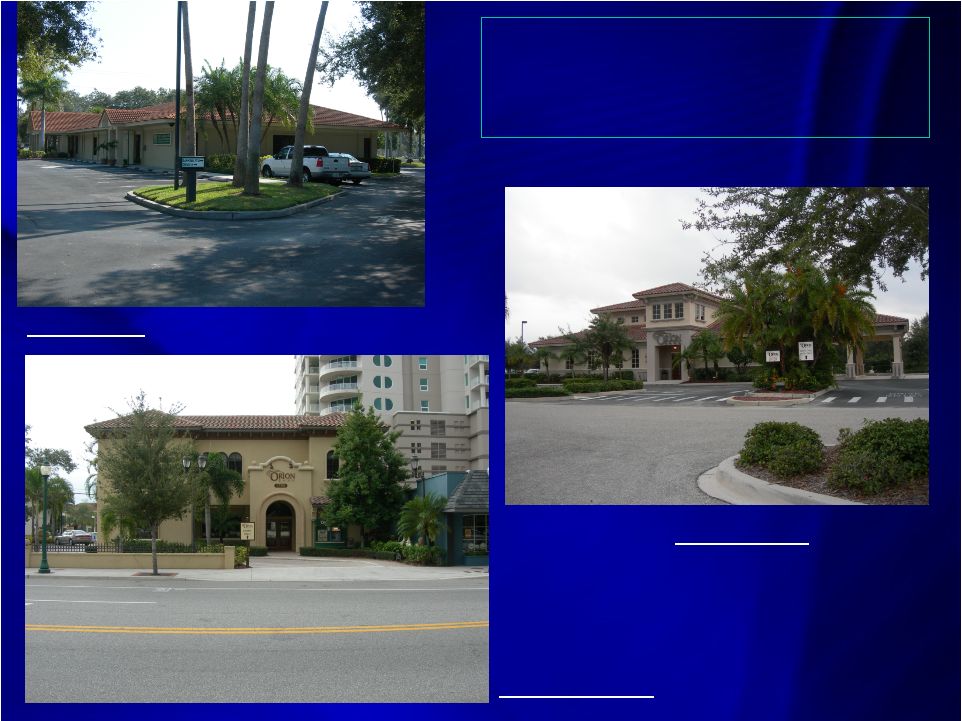
 ORION BANK Branches - Naples Ninth Street Main Office 22 |
 ORION BANK Branches – Naples (Cont.) Tamiami Pine Ridge 23 |
 ORION BANK Branches – Naples (Cont.) Immokalee Airport 24 |
 ORION BANK Branches - Sarasota Main Street University Tamiami 25 |
 ORION BANK Branches – Fort Myers First Street Orion Drive Summerlin 26 |
 ORION BANK Branches – Other SW Florida Bradenton Cape Coral 27 |
 ORION BANK Branches – Florida Keys Marathon Shores Islamorada 28 |
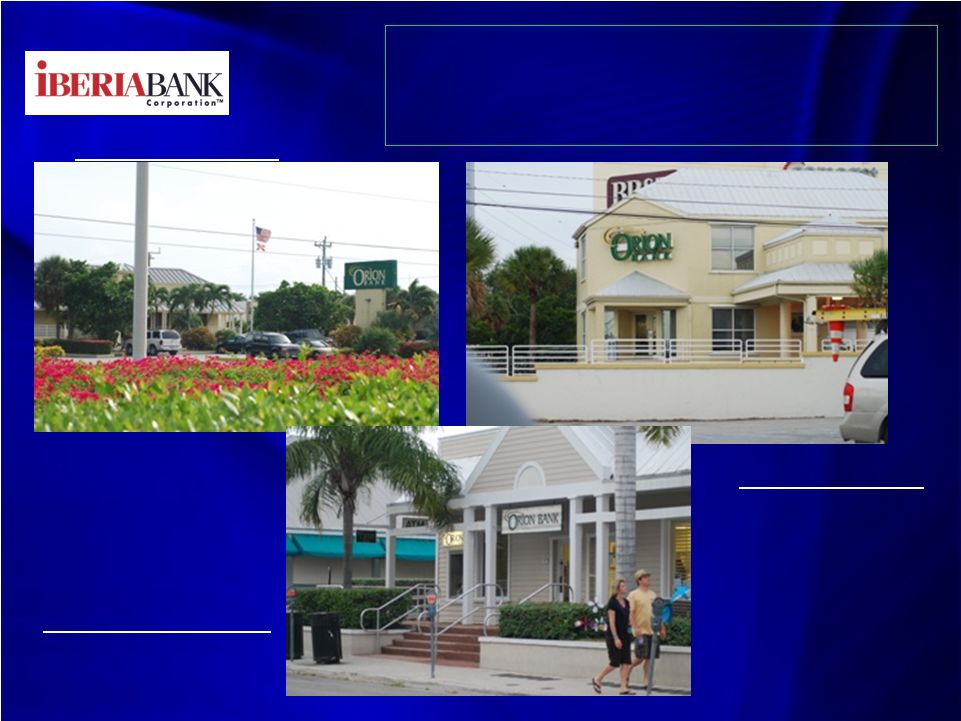 ORION BANK Branches – Florida Keys (cont.) Keys Kennedy 1001 Marathon Key West - Duval 29 |
 ORION BANK Branches – Other SE Florida 5003 East Boca West Palm Beach Not Shown: Marco Island, Palm Beach Gardens 30 |
 31 Century Bank, FSB Century Bank, FSB Sarasota, Florida Sarasota, Florida |
 32 Century Bank,FSB Century Bank,FSB Highlights Highlights Federal Savings Bank Headquartered in Sarasota, Federal Savings Bank Headquartered in Sarasota, Florida Florida Established in 1985 Established in 1985 Franchise With 11 Offices in Two Florida MSA’s Franchise With 11 Offices in Two Florida MSA’s 53 53 rd Ranked Ranked Deposit Deposit Market Market Share Share in in Florida Florida with with $690 $690 Million in Deposits Million in Deposits At June 30, 2009 - At June 30, 2009 - $841 Million in Assets, $695 Million in $841 Million in Assets, $695 Million in Loans, and $690 Million in Deposits Loans, and $690 Million in Deposits NPAs/Assets = 20.61%; Texas Ratio = 523% NPAs/Assets = 20.61%; Texas Ratio = 523% 133 FTE Employees 133 FTE Employees August 11, 2009 – August 11, 2009 – OTS Issued a Cease & Desist Order OTS Issued a Cease & Desist Order for Century Bank, FSB for Century Bank, FSB |
 33 Century Bank, FSB Century Bank, FSB Balance Sheet History Balance Sheet History Source: SNL Financial (Dollars in Thousands) 12/31/05 12/31/06 12/31/07 12/31/08 3/31/09 6/30/09 Balance Sheet Highlights Total Assets 611,110 $ 819,143 $ 920,063 $ 919,126 $ 899,329 $ 841,304 $ Total Securities 37,562 49,462 68,643 53,883 48,990 41,905 Total Loans & Leases 544,727 741,061 824,119 770,918 741,837 694,707 Total Deposits 480,002 646,431 695,022 719,480 708,993 689,740 Total Equity 41,219 52,464 57,813 39,119 35,074 7,628 Loans/ Assets (%) 89.1 90.5 89.6 83.9 82.5 82.6 Loans/Deposits (%) 113.5 114.6 118.6 107.2 104.6 100.7 Equity Cap/ Total Assets (%) 6.74 6.40 6.28 4.26 3.90 0.91 Tang Common Eq/ Tang Assets (%) 5.97 6.31 6.20 4.26 3.90 0.91 Leverage Ratio (%) 6.66 6.34 6.20 4.63 4.49 1.51 |
  34 Century Bank, FSB Century Bank, FSB Income Statement History Income Statement History Source: SNL Financial YTD (Dollars in Thousands) 2005 2006 2007 2008 6/30/09 Income Statement Interest Income 34,306 $ 51,034 $ 66,622 $ 56,554 $ 19,669 $ Interest Expense 14,999 25,141 36,766 33,709 14,503 Net Interest Income (FTE) 19,501 26,173 30,247 23,166 5,166 Loan Loss Provisions 540 480 8,886 31,026 35,628 Total Noninterest Income 2,830 2,301 1,594 158 (788) Realized Sec Gns/(Loss) 926 777 587 366 43 Total Noninterest Expense 9,943 11,567 14,551 15,742 7,969 Net Income - Pre Tax 12,774 17,204 8,991 (23,078) (39,176) Income Taxes (4,828) (6,608) - - - Net Income - After Tax 7,946 10,596 8,991 (23,078) (39,176) |
 CENTURY BANK, FSB Branches - Sarasota 17 th Street Bay Village 35 |
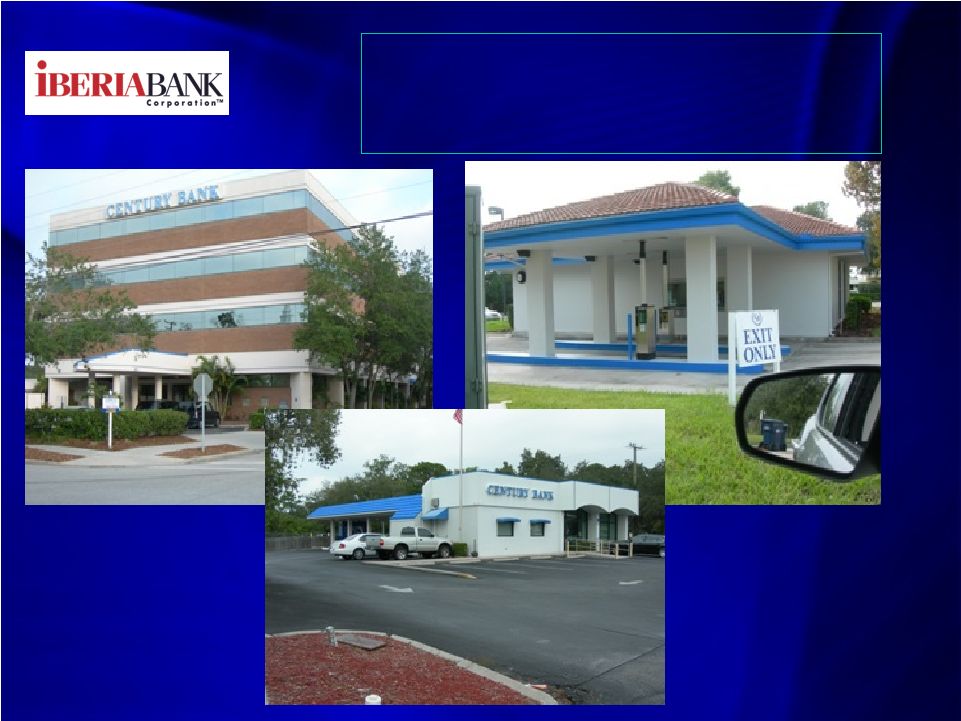 CENTURY BANK, FSB Branches - Sarasota Gulf Gate 36 Main Branch Tuttle |
 CENTURY BANK, FSB Branches - Bradenton Freedom Village West Bradenton Southwood 37 |
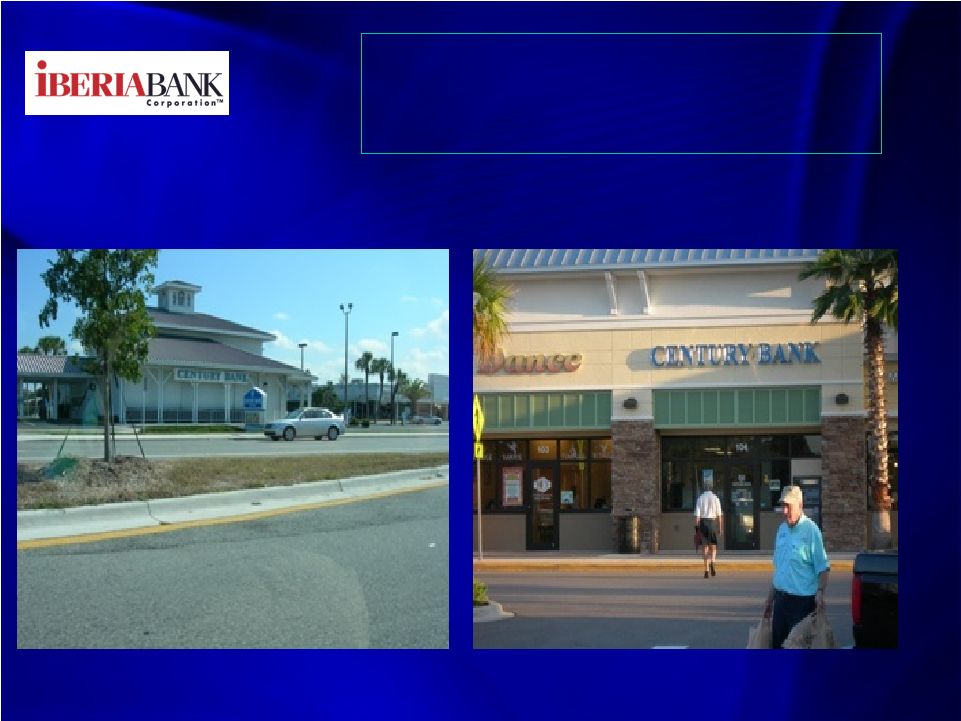 CENTURY BANK, FSB Branches – Other SW Mkts Venice Parrish 38 |