Attached files
| file | filename |
|---|---|
| 8-K - Colfax CORP | v166530_8k.htm |
Investor Presentation
November 16, 2009
The following information contains forward-looking statements, including forward-looking statements within the meaning of the Private Securities Litigation Reform Act of 1995. Such forward-looking
statements include, but are not limited to, statements concerning Colfax's plans, objectives, expectations and intentions and other statements that are not historical or current facts. Forward- looking statements are based on Colfax's
current expectations and involve risks and uncertainties that could cause actual results to differ materially from those expressed or implied in such forward-looking statements. Factors that could cause Colfax's results to differ materially
from current expectations include, but are not limited to factors detailed in Colfax's reports filed with the U.S. Securities and Exchange Commission as well as its Annual Report on Form 10-K under the caption “Risk Factors”. In
addition, these statements are based on a number of assumptions that are subject to change. This presentation speaks only as of this date. Colfax disclaims any duty to update the information herein.
Forward-Looking Statements
1
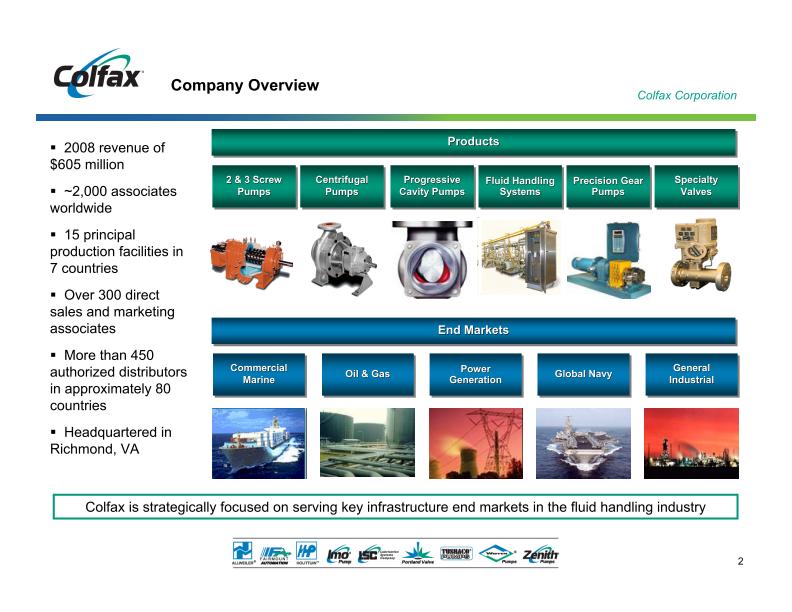
2008 revenue of $605 million
~2,000 associates worldwide
15 principal production facilities in 7 countries
Over 300 direct sales and marketing associates
More than 450 authorized distributors in approximately 80 countries
Headquartered in Richmond, VA
Colfax is strategically focused on serving key infrastructure end markets in the fluid handling industry
2 & 3 Screw
Pumps
Centrifugal
Pumps
Progressive
Cavity Pumps
Precision Gear Pumps
Specialty
Valves
Fluid Handling Systems
End Markets
Products
Global Navy
General
Industrial
Commercial
Marine
Oil & Gas
Power Generation
Company Overview
2
Founded in 1995
John Young, President & CEO, was an original founder
Equity capital provided by Mitch and Steve Rales, founders of Danaher (NYSE: DHR)
Targeted global industrial companies with strong brands
13 acquisitions, 5 divestitures
Exclusively focused on fluid handling industry
Proven, experienced management team
Began trading on the NYSE in May 2008
There are approximately 5,000 pump companies globally and Colfax is in the top 15
Background
3
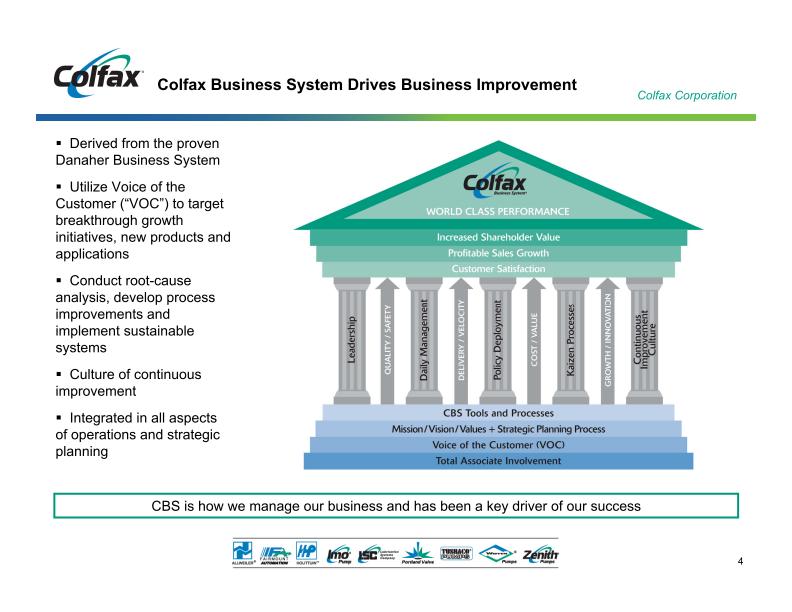
Derived from the proven Danaher Business System
Utilize Voice of the Customer (“VOC”) to target breakthrough growth initiatives, new products and applications
Conduct root-cause analysis, develop process improvements and implement sustainable systems
Culture of continuous improvement
Integrated in all aspects of operations and strategic planning
CBS is how we manage our business and has been a key driver of our success
Colfax Business System Drives Business Improvement
4
Global leader in specialty fluid handling products
Proven application expertise in solving critical customer needs
Serving growing global infrastructure driven end markets
Leading brand names generating aftermarket sales and services
Experienced management team in place to grow organically and through strategic acquisition
Strong financial position
Significant insider ownership
Consistent track record of driving profitable organic sales growth
Investment Highlights
5
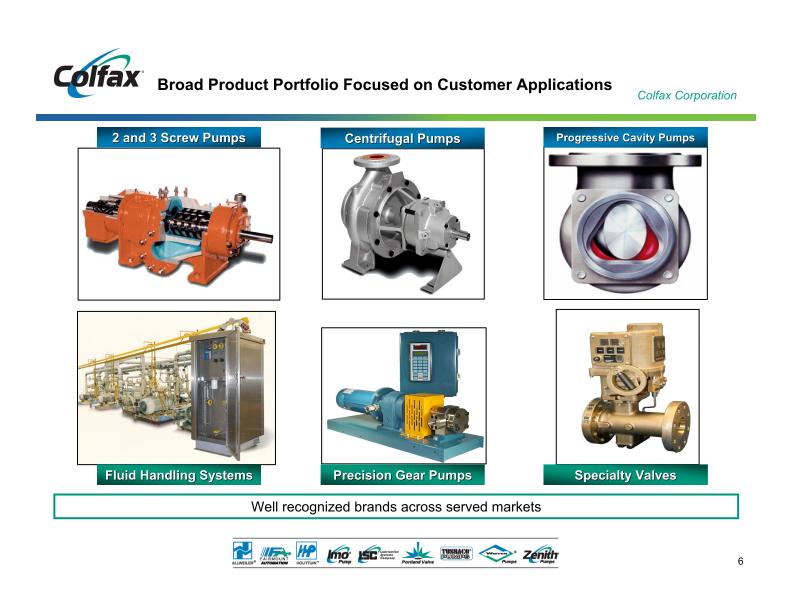
2 and 3 Screw Pumps
Well recognized brands across served markets
Fluid Handling Systems
Precision Gear Pumps
Progressive Cavity Pumps
Specialty Valves
Centrifugal Pumps
Broad Product Portfolio Focused on Customer Applications
6
7
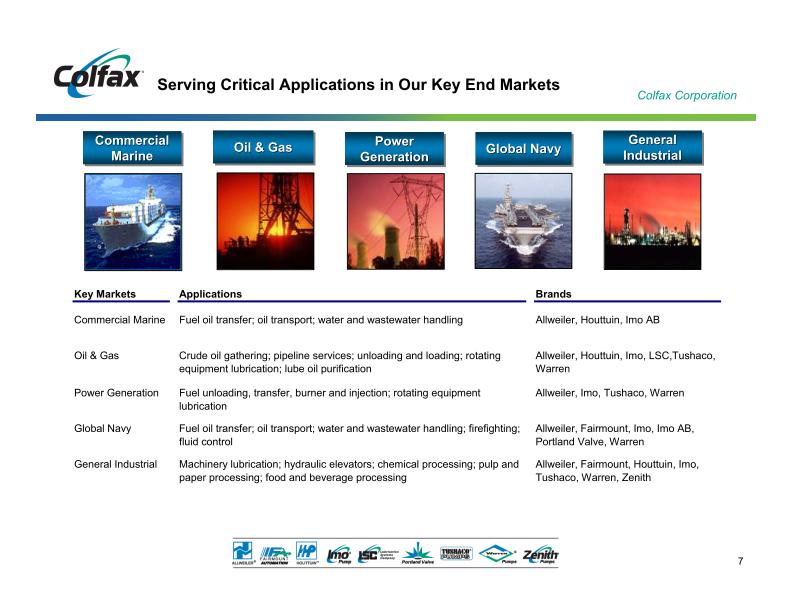
Commercial Marine
Serving Critical Applications in Our Key End Markets
General Industrial
Power Generation
Oil & Gas
Global Navy
Key Markets
Applications
Brands
Commercial
Marine
Fuel oil transfer; oil transport; water and wastewater handling
Allweiler,
Houttuin
,
I
mo
AB
Oil & Gas
Crude oil gathering; pipeline services; unloading and loading; rotating
equipment lubrication; lube oi
l purification
Allweiler, Houttuin,
Imo,
LSC,
Tushaco
,
Warren
Power Generation
Fuel unloading, transfer, burner and injection; rotating equipment
lubrication
Allweiler, Imo,
Tushaco
, Warren
Global
Navy
Fuel oil transfer; oil transport; water and wastewate
r handling; firefighting;
fluid control
Allweiler,
Fairmount,
I
mo
,
I
m
o
AB,
Portland
Valve,
Warren
General Industrial
Machinery lubrication; hydraulic elevators; chemical processing; pulp and
paper processing; food and beverage processing
Allweiler,
Fairm
ount,
Houttuin,
I
mo
,
Tushaco
, Warren,
Zenith
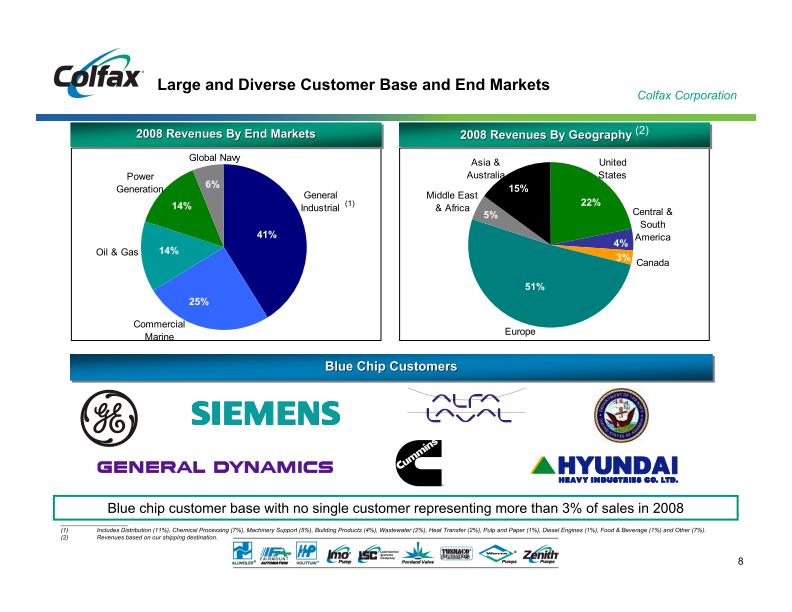
Large and Diverse Customer Base and End Markets
Blue Chip Customers
(2)
2008 Revenues By End Markets
3%
4%
15%
5%
51%
22%
(1)
6%
14%
14%
25%
41%
____________________
(1) Includes Distribution (11%), Chemical Processing (7%), Machinery Support (5%), Building Products (4%), Wastewater (2%), Heat Transfer (2%), Pulp and Paper (1%), Diesel Engines (1%), Food & Beverage (1%) and Other (7%).
(2) Revenues based on our shipping destination. Blue chip customer base with no single customer representing more than 3% of sales in 2008 Global Navy Marine Commercial Oil & Gas Industrial General Generation Power Asia & Australia Europe United States Canada Central & South America Middle East & Africa 8
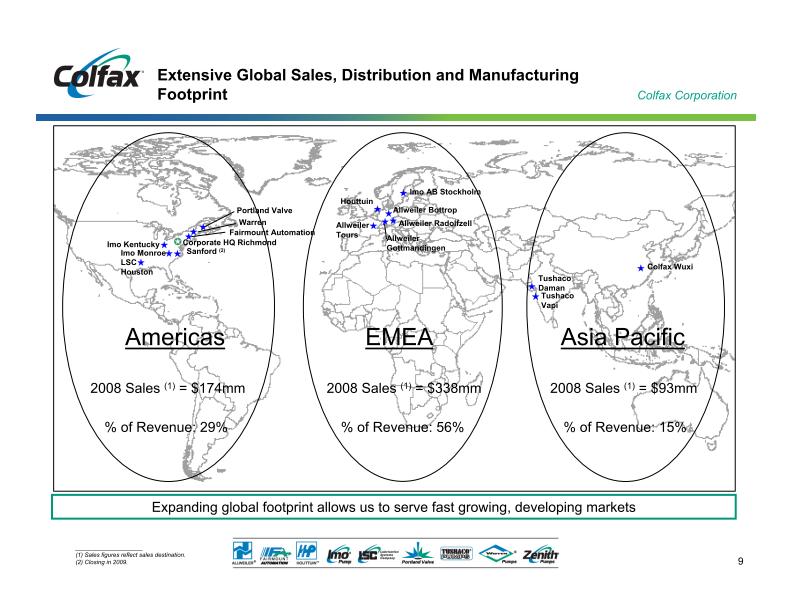
EMEA
= $338mm
____________________
(1) Sales figures reflect sales destination.
(2) Closing in 2009. Americas = $174mm % of Revenue: 29% % of Revenue: 56% % of Revenue: 15% LSC Houston Warren Corporate HQ Richmond Imo Kentucky Imo Monroe (2) Houttuin Tushaco Vapi Tushaco Daman Colfax Wuxi Imo AB Stockholm Allweiler Gottmandingen Portland Valve Allweiler Tours Allweiler Radolfzell Allweiler Bottrop Fairmount Automation Expanding global footprint allows us to serve fast growing, developing markets Extensive Global Sales, Distribution and Manufacturing Footprint Asia Pacific = $93mm 9
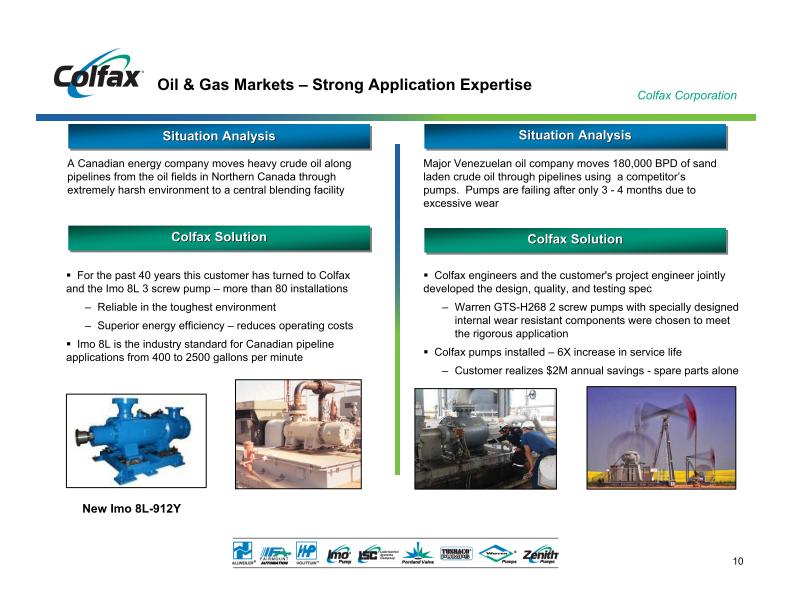
Situation Analysis
A Canadian energy company moves heavy crude oil along pipelines from the oil fields in Northern Canada through extremely harsh environment to a central blending facility
Colfax engineers and the customer's project engineer jointly developed the design, quality, and testing spec
Warren GTS-H268 2 screw pumps with specially designed internal wear resistant components were chosen to meet the rigorous application
Colfax pumps installed – 6X increase in service life
Colfax Solution
Situation Analysis
Major Venezuelan oil company moves 180,000 BPD of sand laden crude oil through pipelines using a competitor’s pumps. Pumps are failing after only 3 - 4 months due to excessive
wear
Colfax Solution
For the past 40 years this customer has turned to Colfax and the Imo 8L 3 screw pump – more than 80 installations
Reliable in the toughest environment
Superior energy efficiency – reduces operating costs
Imo 8L is the industry standard for Canadian pipeline applications from 400 to 2500 gallons per minute
Oil & Gas Markets – Strong Application Expertise
New Imo 8L-912Y
10
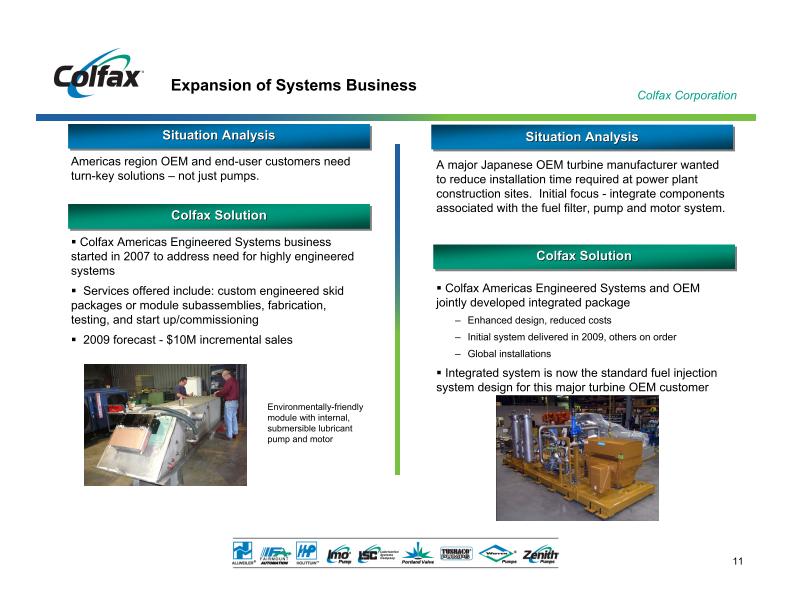
Expansion of Systems Business
Situation Analysis
A major Japanese OEM turbine manufacturer wanted to reduce installation time required at power plant construction sites. Initial focus - integrate components associated with the fuel filter,
pump and motor system.
Colfax Solution
Enhanced design, reduced costs
Initial system delivered in 2009, others on order
Global installations
Integrated system is now the standard fuel injection system design for this major turbine OEM customer
Situation Analysis
Colfax Solution
Americas region OEM and end-user customers need turn-key solutions – not just pumps.
Colfax Americas Engineered Systems business started in 2007 to address need for highly engineered systems
Services offered include: custom engineered skid packages or module subassemblies, fabrication, testing, and start up/commissioning
2009 forecast - $10M incremental sales
Environmentally-friendly module with internal, submersible lubricant pump and motor
11
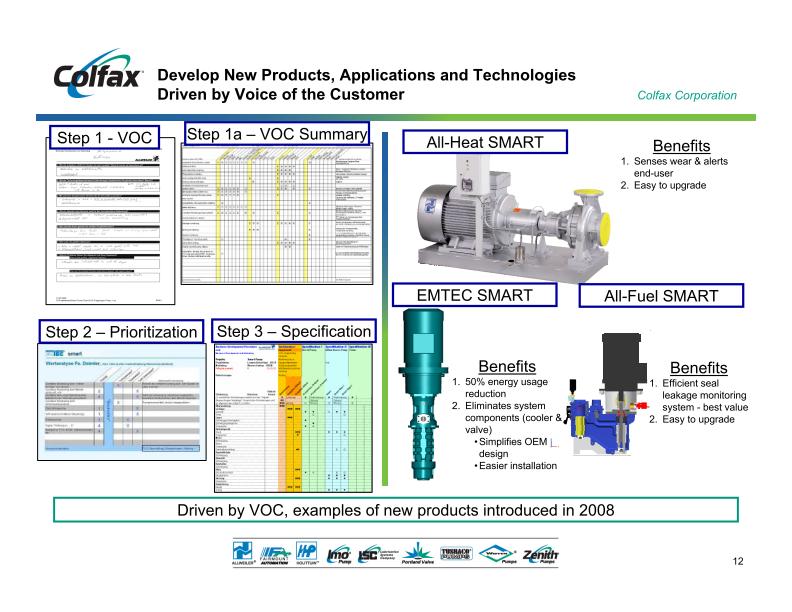
Driven by VOC, examples of new products introduced in 2008
Develop New Products, Applications and Technologies Driven by Voice of the Customer
Step 1 - VOC
Step 1a – VOC Summary
Step 2 – Prioritization
Step 3 – Specification
All-Heat SMART
EMTEC SMART
Benefits
1. Senses wear & alerts end-user
2. Easy to upgrade Benefits
1. 50% energy usage reduction
2. Eliminates system components (cooler & valve) Simplifies OEM design Easier installation All-Fuel SMART
1. Efficient seal leakage monitoring system - best value
2. Easy to upgrade 12
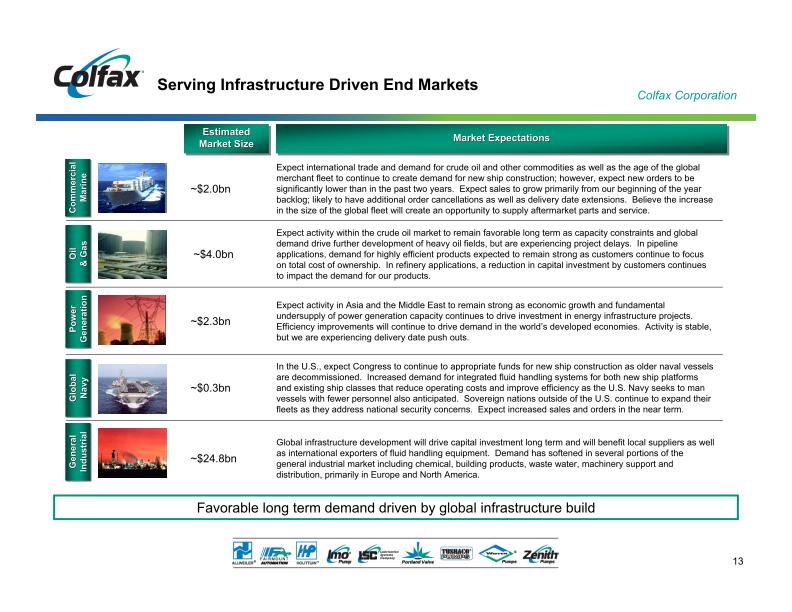
~$24.8bn
~$0.3bn
~$2.3bn
~$4.0bn
~$2.0bn
Global infrastructure development will drive capital investment long term and will benefit local suppliers as well as international exporters of fluid handling equipment. Demand has softened in several
portions of the general industrial market including chemical, building products, waste water, machinery support and distribution, primarily in Europe and North America.
In the U.S., expect Congress to continue to appropriate funds for new ship construction as older naval vessels are decommissioned. Increased demand for integrated fluid handling systems for both
new ship platforms and existing ship classes that reduce operating costs and improve efficiency as the U.S. Navy seeks to man vessels with fewer personnel also anticipated. Sovereign
nations outside of the U.S. continue to expand their fleets as they address national security concerns. Expect increased sales and orders in the near term.
Expect activity in Asia and the Middle East to remain strong as economic growth and fundamental undersupply of power generation capacity continues to drive investment in energy infrastructure projects. Efficiency
improvements will continue to drive demand in the world’s developed economies. Activity is stable, but we are experiencing delivery date push outs.
Expect activity within the crude oil market to remain favorable long term as capacity constraints and global demand drive further development of heavy oil fields, but are experiencing project delays. In
pipeline applications, demand for highly efficient products expected to remain strong as customers continue to focus on total cost of ownership. In refinery applications, a reduction in capital investment by customers continues to impact
the demand for our products.
Expect international trade and demand for crude oil and other commodities as well as the age of the global merchant fleet to continue to create demand for new ship construction; however, expect new orders to
be significantly lower than in the past two years. Expect sales to grow primarily from our beginning of the year backlog; likely to have additional order cancellations as well as delivery date extensions. Believe the increase in
the size of the global fleet will create an opportunity to supply aftermarket parts and service.
Estimated
Market Size
Favorable long term demand driven by global infrastructure build
Market Expectations
Serving Infrastructure Driven End Markets
13
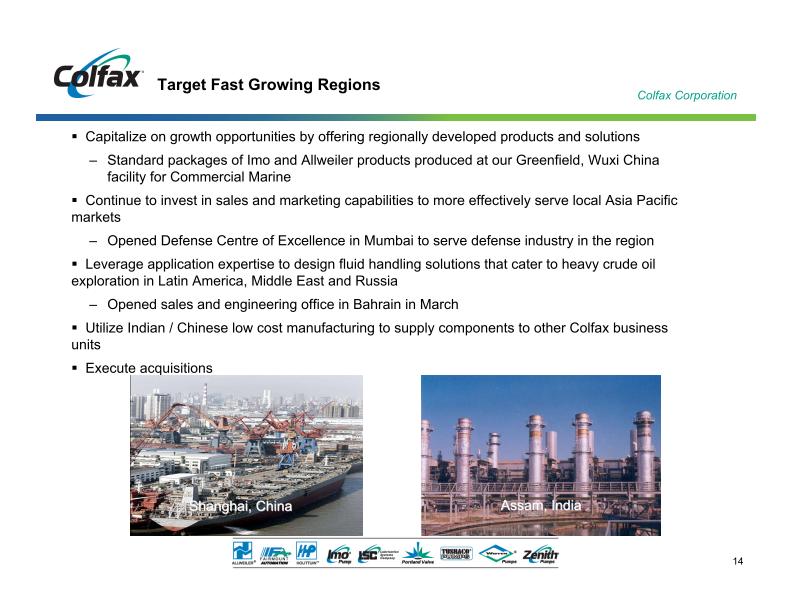
Capitalize on growth opportunities by offering regionally developed products and solutions
Standard packages of Imo and Allweiler products produced at our Greenfield, Wuxi China facility for Commercial Marine
Continue to invest in sales and marketing capabilities to more effectively serve local Asia Pacific markets
Opened Defense Centre of Excellence in Mumbai to serve defense industry in the region
Leverage application expertise to design fluid handling solutions that cater to heavy crude oil exploration in Latin America, Middle East and Russia
Opened sales and engineering office in Bahrain in March
Utilize Indian / Chinese low cost manufacturing to supply components to other Colfax business units
Execute acquisitions
Assam, India
Shanghai, China
Target Fast Growing Regions
14
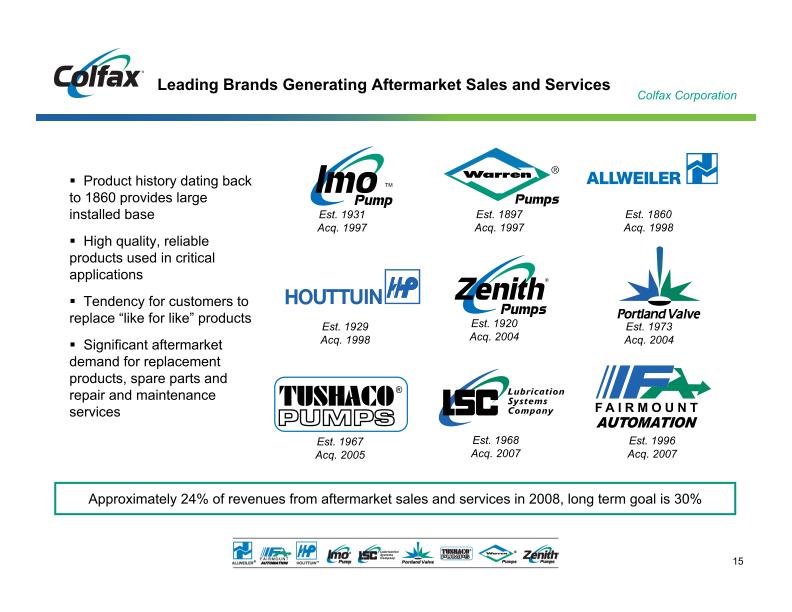
Est. 1860
Acq. 1998
Est. 1897
Acq. 1997
Est. 1929
Acq. 1998
Est. 1931
Acq. 1997
Est. 1973
Acq. 2004
Est. 1920
Acq. 2004
Est. 1967
Acq. 2005
Est. 1968
Acq. 2007
Est. 1996
Acq. 2007
Product history dating back to 1860 provides large installed base
High quality, reliable products used in critical applications
Tendency for customers to replace “like for like” products
Significant aftermarket demand for replacement products, spare parts and repair and maintenance services
Approximately 24% of revenues from aftermarket sales and services in 2008, long term goal is 30%
Leading Brands Generating Aftermarket Sales and Services
15
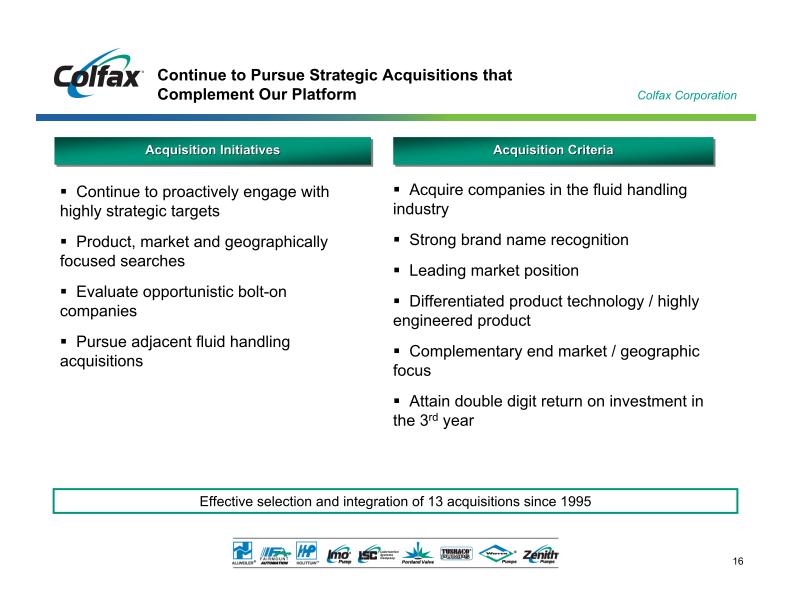
Continue to proactively engage with highly strategic targets
Product, market and geographically focused searches
Evaluate opportunistic bolt-on companies
Pursue adjacent fluid handling acquisitions
Effective selection and integration of 13 acquisitions since 1995
Acquisition Criteria
Acquisition Initiatives
Acquire companies in the fluid handling industry
Strong brand name recognition
Leading market position
Differentiated product technology / highly engineered product
Complementary end market / geographic focus
year
Continue to Pursue Strategic Acquisitions that Complement Our Platform
16
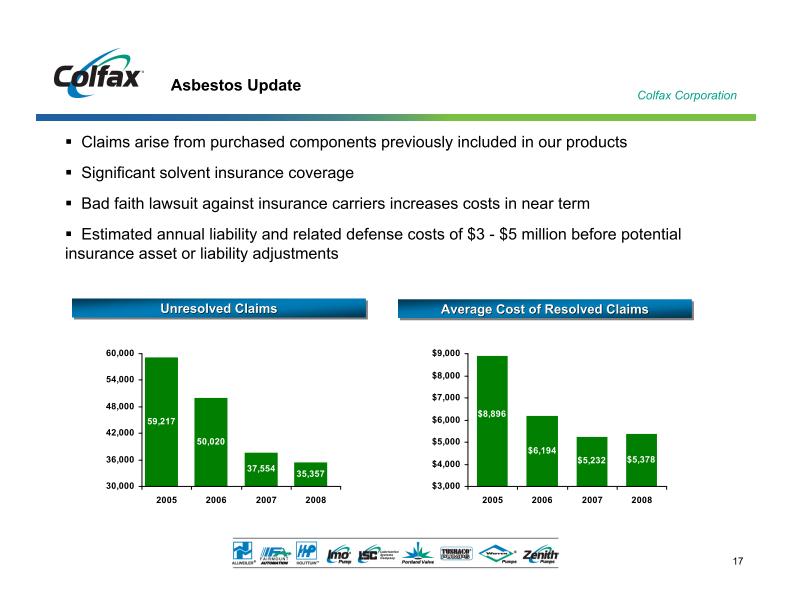
Claims arise from purchased components previously included in our products
Significant solvent insurance coverage
Bad faith lawsuit against insurance carriers increases costs in near term
Estimated annual liability and related defense costs of $3 - $5 million before potential insurance asset or liability adjustments
Asbestos Update
2008
2007
2006
2005
60,000
54,000
48,000
42,000
36,000
30,000
35,357
37,554
50,020
59,217
Average Cost of Resolved Claims
Unresolved Claims
$6,194
$5,378
$5,232
$8,896
$3,000
$4,000
$5,000
$6,000
$7,000
$8,000
$9,000
2005
2006
2007
2008
17
Financial Overview
18
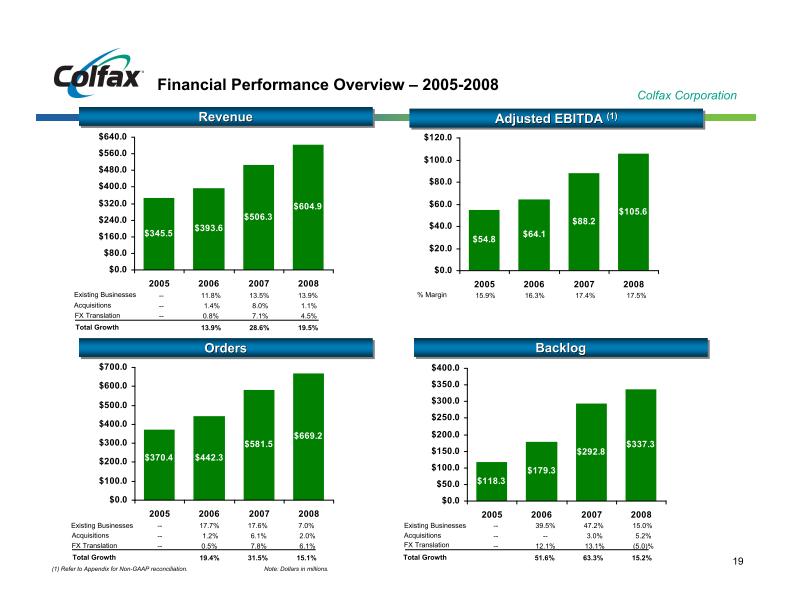
Financial Performance Overview – 2005-2008
2008
2007
2006
2005
$400.0
$350.0
$300.0
$250.0
$200.0
$150.0
$100.0
$50.0
$0.0
$337.3
$292.8
$179.3
$118.3
$54.8
$64.1
$88.2
$105.6
$0.0
$20.0
$40.0
$60.0
$80.0
$100.0
$120.0
2005
2006
2007
2008
Backlog
$345.5
$393.6
$506.3
$604.9
$0.0
$80.0
$160.0
$240.0
$320.0
$400.0
$480.0
$560.0
$640.0
2005
2006
2007
2008
% Margin
15.9%
16.3%
17.4%
17.5%
(1)
Total Growth
31.5%
15.1%
Existing Businesses
19.4%
17.6%
7.0%
Acquisitions
6.1%
2.0%
FX Translation
7.8%
6.1%
--
--
--
17.7%
1.2%
0.5%
Total Growth
63.3%
15.2%
Existing Businesses
51.6%
47.2%
15.0%
Acquisitions
3.0%
5.2%
FX Translation
13.1%
(5.0)%
--
--
--
39.5%
--
12.1%
Total Growth
28.6%
19.5%
Existing Businesses
13.9%
13.5%
13.9%
Acquisitions
8.0%
1.1%
FX Translation
7.1%
4.5%
--
--
--
11.8%
1.4%
0.8%
Orders
(1) Refer to Appendix for Non-GAAP reconciliation. Note: Dollars in millions.
Revenue
$442.3
$581.5
$669.2
$370.4
$0.0
$100.0
$200.0
$300.0
$400.0
$500.0
$600.0
$700.0
2005
2006
2007
2008
19
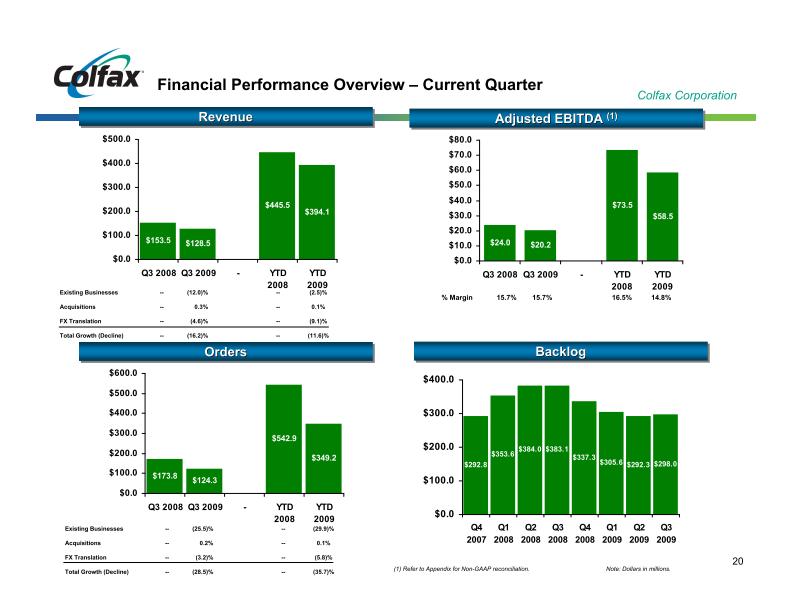
Financial Performance Overview – Current Quarter
0.1%
--
0.2%
--
Acquisitions
(28.5)%
(3.2)%
(25.5)%
(35.7)%
--
--
Total Growth (Decline)
(5.8)%
--
--
FX Translation
(29.9)%
--
--
Existing Businesses
2009
YTD
2008
YTD
-
Q3 2009
Q3 2008
$600.0
$500.0
$400.0
$300.0
$200.0
$100.0
$0.0
$349.2
$542.9
$124.3
$173.8
14.8%
16.5%
15.7%
15.7%
% Margin
(1)
Backlog
Orders
(1) Refer to Appendix for Non-GAAP reconciliation. Note: Dollars in millions.
Revenue
0.1%
--
0.3%
--
Acquisitions
(16.2)%
(4.6)%
(12.0)%
(11.6)%
--
--
Total Growth (Decline)
(9.1)%
--
--
FX Translation
(2.5)%
--
--
Existing Businesses
2009
Q3
2009
Q2
2009
Q1
2008
Q4
2008
Q3
2008
Q2
2008
Q1
2007
Q4
$400.0
$300.0
$200.0
$100.0
$0.0
$298.0
$292.3
$305.6
$337.3
$383.1
$384.0
$353.6
$292.8
2009
YTD
2008
YTD
-
Q3 2009
Q3 2008
$500.0
$400.0
$300.0
$200.0
$100.0
$0.0
$394.1
$445.5
$128.5
$153.5
$24.0
$20.2
$73.5
$58.5
$0.0
$10.0
$20.0
$30.0
$40.0
$50.0
$60.0
$70.0
$80.0
Q3 2008
Q3 2009
-
YTD
2008
YTD
2009
20
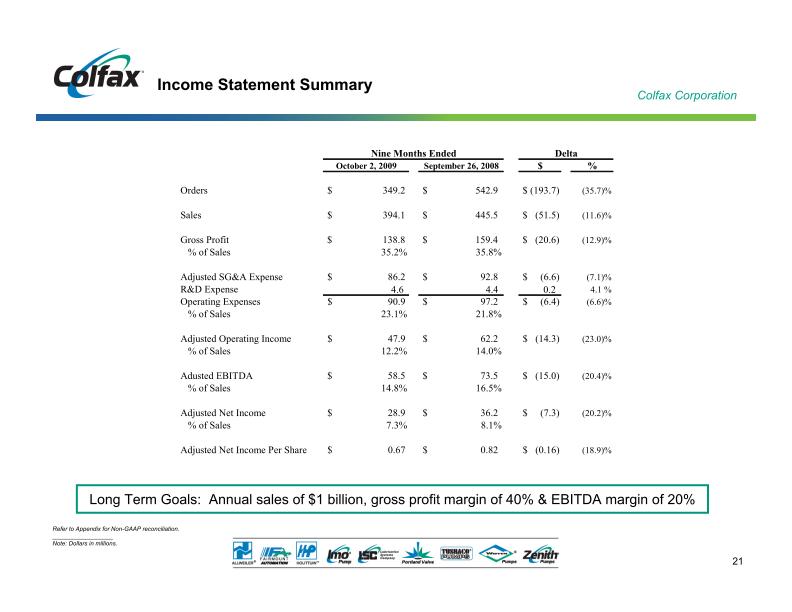
Income Statement Summary
Refer to Appendix for Non-GAAP reconciliation.
__________________
Note: Dollars in millions.
Long Term Goals: Annual sales of $1 billion, gross profit margin of 40% & EBITDA margin of 20%
Delta
October 2, 2009
September 26, 2008
$
%
Orders
$ 349.2
$ 542.9
$ (193.7)
(35.7)%
Sales
$ 394.1
$ 445.5
$ (51.5)
(11.6)%
Gross Profit
$ 138.8
$ 159.4
$ (20.6)
(12.9)%
% of Sales
35.2%
35.8%
Adjusted SG&A Expense
$ 86.2
$ 92.8
$ (6.6)
(7.1)%
R&D Expense
4.6
4.4
0.2
4.1 %
Operating Expenses
$ 90.9
$ 97.2
$ (6.4)
(6.6)%
% of Sales
23.1%
21.8%
Adjusted Operating Income
$ 47.9
$ 62.2
$ (14.3)
(23.0)%
% of Sales
12.2%
14.0%
Adusted EBITDA
$ 58.5
$ 73.5
$ (15.0)
(20.4)%
% of Sales
14.8%
16.5%
Adjusted Net Income
$ 28.9
$ 36.2
$ (7.3)
(20.2)%
% of Sales
7.3%
8.1%
Adjusted Net Income Per Share
$ 0.67
$ 0.82
$ (0.16)
(18.9)%
Nine Months Ended
21
____________________
Note: Dollars in millions.
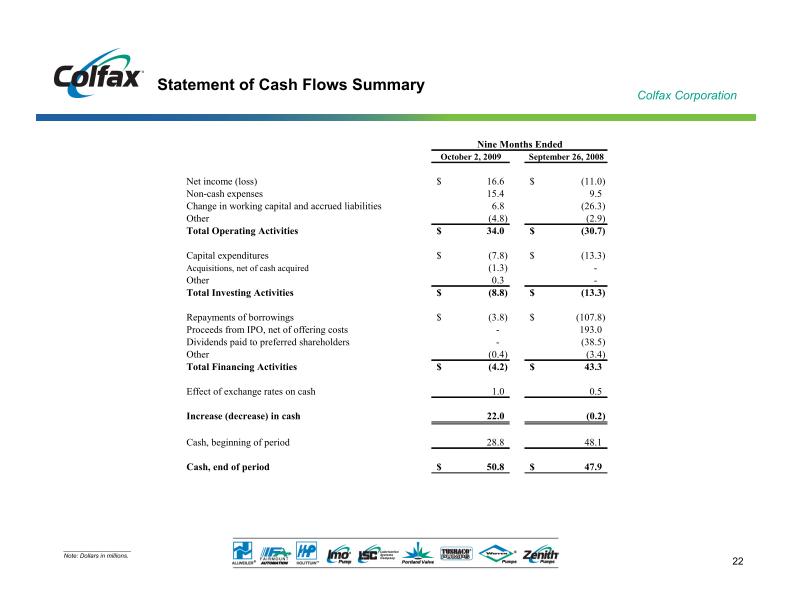
Statement of Cash Flows Summary
October 2, 2009
September 26, 2008
Net income (loss)
16.6
$
(11.0)
$
Non-cash expenses
15.4
9.5
Change in working capital and accrued liabilities
6.8
(26.3)
Other
(4.8)
(2.9)
Total Operating Activities
34.0
$
(30.7)
$
Capital expenditures
(7.8)
$
(13.3)
$
Acquisitions, net of cash acquired
(1.3)
-
Other
0.3
-
Total Investing Activities
(8.8)
$
(13.3)
$
Repayments of borrowings
(3.8)
$
(107.8)
$
Proceeds from IPO, net of offering costs
-
193.0
Dividends paid to preferred shareholders
-
(38.5)
Other
(0.4)
(3.4)
Total Financing Activities
(4.2)
$
43.3
$
Effect of exchange rates on cash
1.0
0.5
Increase (decrease) in cash
22.0
(0.2)
Cash, beginning of period
28.8
48.1
Cash, end of period
50.8
$
47.9
$
Nine Months Ended
22
Continuing to rightsize to align capacity with demand
Major actions since the beginning of the year:
Reduced headcount by 330 employees or 15%
Eliminated temporary, contract and full-time employees
Implemented furlough programs in Germany
Closed facility in Aberdeen, NC and closing Sanford, NC facility by year end
Expect savings of about $16 million in 2009, or about $22 million annualized (including furlough-related savings)
Expect restructuring expenses of about $14 million in 2009 for activities announced to date
Additional restructuring anticipated in 4Q
Will remain agile and respond as conditions warrant
CBS activity continues in all areas
Profit Protection Plan Update
23
Strong balance sheet
Debt to adjusted EBITDA – approximately 1X
Debt of $93 million, principal payments of $9 million in 2010, matures in 2013
Cash = $51 million
$136 million available on revolver
Strong cash flow
Adjusted EBITDA (LTM) of $91 million
Strong Financial Condition
____________________
Note: As of 10/2/09
24
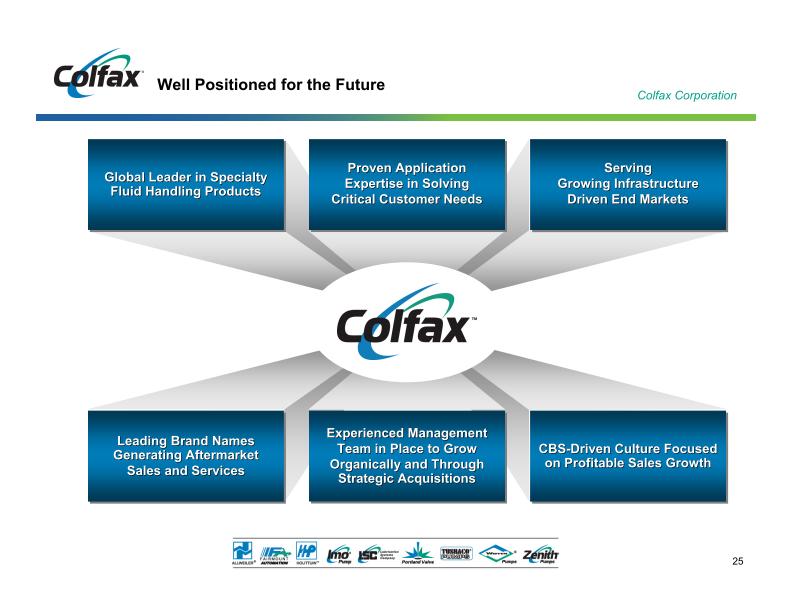
Well Positioned for the Future
Leading Brand Names Generating Aftermarket
Sales and Services
Experienced Management Team in Place to Grow Organically and Through Strategic Acquisitions
Global Leader in Specialty Fluid Handling Products
Proven Application
Expertise in Solving
Critical Customer Needs
Serving
Growing Infrastructure
Driven End Markets
CBS-Driven Culture Focused on Profitable Sales Growth
25

Appendix
26
Adjusted net income, adjusted net income per share, adjusted operating income and adjusted EBITDA exclude asbestos liability and defense costs (income) and asbestos coverage litigation expenses, certain
legacy legal charges, restructuring and other related charges, certain due diligence costs, certain other post-employment benefit settlement, cross currency swap, environmental indemnification and discontinued operations expense (income), as well as
one time initial public offering-related costs to the extent they impact the periods presented. Adjusted selling, general and administrative expenses exclude legacy legal adjustments and certain due diligence costs. Adjusted net income also
reflects interest expense as if the initial public offering (IPO) had occurred at the beginning of 2007 and presents income taxes at an effective tax rate of 32% in 2009 and 34% in 2008. Adjusted net income per share in 2008 assumes the 44,006,026 shares
outstanding at the closing of the IPO to be outstanding since January 1, 2007. Organic sales growth (decline) and organic order growth (decline) exclude the impact of foreign exchange rate fluctuations and acquisitions. These non-GAAP
financial measures assist Colfax in comparing its operating performance on a consistent basis because, among other things, they remove the impact of changes in our capital structure and asset base, non-recurring items such as IPO-related costs, legacy
asbestos issues (except in the case of EBITDA) and items outside the control of its operating management team.
Sales and order information by end market are estimates. We periodically update our customer groupings in order to refine these estimates. During 2009, reclassifications of previously
reported amounts were made to conform to current period presentation. No changes have been made to total sales or orders.
Disclaimer
27
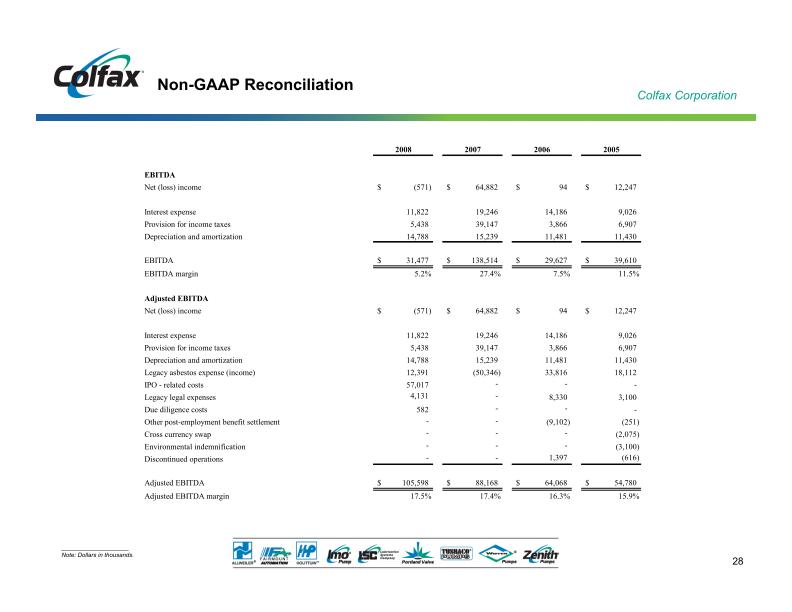
Non-GAAP Reconciliation
____________________
Note: Dollars in thousands.
2008
2007
2006
2005
EBITDA
Net (loss) income
(571)
$
64,882
$
94
$
12,247
$
Interest expense
11,822
19,246
14,186
9,026
Provision for income taxes
5,438
39,147
3,866
6,907
Depreciation and amortization
14,788
15,239
11,481
11,430
EBITDA
31,477
$
138,514
$
29,627
$
39,610
$
EBITDA margin
5.2%
27.4%
7.5%
11.5%
Adjusted EBITDA
Net (loss) income
(571)
$
64,882
$
94
$
12,247
$
Interest expense
11,822
19,246
14,186
9,026
Provision for income taxes
5,438
39,147
3,866
6,907
Depreciation and amortization
14,788
15,239
11,481
11,430
Legacy asbestos expense (income)
12,391
(50,346)
33,816
18,112
IPO - related costs
57,017
-
-
-
Legacy legal expenses
4,131
-
8,330
3,100
Due diligence costs
582
-
-
-
Other post-employment benefit settlement
-
-
(9,102)
(251)
Cross currency swap
-
-
-
(2,075)
Environmental indemnification
-
-
-
(3,100)
Discontinued operations
-
-
1,397
(616)
Adjusted EBITDA
105,598
$
88,168
$
64,068
$
54,780
$
Adjusted EBITDA margin
17.5%
17.4%
16.3%
15.9%
28
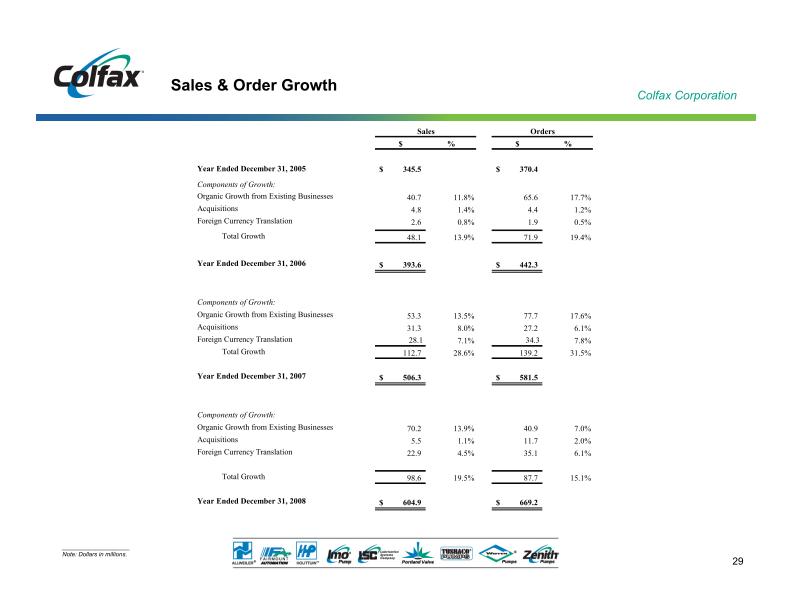
Sales & Order Growth
____________________
Note: Dollars in millions.
$
%
$
%
Year Ended December 31, 2005
345.5
$
370.4
$
Components of Growth:
Organic Growth from Existing Businesses
40.7
11.8%
65.6
17.7%
Acquisitions
4.8
1.4%
4.4
1.2%
Foreign Currency Translation
2.6
0.8%
1.9
0.5%
Total Growth
48.1
13.9%
71.9
19.4%
Year Ended December 31, 2006
393.6
$
442.3
$
Components of Growth:
Organic Growth from Existing Businesses
53.3
13.5%
77.7
17.6%
Acquisitions
31.3
8.0%
27.2
6.1%
Foreign Currency Translation
28.1
7.1%
34.3
7.8%
Total Growth
112.7
28.6%
139.2
31.5%
Year Ended December 31, 2007
506.3
$
581.5
$
Components of Growth:
Organic Growth from Existing Businesses
70.2
13.9%
40.9
7.0%
Acquisitions
5.5
1.1%
11.7
2.0%
Foreign Currency Translation
22.9
4.5%
35.1
6.1%
Total Growth
98.6
19.5%
87.7
15.1%
Year Ended December 31, 2008
604.9
$
669.2
$
Sales
Orders
29
____________________
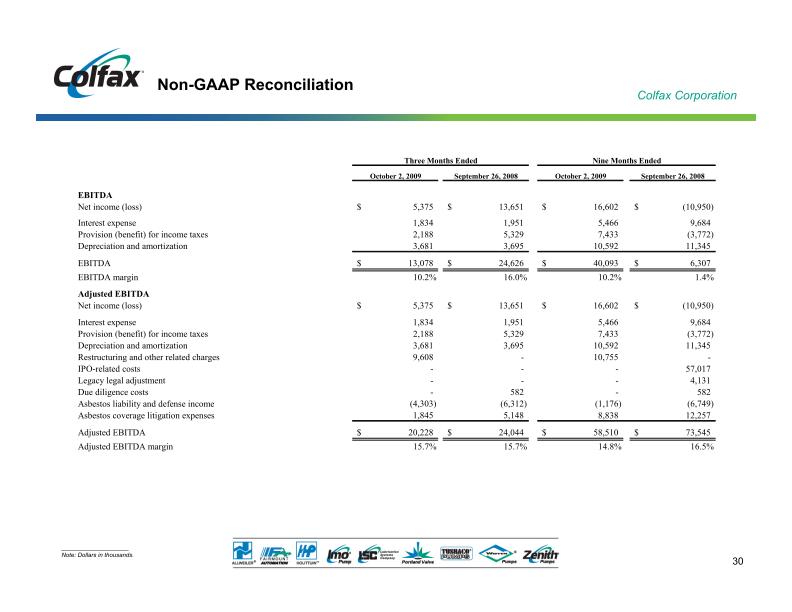
Note: Dollars in thousands.
Non-GAAP Reconciliation
October 2, 2009
September 26, 2008
October 2, 2009
September 26, 2008
EBITDA
Net income (loss)
5,375
$
13,651
$
16,602
$
(10,950)
$
Interest expense
1,834
1,951
5,466
9,684
Provision (benefit) for income taxes
2,188
5,329
7,433
(3,772)
Depreciation and amortization
3,681
3,695
10,592
11,345
EBITDA
13,078
$
24,626
$
40,093
$
6,307
$
EBITDA margin
10.2%
16.0%
10.2%
1.4%
Adjusted EBITDA
Net income (loss)
5,375
$
13,651
$
16,602
$
(10,950)
$
Interest expense
1,834
1,951
5,466
9,684
Provision (benefit) for income taxes
2,188
5,329
7,433
(3,772)
Depreciation and amortization
3,681
3,695
10,592
11,345
Restructuring and other related charges
9,608
-
10,755
-
IPO-related costs
-
-
-
57,017
Legacy legal adjustment
-
-
-
4,131
Due diligence costs
-
582
-
582
Asbestos liability and defense income
(4,303)
(6,312)
(1,176)
(6,749)
Asbestos coverage litigation expenses
1,845
5,148
8,838
12,257
Adjusted EBITDA
20,228
$
24,044
$
58,510
$
73,545
$
Adjusted EBITDA margin
15.7%
15.7%
14.8%
16.5%
Three Months Ended
Nine Months Ended
30
____________________
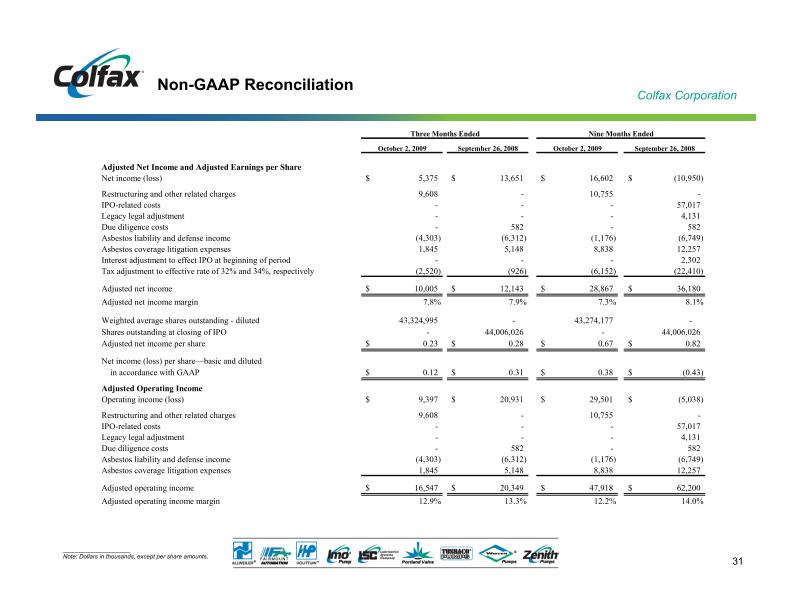
Note: Dollars in thousands, except per share amounts.
Non-GAAP Reconciliation
October 2, 2009
September 26, 2008
October 2, 2009
September 26, 2008
Adjusted Net Income and Adjusted Earnings per Share
Net income (loss)
5,375
$
13,651
$
16,602
$
(10,950)
$
Restructuring and other related charges
9,608
-
10,755
-
IPO-related costs
-
-
-
57,017
Legacy legal adjustment
-
-
-
4,131
Due diligence costs
-
582
-
582
Asbestos liability and defense income
(4,303)
(6,312)
(1,176)
(6,749)
Asbestos coverage litigation expenses
1,845
5,148
8,838
12,257
Interest adjustment to effect IPO at beginning of period
-
-
-
2,302
Tax adjustment to effective rate of 32% and 34%, respectively
(2,520)
(926)
(6,152)
(22,410)
Adjusted net income
10,005
$
12,143
$
28,867
$
36,180
$
Adjusted net income margin
7.8%
7.9%
7.3%
8.1%
Weighted average shares outstanding - diluted
43,324,995
-
43,274,177
-
Shares outstanding at closing of IPO
-
44,006,026
-
44,006,026
Adjusted net income per share
0.23
$
0.28
$
0.67
$
0.82
$
Net income
(
loss
)
per share—basic and diluted
in accordance with GAAP
0.12
$
0.31
$
0.38
$
(0.43)
$
Adjusted Operating Income
Operating income (loss)
9,397
$
20,931
$
29,501
$
(5,038)
$
Restructuring and other related charges
9,608
-
10,755
-
IPO-related costs
-
-
-
57,017
Legacy legal adjustment
-
-
-
4,131
Due diligence costs
-
582
-
582
Asbestos liability and defense income
(4,303)
(6,312)
(1,176)
(6,749)
Asbestos coverage litigation expenses
1,845
5,148
8,838
12,257
Adjusted operating income
16,547
$
20,349
$
47,918
$
62,200
$
Adjusted operating income margin
12.9%
13.3%
12.2%
14.0%
Three Months Ended
Nine Months Ended
31
____________________
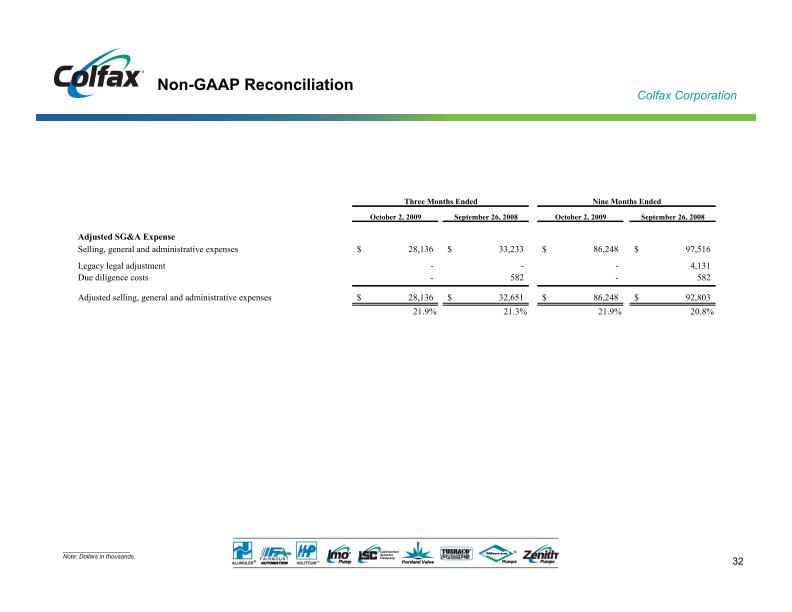
Note: Dollars in thousands.
Non-GAAP Reconciliation
October 2, 2009
September 26, 2008
October 2, 2009
September 26, 2008
Adjusted SG&A Expense
Selling, general and administrative expenses
28,136
$
33,233
$
86,248
$
97,516
$
Legacy legal adjustment
-
-
-
4,131
Due diligence costs
-
582
-
582
Adjusted selling, general and administrative expenses
28,136
$
32,651
$
86,248
$
92,803
$
21.9%
21.3%
21.9%
20.8%
Three Months Ended
Nine Months Ended
32
____________________
Note: Dollars in millions.
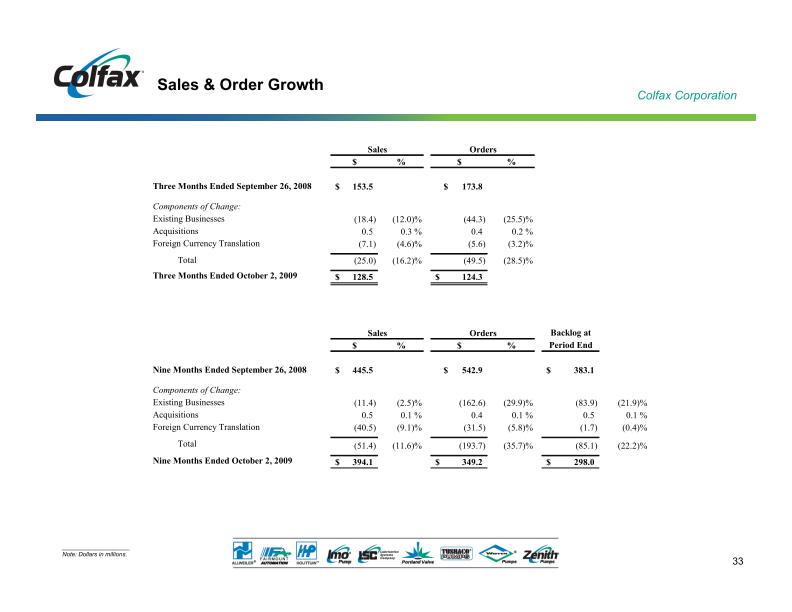
Sales & Order Growth
$
%
$
%
Three Months Ended September 26, 2008
153.5
$
173.8
$
Components of Change:
Existing Businesses
(18.4)
(12.0)%
(44.3)
(25.5)%
Acquisitions
0.5
0.3 %
0.4
0.2 %
Foreign Currency Translation
(7.1)
(4.6)%
(5.6)
(3.2)%
Total
(25.0)
(16.2)%
(49.5)
(28.5)%
Three Months Ended October 2, 2009
128.5
$
124.3
$
Backlog
at
$
%
$
%
Period
End
Nine Months Ended September 26, 2008
445.5
$
542.9
$
383.1
$
Components of Change:
Existing Businesses
(11.4)
(2.5)%
(162.6)
(29.9)%
(83.9)
(21.9)%
Acquisitions
0.5
0.1 %
0.4
0.1 %
0.5
0.1 %
Foreign Currency Translation
(40.5)
(9.1)%
(31.5)
(5.8)%
(1.7)
(0.4)%
Total
(51.4)
(11.6)%
(193.7)
(35.7)%
(85.1)
(22.2)%
Nine Months Ended October 2, 2009
394.1
$
349.2
$
298.0
$
Sales
Orders
Sales
Orders
33