Attached files
| file | filename |
|---|---|
| 8-K - CURRENT REPORT - NATIONWIDE FINANCIAL SERVICES INC/ | d8k.htm |
Exhibit 99.1
Nationwide Financial Services, Inc.
Statistical Supplement
September 30, 2009
Table of Contents
| Page | ||
| Quarterly Financial Highlights |
1-2 | |
| NFS Financial Reporting Structure |
2 | |
| Quarterly Consolidated Income Statements |
4 | |
| Combining Income Statements |
||
| For the three months ended September 30, 2009 |
5 | |
| For the three months ended September 30, 2008 |
6 | |
| Quarterly Consolidated Balance Sheets |
8 | |
| Individual Investments Segment |
||
| Quarterly earnings trends |
9 | |
| Account value activity |
9 | |
| Account values by product |
10 | |
| New and renewal production premiums and deposits by product |
10 | |
| New and renewal production premiums and deposits by channel |
10 | |
| Retirement Plans Segment |
||
| Quarterly earnings trends |
11 | |
| Account value activity |
11 | |
| Account values by product |
12 | |
| New and renewal production premiums and deposits by product |
12 | |
| New and renewal production premiums and deposits by channel |
12 | |
| Individual Protection Segment |
||
| Quarterly earnings trends |
13 | |
| Policy reserves |
13 | |
| Insurance in force |
13 | |
| New and renewal production premiums and deposits by product |
14 | |
| New and renewal production premiums and deposits by channel |
14 | |
| Investment life quarterly earnings trends |
15 | |
| Investment life policy reserve activity |
15 | |
| Fixed life quarterly earnings trends |
16 | |
| Fixed life policy reserve activity |
16 | |
| Corporate and Other Segment |
||
| Quarterly earnings trends |
17 | |
| Nationwide Bank and Medium Term Notes Key Ratios and Statistics |
17 | |
| Account value activity |
17 | |
| Other Data |
||
| Customer funds managed and administered |
18 | |
| Separate account assets by segment and fund type |
18 | |
| Securities available-for-sale |
19 | |
| Aging of gross unrealized losses on securities available-for-sale |
19 | |
| Credit quality of fixed maturity securities available-for-sale |
20 | |
| Mortgage loans by region and property type |
20 | |
| Deferred policy acquisition costs |
21 | |
| Value of business acquired |
22 | |
| Individual variable annuity guaranteed minimum death benefits |
23 | |
| Individual variable annuity guaranteed minimum accumulation benefits |
24 | |
| Individual variable annuity guaranteed minimum income benefits |
24 | |
| Individual variable annuity guaranteed lifetime withdrawal benefits |
26 | |
| Individual variable annuity guaranteed minimum death benefit reserve activity |
26 | |
| Individual fixed annuity and fixed option of variable annuity summary of crediting rate detail |
26 | |
| Historical Data |
27-42 | |
| Glossary |
43-46 | |
Nationwide Financial Services, Inc.
Statistical Supplement
September 30, 2009
Quarterly Financial Highlights
| ($ in millions) | Q3’08 | Q4’08 | Q1’09 | Q2’09 | Q3’09 | ||||||||||||
| Operating Revenues | |||||||||||||||||
| Individual investments |
$ | 314.5 | $ | 401.8 | $ | 364.8 | $ | 193.2 | $ | 251.9 | |||||||
| Retirement plans |
275.0 | 256.2 | 247.4 | 276.4 | 267.7 | ||||||||||||
| Individual protection |
346.3 | 359.6 | 349.6 | 368.0 | 351.8 | ||||||||||||
| Corporate and other |
82.7 | 19.6 | 102.3 | 109.9 | 106.3 | ||||||||||||
| Total operating revenues |
$ | 1,018.5 | $ | 1,037.2 | $ | 1,064.1 | $ | 947.5 | $ | 977.7 | |||||||
| Net realized investment gains/(losses) (1) |
(533.9) | (811.0) | (38.4) | 219.1 | (202.9) | ||||||||||||
| Total revenues |
$ | 484.6 | $ | 226.2 | $ | 1,025.7 | $ | 1,166.6 | $ | 774.8 | |||||||
| Pre-tax Operating Earnings (Loss) |
|||||||||||||||||
| Individual investments |
$ | (120.7) | $ | (209.7) | $ | 16.8 | $ | 9.9 | $ | 26.8 | |||||||
| Retirement plans |
55.3 | 37.4 | 33.3 | 48.8 | 51.8 | ||||||||||||
| Individual protection |
72.2 | 41.0 | 61.0 | 12.6 | 56.4 | ||||||||||||
| Corporate and other |
(50.4) | (129.4) | (4.4) | 8.8 | (1.3) | ||||||||||||
| Pre-tax operating earnings (loss) |
$ | (43.6) | $ | (260.7) | $ | 106.7 | $ | 80.1 | $ | 133.7 | |||||||
| Federal income tax expense |
(21.8) | (109.0) | 26.6 | 0.9 | 16.1 | ||||||||||||
| Net operating earnings (loss) |
$ | (21.8) | $ | (151.7) | $ | 80.1 | $ | 79.2 | $ | 117.6 | |||||||
| Net realized investment gains/(losses), net of taxes (2) |
(315.4) | (476.6) | (187.5) | 126.6 | (134.8) | ||||||||||||
| Discontinued operations, net of taxes |
(9.2) | (4.2) | - | - | - | ||||||||||||
| Net income (loss) |
$ | (346.4) | $ | (632.5) | $ | (107.4) | $ | 205.8 | $ | (17.2) | |||||||
| New and Renewal Production Premiums and Deposits by Channel |
|||||||||||||||||
| Non-affiliated |
|||||||||||||||||
| Independent broker/dealers |
$ | 1,291.1 | $ | 1,277.9 | $ | 1,326.9 | $ | 1,264.7 | $ | 1,229.6 | |||||||
| Financial institutions |
462.5 | 759.1 | 544.4 | 645.6 | 503.5 | ||||||||||||
| Wirehouse and regional firms |
522.2 | 561.9 | 552.4 | 527.8 | 525.2 | ||||||||||||
| Pension plan administrators |
109.1 | 129.3 | 99.9 | 78.0 | 97.9 | ||||||||||||
| Life specialists |
47.2 | 105.5 | 112.1 | 73.1 | 60.9 | ||||||||||||
| Affiliated |
|||||||||||||||||
| Nationwide Retirement Solutions |
1,135.6 | 1,099.0 | 1,072.2 | 1,054.0 | 1,073.1 | ||||||||||||
| Nationwide Financial Network |
302.0 | 318.0 | 281.6 | 265.1 | 244.6 | ||||||||||||
| Mullin TBG |
22.4 | 15.7 | - | - | - | ||||||||||||
| Total |
$ | 3,892.1 | $ | 4,266.4 | $ | 3,989.5 | $ | 3,908.3 | $ | 3,734.8 | |||||||
| (1) | Excluding operating items (periodic net amounts paid or received on interest rate swaps that do not qualify for hedge accounting treatment, trading portfolio realized gains and losses, trading portfolio valuation changes, and net realized gains and losses related to securitizations). |
| (2) | Excluding operating items (periodic net amounts paid or received on interest rate swaps that do not qualify for hedge accounting treatment, trading portfolio realized gains and losses, trading portfolio valuation changes, and net realized gains and losses related to securitizations), and net of adjustment to amortization related to net realized gains/(losses). |
Note: The results of operations of TBG Financial are reflected as discontinued operations for 2008 and all prior years.
1
Nationwide Financial Services, Inc.
Statistical Supplement
September 30, 2009
Quarterly Financial Highlights
| ($ in millions) | Q3’08 | Q4’08 | Q1’09 | Q2’09 | Q3’09 | ||||||||||||
| Balance Sheet Data | |||||||||||||||||
| Total assets |
$ | 102,296.7 | $ | 94,472.6 | $ | 91,134.4 | $ | 96,034.9 | $ | 102,155.3 | |||||||
| Customer funds managed and administered |
$ | 140,882.5 | $ | 126,925.8 | $ | 122,321.5 | $ | 132,249.6 | $ | 143,323.3 | |||||||
| Total equity |
|||||||||||||||||
| Including accumulated other comprehensive income (AOCI) (1) and noncontrolling interest (NCI) |
$ | 4,662.2 | $ | 3,474.8 | $ | 3,448.3 | $ | 4,193.7 | $ | 4,920.8 | |||||||
| AOCI |
(844.4) | (1,370.8) | (1,545.5) | (992.1) | (233.4) | ||||||||||||
| NCI |
450.6 | 416.6 | 405.0 | 390.8 | 376.6 | ||||||||||||
| Excluding AOCI and NCI |
$ | 5,056.0 | $ | 4,429.0 | $ | 4,588.8 | $ | 4,795.0 | $ | 4,777.6 | |||||||
| Net operating return on average equity excluding AOCI and NCI |
(1.7%) | (12.8%) | 7.1% | 6.8% | 9.8% | ||||||||||||
| Statutory capital and surplus |
$ | 2,825.8 | $ | 2,749.9 | $ | 2,429.5 | $ | 2,919.5 | $ | 2,860.8 | |||||||
| (1) | Includes changes in fair value of certain investments and derivatives under SFAS 115 and SFAS 133. |
Note: The results of operations of TBG Financial are reflected as discontinued operations for 2008 and all prior years.
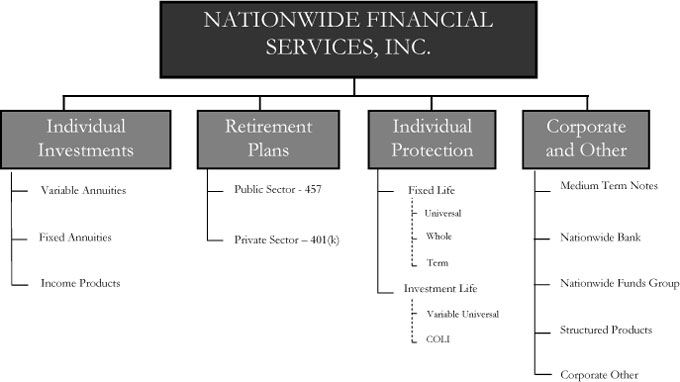
NFS Operating Segment Reporting Structure
2
Nationwide Financial Services, Inc.
Statistical Supplement
September 30, 2009
This Page Intentionally Left Blank.
3
Nationwide Financial Services, Inc.
Statistical Supplement
September 30, 2009
Quarterly Consolidated Income Statements
| ($ in millions) | Q3’08 | Q4’08 | Q1’09 | Q2’09 | Q3’09 | ||||||||||||
| Operating Revenues |
|||||||||||||||||
| Asset fees |
$ | 174.3 | $ | 131.3 | $ | 120.9 | $ | 140.6 | $ | 141.7 | |||||||
| Cost of insurance charges |
113.4 | 115.6 | 118.2 | 117.6 | 117.6 | ||||||||||||
| Administrative fees |
33.1 | 35.0 | 29.1 | 46.6 | 38.0 | ||||||||||||
| Surrender fees |
16.0 | 22.3 | 18.1 | 14.6 | 13.4 | ||||||||||||
| Total policy charges |
336.8 | 304.2 | 286.3 | 319.4 | 310.7 | ||||||||||||
| Premiums |
89.8 | 113.6 | 118.1 | 127.8 | 119.6 | ||||||||||||
| Net investment income |
480.8 | 459.5 | 484.7 | 514.5 | 513.3 | ||||||||||||
| Operating realized gains (losses) |
(21.2) | 49.0 | 76.6 | (118.5) | (84.5) | ||||||||||||
| Other income |
132.3 | 110.9 | 98.4 | 104.3 | 118.6 | ||||||||||||
| Total operating revenues |
1,018.5 | 1,037.2 | 1,064.1 | 947.5 | 977.7 | ||||||||||||
| Benefits |
|||||||||||||||||
| Interest credited to policyholder accounts |
300.8 | 303.3 | 282.6 | 293.3 | 284.2 | ||||||||||||
| Life insurance and annuity benefits |
188.1 | 336.9 | 299.5 | 135.1 | 157.9 | ||||||||||||
| Policyholder dividends |
23.7 | 21.1 | 21.4 | 23.5 | 22.4 | ||||||||||||
| Total benefits |
512.6 | 661.3 | 603.5 | 451.9 | 464.5 | ||||||||||||
| Expenses |
|||||||||||||||||
| Commissions |
154.0 | 159.4 | 134.4 | 147.3 | 143.9 | ||||||||||||
| General operating expenses |
219.5 | 287.5 | 232.4 | 215.4 | 225.7 | ||||||||||||
| Deferral of policy acquisition costs |
(128.6) | (146.4) | (123.4) | (132.4) | (121.1) | ||||||||||||
| Subtotal |
244.9 | 300.5 | 243.4 | 230.3 | 248.5 | ||||||||||||
| Amortization of policy acquisition costs |
268.9 | 300.2 | 77.6 | 138.1 | 93.2 | ||||||||||||
| Amortization of VOBA and other intangible assets |
9.6 | 10.0 | 6.9 | 21.3 | 12.1 | ||||||||||||
| Interest expense |
26.1 | 25.9 | 26.0 | 25.8 | 25.7 | ||||||||||||
| Total expenses |
549.5 | 636.6 | 353.9 | 415.5 | 379.5 | ||||||||||||
| Pre-tax operating earnings (loss) |
$ | (43.6) | $ | (260.7) | $ | 106.7 | $ | 80.1 | $ | 133.7 | |||||||
| Federal income tax expense |
(21.8) | (109.0) | 26.6 | 0.9 | 16.1 | ||||||||||||
| Net operating earnings (loss) |
$ | (21.8) | $ | (151.7) | $ | 80.1 | $ | 79.2 | $ | 117.6 | |||||||
| Net realized investment gains/(losses), net of taxes (1) |
|||||||||||||||||
| Realized gains/(losses) on sales, net of hedging |
(17.2) | 1.2 | 17.0 | 18.5 | (1.6) | ||||||||||||
| Other-than-temporary impairments, including mortgage loan valuation allowance adjustment |
(257.8) | (367.8) | (212.5) | (25.3) | (96.9) | ||||||||||||
| Credit default swaps |
(4.0) | 2.3 | (3.4) | 3.9 | 0.4 | ||||||||||||
| Derivatives, excluding hedging gains and losses on sales and credit default swaps |
(42.0) | (129.3) | 12.9 | 131.3 | (36.2) | ||||||||||||
| Amounts credited to policyholder dividend obligation |
5.6 | 16.8 | (1.5) | (1.8) | (0.5) | ||||||||||||
| Adjustment to VOBA amortization |
- | 0.2 | - | - | - | ||||||||||||
| Subtotal |
(315.4) | (476.6) | (187.5) | 126.6 | (134.8) | ||||||||||||
| Discontinued operations, net of taxes |
(9.2) | (4.2) | - | - | - | ||||||||||||
| Net income (loss) |
$ | (346.4) | $ | (632.5) | $ | (107.4) | $ | 205.8 | $ | (17.2) | |||||||
| (1) | Excluding operating items (periodic net amounts paid or received on interest rate swaps that do not qualify for hedge accounting treatment, trading portfolio realized gains and losses, trading portfolio valuation changes, and net realized gains and losses related to securitizations), and net of adjustment to amortization related to net realized gains/(losses). |
Note: The results of operations of TBG Financial are reflected as discontinued operations for 2008 and all prior years.
4
Nationwide Financial Services, Inc.
Statistical Supplement
September 30, 2009
Combining Income Statement
For the three months ended September 30, 2009
| ($ in millions) | Individual Investments |
Retirement Plans |
Individual Protection |
Corporate and Other |
Total | ||||||||||||
| Operating Revenues |
|||||||||||||||||
| Asset fees |
$ | 116.1 | $ | 15.8 | $ | 9.8 | $ | - | $ | 141.7 | |||||||
| Cost of insurance charges |
- | - | 117.6 | - | 117.6 | ||||||||||||
| Administrative fees |
13.6 | 1.9 | 22.5 | - | 38.0 | ||||||||||||
| Surrender fees |
6.7 | 0.3 | 6.4 | - | 13.4 | ||||||||||||
| Total policy charges |
136.4 | 18.0 | 156.3 | - | 310.7 | ||||||||||||
| Premiums |
45.8 | - | 73.8 | - | 119.6 | ||||||||||||
| Net investment income |
150.3 | 169.5 | 121.2 | 72.3 | 513.3 | ||||||||||||
| Operating realized gains (losses) |
(85.6) | - | - | 1.1 | (84.5) | ||||||||||||
| Other income |
5.0 | 80.2 | 0.5 | 32.9 | 118.6 | ||||||||||||
| Total operating revenues |
251.9 | 267.7 | 351.8 | 106.3 | 977.7 | ||||||||||||
| Benefits |
|||||||||||||||||
| Interest credited to policyholder accounts |
104.9 | 103.6 | 49.6 | 26.1 | 284.2 | ||||||||||||
| Life insurance and annuity benefits |
24.8 | - | 133.1 | - | 157.9 | ||||||||||||
| Policyholder dividends |
- | - | 22.4 | - | 22.4 | ||||||||||||
| Total benefits |
129.7 | 103.6 | 205.1 | 26.1 | 464.5 | ||||||||||||
| Expenses |
|||||||||||||||||
| Commissions |
73.2 | 36.5 | 31.6 | 2.6 | 143.9 | ||||||||||||
| General operating expenses |
42.1 | 74.7 | 58.0 | 50.9 | 225.7 | ||||||||||||
| Deferral of policy acquisition costs |
(70.7) | (8.0) | (42.4) | - | (121.1) | ||||||||||||
| Subtotal |
44.6 | 103.2 | 47.2 | 53.5 | 248.5 | ||||||||||||
| Amortization of policy acquisition costs |
50.5 | 8.6 | 34.1 | - | 93.2 | ||||||||||||
| Amortization of VOBA and other intangible assets |
0.3 | 0.5 | 9.0 | 2.3 | 12.1 | ||||||||||||
| Interest expense |
- | - | - | 25.7 | 25.7 | ||||||||||||
| Total expenses |
95.4 | 112.3 | 90.3 | 81.5 | 379.5 | ||||||||||||
| Pre-tax operating earnings (loss) |
$ | 26.8 | $ | 51.8 | $ | 56.4 | $ | (1.3) | $ | 133.7 | |||||||
| Federal income tax expense |
16.1 | ||||||||||||||||
| Net operating earnings (loss) |
$ | 117.6 | |||||||||||||||
| Net realized investment gains/(losses), net of taxes (1) |
(134.8) | ||||||||||||||||
| Discontinued operations, net of taxes |
- | ||||||||||||||||
| Net income (loss) |
$ | (17.2) | |||||||||||||||
| (1) | Excluding operating items (periodic net amounts paid or received on interest rate swaps that do not qualify for hedge accounting treatment, trading portfolio realized gains and losses, trading portfolio valuation changes, and net realized gains and losses related to securitizations), and net of adjustment to amortization related to net realized gains/(losses). |
5
Nationwide Financial Services, Inc.
Statistical Supplement
September 30, 2009
Combining Income Statement
For the three months ended September 30, 2008
| ($ in millions) | Individual Investments |
Retirement Plans |
Individual Protection |
Corporate and Other |
Total | ||||||||||||
| Operating Revenues |
|||||||||||||||||
| Asset fees |
$ | 135.7 | $ | 26.3 | $ | 12.3 | $ | - | $ | 174.3 | |||||||
| Cost of insurance charges |
- | - | 113.4 | - | 113.4 | ||||||||||||
| Administrative fees |
8.9 | 2.6 | 21.6 | - | 33.1 | ||||||||||||
| Surrender fees |
11.0 | 0.4 | 4.6 | - | 16.0 | ||||||||||||
| Total policy charges |
155.6 | 29.3 | 151.9 | - | 336.8 | ||||||||||||
| Premiums |
20.2 | - | 69.6 | - | 89.8 | ||||||||||||
| Net investment income |
131.5 | 163.9 | 123.9 | 61.5 | 480.8 | ||||||||||||
| Operating realized gains (losses) |
- | - | - | (21.2) | (21.2) | ||||||||||||
| Other income |
7.2 | 81.8 | 0.9 | 42.4 | 132.3 | ||||||||||||
| Total operating revenues |
314.5 | 275.0 | 346.3 | 82.7 | 1,018.5 | ||||||||||||
| Benefits |
|||||||||||||||||
| Interest credited to policyholder accounts |
93.3 | 110.6 | 50.1 | 46.8 | 300.8 | ||||||||||||
| Life insurance and annuity benefits |
70.4 | 1.1 | 116.6 | - | 188.1 | ||||||||||||
| Policyholder dividends |
- | - | 23.7 | - | 23.7 | ||||||||||||
| Total benefits |
163.7 | 111.7 | 190.4 | 46.8 | 512.6 | ||||||||||||
| Expenses |
|||||||||||||||||
| Commissions |
75.4 | 39.5 | 34.9 | 4.2 | 154.0 | ||||||||||||
| General operating expenses |
39.9 | 67.4 | 56.6 | 55.6 | 219.5 | ||||||||||||
| Deferral of policy acquisition costs |
(70.6) | (8.5) | (49.5) | - | (128.6) | ||||||||||||
| Subtotal |
44.7 | 98.4 | 42.0 | 59.8 | 244.9 | ||||||||||||
| Amortization of policy acquisition costs |
226.3 | 9.1 | 33.5 | - | 268.9 | ||||||||||||
| Amortization of VOBA and other intangible assets |
0.5 | 0.5 | 8.2 | 0.4 | 9.6 | ||||||||||||
| Interest expense |
- | - | - | 26.1 | 26.1 | ||||||||||||
| Total expenses |
271.5 | 108.0 | 83.7 | 86.3 | 549.5 | ||||||||||||
| Pre-tax operating earnings (loss) |
$ | (120.7) | $ | 55.3 | $ | 72.2 | $ | (50.4) | $ | (43.6) | |||||||
| Federal income tax expense |
(21.8) | ||||||||||||||||
| Net operating earnings (loss) |
$ | (21.8) | |||||||||||||||
| Net realized investment gains/(losses), net of taxes (1) |
(315.4) | ||||||||||||||||
| Discontinued operations, net of taxes |
(9.2) | ||||||||||||||||
| Net income (loss) |
$ | (346.4) | |||||||||||||||
| (1) | Excluding operating items (periodic net amounts paid or received on interest rate swaps that do not qualify for hedge accounting treatment, trading portfolio realized gains and losses, trading portfolio valuation changes, and net realized gains and losses related to securitizations), and net of adjustment to amortization related to net realized gains/(losses). |
Note: The results of operations of TBG Financial are reflected as discontinued operations for 2008 and all prior years.
6
Nationwide Financial Services, Inc.
Statistical Supplement
September 30, 2009
This Page Intentionally Left Blank.
7
Nationwide Financial Services, Inc.
Statistical Supplement
September 30, 2009
Quarterly Consolidated Balance Sheets
| ($ in millions) | Q3’08 | Q4’08 | Q1’09 | Q2’09 | Q3’09 | ||||||||||||
| Assets |
|||||||||||||||||
| Investments |
|||||||||||||||||
| Securities available-for-sale, at fair value: |
|||||||||||||||||
| Fixed maturity securities |
$ | 24,849.6 | $ | 23,069.7 | $ | 23,726.9 | $ | 25,696.6 | $ | 27,125.1 | |||||||
| Equity securities |
69.3 | 60.7 | 47.6 | 51.7 | 60.5 | ||||||||||||
| Trading assets |
63.7 | 66.1 | 59.1 | 54.4 | 36.4 | ||||||||||||
| Mortgage loans on real estate, net |
7,913.9 | 7,888.2 | 7,728.5 | 7,514.3 | 7,294.1 | ||||||||||||
| Real estate |
16.4 | 16.5 | 16.4 | 16.6 | 12.4 | ||||||||||||
| Policy loans |
1,050.4 | 1,095.6 | 1,080.1 | 1,067.8 | 1,040.5 | ||||||||||||
| Other long-term investments |
1,228.8 | 968.1 | 914.3 | 922.5 | 871.6 | ||||||||||||
| Short-term investments |
1,188.6 | 3,055.0 | 2,385.4 | 1,703.1 | 1,780.7 | ||||||||||||
| Total investments |
36,380.7 | 36,219.9 | 35,958.3 | 37,027.0 | 38,221.3 | ||||||||||||
| Cash |
145.0 | 165.5 | 132.8 | 77.5 | 84.4 | ||||||||||||
| Accrued investment income |
388.7 | 352.1 | 417.3 | 385.5 | 419.9 | ||||||||||||
| Deferred policy acquisition costs |
4,428.3 | 4,523.8 | 4,286.0 | 4,060.5 | 3,766.9 | ||||||||||||
| Value of business acquired |
338.2 | 334.0 | 321.9 | 316.4 | 289.9 | ||||||||||||
| Other intangible assets |
41.9 | 17.1 | 16.7 | 16.2 | 13.8 | ||||||||||||
| Goodwill |
292.4 | 246.5 | 246.5 | 246.5 | 246.5 | ||||||||||||
| Other assets |
2,373.0 | 3,773.0 | 4,229.7 | 2,975.2 | 2,640.8 | ||||||||||||
| Separate account assets |
57,908.5 | 48,840.7 | 45,525.2 | 50,930.1 | 56,471.8 | ||||||||||||
| Total assets |
$ | 102,296.7 | $ | 94,472.6 | $ | 91,134.4 | $ | 96,034.9 | $ | 102,155.3 | |||||||
| Liabilities and equity |
|||||||||||||||||
| Future policy benefits and claims |
$ | 34,252.3 | $ | 35,720.0 | $ | 35,720.7 | $ | 34,618.0 | $ | 34,056.5 | |||||||
| Short-term debt |
336.6 | 295.7 | 312.6 | 384.1 | 563.5 | ||||||||||||
| Long-term debt |
1,720.3 | 1,725.9 | 1,726.0 | 1,726.1 | 1,726.9 | ||||||||||||
| Other liabilities |
3,416.8 | 4,415.5 | 4,401.6 | 4,182.9 | 4,415.8 | ||||||||||||
| Separate account liabilities |
57,908.5 | 48,840.7 | 45,525.2 | 50,930.1 | 56,471.8 | ||||||||||||
| 97,634.5 | 90,997.8 | 87,686.1 | 91,841.2 | 97,234.5 | |||||||||||||
| Total equity |
4,662.2 | 3,474.8 | 3,448.3 | 4,193.7 | 4,920.8 | ||||||||||||
| Total liabilities and equity |
$ | 102,296.7 | $ | 94,472.6 | $ | 91,134.4 | $ | 96,034.9 | $ | 102,155.3 | |||||||
| Capital Structure | |||||||||||||||||
| ($ in millions) | Q3’08 | Q4’08 | Q1’09 | Q2’09 | Q3’09 | ||||||||||||
| Total capital, including AOCI and NCI |
$ | 6,382.5 | $ | 5,200.7 | $ | 5,174.3 | $ | 5,919.8 | $ | 6,647.7 | |||||||
| Less AOCI |
(844.4) | (1,370.8) | (1,545.5) | (992.1) | (233.4) | ||||||||||||
| Less NCI |
450.6 | 416.6 | 405.0 | 390.8 | 376.6 | ||||||||||||
| Total capital, excluding AOCI and NCI |
$ | 6,776.3 | $ | 6,154.9 | $ | 6,314.8 | $ | 6,521.1 | $ | 6,504.5 | |||||||
| Leverage, excluding AOCI and NCI |
|||||||||||||||||
| Long-term debt—to—total capital |
25.4% | 28.0% | 27.3% | 26.5% | 26.5% | ||||||||||||
| Ratio of pre-tax operating earnings (loss) before interest expense to interest expense |
-0.7X | -9.1X | 5.1X | 4.1X | 6.2X | ||||||||||||
8
Nationwide Financial Services, Inc.
Statistical Supplement
September 30, 2009
Individual Investments
Quarterly Earnings Trends
| ($ in millions) | Q3’08 | Q4’08 | Q1’09 | Q2’09 | Q3’09 | ||||||||||||
| Operating Revenues |
|||||||||||||||||
| Asset fees |
$ | 135.7 | $ | 102.9 | $ | 95.2 | $ | 104.7 | $ | 116.1 | |||||||
| Administrative fees |
8.9 | 9.2 | 8.6 | 11.7 | 13.6 | ||||||||||||
| Surrender fees |
11.0 | 11.3 | 10.4 | 7.6 | 6.7 | ||||||||||||
| Total policy charges |
155.6 | 123.4 | 114.2 | 124.0 | 136.4 | ||||||||||||
| Net Investment Income |
|||||||||||||||||
| General account assets |
132.8 | 131.5 | 130.0 | 150.2 | 155.8 | ||||||||||||
| Charge for invested capital |
(1.3) | 0.5 | (7.2) | (5.9) | (5.5) | ||||||||||||
| Total net investment income |
131.5 | 132.0 | 122.8 | 144.3 | 150.3 | ||||||||||||
| Premiums |
20.2 | 35.9 | 41.2 | 52.3 | 45.8 | ||||||||||||
| Operating realized gains |
- | 106.9 | 82.0 | (130.5) | (85.6) | ||||||||||||
| Other income |
7.2 | 3.6 | 4.6 | 3.1 | 5.0 | ||||||||||||
| Total operating revenues |
314.5 | 401.8 | 364.8 | 193.2 | 251.9 | ||||||||||||
| Benefits |
|||||||||||||||||
| Interest credited to policyholder accounts |
93.3 | 97.4 | 94.1 | 97.8 | 104.9 | ||||||||||||
| Immediate annuity benefits |
19.5 | 31.6 | 36.5 | 46.1 | 43.4 | ||||||||||||
| Policy benefits |
50.9 | 164.7 | 125.9 | (58.7) | (18.6) | ||||||||||||
| Total benefits |
163.7 | 293.7 | 256.5 | 85.2 | 129.7 | ||||||||||||
| Expenses |
|||||||||||||||||
| Commissions |
75.4 | 87.0 | 69.8 | 79.8 | 73.2 | ||||||||||||
| General operating expenses |
39.9 | 50.6 | 49.2 | 46.3 | 42.1 | ||||||||||||
| Deferral of policy acquisition costs |
(70.6) | (84.6) | (71.7) | (81.6) | (70.7) | ||||||||||||
| Subtotal |
44.7 | 53.0 | 47.3 | 44.5 | 44.6 | ||||||||||||
| Amortization of policy acquisition costs |
226.3 | 261.7 | 44.1 | 53.3 | 50.5 | ||||||||||||
| Amortization of VOBA and other intangible assets |
0.5 | 3.1 | 0.1 | 0.3 | 0.3 | ||||||||||||
| Total expenses |
271.5 | 317.8 | 91.5 | 98.1 | 95.4 | ||||||||||||
| Pre-tax operating earnings (loss) |
$ | (120.7) | $ | (209.7) | $ | 16.8 | $ | 9.9 | $ | 26.8 | |||||||
| Key Ratios/Statistics |
|||||||||||||||||
| Average Account Values: |
|||||||||||||||||
| General account |
$ | 10,028.4 | $ | 10,976.7 | $ | 11,861.6 | $ | 11,524.1 | $ | 10,942.4 | |||||||
| Separate account |
36,171.4 | 30,721.3 | 26,623.8 | 27,331.9 | 30,866.3 | ||||||||||||
| Advisory services program |
441.3 | 221.2 | 41.3 | - | - | ||||||||||||
| Total average individual investments account values |
$ | 46,641.1 | $ | 41,919.2 | $ | 38,526.7 | $ | 38,856.0 | $ | 41,808.7 | |||||||
| Earned rate |
5.30% | 4.79% | 4.38% | 5.21% | 5.70% | ||||||||||||
| Credited rate |
3.72% | 3.55% | 3.17% | 3.39% | 3.84% | ||||||||||||
| Interest spread on average general account values |
1.58% | 1.24% | 1.21% | 1.82% | 1.86% | ||||||||||||
| Income from mortgage loan prepayments and bond call premiums |
0.09% | 0.03% | 0.01% | 0.05% | 0.02% | ||||||||||||
| Base interest spread on average general account values |
1.49% | 1.21% | 1.20% | 1.77% | 1.84% | ||||||||||||
| Asset fees to average separate account values |
1.50% | 1.34% | 1.43% | 1.53% | 1.50% | ||||||||||||
| General operating expenses to average account values |
0.34% | 0.48% | 0.51% | 0.48% | 0.40% | ||||||||||||
| Pre-tax operating earnings (loss) to average account values |
-1.04% | -2.00% | 0.17% | 0.10% | 0.26% | ||||||||||||
| Pre-tax operating earnings (loss) to operating revenues |
-38.4% | -52.2% | 4.6% | 5.1% | 10.6% | ||||||||||||
| Average allocated capital |
$ | 1,347.6 | $ | 1,216.4 | $ | 1,142.2 | $ | 1,249.5 | $ | 1,350.6 | |||||||
| Return on average allocated capital |
-21.7% | -43.1% | 6.5% | 5.9% | 7.7% | ||||||||||||
| Individual Investments Account Value Activity
| |||||||||||||||||
| ($ in millions) | Q3’08 | Q4’08 | Q1’09 | Q2’09 | Q3’09 | ||||||||||||
| Individual Variable Annuities |
|||||||||||||||||
| Balance, beginning of period |
$ | 42,075.0 | $ | 37,660.1 | $ | 32,954.3 | $ | 30,964.2 | $ | 33,509.2 | |||||||
| Deposits |
978.5 | 1,052.0 | 959.1 | 1,046.6 | 972.7 | ||||||||||||
| Withdrawals and surrenders |
(1,546.4) | (1,296.0) | (1,105.2) | (975.1) | (974.0) | ||||||||||||
| Net flows |
(567.9) | (244.0) | (146.1) | 71.5 | (1.3) | ||||||||||||
| Investment performance/interest credited to policyholder accounts |
(4,034.8) | (5,710.5) | (1,594.1) | 3,364.2 | 3,675.0 | ||||||||||||
| Policy charges |
(154.4) | (122.0) | (113.2) | (123.0) | (135.5) | ||||||||||||
| Benefits and other |
342.2 | 1,370.7 | (136.7) | (767.7) | (306.2) | ||||||||||||
| Balance, end of period |
$ | 37,660.1 | $ | 32,954.3 | $ | 30,964.2 | $ | 33,509.2 | $ | 36,741.2 | |||||||
| Individual Fixed Annuities |
|||||||||||||||||
| Balance, beginning of period |
$ | 4,273.1 | $ | 4,155.0 | $ | 4,406.9 | $ | 4,420.5 | $ | 4,543.2 | |||||||
| Deposits |
81.5 | 451.0 | 152.9 | 226.6 | 39.5 | ||||||||||||
| Withdrawals and surrenders |
(236.4) | (240.1) | (176.9) | (143.3) | (161.4) | ||||||||||||
| Net flows |
(154.9) | 210.9 | (24.0) | 83.3 | (121.9) | ||||||||||||
| Policyholder interest credited |
36.8 | 37.3 | 40.5 | 41.2 | 41.7 | ||||||||||||
| Policy charges |
(0.9) | (1.0) | (0.6) | (0.6) | (0.5) | ||||||||||||
| Benefits and other |
0.9 | 4.7 | (2.3) | (1.2) | 5.6 | ||||||||||||
| Balance, end of period |
$ | 4,155.0 | $ | 4,406.9 | $ | 4,420.5 | $ | 4,543.2 | $ | 4,468.1 | |||||||
| Income Products |
$ | 2,112.3 | $ | 2,107.4 | $ | 2,117.5 | $ | 2,157.4 | $ | 2,198.2 | |||||||
| Advisory Services Program |
$ | 359.8 | $ | 82.6 | $ | - | $ | - | $ | - | |||||||
| Total individual investment account values |
$ | 44,287.2 | $ | 39,551.2 | $ | 37,502.2 | $ | 40,209.8 | $ | 43,407.5 | |||||||
9
Nationwide Financial Services, Inc.
Statistical Supplement
September 30, 2009
Individual Investments
Account Values by Product
| ($ in millions) | Q3’08 | Q4’08 | Q1’09 | Q2’09 | Q3’09 | ||||||||||||
| Individual Variable Annuities |
|||||||||||||||||
| BEST of AMERICA products |
$ | 31,657.3 | $ | 27,934.2 | $ | 26,253.1 | $ | 28,427.2 | $ | 31,140.8 | |||||||
| Private label annuities |
5,793.0 | 4,860.4 | 4,569.0 | 4,935.1 | 5,440.4 | ||||||||||||
| Nationwide Financial Network and other |
209.8 | 159.7 | 142.1 | 146.9 | 160.0 | ||||||||||||
| Total individual variable annuities |
$ | 37,660.1 | $ | 32,954.3 | $ | 30,964.2 | $ | 33,509.2 | $ | 36,741.2 | |||||||
| Individual Fixed Annuities |
$ | 4,155.0 | $ | 4,406.9 | $ | 4,420.5 | $ | 4,543.2 | $ | 4,468.1 | |||||||
| Income Products |
$ | 2,112.3 | $ | 2,107.4 | $ | 2,117.5 | $ | 2,157.4 | $ | 2,198.2 | |||||||
| Advisory Services Program |
$ | 359.8 | $ | 82.6 | $ | - | $ | - | $ | - | |||||||
| Total individual investment account values |
$ | 44,287.2 | $ | 39,551.2 | $ | 37,502.2 | $ | 40,209.8 | $ | 43,407.5 | |||||||
| Individual Investments New and Renewal Production Premiums and Deposits by Product
| |||||||||||||||||
| ($ in millions) | Q3’08 | Q4’08 | Q1’09 | Q2’09 | Q3’09 | ||||||||||||
| Individual Variable Annuities |
|||||||||||||||||
| BEST of AMERICA products |
$ | 804.4 | $ | 899.9 | $ | 830.4 | $ | 936.9 | $ | 836.6 | |||||||
| Private label annuities |
89.2 | 96.6 | 78.6 | 67.4 | 83.6 | ||||||||||||
| Nationwide Financial Network and other |
0.4 | 0.3 | 0.2 | 0.1 | 0.1 | ||||||||||||
| Total individual variable annuities |
$ | 894.0 | $ | 996.8 | $ | 909.2 | $ | 1,004.4 | $ | 920.3 | |||||||
| Individual Fixed Annuities |
$ | 77.2 | $ | 442.1 | $ | 150.9 | $ | 225.4 | $ | 38.6 | |||||||
| Income Products |
$ | 37.7 | $ | 54.3 | $ | 58.4 | $ | 75.0 | $ | 66.8 | |||||||
| Portfolio Income Insurance |
$ | - | $ | - | $ | - | $ | - | $ | 4.1 | |||||||
| Advisory Services Program |
$ | 4.6 | $ | 1.3 | $ | - | $ | - | $ | - | |||||||
| Total new and renewal production premiums and deposits |
$ | 1,013.5 | $ | 1,494.5 | $ | 1,118.5 | $ | 1,304.8 | $ | 1,029.8 | |||||||
| Individual Investments New and Renewal Production Premiums and Deposits by Channel
| |||||||||||||||||
| ($ in millions) | Q3’08 | Q4’08 | Q1’09 | Q2’09 | Q3’09 | ||||||||||||
| Individual Variable Annuities |
|||||||||||||||||
| Non-affiliated |
|||||||||||||||||
| Independent broker/dealers |
$ | 312.9 | $ | 374.5 | $ | 344.5 | $ | 383.6 | $ | 298.2 | |||||||
| Wirehouse and regional firms |
234.8 | 263.3 | 240.0 | 244.1 | 250.8 | ||||||||||||
| Financial institutions |
285.6 | 301.1 | 277.9 | 336.2 | 339.3 | ||||||||||||
| Affiliated |
|||||||||||||||||
| Nationwide Financial Network |
60.7 | 57.9 | 46.8 | 40.5 | 32.0 | ||||||||||||
| Total individual variable annuities |
$ | 894.0 | $ | 996.8 | $ | 909.2 | $ | 1,004.4 | $ | 920.3 | |||||||
| Individual Fixed Annuities |
|||||||||||||||||
| Non-affiliated |
|||||||||||||||||
| Independent broker/dealers |
$ | 12.3 | $ | 46.6 | $ | 17.5 | $ | 12.2 | $ | 4.7 | |||||||
| Wirehouse and regional firms |
7.7 | 39.7 | 15.2 | 16.7 | 4.3 | ||||||||||||
| Financial institutions |
26.3 | 314.3 | 87.5 | 170.6 | 15.0 | ||||||||||||
| Affiliated |
|||||||||||||||||
| Nationwide Financial Network |
30.9 | 41.5 | 30.7 | 25.9 | 14.6 | ||||||||||||
| Total individual fixed annuities |
$ | 77.2 | $ | 442.1 | $ | 150.9 | $ | 225.4 | $ | 38.6 | |||||||
| Income Products |
|||||||||||||||||
| Non-affiliated |
|||||||||||||||||
| Independent broker/dealers |
$ | 16.6 | $ | 25.3 | $ | 25.4 | $ | 34.0 | $ | 26.8 | |||||||
| Wirehouse and regional firms |
12.5 | 19.2 | 20.4 | 25.0 | 25.5 | ||||||||||||
| Financial institutions |
4.9 | 5.4 | 8.9 | 11.9 | 11.0 | ||||||||||||
| Affiliated |
|||||||||||||||||
| Nationwide Financial Network |
3.7 | 4.4 | 3.7 | 4.1 | 3.5 | ||||||||||||
| Total income products |
$ | 37.7 | $ | 54.3 | $ | 58.4 | $ | 75.0 | $ | 66.8 | |||||||
| Portfolio Income Insurance |
|||||||||||||||||
| Non-affiliated |
|||||||||||||||||
| Wirehouse and regional firms |
- | - | - | - | 4.1 | ||||||||||||
| Total portfolio insurance |
$ | - | $ | - | $ | - | $ | - | $ | 4.1 | |||||||
| Advisory Services Program |
|||||||||||||||||
| Non-affiliated |
|||||||||||||||||
| Independent broker/dealers |
$ | 3.3 | $ | 1.2 | $ | - | $ | - | $ | - | |||||||
| Financial institutions |
0.5 | - | - | - | - | ||||||||||||
| Affiliated |
|||||||||||||||||
| Nationwide Financial Network |
0.8 | 0.1 | - | - | - | ||||||||||||
| Total advisory services program |
$ | 4.6 | $ | 1.3 | $ | - | $ | - | $ | - | |||||||
| Total new and renewal production premiums and deposits |
$ | 1,013.5 | $ | 1,494.5 | $ | 1,118.5 | $ | 1,304.8 | $ | 1,029.8 | |||||||
10
Nationwide Financial Services, Inc.
Statistical Supplement
September 30, 2009
Retirement Plans
Quarterly Earnings Trends
| ($ in millions) | Q3’08 | Q4’08 | Q1’09 | Q2’09 | Q3’09 | ||||||||||||
| Operating Revenues |
|||||||||||||||||
| Asset fees |
$ | 26.3 | $ | 18.6 | $ | 17.0 | $ | 26.6 | $ | 15.8 | |||||||
| Administrative fees |
2.6 | 5.2 | 2.7 | 2.2 | 1.9 | ||||||||||||
| Surrender fees |
0.4 | 0.4 | 0.6 | - | 0.3 | ||||||||||||
| Total policy charges |
29.3 | 24.2 | 20.3 | 28.8 | 18.0 | ||||||||||||
| Net investment income |
163.9 | 164.9 | 161.4 | 175.8 | 169.5 | ||||||||||||
| Other income |
81.8 | 67.1 | 65.7 | 71.8 | 80.2 | ||||||||||||
| Total operating revenues |
275.0 | 256.2 | 247.4 | 276.4 | 267.7 | ||||||||||||
| Benefits |
|||||||||||||||||
| Interest credited to policyholder accounts |
110.6 | 111.2 | 105.2 | 113.3 | 103.6 | ||||||||||||
| Other policy benefits |
1.1 | (1.1) | - | - | - | ||||||||||||
| Total benefits |
111.7 | 110.1 | 105.2 | 113.3 | 103.6 | ||||||||||||
| Expenses |
|||||||||||||||||
| Commissions |
39.5 | 32.4 | 31.8 | 32.8 | 36.5 | ||||||||||||
| General operating expenses |
67.4 | 74.7 | 76.9 | 71.7 | 74.7 | ||||||||||||
| Deferral of policy acquisition costs |
(8.5) | (7.9) | (7.7) | (7.8) | (8.0) | ||||||||||||
| Subtotal |
98.4 | 99.2 | 101.0 | 96.7 | 103.2 | ||||||||||||
| Amortization of policy acquisition costs |
9.1 | 9.4 | 7.7 | 16.9 | 8.6 | ||||||||||||
| Amortization of VOBA and other intangible assets |
0.5 | 0.1 | 0.2 | 0.7 | 0.5 | ||||||||||||
| Total expenses |
108.0 | 108.7 | 108.9 | 114.3 | 112.3 | ||||||||||||
| Pre-tax operating earnings |
$ | 55.3 | $ | 37.4 | $ | 33.3 | $ | 48.8 | $ | 51.8 | |||||||
| Key Ratios/Statistics |
|||||||||||||||||
| Average Account Values: |
|||||||||||||||||
| General account |
$ | 11,214.5 | $ | 11,396.7 | $ | 11,590.8 | $ | 11,711.2 | $ | 11,798.3 | |||||||
| Separate account |
13,880.9 | 11,805.6 | 10,259.0 | 10,453.7 | 11,663.4 | ||||||||||||
| Non insurance assets |
20,123.7 | 17,507.1 | 15,648.4 | 16,525.5 | 18,859.5 | ||||||||||||
| Administration only |
28,856.2 | 26,301.4 | 24,427.8 | 25,692.1 | 28,669.5 | ||||||||||||
| Total average retirement plan account values |
$ | 74,075.3 | $ | 67,010.8 | $ | 61,926.0 | $ | 64,382.5 | $ | 70,990.7 | |||||||
| Earned rate |
5.84% | 5.78% | 5.57% | 6.00% | 5.74% | ||||||||||||
| Credited rate |
3.95% | 3.90% | 3.63% | 3.87% | 3.51% | ||||||||||||
| Interest spread on average general account values |
1.89% | 1.88% | 1.94% | 2.13% | 2.23% | ||||||||||||
| Income from mortgage loan prepayments and bond call premiums |
0.06% | 0.03% | 0.01% | 0.11% | 0.02% | ||||||||||||
| Base interest spread on average general account values |
1.83% | 1.85% | 1.93% | 2.02% | 2.21% | ||||||||||||
| Asset fees to average separate account values |
0.76% | 0.63% | 0.66% | 1.02% | 0.54% | ||||||||||||
| General operating expenses to average account values |
0.36% | 0.45% | 0.50% | 0.45% | 0.42% | ||||||||||||
| Pre-tax operating earnings to average account values |
0.30% | 0.22% | 0.22% | 0.30% | 0.29% | ||||||||||||
| Pre-tax operating earnings to operating revenue |
20.1% | 14.6% | 13.5% | 17.7% | 19.4% | ||||||||||||
| Average allocated capital |
$ | 762.0 | $ | 753.8 | $ | 757.6 | $ | 729.7 | $ | 716.7 | |||||||
| Return on average allocated capital |
|
19.9%
|
|
13.9%
|
|
12.9%
|
|
19.7%
|
|
20.5%
| |||||||
| Retirement Plans | |||||||||||||||||
| Account Value Activity
| |||||||||||||||||
| ($ in millions) | Q3’08 | Q4’08 | Q1’09 | Q2’09 | Q3’09 | ||||||||||||
| Private Sector Pension Plans |
|||||||||||||||||
| Balance, beginning of period |
$ | 30,668.7 | $ | 27,805.1 | $ | 23,647.2 | $ | 22,895.2 | $ | 25,518.0 | |||||||
| New deposits/other |
1,451.6 | 1,292.5 | 1,485.0 | 1,234.5 | 1,347.2 | ||||||||||||
| Participant withdrawals and surrenders |
(1,300.7) | (1,212.5) | (1,113.8) | (1,178.0) | (1,424.4) | ||||||||||||
| Net flows |
150.9 | 80.0 | 371.2 | 56.5 | (77.2) | ||||||||||||
| Investment performance/interest credited to policyholder accounts |
(2,957.7) | (4,119.1) | (1,079.0) | 2,684.7 | 2,833.1 | ||||||||||||
| Policy charges and other |
(56.8) | (47.6) | (44.2) | (50.3) | (53.8) | ||||||||||||
| Case acquisitions/(terminations), net |
- | (71.2) | - | (68.1) | - | ||||||||||||
| Balance, end of period |
$ | 27,805.1 | $ | 23,647.2 | $ | 22,895.2 | $ | 25,518.0 | $ | 28,220.1 | |||||||
| Public Sector Pension Plans |
|||||||||||||||||
| Balance, beginning of period |
$ | 46,258.7 | $ | 43,418.1 | $ | 39,150.9 | $ | 38,158.5 | $ | 42,193.1 | |||||||
| New deposits/other |
1,127.4 | 1,092.0 | 1,074.1 | 1,040.2 | 1,067.3 | ||||||||||||
| Participant withdrawals and surrenders |
(794.0) | (753.1) | (736.5) | (581.4) | (602.4) | ||||||||||||
| Net flows |
333.4 | 338.9 | 337.6 | 458.8 | 464.9 | ||||||||||||
| Investment performance/interest credited |
(3,113.6) | (4,593.4) | (1,260.1) | 3,050.2 | 3,422.8 | ||||||||||||
| Policy charges and other |
(18.6) | (14.9) | (13.6) | (19.7) | (16.1) | ||||||||||||
| Case acquisitions/(terminations), net |
(41.8) | 2.2 | (56.3) | 545.3 | (14.7) | ||||||||||||
| Balance, end of period |
$ | 43,418.1 | $ | 39,150.9 | $ | 38,158.5 | $ | 42,193.1 | $ | 46,050.0 | |||||||
| Total retirement plan account values |
$ | 71,223.2 | $ | 62,798.1 | $ | 61,053.7 | $ | 67,711.1 | $ | 74,270.1 | |||||||
11
Nationwide Financial Services, Inc.
Statistical Supplement
September 30, 2009
Retirement Plans
Account Values by Product
| ($ in millions) | Q3’08 | Q4’08 | Q1’09 | Q2’09 | Q3’09 | ||||||||||||
| Private Sector Pension Plans |
|||||||||||||||||
| BEST of AMERICA annuity products |
$ | 5,470.4 | $ | 4,543.5 | $ | 4,343.0 | $ | 4,628.5 | $ | 4,924.9 | |||||||
| BEST of AMERICA trust products |
19,093.3 | 15,920.8 | 15,376.0 | 17,675.0 | 20,043.9 | ||||||||||||
| Subtotal BEST of AMERICA |
24,563.7 | 20,464.3 | 19,719.0 | 22,303.5 | 24,968.8 | ||||||||||||
| Nationwide Financial Network products |
874.6 | 778.5 | 746.3 | 806.6 | 854.5 | ||||||||||||
| Nationwide employee and agent benefit plans |
1,911.8 | 1,954.4 | 1,990.6 | 1,978.0 | 1,989.6 | ||||||||||||
| Other |
455.0 | 450.0 | 439.3 | 429.9 | 407.2 | ||||||||||||
| Total private sector pension plans |
$ | 27,805.1 | $ | 23,647.2 | $ | 22,895.2 | $ | 25,518.0 | $ | 28,220.1 | |||||||
| Public Sector Pension Plans |
|||||||||||||||||
| IRC Section 457 annuities |
$ | 15,569.6 | $ | 14,396.6 | $ | 14,057.2 | $ | 14,910.2 | $ | 15,993.9 | |||||||
| Administration only agreements |
27,848.5 | 24,754.3 | 24,101.3 | 27,282.9 | 30,056.1 | ||||||||||||
| Total public sector pension plans |
$ | 43,418.1 | $ | 39,150.9 | $ | 38,158.5 | $ | 42,193.1 | $ | 46,050.0 | |||||||
| Total retirement plan account values |
$ | 71,223.2 | $ | 62,798.1 | $ | 61,053.7 | $ | 67,711.1 | $ | 74,270.1 | |||||||
|
Retirement Plans New and Renewal Production Premiums and Deposits by Product
| |||||||||||||||||
| ($ in millions) | Q3’08 | Q4’08 | Q1’09 | Q2’09 | Q3’09 | ||||||||||||
| Private Sector Pension Plans |
|||||||||||||||||
| BEST of AMERICA annuity products |
$ | 201.3 | $ | 185.7 | $ | 205.0 | $ | 178.7 | $ | 166.7 | |||||||
| BEST of AMERICA trust products |
1,141.3 | 980.6 | 1,184.9 | 983.8 | 1,097.3 | ||||||||||||
| Subtotal BEST of AMERICA |
1,342.6 | 1,166.3 | 1,389.9 | 1,162.5 | 1,264.0 | ||||||||||||
| Nationwide Financial Network products |
40.7 | 56.5 | 37.7 | 34.5 | 36.2 | ||||||||||||
| Other |
21.1 | 49.7 | 4.9 | 4.0 | 3.8 | ||||||||||||
| Total private sector pension plans |
$ | 1,404.4 | $ | 1,272.5 | $ | 1,432.5 | $ | 1,201.0 | $ | 1,304.0 | |||||||
| Public Sector Pension Plans |
|||||||||||||||||
| IRC Section 457 annuities |
$ | 434.2 | $ | 458.4 | $ | 419.3 | $ | 384.8 | $ | 386.3 | |||||||
| Administration only agreements |
693.3 | 632.9 | 646.5 | 663.7 | 681.1 | ||||||||||||
| Total public sector pension plans |
1,127.5 | 1,091.3 | 1,065.8 | 1,048.5 | 1,067.4 | ||||||||||||
| Total new and renewal production premiums and deposits |
$ | 2,531.9 | $ | 2,363.8 | $ | 2,498.3 | $ | 2,249.5 | $ | 2,371.4 | |||||||
|
Retirement Plans New and Renewal Production Premiums and Deposits by Channel
| |||||||||||||||||
| ($ in millions) | Q3’08 | Q4’08 | Q1’09 | Q2’09 | Q3’09 | ||||||||||||
| Private Sector Pension Plans |
|||||||||||||||||
| Non-affiliated |
|||||||||||||||||
| Independent broker/dealers |
$ | 872.1 | $ | 763.9 | $ | 871.3 | $ | 764.9 | $ | 836.8 | |||||||
| Wirehouse and regional firms |
251.2 | 223.6 | 262.7 | 224.4 | 223.4 | ||||||||||||
| Financial institutions |
130.8 | 122.5 | 160.0 | 107.6 | 112.6 | ||||||||||||
| Pension plan administrators |
109.1 | 129.3 | 99.9 | 78.0 | 97.9 | ||||||||||||
| Affiliated |
|||||||||||||||||
| Nationwide Retirement Solutions |
8.1 | 7.7 | 6.4 | 5.5 | 5.7 | ||||||||||||
| Nationwide Financial Network |
33.1 | 25.5 | 32.2 | 20.6 | 27.6 | ||||||||||||
| Total private sector pension plans |
$ | 1,404.4 | $ | 1,272.5 | $ | 1,432.5 | $ | 1,201.0 | $ | 1,304.0 | |||||||
| Public Sector Pension Plans |
|||||||||||||||||
| Nationwide Retirement Solutions |
$ | 1,127.5 | $ | 1,091.3 | $ | 1,065.8 | $ | 1,048.5 | $ | 1,067.4 | |||||||
| Total new and renewal production premiums and deposits |
$ | 2,531.9 | $ | 2,363.8 | $ | 2,498.3 | $ | 2,249.5 | $ | 2,371.4 | |||||||
12
Nationwide Financial Services, Inc.
Statistical Supplement
September 30, 2009
Individual Protection
Quarterly Earnings Trends
| ($ in millions) | Q3’08 | Q4’08 | Q1’09 | Q2’09 | Q3’09 | ||||||||||||
| Operating Revenues |
|||||||||||||||||
| Asset fees |
$ | 12.3 | $ | 9.8 | $ | 8.7 | $ | 9.3 | $ | 9.8 | |||||||
| Cost of insurance charges |
113.4 | 115.6 | 118.2 | 117.6 | 117.6 | ||||||||||||
| Administrative fees |
21.6 | 20.6 | 17.8 | 32.7 | 22.5 | ||||||||||||
| Surrender fees |
4.6 | 10.6 | 7.1 | 7.0 | 6.4 | ||||||||||||
| Total policy charges |
151.9 | 156.6 | 151.8 | 166.6 | 156.3 | ||||||||||||
| Net Investment Income |
|||||||||||||||||
| General account assets |
127.3 | 127.5 | 122.8 | 128.1 | 123.6 | ||||||||||||
| Charge for invested capital |
(3.4) | (2.9) | (2.4) | (2.7) | (2.4) | ||||||||||||
| Total net investment income |
123.9 | 124.6 | 120.4 | 125.4 | 121.2 | ||||||||||||
| Premiums |
69.6 | 77.7 | 76.9 | 75.5 | 73.8 | ||||||||||||
| Other income |
0.9 | 0.7 | 0.5 | 0.5 | 0.5 | ||||||||||||
| Total operating revenues |
346.3 | 359.6 | 349.6 | 368.0 | 351.8 | ||||||||||||
| Benefits |
|||||||||||||||||
| Interest credited to policyholder accounts |
50.1 | 50.1 | 49.6 | 52.3 | 49.6 | ||||||||||||
| Life benefits |
116.6 | 141.7 | 137.1 | 147.7 | 133.1 | ||||||||||||
| Policyholder dividends |
23.7 | 21.1 | 21.4 | 23.5 | 22.4 | ||||||||||||
| Total benefits |
190.4 | 212.9 | 208.1 | 223.5 | 205.1 | ||||||||||||
| Expenses |
|||||||||||||||||
| Commissions |
34.9 | 36.1 | 30.2 | 32.7 | 31.6 | ||||||||||||
| General operating expenses |
56.6 | 87.7 | 62.2 | 54.3 | 58.0 | ||||||||||||
| Deferral of policy acquisition costs |
(49.5) | (53.9) | (44.0) | (43.0) | (42.4) | ||||||||||||
| Subtotal |
42.0 | 69.9 | 48.4 | 44.0 | 47.2 | ||||||||||||
| Amortization of policy acquisition costs |
33.5 | 29.1 | 25.8 | 67.9 | 34.1 | ||||||||||||
| Amortization of VOBA and other intangible assets |
8.2 | 6.7 | 6.3 | 20.0 | 9.0 | ||||||||||||
| Total expenses |
|
83.7
|
|
105.7
|
|
80.5
|
|
131.9
|
|
90.3
| |||||||
| Pre-tax operating earnings |
$ | 72.2 | $ | 41.0 | $ | 61.0 | $ | 12.6 | $ | 56.4 | |||||||
| Key Ratios/Statistics |
|||||||||||||||||
| General operating expenses to operating revenues |
16.3% | 24.4% | 17.8% | 14.8% | 16.5% | ||||||||||||
| Pre-tax operating earnings to operating revenues |
20.8% | 11.4% | 17.4% | 3.4% | 16.0% | ||||||||||||
| Average allocated capital |
$ | 2,053.6 | $ | 2,043.5 | $ | 1,988.3 | $ | 1,947.6 | $ | 1,935.7 | |||||||
| Return on average allocated capital |
9.5% | 5.7% | 8.6% | 2.5% | 8.2% | ||||||||||||
| Note: The results of operations of TBG Financial are reflected as discontinued operations for 2008 and all prior years. | |||||||||||||||||
| Individual Protection Policy Reserves
| |||||||||||||||||
| ($ in millions) | Q3’08 | Q4’08 | Q1’09 | Q2’09 | Q3’09 | ||||||||||||
| Individual investment life |
$ | 5,083.7 | $ | 4,159.4 | $ | 3,873.4 | $ | 4,284.8 | $ | 4,711.2 | |||||||
| Corporate investment life - excluding experience rated BOLI |
6,620.3 | 7,472.7 | 7,238.8 | 7,665.1 | 7,592.8 | ||||||||||||
| Corporate investment life - experience rated BOLI |
1,305.2 | 1,076.2 | 1,067.1 | 1,079.9 | 1,200.4 | ||||||||||||
| Subtotal investment life | 13,009.2 | 12,708.3 | 12,179.3 | 13,029.8 | 13,504.4 | ||||||||||||
| Traditional life |
4,156.9 | 4,154.8 | 4,125.7 | 4,127.6 | 4,131.3 | ||||||||||||
| Universal life |
1,354.8 | 1,386.9 | 1,409.2 | 1,464.0 | 1,522.9 | ||||||||||||
| Subtotal fixed life | 5,511.7 | 5,541.7 | 5,534.9 | 5,591.6 | 5,654.2 | ||||||||||||
| Total individual protection policy reserves | $ | 18,520.9 | $ | 18,250.0 | $ | 17,714.2 | $ | 18,621.4 | $ | 19,158.6 | |||||||
| Individual Protection Insurance In Force
| |||||||||||||||||
| ($ in millions) | Q3’08 | Q4’08 | Q1’09 | Q2’09 | Q3’09 | ||||||||||||
| Individual investment life |
$ | 56,290.1 | $ | 55,352.8 | $ | 54,379.2 | $ | 53,410.7 | $ | 52,641.2 | |||||||
| Corporate investment life - excluding experience rated BOLI |
11,796.8 | 11,347.5 | 10,867.6 | 11,179.6 | 11,423.5 | ||||||||||||
| Corporate investment life - experience rated BOLI |
13,261.2 | 13,259.3 | 13,255.5 | 13,247.9 | 13,247.9 | ||||||||||||
| Subtotal investment life | 81,348.1 | 79,959.6 | 78,502.3 | 77,838.2 | 77,312.6 | ||||||||||||
| Traditional life |
49,687.3 | 53,685.7 | 54,115.8 | 55,200.6 | 55,366.5 | ||||||||||||
| Universal life |
11,445.7 | 11,714.8 | 11,735.0 | 12,151.2 | 12,570.8 | ||||||||||||
| Subtotal fixed life | 61,133.0 | 65,400.5 | 65,850.8 | 67,351.8 | 67,937.3 | ||||||||||||
| Total individual protection insurance in force | $ | 142,481.1 | $ | 145,360.1 | $ | 144,353.1 | $ | 145,190.0 | $ | 145,249.9 | |||||||
13
Nationwide Financial Services, Inc.
Statistical Supplement
September 30, 2009
Individual Protection
New and Renewal Production Premiums and Deposits by Product
| ($ in millions) | Q3’08 | Q4’08 | Q1’09 | Q2’09 | Q3’09 | ||||||||||||
| BEST of AMERICA Variable Life Series |
|||||||||||||||||
| First year production premiums and deposits |
$ | 24.8 | $ | 19.3 | $ | 16.8 | $ | 12.5 | $ | 10.0 | |||||||
| Renewal production premiums and deposits |
73.4 | 67.5 | 66.4 | 67.7 | 64.5 | ||||||||||||
| Total BEST of AMERICA variable life series |
98.2 | 86.8 | 83.2 | 80.2 | 74.5 | ||||||||||||
| Nationwide Financial Network Variable Life Products |
|||||||||||||||||
| First year production premiums and deposits |
0.8 | 1.6 | 0.4 | 0.2 | 0.2 | ||||||||||||
| Renewal production premiums and deposits |
38.4 | 36.8 | 36.7 | 35.1 | 33.1 | ||||||||||||
| Total Nationwide Financial Network variable life products |
39.2 | 38.4 | 37.1 | 35.3 | 33.3 | ||||||||||||
| Corporate Owned Life Insurance (COLI) |
|||||||||||||||||
| First year production premiums and deposits |
36.7 | 55.2 | 20.7 | 10.5 | 9.8 | ||||||||||||
| Renewal production premiums and deposits |
32.9 | 66.0 | 91.4 | 62.6 | 51.1 | ||||||||||||
| Total COLI |
69.6 | 121.2 | 112.1 | 73.1 | 60.9 | ||||||||||||
| Traditional/Universal life |
|||||||||||||||||
| First year production premiums and deposits |
31.6 | 39.3 | 29.5 | 50.4 | 51.5 | ||||||||||||
| Renewal production premiums and deposits |
108.1 | 122.4 | 110.8 | 115.0 | 113.4 | ||||||||||||
| Total traditional/universal life | 139.7 | 161.7 | 140.3 | 165.4 | 164.9 | ||||||||||||
| Total new and renewal production premiums and deposits | $ | 346.7 | $ | 408.1 | $ | 372.7 | $ | 354.0 | $ | 333.6 | |||||||
| Individual Protection New and Renewal Production Premiums and Deposits by Channel
| |||||||||||||||||
| ($ in millions) | Q3’08 | Q4’08 | Q1’09 | Q2’09 | Q3’09 | ||||||||||||
| Non-affiliated |
|||||||||||||||||
| Independent broker/dealers |
$ | 73.9 | $ | 66.4 | $ | 68.2 | $ | 70.0 | $ | 63.1 | |||||||
| Wirehouse and regional firms |
16.0 | 16.1 | 14.1 | 17.6 | 17.1 | ||||||||||||
| Financial institutions |
14.4 | 15.8 | 10.1 | 19.3 | 25.6 | ||||||||||||
| Life specialists |
47.2 | 105.5 | 112.1 | 73.1 | 60.9 | ||||||||||||
| Affiliated |
|||||||||||||||||
| Nationwide Financial Network |
172.8 | 188.6 | 168.2 | 174.0 | 166.9 | ||||||||||||
| Mullin TBG |
22.4 | 15.7 | - | - | - | ||||||||||||
| Total new and renewal production premiums and deposits | $ | 346.7 | $ | 408.1 | $ | 372.7 | $ | 354.0 | $ | 333.6 | |||||||
14
Nationwide Financial Services, Inc.
Statistical Supplement
September 30, 2009
Investment Life
Quarterly Earnings Trends
| ($ in millions) | Q3’08 | Q4’08 | Q1’09 | Q2’09 | Q3’09 | ||||||||||||
| Operating Revenues |
|||||||||||||||||
| Asset fees |
$ | 12.3 | $ | 9.8 | $ | 8.7 | $ | 9.3 | $ | 9.8 | |||||||
| Cost of insurance charges |
90.9 | 92.5 | 93.9 | 92.0 | 90.2 | ||||||||||||
| Administrative fees |
14.2 | 12.4 | 10.8 | 21.3 | 13.4 | ||||||||||||
| Surrender fees |
4.0 | 9.2 | 6.1 | 5.5 | 5.0 | ||||||||||||
| Total policy charges |
121.4 | 123.9 | 119.5 | 128.1 | 118.4 | ||||||||||||
| Net Investment Income |
|||||||||||||||||
| General account assets |
39.0 | 39.4 | 39.1 | 39.9 | 36.9 | ||||||||||||
| Charge for invested capital |
(3.4) | (2.9) | (2.4) | (2.7) | (2.4) | ||||||||||||
| Total net investment income |
35.6 | 36.5 | 36.7 | 37.2 | 34.5 | ||||||||||||
| Other income |
0.9 | 0.7 | 0.5 | 0.5 | 0.5 | ||||||||||||
| Total operating revenues |
157.9 | 161.1 | 156.7 | 165.8 | 153.4 | ||||||||||||
| Benefits |
|||||||||||||||||
| Interest credited to policyholder accounts |
28.8 | 29.1 | 28.9 | 30.7 | 29.2 | ||||||||||||
| Life benefits |
41.3 | 49.2 | 50.7 | 59.5 | 37.4 | ||||||||||||
| Total benefits |
70.1 | 78.3 | 79.6 | 90.2 | 66.6 | ||||||||||||
| Expenses |
|||||||||||||||||
| Commissions |
16.2 | 20.4 | 17.1 | 13.7 | 11.3 | ||||||||||||
| General operating expenses |
28.1 | 54.1 | 29.2 | 24.9 | 26.2 | ||||||||||||
| Deferral of policy acquisition costs |
(24.4) | (29.9) | (23.4) | (18.7) | (16.4) | ||||||||||||
| Subtotal |
19.9 | 44.6 | 22.9 | 19.9 | 21.1 | ||||||||||||
| Amortization of policy acquisition costs |
19.3 | 15.8 | 12.7 | 51.0 | 20.7 | ||||||||||||
| Amortization of VOBA and other intangible assets |
5.6 | 4.5 | 3.9 | 16.7 | 7.2 | ||||||||||||
| Total expenses |
|
44.8
|
|
64.9
|
|
39.5
|
|
87.6
|
|
49.0
| |||||||
| Pre-tax operating earnings |
$ | 43.0 | $ | 17.9 | $ | 37.6 | $ | (12.0) | $ | 37.8 | |||||||
| Key Ratios/Statistics |
|||||||||||||||||
| Cost of insurance per $1,000 of average net amount at risk (1) |
$ | 6.45 | $ | 6.64 | $ | 6.88 | $ | 6.89 | $ | 6.91 | |||||||
| Life benefits per $1,000 of average net amount at risk (1) |
$ | 2.93 | $ | 3.53 | $ | 3.71 | $ | 4.46 | $ | 2.87 | |||||||
| General operating expenses to operating revenues |
17.8% | 33.6% | 18.6% | 15.0% | 17.1% | ||||||||||||
| Pre-tax operating earnings to operating revenues |
27.2% | 11.1% | 24.0% | -7.2% | 24.6% | ||||||||||||
| Average allocated capital |
$ | 1,287.8 | $ | 1,260.1 | $ | 1,203.2 | $ | 1,149.1 | $ | 1,116.4 | |||||||
| Return on average allocated capital |
9.3% | 4.4% | 9.2% | -1.3% | 9.9% | ||||||||||||
| (1) | Excludes experience rated BOLI corporate investment life. |
Note: The results of operations of TBG Financial are reflected as discontinued operations for 2008 and all prior years.
| Investment Life | |||||||||||||||||
| Policy Reserve Activity
| |||||||||||||||||
| ($ in millions) | Q3’08 | Q4’08 | Q1’09 | Q2’09 | Q3’09 | ||||||||||||
| Balance, beginning of period |
$ | 14,288.0 | $ | 13,009.2 | $ | 12,708.3 | $ | 12,179.3 | $ | 13,029.8 | |||||||
| Deposits |
237.2 | 271.6 | 245.5 | 175.9 | 149.0 | ||||||||||||
| Withdrawals and surrenders |
(118.1) | (148.8) | (155.6) | (115.8) | (178.5) | ||||||||||||
| Net flows |
119.1 | 122.8 | 89.9 | 60.1 | (29.5) | ||||||||||||
| Investment performance/interest credited to policyholder accounts |
(1,272.6) | (1,767.9) | (412.2) | 939.4 | 1,116.8 | ||||||||||||
| Policy charges |
(121.3) | (124.3) | (119.4) | (127.7) | (118.9) | ||||||||||||
| Benefits and other |
(4.0) | 1,468.5 | 89.9 | (21.3) | (493.8) | ||||||||||||
| Acquired/(Terminated) business |
- | - | (177.2) | - | - | ||||||||||||
| Balance, end of period |
$ | 13,009.2 | $ | 12,708.3 | $ | 12,179.3 | $ | 13,029.8 | $ | 13,504.4 | |||||||
15
Nationwide Financial Services, Inc.
Statistical Supplement
September 30, 2009
Fixed Life
Quarterly Earnings Trends
| ($ in millions) | Q3’08 | Q4’08 | Q1’09 | Q2’09 | Q3’09 | ||||||||||||
| Operating Revenues |
|||||||||||||||||
| Cost of insurance charges |
$ | 22.5 | $ | 23.1 | $ | 24.3 | $ | 25.6 | $ | 27.4 | |||||||
| Administrative fees |
7.4 | 8.2 | 7.0 | 11.4 | 9.1 | ||||||||||||
| Surrender fees |
0.6 | 1.4 | 1.0 | 1.5 | 1.4 | ||||||||||||
| Total policy charges |
30.5 | 32.7 | 32.3 | 38.5 | 37.9 | ||||||||||||
| Net investment income |
88.3 | 88.1 | 83.7 | 88.2 | 86.7 | ||||||||||||
| Premiums |
69.6 | 77.7 | 76.9 | 75.5 | 73.8 | ||||||||||||
| Total operating revenues |
188.4 | 198.5 | 192.9 | 202.2 | 198.4 | ||||||||||||
| Benefits |
|||||||||||||||||
| Interest credited to policyholder accounts |
21.3 | 21.0 | 20.7 | 21.6 | 20.4 | ||||||||||||
| Life benefits |
75.3 | 92.5 | 86.4 | 88.2 | 95.7 | ||||||||||||
| Policyholder dividends |
23.7 | 21.1 | 21.4 | 23.5 | 22.4 | ||||||||||||
| Total benefits |
120.3 | 134.6 | 128.5 | 133.3 | 138.5 | ||||||||||||
| Expenses |
|||||||||||||||||
| Commissions |
18.7 | 15.7 | 13.1 | 19.0 | 20.3 | ||||||||||||
| General operating expenses |
28.5 | 33.6 | 33.0 | 29.4 | 31.8 | ||||||||||||
| Deferral of policy acquisition costs |
(25.1) | (24.0) | (20.6) | (24.3) | (26.0) | ||||||||||||
| Subtotal |
22.1 | 25.3 | 25.5 | 24.1 | 26.1 | ||||||||||||
| Amortization of policy acquisition costs |
14.2 | 13.3 | 13.1 | 16.9 | 13.4 | ||||||||||||
| Amortization of VOBA and other intangible assets |
2.6 | 2.2 | 2.4 | 3.3 | 1.8 | ||||||||||||
| Total expenses |
|
38.9
|
|
40.8
|
|
41.0
|
|
44.3
|
|
41.3
| |||||||
| Pre-tax operating earnings |
$ | 29.2 | $ | 23.1 | $ | 23.4 | $ | 24.6 | $ | 18.6 | |||||||
| Key Ratios/Statistics |
|||||||||||||||||
| Life benefits per $1,000 of average life insurance in force |
$ | 5.04 | $ | 5.85 | $ | 5.27 | $ | 5.30 | $ | 5.66 | |||||||
| General operating expenses to operating revenues |
15.1% | 16.9% | 17.1% | 14.5% | 16.0% | ||||||||||||
| Pre-tax operating earnings to operating revenues |
15.5% | 11.6% | 12.1% | 12.2% | 9.4% | ||||||||||||
| Average allocated capital |
$ | 765.8 | $ | 783.4 | $ | 785.1 | $ | 798.5 | $ | 819.3 | |||||||
| Return on average allocated capital |
9.9% | 7.7% | 7.7% | 8.0% | 5.9% | ||||||||||||
| Fixed Life | |||||||||||||||||
| Policy Reserve Activity
| |||||||||||||||||
| ($ in millions) | Q3’08 | Q4’08 | Q1’09 | Q2’09 | Q3’09 | ||||||||||||
| Traditional/Universal Life |
|||||||||||||||||
| Balance, beginning of period |
$ | 5,493.7 | $ | 5,511.7 | $ | 5,541.7 | $ | 5,534.9 | $ | 5,591.6 | |||||||
| Deposits |
123.1 | 139.6 | 127.1 | 146.3 | 146.1 | ||||||||||||
| Withdrawals and surrenders |
(58.4) | (66.7) | (63.3) | (69.9) | (57.4) | ||||||||||||
| Net flows |
64.7 | 72.9 | 63.8 | 76.4 | 88.7 | ||||||||||||
|
Interest credited to policyholder accounts |
|
22.0 |
|
19.6 |
|
21.0 |
|
21.2 |
|
10.8 | |||||||
| Policy charges |
(30.8) | (32.6) | (32.3) | (39.4) | (36.9) | ||||||||||||
| Benefits and other |
(37.9) | (29.9) | (59.3) | (1.5) | - | ||||||||||||
| Balance, end of period |
$ | 5,511.7 | $ | 5,541.7 | $ | 5,534.9 | $ | 5,591.6 | $ | 5,654.2 | |||||||
16
Nationwide Financial Services, Inc.
Statistical Supplement
September 30, 2009
Corporate and Other
Quarterly Earnings Trends
| ($ in millions) | Q3’08 | Q4’08 | Q1’09 | Q2’09 | Q3’09 | ||||||||||||
| Operating Revenues |
|||||||||||||||||
| Net Investment Income |
|||||||||||||||||
| General account assets |
$ | 61.5 | $ | 38.0 | $ | 80.1 | $ | 69.0 | $ | 72.3 | |||||||
| Total net investment income |
61.5 | 38.0 | 80.1 | 69.0 | 72.3 | ||||||||||||
| Operating realized gains (losses) |
(21.2) | (57.9) | (5.4) | 12.0 | 1.1 | ||||||||||||
| Other income |
42.4 | 39.5 | 27.6 | 28.9 | 32.9 | ||||||||||||
| Total operating revenues |
82.7 | 19.6 | 102.3 | 109.9 | 106.3 | ||||||||||||
| Benefits |
|||||||||||||||||
| Interest credited to policyholder accounts |
46.8 | 44.6 | 33.7 | 29.9 | 26.1 | ||||||||||||
| Total benefits |
46.8 | 44.6 | 33.7 | 29.9 | 26.1 | ||||||||||||
| Expenses |
|||||||||||||||||
| Commissions |
4.2 | 3.9 | 2.6 | 2.0 | 2.6 | ||||||||||||
| General operating expenses |
55.6 | 74.5 | 44.1 | 43.1 | 50.9 | ||||||||||||
| Amortization of VOBA and other intangible assets |
0.4 | 0.1 | 0.3 | 0.3 | 2.3 | ||||||||||||
| Interest expense |
26.1 | 25.9 | 26.0 | 25.8 | 25.7 | ||||||||||||
| Total expenses |
86.3 | 104.4 | 73.0 | 71.2 | 81.5 | ||||||||||||
| Pre-tax operating earnings (loss) |
$ | (50.4) | $ | (129.4) | $ | (4.4) | $ | 8.8 | $ | (1.3) | |||||||
| Note: The results of operations of TBG Financial are reflected as discontinued operations for 2008 and all prior years. | |||||||||||||||||
| Nationwide Bank | |||||||||||||||||
| Key Ratio / Statistics | Q3’08 | Q4’08 | Q1’09 | Q2’09 | Q3’09 | ||||||||||||
| Total Assets |
1,852.3 | 2,195.2 | 2,416.8 | 2,519.0 | 3,038.7 | ||||||||||||
| Net Interest Margin
|
|
2.94%
|
|
2.84%
|
|
3.11%
|
|
3.10%
|
|
3.04%
| |||||||
| Medium Term Notes | |||||||||||||||||
| ($ in millions) | Q3’08 | Q4’08 | Q1’09 | Q2’09 | Q3’09 | ||||||||||||
| Key Ratios/Statistics |
|||||||||||||||||
| Daily Average Account Values: |
|||||||||||||||||
| General account |
$ | 4,165.1 | $ | 3,509.2 | $ | 3,109.8 | $ | 3,005.4 | $ | 2,426.6 | |||||||
| Earned rate |
4.44% | 4.73% | 3.52% | 2.52% | 2.09% | ||||||||||||
| Credited rate |
3.59% | 3.70% | 2.93% | 2.64% | 2.67% | ||||||||||||
| Interest spread on daily average general account values |
0.85% | 1.03% | 0.59% | -0.12% | -0.58% | ||||||||||||
| Income from mortgage loan prepayments and bond call premiums |
0.07% | -0.01% | 0.00% | 0.01% | 0.02% | ||||||||||||
| Base interest spread on daily average general account values |
0.78% | 1.04% | 0.59% | -0.13% | -0.60% | ||||||||||||
| Corporate and Other Account Value Activity | |||||||||||||||||
| ($ in millions) |
|||||||||||||||||
| Medium Term Notes | Q3’08 | Q4’08 | Q1’09 | Q2’09 | Q3’09 | ||||||||||||
| Balance, beginning of period |
$ | 4,294.3 | $ | 3,690.5 | $ | 3,217.2 | $ | 3,020.1 | $ | 2,488.9 | |||||||
| Deposits |
125.0 | - | - | - | - | ||||||||||||
| Maturities |
(735.0) | (465.0) | (200.0) | (300.0) | (325.0) | ||||||||||||
| Net flows |
(610.0) | (465.0) | (200.0) | (300.0) | (325.0) | ||||||||||||
| Interest credited to policyholder accounts and amortization |
37.0 | 32.5 | 22.8 | 19.8 | 16.2 | ||||||||||||
| Other benefits - interest payments |
(30.8) | (40.8) | (19.9) | (26.2) | (11.2) | ||||||||||||
| Acquisitions/(terminations), net |
- | - | - | (224.8) | (10.5) | ||||||||||||
| Balance, end of period |
$ | 3,690.5 | $ | 3,217.2 | $ | 3,020.1 | $ | 2,488.9 | $ | 2,158.4 | |||||||
| Nationwide Bank |
$ | 1,381.8 | $ | 1,763.5 | $ | 1,904.3 | $ | 1,946.4 | $ | 2,123.3 | |||||||
| Nationwide Funds Group |
$ | 1,778.9 | $ | 1,345.8 | $ | 1,127.0 | $ | 1,272.0 | $ | 2,205.4 | |||||||
| Total corporate and other account values |
$ | 6,851.2 | $ | 6,326.5 | $ | 6,051.4 | $ | 5,707.3 | $ | 6,487.1 | |||||||
17
Nationwide Financial Services, Inc.
Statistical Supplement
September 30, 2009
Customer Funds Managed and Administered
| ($ in millions) | Q3’08 | Q4’08 | Q1’09 | Q2’09 | Q3’09 | ||||||||||||
| Individual variable annuities |
$ | 37,660.1 | $ | 32,954.3 | $ | 30,964.2 | $ | 33,509.2 | $ | 36,741.2 | |||||||
| Individual fixed annuities |
4,155.0 | 4,406.9 | 4,420.5 | 4,543.2 | 4,468.1 | ||||||||||||
| Income products |
2,112.3 | 2,107.4 | 2,117.5 | 2,157.4 | 2,198.2 | ||||||||||||
| Advisory services program |
359.8 | 82.6 | - | - | - | ||||||||||||
| Subtotal individual investments |
44,287.2 | 39,551.2 | 37,502.2 | 40,209.8 | 43,407.5 | ||||||||||||
| Private sector pension plans |
27,805.1 | 23,647.2 | 22,895.2 | 25,518.0 | 28,220.1 | ||||||||||||
| Public sector pension plans |
43,418.1 | 39,150.9 | 38,158.5 | 42,193.1 | 46,050.0 | ||||||||||||
| Subtotal retirement plans |
71,223.2 | 62,798.1 | 61,053.7 | 67,711.1 | 74,270.1 | ||||||||||||
| Individual protection investment life |
13,009.2 | 12,708.3 | 12,179.3 | 13,029.8 | 13,504.4 | ||||||||||||
| Individual protection fixed life |
5,511.7 | 5,541.7 | 5,534.9 | 5,591.6 | 5,654.2 | ||||||||||||
| Subtotal individual protection |
18,520.9 | 18,250.0 | 17,714.2 | 18,621.4 | 19,158.6 | ||||||||||||
| Medium term notes |
3,690.5 | 3,217.2 | 3,020.1 | 2,488.9 | 2,158.4 | ||||||||||||
| Nationwide Bank |
1,381.8 | 1,763.5 | 1,904.3 | 1,946.4 | 2,123.3 | ||||||||||||
| Nationwide Funds Group |
1,778.9 | 1,345.8 | 1,127.0 | 1,272.0 | 2,205.4 | ||||||||||||
| Subtotal corporate and other |
6,851.2 | 6,326.5 | 6,051.4 | 5,707.3 | 6,487.1 | ||||||||||||
| Customer funds managed and administered |
$ | 140,882.5 | $ | 126,925.8 | $ | 122,321.5 | $ | 132,249.6 | $ | 143,323.3 | |||||||
| Note: Total Customer Funds Managed and Administered includes NFG funds as detailed below. | |||||||||||||||||
| Nationwide Funds Group - Customer Funds Managed and Administered | |||||||||||||||||
| ($ in millions) | Q3’08 | Q4’08 | Q1’09 | Q2’09 | Q3’09 | ||||||||||||
| Individual Investments |
14,837.0 | 13,184.7 | 12,676.5 | 14,248.3 | 17,602.3 | ||||||||||||
| Retirement Plans |
8,327.7 | 7,549.9 | 7,340.6 | 7,879.7 | 7,819.7 | ||||||||||||
| Individual Protection |
3,132.7 | 2,759.5 | 2,521.8 | 2,695.2 | 3,057.9 | ||||||||||||
| Corporate and Other |
1,778.9 | 1,345.8 | 1,127.0 | 1,272.0 | 2,205.4 | ||||||||||||
| Customer funds managed and administered |
$ | 28,076.3 | $ | 24,839.9 | $ | 23,665.9 | $ | 26,095.2 | $ | 30,685.3 | |||||||
| Separate Account Assets by Segment and Fund Type | |||||||||||||||||
| ($ in millions) | Q3’08 | Q4’08 | Q1’09 | Q2’09 | Q3’09 | ||||||||||||
| Individual Investments |
|||||||||||||||||
| Equity |
$ | 26,857.6 | $ | 21,097.6 | $ | 19,400.6 | $ | 22,857.4 | $ | 26,427.3 | |||||||
| Bond |
4,974.8 | 4,370.3 | 4,170.5 | 4,366.1 | 4,694.9 | ||||||||||||
| Money market |
1,995.9 | 2,146.4 | 2,062.2 | 1,807.1 | 1,579.8 | ||||||||||||
| Subtotal individual investments |
33,828.3 | 27,614.3 | 25,633.3 | 29,030.6 | 32,702.0 | ||||||||||||
| Retirement Plans |
|||||||||||||||||
| Equity |
$ | 10,494.2 | $ | 8,043.9 | $ | 7,227.7 | $ | 8,301.6 | $ | 9,505.5 | |||||||
| Bond |
1,099.7 | 1,084.5 | 1,124.6 | 1,182.5 | 1,274.7 | ||||||||||||
| Money market |
593.9 | 613.0 | 607.1 | 536.2 | 483.8 | ||||||||||||
| Other |
797.7 | 884.2 | 932.9 | 994.7 | 1,047.7 | ||||||||||||
| Subtotal retirement plans |
12,985.5 | 10,625.6 | 9,892.3 | 11,015.0 | 12,311.7 | ||||||||||||
| Individual Protection |
|||||||||||||||||
| Equity |
$ | 7,037.8 | $ | 5,483.8 | $ | 4,805.2 | $ | 5,522.9 | $ | 6,307.3 | |||||||
| Bond |
2,235.3 | 1,881.2 | 1,993.0 | 2,127.1 | 2,448.4 | ||||||||||||
| Money market |
1,287.3 | 1,379.2 | 1,309.8 | 1,304.6 | 1,210.8 | ||||||||||||
| Other |
- | 1,457.4 | 1,533.7 | 1,516.3 | 1,023.6 | ||||||||||||
| Subtotal individual protection |
10,560.4 | 10,201.6 | 9,641.7 | 10,470.9 | 10,990.1 | ||||||||||||
| Corporate and Other |
|||||||||||||||||
| Equity |
$ | 464.1 | $ | 337.0 | $ | 296.1 | $ | 349.6 | $ | 401.8 | |||||||
| Bond |
58.4 | 49.7 | 49.5 | 52.5 | 55.6 | ||||||||||||
| Money market |
11.8 | 12.5 | 12.3 | 11.5 | 10.6 | ||||||||||||
| Subtotal corporate and other |
534.3 | 399.2 | 357.9 | 413.6 | 468.0 | ||||||||||||
| Total |
|||||||||||||||||
| Equity |
$ | 44,853.7 | $ | 34,962.3 | $ | 31,729.6 | $ | 37,031.5 | $ | 42,641.9 | |||||||
| Bond |
8,368.2 | 7,385.7 | 7,337.6 | 7,728.2 | 8,473.6 | ||||||||||||
| Money market |
3,888.9 | 4,151.1 | 3,991.4 | 3,659.4 | 3,285.0 | ||||||||||||
| Other |
797.7 | 2,341.6 | 2,466.6 | 2,511.0 | 2,071.3 | ||||||||||||
| Total separate account assets by fund type |
$ | 57,908.5 | $ | 48,840.7 | $ | 45,525.2 | $ | 50,930.1 | $ | 56,471.8 | |||||||
18
Nationwide Financial Services, Inc.
Statistical Supplement
September 30, 2009
Securities Available-For-Sale
| ($ in millions) |
Amortized Cost |
Gross Unrealized Gains |
Gross Unrealized Losses |
Estimated Fair Value | ||||||||||||||||
| September 30, 2009 |
|
|||||||||||||||||||
| Fixed maturity securities: |
|
|||||||||||||||||||
| U.S. Treasury securities and obligations of U.S. Government corporations |
|
$ | 182.3 | $ | 19.9 | $ | - | $ | 202.2 | |||||||||||
| U.S. Government agencies |
|
422.4 | 71.0 | - | 493.4 | |||||||||||||||
| Obligations of states and political subdivisions |
|
382.2 | 14.1 | 7.6 | 388.7 | |||||||||||||||
| Debt securities issued by foreign governments |
|
70.0 | 7.5 | - | 77.5 | |||||||||||||||
| Corporate securities |
|
|||||||||||||||||||
| Public |
|
10,890.7 | 669.1 | 205.8 | 11,354.0 | |||||||||||||||
| Private |
|
4,707.3 | 209.6 | 110.2 | 4,806.7 | |||||||||||||||
| Residential mortgage-backed securities |
|
8,379.8 | 183.3 | 707.5 | 7,855.6 | |||||||||||||||
| Commercial mortgage-backed securities |
|
1,380.3 | 9.0 | 233.5 | 1,155.8 | |||||||||||||||
| Collateralized debt obligations |
|
550.6 | 13.0 | 213.6 | 350.0 | |||||||||||||||
| Other asset-backed securities |
|
473.8 | 10.4 | 43.0 | 441.2 | |||||||||||||||
| Total fixed maturity securities | 27,439.4 | 1,206.9 | 1,521.2 | 27,125.1 | ||||||||||||||||
| Equity securities |
|
56.2 | 5.7 | 1.4 | 60.5 | |||||||||||||||
| Total | $ | 27,495.6 | $ | 1,212.6 | $ | 1,522.6 | $ | 27,185.6 | ||||||||||||
| December 31, 2008 |
|
|||||||||||||||||||
| Fixed maturity securities: |
|
|||||||||||||||||||
| U.S. Treasury securities and obligations of U.S. Government corporations |
|
$ | 94.3 | $ | 25.4 | $ | - | $ | 119.7 | |||||||||||
| U.S. Government agencies |
|
420.5 | 93.3 | - | 513.8 | |||||||||||||||
| Obligations of states and political subdivisions |
|
271.3 | 1.6 | 10.5 | 262.4 | |||||||||||||||
| Debt securities issued by foreign governments |
|
50.1 | 5.4 | - | 55.5 | |||||||||||||||
| Corporate securities |
|
|||||||||||||||||||
| Public |
|
8,881.9 | 109.9 | 1,040.7 | 7,951.1 | |||||||||||||||
| Private |
|
5,002.8 | 45.2 | 403.4 | 4,644.6 | |||||||||||||||
| Residential mortgage-backed securities |
|
8,369.1 | 109.8 | 881.0 | 7,597.9 | |||||||||||||||
| Commercial mortgage-backed securities |
|
1,488.9 | 0.6 | 473.9 | 1,015.6 | |||||||||||||||
| Collateralized debt obligations |
|
557.7 | 6.4 | 240.7 | 323.4 | |||||||||||||||
| Other asset-backed securities |
|
689.1 | 3.6 | 107.0 | 585.7 | |||||||||||||||
| Total fixed maturity securities | 25,825.7 | 401.2 | 3,157.2 | 23,069.7 | ||||||||||||||||
| Equity securities |
|
68.7 | 0.8 | 8.8 | 60.7 | |||||||||||||||
| Total | $ | 25,894.4 | $ | 402.0 | $ | 3,166.0 | $ | 23,130.4 | ||||||||||||
| Aging of Gross Unrealized Losses on Securities Available-For-Sale | ||||||||||||||||||||
| Less Than or Equal to One Year |
More Than One Year | Total | ||||||||||||||||||
| ($ in millions) |
Estimated Fair Value |
Gross Unrealized Losses |
Estimated Fair Value |
Gross Unrealized Losses |
Estimated Fair Value |
Gross Unrealized Losses | ||||||||||||||
| September 30, 2009 |
||||||||||||||||||||
| Fixed maturity securities: |
||||||||||||||||||||
| U.S. Treasury securities and obligations of U.S. Government corporations |
$ | 1.3 | $ | - | $ | - | $ | - | $ | 1.3 | $ | - | ||||||||
| U.S. Government agencies |
5.9 | - | - | - | 5.9 | - | ||||||||||||||
| Obligations of states and political subdivisions |
12.0 | 0.4 | 82.3 | 7.2 | 94.3 | 7.6 | ||||||||||||||
| Debt securities issued by foreign governments |
0.5 | - | - | - | 0.5 | - | ||||||||||||||
| Corporate securities |
||||||||||||||||||||
| Public |
707.1 | 26.2 | 1,363.4 | 179.6 | 2,070.5 | 205.8 | ||||||||||||||
| Private |
248.4 | 15.4 | 1,123.9 | 94.8 | 1,372.3 | 110.2 | ||||||||||||||
| Residential mortgage-backed securities |
438.4 | 86.2 | 2,704.8 | 621.3 | 3,143.2 | 707.5 | ||||||||||||||
| Commercial mortgage-backed securities |
11.1 | 0.2 | 834.6 | 233.3 | 845.7 | 233.5 | ||||||||||||||
| Collateralized debt obligations |
85.7 | 38.6 | 221.2 | 175.0 | 306.9 | 213.6 | ||||||||||||||
| Other asset-backed securities |
5.5 | 0.7 | 241.4 | 42.3 | 246.9 | 43.0 | ||||||||||||||
| Total fixed maturity securities | 1,515.9 | 167.7 | 6,571.6 | 1,353.5 | 8,087.5 | 1,521.2 | ||||||||||||||
| Equity securities |
9.2 | 0.8 | 2.5 | 0.6 | 11.7 | 1.4 | ||||||||||||||
| Total | $ | 1,525.1 | $ | 168.5 | $ | 6,574.1 | $ | 1,354.1 | $ | 8,099.2 | $ | 1,522.6 | ||||||||
| Percentage of gross unrealized losses |
11 | % | 89 | % | ||||||||||||||||
| December 31, 2008 |
||||||||||||||||||||
| Fixed maturity securities: |
||||||||||||||||||||
| U.S. Treasury securities and obligations of U.S. Government corporations |
$ | - | $ | - | $ | - | $ | - | $ | - | $ | - | ||||||||
| U.S. Government agencies |
- | - | - | - | - | - | ||||||||||||||
| Obligations of states and political subdivisions |
127.6 | 6.1 | 33.4 | 4.4 | 161.0 | 10.5 | ||||||||||||||
| Debt securities issued by foreign governments |
- | - | - | - | - | - | ||||||||||||||
| Corporate securities |
||||||||||||||||||||
| Public |
4,109.4 | 676.9 | 1,350.3 | 363.8 | 5,459.7 | 1,040.7 | ||||||||||||||
| Private |
2,259.4 | 282.1 | 999.1 | 121.3 | 3,258.5 | 403.4 | ||||||||||||||
| Residential mortgage-backed securities |
1,093.1 | 199.8 | 2,305.4 | 681.2 | 3,398.5 | 881.0 | ||||||||||||||
| Commercial mortgage-backed securities |
592.0 | 209.0 | 410.9 | 264.9 | 1,002.9 | 473.9 | ||||||||||||||
| Collateralized debt obligations |
151.0 | 100.8 | 122.6 | 139.9 | 273.6 | 240.7 | ||||||||||||||
| Other asset-backed securities |
333.8 | 43.2 | 228.7 | 63.8 | 562.5 | 107.0 | ||||||||||||||
| Total fixed maturity securities | 8,666.3 | 1,517.9 | 5,450.4 | 1,639.3 | 14,116.7 | 3,157.2 | ||||||||||||||
| Equity securities |
19.2 | 8.6 | 3.4 | 0.2 | 22.6 | 8.8 | ||||||||||||||
| Total | $ | 8,685.5 | $ | 1,526.5 | $ | 5,453.8 | $ | 1,639.5 | $ | 14,139.3 | $ | 3,166.0 | ||||||||
| Percentage of gross unrealized losses |
48 | % | 52 | % | ||||||||||||||||
19
Nationwide Financial Services, Inc.
Statistical Supplement
September 30, 2009
Credit Quality of Fixed Maturity Securities Available-For-Sale
| September 30, 2009 | December 31, 2008 | |||||||||||||
| ($ in millions) | Amortized Cost |
Est. Fair Value |
Amortized Cost |
Est. Fair Value | ||||||||||
| NAIC Designation |
Rating Agency Equivalent Designation |
|||||||||||||
| 1 | AAA/AA/A |
$ | 17,154.2 | $ | 17,341.6 | $ | 17,087.2 | $ | 15,612.2 | |||||
| 2 | BBB |
7,073.8 | 7,126.5 | 6,633.9 | 5,821.6 | |||||||||
| 3 | BB |
1,265.9 | 1,106.1 | 1,233.3 | 990.0 | |||||||||
| 4 | B |
781.9 | 657.0 | 571.4 | 397.2 | |||||||||
| 5 | CCC and lower |
793.0 | 569.8 | 190.5 | 148.2 | |||||||||
| 6 | In or near default |
370.6 | 324.1 | 109.4 | 100.5 | |||||||||
| Total fixed maturity securities | $ | 27,439.4 | $ | 27,125.1 | $ | 25,825.7 | $ | 23,069.7 | ||||||
Mortgage Loans by Region and Property Type
| ($ in millions) September 30, 2009 |
Office | Warehouse | Retail | Apartment & Other |
Total | ||||||||||
| Commercial mortgage loans on real estate: |
|||||||||||||||
| New England |
$ | 113.1 | $ | 25.7 | $ | 55.7 | $ | 76.8 | $ | 271.3 | |||||
| Middle Atlantic |
230.8 | 239.3 | 326.0 | 105.7 | 901.8 | ||||||||||
| East North Central |
99.4 | 200.2 | 523.3 | 396.2 | 1,219.1 | ||||||||||
| West North Central |
9.0 | 59.7 | 67.8 | 117.2 | 253.7 | ||||||||||
| South Atlantic |
122.1 | 430.0 | 689.9 | 344.5 | 1,586.5 | ||||||||||
| East South Central |
19.6 | 38.9 | 115.0 | 94.0 | 267.5 | ||||||||||
| West South Central |
24.5 | 156.8 | 165.9 | 229.1 | 576.3 | ||||||||||
| Mountain |
99.6 | 112.5 | 132.5 | 298.7 | 643.3 | ||||||||||
| Pacific |
308.7 | 345.6 | 408.9 | 325.0 | 1,388.2 | ||||||||||
| Total current principal |
$ | 1,026.8 | $ | 1,608.7 | $ | 2,485.0 | $ | 1,987.2 | $ | 7,107.7 | |||||
| Valuation allowance |
(53.8) | ||||||||||||||
| Unamortized premium |
1.3 | ||||||||||||||
| Fair value adjustment on mortgage loans held for sale |
(27.8) | ||||||||||||||
| Cumulative change in fair value of hedged mortgage loans |
19.4 | ||||||||||||||
| Total commercial mortgage loans on real estate |
7,046.8 | ||||||||||||||
| Total residential mortgage loans on real estate |
247.3 | ||||||||||||||
| Total mortgage loans on real estate, net |
$ | 7,294.1 | |||||||||||||
| December 31, 2008 | Office | Warehouse | Retail | Apartment & Other |
Total | ||||||||||
| New England |
$ | 134.9 | $ | 26.3 | $ | 74.6 | $ | 115.7 | $ | 351.5 | |||||
| Middle Atlantic |
243.9 | 256.5 | 336.5 | 117.2 | 954.1 | ||||||||||
| East North Central |
106.2 | 214.8 | 563.7 | 520.1 | 1,404.8 | ||||||||||
| West North Central |
11.1 | 67.3 | 68.8 | 138.2 | 285.4 | ||||||||||
| South Atlantic |
135.7 | 476.6 | 730.9 | 466.7 | 1,809.9 | ||||||||||
| East South Central |
22.1 | 43.3 | 117.9 | 126.3 | 309.6 | ||||||||||
| West South Central |
40.0 | 167.7 | 185.2 | 232.3 | 625.2 | ||||||||||
| Mountain |
106.5 | 133.6 | 136.9 | 327.6 | 704.6 | ||||||||||
| Pacific |
331.0 | 411.3 | 417.6 | 343.8 | 1,503.7 | ||||||||||
| Total current principal |
$ | 1,131.4 | $ | 1,797.4 | $ | 2,632.1 | $ | 2,387.9 | $ | 7,948.8 | |||||
| Valuation allowance |
(42.4) | ||||||||||||||
| Unamortized premium |
2.6 | ||||||||||||||
| Fair value adjustment on mortgage loans held for sale |
(48.4) | ||||||||||||||
| Cumulative change in fair value of hedged mortgage loans |
27.6 | ||||||||||||||
| Total mortgage loans on real estate, net |
$ | 7,888.2 | |||||||||||||
20
Nationwide Financial Services, Inc.
Statistical Supplement
September 30, 2009
Deferred Policy Acquisition Costs
| ($ in millions) | Individual Investments |
Retirement Plans |
Individual Protection |
Corporate and Other |
Total | ||||||||||||
| Nine Months Ended September 30, 2009 |
|||||||||||||||||
| Balance, beginning of period |
$ | 1,883.0 | $ | 290.1 | $ | 1,734.8 | $ | 615.9 | $ | 4,523.8 | |||||||
| Capitalization |
224.0 | 23.5 | 129.4 | - | 376.9 | ||||||||||||
| Amortization |
(147.9) | (33.2) | (127.8) | - | (308.9) | ||||||||||||
| Adjustments to unrealized gains and losses on securities |
(266.8) | (5.1) | 23.0 | (576.0) | (824.9) | ||||||||||||
| Balance, end of period |
$ | 1,692.3 | $ | 275.3 | $ | 1,759.4 | $ | 39.9 | $ | 3,766.9 | |||||||
| Year Ended December 31, 2008 |
|||||||||||||||||
| Balance, beginning of period |
$ | 2,078.0 | $ | 292.9 | $ | 1,637.6 | $ | 87.1 | $ | 4,095.6 | |||||||
| Capitalization |
326.5 | 34.5 | 226.6 | - | 587.6 | ||||||||||||
| Amortization |
(647.7) | (40.6) | (129.9) | - | (818.2) | ||||||||||||
| Adjustments to unrealized gains and losses on securities |
126.2 | 3.3 | 0.5 | 528.8 | 658.8 | ||||||||||||
| Balance, end of period |
$ | 1,883.0 | $ | 290.1 | $ | 1,734.8 | $ | 615.9 | $ | 4,523.8 | |||||||
| Year Ended December 31, 2007 |
|||||||||||||||||
| Balance, beginning of period |
$ | 1,945.0 | $ | 292.1 | $ | 1,530.5 | $ | 83.4 | $ | 3,851.0 | |||||||
| Capitalization |
398.6 | 36.1 | 196.6 | - | 631.3 | ||||||||||||
| Amortization |
(287.1) | (27.4) | (93.1) | - | (407.6) | ||||||||||||
| Adjustments to unrealized gains and losses on securities |
21.5 | (7.9) | 3.6 | 3.7 | 20.9 | ||||||||||||
| Balance, end of period |
$ | 2,078.0 | $ | 292.9 | $ | 1,637.6 | $ | 87.1 | $ | 4,095.6 | |||||||
| Year Ended December 31, 2006 |
|||||||||||||||||
| Balance, beginning of period |
$ | 1,936.4 | $ | 294.5 | $ | 1,412.0 | $ | 42.5 | $ | 3,685.4 | |||||||
| Capitalization |
350.8 | 36.8 | 200.8 | - | 588.4 | ||||||||||||
| Amortization |
(352.7) | (38.3) | (81.6) | - | (472.6) | ||||||||||||
| Adjustments to unrealized gains and losses on securities |
10.5 | (0.9) | (0.7) | 40.9 | 49.8 | ||||||||||||
| Balance, end of period |
$ | 1,945.0 | $ | 292.1 | $ | 1,530.5 | $ | 83.4 | $ | 3,851.0 | |||||||
| Year Ended December 31, 2005 |
|||||||||||||||||
| Balance, beginning of period |
$ | 2,094.6 | $ | 304.9 | $ | 1,314.2 | $ | (152.6) | $ | 3,561.1 | |||||||
| Capitalization |
250.7 | 37.2 | 201.1 | - | 489.0 | ||||||||||||
| Amortization |
(329.3) | (47.4) | (102.7) | - | (479.4) | ||||||||||||
| Adjustments to unrealized gains and losses on securities |
(79.6) | (0.2) | (0.6) | 195.1 | 114.7 | ||||||||||||
| Balance, end of period |
$ | 1,936.4 | $ | 294.5 | $ | 1,412.0 | $ | 42.5 | $ | 3,685.4 | |||||||
| Year Ended December 31, 2004 |
|||||||||||||||||
| Balance, beginning of period |
$ | 2,052.1 | $ | 303.3 | $ | 1,223.3 | $ | (248.8) | $ | 3,329.9 | |||||||
| Capitalization |
293.6 | 41.5 | 204.1 | - | 539.2 | ||||||||||||
| Amortization |
(276.1) | (39.9) | (114.4) | - | (430.4) | ||||||||||||
| Adjustments to unrealized gains and losses on securities |
25.0 | - | 1.2 | 96.2 | 122.4 | ||||||||||||
| Balance, end of period |
$ | 2,094.6 | $ | 304.9 | $ | 1,314.2 | $ | (152.6) | $ | 3,561.1 | |||||||
21
Nationwide Financial Services, Inc.
Statistical Supplement
September 30, 2009
Value of Business Acquired
| ($ in millions) | Individual Investments |
Retirement Plans |
Individual Protection |
Corporate and Other |
Total | ||||||||||||
| Nine Months Ended September 30, 2009 |
|||||||||||||||||
| Balance, beginning of period |
$ | 5.6 | $ | 11.8 | $ | 310.8 | $ | 5.8 | $ | 334.0 | |||||||
| Amortization |
(0.7) | (1.4) | (35.5) | (2.9) | (40.5) | ||||||||||||
| Adjustments to realized and unrealized gains and losses on securities available-for-sale |
0.1 | (7.7) | 1.2 | 2.8 | (3.6) | ||||||||||||
| Balance, end of period |
$ | 5.0 | $ | 2.7 | $ | 276.5 | $ | 5.7 | $ | 289.9 | |||||||
| Year Ended December 31, 2008 |
|||||||||||||||||
| Balance, beginning of period |
$ | 13.5 | $ | 5.8 | $ | 329.5 | $ | 6.0 | $ | 354.8 | |||||||
| Amortization |
(7.8) | (1.3) | (22.1) | (0.3) | (31.5) | ||||||||||||
| Adjustments to realized and unrealized gains and losses on securities available-for-sale |
(0.1) | 7.3 | 3.4 | 0.1 | 10.7 | ||||||||||||
| Balance, end of period |
$ | 5.6 | $ | 11.8 | $ | 310.8 | $ | 5.8 | $ | 334.0 | |||||||
| Year Ended December 31, 2007 |
|||||||||||||||||
| Balance, beginning of period |
$ | 14.1 | $ | 4.9 | $ | 367.5 | $ | 6.2 | $ | 392.7 | |||||||
| Amortization |
(5.3) | (2.2) | (39.3) | (0.2) | (47.0) | ||||||||||||
| Adjustments to realized and unrealized gains and losses on securities available-for-sale |
4.7 | 3.1 | 1.3 | - | 9.1 | ||||||||||||
| Balance, end of period |
$ | 13.5 | $ | 5.8 | $ | 329.5 | $ | 6.0 | $ | 354.8 | |||||||
| Year Ended December 31, 2006 |
|||||||||||||||||
| Balance, beginning of period |
$ | 29.4 | $ | 15.7 | $ | 398.2 | $ | 6.4 | $ | 449.7 | |||||||
| Amortization |
(6.5) | (6.9) | (32.6) | - | (46.0) | ||||||||||||
| Adjustments to realized and unrealized gains and losses on securities available-for-sale |
(8.8) | (3.9) | 1.9 | (0.2) | (11.0) | ||||||||||||
| Balance, end of period |
$ | 14.1 | $ | 4.9 | $ | 367.5 | $ | 6.2 | $ | 392.7 | |||||||
| Year Ended December 31, 2005 |
|||||||||||||||||
| Balance, beginning of period |
$ | 27.1 | $ | 16.5 | $ | 430.4 | $ | 6.4 | $ | 480.4 | |||||||
| Amortization |
(7.2) | (3.5) | (34.3) | - | (45.0) | ||||||||||||
| Adjustments to realized and unrealized gains and losses on securities available-for-sale |
9.5 | 2.7 | 2.1 | - | 14.3 | ||||||||||||
| Balance, end of period |
$ | 29.4 | $ | 15.7 | $ | 398.2 | $ | 6.4 | $ | 449.7 | |||||||
| Year Ended December 31, 2004 |
|||||||||||||||||
| Balance, beginning of period |
$ | 33.0 | $ | 19.6 | $ | 463.6 | $ | 6.8 | $ | 523.0 | |||||||
| Amortization |
(7.5) | (4.7) | (40.1) | - | (52.3) | ||||||||||||
| Adjustments to realized and unrealized gains and losses on securities available-for-sale |
1.6 | 1.6 | 6.9 | (0.4) | 9.7 | ||||||||||||
| Balance, end of period |
$ | 27.1 | $ | 16.5 | $ | 430.4 | $ | 6.4 | $ | 480.4 | |||||||
22
Nationwide Financial Services, Inc.
Statistical Supplement
September 30, 2009
| Individual Variable Annuity Guaranteed Minimum Death Benefits | ||||||||||||||||||||
| ($ in millions) | September 30, 2009 | December 31, 2008 | ||||||||||||||||||
| Account Values |
Net Amount at Risk | Account Values |
Net Amount at Risk | |||||||||||||||||
| GMDB Benefit Type |
Gross | Net | Gross | Net | ||||||||||||||||
| Return of premium |
$ | 6,447.5 | $ | 152.6 | $ | 135.8 | $ | 5,994.3 | $ | 472.3 | $ | 440.6 | ||||||||
| Reset |
13,728.9 | 1,412.7 | 1,141.4 | 12,542.1 | 3,119.1 | 2,477.7 | ||||||||||||||
| Ratchet |
14,478.9 | 2,456.5 | 2,107.0 | 12,423.4 | 4,377.8 | 3,775.3 | ||||||||||||||
| Roll-up |
298.6 | 123.0 | 19.2 | 290.4 | 163.8 | 25.9 | ||||||||||||||
| Combo |
1,787.3 | 378.4 | 376.6 | 1,704.1 | 623.4 | 621.2 | ||||||||||||||
| Subtotal | $ | 36,741.2 | 4,523.2 | 3,780.0 | $ | 32,954.3 | 8,756.4 | 7,340.7 | ||||||||||||
| Earnings enhancement |
$ | 377.4 | $ | 17.1 | $ | 17.1 | $ | 333.5 | $ | 7.2 | $ | 7.2 | ||||||||
| Total | $ | 4,540.3 | $ | 3,797.1 | $ | 8,763.6 | $ | 7,347.9 | ||||||||||||
| GAAP GMDB reserves |
$ | 78.9 | $ | 192.9 | ||||||||||||||||
| Statutory GMDB reserves |
$ | 171.3 | $ | 308.5 | ||||||||||||||||
| December 31, 2007 | December 31, 2006 | |||||||||||||||||||
| Account Values |
Net Amount at Risk | Account Values |
Net Amount at Risk | |||||||||||||||||
| GMDB Benefit Type |
Gross | Net | Gross | Net | ||||||||||||||||
| Return of premium |
$ | 9,086.7 | $ | 23.4 | $ | 18.7 | $ | 9,243.7 | $ | 42.9 | $ | 33.9 | ||||||||
| Reset |
18,055.4 | 120.7 | 62.1 | 17,752.7 | 177.3 | 49.3 | ||||||||||||||
| Ratchet |
15,931.7 | 224.4 | 133.3 | 13,651.6 | 195.2 | 31.7 | ||||||||||||||
| Roll-up |
492.2 | 61.7 | 8.4 | 568.1 | 87.7 | 11.3 | ||||||||||||||
| Combo |
2,555.5 | 48.0 | 47.0 | 2,588.7 | 30.1 | 28.9 | ||||||||||||||
| Subtotal | $ | 46,121.5 | 478.2 | 269.5 | $ | 43,804.8 | 533.2 | 155.1 | ||||||||||||
| Earnings enhancement |
$ | 519.2 | $ | 49.8 | $ | 49.8 | $ | 477.8 | $ | 41.1 | $ | 41.1 | ||||||||
| Total | $ | 528.0 | $ | 319.3 | $ | 574.3 | $ | 196.2 | ||||||||||||
| GAAP GMDB reserves |
$ | 47.6 | $ | 29.6 | ||||||||||||||||
| Statutory GMDB reserves |
$ | 34.4 | $ | 27.3 | ||||||||||||||||
| December 31, 2005 | December 31, 2004 | |||||||||||||||||||
| Account Values |
Net Amount at Risk | Account Values |
Net Amount at Risk | |||||||||||||||||
| GMDB Benefit Type |
Gross | Net | Gross | Net | ||||||||||||||||
| Return of premium |
$ | 9,272.7 | $ | 83.3 | $ | 32.5 | $ | 9,848.6 | $ | 136.8 | $ | 54.1 | ||||||||
| Reset |
17,130.4 | 388.0 | 61.8 | 18,084.1 | 751.7 | 158.1 | ||||||||||||||
| Ratchet |
11,233.2 | 410.3 | 31.6 | 10,322.1 | 644.5 | 46.3 | ||||||||||||||
| Roll-up |
629.1 | 143.8 | 8.4 | 707.2 | 167.5 | 9.7 | ||||||||||||||
| Combo |
2,530.6 | 45.7 | 22.3 | 2,519.9 | 39.8 | 19.2 | ||||||||||||||
| Subtotal | $ | 40,796.0 | 1,071.1 | 156.6 | $ | 41,481.9 | 1,740.3 | 287.4 | ||||||||||||
| Earnings enhancement |
$ | 418.5 | $ | 27.6 | $ | 27.6 | $ | 310.1 | $ | 18.0 | $ | 18.0 | ||||||||
| Total | $ | 1,098.7 | $ | 184.2 | $ | 1,758.3 | $ | 305.4 | ||||||||||||
| GAAP GMDB reserves |
$ | 27.2 | ||||||||||||||||||
| Statutory GMDB reserves |
$ | 38.4 | ||||||||||||||||||
| Net Amount at Risk, Net of Reinsurance by Benefit Type and Age at September 30, 2009 | Wghtd. Avg. Attained Age | |||||||||||||||||||
| GMDB Benefit Type |
0 to 50 | 51 to 60 | 61 to 70 | 71 to 80 | Over 81 | Total | ||||||||||||||
| Return of premium |
$ | 33.7 | $ | 46.9 | $ | 37.8 | $ | 12.2 | $ | 5.2 | $ | 135.8 | 61 | |||||||
| Reset |
132.3 | 320.3 | 396.6 | 217.2 | 75.0 | 1,141.4 | 64 | |||||||||||||
| Ratchet |
169.2 | 459.8 | 700.0 | 488.6 | 289.4 | 2,107.0 | 67 | |||||||||||||
| Roll-up |
1.6 | 3.9 | 5.2 | 4.6 | 3.9 | 19.2 | 73 | |||||||||||||
| Combo |
20.7 | 63.8 | 126.5 | 109.6 | 56.0 | 376.6 | 69 | |||||||||||||
| Subtotal | 357.5 | 894.7 | 1,266.1 | 832.2 | 429.5 | 3,780.0 | 65 | |||||||||||||
| Earnings enhancement |
1.3 | 3.9 | 7.2 | 4.7 | - | 17.1 | 64 | |||||||||||||
| Total | $ | 358.8 | $ | 898.6 | $ | 1,273.3 | $ | 836.9 | $ | 429.5 | $ | 3,797.1 | 65 | |||||||
Definition of GMDB Benefit Types
Return of premium: provides the greater of account value or total deposits made to the contract less any partial withdrawals and assessments, which is referred to as “net premiums.” In general, there is no lock in age for this benefit, however for some contracts, the GMDB reverts to the account value at a specified age, typically age 75.
Reset: provides the greater of a return of premium death benefit or the most recent five-year anniversary (prior to lock in age) account value adjusted for withdrawals. For most contracts, this GMDB locks in at age 86 or 90 and for others the GMDB reverts to the account value at age 75, 85, 86 or 90.
Ratchet: provides the greater of a return of premium death benefit or the highest “anniversary” account value (prior to age 86) adjusted for withdrawals. Currently, there are three versions of ratchet, with the difference being based on the definition of anniversary: monthaversary—evaluated monthly, annual—evaluated annually, and five-year—evaluated every fifth year. The majority of the business is an annual ratchet.
Rollup: provides the greater of a return of premium death benefit or premiums adjusted for withdrawals accumulated at generally 5% simple interest up to the earlier of age 86 or 200% of adjusted premiums. There are two variations of this benefit. For certain contracts, this GMDB locks in at age 86 and for others the GMDB reverts to the account value at age 75.
Combo: provides the greater of annual ratchet death benefit or the rollup death benefit. This benefit locks in at either age 81 or 86.
Earnings enhancement: provides an enhancement to the death benefit that is a specified percentage of the adjusted earnings accumulated on the contract at the date of death. There are two versions of this benefit, one where the benefit expires at age 86 and a credit of 4% of account value is deposited into the contract and the second where the benefit doesn’t have an end age, but has a cap on the payout and is paid upon the first death in a spousal situation. Both benefits have age limitations. This benefit is paid in addition to any other death benefits paid under the contract.
23
Nationwide Financial Services, Inc.
Statistical Supplement
September 30, 2009
Individual Variable Annuity Guaranteed Minimum Accumulation Benefits
| ($ in millions) | September 30, 2009 | December 31, 2008 | ||||||||||||||||
| Account Values |
Net Amount at Risk | Account Values |
Net Amount at Risk | |||||||||||||||
| GMAB Benefit Type |
Gross | Net | Gross | Net | ||||||||||||||
| 5 Year |
$ | 3,067.7 | $ | 218.9 | $ | 218.9 | $ | 2,867.6 | $ | 499.0 | $ | 499.0 | ||||||
| 7 Year |
2,521.7 | 222.8 | 222.8 | 2,265.9 | 482.9 | 482.9 | ||||||||||||
| 10 Year |
753.1 | 50.3 | 50.3 | 677.9 | 132.2 | 132.2 | ||||||||||||
| Total | $ | 6,342.5 | $ | 492.0 | $ | 492.0 | $ | 5,811.4 | $ | 1,114.1 | $ | 1,114.1 | ||||||
| CPPLI included in totals |
$ | 5,268.1 | $ | 488.6 | $ | 488.6 | $ | 4,585.6 | $ | 1,061.2 | $ | 1,061.2 | ||||||
| December 31, 2007 | December 31, 2006 | |||||||||||||||||
| Account Values |
Net Amount at Risk | Account Values |
Net Amount at Risk | |||||||||||||||
| GMAB Benefit Type |
Gross | Net | Gross | Net | ||||||||||||||
| 5 Year |
$ | 2,985.6 | $ | 4.6 | $ | 4.6 | $ | 2,131.1 | $ | 0.1 | $ | 0.1 | ||||||
| 7 Year |
2,644.1 | 6.2 | 6.2 | 1,865.7 | 0.1 | 0.1 | ||||||||||||
| 10 Year |
927.3 | 1.3 | 1.3 | 784.0 | - | - | ||||||||||||
| Total | $ | 6,557.0 | $ | 12.1 | $ | 12.1 | $ | 4,780.8 | $ | 0.2 | $ | 0.2 | ||||||
| CPPLI included in totals |
$ | 4,772.4 | $ | 12.1 | $ | 12.1 | $ | 2,946.4 | $ | 0.2 | $ | 0.2 | ||||||
| December 31, 2005 | December 31, 2004 | |||||||||||||||||
| Account Values |
Net Amount at Risk | Account Values |
Net Amount at Risk | |||||||||||||||
| GMAB Benefit Type |
Gross | Net | Gross | Net | ||||||||||||||
| 5 Year |
$ | 1,041.8 | $ | 0.5 | $ | 0.5 | $ | 512.2 | $ | 0.1 | $ | 0.1 | ||||||
| 7 Year |
1,103.5 | 0.2 | 0.2 | 647.5 | - | - | ||||||||||||
| 10 Year |
595.5 | 0.1 | 0.1 | 332.4 | - | - | ||||||||||||
| Total | $ | 2,740.8 | $ | 0.8 | $ | 0.8 | $ | 1,492.1 | $ | 0.1 | $ | 0.1 | ||||||
| CPPLI included in totals |
$ | 939.1 | $ | 0.6 | $ | 0.6 | - | - | - | |||||||||
| Individual Variable Annuity Guaranteed Minimum Income Benefits | ||||||||||||||||||
| ($ in millions) | September 30, 2009 | December 31, 2008 | ||||||||||||||||
| Account Values |
Net Amount at Risk | Account Values |
Net Amount at Risk | |||||||||||||||
| GMIB Benefit Type |
Gross | Net | Gross | Net | ||||||||||||||
| Ratchet |
$ | 260.6 | $ | 1.4 | $ | 0.4 | $ | 244.7 | $ | 14.1 | $ | 5.6 | ||||||
| Roll-up |
687.9 | 11.0 | 0.5 | 659.5 | 22.3 | 1.3 | ||||||||||||
| Combo |
0.1 | - | - | 0.1 | - | - | ||||||||||||
| Total | $ | 948.6 | $ | 12.4 | $ | 0.9 | $ | 904.3 | $ | 36.4 | $ | 6.9 | ||||||
| December 31, 2007 | December 31, 2006 | |||||||||||||||||
| Account Values |
Net Amount at Risk | Account Values |
Net Amount at Risk | |||||||||||||||
| GMIB Benefit Type |
Gross | Net | Gross | Net | ||||||||||||||
| Ratchet |
$ | 425.2 | $ | 0.1 | $ | - | $ | 450.6 | $ | 0.2 | $ | - | ||||||
| Roll-up |
1,119.9 | 1.8 | - | 1,187.1 | 3.3 | - | ||||||||||||
| Combo |
0.3 | - | - | 0.5 | - | - | ||||||||||||
| Total | $ | 1,545.4 | $ | 1.9 | $ | - | $ | 1,638.2 | $ | 3.5 | $ | - | ||||||
| December 31, 2005 | December 31, 2004 | |||||||||||||||||
| Account Values |
Net Amount at Risk | Account Values |
Net Amount at Risk | |||||||||||||||
| GMIB Benefit Type |
Gross | Net | Gross | Net | ||||||||||||||
| Ratchet |
$ | 444.7 | $ | 0.3 | $ | - | $ | 439.7 | $ | 0.7 | $ | - | ||||||
| Roll-up |
1,189.3 | 5.0 | - | 1,188.7 | 7.2 | - | ||||||||||||
| Combo |
0.5 | - | - | 1.0 | - | - | ||||||||||||
| Total | $ | 1,634.5 | $ | 5.3 | $ | - | $ | 1,629.4 | $ | 7.9 | $ | - | ||||||
Definition of Benefit Types
5 Year, 7 Year, 10 Year: the waiting period required to receive the guaranteed accumulation benefit.
Ratchet: provides an annuitization value equal to the greater of account value, net premiums paid or the highest one-year anniversary account value (prior to age 86) adjusted for withdrawals.
Rollup: provides an annuitization value equal to the greater of account value and premiums adjusted for withdrawals accumulated at 5% compound interest up to the earlier of age 86 or 200% of adjusted premiums.
Combo: provides an annuitization value equal to the greater of account value, ratchet GMIB benefit or rollup GMIB benefit.
CPPLI: Capital Preservation Plus Lifetime Income is a living benefit rider that combines a GMAB feature in its first five to 10 years with a lifetime withdrawal benefit which begins upon the maturity of the GMAB and extends for the duration of the insured’s life.
24
Nationwide Financial Services, Inc.
Statistical Supplement
September 30, 2009
This Page Intentionally Left Blank.
25
Nationwide Financial Services, Inc.
Statistical Supplement
September 30, 2009
Individual Variable Annuity Guaranteed Lifetime Withdrawal Benefits
| ($ in millions) | September 30, 2009 | December 31, 2008 | ||||||||||||||||
| Account | Net Amount at Risk | Account | Net Amount at Risk | |||||||||||||||
| GLWB Benefit Type |
Values | Gross | Net | Values | Gross | Net | ||||||||||||
| L.INC |
$ | 6,228.4 | $ | 138.1 | $ | 138.1 | $ | 3,320.8 | $ | 571.5 | $ | 571.5 | ||||||
| Portfolio Income Insurance (1) |
4.2 | - | - | - | - | - | ||||||||||||
| Total | $ | 6,232.6 | $ | 138.1 | $ | 138.1 | $ | 3,320.8 | $ | 571.5 | $ | 571.5 | ||||||
|
(1) Funds for the Portfolio Income Insurance product are not managed by Nationwide Financial. |
||||||||||||||||||
| December 31, 2007 | December 31, 2006 | |||||||||||||||||
| Account | Net Amount at Risk | Account | Net Amount at Risk | |||||||||||||||
| GLWB Benefit Type |
Values | Gross | Net | Values | Gross | Net | ||||||||||||
| L.INC |
$ | 2,865.8 | $ | - | $ | - | $ | 993.8 | $ | - | $ | - | ||||||
| Total | $ | 2,865.8 | $ | - | $ | - | $ | 993.8 | $ | - | $ | - | ||||||
Individual Variable Annuity Guaranteed Minimum Death Benefit Reserve Activity
| ($ in millions) | Q3’08 | Q4’08 | Q1’09 | Q2’09 | Q3’09 | ||||||||||
| Balance, beginning of period |
$ | 59.5 | $ | 95.3 | $ | 192.9 | $ | 261.3 | $ | 148.6 | |||||
| Expense provision & True Up |
50.0 | 138.7 | 102.9 | (78.4) | (43.0) | ||||||||||
| Net claims paid |
(14.2) | (41.1) | (34.5) | (34.3) | (26.7) | ||||||||||
| Balance, end of period |
$ | 95.3 | $ | 192.9 | $ | 261.3 | $ | 148.6 | $ | 78.9 | |||||
Individual Fixed Annuity and Fixed Option of Variable Annuity Summary of Crediting Rate Detail as of September 30, 2009
| Ratchet | Reset | |||||||||
| ($ in millions) | Account Value |
Wtd. Avg. Crediting Rate |
Account Value |
Wtd.
Avg. Crediting Rate | ||||||
| Minimum interest rate of 3.50% or greater |
$ | - | - | $ | 851.7 | 3.65% | ||||
| Minimum interest rate of 3.00% to 3.49% |
1,025.1 | 4.03% | 2,537.7 | 3.09% | ||||||
| Minimum interest rate lower than 3.00% |
1,061.6 | 3.64% | 1,208.9 | 3.60% | ||||||
| MVA with no minimum interest rate guarantee |
- | - | - | - | ||||||
| Total | $ | 2,086.7 | 3.83% | $ | 4,598.3 | 3.33% | ||||
| MVA & Other | Total | |||||||||
| Account Value |
Wtd. Avg. Crediting Rate |
Account Value |
Wtd. Avg. Crediting Rate | |||||||
| Minimum interest rate of 3.50% or greater |
$ | - | - | 851.7 | 3.65% | |||||
| Minimum interest rate of 3.00% to 3.49% |
- | - | 3,562.8 | 3.36% | ||||||
| Minimum interest rate lower than 3.00% |
215.8 | 1.44% | 2,486.3 | 3.43% | ||||||
| MVA with no minimum interest rate guarantee |
1,713.5 | 2.81% | 1,713.5 | 2.81% | ||||||
| Total | $ | 1,929.3 | 2.65% | $ | 8,614.3 | 3.30% | ||||
Definition of Benefit Types
L.INC: Lifetime Income is a living benefit rider that provides a lifetime withdrawal benefit to the insured.
The withdrawal percent is based on the insured’s age at the time of the first withdrawal.
26
Nationwide Financial Services, Inc.
Statistical Supplement
September 30, 2009
Historical Financial Highlights
| ($ in millions) | 2004 | 2005 | 2006 | 2007 | 2008 | ||||||||||
| Operating Revenues |
|||||||||||||||
| Individual investments |
$ | 1,487.0 | $ | 1,528.2 | $ | 1,526.6 | $ | 1,469.8 | $ | 1,385.4 | |||||
| Retirement plans |
982.5 | 1,045.2 | 1,115.6 | 1,146.2 | 1,091.3 | ||||||||||
| Individual protection |
1,318.2 | 1,321.1 | 1,321.0 | 1,349.7 | 1,405.2 | ||||||||||
| Corporate and other |
421.1 | 503.5 | 599.9 | 716.0 | 382.5 | ||||||||||
| Total operating revenues |
$ | 4,208.8 | $ | 4,398.0 | $ | 4,563.1 | $ | 4,681.7 | $ | 4,264.4 | |||||
| Net realized investment gains/(losses) (1) |
(40.9) | 18.2 | (0.6) | (152.8) | (1,556.8) | ||||||||||
| Total revenues |
$ | 4,167.9 | $ | 4,416.2 | $ | 4,562.5 | $ | 4,528.9 | $ | 2,707.6 | |||||
| Pre-tax Operating Earnings (Loss) |
|||||||||||||||
| Individual investments |
$ | 244.0 | $ | 250.7 | $ | 223.1 | $ | 300.7 | $ | (220.2) | |||||
| Retirement plans |
183.3 | 191.3 | 221.2 | 252.6 | 202.2 | ||||||||||
| Individual protection |
247.3 | 266.1 | 280.8 | 299.8 | 256.5 | ||||||||||
| Corporate and other |
66.8 | 54.9 | 65.1 | 74.6 | (188.8) | ||||||||||
| Pre-tax operating earnings |
$ | 741.4 | $ | 763.0 | $ | 790.2 | $ | 927.7 | $ | 49.7 | |||||
| Federal income tax expense |
190.3 | 135.1 | 69.0 | 235.2 | (35.9) | ||||||||||
| Net operating earnings |
$ | 551.1 | $ | 627.9 | $ | 721.2 | $ | 692.5 | $ | 85.6 | |||||
| Net realized investment gains/(losses), net of taxes (2) |
(26.6) | 11.1 | 5.9 | (82.8) | (921.4) | ||||||||||
| Discontinued operations, net of taxes |
|
(4.7) |
(28.6) | (3.1) | 23.1 | (13.2) | |||||||||
| Cumulative effect of adoption of accounting principles, net of taxes |
(3.4) | - | - | (6.0) | - | ||||||||||
| Net income |
$ | 516.4 | $ | 610.4 | $ | 724.0 | $ | 626.8 | $ | (849.0) | |||||
| New and Renewal Production Premiums and Deposits by Channel |
|||||||||||||||
| Non-affiliated |
|||||||||||||||
| Independent broker/dealers |
$ | 5,223.2 | $ | 5,266.0 | $ | 5,758.2 | $ | 6,354.7 | $ | 5,556.3 | |||||
| Financial institutions |
2,618.5 | 1,808.0 | 2,295.1 | 2,501.2 | 2,385.6 | ||||||||||
| Wirehouse and regional firms |
1,992.1 | 1,912.5 | 2,433.6 | 2,879.0 | 2,399.4 | ||||||||||
| Pension plan administrators |
476.1 | 469.0 | 532.8 | 507.7 | 459.1 | ||||||||||
| Life specialists |
382.8 | 382.4 | 580.6 | 329.6 | 353.6 | ||||||||||
| Affiliated |
|||||||||||||||
| Nationwide Retirement Solutions |
3,665.9 | 3,914.7 | 4,050.2 | 4,299.9 | 4,509.9 | ||||||||||
| Nationwide Financial Network |
1,475.2 | 1,415.8 | 1,486.5 | 1,468.9 | 1,257.5 | ||||||||||
| Mullin TBG |
184.2 | 275.4 | 226.1 | 223.2 | 191.5 | ||||||||||
| Total |
$ | 16,018.0 | $ | 15,443.8 | $ | 17,363.1 | $ | 18,564.2 | $ | 17,112.9 | |||||
| (1) | Excluding operating items (periodic net amounts paid or received on interest rate swaps that do not qualify for hedge accounting treatment, trading portfolio realized gains and losses, trading portfolio valuation changes, and net realized gains and losses related to securitizations). |
| (2) | Excluding operating items (periodic net amounts paid or received on interest rate swaps that do not qualify for hedge accounting treatment, trading portfolio realized gains and losses, trading portfolio valuation changes, and net realized gains and losses related to securitizations), and net of adjustment to amortization related to net realized gains/(losses). |
| Note: | The results of operations of TBG Financial are reflected as discontinued for 2008 and all prior years. The results of operations of The 401(k) Company are reflected as discontinued for 2007 and all prior years. In addition, the results of operations of Cap Pro Holding, Inc., Nationwide Financial Services (Bermuda), Ltd. and William J. Lynch & Associates, Inc. are reflected as discontinued for 2005 and 2004. |
27
Nationwide Financial Services, Inc.
Statistical Supplement
September 30, 2009
Historical Financial Highlights
| ($ in millions) | 2004 | 2005 | 2006 | 2007 | 2008 | ||||||||||
| Balance Sheet Data |
|||||||||||||||
| Total assets |
$ | 117,121.2 | $ | 116,361.2 | $ | 119,531.1 | $ | 119,207.1 | $ | 94,472.6 | |||||
| Customer funds managed and administered |
$ | 140,296.6 | $ | 145,484.8 | $ | 156,909.9 | $ | 162,365.4 | $ | 126,925.8 | |||||
| Total equity |
|||||||||||||||
| Including AOCI and NCI |
$ | 5,614.7 | $ | 5,829.9 | $ | 6,069.7 | $ | 5,792.2 | $ | 3,474.8 | |||||
| AOCI |
432.2 | 100.7 | 31.9 | (81.5) | (1,370.8) | ||||||||||
| NCI |
380.7 | 442.3 | 447.0 | 467.6 | 416.6 | ||||||||||
| Excluding AOCI and NCI |
$ | 4,801.8 | $ | 5,286.9 | $ | 5,590.8 | $ | 5,406.1 | $ | 4,429.0 | |||||
| Net operating return on average equity excluding AOCI and NCI |
12.1% | 12.4% | 13.2% | 12.5% | 1.7% | ||||||||||
| Adjusted net operating return on average equity excluding AOCI and NCI (1) |
12.1% | 11.7% | 11.3% | 12.5% | 1.7% | ||||||||||
| Statutory capital and surplus |
$ | 2,967.5 | $ | 3,262.1 | $ | 3,336.6 | $ | 3,175.1 | $ | 2,749.9 | |||||
| (1) | 2005 return adjusted for $37.9 million impact of one-time tax adjustments associated with separate account dividend received deductions. |
| 2006 return adjusted for $113.1 million of released tax reserves and associated tax-related adjustments relating to prior tax years. |
| Note: | The results of operations of TBG Financial are reflected as discontinued for 2008 and all prior years. The results of operations of The 401(k) Company are reflected as discontinued for 2007 and all prior years. In addition, the results of operations of Cap Pro Holding, Inc., Nationwide Financial Services (Bermuda), Ltd. and William J. Lynch & Associates, Inc. are reflected as discontinued for 2005 and 2004. | |
28
Nationwide Financial Services, Inc.
Statistical Supplement
September 30, 2009
Historical Consolidated Earnings Trends
| ($ in millions) | 2004 | 2005 | 2006 | 2007 | 2008 | ||||||||||
| Operating Revenues |
|||||||||||||||
| Asset fees |
$ | 620.7 | $ | 639.9 | $ | 691.2 | $ | 773.2 | $ | 677.1 | |||||
| Cost of insurance charges |
379.7 | 388.5 | 402.0 | 420.5 | 449.7 | ||||||||||
| Administrative fees |
117.9 | 114.9 | 139.1 | 119.4 | 140.4 | ||||||||||
| Surrender fees |
104.3 | 98.2 | 83.7 | 70.8 | 73.3 | ||||||||||
| Total policy charges |
1,222.6 | 1,241.5 | 1,316.0 | 1,383.9 | 1,340.5 | ||||||||||
| Premiums |
402.7 | 399.9 | 441.5 | 432.7 | 417.7 | ||||||||||
| Net investment income |
2,231.7 | 2,344.1 | 2,300.2 | 2,276.7 | 1,971.3 | ||||||||||
| Operating realized gains (losses) |
8.7 | 2.6 | 9.7 | (12.4) | 6.9 | ||||||||||
| Other income |
343.1 | 409.9 | 495.7 | 600.8 | 528.0 | ||||||||||
| Total operating revenues |
4,208.8 | 4,398.0 | 4,563.1 | 4,681.7 | 4,264.4 | ||||||||||
| Benefits |
|||||||||||||||
| Interest credited to policyholder accounts |
1,328.3 | 1,380.9 | 1,381.5 | 1,342.0 | 1,210.8 | ||||||||||
| Life insurance and annuity benefits |
548.6 | 574.9 | 646.8 | 682.9 | 887.2 | ||||||||||
| Policyholder dividends |
101.4 | 107.3 | 90.7 | 83.1 | 93.1 | ||||||||||
| Total benefits |
1,978.3 | 2,063.1 | 2,119.0 | 2,108.0 | 2,191.1 | ||||||||||
| Expenses |
|||||||||||||||
| Commissions |
573.2 | 557.5 | 658.3 | 738.8 | 674.5 | ||||||||||
| General operating expenses |
867.6 | 847.9 | 959.0 | 959.9 | 980.0 | ||||||||||
| Debt extinguishment costs |
- | 21.7 | - | 10.2 | - | ||||||||||
| Deferral of policy acquisition costs |
(539.2) | (489.0) | (588.4) | (631.3) | (587.6) | ||||||||||
| Subtotal |
901.6 | 938.1 | 1,028.9 | 1,077.6 | 1,066.9 | ||||||||||
| Amortization of policy acquisition costs |
430.4 | 479.4 | 472.6 | 407.6 | 818.2 | ||||||||||
| Amortization of VOBA and other intangible assets |
54.7 | 46.8 | 49.3 | 50.2 | 32.9 | ||||||||||
| Interest expense |
102.4 | 107.6 | 103.1 | 110.6 | 105.6 | ||||||||||
| Total expenses |
1,489.1 | 1,571.9 | 1,653.9 | 1,646.0 | 2,023.6 | ||||||||||
| Pre-tax operating earnings |
$ | 741.4 | $ | 763.0 | $ | 790.2 | $ | 927.7 | $ | 49.7 | |||||
| Federal income tax expense |
190.3 | 135.1 | 69.0 | 235.2 | (35.9) | ||||||||||
| Net operating earnings |
$ | 551.1 | $ | 627.9 | $ | 721.2 | $ | 692.5 | $ | 85.6 | |||||
| Net realized investment gains/(losses), net of taxes (1) |
|||||||||||||||
| Realized gains/(losses) on sales, net of hedging |
45.3 | 43.8 | 17.1 | 8.5 | (22.4) | ||||||||||
| Other-than-temporary impairments, including mortgage loan valuation allowance adjustment |
(67.1) | (26.9) | (11.0) | (76.1) | (745.2) | ||||||||||
| Credit default swaps |
0.3 | (4.8) | (0.8) | (3.9) | (4.5) | ||||||||||
| Derivatives, excluding hedging gains and losses on sales and credit default swaps |
(3.4) | 0.8 | (0.4) | (10.4) | (174.6) | ||||||||||
| Amounts credited to policyholder dividend obligation |
(4.7) | (3.3) | - | (1.7) | 24.7 | ||||||||||
| Adjustment to VOBA amortization |
3.0 | 1.5 | 1.0 | 0.8 | 0.6 | ||||||||||
| Subtotal |
(26.6) | 11.1 | 5.9 | (82.8) | (921.4) | ||||||||||
| Discontinued operations, net of taxes |
(4.7) | (28.6) | (3.1) | 23.1 | (13.2) | ||||||||||
| Cumulative effect of adoption of accounting principles, net of taxes |
(3.4) | - | - | (6.0) | - | ||||||||||
| Net income |
$ | 516.4 | $ | 610.4 | $ | 724.0 | $ | 626.8 | $ | (849.0) | |||||
| (1) | Excluding operating items (periodic net amounts paid or received on interest rate swaps that do not qualify for hedge accounting treatment, trading portfolio realized gains and losses, trading portfolio valuation changes, and net realized gains and losses related to securitizations), and net of adjustment to amortization related to net realized gains/(losses). |
| Note: |
The results of operations of TBG Financial are reflected as discontinued for 2008 and all prior years. The results of operations of The 401(k) Company are reflected as discontinued for 2007 and all prior years. In addition, the results of operations of Cap Pro Holding, Inc., Nationwide Financial Services (Bermuda), Ltd. and William J. Lynch & Associates, Inc. are reflected as discontinued for 2005 and 2004. |
29
Nationwide Financial Services, Inc.
Statistical Supplement
September 30, 2009
Historical Consolidated Balance Sheet
| ($ in millions) | 2004 | 2005 | 2006 | 2007 | 2008 | ||||||||||
| Assets |
|||||||||||||||
| Investments |
|||||||||||||||
| Securities available-for-sale at fair value: |
|||||||||||||||
| Fixed maturity securities |
$ | 31,516.8 | $ | 30,106.0 | $ | 28,160.0 | $ | 27,189.2 | $ | 23,069.7 | |||||
| Equity securities |
87.0 | 75.6 | 67.6 | 124.2 | 60.7 | ||||||||||
| Trading assets |
15.9 | 34.4 | 24.3 | 37.7 | 66.1 | ||||||||||
| Mortgage loans on real estate, net |
9,267.5 | 9,148.6 | 8,909.8 | 8,316.1 | 7,888.2 | ||||||||||
| Real estate |
108.3 | 108.7 | 59.1 | 21.8 | 16.5 | ||||||||||
| Policy loans |
987.2 | 930.6 | 966.9 | 1,018.3 | 1,095.6 | ||||||||||
| Other long-term investments |
604.2 | 691.9 | 856.0 | 1,187.2 | 968.1 | ||||||||||
| Short-term investments |
2,009.9 | 2,073.2 | 2,215.6 | 1,173.6 | 3,055.0 | ||||||||||
| Total investments |
44,596.8 | 43,169.0 | 41,259.3 | 39,068.1 | 36,219.9 | ||||||||||
| Cash |
60.3 | 49.5 | 84.1 | 73.6 | 165.5 | ||||||||||
| Accrued investment income |
428.7 | 396.3 | 373.8 | 368.4 | 352.1 | ||||||||||
| Deferred policy acquisition costs |
3,561.1 | 3,685.4 | 3,851.0 | 4,095.6 | 4,523.8 | ||||||||||
| Value of business acquired |
480.4 | 449.7 | 392.7 | 354.8 | 334.0 | ||||||||||
| Other intangible assets |
48.7 | 45.6 | 47.6 | 44.3 | 17.1 | ||||||||||
| Goodwill |
382.3 | 364.5 | 359.0 | 301.2 | 246.5 | ||||||||||
| Other assets |
2,659.7 | 2,237.4 | 2,468.9 | 2,046.1 | 3,773.0 | ||||||||||
| Separate account assets |
64,903.2 | 65,963.8 | 70,694.7 | 72,855.0 | 48,840.7 | ||||||||||
| Total assets |
$ | 117,121.2 | $ | 116,361.2 | $ | 119,531.1 | $ | 119,207.1 | $ | 94,472.6 | |||||
| Liabilities and equity |
|||||||||||||||
| Future policy benefits and claims |
$ | 41,077.2 | $ | 39,748.1 | $ | 38,097.8 | $ | 35,441.5 | $ | 35,720.0 | |||||
| Short-term debt |
230.8 | 252.3 | 85.2 | 309.3 | 295.7 | ||||||||||
| Long-term debt |
1,406.0 | 1,398.0 | 1,398.5 | 1,565.1 | 1,725.9 | ||||||||||
| Other liabilities |
3,889.3 | 3,169.1 | 3,185.2 | 3,244.0 | 4,415.5 | ||||||||||
| Separate account liabilities |
64,903.2 | 65,963.8 | 70,694.7 | 72,855.0 | 48,840.7 | ||||||||||
| 111,506.5 | 110,531.3 | 113,461.4 | 113,414.9 | 90,997.8 | |||||||||||
| Total equity |
5,614.7 | 5,829.9 | 6,069.7 | 5,792.2 | 3,474.8 | ||||||||||
| Total liabilities and equity |
$ | 117,121.2 | $ | 116,361.2 | $ | 119,531.1 | $ | 119,207.1 | $ | 94,472.6 | |||||
| Capital Structure | |||||||||||||||
| ($ in millions) | 2004 | 2005 | 2006 | 2007 | 2008 | ||||||||||
| Total capital, including AOCI and NCI |
$ | 7,020.7 | $ | 7,227.9 | $ | 7,468.2 | $ | 7,357.3 | $ | 5,200.7 | |||||
| Less AOCI |
432.2 | 100.7 | 31.9 | (81.5) | (1,370.8) | ||||||||||
| Less NCI |
380.7 | 442.3 | 447.0 | 467.6 | 416.6 | ||||||||||
| Total capital, excluding AOCI and NCI |
$ | 6,207.8 | $ | 6,684.9 | $ | 6,989.3 | $ | 6,971.2 | $ | 6,154.9 | |||||
| Leverage, excluding AOCI and NCI |
|||||||||||||||
| Long-term debt—to—total capital |
22.6% | 20.9% | 20.0% | 22.5% | 28.0% | ||||||||||
| Ratio of pre-tax operating earnings before interest expense to interest expense |
8.2X | 8.1X | 8.7X | 9.4X | 1.5X | ||||||||||
30
Nationwide Financial Services, Inc.
Statistical Supplement
September 30, 2009
Individual Investments
Historical Earnings Trends
| ($ in millions) | 2004 | 2005 | 2006 | 2007 | 2008 | ||||||||||
| Operating Revenues |
|||||||||||||||
| Asset fees |
$ | 435.5 | $ | 461.9 | $ | 511.4 | $ | 587.6 | $ | 525.7 | |||||
| Administrative fees |
15.7 | 16.2 | 20.4 | 27.1 | 33.7 | ||||||||||
| Surrender fees |
62.2 | 62.1 | 56.6 | 47.9 | 43.5 | ||||||||||
| Total policy charges |
513.4 | 540.2 | 588.4 | 662.6 | 602.9 | ||||||||||
| Net Investment Income |
|||||||||||||||
| General account assets |
895.3 | 895.9 | 806.3 | 671.8 | 541.2 | ||||||||||
| Charge for invested capital |
(22.5) | (26.0) | (25.2) | (28.9) | (10.8) | ||||||||||
| Total net investment income |
872.8 | 869.9 | 781.1 | 642.9 | 530.4 | ||||||||||
| Premiums |
90.8 | 102.9 | 142.5 | 133.3 | 120.2 | ||||||||||
| Operating realized gains |
- | - | - | - | 106.9 | ||||||||||
| Other income |
10.0 | 15.2 | 14.6 | 31.0 | 25.0 | ||||||||||
| Total operating revenues |
1,487.0 | 1,528.2 | 1,526.6 | 1,469.8 | 1,385.4 | ||||||||||
| Benefits |
|||||||||||||||
| Interest credited to policyholder accounts |
606.1 | 589.1 | 528.3 | 444.3 | 379.1 | ||||||||||
| Immediate annuity benefits |
76.1 | 89.2 | 126.9 | 119.6 | 114.0 | ||||||||||
| Policy benefits |
63.1 | 66.2 | 75.5 | 113.9 | 264.5 | ||||||||||
| Total benefits |
745.3 | 744.5 | 730.7 | 677.8 | 757.6 | ||||||||||
| Expenses |
|||||||||||||||
| Commissions |
288.3 | 257.5 | 340.5 | 398.1 | 339.5 | ||||||||||
| General operating expenses |
219.4 | 189.7 | 223.9 | 199.4 | 179.5 | ||||||||||
| Deferral of policy acquisition costs |
(293.6) | (250.7) | (350.8) | (398.6) | (326.5) | ||||||||||
| Subtotal |
214.1 | 196.5 | 213.6 | 198.9 | 192.5 | ||||||||||
| Amortization of policy acquisition costs |
276.1 | 329.3 | 352.7 | 287.1 | 647.7 | ||||||||||
| Amortization of VOBA and other intangible assets |
7.5 | 7.2 | 6.5 | 5.3 | 7.8 | ||||||||||
| Total expenses |
497.7 | 533.0 | 572.8 | 491.3 | 848.0 | ||||||||||
| Pre-tax operating earnings (loss) |
$ | 244.0 | $ | 250.7 | $ | 223.1 | $ | 300.7 | $ | (220.2) | |||||
| Key Ratios/Statistics |
|||||||||||||||
| Average Account Values: |
|||||||||||||||
| General account |
$ | 16,211.1 | $ | 15,966.7 | $ | 14,041.3 | $ | 11,814.2 | $ | 10,576.8 | |||||
| Separate account |
34,198.8 | 35,600.5 | 37,223.3 | 41,366.0 | 36,238.6 | ||||||||||
| Advisory services program |
99.1 | 309.3 | 508.1 | 634.9 | 443.4 | ||||||||||
| Total average individual investment account values |
$ | 50,509.0 | $ | 51,876.5 | $ | 51,772.7 | $ | 53,815.1 | $ | 47,258.8 | |||||
| Earned rate |
5.52% | 5.61% | 5.74% | 5.69% | 5.12% | ||||||||||
| Credited rate |
3.74% | 3.69% | 3.76% | 3.76% | 3.58% | ||||||||||
| Interest spread on average general account values |
1.78% | 1.92% | 1.98% | 1.93% | 1.54% | ||||||||||
| Income from mortgage loan prepayments and bond call premiums |
0.12% | 0.21% | 0.15% | 0.15% | 0.04% | ||||||||||
| Base interest spread on average general account values |
1.66% | 1.71% | 1.83% | 1.78% | 1.50% | ||||||||||
| Total asset fees to average separate account values |
1.27% | 1.30% | 1.37% | 1.42% | 1.45% | ||||||||||
| General operating expenses to average account values |
0.43% | 0.37% | 0.43% | 0.37% | 0.38% | ||||||||||
| Pre-tax operating earnings (loss) to average account values |
0.48% | 0.48% | 0.43% | 0.56% | -0.47% | ||||||||||
| Pre-tax operating earnings (loss) to operating revenues |
16.4% | 16.4% | 14.6% | 20.5% | -15.89% | ||||||||||
| Average allocated capital |
$ | 1,747.0 | $ | 1,671.0 | $ | 1,499.3 | $ | 1,420.5 | $ | 1,328.7 | |||||
| Return on average allocated capital |
10.7% | 13.5% | 12.3% | 16.7% | -8.8% | ||||||||||
Note: The results of operations of Nationwide Financial Services (Bermuda), Ltd. are reflected as discontinued operations for 2005 and 2004.
Individual Investments
Account Value Activity
| ($ in millions) | 2004 | 2005 | 2006 | 2007 | 2008 | ||||||||||
| Individual Variable Annuities |
$ | 38,835.9 | $ | 41,481.9 | $ | 40,796.0 | $ | 43,804.8 | $ | 46,121.5 | |||||
| Deposits |
4,409.2 | 3,661.2 | 5,034.9 | 5,984.7 | 4,557.8 | ||||||||||
| Withdrawals and surrenders |
(4,964.4) | (5,574.2) | (6,133.3) | (6,783.9) | (6,191.2) | ||||||||||
| Net flows |
(555.2) | (1,913.0) | (1,098.4) | (799.2) | (1,633.4) | ||||||||||
| Investment performance/interest credited to policyholder accounts |
3,681.9 | 2,922.1 | 4,742.3 | 3,739.9 | (12,782.7) | ||||||||||
| Policy charges |
(515.0) | (543.4) | (576.2) | (653.3) | (597.6) | ||||||||||
| Benefits and other |
34.3 | 9.0 | (58.9) | 29.3 | 1,846.5 | ||||||||||
| Acquisitions/(terminations), net |
- | (1,160.6) | - | - | - | ||||||||||
| Balance, end of period |
$ | 41,481.9 | $ | 40,796.0 | $ | 43,804.8 | $ | 46,121.5 | $ | 32,954.3 | |||||
| Individual Fixed Annuities |
$ | 8,630.7 | $ | 8,902.5 | $ | 8,041.8 | $ | 6,536.1 | $ | 4,717.3 | |||||
| Deposits |
672.9 | 160.9 | 178.2 | 192.3 | 621.2 | ||||||||||
| Withdrawals and surrenders |
(753.6) | (1,044.0) | (1,893.8) | (2,203.6) | (1,083.6) | ||||||||||
| Net flows |
(80.7) | (883.1) | (1,715.6) | (2,011.3) | (462.4) | ||||||||||
| Policyholder interest credited |
362.7 | 327.7 | 284.4 | 207.3 | 151.8 | ||||||||||
| Policy charges |
(9.9) | (11.4) | (10.6) | (7.3) | (3.7) | ||||||||||
| Benefits and other |
(0.3) | (4.3) | (63.9) | (7.5) | 3.9 | ||||||||||
| Acquisitions/(terminations), net |
- | (289.6) | - | - | - | ||||||||||
| Balance, end of period |
$ | 8,902.5 | $ | 8,041.8 | $ | 6,536.1 | $ | 4,717.3 | $ | 4,406.9 | |||||
| Income Products |
$ | 1,901.6 | $ | 1,978.3 | $ | 2,025.6 | $ | 2,101.0 | $ | 2,107.4 | |||||
| Advisory Services Program |
$ | 195.9 | $ | 411.5 | $ | 597.1 | $ | 647.2 | $ | 82.6 | |||||
| Total individual investment account values |
$ | 52,481.9 | $ | 51,227.6 | $ | 52,963.6 | $ | 53,587.0 | $ | 39,551.2 | |||||
31
Nationwide Financial Services, Inc.
Statistical Supplement
September 30, 2009
Individual Investments
Account Values by Product
| ($ in millions) | 2004 | 2005 | 2006 | 2007 | 2008 | ||||||||||
| Individual Variable Annuities |
|||||||||||||||
| BEST of AMERICA products |
$ | 33,573.0 | $ | 32,937.0 | $ | 36,106.8 | $ | 38,371.2 | $ | 27,934.2 | |||||
| Private label annuities |
7,350.9 | 7,398.9 | 7,319.7 | 7,438.1 | 4,860.4 | ||||||||||
| Nationwide Financial Network and other |
558.0 | 460.1 | 378.3 | 312.2 | 159.7 | ||||||||||
| Total individual variable annuities | $ | 41,481.9 | $ | 40,796.0 | $ | 43,804.8 | $ | 46,121.5 | $ | 32,954.3 | |||||
| Individual Fixed Annuities |
$ | 8,902.5 | $ | 8,041.8 | $ | 6,536.1 | $ | 4,717.3 | $ | 4,406.9 | |||||
| Income Products |
$ | 1,901.6 | $ | 1,978.3 | $ | 2,025.6 | $ | 2,101.0 | $ | 2,107.4 | |||||
| Advisory Services Program |
$ | 195.9 | $ | 411.5 | $ | 597.1 | $ | 647.2 | $ | 82.6 | |||||
| Total individual investment account values | $ | 52,481.9 | $ | 51,227.6 | $ | 52,963.6 | $ | 53,587.0 | $ | 39,551.2 | |||||
| Individual Investments New and Renewal Production Premiums and Deposits by Product
| |||||||||||||||
| ($ in millions) | 2004 | 2005 | 2006 | 2007 | 2008 | ||||||||||
| Individual Variable Annuities |
|||||||||||||||
| BEST of AMERICA products |
$ | 3,674.3 | $ | 3,135.5 | $ | 4,390.9 | $ | 5,169.0 | $ | 3,791.8 | |||||
| Private label annuities |
449.0 | 346.6 | 356.6 | 434.6 | 417.3 | ||||||||||
| Nationwide Financial Network and other |
7.0 | 4.7 | 3.6 | 2.8 | 1.9 | ||||||||||
| Total individual variable annuities | $ | 4,130.3 | $ | 3,486.8 | $ | 4,751.1 | $ | 5,606.4 | $ | 4,211.0 | |||||
| Individual Fixed Annuities |
$ | 858.8 | $ | 194.4 | $ | 186.5 | $ | 156.3 | $ | 603.0 | |||||
| Income Products |
$ | 168.4 | $ | 196.7 | $ | 230.7 | $ | 216.7 | $ | 198.3 | |||||
| Advisory Services Program |
$ | 181.0 | $ | 231.3 | $ | 222.8 | $ | 147.2 | $ | 54.0 | |||||
| Total new and renewal production premiums and deposits | $ | 5,338.5 | $ | 4,109.2 | $ | 5,391.1 | $ | 6,126.6 | $ | 5,066.3 | |||||
| Individual Investments New and Renewal Production Premiums and Deposits by Channel
| |||||||||||||||
| ($ in millions) | 2004 | 2005 | 2006 | 2007 | 2008 | ||||||||||
| Individual Variable Annuities |
|||||||||||||||
| Non-affiliated |
|||||||||||||||
| Independent broker/dealers |
$ | 1,534.6 | $ | 1,304.3 | $ | 1,606.5 | $ | 1,843.9 | $ | 1,437.1 | |||||
| Wirehouse and regional firms |
991.6 | 821.9 | 1,171.8 | 1,558.0 | 1,156.6 | ||||||||||
| Financial institutions |
1,270.8 | 1,031.5 | 1,558.8 | 1,788.4 | 1,341.9 | ||||||||||
| Life specialists |
2.3 | 0.3 | 0.8 | 0.1 | - | ||||||||||
| Affiliated |
|||||||||||||||
| Nationwide Financial Network |
331.0 | 328.8 | 413.2 | 416.0 | 275.4 | ||||||||||
| Total individual variable annuities | $ | 4,130.3 | $ | 3,486.8 | $ | 4,751.1 | $ | 5,606.4 | $ | 4,211.0 | |||||
| Individual Fixed Annuities |
|||||||||||||||
| Non-affiliated |
|||||||||||||||
| Independent broker/dealers |
$ | 17.1 | $ | 7.0 | $ | 13.4 | $ | 20.7 | $ | 74.7 | |||||
| Wirehouse and regional firms |
20.6 | 8.2 | 9.8 | 10.9 | 51.4 | ||||||||||
| Financial institutions |
774.3 | 129.4 | 72.4 | 55.0 | 369.9 | ||||||||||
| Affiliated |
|||||||||||||||
| Nationwide Financial Network |
46.8 | 49.8 | 90.9 | 69.7 | 107.0 | ||||||||||
| Total individual fixed annuities | $ | 858.8 | $ | 194.4 | $ | 186.5 | $ | 156.3 | $ | 603.0 | |||||
| Income Products |
|||||||||||||||
| Non-affiliated |
|||||||||||||||
| Independent broker/dealers |
$ | 70.8 | $ | 76.9 | $ | 98.1 | $ | 101.8 | $ | 91.2 | |||||
| Wirehouse and regional firms |
52.2 | 63.4 | 84.7 | 68.4 | 64.9 | ||||||||||
| Financial institutions |
23.4 | 29.2 | 30.7 | 30.3 | 27.0 | ||||||||||
| Affiliated |
|||||||||||||||
| Nationwide Financial Network |
22.0 | 27.2 | 17.2 | 16.2 | 15.2 | ||||||||||
| Total income products | $ | 168.4 | $ | 196.7 | $ | 230.7 | $ | 216.7 | $ | 198.3 | |||||
| Advisory Services Program |
|||||||||||||||
| Non-affiliated |
|||||||||||||||
| Independent broker/dealers |
$ | 160.0 | $ | 205.3 | $ | 180.5 | $ | 98.6 | $ | 39.6 | |||||
| Financial institutions |
8.9 | 8.1 | 15.5 | 11.6 | 4.2 | ||||||||||
| Affiliated |
|||||||||||||||
| Nationwide Financial Network |
12.1 | 17.9 | 26.8 | 37.0 | 10.2 | ||||||||||
| Total advisory services program |
$ | 181.0 | $ | 231.3 | $ | 222.8 | $ | 147.2 | $ | 54.0 | |||||
| Total new and renewal production premiums and deposits |
$ | 5,338.5 | $ | 4,109.2 | $ | 5,391.1 | $ | 6,126.6 | $ | 5,066.3 | |||||
32
Nationwide Financial Services, Inc.
Statistical Supplement
September 30, 2009
Individual Variable Annuity Deferred Acquisition Costs
($ in millions)
33
Nationwide Financial Services, Inc.
Statistical Supplement
September 30, 2009
This Page Intentionally Left Blank.
34
Nationwide Financial Services, Inc.
Statistical Supplement
September 30, 2009
Retirement Plans
Historical Earnings Trends
| ($ in millions) | 2004 | 2005 | 2006 | 2007 | 2008 | ||||||||||
| Operating Revenues |
|||||||||||||||
| Asset fees |
$ | 150.8 | $ | 137.8 | $ | 134.0 | $ | 132.5 | $ | 103.6 | |||||
| Administrative fees |
8.9 | 8.7 | 36.0 | 11.8 | 14.5 | ||||||||||
| Surrender fees |
12.1 | 8.2 | 4.5 | 3.0 | 1.8 | ||||||||||
| Total policy charges | 171.8 | 154.7 | 174.5 | 147.3 | 119.9 | ||||||||||
| Net investment income |
647.6 | 661.4 | 652.2 | 655.2 | 650.8 | ||||||||||
| Other income |
163.1 | 229.1 | 288.9 | 343.7 | 320.6 | ||||||||||
| Total operating revenues | 982.5 | 1,045.2 | 1,115.6 | 1,146.2 | 1,091.3 | ||||||||||
| Benefits |
|||||||||||||||
| Interest credited to policyholder accounts |
446.1 | 455.0 | 451.6 | 443.3 | 435.9 | ||||||||||
| Total benefits | 446.1 | 455.0 | 451.6 | 443.3 | 435.9 | ||||||||||
| Expenses |
|||||||||||||||
| Commissions |
111.3 | 133.3 | 151.6 | 171.0 | 157.0 | ||||||||||
| General operating expenses |
238.6 | 251.7 | 282.3 | 285.3 | 288.5 | ||||||||||
| Deferral of policy acquisition costs |
(41.5) | (37.2) | (36.8) | (36.1) | (34.5) | ||||||||||
| Subtotal | 308.4 | 347.8 | 397.1 | 420.2 | 411.0 | ||||||||||
| Amortization of policy acquisition costs |
39.9 | 47.4 | 38.3 | 27.4 | 40.6 | ||||||||||
| Amortization of VOBA and other intangible assets |
4.8 | 3.7 | 7.4 | 2.7 | 1.6 | ||||||||||
| Total expenses | 353.1 | 398.9 | 442.8 | 450.3 | 453.2 | ||||||||||
| Pre-tax operating earnings | $ | 183.3 | $ | 191.3 | $ | 221.2 | $ | 252.6 | $ | 202.2 | |||||
| Key Ratios/Statistics |
|||||||||||||||
| Average Account Values: |
|||||||||||||||
| General account |
$ | 10,175.6 | $ | 10,881.2 | $ | 11,093.0 | $ | 11,135.3 | $ | 11,202.4 | |||||
| Separate account |
20,287.9 | 19,792.0 | 18,512.4 | 17,723.6 | 13,993.9 | ||||||||||
| Non insurance assets |
8,315.6 | 12,500.3 | 16,515.0 | 20,747.9 | 19,759.9 | ||||||||||
| Administration only |
21,995.8 | 24,289.9 | 25,904.7 | 29,844.5 | 28,652.1 | ||||||||||
| Total average retirement plan account values | $ | 60,774.9 | $ | 67,463.4 | $ | 72,025.1 | $ | 79,451.3 | $ | 73,608.3 | |||||
| Earned rate |
6.36% | 6.08% | 5.88% | 5.88% | 5.81% | ||||||||||
| Credited rate |
4.38% | 4.18% | 4.07% | 3.98% | 3.89% | ||||||||||
| Interest spread on average general account values | 1.98% | 1.90% | 1.81% | 1.90% | 1.92% | ||||||||||
| Income from mortgage loan prepayments and bond call premiums |
0.18% | 0.20% | 0.09% | 0.11% | 0.07% | ||||||||||
| Base interest spread on average general account values | 1.80% | 1.70% | 1.72% | 1.79% | 1.85% | ||||||||||
| Total asset fees to average separate account values |
0.74% | 0.70% | 0.72% | 0.75% | 0.74% | ||||||||||
| General operating expenses to average account values |
0.39% | 0.37% | 0.39% | 0.36% | 0.39% | ||||||||||
| Pre-tax operating earnings to average account values |
0.30% | 0.28% | 0.31% | 0.32% | 0.27% | ||||||||||
| Pre-tax operating earnings to operating revenues |
18.7% | 18.3% | 19.8% | 22.0% | 18.5% | ||||||||||
| Average allocated capital |
$ | 724.4 | $ | 773.9 | $ | 815.1 | $ | 770.4 | $ | 763.3 | |||||
| Return on average allocated capital |
18.9% | 20.7% | 19.8% | 23.4% | 18.4% | ||||||||||
| Note: The results of operations of The 401(k) Company are reflected as discontinued operations for 2007 and all prior years. | |||||||||||||||
| Retirement Plans Account Value Activity
| |||||||||||||||
| ($ in millions) | 2004 | 2005 | 2006 | 2007 | 2008 | ||||||||||
| Private Sector Pension Plans |
|||||||||||||||
| Balance, beginning of period |
$ | 22,789.2 | $ | 26,503.1 | $ | 29,758.8 | $ | 32,645.3 | $ | 32,286.5 | |||||
| New deposits/other |
5,619.9 | 6,104.9 | 6,203.8 | 6,629.9 | 6,000.8 | ||||||||||
| Participant withdrawals and surrenders |
(4,308.0) | (4,721.0) | (5,266.4) | (5,803.0) | (5,380.2) | ||||||||||
| Net flows | 1,311.9 | 1,383.9 | 937.4 | 826.9 | 620.6 | ||||||||||
| Investment performance/interest credited to policyholder accounts |
2,596.3 | 2,083.3 | 3,654.9 | 2,497.5 | (8,961.6) | ||||||||||
| Policy charges and other |
(194.3) | (211.5) | (226.9) | (265.5) | (227.1) | ||||||||||
| Net, case acquisitions/(terminations) |
- | - | (1,478.9) | (3,417.7) | (71.2) | ||||||||||
| Balance, end of period |
$ | 26,503.1 | $ | 29,758.8 | $ | 32,645.3 | $ | 32,286.5 | $ | 23,647.2 | |||||
| Public Sector Pension Plans |
|||||||||||||||
| Balance, beginning of period |
$ | 34,545.4 | $ | 38,925.2 | $ | 40,092.0 | $ | 43,951.8 | $ | 48,260.1 | |||||
| New deposits/other |
3,637.1 | 3,881.6 | 4,018.4 | 4,268.1 | 4,480.0 | ||||||||||
| Participant withdrawals and surrenders |
(2,242.5) | (2,638.9) | (2,412.8) | (3,057.8) | (3,256.5) | ||||||||||
| Net flows | 1,394.6 | 1,242.7 | 1,605.6 | 1,210.3 | 1,223.5 | ||||||||||
| Investment performance/interest credited |
2,869.6 | 2,577.1 | 3,802.9 | 3,648.4 | (10,057.8) | ||||||||||
| Policy charges and other |
(65.8) | (69.4) | (94.8) | (82.3) | (70.4) | ||||||||||
| Net, case acquisitions/(terminations) |
181.4 | (2,583.6) | (1,453.9) | (468.1) | (204.5) | ||||||||||
| Balance, end of period |
$ | 38,925.2 | $ | 40,092.0 | $ | 43,951.8 | $ | 48,260.1 | $ | 39,150.9 | |||||
| Total retirement plan account values | $ | 65,428.3 | $ | 69,850.8 | $ | 76,597.1 | $ | 80,546.6 | $ | 62,798.1 | |||||
35
Nationwide Financial Services, Inc.
Statistical Supplement
September 30, 2009
Retirement Plans
Account Values by Product
| ($ in millions) | 2004 | 2005 | 2006 | 2007 | 2008 | ||||||||||
| Private Sector Pension Plans |
|||||||||||||||
| BEST of AMERICA annuity products |
$ | 8,845.8 | $ | 7,791.9 | $ | 7,557.1 | $ | 7,178.6 | $ | 4,543.5 | |||||
| BEST of AMERICA trust products |
10,558.4 | 14,479.5 | 18,834.1 | 21,814.6 | 15,920.8 | ||||||||||
| Subtotal BEST of AMERICA |
19,404.2 | 22,271.4 | 26,391.2 | 28,993.2 | 20,464.3 | ||||||||||
| Nationwide Financial Network products |
1,483.7 | 1,378.4 | 1,268.2 | 1,014.5 | 778.5 | ||||||||||
| Nationwide employee and agent benefit plans |
4,985.3 | 5,504.2 | 4,435.6 | 1,795.4 | 1,954.4 | ||||||||||
| Other |
629.9 | 604.8 | 550.3 | 483.4 | 450.0 | ||||||||||
| Total private sector pension plans |
$ | 26,503.1 | $ | 29,758.8 | $ | 32,645.3 | $ | 32,286.5 | $ | 23,647.2 | |||||
| Public Sector Pension Plans |
|||||||||||||||
| IRC Section 457 annuities |
$ | 14,889.2 | $ | 15,790.2 | $ | 15,979.5 | $ | 17,096.3 | $ | 14,396.6 | |||||
| Administration only agreements |
24,036.0 | 24,301.8 | 27,972.3 | 31,163.8 | 24,754.3 | ||||||||||
| Total public sector pension plans |
$ | 38,925.2 | $ | 40,092.0 | $ | 43,951.8 | $ | 48,260.1 | $ | 39,150.9 | |||||
| Total retirement plan account values |
$ | 65,428.3 | $ | 69,850.8 | $ | 76,597.1 | $ | 80,546.6 | $ | 62,798.1 | |||||
| Retirement Plans New and Renewal Production Premiums and Deposits by Product | |||||||||||||||
| ($ in millions) | 2004 | 2005 | 2006 | 2007 | 2008 | ||||||||||
| Private Sector Pension Plans |
|||||||||||||||
| BEST of AMERICA annuity products |
$ | 1,679.7 | $ | 1,371.1 | $ | 1,230.2 | $ | 1,064.7 | $ | 863.0 | |||||
| BEST of AMERICA trust products |
3,232.0 | 3,974.9 | 4,504.0 | 5,126.3 | 4,710.6 | ||||||||||
| Subtotal BEST of AMERICA |
4,911.7 | 5,346.0 | 5,734.2 | 6,191.0 | 5,573.6 | ||||||||||
| Nationwide Financial Network products |
335.8 | 205.9 | 188.2 | 149.4 | 176.7 | ||||||||||
| Other |
28.1 | 75.8 | 69.4 | 82.7 | 111.1 | ||||||||||
| Total private sector pension plans |
$ | 5,275.6 | $ | 5,627.7 | $ | 5,991.8 | $ | 6,423.1 | $ | 5,861.4 | |||||
| Public Sector Pension Plans |
|||||||||||||||
| IRC Section 457 annuities |
$ | 1,514.2 | $ | 1,544.8 | $ | 1,533.3 | $ | 1,548.5 | $ | 1,771.8 | |||||
| Administration only agreements |
2,122.9 | 2,336.9 | 2,484.9 | 2,719.6 | 2,706.7 | ||||||||||
| Total public sector pension plans |
$ | 3,637.1 | $ | 3,881.7 | $ | 4,018.2 | $ | 4,268.1 | $ | 4,478.5 | |||||
| Total new and renewal production premiums and deposits |
$ | 8,912.7 | $ | 9,509.4 | $ | 10,010.0 | $ | 10,691.2 | $ | 10,339.9 | |||||
| Retirement Plans New and Renewal Production Premiums and Deposits by Channel | |||||||||||||||
| ($ in millions) | 2004 | 2005 | 2006 | 2007 | 2008 | ||||||||||
| Private Sector Pension Plans |
|||||||||||||||
| Non-affiliated |
|||||||||||||||
| Independent broker/dealers |
$ | 3,154.4 | $ | 3,412.0 | $ | 3,594.0 | $ | 4,011.0 | $ | 3,611.6 | |||||
| Wirehouse and regional firms |
863.7 | 953.7 | 1,104.7 | 1,162.0 | 1,055.4 | ||||||||||
| Financial institutions |
493.3 | 551.2 | 559.8 | 546.9 | 578.6 | ||||||||||
| Pension plan administrators |
476.1 | 469.0 | 532.8 | 507.7 | 459.1 | ||||||||||
| Affiliated |
|||||||||||||||
| Nationwide Retirement Solutions |
28.8 | 33.0 | 32.0 | 31.8 | 31.4 | ||||||||||
| Nationwide Financial Network |
259.3 | 208.8 | 168.5 | 163.7 | 125.3 | ||||||||||
| Total private sector pension plans |
$ | 5,275.6 | $ | 5,627.7 | $ | 5,991.8 | $ | 6,423.1 | $ | 5,861.4 | |||||
| Public Sector Pension Plans |
|||||||||||||||
| Nationwide Retirement Solutions
|
$
|
3,637.1
|
$
|
3,881.7
|
$
|
4,018.2
|
$
|
4,268.1
|
$
|
4,478.5
| |||||
| Total new and renewal production premiums and deposits |
$ | 8,912.7 | $ | 9,509.4 | $ | 10,010.0 | $ | 10,691.2 | $ | 10,339.9 | |||||
36
Nationwide Financial Services, Inc.
Statistical Supplement
September 30, 2009
Individual Protection
Historical Earnings Trends
| ($ in millions) | 2004 | 2005 | 2006 | 2007 | 2008 | ||||||||||
| Operating Revenues |
|||||||||||||||
| Asset fees |
$ | 34.4 | $ | 40.2 | $ | 45.8 | $ | 53.1 | $ | 47.8 | |||||
| Cost of insurance charges |
379.7 | 388.5 | 402.0 | 420.5 | 449.7 | ||||||||||
| Administrative fees |
93.3 | 90.0 | 82.7 | 80.5 | 92.2 | ||||||||||
| Surrender fees |
30.0 | 27.9 | 22.6 | 19.9 | 28.0 | ||||||||||
| Total policy charges | 537.4 | 546.6 | 553.1 | 574.0 | 617.7 | ||||||||||
| Net Investment Income |
|||||||||||||||
| General account assets |
487.2 | 492.7 | 484.5 | 489.4 | 499.7 | ||||||||||
| Charge for invested capital |
(19.3) | (17.6) | (16.4) | (17.1) | (12.9) | ||||||||||
| Total net investment income | 467.9 | 475.1 | 468.1 | 472.3 | 486.8 | ||||||||||
| Premiums |
311.9 | 297.0 | 299.0 | 299.4 | 297.5 | ||||||||||
| Other income |
1.0 | 2.4 | 0.8 | 4.0 | 3.2 | ||||||||||
| Total operating revenues | 1,318.2 | 1,321.1 | 1,321.0 | 1,349.7 | 1,405.2 | ||||||||||
| Benefits |
|||||||||||||||
| Interest credited to policyholder accounts |
189.4 | 190.7 | 191.7 | 192.0 | 196.1 | ||||||||||
| Life benefits |
409.4 | 419.5 | 444.4 | 449.4 | 508.7 | ||||||||||
| Policyholder dividends |
101.4 | 107.3 | 90.7 | 83.1 | 93.1 | ||||||||||
| Total benefits | 700.2 | 717.5 | 726.8 | 724.5 | 797.9 | ||||||||||
| Expenses |
|||||||||||||||
| Commissions |
148.9 | 140.2 | 137.8 | 140.8 | 162.6 | ||||||||||
| General operating expenses |
269.7 | 260.4 | 261.0 | 247.7 | 262.8 | ||||||||||
| Deferral of policy acquisition costs |
(204.1) | (201.1) | (200.8) | (196.6) | (226.6) | ||||||||||
| Subtotal | 214.5 | 199.5 | 198.0 | 191.9 | 198.8 | ||||||||||
| Amortization of policy acquisition costs |
114.4 | 102.7 | 81.6 | 93.1 | 129.9 | ||||||||||
| Amortization of VOBA and other intangible assets |
41.8 | 35.3 | 33.8 | 40.4 | 22.1 | ||||||||||
| Total expenses | 370.7 | 337.5 | 313.4 | 325.4 | 350.8 | ||||||||||
| Pre-tax operating earnings | $ | 247.3 | $ | 266.1 | $ | 280.8 | $ | 299.8 | $ | 256.5 | |||||
| Key Ratios/Statistics |
|||||||||||||||
| General operating expenses to operating revenues |
20.5% | 19.7% | 19.8% | 18.4% | 18.7% | ||||||||||
| Pre-tax operating earnings to operating revenues |
18.8% | 20.1% | 21.3% | 22.2% | 18.3% | ||||||||||
| Average allocated capital |
$ | 1,731.1 | $ | 1,788.9 | $ | 1,849.2 | $ | 1,965.2 | $ | 2,036.9 | |||||
| Return on average allocated capital |
9.7% | 10.5% | 10.5% | 10.6% | 8.6% | ||||||||||
| Note: The results of operations of TBG Financial are reflected as discontinued for 2008 and all prior years. In addition, the results of operations of Nationwide Financial Services (Bermuda), Ltd. and William J. Lynch & Associates, Inc. are reflected as discontinued for 2005 and 2004. | |||||||||||||||
| Individual Protection Policy Reserves
| |||||||||||||||
| ($ in millions) | 2004 | 2005 | 2006 | 2007 | 2008 | ||||||||||
| Individual investment life |
$ | 4,962.1 | $ | 5,329.5 | $ | 5,842.5 | $ | 6,298.2 | $ | 4,159.4 | |||||
| Corporate investment life - excluding experience rated BOLI |
5,063.0 | 5,613.8 | 6,600.9 | 7,192.9 | 7,472.7 | ||||||||||
| Corporate investment life - experience rated BOLI |
381.1 | 1,130.8 | 1,913.5 | 2,085.9 | 1,076.2 | ||||||||||
| Subtotal investment life | 10,406.2 | 12,074.1 | 14,356.9 | 15,577.0 | 12,708.3 | ||||||||||
| Traditional life |
4,278.9 | 4,225.2 | 4,170.9 | 4,156.4 | 4,154.8 | ||||||||||
| Universal life |
997.9 | 1,089.3 | 1,159.0 | 1,257.1 | 1,386.9 | ||||||||||
| Subtotal fixed life | 5,276.8 | 5,314.5 | 5,329.9 | 5,413.5 | 5,541.7 | ||||||||||
| Total individual protection policy reserves | $ | 15,683.0 | $ | 17,388.6 | $ | 19,686.8 | $ | 20,990.5 | $ | 18,250.0 | |||||
| Individual Protection Insurance In Force
| |||||||||||||||
| ($ in millions) | 2004 | 2005 | 2006 | 2007 | 2008 | ||||||||||
| Individual investment life |
$ | 56,836.7 | $ | 57,021.7 | $ | 57,536.7 | $ | 57,772.0 | $ | 55,352.8 | |||||
| Corporate investment life - excluding experience rated BOLI |
9,774.3 | 10,305.0 | 11,451.7 | 11,980.3 | 11,347.5 | ||||||||||
| Corporate investment life - experience rated BOLI |
1,129.8 | 13,330.5 | 13,312.7 | 13,311.2 | 13,259.3 | ||||||||||
| Subtotal investment life | 67,740.8 | 80,657.2 | 82,301.1 | 83,063.5 | 79,959.6 | ||||||||||
| Traditional life |
32,979.4 | 36,589.3 | 41,061.3 | 43,970.7 | 53,685.7 | ||||||||||
| Universal life |
8,505.5 | 9,114.6 | 9,950.3 | 10,484.5 | 11,714.8 | ||||||||||
| Subtotal fixed life | 41,484.9 | 45,703.9 | 51,011.6 | 54,455.2 | 65,400.5 | ||||||||||
| Total individual protection insurance in force | $ | 109,225.7 | $ | 126,361.1 | $ | 133,312.7 | $ | 137,518.7 | $ | 145,360.1 | |||||
37
Nationwide Financial Services, Inc.
Statistical Supplement
September 30, 2009
Individual Protection
New and Renewal Production Premiums and Deposits by Product
| ($ in millions) | 2004 | 2005 | 2006 | 2007 | 2008 | ||||||||||
| BEST of AMERICA Variable Life Series |
|||||||||||||||
| First year production premiums and deposits |
$ | 131.7 | $ | 121.9 | $ | 138.0 | $ | 141.9 | $ | 107.1 | |||||
| Renewal production premiums and deposits |
307.9 | 304.1 | 299.3 | 307.0 | 285.0 | ||||||||||
| Total BEST of AMERICA variable life series |
439.6 | 426.0 | 437.3 | 448.9 | 392.1 | ||||||||||
| Nationwide Financial Network Variable Life Products |
|||||||||||||||
| First year production premiums and deposits |
32.0 | 24.0 | 21.0 | 6.7 | 6.1 | ||||||||||
| Renewal production premiums and deposits |
223.8 | 205.0 | 180.7 | 183.7 | 155.7 | ||||||||||
| Total Nationwide Financial Network variable life products |
255.8 | 229.0 | 201.7 | 190.4 | 161.8 | ||||||||||
| Corporate Owned Life Insurance (COLI) |
|||||||||||||||
| First year production premiums and deposits |
157.0 | 227.8 | 396.6 | 181.9 | 211.1 | ||||||||||
| Renewal production premiums and deposits |
407.5 | 429.7 | 409.3 | 370.8 | 334.0 | ||||||||||
| Total COLI |
564.5 | 657.5 | 805.9 | 552.7 | 545.1 | ||||||||||
| Traditional/Universal life |
|||||||||||||||
| First year production premiums and deposits |
114.6 | 111.4 | 102.6 | 120.9 | 160.5 | ||||||||||
| Renewal production premiums and deposits |
392.3 | 401.3 | 414.5 | 433.5 | 447.2 | ||||||||||
| Total traditional/universal life |
506.9 | 512.7 | 517.1 | 554.4 | 607.7 | ||||||||||
| Total new and renewal production premiums and deposits |
$ | 1,766.8 | $ | 1,825.2 | $ | 1,962.0 | $ | 1,746.4 | $ | 1,706.7 | |||||
|
Individual Protection New and Renewal Production Premiums and Deposits by Channel
| |||||||||||||||
| ($ in millions) | 2004 | 2005 | 2006 | 2007 | 2008 | ||||||||||
| Non-affiliated |
|||||||||||||||
| Independent broker/dealers |
$ | 286.3 | $ | 260.5 | $ | 265.7 | $ | 278.7 | $ | 302.1 | |||||
| Wirehouse and regional firms |
64.0 | 65.3 | 62.6 | 79.7 | 71.1 | ||||||||||
| Financial institutions |
47.8 | 58.6 | 57.9 | 69.0 | 64.0 | ||||||||||
| Life specialists |
380.5 | 382.1 | 579.8 | 329.5 | 353.6 | ||||||||||
| Affiliated |
|||||||||||||||
| Nationwide Financial Network |
804.0 | 783.3 | 769.9 | 766.3 | 724.4 | ||||||||||
| Mullin TBG |
184.2 | 275.4 | 226.1 | 223.2 | 191.5 | ||||||||||
| Total new and renewal production premiums and deposits |
$ | 1,766.8 | $ | 1,825.2 | $ | 1,962.0 | $ | 1,746.4 | $ | 1,706.7 | |||||
38
Nationwide Financial Services, Inc.
Statistical Supplement
September 30, 2009
Investment Life
Historical Earnings Trends
| ($ in millions) | 2004 | 2005 | 2006 | 2007 | 2008 | ||||||||||
| Operating Revenues |
|||||||||||||||
| Asset fees |
$ | 34.4 | $ | 40.2 | $ | 45.8 | $ | 53.1 | $ | 47.8 | |||||
| Cost of insurance charges |
334.9 | 339.0 | 344.3 | 353.1 | 363.4 | ||||||||||
| Administrative fees |
79.4 | 75.7 | 67.7 | 58.3 | 58.5 | ||||||||||
| Surrender fees |
29.2 | 26.3 | 20.2 | 17.3 | 24.3 | ||||||||||
| Total policy charges |
477.9 | 481.2 | 478.0 | 481.8 | 494.0 | ||||||||||
| Net Investment Income |
|||||||||||||||
| General account assets |
150.2 | 157.2 | 150.8 | 152.4 | 153.3 | ||||||||||
| Charge for invested capital |
(19.3) | (17.6) | (16.4) | (17.1) | (12.9) | ||||||||||
| Total net investment income |
130.9 | 139.6 | 134.4 | 135.3 | 140.4 | ||||||||||
| Other income |
1.0 | 2.4 | 0.8 | 4.0 | 3.2 | ||||||||||
| Total operating revenues |
609.8 | 623.2 | 613.2 | 621.1 | 637.6 | ||||||||||
| Benefits |
|||||||||||||||
| Interest credited to policyholder accounts |
117.0 | 116.3 | 112.4 | 113.5 | 113.2 | ||||||||||
| Life benefits |
128.1 | 128.4 | 141.8 | 144.3 | 176.3 | ||||||||||
| Total benefits |
245.1 | 244.7 | 254.2 | 257.8 | 289.5 | ||||||||||
| Expenses |
|||||||||||||||
| Commissions |
106.4 | 105.5 | 97.4 | 94.4 | 88.7 | ||||||||||
| General operating expenses |
148.7 | 132.8 | 133.8 | 126.4 | 145.0 | ||||||||||
| Deferral of policy acquisition costs |
(149.1) | (142.8) | (133.1) | (130.4) | (128.8) | ||||||||||
| Subtotal |
106.0 | 95.5 | 98.1 | 90.4 | 104.9 | ||||||||||
| Amortization of policy acquisition costs |
85.1 | 85.7 | 80.2 | 57.2 | 86.5 | ||||||||||
| Amortization of VOBA and other intangible assets |
24.2 | 26.2 | 24.7 | 31.4 | 11.6 | ||||||||||
| Total expenses |
215.3 | 207.4 | 203.0 | 179.0 | 203.0 | ||||||||||
| Pre-tax operating earnings |
$ | 149.4 | $ | 171.1 | $ | 156.0 | $ | 184.3 | $ | 145.1 | |||||
| Key Ratios/Statistics |
|||||||||||||||
| Cost of insurance per $1,000 of average net amount at risk (1) |
$ | 5.88 | $ | 6.01 | $ | 6.10 | $ | 6.27 | $ | 6.48 | |||||
| Life benefits per $1,000 of average net amount at risk (1) |
$ | 2.25 | $ | 2.28 | $ | 2.51 | $ | 2.56 | $ | 3.14 | |||||
| General operating expenses to operating revenues |
24.4% | 21.3% | 21.8% | 20.4% | 22.7% | ||||||||||
| Pre-tax operating earnings to operating revenues |
24.5% | 27.5% | 25.4% | 29.7% | 22.8% | ||||||||||
| Average allocated capital |
$ | 1,191.5 | $ | 1,246.1 | $ | 1,273.2 | $ | 1,303.2 | $ | 1,291.6 | |||||
| Return on average allocated capital |
8.8% | 10.2% | 8.9% | 10.3% | 8.0% | ||||||||||
| (1) Excludes experience rated BOLI corporate investment life.
Note: The results of operations of TBG Financial are reflected as discontinued for 2008 and all prior years. In addition, the results of operations of Nationwide Financial Services (Bermuda), Ltd. and William J. Lynch & Associates, Inc. are reflected as discontinued for 2005 and 2004. | |||||||||||||||
| Investment Life Policy Reserve Activity | |||||||||||||||
| ($ in millions) | 2004 | 2005 | 2006 | 2007 | 2008 | ||||||||||
| Balance, beginning of period |
$ | 8,845.3 | $ | 10,406.2 | $ | 12,074.1 | $ | 14,356.9 | $ | 15,577.0 | |||||
| Deposits |
1,642.7 | 2,153.8 | 2,208.6 | 1,265.6 | 1,187.7 | ||||||||||
| Withdrawals and surrenders |
(467.4) | (780.8) | (576.7) | (639.7) | (548.5) | ||||||||||
| Net flows |
1,175.3 | 1,373.0 | 1,631.9 | 625.9 | 639.2 | ||||||||||
| Investment performance/interest credited to policyholder accounts |
842.8 | 731.6 | 1,290.5 | 1,064.1 | (4,482.9) | ||||||||||
| Policy charges |
(478.0) | (481.4) | (477.9) | (481.1) | (495.2) | ||||||||||
| Benefits and other |
20.8 | 46.2 | (161.7) | 11.2 | 1,470.2 | ||||||||||
| Acquired business |
- | (1.5) | - | - | - | ||||||||||
| Balance, end of period |
$ | 10,406.2 | $ | 12,074.1 | $ | 14,356.9 | $ | 15,577.0 | $ | 12,708.3 | |||||
39
Nationwide Financial Services, Inc.
Statistical Supplement
September 30, 2009
Fixed Life
Historical Earnings Trends
| ($ in millions) | 2004 | 2005 | 2006 | 2007 | 2008 | |||||||||||||||
| Operating Revenues |
||||||||||||||||||||
| Cost of insurance charges |
$ | 44.8 | $ | 49.5 | $ | 57.7 | $ | 67.4 | $ | 86.3 | ||||||||||
| Administrative fees |
13.9 | 14.3 | 15.0 | 22.2 | 33.7 | |||||||||||||||
| Surrender fees |
0.8 | 1.6 | 2.4 | 2.6 | 3.7 | |||||||||||||||
| Total policy charges | 59.5 | 65.4 | 75.1 | 92.2 | 123.7 | |||||||||||||||
| Net investment income |
337.0 | 335.5 | 333.7 | 337.0 | 346.4 | |||||||||||||||
| Premiums |
311.9 | 297.0 | 299.0 | 299.4 | 297.5 | |||||||||||||||
| Total operating revenues | 708.4 | 697.9 | 707.8 | 728.6 | 767.6 | |||||||||||||||
| Benefits |
||||||||||||||||||||
| Interest credited to policyholder accounts |
72.4 | 74.4 | 79.3 | 78.5 | 82.9 | |||||||||||||||
| Life benefits |
281.3 | 291.1 | 302.6 | 305.1 | 332.4 | |||||||||||||||
| Policyholder dividends |
101.4 | 107.3 | 90.7 | 83.1 | 93.1 | |||||||||||||||
| Total benefits | 455.1 | 472.8 | 472.6 | 466.7 | 508.4 | |||||||||||||||
| Expenses |
||||||||||||||||||||
| Commissions |
42.5 | 34.7 | 40.4 | 46.4 | 73.9 | |||||||||||||||
| General operating expenses |
121.0 | 127.6 | 127.2 | 121.3 | 117.8 | |||||||||||||||
| Deferral of policy acquisition costs |
(55.0 | ) | (58.3 | ) | (67.7 | ) | (66.2 | ) | (97.8 | ) | ||||||||||
| Subtotal | 108.5 | 104.0 | 99.9 | 101.5 | 93.9 | |||||||||||||||
| Amortization of policy acquisition costs |
29.3 | 17.0 | 1.4 | 35.9 | 43.4 | |||||||||||||||
| Amortization of VOBA and other intangible assets |
17.6 | 9.1 | 9.1 | 9.0 | 10.5 | |||||||||||||||
| Total expenses | 155.4 | 130.1 | 110.4 | 146.4 | 147.8 | |||||||||||||||
| Pre-tax operating earnings | $ | 97.9 | $ | 95.0 | $ | 124.8 | $ | 115.5 | $ | 111.4 | ||||||||||
| Key Ratios/Statistics |
||||||||||||||||||||
| Life benefits per $1,000 of average life insurance in force |
$ | 6.77 | $ | 6.70 | $ | 6.25 | $ | 5.87 | $ | 5.64 | ||||||||||
| General operating expenses to operating revenues |
17.1% | 18.3% | 18.0% | 16.6% | 15.3% | |||||||||||||||
| Pre-tax operating earnings to operating revenues |
13.8% | 13.6% | 17.6% | 15.9% | 14.5% | |||||||||||||||
| Average allocated capital |
$ | 539.6 | $ | 542.9 | $ | 576.1 | $ | 662.0 | $ | 745.2 | ||||||||||
| Return on average allocated capital |
11.8% | 11.4% | 14.1% | 11.3% | 9.7% | |||||||||||||||
| Fixed Life | ||||||||||||||||||||
| Policy Reserve Activity
|
| |||||||||||||||||||
| ($ in millions) | 2004 | 2005 | 2006 | 2007 | 2008 | |||||||||||||||
| Traditional/Universal Life |
||||||||||||||||||||
| Balance, beginning of period |
$ | 5,051.8 | $ | 5,276.8 | $ | 5,314.5 | $ | 5,329.9 | $ | 5,413.5 | ||||||||||
| Deposits |
457.6 | 448.6 | 455.9 | 492.9 | 529.6 | |||||||||||||||
| Withdrawals and surrenders |
(196.9 | ) | (214.0 | ) | (214.5 | ) | (236.9 | ) | (239.7 | ) | ||||||||||
| Net flows | 260.7 | 234.6 | 241.4 | 256.0 | 289.9 | |||||||||||||||
| Interest credited to policyholder accounts |
72.4 | 74.4 | 83.9 | 80.7 | 83.5 | |||||||||||||||
| Policy charges |
(59.5 | ) | (65.4 | ) | (74.8 | ) | (93.4 | ) | (124.7 | ) | ||||||||||
| Benefits and other |
(48.6 | ) | (205.9 | ) | (235.1 | ) | (159.7 | ) | (120.5 | ) | ||||||||||
| Balance, end of period |
$ | 5,276.8 | $ | 5,314.5 | $ | 5,329.9 | $ | 5,413.5 | $ | 5,541.7 | ||||||||||
40
Nationwide Financial Services, Inc.
Statistical Supplement
September 30, 2009
This Page Intentionally Left Blank.
41
Nationwide Financial Services, Inc.
Statistical Supplement
September 30, 2009
Corporate and Other
Historical Earnings Trends
| ($ in millions) | 2004 | 2005 | 2006 | 2007 | 2008 | ||||||||||
| Operating Revenues |
|||||||||||||||
| Net investment income |
|||||||||||||||
| General account assets |
$ | 247.6 | $ | 337.8 | $ | 400.2 | $ | 507.2 | $ | 303.3 | |||||
| Periodic net coupon settlements on non-qualifying derivatives |
(4.2) | (0.1) | (1.4) | (0.9) | $ | - | |||||||||
| Total net investment income |
243.4 | 337.7 | 398.8 | 506.3 | 303.3 | ||||||||||
| Operating realized gains (losses) |
8.7 | 2.6 | 9.7 | (12.4) | (100.0) | ||||||||||
| Other income |
169.0 | 163.2 | 191.4 | 222.1 | 179.2 | ||||||||||
| Total operating revenues |
421.1 | 503.5 | 599.9 | 716.0 | 382.5 | ||||||||||
| Benefits |
|||||||||||||||
| Interest credited |
|||||||||||||||
| Products |
84.2 | 144.9 | 209.9 | 262.3 | 199.7 | ||||||||||
| Periodic net coupon settlements on non-qualifying derivatives |
2.5 | 1.2 | - | 0.1 | - | ||||||||||
| Total benefits |
86.7 | 146.1 | 209.9 | 262.4 | 199.7 | ||||||||||
| Expenses |
|||||||||||||||
| Commissions |
24.7 | 26.5 | 28.4 | 28.9 | 15.4 | ||||||||||
| General operating expenses |
139.9 | 146.1 | 191.8 | 227.5 | 249.2 | ||||||||||
| Amortization of VOBA and other intangible assets |
0.6 | 0.6 | 1.6 | 1.8 | 1.4 | ||||||||||
| Debt extinguishment costs |
- | 21.7 | - | 10.2 | - | ||||||||||
| Interest expense |
102.4 | 107.6 | 103.1 | 110.6 | 105.6 | ||||||||||
| Total expenses |
267.6 | 302.5 | 324.9 | 379.0 | 371.6 | ||||||||||
| Pre-tax operating earnings (loss) |
$ | 66.8 | $ | 54.9 | $ | 65.1 | $ | 74.6 | $ | (188.8) | |||||
|
Note: The results of operations of TBG Financial are reflected as discontinued for 2008 and all prior years. In addition, the results of operations of Cap Pro Holding, Inc. and Nationwide Financial Services (Bermuda), Ltd. are reflected as discontinued for 2005 and 2004. | |||||||||||||||
| Medium Term Notes | |||||||||||||||
| ($ in millions) | 2004 | 2005 | 2006 | 2007 | 2008 | ||||||||||
| Key Ratios/Statistics |
|||||||||||||||
| Daily Average Account Values: |
|||||||||||||||
| General account |
$ | 4,701.8 | $ | 4,048.7 | $ | 4,055.9 | $ | 4,323.7 | $ | 4,127.1 | |||||
| Earned rate |
3.09% | 4.87% | 6.29% | 6.43% | 4.87% | ||||||||||
| Credited rate |
1.79% | 3.58% | 5.14% | 5.35% | 3.92% | ||||||||||
| Interest spread on daily average general account values |
1.30% | 1.29% | 1.15% | 1.08% | 0.95% | ||||||||||
| Income from mortgage loan prepayments and bond call premiums |
0.20% | 0.14% | 0.07% | 0.19% | 0.04% | ||||||||||
| Base interest spread on daily average general account values |
1.10% | 1.15% | 1.08% | 0.89% | 0.91% | ||||||||||
| Corporate and Other Account Value Activity | |||||||||||||||
| ($ in millions) | 2004 | 2005 | 2006 | 2007 | 2008 | ||||||||||
| Medium Term Notes |
|||||||||||||||
| Balance, beginning of period |
$ | 4,606.3 | $ | 4,401.6 | $ | 3,998.2 | $ | 4,599.5 | $ | 4,525.7 | |||||
| Deposits |
900.0 | 900.0 | 1,775.0 | 1,349.8 | 125.0 | ||||||||||
| Maturities |
(1,115.2) | (1,305.4) | (1,180.3) | (1,420.0) | (1,423.8) | ||||||||||
| Net flows |
(215.2) | (405.4) | 594.7 | (70.2) | (1,298.8) | ||||||||||
| Interest credited to policyholder accounts and amortization |
88.4 | 151.2 | 213.4 | 232.6 | 161.4 | ||||||||||
| Other benefits - interest payments |
(77.9) | (149.2) | (206.8) | (236.2) | (171.1) | ||||||||||
| Balance, end of period |
$ | 4,401.6 | $ | 3,998.2 | $ | 4,599.5 | $ | 4,525.7 | $ | 3,217.2 | |||||
| Nationwide Bank |
$ | - | $ | - | $ | 222.3 | $ | 798.3 | $ | 1,763.5 | |||||
| Nationwide Funds Group |
$ | 2,301.8 | $ | 3,019.6 | $ | 2,840.6 | $ | 1,917.3 | $ | 1,345.8 | |||||
| Total corporate and other account values |
$ | 6,703.4 | $ | 7,017.8 | $ | 7,662.4 | $ | 7,241.3 | $ | 6,326.5 | |||||
42
Nationwide Financial Services, Inc.
Statistical Supplement
September 30, 2009
Glossary
Advisory services program - Investment products, including mutual funds, separately managed accounts and variable annuities, provided with advice services, such as asset allocation profiling, through an asset-based fee compensation model.
Allocated capital - A non-GAAP financial measure that is calculated by adding target surplus (calculated as 225% of NAIC defined risk based capital), to the following after-tax amounts: unamortized DAC, the difference between statutory benefit reserves and GAAP benefit reserves, the difference between GAAP invested assets and statutory invested assets, unamortized VOBA, unamortized deferred software costs, unamortized intangible assets, unamortized goodwill, unamortized debt issue costs, unamortized deferred revenue, less deferred premiums.
Annuity - A contract that provides a periodic stream of cash flows at regular intervals for a specified period of time, such as number of years or for life.
Asset fees to average separate account values - A financial measure that is calculated by dividing asset fees by average separate account values.
Average allocated capital - A non-GAAP financial measure that is calculated by taking the mean average of the beginning and ending allocated capital amounts of a quarter for a quarterly average, or the mean average of the beginning of the year allocated capital amount and the ending allocated capital amounts for each of the four quarters for a yearly average.
Average equity - A non-GAAP financial measure that is calculated by taking the mean average of the beginning and ending equity, excluding accumulated other comprehensive income and noncontrolling interest for a quarterly average, or the mean average of the beginning of the year equity excluding accumulated other comprehensive income and noncontrolling interest and the ending equity, excluding accumulated other comprehensive income and noncontrolling interest for each of the four quarters for a yearly average.
Average in force - A metric that is calculated by taking the mean average of the beginning and ending in force amounts of a quarter for a quarterly average, or the mean average of the beginning of the year in force amount and the ending in force amounts for each of the four quarters for a yearly average.
BOLI (Bank Owned Life Insurance) - Generally refers to a large single premium purchase of a Modified Endowment Contract to informally fund a block of employee benefit liabilities.
COLI (Corporate Owned Life Insurance) - Broadly describes the use of life insurance to informally fund a block of employee benefits. In its truest form refers to corporate owned life insurance but could also refer to other ownership arrangements such as split-dollar.
Cost of Insurance per $1,000 of average net amount at risk - A non-GAAP financial measure that is calculated by annualizing the cost of insurance and dividing by the net amount at risk divided by one thousand.
Credited Rate - A financial measure that is calculated by dividing interest credited by average general account values.
Deferred Annuity - An annuity that can be paid either with a single premium or a series of installments, providing for the income payments to begin at some future date.
Deferred Compensation Plan - A benefit plan that allows an employee to save pre-tax dollars. Many are set up similar to a 401(k) plan, including multiple investment options, but without regulated limits on the amount that can be deposited.
Deferred Policy Acquisition Costs - The unamortized policy acquisition costs which are capitalized and charged to expense in proportion to premiums or estimated gross profits depending on the type of underlying contract. See Policy Acquisition Costs.
43
Nationwide Financial Services, Inc.
Statistical Supplement
September 30, 2009
Glossary
Defined Benefit Plan - A qualified pension plan under Section 401 of the Internal Revenue code which defines the retirement benefit to plan participants. The definition of the retirement benefit may include such variables as age, length of service, and compensation, but it would not reflect the investment experience of the assets held to fund these benefits.
Defined Contribution Plan - A benefit plan under which contributions are fixed in advance by formula, and benefits to retiring employees may vary.
Deposits - Premiums received for interest sensitive life insurance, annuities or life insurance products.
Dollar Cost Averaging - Paying a fixed amount of premium at regular intervals regardless of the unit values of the selected variable accounts or the current interest rate on new premiums paid into the guaranteed account.
Earned Rate - A financial measure that is calculated by dividing net investment income by average general account values.
Fixed Annuity - An annuity contract in which premiums paid are credited with a fixed rate of return by the life insurance company.
GAAP - Refers to accounting principles generally accepted in the United States of America.
General Account - An undivided account in which all investments are held that are not held in the separate account.
General operating expenses to average account values - A GAAP financial measure that is calculated by dividing general operating expenses by average account values.
Group Annuity - A pension plan providing annuities at retirement to a group of people under a master contract. It usually is issued to an employer for the benefit of employees.
Immediate Annuity - An annuity providing for payment to begin immediately after a single premium is paid.
Internal Replacement - Transaction whereby a policyholder’s existing insurance product or investment contract is replaced with a similar product issued by the same entity.
Interest spread on average general account assets - A financial measure that is calculated by subtracting the credited rate from the earned rate.
Lapse - Termination of a policy because of failure to pay the premium.
Leverage, excluding AOCI and NCI - A non-GAAP financial measure that is calculated by dividing long-term debt by total capital, excluding accumulated other comprehensive income (AOCI) and noncontrolling interest (NCI).
Life benefits per $1,000 of average net amount at risk - A metric that is calculated by annualizing the life insurance benefit amount and dividing by the average net amount at risk divided by one thousand, excluding separate account corporate investment life business.
Life benefits per $1,000 of average in force - A metric that is calculated by annualizing the life insurance benefit amount and dividing by the average in force amount divided by one thousand, excluding separate account corporate investment life business.
Life Insurance In Force - The sum of the face amounts, plus dividend additions, of life insurance policies outstanding at a given time.
Nationwide Financial Network - Refers to the affiliated distribution channel that was formerly referred to as Nationwide Provident Producers.
Net Amount at Risk - Insurance in force less accumulated account value. Pertains to investment life products and is the amount for which cost of life insurance is assessed.
44
Nationwide Financial Services, Inc.
Statistical Supplement
September 30, 2009
Glossary
Net operating earnings (loss) - A non-GAAP financial measure that is calculated by adjusting net income (loss) to exclude net realized gains and losses on investments not related to operating items (periodic net amounts paid or received on interest rate swaps that do not qualify for hedge accounting treatment, trading portfolio realized gains and losses, trading portfolio valuation changes, and net realized gains and losses related to securitizations), hedging instruments and hedged items, adjustment to amortization related to net realized gains and losses, discontinued operations and cumulative effect of adoption of accounting principles, if any, all net of tax.
New and renewal production premiums and deposits - The Company regularly monitors and reports a sales production metric as a measure of the volume of new and renewal business generated in a period.
New and renewal production premiums and deposits, previously referred to as “sales”, are not derived from any specific GAAP income statement accounts or line items and should not be viewed as a substitute for any financial measure determined in accordance with GAAP, including sales as it relates to non-insurance companies. Management believes that the presentation of new and renewal production premiums and deposits enhances the understanding of the Company’s business and helps depict longer-term trends that may not be apparent in the results of operations due to differences between the timing of sales and revenue recognition.
Non-GAAP financial measures - Key performance indicators used by management that have not been calculated in accordance with GAAP. None of these non-GAAP financial measures should be viewed as substitutes for any GAAP financial measures.
Operating realized gains and (losses) - A non-GAAP financial measure that represents net realized gains and (losses) on investments, hedging instruments and hedged items that are related to operating items (periodic net amounts paid or received on interest rate swaps that do not qualify for hedge accounting treatment, trading portfolio realized gains and losses, trading portfolio valuation changes, and net realized gains and losses related to securitizations).
Operating return on average equity - A non-GAAP financial measure that is calculated by annualizing net operating earnings (loss) and dividing by average equity excluding accumulated other comprehensive income and noncontrolling interest.
Operating revenues - A non-GAAP financial measure that is calculated by adjusting total revenues to include only net realized gains and losses on investments, hedging instruments and hedged items that are related to operating items (periodic net amounts paid or received on interest rate swaps that do not qualify for hedge accounting treatment, trading portfolio realized gains and losses, trading portfolio valuation changes, and net realized gains and losses related to securitizations).
Persistency - Percentage of life insurance policies or annuity contracts remaining in force from one period to another.
Policy Acquisition Costs - Expenses that vary with and are primarily related to the acquisition of new and renewal insurance contracts.
Pre-tax operating earnings (loss) - A non-GAAP financial measure that is calculated by adjusting earnings (loss) from continuing operations before federal income taxes and cumulative effect of adoption of accounting principles, if any, to exclude adjustment to amortization related to net realized gains and losses, and net realized gains and losses on investments, hedging instruments and hedged items, except for operating items (periodic net amounts paid or received on interest rate swaps that do not qualify for hedge accounting treatment, trading portfolio realized gains and losses, trading portfolio valuation changes, and net realized gains and losses related to securitizations).
Pre-tax operating earnings (loss) to average account values - A non-GAAP financial measure that is calculated by dividing pre-tax operating earnings (loss) by average account values.
Pre-tax operating earnings (loss) to operating revenues - A non-GAAP financial measure that is calculated by dividing pre-tax operating earnings (loss) by operating revenues.
45
Nationwide Financial Services, Inc.
Statistical Supplement
September 30, 2009
Glossary
Qualified Plan - A plan purchased with pre-tax dollars, generally under a pension plan, specially sponsored program, or individual retirement account that the Internal Revenue Service approves as meeting the requirements of Section 401(a) of the 1986 Internal Revenue Code, as amended. Such plans receive tax advantages.
Ratio of pre-tax operating earnings (loss) before interest to interest expense - A non-GAAP financial measure that is calculated by subtracting interest expense from pre-tax operating earnings (loss) and dividing the product by interest expense.
Return on average allocated capital - A non-GAAP financial measure that is calculated by dividing annualized after-tax operating earnings (loss) by average allocated capital.
Separate Account - A separate investment account established and maintained by an insurance enterprise used primarily for variable products. This arrangement permits wider latitude in the choice of investments for contract holders.
Surrender Charges - Charges made against withdrawals from the contract value of most variable annuities for a period of time, typically four to seven years.
Statutory capital and surplus - A financial measure that is calculated based on accounting practices prescribed or permitted by the department of insurance of the state of domicile. Each of the states in which the Company’s insurance companies are domiciled has adopted the National Association of Insurance Commissioners (NAIC) statutory accounting practices (NAIC SAP) as the basis of its statutory accounting practices. The Company’s insurance subsidiaries have no statutory accounting practices that differ from NAIC SAP.
Universal Life Insurance - A flexible premium, adjustable benefit life insurance contract that accumulates cash values through the receipt of contractually determined interest credited.
Variable Annuity - An annuity contract in which the funds are invested in investments for which the underlying values can fluctuate.
Variable Life Insurance - A securities-based whole life insurance policy that employs a fixed premium and provides variable cash values and death benefit, dependent upon the performance of the separate account investment election.
Variable Universal Life Insurance - A type of variable life insurance that has flexible premiums.
Value of Business Acquired (VOBA) - Reflects the estimated fair value of the Nationwide Provident business in-force and represents the portion of the purchase price that is allocated to the value of the right to receive future cash flows from the life insurance and annuity contracts existing as of the closing date of the Nationwide Financial Network Merger.
46
Nationwide Financial Services, Inc.
Statistical Supplement
September 30, 2009
Notes
This report is for information purposes only. It should be read in conjunction with documents filed by Nationwide Financial Services, Inc. with the U.S. Securities and Exchange Commission, including the most recent Annual Report on Form 10-K and Quarterly Reports on Form 10-Q.
47