Attached files
| file | filename |
|---|---|
| 8-K - FORM 8-K - NEWTEK BUSINESS SERVICES, INC. | d8k.htm |
| EX-99.1 - EXHIBIT 99.1 - NEWTEK BUSINESS SERVICES, INC. | dex991.htm |
 Newtek Business Services, Inc. NASDAQ: NEWT Third Quarter 2009 Financial Results Conference Call November 11, 2009, 4:15 PM Hosted By: Barry Sloane, CEO and Chairman Seth A. Cohen, CFO Investor Relations Contact: Barry Sloane 212-356-9500 Exhibit 99.2 bsloane@newtekbusinessservices.com |
 2 Safe Harbor Statement The statements in this slide presentation including statements regarding anticipated future financial performance, Newtek's beliefs, expectations, intentions or strategies for the future, may be "forward-looking statements" under the Private Securities Litigation Reform Act of 1995. All
forward-looking statements involve a number of risks and uncertainties that could cause
actual results to differ materially from the plans, intentions and expectations reflected in or
suggested by the forward-looking statements. Such risks and uncertainties include, among
others, intensified competition, operating problems and their impact on revenues and profit margins, anticipated future business strategies and financial performance, anticipated future number of customers, business prospects, legislative developments and similar matters. Risk factors, cautionary statements and other conditions which could cause Newtek’s actual results to differ from management's current expectations are contained in Newtek’s filings with the Securities and
Exchange Commission and available through Also we need to point out that our Capcos operate under a different set of rules in each of the 8
jurisdictions and that these place varying requirements on the structure of our investments. In
some cases, particularly in Louisiana or in certain situations in New York, we don’t control the
equity or management of a qualified business, but that cannot always be presented orally or in
written presentations. http://www.sec.gov |
 3 Third Quarter 2009 Highlights Announced $782k post tax net income Improved 2009 annual guidance from $(7.4) to $(5.2) million pretax net loss to $(5.1) to $(4.7) million pretax net loss Announce 2010 annual guidance of $(2.4) million pretax net loss to $2.3 million pretax net income Wisconsin and Louisiana notes matured in October Primary revenue trends in EPP and Web Hosting exceed 2008 comparisons GE Amendment LOI signed by top 20 commercial bank to take out GE |
 4 Third Quarter 2009 Highlights SBA lending business dynamics Government guaranteed pricing Portfolio behavior Began originations again Securitization market begins to thaw New alliance partners queue up Is this the beginning of a reversal in lending Asset management – servicing income New origination – 110 price for governments 90% guarantee – for how long Reposition lender financing - alternatives Lending line (signed LOI with top twenty banking institution) Bank merger Other |
 5 Third Quarter 2009 Conference Call Agenda Primary Corporate Initiatives and Strategy Financial Results Snapshot Development in EPP & Web Hosting Segments Web Hosting, EPP & eCommerce Initiatives Small Business Finance Initiatives Cost Reduction Measures Q3 2009 corporate expenses reduced $366,000 and $1,462,000 for the three and nine months ended, respectively, vs. Q3 2008 Marketing Focus Financial Review 2009 Outlook |
 6 Third Quarter 2009 Conference Call Agenda Projections for 2010 cash flow positive Lender projections for Q4 2009 and variables Repayments of Capco debt FDIC contract Variables for success in EPP Variables for success in Web Hosting Variables for success in cash flow & expense control |
 7 Continuation of our Strategy & Mission 1. What do we offer for our clients? • Reduce their expenses • Grow their revenues • Reduce their risk 2. Become the authority for small businesses 3. 7 core offerings: a) Primary: lending, EPP, insurance, hosting applications b) Secondary: web design development, data storage, payroll 4. Cross sell and cross market the database by becoming the authority 5. a) Walmart for small businesses b) Amazon for small businesses 6. We know small business |
 8 What is a Small Business 1. SBA definition 2. Independent business owners 3. Examples: a) 75 site parking garage b) Single practitioner consultant c) Doctor group d) Restaurant |
 9 What Do We Do Well 1. Acquiring the client a) Alliance b) Direct model 2. Servicing the client 3. Cross sell and cross market a) Development 4. Primary goal is to be the small business authority |
 10 Third Quarter 2009 Financial Results $782 thousand net income for Q3 2009 Versus $2.8 million net loss for Q3 2008 Due to: • A release of an income tax valuation allowance • Under a new accounting pronouncement effective in 2009 (SFAS 160 “Noncontrolling Interests in Consolidated Financial Statements), the Company was able to attribute losses from certain subsidiaries to minority holders. Under the old accounting rules, these losses would have normally been absorbed by Newtek, the primary beneficiary. We do not expect this benefit going forward. Q3 2009 pre-tax loss of $1.1 million Depreciation and amortization non-cash expense of $1.3 million in Q3 2009. Decreased pre-tax loss by 61% from Q3 2008’s pre-tax loss of $2.8 million. |
 11 Third Quarter 2009 Financial Results Q3 2009 vs. Q3 2008 core operating segment revenue: Electronic Payment Processing: $18.1 million - up 13% over Q3 2008 Web Hosting: $4.7 million - up 3% over Q3 2008 Small Business Finance: $1.5 million – down (10)% over Q3 2008 |
 12 Cash Position $24.1 million in cash and cash equivalents and restricted cash at September 30, 2009, down from $25.2 million at December 31, 2008. Equates to $0.67 cash per share. $5.6 million of net cash provided by operating activities in the first nine months of 2009 versus $(9.9) million of net cash used in operating activities for the same period in 2008. $1.2 million net decrease in cash and cash equivalents for the first nine months of 2009 versus $7.5 million net decrease in cash and cash equivalents for the same period in 2008. |
 13 Development in EPP Q3 2009 EPP revenue up 13% over Q3 2008 EBITDA margin 8.3% for Q3 2009 compared to 10.5% for Q3 2008 Merchant attrition Cash flow positive business Significant operating leverage Potential to increase market share 2009 EPP segment EBITDA forecast: $6.0 to $6.1 million EPP segment does not have any debt eCommerce – Single most important Corporate initiative and identifier |
 14 Web Hosting Initiatives Q3 2009 versus Q3 2008: Revenue up 3% Pre-tax net income up 14% Continued growth despite challenging market Continue to invest in Web Hosting segment to support future growth Continue to evaluate expenditures versus productivity, particularly in marketing, seeking additional cost savings where applicable Currently above 60% real estate capacity in our data center Began launch of wholesale outreach in Q3 2008 2009 Web Hosting segment EBITDA forecast: $6.7 to $6.8 million Great marketing channel to target IT partners and web developers – TechExec |
 15 Web Hosting & EPP Focus One stop shop Gateway, hosting, merchant processing, shopping cart Everything you need NewtPay NewtPay Pro TechExec Reseller Combined marketing and client service focus |
 16 Positive Trends for SBA Lending 90% Government guaranty up from 75% for 2009 Significantly reduced government guaranteed lender competition Conventional loan market not very competitive Better quality loans at better prices |
  17 Positive Trends for SBA Lending Loan Size 350,000 $ 1,500,000 $ Servicing 1.00% 1.00% Premium 110.00% 110.00% 75% 90% 75% 90% GAAP Premium Received 21,599 $ 31,627 $ 104,216 $ 150,679 $ Cash Premium Received 26,250 $ 31,500 $ 112,500 $ 135,000 $ Servicing Asset 6,500 $ 8,000 $ 32,000 $ 40,000 $ Discount 6,401 $ 3,123 $ 30,784 $ 14,821 $ Net Newtek Investment 61,250 $ 3,500 $ 262,500 $ 15,000 $ 75% vs. 90% Government Guaranty of SBA 7(a) Loans |
 18 Small Business Finance Buying sub & non-performing portfolios Bidding on SBA servicing and sub-servicing contracts We have very good lending infrastructure This infrastructure is valuable more so today The most decimated sector may offer the best opportunity for Newtek shareholders |
 19 Small Business Finance 110 pricing on governments Signed LOI with major money center lender bank on lender FDIC contract Q4 2009 $250k anticipated loss vs. $800k loss previously expected |
 20 Cost Reduction Measures Significantly reduced expenses in Corporate Segment; efforts to reduce or hold expenses in other segments Cost reductions are expected to equate to a minimum $4.0 million of cash savings in 2009 Plan to continue to review all segments to recognize additional cost reductions in 2009 Reduced facilities cost in Great River (Long Island) and the Florida office with D.C. and NYC as the next targets |
 Payroll Reductions 21 “Run rate” analysis based on semi-monthly pay snapshot 2/15/08 Headcount 2/15/08 Payroll 10/15/09 Headcount 10/15/09 Payroll Headcount Reduction Payroll Reduction Headcount % Reduction Payroll % Reduction EPP Segment 79 $119,059 67 $119,515 12 ($456) 15.2% -0.4% Web hosting segment 88 $149,435 100 $179,340 (12) ($29,905) -13.6% -20.0% Small business finance 50 $167,503 30 $92,678 20 $74,825 40.0% 44.7% All other segment 88 $145,872 49 $61,603 39 $84,269 44.3% 57.8% Corporate segment 59 $258,577 33 $137,150 26 $121,427 44.1% 47.0% Total 364 $840,446 279 $590,286 85 $250,160 23.4% 29.8% Annualized Totals $20,170,704 $14,166,864 $6,003,840 29.8% |
 22 Payroll February 15, 2008 – Payroll register Headcount 364 October 15, 2009 – Payroll register Headcount 279 Reduction of 85 or 23.4% |
 23 Payroll Annualized Run-rate February 15, 2008 $20.2 million October 15, 2009 $14.2 million 29.8% Dollar Reduction |
 24 Brownsville - Update Occupied new space officially on March 15, 2009 15,000 sq ft facility with the capacity for 145 positions, constructed with $1.25m Federal Grant, co-located with University of Texas – Brownsville (UTB) 24/7 bi-lingual processing center for all lines of business UTB provides significant resource pool for interns, part time and permanent employees Language translation resource for all marketing and sales initiatives (http://tinyurl.com/cfoz6w) Cross training and cross servicing enhanced thru co-location of division
personnel Outbound Initiatives To Date Initial referrals generated verify client satisfaction with Newtek’s
approach Continued training of outbound personnel will increase quality of
generated referrals and hence close rates |
 25 What is our Growth Strategy Going Forward? Emphasize cross-selling and cross-marketing into the customer base which we are now doing Continue to grow alliance channels as outsourcing of our services is attractive to banks, credit unions, and other Improve our cash flow Reduce Capco exposure Acquisitions within our footprint Utilize balance sheet and strategic partner financings Hire Rubenstein firm for public relations and to help sharpen our message as the small business authority |
 26 Positive Capco and Overhead Trends Wilshire Partners (Florida) note of $37.4 million matured (previously defeased) Return of insurance premium of $250k to Wilshire Partners (Florida) received Operating agreement, monitoring agreement, audited financials, tax return, and office real estate all dissipate Wisconsin & Louisiana Capcos total debt principal repayment of $33 million occurred in Q4. Return of insurance premium of approximately $250k is scheduled for Q4. (previously defeased) Broker dealer sold in August, 2009 -$50k annualized savings |
 Marketing Focus |
 28 Marketing Adjustments Messaging What makes us unique? Our relationship with the client. We now own the client. We are calling our clients. Exceptionally well received. We are their partners!!! Increase Sales Reduce Expenses Reduce Risk Financing EPP Insurance Coverage SEO Payroll Cost PCI Compliance Premium Cost Hosting Cost Storage Cost |
 29 Marketing Adjustments Product Mix Product Revenue Growth Reduce Expense Reduce Risk EPP / E-Commerce Lending Hosting Storage Web Design SEO Payroll Insurance |
 30 Marketing Adjustments Advertising Newtek buys radio advertising on WFAN Boomer and Carton can be heard live in seven states in the Northeast and with online live internet streaming of their show, they can be heard in every state Audience of approximately 2.5 million during prime drive time (6am to10am) Message is changed on a bi-weekly basis to ensure maximum exposure of all our offerings www.newtbiz.com |
 31 Revised 2009 Segment Guidance *Note: totals may not add due to rounding In millions of dollars Electronic Small Payment Web Business All Corporate Processing Hosting Finance Other Activities Low High Low High Low High Low High Low High 2009 Full Year Revenue 68.2 68.5 18.9 19.0 7.0 7.1 2.2 2.2 3.2 3.2 Pretax Net Income (Loss) 4.3 4.4 4.0 4.0 (2.4) (2.3) (0.5) (0.5) (6.4) (6.4) Interest Expense - - 0.1 0.1 1.5 1.5 - - - - Depreciation and Amortization 1.7 1.7 2.6 2.6 1.0 1.0 0.1 0.1 0.4 0.4 EBITDA 6.0 6.1 6.7 6.8 0.1 0.2 (0.4) (0.3) (6.0) (6.0) Total Business CAPCO Intercompany Segments Segment Eliminations Total Low High Low High Low High 2009 Full Year Revenue 99.4 100.0 7.9 7.9 (3.8) 103.5 104.1 Pretax Net Income (Loss) (1.0) (0.8) (4.1) (4.0) - (5.1) (4.7) |
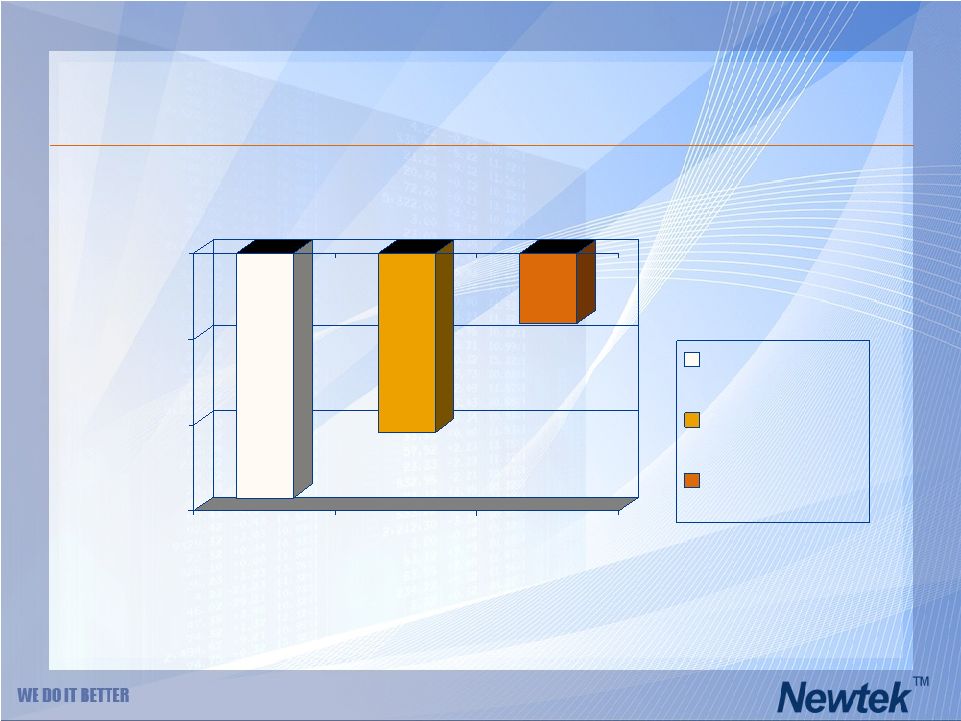 32 Annual Pretax Loss Trend -18 -12 -6 0 2007 Actual 2008 Actual 2009 Forecast Midpoint 2007 Actual 2008 Actual 2009 Forecast Midpoint Pretax Net Loss $(17.1)mm $(12.5)mm $(4.9)mm |
 33 Consolidated Annual Pretax Loss Year Amount (in millions) 2007 (17.1) 2008 (12.5) 2009 (Forecast range midpoint) (4.9) |
 Financial Review Seth A. Cohen - CFO |
 35 Non-GAAP Financial Measures In evaluating its business, Newtek considers and uses EBITDA as a supplemental measure
of its operating performance. The Company defines EBITDA as earnings
before interest expense, taxes, depreciation and amortization. Newtek
uses EBITDA as a supplemental measure to review and assess its operating
performance. The Company also presents EBITDA because it believes it
is frequently used by securities analysts, investors and other interested
parties as a measure of financial performance. The term EBITDA is not
defined under U.S. generally accepted accounting principles, or U.S. GAAP,
and is not a measure of operating income(loss), operating performance or liquidity presented in accordance with U.S. GAAP. EBITDA has limitations as a
analytical tool and, when assessing the Company’s operating
performance, investors should not consider EBITDA in isolation, or as a
substitute for net income (loss) or other consolidated income statement
data prepared in accordance with U.S. GAAP. Among other things, EBITDA does not reflect the Company’s actual cash expenditures. Other
companies may calculate similar measures differently than Newtek, limiting
their usefulness as comparative tools. Newtek compensates for these
limitations by relying primarily on its GAAP results and using EBITDA only
supplementally. |
 36 Cash Position Balance at September 30, 2009 Balance at December 31, 2008 Cash and cash equivalents $15,572 $16,852 Restricted cash $8,548 $8,366 SBA loans held for sale - $6,133 Notes payable $16,801 $25,998 In thousands of dollars 2009 nine month cash flow: Net cash provided by operating activities was $5,637,000 Net cash provided by investing activities was $2,538,000 Net cash used in financing activities was $9,455,000 |
 37 Q3 2009 Actual vs. Q3 2008 Actual Revenue For The Quarter Ended September 30, 2009 Actual Revenue For The Quarter Ended September 30, 2008 Actual Pretax Net Income (Loss) For The Quarter Ended September 30, 2009 Actual Pretax Net Income (Loss) For The Quarter Ended September 30, 2008 Actual EBITDA For The Quarter Ended September 30, 2009 Actual EBITDA For The Quarter Ended September 30, 2008 Actual Electronic Payment Processing 18.115 15.984 1.088 1.114 1.509 1.672 Web Hosting 4.746 4.590 1.027 0.898 1.576 1.721 Small Business Finance 1.478 1.647 (0.756) (1.494) (0.157) (0.734) All Other 0.311 0.402 (0.271) (0.575) (0.237) (0.552) Corporate Activities 0.712 1.169 (1.314) (1.223) (1.209) (1.117) CAPCO 2.298 1.755 (0.873) (1.520) Interco Eliminations (0.848) (1.304) Total 26.812 24.243 (1.099) (2.800) In millions of dollars |
 38 Original 2009 Segment Guidance *Note: totals may not add due to rounding In millions of dollars Electronic Small Payment Web Business All Corporate Processing Hosting Finance Other Activities Low High Low High Low High Low High Low High 2009 Full Year Revenue 63.5 67.5 18.6 19.6 6.3 6.8 1.0 1.4 2.6 2.6 Pretax Net Income (Loss) 3.7 4.4 4.0 4.8 (3.1) (2.7) (0.9) (0.6) (7.4) (7.4) Interest Expense - - 0.1 0.1 1.4 1.4 - - - - Depreciation and Amortization 1.8 1.8 2.7 2.7 1.3 1.3 0.2 0.2 0.3 0.3 EBITDA 5.5 6.1 6.9 7.7 (0.4) - (0.7) (0.4) (7.1) (7.4) Total Business CAPCO Intercompany Segments Segment Eliminations Total Low High Low High Low High 2009 Full Year Revenue 92.0 97.9 6.5 6.5 (3.2) 95.3 101.2 Pretax Net Income (Loss) (3.7) (1.5) (3.7) (3.7) - (7.4) (5.2) |
 39 Revised 2009 Segment Guidance *Note: totals may not add due to rounding In millions of dollars Electronic Small Payment Web Business All Corporate Processing Hosting Finance Other Activities Low High Low High Low High Low High Low High 2009 Full Year Revenue 68.2 68.5 18.9 19.0 7.0 7.1 2.2 2.2 3.2 3.2 Pretax Net Income (Loss) 4.3 4.4 4.0 4.0 (2.4) (2.3) (0.5) (0.5) (6.4) (6.4) Interest Expense - - 0.1 0.1 1.5 1.5 - - - - Depreciation and Amortization 1.7 1.7 2.6 2.6 1.0 1.0 0.1 0.1 0.4 0.4 EBITDA 6.0 6.1 6.7 6.8 0.1 0.2 (0.4) (0.3) (6.0) (6.0) Total Business CAPCO Intercompany Segments Segment Eliminations Total Low High Low High Low High 2009 Full Year Revenue 99.4 100.0 7.9 7.9 (3.8) 103.5 104.1 Pretax Net Income (Loss) (1.0) (0.8) (4.1) (4.0) - (5.1) (4.7) |
 40 2010 Segment Guidance *Note: totals may not add due to rounding In millions of dollars Electronic Small Payment Web Business All Corporate Processing Hosting Finance Other Activities Low High Low High Low High Low High Low High 2010 Full Year Revenue 76.6 78.8 19.2 20.2 9.4 11.5 1.2 1.5 1.4 1.4 Pretax Net Income (Loss) 4.1 5.0 4.0 5.0 (1.0) (3.0) (1.1) (0.8) (7.9) (7.6) Interest Expense - - 0.1 0.1 1.0 1.0 - - - - Depreciation and Amortization 1.5 1.5 2.1 2.1 0.8 0.8 0.1 0.1 0.4 0.4 EBITDA 5.6 6.5 6.2 7.2 2.8 4.8 (1.0) (0.7) (7.4) (7.1) Total Business CAPCO Intercompany Segments Segment Eliminations Total Low High Low High Low High 2010 Full Year Revenue 107.8 113.4 3.9 3.9 (1.5) 110.2 115.8 Pretax Net Income (Loss) 0.2 4.6 (2.6) (2.3) - (2.4) 2.3 |
 Going Forward: 2009/2010 Barry Sloane - CEO |
 Questions & Answers |
 Addendum |
 44 Pretax Income (Loss) for Q3 2009 Interest Expense for Q3 2009 Depreciation and amortization for Q3 2009 Q3 2009 EBITDA Electronic Payment Processing 1.088 - 0.421 1.509 Web Hosting 1.027 0.033 0.516 1.576 Small Business Finance (0.756) 0.366 0.233 (0.157) All Other (0.271) - 0.034 (0.237) Corporate Activities (1.314) - 0.105 (1.209) Pretax Income (Loss) for Q3 2008 Interest Expense for Q3 2008 Depreciation and amortization for Q3 2008 Q3 2008 EBITDA Electronic Payment Processing 0.917 - 0.519 1.436 Web Hosting 0.317 0.165 0.759 1.241 Small Business Finance (0.162) 0.578 0.301 0.717 All Other (0.304) - 0.032 (0.272) Corporate Activities (2.487) 0.024 0.067 (2.396) EBITDA Reconciliation EBITDA Reconciliation from Net Income (Loss) For The Three Months Ended September 30, 2009 In millions of dollars EBITDA Reconciliation to Net Income (Loss) For The Three Months Ended September 30, 2008 In millions of dollars |