Attached files
| file | filename |
|---|---|
| 8-K - MODAVOX FORM 8K DATED NOVEMBER 12, 2009 - HIPCRICKET, INC. | modavox8k111209.htm |
EXHIBIT
99.1
VALUATION
SERVICES FOR:
MODAVOX,
INC.
FAIR
MARKET VALUE ANALYSIS OF MODAVOX, INC. (AND ASSOCIATED PATENTS)
As
of October 1, 2009
|
1250
Connecticut Avenue, NW, Suite 650
Washington,
DC 20036
T :
(202) 420-7680
F :
(202) 429-5673
|
|||
October
1, 2009
Shelly
Meyers
Modavox,
Inc.
1900 West
University, Suite 230
Tempe, AZ
85281
Re: Modavox,
Inc. – Project X Settlement Purposes Only
Dear Ms. Meyers:
Pursuant
to your request, The Kenrich Group LLC (“Kenrich Group”) has performed valuation
services for Modavox, Inc. (the “Company” or “Modavox”) for settlement
purposes
in order
to assist management in its evaluation of the fair market value of Modavox and
Modavox’s patented technology. Our analysis was performed as of October
1,
2009.
OBJECTIVE
AND PURPOSE
We
understand that Modavox is currently in the process of and, more specifically,
in discussions with X regarding a settlement of their
litigation.
We were
asked to provide a current opinion of the fair market business enterprise value
of Modavox on a consolidated
basis In
the course of our analysis, we have focused on the value related to the patented
technology.
Our
analysis incorporated a review of financial and other data provided to us, as
well as discussions with the Company’s senior management. Our analysis does not
constitute an audit; we relied upon the information provided to us as accurate
and representative of the operational history of the Company. The valuation
process included consideration of factors affecting the operations of Modavox
and its patented technology as well as the ability to generate future investment
returns through operations and litigation. The factors considered in our
analysis, when relevant and available, included:
|
·
|
The
nature and history of the patent technology and the
business;
|
|
·
|
Financial
and economic conditions affecting the patented technology, its industry
and the general economy;
|
|
·
|
Past
results, current operations and future prospects of the business
enterprise;
|
|
·
|
Sales
of similar businesses or capital stock of publicly and privately held
similar businesses; and
|
|
·
|
Prices,
terms and conditions affecting past sales of similar business
enterprises.
|
ii
STANDARD
OF VALUE
Fair
market value (“FMV”) is defined as the price at which property would change
hands between a willing buyer and a willing seller when the former is not under
any compulsion to buy and the latter is not under any compulsion to sell, both
parties having reasonable knowledge of relevant facts.
VALUATION
METHODOLOGY
Typically,
there are three basic, generally accepted approaches for valuing a business or
asset:
|
·
|
Income
Approach
|
|
·
|
Market
Approach
|
|
·
|
Cost
Approach
|
These
approaches utilize the line of reasoning a prudent investor would follow in
estimating the value of a business or assets. In a valuation study, all three
approaches to value should be considered, as one or
more may be appropriate. The appropriateness for the various valuation methods
in any valuation varies with the particular company and industry. Due to the
uniqueness of the current situation (Modavox’s litigation pursuits as well as
the fundamental aspects of their owned, patented technology), we expanded upon
the income approach, including an analysis of several scenarios to determine the
value of Modavox. To determine the appropriate value to a buyer in the current
marketplace,
we were required to determine the inherent value of the litigations currently
being pursued
as well as those that will inevitably occur. As discussed below, the value
associated with the alleged exceed that which would be derived from an analysis
of the Company’s current operations. We have estimated a settlement value for
both the value of the company as a pure acquisition as well as the value derived
by licensing the patented technology. Additionally, we have also estimated the
value of this technology to X internally in terms of increase profit, as well as
to the online industry.
CONCLUSION
There are
many factors that affect the ability of an appraiser to estimate the value of an
entity such as Modavox.
Some of the challenges we faced in our analysis are as follows:
|
·
|
The
relative infancy of the current behaviorally targeted advertising market.
This aspect has reduced the amount of information available to determine
both current and projected market rates associated with use of the
technology.
|
|
·
|
The
lack of detailed information regarding the amount of profitability a
potential purchaser will be able to derive from the use of the patented
technology.
|
|
·
|
The
lack of certainty that is always associated with the litigation
process.
|
These
factors make it difficult to determine a point estimate of value. Therefore, we
concentrated our analysis on developing ranges of value based on key assumptions
related to growth, profitability, risk, development of the market and value of
litigation (to both X and throughout the industry.) When possible and
appropriate, we benchmarked key assumptions with industry data currently
available as well as information received from Modavox’s senior
management.
iii
The
following analyses of value represent various value estimates indicative of the
value of Modavox:
| Preliminary FMV | Low | High | ||||||
| X Litigation/Licensing Value (Online) | $ | 146.27 | $ | 146.27 | ||||
| Industry Litigation Value for the Online Behavioral Targeting (Not Including X) | $ | 693.49 | $ | 1,456.69 | ||||
| Value to X Internally (Increased Profit) of Patent Portfolio to X (Online only) | $ | 569.99 | $ | 569.99 | ||||
| Value of Patent Portfolio to X Internally and the Industry Litigation Value (Online) Industry | $ | 1,263.48 | $ | 2,026.68 | ||||
| Litigation Value: Mobile Behavioral Targeting | $ | 141.96 | $ | 524.25 | ||||
| Value to X Internally (Increased Profit) of Patent Portfolio to X (Mobile only) | $ | 112.60 | $ | 188.35 | ||||
Based
upon the analysis presented in this report, information we have reviewed, and
the fact and circumstances surrounding Modavox’s patent portfolio,
the
of Modavox is between approximately $525 and $575 million.
This
report is subject to the attached Statement of General Assumptions and Limiting
Conditions. We appreciate the opportunity to be of service to Modavox. Please
contact us if you have any questions concerning our analysis.
Very
truly yours,
/s/ Krista F.
Holt
The
Kenrich Group
Krista F.
Holt, Vice President
iv
TABLE
OF CONTENTS
|
1.
|
EXECUTIVE
SUMMARY
|
3
|
|
| 1.1 Standard of Value |
3
|
||
|
2.
|
DESCRIPTION
OF MODAVOX AND THE PATENTED TECHNOLOGY
|
4
|
|
| 2.1 Description of Modavox, Inc. |
4
|
||
| 2.2 Description of Patents |
4
|
||
| 2.3 Description of the Patented Technology |
5
|
||
|
3.
|
INFORMATION
RELIED UPON AND CONSIDERED
|
6
|
|
|
4.
|
THE
ECONOMIC ENVIRONMENT.
|
7
|
|
| 4.1 Gross Domestic Product |
7
|
||
| 4.2 Consumer Spending |
8
|
||
| 4.3 Employment |
8
|
||
| 4.4 Inflation |
9
|
||
| 4.5 Interest Rates |
10
|
||
|
5.
|
INDUSTRY
OVERVIEW
|
11
|
|
| 5.1 Advertising |
11
|
||
| 5.2 Online Behaviorally Targeted Advertising . |
12
|
||
| 5.3 Mobile Behavioral Targeting Advertising . |
13
|
||
|
6.
|
VALUATION
METHODOLOGY
|
14
|
|
| 6.1 Premise of Value |
14
|
||
| 6.2 Methods for Determining Value |
14
|
||
| 6.3 Income Approach | 15 | ||
|
|
6.3.1
Relief-from-Royalty Approach
|
16
|
|
| 6.4 Market Approach |
17
|
||
| 6.5 Cost Approach |
17
|
||
|
7.
|
VALUATION
METHODS APPLIED
|
18
|
|
|
8.
|
PRELIMINARY
BUSINESS ENTERPRISE VALUE OF MODAVOX
|
19
|
|
| 8.1 The Income Approach |
19
|
||
|
8.1.1
Preliminary X Litigation/Licensing Value.
|
19
|
||
|
8.1.2
Preliminary X Litigation Value of the Patent Portfolio within the Industry
(Less X)
|
22
|
||
|
8.1.3
After-tax Value of Patent Portfolio to X Through Internal Use (Online
Advertising Revenues Only)
|
23
|
||
|
8.1.4
Value of Patent Portfolio and Industry Litigation (Online)..
.
|
24
|
||
|
8.1.5
Value of Mobile Behavioral Targeting Market .
|
24
|
||
|
8.1.6
Industry Litigation Value – Mobile Behavioral Targeting
Market
|
25
|
||
|
8.1.7
After Tax Value of Patent Portfolio to X for Internal Use (Mobile Market
Only)
|
25
|
||
|
8.1.8
Total Value of Patent Portfolio Internally and Industry Litigation to X
(Mobile Market Only) Summary
|
26
|
||
|
8.1.9
Preliminary Internal Value of the Patent Portfolio to the Industry for the
Online and Mobile Behavioral Targeting Market
|
26
|
||
| 8.2 The Market Approach |
26
|
||
|
8.2.1 Comparable
Transaction Analysis
|
27
|
||
|
8.2.2 The
Market Approach – Valuation Conclusion
|
28
|
||
v
| 8.3 The Cost Approach Consideration and Indication |
28
|
|
|
9.
|
PRELIMINARY
FAIR MARKET VALUE CONCLUSIONS
|
29
|
|
10.
|
COUNTERVAILING
FACTS & RISK FACTORS .
|
30
|
| 10.1 Litigation Risks |
30
|
|
| 10.2 Judicial and Legislative Risk |
30
|
|
|
11.
|
STATEMENT
OF GENERAL ASSUMPTIONS AND LIMITING CONDITIONS
|
31
|
|
12.
|
KENRICH
GROUP QUALIFICATIONS
|
33
|
|
13.
|
CERTIFICATION
|
34
|
2
1. EXECUTIVE
SUMMARY
The
Kenrich Group LLC (“Kenrich Group”) has been retained by Shaub & Williams on
behalf of Modavox, Inc. (“Modavox" or "The Company”) in
regards to assisting in determination of potential settlement
amounts
This includes assisting Company
management in its evaluation of the fair market value of Modavox. Our analysis
was performed as of October 1, 2009.
We
understand that the settlement estimates we are presenting here today are being
done at the request of Modavox as part of
Modavox’s settlement
discussions with X. We also understand that this information can be used solely
for the purposes of settlement and is considered highly confidential, and is not
to be used for any other purposes.
We have
been instructed to determine a preliminary value of Modavox as it relates to
their ownership of the patented technology. This includes an analysis of their
current business, the yet un-monetized value of the patented technology as well
as the value of the overall litigation
to X and value of the technology throughout the industry.
We have
determined the preliminary value of the Modavox patent portfolio as referenced
above. Based upon multiple analyses we have determined the preliminary value of
the litigation with X to be approximately $146 million. In addition, we have
determined that the value of the entire Modavox entity is between approximately
$525 million and $575 million, which includes utilizing the technology for
business purposes as well as for litigation.
1.1 Standard of Value
Fair
market value is generally defined as “the price at which the property would
change hands between a willing buyer and a willing seller, neither being under
any compulsion to buy or sell and both having reasonable knowledge of relevant facts.”1
1 Treasury Regulation
Section 1.170A-1(c)(2)
3
2. DESCRIPTION
OF MODAVOX AND THE PATENTED TECHNOLOGY
2.1 Description of Modavox, Inc.
Founded
in 1999, Modavox provides content targeting and consumer centric content
delivery technologies through internet products and services.2 The name Modavox, Inc. was
created
in 2006 as a result of the merger between SurfNet Media and Kino Communications.3
Founder and current board member David Ide saw the need for real-time delivery of online customized content customization and created Modavox to fill those needs in the industry. Modavox is a publicly traded company, and its shares have been listed on the NASDAQ exchange since 2001.4
Modavox owns the “Method and System for Adding Function to a Webpage” portfolio of patents, which teach of a technical process and method which are in an indispensable component of the behavioral targeting industry as it exists today. Powered by Modavox’s inventions, behavioral targeting facilitates the automatic provision of customized content to individuals based on their web activity and preferences.5 Modavox’s business revolves around three core divisions: BoomBoxTM Technologies, which streams internet radio and television programs; Interactive Communications, which provides behavioral targeting services to websites and internet companies; and Mobile Solutions, which focuses on mobile marketing solutions, including behavioral targeting.6
2.2 Description of Patents
Modavox
currently owns at least two U.S. patents. The first patent, US Patent No.
6,594,691, was issued on July 15, 2003, and is titled “Method and System for
Adding Function to a Webpage.” The second patent, US. Patent No. 7,269,636, was
issued on September 11, 2007 and is titled “Method and code module for adding
function to a Web page.”
The patented methods and systems use web browsers which adhere to the standards for Hypertext Transfer Protocol (HTTP) and add function to a web page through an easily distributed software code module. The method and system deliver services through client demands that are specific to predetermined visitor parameters. When a web page is downloaded, the technology automatically executes a first code module embedded in the web page. The first code module issues a first command to retrieve a second code module, via a network connection, from a server system, which assembles the second code module with a service response. When assembled, the second code module is executed at the user processor platform and delivers a tailored response targeted to the end user's parameters. The technology enables this process to be performed in real time during the download of the webpage."7
2 Modavox, Inc. Form 10-K, February 28, 2009
3 Modavox, Inc. Form 8-K, March 5, 2007
4 Form SB-2, March 28, 2001
5 Ibid.
6 “Modavox
Company Profile” http://www.modavox.com/
7 U.S. Patents 6,594,691 and
7,269,636
4
2.3 Description of the Patented Technology
Modavox’s developments in customized content delivery have produced a complete product line designed to capture, captivate and maximize effective communication to targeted audiences. This essentially means that an end-user accessing a website can be delivered video, audio, and other content that is customized based on geographic location, gender, age, or any other predetermined parameter in real time. This system has been used across several platforms, including e-learning, advertising, internet radio and television broadcasting, and enterprise platforms.9
In 2009, Modavox acquired Augme Mobile, which developed a web-based platform that provides marketers, brands and advertising agencies the ability to create, deliver, manage and track interactive marketing campaigns targeting mobile consumers.10 The Augme Mobile platform uses SMS, two-dimensional (2D) code, image recognition, audio detection and other leading technologies as a suite of interactive consumer response mechanisms that link mobile consumers to targeted and interactive mobile marketing content.11
8 “Modavox Company Profile”
http://www.modavox.com/
9 “Modavox Company Profile”
http://www.modavox.com/
10 “Modavox Completes
Acquisition of Augme Mobile”, http://www.quotemedia.com/
11 “Augme Mobile Launches
Personalized Mobile Marketing Campaign for Colgate-Palmolive’s
Speed
Stick
Brand”, http://www.quotemedia.com/
5
3. INFORMATION
RELIED UPON AND CONSIDERED
In
forming our preliminary opinion of fair market value, we have considered and
relied upon, without independent verification, documents and information
provided by the Company
or
obtained through publicly available resources. The following is a list of the
primary information (including Bates stamped numbers) provided by
Modavox
and
relied upon in our analysis:
Discussions
with representatives of Modavox, including:
|
·
|
Shelly
Meyers, Chairwoman of the Board of Directors
|
|
·
|
Anthony
Iacovone - Chief Innovation
Officer & President Augme Division
|
|
·
|
Nathaniel
T. Bradley - Chief Technology
& Product Officer
|
Other
publicly available information, including but not limited to:
|
·
|
X
Annual Report 2008
|
|
·
|
RoyaltySource
Database Search for similar industry licensing
agreements
|
|
·
|
Various
reports and websites as referenced in the report.
|
|
·
|
“Some
Predictions for Online Advertising in 2009”, Seeking
Alpha
|
|
·
|
“Behavioral
Targeting: Marketing Trends,” eMarketer, June
2008
|
|
·
|
"Mobile
Advertising: After the Growing Pains,” eMarketer, March
2008
|
In
addition to the information provided, we relied upon discussions with and
Modavox senior management ; and considered, when possible, the history
and nature of the patented technology and Company, the industry in which it
operates, its financial situation and current prospects. New information or
unforeseen market and business changes could affect estimates made in this
valuation.
6
4. THE
ECONOMIC ENVIRONMENT
When
valuing a company or its assets, it is important to consider the condition of,
and outlook for, the economy or economies in which the company operates and
sells its products and services. This economic analysis is required because the
financial performance, and, consequently the value, of a company or its assets
are affected to varying degrees by the economic environment in which the company
operates.The following sections provide a brief discussion of the economic
condition and outlook for the US economy over the next five years.
4.1 Gross Domestic Product
The most
widely accepted measure of overall economic growth is GDP, a measure of the
aggregate value of all goods and services produced within the country during a
specified time period.12 Real GDP growth is
forecasted to be -1.9% for 2009.13 The Federal
Reserve
predicts
modest positive growth in 2010, followed by a full recovery and higher sustained
growth from 2011 to 2014, after which growth should return to its equilibrium
rate of 2.5% to 2.7% annually.14
Table 4.115

As
investment growth slows due to numerous market factors, unemployment and
personal savings rise slightly and private consumption decreases.16 The
current economic conditions will most likely cause an extended period of
decreased consumption and production until unemployment stabilizes at a lower
rate and both households and companies become more comfortable with spending and holding inventories. When the economy rebounds, it is possible that advertisers may be willing to pay higher CPM rates in exchange for the higher return on investment that behaviorally-targeted advertising offers.18
12 Economic Terms
Glossary, http://www.economist.com/
13 “The Budget and
Economic Outlook: Fiscal Years 2009 to
2019” http://www.cbo.gov/
14 “The Budget and
Economic Outlook: Fiscal Years 2009 to
2019” http://www.cbo.gov/
15 “The Budget and
Economic Outlook: Fiscal Years 2009 to
2019” http://www.cbo.gov/
16 “Economic Effects of
Increasing Tax Rates” http://www.heritage.org/
7
4.2 Consumer Spending
Consumer spending is a key economic figure that indicates the level of private consumption in the US.19 Because consumer spending drives a large part of the American economy, this index is an important indicator of overall economic health.20 As spending recovers, capital expenditures should increase simultaneously. Companies and advertisers may be willing to spend more on behaviorally-targeted advertising to win consumers, as behavioral targeting creates campaigns that are “more likely to sway the audience”.22
2008
marked the first decrease in consumer spending after nearly 7 years of
consistent spending increases, and spending continued to drop through the rest
of 2008 and first half of 2009.23 It is my understanding
that it is unlikely that consumer spending will increase dramatically in the
near future, as households will continue to be cautious about unnecessary
expenditures until discernable economic recovery is seen.24
4.3 Employment
as
companies continue to be conservative with hiring as the economy recovers.29 By 2014,
employment should be steady at near-equilibrium rates, which will allow the
economy to obtain current growth projections, and may help increase behavioral targeting revenue.30
17 “Minutes of the Federal
Reserve Open Market Committee”
http://www.federalreserve.gov/
18 “Behavioral Targeting:
Marketing Trends”, David Hallerman. eMarketer, June 2008,
p. 2
19 Economic Terms
Glossary, http://www.economist.com/
20 “Economic Performance:
Doubts remain about the strength
of consumer demand”, http://www.eiu.com/
21 “Economic Performance:
Doubts remain about the strength
of consumer demand”, http://www.eiu.com/
22 Behavioral Targeting:
Marketing Trends”, David Hallerman. eMarketer, June 2008,
p. 9
23 “Economic Performance:
Consumer Confidence is at a record low”, http://www.eiu.com/
24“Economic Performance:
Doubts remain about the strength of consumer
demand”, http://www.eiu.com/
25 “Economic Performance:
Recent Indicators Point to the End of Recession”,
http://www.eiu.com/
26 “Economic Performance:
Recent Indicators Point to the End of Recession”,
http://www.eiu.com/
27“Labor Force Statistics
from the Current Population
Survey,” http://data.bls.gov/
28 “Labor Force Statistics
from the Current Population
Survey,” http://data.bls.gov/
29 “A Preliminary Analysis of
the President’s Budget and an Update of CBO’s Budget and Economic
Outlook”,
http://www.cbo.gov/
30 “A Preliminary Analysis of
the President’s Budget and an Update of CBO’s Budget and Economic
Outlook”,
http://www.cbo.gov/
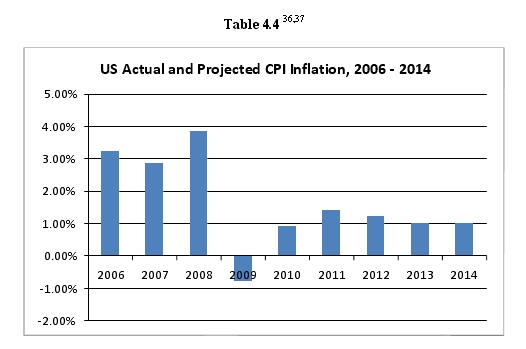
8

4.4 Inflation
Inflation
is a measure of the increase in prices in the market, and is typically measured
by the Consumer
Price Index (“CPI”) and the Producer Price Index (“PPI”).31 The CPI
measures the consumer’s cost of consumption and the PPI measures the average
change over time in the selling prices received by domestic producers for their
output.32,33 Inflation held steady at the
beginning of the decade but dropped into deflation in 2009 due to the widespread
Recession.34 When the
economy begins to recover, inflation will increase significantly, and the
Congressional Budget Office predicts inflation will grow at a rate slightly
above 1% over the next five years35
31 Economic Terms
Glossary, http://www.economist.com/
32 “Consumer Price
Index”, http://www.investopedia.com/
33 PPI Index, http://www.bls.gov/
34 “Consumer Price Index Data
from 1913 to 2009”, http://www.usinflationcalculator.com/
35 “A Preliminary Analysis of
the President’s Budget and an Update of CBO’s Budget and Economic
Outlook”,
http://www.cbo.gov/
9
4.5 Interest Rates
Interest
rates indicate the overall state of US debt markets. Current US interest rates
are at historical lows in order to stimulate borrowing and encourage economic
growth.38 The prolonged period of
cheap debt in the middle of this decade resulted in a credit crunch that
began in
mid-2007 and has yet to recede.39 1-month Treasury bill
rates averaged nearly zero in late 2008 and throughout 2009.40 Similarly, 10-year
Treasury note rates have fallen as investors flocked to the safety of Treasuries and the Federal Reserve pumped billions of dollars into Treasury bonds to keep rates low.41
Bank
interest rates spiked in 2007 and continued to increase through 2008, which led
to the recession and the Federal Reserve’s dramatic cut of the federal funds
target rate to 0-0.25%. The Fed is expected to hold this rate steady for the
next 12 to 18 months, indicating that economic recovery will be slow and
prolonged.42,43 Low interest rates will be
necessary over the next
12 to 24 months to ensure that banks will lend and companies can borrow.
Companies that publish and create behaviorally-targeted advertising may depend
on these low rates to continue funding their operations through the
recession.
36 “A Preliminary Analysis of
the President’s Budget and an Update of CBO’s Budget and Economic
Outlook”, http://www.cbo.gov/
37 “US Inflation”, www.inflationdata.com
38 “Outlook
for 2009-10: Monetary Policy”, http://www.eiu.com/
39 “Economic Policy: Mr.
Bernanke’s term as Fed Chairman is to be renewed”,
http://www.eiu.com/
40 Daily 1-month
Treasury bill rates, http://www.federalreserve.gov/
41 “Economic Performance: A
surge in long-term yields are a threat to recovery”,
http://www.eiu.com/
42 “Federal Reserve Leaves
Interest Rates Near Zero”, http://www.latimes.com/
43 “Economic Policy: Market
Expectations of Hikes are Misguided”, http://www.eiu.com/
10
5. INDUSTRY OVERVIEW44
5.1 Advertising
The advertising industry has suffered in the recession as companies have slashed marketing expenditures to save cash.45 Total advertising expenditures dropped 14% from 2008 to 2009, and that spending will continue to decrease in 2010 before picking up again in 2011.46 Internet advertising has fallen at a slower pace than traditional forms of advertising, as internet ads have higher ROIs and can be targeted more easily to the consumer.47

Online
advertising is a form of marketing that expressly utilizes the World Wide Web
(“internet”) to deliver product information and messages to attract customers.
There are many differing forms of online advertising utilized in today’s market
place. Several examples are contextual ads (that utilize key word search
technology) displayed on search engine results pages, banner ads, Rich Media
Ads, social networking advertising, online classifieds
and email spam, among others. Though projections and beliefs in early 200850 were
that online advertising would be able to “power through any broader economic and
advertising weakness,”51 this has not come to
fruition as the online advertising market has also experienced the backlash of the recent economic downturn. However, the behavioral targeting portion of the market is seen as a means for increasing the effectiveness of online advertising because it has generally higher click through and conversion rates.52
44 Unless otherwise
indicated, information for this section provided by eMarketer, “Behavioral
Targeting: Marketing Trends”
45 “Nothing to shout about:
things are still getting worse for the advertising industry,”
http://www.economist.com/
46 “Nothing to shout about:
things are still getting worse for the advertising industry,”
http://www.economist.com/
47 “Nothing to shout about:
things are still getting worse for the advertising industry,”
http://www.economist.com/
48 “Behavioral Targeting:
Marketing Trends,” eMarketer, June 2008
49 :”U.S. Advertising
Spending”, eMarketer, June 2008
11
5.2 Online Behaviorally Targeted Advertising
Behavioral
targeting is an online technique that utilizes software and hardware methods to
serve advertisements to specific internet viewers. This technology segments the
target audience based upon observed content and measured data. This is a data
driven process and the quantity of data is important in obtaining accurate
information about the viewer so that appropriate advertising can be delivered in
real time. Behavioral targeting has the potential to become the most
valuable and most often utilized form of online advertising. There are several
reasons that behavioral targeting holds significant underlying value, which
include:
|
·
|
Behaviorally-targeted advertising campaigns are more likely to sway targeted audiences53
|
|
·
|
Publishers may make more money from previously unsold advertising inventory54
|
|
·
|
The processes that make up behavioral targeting are complex and technologically
advanced55
|
|
·
|
Behavioral targeting provides companies extremely valuable data56
|
|
·
|
Behavioral targeting will likely be used by large companies as a facet of an overall marketing plan, in addition to being used as solely an online advertising medium57
|
|
·
|
Online advertising and behavioral targeting are seen as “glimmer[s] of hope in the recession”58
|
Due to
the continuing development of technologies that drive the behavioral targeting
market, the US market size was approximately $775 million in 2008. However,
based upon projections and a return to growth of the overall economy, this
amount is projected to exceed $4
billion by 2012. The marked increase in the size of this market is due to the
following:
|
·
|
behavioral targeting’s greater effectiveness for both branding and direct response objectives will draw in more marketers despite concerns for transparency59
|
|
·
|
brand marketers are shifting a higher portion of their advertising budget to the internet space, but this won’t have a significant impact until 201060
|
50 “US Online Ad
Market Expected to Double in
Four Years”, http://www.informationweek.com/
51 “Let’s be
serious: Online Display Ads will fall sharply in 2009”, http://www.businessinsider.com/
52 “Will the Recession
Kill Web 2.0”, http://online.wsj.com
53 “Behavioral Targeting:
Marketing Trends,” eMarketer, June 2008
54 “Behavioral Targeting:
Marketing Trends,” eMarketer, June 2008
55 “Behavioral Targeting:
Marketing Trends,” eMarketer, June 2008
56 “Behavioral Targeting: Marketing
Trends,” eMarketer, June 2008, p. 5
57 “Behavioral Targeting: Marketing
Trends,” eMarketer, June 2008, p. 8
58 “New Dynamics in
Digital Advertising”, http://www.reportlinker.com/
59 “Behavioral Targeting:
Marketing Trends,” eMarketer, June 2008
60 “Behavioral Targeting:
Marketing Trends,” eMarketer, June 2008
12
|
·
|
by 2012, online video advertising will be firmly established.61
|
Even when
the behaviorally targeted advertising market reaches $4.4 billion, it will only
represent approximately 9% of the total online advertising market still leaving
plenty of room for growth in the next decade. Behavioral targeting technology is
expected to advance and expand in the next few years, most notably into the
mobile arena.
5.3 Mobile Behavioral Targeting Advertising
Mobile behavioral targeting is an emerging form of advertising that uses behavioral targeting technology to deliver content through mobile devices.62All four major internet portals—
currently offer mobile advertising solutions.63Modavox added a mobile component to its portfolio in 2009 when it merged with Augme Mobile.64
Mobile advertising uses the same types of advertisements as traditional online advertising, but uses a chip inside of a cell phone or PDA rather than collecting data through webpage visits.65 The chip harnesses consumer information and preferences and targets advertisements based on these preferences66 granting access to consumers through a new, more profitable channel.67
61 “Behavioral Targeting:
Marketing Trends,” eMarketer, June 2008
62 “Behavioral Targeting: Marketing
Trends,” eMarketer, June 2008, p. 5
63 “Behavioral Targeting:
Marketing
Trends,” eMarketer, June 2008, p. 15
64 “Modavox Completes
Acquisition of Augme Mobile”, http://www.quotemedia.com
65 Conversation with Anthony
Iacovone
66 Conversation with Anthony
Iacovone
67 Conversation with Anthony
Iacovone
13
6. VALUATION
METHODOLOGY
6.1 Premise of Value
As
discussed earlier, Kenrich Group’s assignment was to determine settlement values
for the X litigation and the fair market value of Modavox as of October 1,
2009.
Our
analysis focused on identifying and quantifying what sellers and buyers consider
when negotiating for the sale or license of assets, specifically, the economic
value that the buyer gains by taking ownership of the assets or rights to the
assets, and the economic value that the seller gives up by transferring
ownership of, or certain rights to, the assets to another party.
6.2 Methods for Determining Value
There are
three basic, generally accepted approaches for valuing a business or
asset:
|
·
|
Income
approach
|
|
·
|
Market
approach
|
|
·
|
Cost
approach
|
These
approaches utilize the line of reasoning a prudent investor would follow in
estimating the value of an asset. The appropriateness of a particular approach
varies with the specific asset valued and the available information. When more
than one approach to value is appropriate, it is necessary to reconcile the
approaches and weigh the results in consideration of the asset being valued to
determine FMV.
14
Table
6.2: Summary of Valuation Analyses
|
Scenario (in millions)
|
Low
|
High
|
||||||
|
X Litigation/Licensing Value (Online)
|
$ | 146.3 | $ | 146.3 | ||||
|
Value
of Patent Portfolio
to X Internally
and the Industry Litigation Value (Online)
|
||||||||
|
Industry
Litigation Value for the Online Behavioral Targeting (Not Including X
)
|
$ | 693.5 | $ | 1,456.7 | ||||
|
Value
to X Internally (Increased Profit) of Patent
Portfolio
to X (Online
only)
|
$ | 570.0 | $ | 570.0 | ||||
|
Sub-Total: Value of Patent Portfolio for X Internally and Industry Litigation (Not Including
X ) (Online)
|
$ | 1,263.5 | $ | 2,026.7 | ||||
|
Value
of Patent Portfolio
for X Internally
and Industry Litigation (Mobile)
|
||||||||
|
Industry
Litigation Value: Mobile Behavioral Targeting
|
$ | 142.0 | $ | 524.2 | ||||
|
Value
to X Internally (Increased
Profit) of Patent Portfolio
to X (Mobile
only)
|
$ | 112.6 | $ | 188.3 | ||||
|
Sub-Total:
Value of Patent Portfolio and Industry Litigation (Mobile)
|
$ | 254.6 | $ | 712.6 | ||||
|
After-tax
Value to Online Behavioral Targeting Industry Internally (Increased
Profit)
|
||||||||
|
Value
of Patent Portfolio to Industry (Online Only)
|
$ | 5,001.0 | $ | 5,001.0 | ||||
|
25%
Rule of Thumb
|
25 | % | 25 | % | ||||
|
25%
Profit Split Apportionment Value
|
$ | 1,250.2 | $ | 1,250.2 | ||||
|
After-tax
Value to Mobile Behavioral Targeting Industry Internally (Increased
Profit)
|
||||||||
|
Value
of Patent Portfolio to Industry (Mobile Only)
|
$ | 1,315.4 | $ | 1,315.4 | ||||
|
25%
Rule of Thumb
|
25 | % | 25 | % | ||||
|
25%
Profit Split Apportionment Value
|
$ | 328.9 | $ | 328.9 | ||||
|
Total
Value
|
||||||||
|
Value
of X Litigation/Licensing
|
$ | 146.3 | $ | 146.3 | ||||
|
Value
of Acquisition of Modavox
|
$ | 1,518.0 | $ | 2,739.3 | ||||
6.3 Income Approach
The
income approach measures the value of a business by the present value of its
future economic benefits over its remaining economic life. These
benefits can include earnings, cost savings, tax deductions and proceeds from
its disposition.
The
duration and timing of the cash flow stream are determined by forecasting the
useful life of the asset. The useful life of the asset can be determined in many
ways, several of which include: (1) the physical or service life of the asset,
(2) the statutory or legal life of the asset, (3) the economic life of the asset
or (4) the functional or technological life.
The
primary method under the income approach is referred to as the discounted cash
flow (“DCF”) method and involves discounting expected cash flows to their
present value at a rate of return that incorporates the risk-free rate for the
use of funds, the expected rate of inflation and risks associated with the
particular investment.
The
business risk associated with the realization of the stream of expected cash
flows may be captured through the use of an appropriate discount rate,
probabilities of success within the inputs used to forecast the cash flows or
through a combination of these factors. The discount rate selected is generally
based on rates of return available from alternative investments of similar type
and quality as of the valuation date.
When the
valuation of an entity in which the primary source of value is an intellectual
property asset, the Relief-from-Royalty Approach is frequently used. The
following report section provides a discussion of this approach and how it may
be used to quantify the expected cash flows attributable to intellectual
property assets.
15
6.3.1 Relief-from-Royalty Approach
The
Relief-from-Royalty Approach determines a property’s value by looking at what
the owner of the property would pay in royalties if he did not own the property
and had to license it from a third party. This approach can be used to quantify
the royalties a company would have to pay for the rights to license their own
intellectual property.
The
lump-sum fair market value of the intellectual property under this method is
calculated as the net present value of royalty payments. The projected royalty
payments are derived by applying a royalty rate to an appropriate royalty
base. The royalty base is generally established by forecasting the
expected revenues to be generated throughout the useful life of the intellectual
property. The royalty rate is generally a percentage rate that establishes the
potential cash flow that can be associated with the intellectual property. The
royalty rate is determined by what a licensee would be willing to pay for use of
the intellectual property.
6.3.1.1 Methods for Determining the Royalty Base
Revenue
Approach
Product and services protected by Intellectual Property rights have been used to enhance market share, to create and expand the market as a whole, and to increase sales prices. In such situations, revenue increases may be an appropriate basis determining an appropriate royalty base. The primary economic benefits of the subject patent(s) are maintained/increased revenues due to enhanced customer loyalty and due to more effective sales efforts to potential new customers.
Cost
Savings Approach
The cost
savings approach is not applicable to the present situation because the benefits
provided by the patented technology are not related to cost
savings.
6.3.1.2 Methods for Determining the Royalty Rate
Market
Approach
The
Market Approach to valuation may be appropriate in determining a royalty rate
because the approach looks at actual arms-length transactions that have been
negotiated between willing buyers and willing sellers. Kenrich Group used
RoyaltySource and RoyaltyStat as its sources for market licenses in the
industry.
Excess
Earnings Approach
The
Excess Earnings Approach is based on the idea that a property’s value can be
assessed by the incremental earnings of proprietary products/service relative to
an identical but non- proprietary product/service. As used in this context, a
proprietary product/service is one that represents the property under
consideration. The excess earnings could result from the product/service
demanding a price premium, increasing manufacturing cost savings, or producing
larger sale quantities.
Profit
Apportionment Approach
The
Profit Apportionment Approach is a method used to determine a reasonable royalty
under an arm’s length transaction. The idea behind this approach is that the
licensee and licensor should share the anticipated profit. Several methodologies
have been used or suggested for achieving an appropriate profit split between
parties. Most of these approaches attempt to create a division of anticipated
profit that is appropriate with the nature of the intellectual property and
risks assumed by each party.
Profits
have been apportioned using both objective and subjective methods. Objective
methods generally focus on the licensee’s required return on capital invested or
assets used to utilize the intellectual property. In the case of licensing
intellectual property assets, there are several rules of thumb that are used
when determining a profit split. One of these rules of thumb is referred to as
the 25% Rule. The 25% Rule tends to be a starting point in licensing
transactions and should be increased or decreased depending on the particular
situation.
16
6.4 Market Approach
Asset
values calculated by using the Market Approach are derived from utilizing
comparable asset transactions between unrelated parties. The weight that a
comparable asset transaction holds is largely dependent upon if the transaction
is sufficiently similar to the assets at issue. There are several factors that
should be considered when assessing if a comparable asset transaction is
sufficiently analogous to the proposed transaction involving the parties in
question such as: the nature of the industry the assets are utilized in, the
terms of the transaction and/or agreement, the actual assets involved in the
transaction, the circumstances surrounding the parties in the comparable asset
transaction, and other elements that would affect the transaction or agreement
terms.
The
Market Approach is useful in that it references actual arms-length transactions
between a willing buyer and willing seller. Therefore, it can result in creating
a useful proxy for the value of the assets in question, and can be an important
method for determining the significance of asset value.
6.5 Cost Approach
The cost
approach measures the value of a business or asset by the cost to create and
develop the assets under consideration or the cost to replace it with another of
like utility. The assumption underlying this approach is that a party would not
pay more than the cost to purchase or develop new property that has the same
value.
When applied to the valuation of intellectual property, the cost approach may be used when a functionally equivalent non-infringing alternative may be reproduced or replaced.68 The cost of reproduction or replacement may also reflect the cost a company may avoid by buying, rather than duplicating, a similar technology.69
The cost
approach may have certain limitations such as it may lack consideration for all
elements of future income or profit streams, market considerations, useful life
and the risk associated with realizing future benefits. Due to the limitations
of the cost approach, we did not use it in our consideration of value for
Modavox.
68 Smith, Gordon
(2005) Intellectual Property: Valuation, Exploitation and Infringement Damages
69 Reilly & Schweihs
(1999) Valuing Intangible Assets, p. 96-97
17
7. VALUATION
METHODS APPLIED
In a
valuation study, all three approaches to value may need to be considered, as one
or more may be more appropriate in valuing a business or asset. The
appropriateness for the various valuation approaches in valuing the assets of an
entity varies with the particular company and industry.
For the
purpose of the present valuation, fair market value estimates were established
through application of the income approach using the discounted cash flow
method. We also
reviewed
the market approach utilizing the comparable transaction method. However, this
method was altered as the value that could be obtained by Modavox has been
greatly hindered by the large amount of infringement that has occurred
throughout the industry.
In
regards to the income approach, we determined value under several different
analyses, including the preliminary value of the damages likely to result in
litigation with X the preliminary value of X litigation associated with the
remaining allegedly infringing behavioral targeting in the industry, the
preliminary value of X’s utilization of the behavioral targeting patents in
their business operations, the preliminary value of the mobile behavioral
targeting industry litigation as well as the preliminary value of the patent
portfolio as utilized by the mobile advertising industry and by X in the
ordinary course of their business.
18
8. PRELIMINARY
BUSINESS ENTERPRISE VALUE OF MODAVOX
8.1 The Income Approach
8.1.1 Preliminary X
Litigation/Licensing Value
In
determining the preliminary value of the X litigation
for
we have
utilized the Income Approach and segmented the analysis into the following
sections:
1. Quantification
of royalty base – revenues from US Sales of X products utilizing the patented
technology
2. Establishment
of an appropriate royalty rate – a percent of sales
3. Accounting
for risk
8.1.1.1 Royalty Base
The first
step in determining the preliminary settlement amount was to determine a
reasonable preliminary royalty base. Based upon financial information we
obtained from publicly-available sources as well as independent research
performed, we estimated the preliminary amount of revenues which were relevant
for royalties related to the patented technology.
To
determine the appropriate preliminary royalty base we needed to determine which
revenues generated by X would utilize the patented technology. Secondly, we
needed to determine the percentage of these revenues that would be further
increased through use of the technology. Finally, we needed to determine the
amount these specific revenues would be increased. By performing the above three
tasks, we were able to obtain the preliminary royalty base that would be
applicable to use in regards to the patented technology. Based upon this
preliminary analysis, it was determined that the patented technology would be
used by some portion of X’s Media and Third Party Network revenues.
In order
to determine projected yearly revenue growth for these two segments, we utilized
overall projected growth for the online advertising industry as provided by a
recognized industry source, Seeking Alpha.70 We then applied this
growth rate to the total revenues obtained in X’s Media and Third Party Network
segments. For the year 2009, we annualized the average results obtained during
the first two quarters. We then applied the above methodology to obtain a
preliminary value of the litigation (including amounts for future
licensing).
We
understand that the economy did enter a recession after the projections we
utilized were published. However, it is our understanding that this would have a
minimal impact on the projections for the following reasons:
|
|
·
|
the increased effectiveness of behaviorally targeted advertising – advertisers want advertising that will reach their target audience71
|
70 “Some Predictions for Online Advertising in 2009”, http://seekingalpha.com/
71 “Behavioral Targeting”,
http://www.emc.com
19
|
|
·
|
the relatively low percentage that behavioral advertising represents in regards to total advertising – larger percentage growth is easier to obtain when the revenue base is small.72
|
Though
the overall growth of the behaviorally targeted advertising market is far
greater than the total online advertising market, the behaviorally targeted
market is still in relative infancy. As such, we believe the projections we have
utilized are conservative with the results that have been or will be obtained by
this market.
8.1.1.2 Royalty Rate
8.1.1.2.1
Comparable Patent Licensing Agreements
To
determine an appropriate preliminary royalty rate to value the subject patents,
Kenrich employed the Market Approach and used indicia of value from the Excess
Earnings Approach. The Market Approach values assets based on comparable
transactions between unrelated parties. Hence, in the context of determining a
reasonable royalty rate, use of the
Market Approach entails searching for negotiated royalty rates from licensing transactions for similar assets. We identified multiple license agreements for patents in the related industry to establish an appropriate royalty rate. The table below provides a summary of the identified agreements at this time.73
Table 8.1: Licensing Agreements of Similar Companies
|
Royalty
Rate
|
||||||
|
Licensee
|
Licensor
|
Low
|
High
|
|||
|
VALUECLICK
EUROPE LIMITED
|
VALUECLICK,
INC.
|
5.00%
|
5.00%
|
|||
|
AMERICOM
USA, INC.
|
SYSTEAM
SPA
|
8.00%
|
8.00%
|
|||
|
HIGH
SPEED NET SOLUTIONS, INC.
|
SUMMUS
LTD
|
10.00%
|
10.00%
|
|||
|
VALUECLICK
JAPAN INC.
|
VALUECLICK,
LLC
|
10.00%
|
10.00%
|
|||
|
MIND2MARKET,
INC
|
UINFO
INTERNATIONAL, INC.
|
10.00%
|
10.00%
|
|||
|
E-CENTIVES,
INC.
|
BRIGHTSTREET.COM,
INC.
|
10.00%
|
10.00%
|
|||
|
Mode
|
10.00%
|
10.00%
|
||||
The
license agreements listed in the table above include a variety of those related
to the industry of concern and indicate a royalty rate of 10%.
8.1.1.2.2
Excess Earnings Approach
The
Excess Earnings Approach has been used to calculate an implicit royalty rate
from the excess earnings from the use of the patented technology. In order to do
so, Kenrich made use of the 25% rule as mentioned previously to calculate the
implied rate and compare to the rate(s) utilized in determining the preliminary
value of the patented technology.
We
analyzed the total profitability of the industry and found it to be
approximately $5.0 billion, 25% of which is $1.25 billion.
72 “Behavioral Targeting:
Marketing Trends,” eMarketer, June 2008
73 Royalty Source
intellectual property database by AUS Consultants.
20
In order
to determine a preliminary royalty rate using the Profit Apportionment of Excess
Earnings Method, a common rule of thumb used in licensing negotiations for
intellectual property assets is the 25% Rule. The 25% Rule states that 25% of
the profits or cost savings resulting from the intellectual property assets
should go to the licensor. The rationale for this approach is to provide the
licensee with the majority of the profits for undertaking resultant business
risks associated with developing and selling the product. The 25% Rule tends to
be a
starting point in licensing transactions, and the profit split can be higher or
lower depending on the particular facts and circumstances of the intellectual
property to be licensed. The negotiated partition of profits should ultimately
reflect each party’s contribution to the venture
or, in this case, the relative importance of the patents to the revenue
generating abilities of the potential buyer.
After
excess earnings are established, a portion of this excess must be allocated to
the licensor. Kenrich Group utilized a 25% apportionment to the licensor, based
on the “25% rule of thumb,” to value the patents. The following table provides a
summary of our royalty rate analysis.
Table 8.2: 25% Rule Calculation
|
Total
(2009-2018)
|
||||
|
Total
Revenue Increased*
|
$ | 4,159 | ||
|
25%
Rule Increased Profitability*
|
$ | 520 | ||
|
Percentage
Revenue Enhanced
|
12.50 | % | ||
|
*in
millions
|
||||
Based on
the 25% rule of thumb applied to the excess profits, the resulting royalty rate
exceeds the percentage of additional revenue, at approximately
12.5%.
As
displayed above, there is a range between the rates identified by the Market
Approach above. However, the 10% rate is further reinforced through our
preliminary Excess Earnings Approach.
8.1.1.3 Accounting for Risk – Discount Rate
One of
the fundamental steps in financial valuation is the determination of a lump-sum
value of an asset as of a prescribed date. The methodology in performing such a
calculation is often termed Net Present Value (“NPV”), and this methodology is
well-established. Such NPV calculations depend on two primary factors: the
forecasted revenue stream and associated timing, and the discount rate. In
previous sections, we presented our opinion on the forecasted cash flows. In
this section, we provide our rationale for determination of the discount
rate.
As
mentioned earlier in our discussions of the Income Approach, the discount rate
used in any income-based valuation model should reflect a rate of return on
investment that is appropriate for the type of asset under consideration and for
the party investing in said asset. We examined the Weighted Average Cost of
Capital (“WACC”) for X and others in the industry, where that information was
available. The WACC is a measure of a firm’s cost of funds considering both the
cost of equity (“COE”) and the cost of debt. The results of our analysis are
presented in the following table.
21
Table 8.3: Weighted Average Cost of Capital for Similar Companies 74
|
Company
|
WACC
|
|||
|
AOL
|
8.05 | % | ||
|
Yahoo!
|
10.63 | % | ||
|
Google
|
9.79 | % | ||
|
MSN
|
8.72 | % | ||
|
Baidu
|
11.04 | % | ||
|
Expedia
|
10.74 | % | ||
|
Priceline
|
7.77 | % | ||
|
WebMD
|
10.53 | % | ||
|
United
Health Online
|
8.88 | % | ||
|
Average
|
9.57 | % | ||
Intangible
assets, especially those involved in litigation, are typically riskier than the
overall risk of a company. After
discussions with the counsel for the Company, and based upon the current status
of the litigation in which Modavox is involved, a preliminary discount rate of
25% was selected to bring the royalty income to present value
terms.
8.1.1.4 Preliminary X Litigation/Licensing Valuation Conclusion
Based
upon the royalty rate analysis
and the
fundamental nature of the patents owned by Modavox, we believe preliminary value
obtained using the 10% royalty rate are more appropriate. As such, it is our
opinion that the preliminary value oflitigation with X is approximately $146
million.
8.1.2 Preliminary Litigation Value for the online Behavioral Targeting (not including X)
These
analyses are associated with the preliminary value of the online behavioral
targeting technology patents to X or another major industry player. We
considered the preliminary value of the litigation associated with the relevant
industry, less the litigation value associated with X as discussed
above.
8.1.2.1 Royalty Base
We
determined the preliminary royalty base associated with the industry by
utilizing the eMarketer report referenced above. This report projects the
revenues associated with online behaviorally targeted advertising to be $775
million in 2008 and grow to $4.4 billion in 2012. However, as the patents do not
expire until 2019 at the earliest, we projected preliminary revenues from 2013 –
2019. We believe these estimates to be conservative predicated upon the growth
that is projected from 2008 – 2012. Though the growth may well exceed what we
have projected at this time, it is unlikely that the industry will experience
growth below these projections. As such, we have conservatively estimated the
preliminary royalty base associated with the industry litigation.
74 Bloomberg
22
8.1.2.2 Royalty Rate
We
utilized the same preliminary royalty rates referenced above in our analysis
associated with the X Litigation/Licensing analysis of 10%. Please see above
section for discussion of the royalty rate.
8.1.2.3 Accounting for Risk – Discount Rate
Due to
the infancy of the market, we have utilized discount rates of approximately 35%
and 60% in
order to determine the value associated with the industry intellectual property
litigation.
8.1.2.4 Litigation Value for the online Behavioral Targeting Conclusion
Using the
inputs described above, we have estimated that the total preliminary value of
the litigation revenues minus costs for the industry litigation to fall between
$693.5 million and $1.46 billion.75
8.1.3 Value to X internally (increased profit) of Patent Portfolio (online only)
The
preliminary value under this scenario is directly related the value of the
ownership of the patented technology on an after-tax basis as used by X. In this
method we utilized the Discounted Cash Flows (“DCF”) Method. The DCF Method is
used to estimate the present value of the increased future cash flows of X made
possible by the Modavox patented technology utilized by X. In order to calculate
our projections, we have relied upon the industry projections referenced
previously, research articles produced by industry experts, and
publicly available information. We have analyzed all of this information for
reasonableness and believe that the projections provided reflect the most
current preliminary information available for the purposes of
valuation.
The DCF
analysis using the forecasted future cash flows were prepared on an invested
capital basis. Invested capital refers to the aggregate of all classes of debt
and equity invested in the business. In preparing a DCF analysis on an invested
capital basis, forecasted debt-free cash flow is discounted to present value
using the weighted average cost of capital (“WACC”). Interest expense is
excluded from the forecast as debt-free cash flow represents an economic benefit
that is available to all capital holders of an enterprise.
75 This estimate does not
include the value of the X litigation.
23
Upon
analysis of the relevant and available information, the net cash flow of
Modavox, as operated by X was calculated as follows:
| CF = EBIT - Taxes + Depreciation - Capex =/- Change in NWC | |
|
CF
|
=
Forecasted net cash flow to invested capital
|
|
EB IT
|
=
Earnings before interest a and taxes (operating income)
|
|
Taxes
|
=
Estimated blended State and Federal income tax rate
|
|
Depreciation
|
= Depreciation (if
applicable)
|
|
Cape x
|
=
Required maintenance and deferred capital expenditures (if
applicable)
|
|
NWC
|
= Net working capital
|
In
typical valuations, a terminal value, also termed residual value at the end of
the forecast period is computed through use of an exit multiple or
capitalization of long-term cash flows. However, since patents have a limited
life of 20 years, we did not feel it was appropriate to include a terminal value
in our calculation.
After
adjusting earnings to arrive at net cash flow, it was then necessary to discount
the cash flow to present value at a rate commensurate with the inherent risk
associated with the cash flow. The WACC is predicated upon the general level of
interest rates, plus premiums for business and financial risks. Financial risk
refers to the possibility of bankruptcy and variability of the returns to equity
holders. The discount rate incorporates the level of risk in achieving the
amount of revenue and resulting profitability inherent in the projections. We
have utilized X’s WACC of 8.05% in regards to the risk associated with the
projected cash flows.
At this
time, I understand X is making use of the technology and has been doing so
since
This
usage will only increase with
time. at
this time
insures
of the
ability to continue to use the technology.
If ,
X will be able to decide in the market has access to the patented
technology. As such there is substantial value to X in owning the
patented technology.
8.1.4
Value to X internally (increased profit) of Patent Portfolio (online only)
Conclusion
Based
upon the DCF Method, the fair market value of Modavox is approximately $570
million in additional cash flows when operated under X.
8.1.5 Value of Patent Portfolio and Industry Litigation (Online)
Based
upon the acquisition of Modavox, X may be expected to gain $1.25 billion in
economic value. This value is substantially higher than the value related to
licensing the patents alone.
8.1.6 Value of Mobile Behavioral Targeting Market
The
preliminary value of the patent portfolio when applied to the mobile behavioral
targeting market is substantial and in addition to the value of the online
behavioral targeting market. We first considered the preliminary value
of litigation associated with the relevant
market
24
once
again due to the fundamental nature of the patents. Secondly, we considered the
preliminary value of the technology to X for use internally.
8.1.7 Industry Litigation Value – Mobile Behavioral Targeting Market
8.1.7.1 Royalty Base
The
industry projections provided by Mobile Stance 76 indicate the mobile
advertising market is going to grow from $2.8 billion in 2009 to $6.5 billion in
2012. In order to determine the portion of the total mobile advertising
marketing that will utilize behavioral targeting we have estimated that the
market will grow at a rate similar to that of the adoption of behavioral
targeting in the online advertising market.
8.1.7.2 Royalty Rate
We used
the previously determined royalty of 10% to estimate the litigation value of the
mobile portion. Please see previously discussed section for royalty
rate.
8.1.7.3 Accounting for Risk – Discount Rate
In
regards to the risk associated with obtaining the cash flows related to
litigation, we have utilized discount rates of approximately 33% and 60% in
order to determine the preliminary value associated with the industry
intellectual property litigation.
8.1.7.4 Industry Litigation – Mobile Behavioral Targeting Valuation Conclusion
Using the
variables described above, including the discount rate, royalty rate, and
revenue and cost projections, we estimate the litigation value of the patent
portfolio in the mobile industry to be between $142 and $524.2
million.
8.1.8 After Tax Value of Patent Portfolio to X for Internal Use (Mobile Market Only)
The
preliminary value under this scenario is directly related to the value of the
ownership of the patented technology as used by X in the mobile market. As is
the case when we determined the value of the patent portfolio in regards to X’s
online advertising use, we utilized the more classic approach related to whole
business valuation through use of Discounted Cash Flows (“DCF”) Method, as
explained in section 8.1.
We first
adjusted earnings to arrive at net cash flow, then discounted the cash flow to
present value at a rate commensurate with the inherent risk associated with the
cash flow. The WACC, as stated previously, is predicated upon the general level
of interest rates, plus premiums for business and financial risks. The discount
rate incorporates the level of risk in achieving the amount of revenue and
resulting profitability inherent in the projections. We used X’s WACC of 8.05%
to discount the cash flows.
To obtain
a range of preliminary value for X internally utilizing this technology in the
mobile market, we have used growth rates that would mirror that associated with
the growth of behavioral advertising in the online market. However, based on
discussions with Modavox management, we understand it is likely that adoption of
behavioral advertising in the mobile market may be more rapid than that of the
online market.
76 “Full Coverage: Mobile
Advertising After the Growing Pains”, http://www.mobilestance.com/
25
Because
the market has yet to be firmly established, we have added a preliminary 10%
risk premium to the industry WACC in discounting the appropriate cash flows.
This gives a discount rate of approximately 18%; we believe this is appropriate
given the current state of the market, the projections utilized and the
attributes associated with X. This is comparable to the lower range of return
generally required by venture capital firms.77 This
situation is comparable with less risky venture capital investments as the
overall technology (behavioral
targeting) and market (mobile advertising) are established and are simply being
married
to one another, thus reducing the required rate of return.
8.1.8.1 After-Tax Value of Patent Portfolio to X for Internal Use within the Mobile Market
Valuation Conclusion
Based
upon the DCF Method, the preliminary fair market value of the patent portfolio
to X when applied to Mobile Advertising revenues is approximately $112 million
and $188 million utilized internally by X.
8.1.9 Total Value of Patent Portfolio Internally and Industry Litigation to X (Mobile Market
Only) Summary
Based on
the acquisition of Modavox, X would be expected to gain between $255 million and
$712 million in economic value as a result of use of the patented technology in
the mobile market. This preliminary value is an addition to the value of the
online behavioral targeting market to X. This acquisition would give X the
rights to the patent portfolio as they relate to the mobile behavioral targeting
advertising market.
8.1.10
Preliminary Internal Value of the Patent Portfolio to the Industry for the Online and Mobile Behavioral Targeting Market
The
preliminary value associated with the online patent portfolio for the industry
(less X), of additional revenues on an after-tax basis, is approximately $5.0
billion. Additionally, the preliminary value of additional revenues on an
after-tax basis associated for the mobile industry is $1.25 billion. This
situation represents a significant competitive advantage to any company that
purchases Modavox and provides additional indicia regarding the value of Modavox
in total.
By
purchasing Modavox, X would not only be able to gain value
internally
I
understand they would most likely be able to receive a permanent injunction or
license from their competitors, directly increasing their own market share and
positively impacting the current profitability of this behavioral targeting
program.
8.2 The Market Approach
In
addition to the Income Approach, Kenrich Group also used the Market Approach to
determine the preliminary fair market value of the subject patents. The market
approach to valuation is a general way of developing a value indication of a
business by using one or more methods that compare the subject company to
similar businesses, business ownership interest and securities (investments)
that have been sold. A popular method used in the Market Approach is to consider
comparable asset transactions from unrelated parties.
77 "The Discount Rate
Used by Venture Capital Funds", http://e-articles.info/
26
The
weight that a comparable asset transaction holds is largely dependent upon if
the transaction is sufficiently similar to the assets at issue. There are
several factors that should be considered when assessing if a comparable asset
transaction is sufficiently analogous to the proposed transaction involving the
parties in question such as: the nature of the industry the assets are utilized
in, the terms of the transaction and/or agreement, the actual assets
involved
in the transaction, the circumstances surrounding the parties in the comparable
asset transaction, and other elements that would affect the transaction or
agreement terms.
The
Market Approach is useful in that it references actual arms-length transactions
between a willing buyer and willing seller. This method only applies to the
value of the Company and is not
related to any revenues from potential litigation that may be
pursued.
8.2.1 Comparable Transaction Analysis
We
considered a number of transactions within the online behaviorally targeted
marketing industry that occurred within the past couple of years. Based upon our
research, we identified six transactions during this period in which the
transactions terms were disclosed. A summary of the transactions is presented in
the table below.
Table 8.4: Comparable Transactions
|
Acquirer
|
Acquired
|
Purchase Price
|
Date
|
||||
|
Yahoo!
|
Overture
|
$ | 1.73B |
July
2003
|
|||
|
Google
|
DoubleClick
|
$ | 3.2B |
April
2007
|
|||
|
Microsoft
|
aQuantive
|
$ | 6B |
May
2007
|
|||
|
AOL
|
Tacoda
|
$ | 275M |
September
2007
|
|||
|
Yahoo!
|
BlueLithium
|
$ | 300M |
September
2007
|
|||
|
AOL
|
Quigo
|
$ | 340M |
November
2007
|
|||
|
Median
|
-
|
$ | 1,035M |
-
|
|||
From April to November 2007, significant consolidation took place in the online advertising industry. All four major internet players—AOL, Google, Microsoft, and Yahoo!—purchased companies with large online advertising platforms and targeting abilities. In total, over $10 billion in transaction activity occurred in those seven months.78
AOL bought Tacoda in September 2007 amid the frenzy of advertising consolidation among the big four internet players.79 Both Tacoda and Quigo were acquired to add to X’s Platform-A (now X Advertising), an online advertising platform that allows advertisers to display contextually-targeted advertisements and gives them superior data analytics.80 The Tacoda and Quigo acquisitions allow X to collect data and target specific individuals based
on their internet search habits.81
78 See table 8.4
http://www.clickz.com
80 , http://www.reuters.com/
http://www.reuters.com/
27
In order to increase its competitiveness in the advertising market, Google purchased DoubleClick in April 2007.82 The acquisition gave Google a large network of advertising buyers and sellers, as well as enhanced display advertising abilities.83
Microsoft enhanced its advertising platform with its acquisition of aQuantive in 2007.84 The firm both owns advertising agencies and develops online advertising tools and platforms; it was purchased by Microsoft to keep up with Google’s and Yahoo!’ in the advertising market after both companies completed similar transactions.85
In 2003, Yahoo! bought Overture in order to enhance its search engine to compete with Google in the search market. Yahoo! later acquired BlueLithium to broaden and enhance its targeting and data analytics.87
8.2.2 The Market Approach – Valuation Conclusion
It is my
understanding that a large amount of infringement within the industry has
prevented Modavox from maximizing the value of its fundamental technology. Due
to the unique facts and circumstances of the present situation, we have decided
to use The Market Approach as a benchmark supporting the preliminary value
obtained from The Income Approach. The Market Approach suggests a median
purchase price of $1,035 million.
8.3 The Cost Approach Consideration and Indication
As
described above, the cost approach measures the value of a business or asset by
the cost to create and develop the assets under consideration or the cost to
replace it with another of like utility. The assumption underlying this approach
is that a party would not pay more than the cost to purchase or develop new
property that has the same value.
When
applied to the valuation of intellectual property, the cost approach may be used
when a functionally equivalent non-infringing alternative may be reproduced or
replaced.88 The cost of reproduction
or replacement reflects the cost a company may avoid by buying, rather than
duplicating, a similar technology.89 Given the facts of the
issue at hand, we have determined the Cost Approach is not indicative of the
value of the Modavox entity.
82 “AOL to Buy Quigo
as Last Advertising Deal”, http://www.reuters.com/
83 “Google’s
DoubleClick Strategic Move”, http://www.businessweek.com/
84 “Microsoft
Buys aQuantive for $6
billion”, http://money.cnn.com/
85 “Microsoft
Buys aQuantive for $6
billion”, http://money.cnn.com/
86 “Yahoo! to Acquire Overture”, http://docs.yahoo.com
87 “Yahoo! Announces
Agreement to Acquire
BlueLithium”, http://yhoo.client.shareholder.com
88 Smith, Gordon
(2005) Intellectual Property: Valuation, Exploitation and Infringement Damages
89 Reilly & Schweihs
(1999) Valuing Intangible Assets, p. 96-97
28
9. PRELIMINARY
FAIR MARKET VALUE CONCLUSIONS
In this
study, we considered the three main approaches in valuing intellectual property
assets: the income approach, the market approach, and the cost approach. In
conducting our analysis and taking into consideration all available information,
we have determined that the income approach is the most appropriate method for
valuing Modavox. Based upon the analysis presented in this report and
information available to us, it is our opinion that the current fair market
value of the Company is between approximately $525 million and $575
million.
29
10.
COUNTERVAILING FACTS & RISK FACTORS
I have
reviewed and considered countervailing facts in this case to further test the
appropriateness of my opinion. Among the most notable of these factors are the
following:
10.1 Litigation Risks
Like any
other litigation and enforcement action, Modavox faces some risk that the
patent(s) may be found invalid, not infringed, or unenforceable. I
have accounted for this underlying risk by basing my “Income Approach” on an
appropriate, risk-adjusted discount rate and royalty rate. Values indicated by
the Market Approach already encompass litigation risk as well.
We conducted a review on specific US Patent and Non-Patent Literature (NPL) documents that relate to U.S. Patents 6,594,691 and 7,269,636 (Modavox’s patents). 90 The review was related to inventions within the field of computer networks, and more specifically to methods and systems for adding function to Web pages that are accessible through the Internet. The review identified five (5) U.S. patent documents that appear to be of central interest 91 and also identified one (1) NPL document that appears to be of peripheral interest.92
I have
relied upon documents indicating the scope and breadth of specific claims; I
have not reached an independent conclusion about these topics. It is my
understanding that none of the identified documents disclose, teach or suggest
the use of Modavox’s patented technology. It is my understanding that a court of
law may hold Modavox’s patents to be novel and/or non-obvious over the
identified documents.
10.2 Judicial and Legislative Risk
Modavox’s
patents also face some exposure to judicial and legislative risk, such as the
risk that changes or amendments to the law or the patent statute may impair the
rights and values associated with United States Patents. However, I am unaware
of any specific risks, and I am further unaware of any reason that Modavox’s
patents would face more judicial and/or legislative risk than any other issued
United States Patent.
Accordingly,
it is my understanding that this countervailing risk factor is appropriately
accounted for in my valuation mode, as my risk-adjusted discount rate of 25%
exceeds the WACC rates for industry competitors.
90 I have completed my review
with available evidence. Any assessment made herein is based upon the analyst’s
interpretation of the subject matter. The valuation analyst does not practice
law; therefore the results of this study DO NOT constitutes a legal opinion of
any kind or nature as to any aspect of the present invention. Users who wish a
legal opinion as to the patentability of any invention or the validity or
enforceability of any patent are invited to obtain legal counsel for this
purpose. The Kenrich Group assumes no liability of any kind and the users of
this study agreed to release and hold Kenrich Group harmless
therefore.
91 US Patents 6,516,338; 6,477,550; 6,304,893;
6,266,681; 5,923,885
92 Baker, James. "Algorithm
Animation Over the World Wide Web." ACM Inc.. (1996): 203-212.
Print.
30
11.
STATEMENT OF GENERAL ASSUMPTIONS AND LIMITING CONDITIONS
The
Kenrich Group and its employees have no concerted interest in the assets valued
in the study. Because Kenrich Group’s compensation is based on fees, the
estimated values contained in the opinion are independent of the employment and
compensation of Kenrich Group personnel.
Krista F.
Holt assumes accountability for the valuation of Modavox on behalf of all
Kenrich Group
personnel.
The goal of this report is to estimate the Fair market business enterprise value of Modavox. Generally fair market business enterprise value is “the price at which the property would change hands between a willing buyer and a willing seller, neither being under any compulsion to buy or sell and both having reasonable knowledge of relevant facts.”93
The
valuation of Modavox on behalf of The Kenrich Group is subject to the following
assumptions as listed below:
|
1.
|
The
preliminary value in this report is valid as of the date of the
valuation.
|
|
2.
|
Kenrich
Group has assumed without verification that all information provided by
Modavox, including financial statements, projections, and technical
information, is accurate, and therefore Kenrich Group has not confirmed
reliability of this information.
|
|
3.
|
Third-party
research has been gathered from sources that we perceive as
reliable. We have not verified and do not assure accuracy or
completeness of the sources of this information.
|
|
4.
|
This
report may contain forward-looking financial estimates or projections (the
“Estimates” or “Projections”). Based on certain factors, actual results
could differ materially from the Estimates, which are based on historical
or current information that relates to future operations, strategies,
financial results or other developments. Some of the factors, among
others, that could cause these actual results to differ include regulatory
developments, technological changes, competitive conditions, new products,
general economic conditions, changes in tax laws, adequacy of reserves,
credit and other risks associated with the interest included in the
valuation or significant changes in interest rates and fluctuations in
foreign currency exchange rates which, in each case could not be
anticipated as of the date of this report.
|
|
5.
|
Any
changes of items in this report shall be made exclusively by The Kenrich
Group. Any such change that is made by anybody other than The Kenrich
Group is unauthorized and therefore we shall have no responsibility for
any such revisions.
|
|
6.
|
Without
The Kenrich Group’s written consent, no contents of this report shall be
presented to third-party investors for the purpose of any transaction with
a non- accredited entity.
|
|
7.
|
This
report is for the exclusive use of our client and the information
contained herein should not be interpreted as investment
advice.
|
93 Treasury Regulation
Section 1.170A-1(c)(2).
31
|
8.
|
Any
opinions in regard to the value of the asset(s) in this report were made
in the context of the stated purpose of this report.
|
|
9.
|
We
have not attempted to verify that the assets contained in the report
herein are free and clear of liens and encumbrances or that Modavox has
good title to all assets. We assume no responsibility for legal matters
regarding Modavox’s assets.
|
|
10.
|
We
assume that there is full compliance with all applicable Federal, state
and local regulations and laws unless noncompliance is stated, defined and
considered in the valuation report.
|
|
11.
|
No
responsibility is taken for changes in market conditions and no obligation
is assumed to revise this report to reflect events or conditions that
occur subsequent to the valuation date
hereof.
|
32
12.
KENRICH GROUP QUALIFICATIONS
Krista
Holt is a Vice President for The Kenrich Group in their DC office and leads the
firm’s Intellectual Property practice. The Kenrich Group is an integrated
consulting firm specializing in litigation and valuation services for
Intellectual Property, Commercial Damages, Construction, Government Contracting,
Utilities, Financial Institutions and Business Consulting.
Ms. Holt
provides consulting services and expert witness testimony for intellectual
property issues related to patent, trademark, trade secret, copyright and false
advertising, including strategic consulting, valuation of intellectual property
and analysis of damages claimed in litigation, including lost profits,
reasonable royalties, price erosion, corrective advertising, accounting of
defendant’s profits and diminution in trademark and enterprise
value.
Prior to
becoming a Vice President for The Kenrich Group, Ms. Holt was a Managing
Director for Ocean Tomo and led the firm’s Washington DC Expert Testimony
Practice. Prior to its acquisition by Ocean Tomo, Ms. Holt was a Senior
Consultant for Tait Advisory Services’ Intellectual Property Practice. Before
becoming an intellectual property consultant in 2001, Ms. Holt worked for eleven
years in industry accounting and marketing management for companies including
Western Express, Inc., Salvucci Engineers, Inc. and InterMedia Marketing. She
served as the senior financial officer for two companies and as Director of
Marketing for a third. Ms. Holt is an active member of the International
Trademark Association, The Licensing Executives Society, the American Bar
Association, Intellectual Property Owners Association and the Marketing Research
Association. Ms. Holt is a Certified Licensing Professional. She has
lectured on a variety of intellectual property topics for the American Bar
Association, Licensing and Executives Society, DRI and various other
organization and universities.
Ms. Holt
has provided services including expert testimony, valuation, and consulting, as
well as other services for a wide range of industries, including
pharmaceuticals, computer software, surgical equipment, DVD equipment, athletic
equipment, biotechnology, tobacco, internet technology, financial services,
semi-conductors, hospitality, medical supplies, quick serve restaurants,
automotive aftermarket, professional services, computer technology, visual arts,
retail and wholesale consumer products, distilled spirits, educational products
and manufacturing. She has testified on issues informing economic damages, lost
profits, reasonable royalties, competition, industry trends, valuation of
Intellectual Property, and management practices.
33
13.
CERTIFICATION
We
hereby, to our best knowledge and belief, certify the following statements
regarding this opinion:
|
·
|
We
have not personally inspected certain assets, properties or business
interests encompassed by this opinion. Title to the subject assets,
properties or business interests is assumed to be good and marketable
unless otherwise stated. The subject assets, properties or business
interests are valued free and clear of any or all liens or encumbrances
unless otherwise stated.
|
|
·
|
The
statements of fact contained in this report are true and
correct.
|
|
·
|
The
reported analyses, opinions and conclusions are limited only by the
reported assumptions and limiting conditions, and our personal, impartial,
unbiased professional analyses, opinions and
conclusions.
|
|
·
|
We
have no bias with respect to the subject matter of the report or the
parties involved with this engagement.
|
|
·
|
Our
compensation for this engagement is not contingent upon the development or
reporting of a predetermined value or direction in value that favors the
cause of the client, the amount of the value opinion, the attainment of a
stipulated result or the occurrence of a subsequent event directly related
to the intended use of this report.
|
|
·
|
Our
engagement for the provision of services was not contingent upon
developing or reporting predetermined results.
|
|
·
|
The
undersigned prepared the analyses, conclusions and opinions concerning the
businesses that are set forth in this appraisal report. Members of my
staff assisted me under my
direction.
|
Krista F.
Holt
/s/ Krista F.
Holt
Vice
President
The
Kenrich Group
34
EXHIBIT
1.1
Summary
of Valuation Conclusions
| Scenario (in millions) | Low | High | ||||||
| X Litigation/Licensing Value (Online) | $ | 146.3 | $ | 146.3 | ||||
| Value of Patent Portfolio to X Internally and the Industry Litigation Value (Online) | ||||||||
| Industry Litigation Value for the Online Behavioral Targeting (Not Including X) | $ | 693.5 | $ | 1,456.7 | ||||
| Value to X Internally (Increased Profit) of Patent Portfolio to X (Online only) | $ | 570.0 | $ | 570.0 | ||||
| Sub-Total: Value of Patent Portfolio for X Internally and Industry Litigation (Not Including X) (Online) | $ | 1,263.5 | $ | 2,026.7 | ||||
| Value of Patent Portfolio for X Internally and Industry Litigation (Mobile) | ||||||||
| Industry Litigation Value: Mobile Behavioral Targeting | $ | 142.0 | $ | 524.2 | ||||
| Value to X Internally (Increased Profit) of Patent Portfolio to X (Mobile only) | $ | 112.6 | $ | 188.3 | ||||
| Sub-Total: Value of Patent Portfolio and Industry Litigation (Mobile) | $ | 254.6 | 712.6 | |||||
| After-tax Value to Online Behavioral Targeting Industry Internally (Increased Profit) | ||||||||
| Value of Patent Portfolio to Industry (Online Only) | $ | 5,001.0 | $ | 5,001.0 | ||||
| 25% Rule of Thumb | 25 | % | 25 | % | ||||
| 25% Profit Split Apportionment Value | $ | 1,250.2 | $ | 1,250.2 | ||||
| After-tax Value to Mobile Behavioral Targeting Industry Internally (Increased Profit) | ||||||||
| Value of Patent Portfolio to Industry (Mobile Only) | $ | 1,315.4 | $ | 1,315.4 | ||||
| 25% Rule of Thumb | 25 | % | 25 | % | ||||
| 25% Profit Split Apportionment Value | $ | 328.9 | $ | 328.9 | ||||
| Total Value | ||||||||
| Value of X Litigation/Licensing | $ | 146.3 | $ | 146.3 | ||||
| Value of Acquisition of Modavox | $ | 1,518.0 | $ | 2,739.3 | ||||
EXHIBIT
2.1
2009
- 2019 Behaviorally Targeted Advertising Spending and Growth Rates 1/,
2/
| Year | Annual Spending 3/ | Growth Rate | ||||||
|
2006
|
$ | 350 | N/A | |||||
|
2007
|
$ | 525 | 50.0 | % | ||||
|
2008
|
$ | 775 | 47.6 | % | ||||
|
2009
|
$ | 1,100 | 41.9 | % | ||||
|
2010
|
$ | 1,700 | 54.5 | % | ||||
|
2011
|
$ | 2,700 | 58.8 | % | ||||
|
2012
|
$ | 4,400 | 63.0 | % | ||||
|
2013
|
$ | 5,500 | 25.0 | % | ||||
|
2014
|
$ | 6,875 | 25.0 | % | ||||
|
2015
|
$ | 8,594 | 25.0 | % | ||||
|
2016
|
$ | 10,742 | 25.0 | % | ||||
|
2017
|
$ | 12,891 | 25.0 | % | ||||
|
2018
|
$ | 15,469 | 20.0 | % | ||||
|
2019
|
$ | 17,789 | 15.0 | % |
1/ See
Exhibit 2.2
2/ See
Exhibit 2.3
3/
Millions of dollars
EXHIBIT
2.2
2006
- 2012 Behaviorally Targeted Advertising Spending and Growth Rates
1/
| Year | Annual Spending 2/ | Percent Change | ||||||
|
2006
|
$ | 350 | N/A | |||||
|
2007
|
$ | 525 | 50.0 | % | ||||
|
2008
|
$ | 775 | 47.6 | % | ||||
|
2009
|
$ | 1,100 | 41.9 | % | ||||
|
2010
|
$ | 1,700 | 54.5 | % | ||||
|
2011
|
$ | 2,700 | 58.8 | % | ||||
|
2012
|
$ | 4,400 | 63.0 | % |
1/
Source: "Behavioral Targeting: Marketing Trends", eMarketer, June
2008
2/
Millions of dollars
EXHIBIT
2.3
2013
- 2019 Behaviorally Targeted Advertising Spending and Growth Rates
1/
| Year | Annual Spending 2/ | Percent Change | ||||||
|
2013
|
$ | 5,500 | 25.0 | % | ||||
|
2014
|
$ | 6,875 | 25.0 | % | ||||
|
2015
|
$ | 8,594 | 25.0 | % | ||||
|
2016
|
$ | 10,742 | 25.0 | % | ||||
|
2017
|
$ | 12,891 | 25.0 | % | ||||
|
2018
|
$ | 15,469 | 20.0 | % | ||||
|
2019
|
$ | 17,789 | 15.0 | % |
1/
Source: Conversation with Shelly Meyers
2/
Millions of dollars
EXHIBIT
2.4
2007
- 2013 Online Advertising Spending and Growth Rates 1/
| Year | Annual Spending 2/ | Percent Change | ||||||
|
2007
|
$ | 25,200 | N/A | |||||
|
2008
|
$ | 23,600 | -6.3 | % | ||||
|
2009
|
$ | 25,700 | 8.9 | % | ||||
|
2010
|
$ | 28,500 | 10.9 | % | ||||
|
2011
|
$ | 32,000 | 12.3 | % | ||||
|
2012
|
$ | 37,000 | 15.6 | % | ||||
|
2013
|
$ | 42,000 | 13.5 | % |
1/
Source: http://www.seekingalpha.com
2/
Millions of dollars
2009
- 2019 Mobile Advertising Spending and Growth Rates
| Year |
Annual
Spending 1/,
3/
|
Percent Change 2/ | ||||||
|
2009
|
$ | 2,808 | N/A | |||||
|
2010
|
$ | 3,917 | 39.5 | % | ||||
|
2011
|
$ | 5,194 | 32.6 | % | ||||
|
2012
|
$ | 6,525 | 25.6 | % | ||||
|
2013
|
$ | 8,156 | 25.0 | % | ||||
|
2014
|
$ | 9,788 | 20.0 | % | ||||
|
2015
|
$ | 11,256 | 15.0 | % | ||||
|
2016
|
$ | 12,381 | 10.0 | % | ||||
|
2017
|
$ | 13,619 | 10.0 | % | ||||
|
2018
|
$ | 14,709 | 8.0 | % | ||||
|
2019
|
$ | 15,738 | 7.0 | % |
1/
Source: http://www.seekingalpha.com
2/
Source: Conversation with Anthony Iacovone
3/
Millions of dollars