Attached files
| file | filename |
|---|---|
| EX-3.3 - ARTICLES OF AMENDMENT - InfrastruX Group, Inc. | dex33.htm |
| EX-23.1 - CONSENT OF KPMG LLP - InfrastruX Group, Inc. | dex231.htm |
| EX-23.2 - CONSENT OF KPMG LLP - InfrastruX Group, Inc. | dex232.htm |
Table of Contents
As filed with the Securities and Exchange Commission on November 12, 2009
Registration No. 333-161234
UNITED STATES
SECURITIES AND EXCHANGE COMMISSION
WASHINGTON, D.C. 20549
AMENDMENT NO. 2
TO
FORM S-1
REGISTRATION STATEMENT
UNDER
THE SECURITIES ACT OF 1933
InfrastruX Group, Inc.
(Exact name of registrant as specified in its charter)
| Washington | 1623 | 91-2063014 | ||
| (State or other jurisdiction of incorporation or organization) | (Primary Standard Industrial Classification Code Number) | (I.R.S. Employer Identification No.) |
600 University Street, Suite 600
Seattle, Washington 98101-1176
(206) 494-4010
(Address, including zip code, and telephone number, including area code, of registrant’s principal executive offices)
Michael T. Lennon
President and Chief Executive Officer
InfrastruX Group, Inc.
600 University Street, Suite 600
Seattle, Washington 98101-1176
(206) 494-4010
(Name, address, including zip code, and telephone number, including area code, of agent for service)
Copy to:
| Mark Stegemoeller Latham & Watkins LLP 355 South Grand Avenue Los Angeles, California 90071-1560 (213) 485-1234 |
Stacy J. Kanter Skadden, Arps, Slate, Meagher & Flom LLP Four Times Square New York, New York 10036-6522 (212) 735-3000 |
Approximate date of commencement of proposed sale to the public: As soon as practicable after this Registration Statement becomes effective.
If any of the securities being registered on this Form are to be offered on a delayed or continuous basis pursuant to Rule 415 under the Securities Act of 1933, check the following box. ¨
If this Form is filed to register additional securities for an offering pursuant to Rule 462(b) under the Securities Act, please check the following box and list the Securities Act registration statement number of the earlier effective registration statement for the same offering. ¨
If this Form is a post-effective amendment filed pursuant to Rule 462(c) under the Securities Act, check the following box and list the Securities Act registration statement number of the earlier effective registration statement for the same offering. ¨
If this Form is a post-effective amendment filed pursuant to Rule 462(d) under the Securities Act, check the following box and list the Securities Act registration statement number of the earlier effective registration statement for the same offering. ¨
Indicate by check mark whether the registrant is a large accelerated filer, an accelerated filer, a non-accelerated filer, or a smaller reporting company. See the definitions of “large accelerated filer,” “accelerated filer” and “smaller reporting company” in Rule 12b-2 of the Exchange Act. (Check one):
| Large accelerated filer ¨ |
Accelerated filer ¨ | |
| Non-accelerated filer x (Do not check if smaller reporting company) |
Smaller reporting company ¨ |
The registrant hereby amends this registration statement on such date or dates as may be necessary to delay its effective date until the registrant shall file a further amendment which specifically states that this registration statement shall thereafter become effective in accordance with Section 8(a) of the Securities Act, or until the registration statement shall become effective, on such date as the Commission, acting pursuant to said Section 8(a), may determine.
Table of Contents
The information in this prospectus is not complete and may be changed. We may not sell these securities until the registration statement filed with the Securities and Exchange Commission is effective. This prospectus is not an offer to sell these securities and it is not soliciting an offer to buy these securities in any jurisdiction where the offer or sale is not permitted.
| SUBJECT TO COMPLETION, DATED NOVEMBER 12, 2009 | ||
Shares

Common Stock
This is our initial public offering of common stock. We are offering shares and the selling shareholder is offering shares of our common stock. The initial public offering price of our common stock is expected to be between $ and $ per share.
Prior to this offering, there has been no public market for our common stock. We are applying to list our common stock on the New York Stock Exchange under the symbol “IFR.”
Investing in our common stock involves risks. See “Risk Factors” beginning on page 13.
| Price to Public |
Underwriting Discounts and Commissions |
Proceeds to InfrastruX Group, Inc. |
Proceeds to Selling Shareholder | |||||
| Per Share |
$ | $ | $ | $ | ||||
| Total |
$ | $ | $ | $ |
The underwriters have an option to purchase a maximum of additional shares of common stock from the selling shareholder at the public offering price, less the underwriting discounts and commissions, to cover over-allotment of shares, if any. The underwriters can exercise this option at any time within 30 days from the date of this prospectus.
Delivery of the common stock will be made on or about , 2009.
Neither the Securities and Exchange Commission nor any state securities commission has approved or disapproved of these securities or determined if this prospectus is truthful or complete. Any representation to the contrary is a criminal offense.
| Credit Suisse | UBS Investment Bank |
The date of this prospectus is , 2009
Table of Contents
You should rely only on the information contained in this document or any free writing prospectus prepared by or on behalf of us. We have not authorized anyone to provide you with information that is different. This document may only be used where it is legal to sell these securities. The information in this document may only be accurate on the date of this document.
We obtained the industry and market data used throughout this prospectus from industry journals and publications, data on websites maintained by private and public entities, including independent industry associations, or general publications and other publicly available information. In particular, we have based much of our discussion of the electric power and natural gas transmission and distribution markets on information published by the American Society of Civil Engineers (ASCE), the American Wind Energy Association (AWEA), the Edison Electric Institute (EEI), the Emerging Energy Research (EER), the Energy Information Administration (EIA), the Federal Energy Regulatory Commission (FERC), the National Renewable Energy Laboratory, the U.S. Department of Labor Bureau of Labor Statistics and the U.S. Department of Energy (DoE). Because the ASCE, AWEA, EEI and EER serve the interests of their constituents within their respective industries, they may present information in a manner that is more favorable to their respective industries than would be presented by an independent source. Further, forecasts are particularly susceptible to being inaccurate, especially over long periods of time and when made in economic circumstances different than those that exist during the forecast period. As a result, investors are urged to use caution when relying on the industry and market data contained in this prospectus, and beliefs, estimates and forecasts based on such data may not be correct.
Until (25 days after the commencement of the offering), all dealers that effect transactions in these securities, whether or not participating in this offering, may be required to deliver a prospectus. This is in addition to the dealer’s obligation to deliver a prospectus when acting as an underwriter and with respect to unsold allotments or subscriptions.
i
Table of Contents
This summary highlights the information contained elsewhere in this prospectus and does not contain all of the information you need to consider in making your investment decision. For a more complete understanding of the information that you may consider important in making your investment decision, we encourage you to read this entire prospectus. Among the other information in this prospectus, you should carefully consider the information set forth under the heading “Risk Factors” and our consolidated financial statements and accompanying notes included elsewhere in this prospectus. Unless the context requires otherwise, the words “we,” “us,” “our,” “Company” and “InfrastruX” refer to InfrastruX Group, Inc. and its subsidiaries taken as a whole, including our subsidiaries prior to their acquisition by us.
Except as otherwise indicated, all share and per share information included in this prospectus has been adjusted for the -for- stock split of our common stock, effective as of , 2009.
Our Company
We are a leading national provider of maintenance and construction services to the electric power and natural gas transmission and distribution, or T&D, infrastructure markets based on revenue. We combine our project management expertise, large skilled workforce and equipment fleet to provide utilities and energy companies with a broad range of complementary T&D services, including maintenance, construction, repair and emergency storm response. We are one of only a small number of companies that can offer “end-to-end” energy infrastructure services, covering the entire delivery process from the energy source to the end user.
In the electric power market, we are one of the largest national contractors serving the T&D sector based on revenue, and our comprehensive infrastructure capabilities include maintaining and constructing overhead and underground electric power transmission lines, substations and distribution lines. In the natural gas market, we serve our customers’ gas transportation infrastructure needs from the wellhead to gathering lines, pipelines, compressor stations and local distribution systems. To supplement our core offerings, we also provide a range of complementary specialty services, including CableCURE® underground cable restoration, which we also offer internationally, utility-line locating and large-bore directional drilling. From our regional centers in the Southwest, Midwest and East, we are able to pursue and execute projects throughout the country.
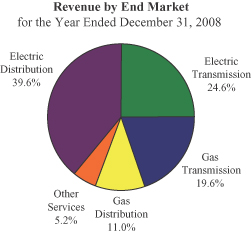
We have long-standing relationships with many electric power and natural gas utilities, cooperatives, municipalities, pipeline companies and other owners and developers of energy infrastructure. Our relationships with many of our customers, including Alliant Energy, American Electric Power, ChevronTexaco, Coserv Electric, Dominion, Duke Energy, Equitable Resources, Oncor (formerly TXU) and Progress Energy, extend for more than 20 years. In 2008, we served approximately 650 customers across electric power and natural gas end markets. The following chart presents the percentage of our consolidated revenue generated by end markets in 2008. Electric power and natural gas T&D specialty services performed for customers are reflected in our electric power and natural gas T&D revenues, respectively. Any other specialty services performed for customers are recorded as revenue from “other services.”
1
Table of Contents
Our business consists of a mix of recurring work and project-based bid work. We have recurring revenues under long-term master service and alliance agreements, which generated approximately 70% of our 2008 revenues. Master service agreements, or MSAs, are typically one to three year contracts and are often renewed. MSAs establish a long-term working framework, including terms, conditions and pricing, for providing our customers a wide array of maintenance and construction services. In late 2008, we expanded on the MSA concept by entering into what we describe as an “alliance agreement” with Oncor, the largest utility in Texas and our largest customer, which we believe represents a new contractual approach to strengthening our customer relationships. Through this 10.5 year contract, we currently serve as Oncor’s primary contractor for T&D maintenance and construction. This alliance approach significantly enhances the alignment of our interests with those of our customer through joint project planning, stipulated target work volumes and incentive structures. Based on the initial success of our alliance agreement with Oncor, we will seek to establish similar arrangements with other leading utilities.
Key Industry Trends
We believe the opportunity for T&D infrastructure service providers is significant and that growth in our end markets will be driven by the following principal factors:
Inadequacy and deterioration of existing energy T&D infrastructure. Long-term increases in energy consumption, historically insufficient investment in T&D and geographic shifts in population have stressed the current T&D infrastructure and increased the need for new maintenance, upgrades and expansion. The need to modernize America’s electric transmission grid is widely acknowledged. According to the EIA, 70% of transmission lines and power transformers are at least 25 years old. In addition, the DoE estimates that nearly 65% of natural gas pipelines in the U.S. were built prior to 1970.
More efficient use of electricity generation. The current electric power infrastructure is congested and regionalized. Congestion limits the efficient movement of electricity throughout the U.S. and results in areas with high electricity costs that are unable to efficiently receive power from lower cost or more environmentally friendly generation sources. In addition, we believe there is a growing recognition of the need for a more flexible “Smart Grid” to increase reliability and reduce electricity costs by improving the efficiency of electric power delivery and more effectively matching electric power supply with demand. The installation of a “Smart Grid” will require significant infrastructure spending.
2
Table of Contents
Expanded development of new energy sources. We expect to benefit from the development of new sources of electric power generation and natural gas production that will require specialty contractors to upgrade, build and maintain additional transmission infrastructure.
| • | Renewable electric power sources. Wind is expected to be the fastest growing source of new electricity supply in the U.S., with installed capacity expected to double between 2008 and 2015 and associated annual investment expected to average over $5 billion during this period. Because the major U.S. wind corridors are generally located away from urban demand centers, we expect significant transmission spending will be required to connect new wind generation facilities to end users. Twenty-nine states and Washington D.C. have adopted mandatory Renewable Portfolio Standards, or RPS, programs that require a certain percentage of electric power to come from renewable sources, and five other states have enacted non-binding RPS-like goals. In addition, the U.S. House of Representatives recently passed the Combined Efficiency and Renewable Electricity Standard (CERES) that would impose renewable energy standards on utilities nationally. We expect to benefit, in particular, from the Texas plan for Competitive Renewable Energy Zones, or CREZ, which are geographic areas in the state suitable for the development of renewable energy resources, principally wind power. Planned CREZ spending includes $4.9 billion of transmission projects, of which $1.3 billion has been allocated, subject to certain state convenience and necessity approvals, to Oncor, our largest customer, although the substantial majority of this work has not yet been committed to InfrastruX. |
| • | Development of natural gas sources. Advances in technology have expanded the economic viability of extracting natural gas from unconventional sources such as the vast shale basins throughout the U.S. and extended the production of conventional natural gas sources. We believe the development of domestic natural gas reserves will continue over the long term, creating opportunities for specialty contractors to build and maintain the associated gathering lines and transmission infrastructure that will be needed to deliver the gas to market. |
Greater use of natural gas for electric power generation. Natural gas is increasingly being viewed as an economic and environmentally favorable alternative to other fossil fuels for electric power generation. In some U.S. markets, lower natural gas prices, combined with the uncertainty surrounding potential U.S. greenhouse gas regulations that could discourage the use of coal (such as the cap-and-trade provisions of the CERES bill recently passed by the U.S. House of Representatives), as well as the knowledge that natural gas produces significantly lower greenhouse gas emissions, have begun to influence some electric power generators to switch from coal to natural gas for new power plants. We believe an increase in the use of natural gas for electric power generation will be a major driver of long-term demand for domestic natural gas production and result in a substantial increase in transmission infrastructure spending.
Increased outsourcing of infrastructure services. Due to cost control initiatives, the ability to improve service levels and aging workforce trends, utilities have increased the outsourcing of their T&D maintenance and construction services needs. We believe that a majority of utility infrastructure services are still conducted in-house and that our customers, especially electric utilities, will expand outsourcing of utility infrastructure services over time. Outsourced service providers are often able to provide the same services at a lower cost because of their specialization, larger scale and ability to better utilize their workforce and equipment across a larger geographic footprint.
Our Competitive Strengths
Our competitive strengths include the following:
Comprehensive service offerings. We believe that utilities will continue to seek efficiencies by focusing on a more limited number of service providers that offer comprehensive capabilities. Our wide range of services allows us to address this demand and provides us with cross-selling opportunities. In particular, we believe our
3
Table of Contents
significant experience in more complex, high-voltage electric power transmission and substation work differentiates us from many of our electric T&D competitors. We also offer our natural gas T&D customers a full spectrum of maintenance and construction solutions from large diameter transmission pipelines to the maintenance and installation of local distribution infrastructure. Our specialty services, such as CableCURE® underground cable restoration, utility-line locating and large-bore directional drilling, complement our portfolio of services.
Critical scale and geographic presence. We have a significant presence in key U.S. energy markets including the Southwest, Midwest and East with approximately 4,400 employees as of June 30, 2009 and an equipment fleet that can be mobilized quickly throughout the continental U.S. Our geographic coverage allows us to serve customers whose operations span multiple states or regions, and our scale allows us to quickly deploy large numbers of skilled workers on short notice. We believe we are well positioned to assist our customers in constructing new electric power transmission infrastructure to connect remotely located alternative energy sources to the existing grid.
Long-term customer relationships. We have relationships of more than 20 years with a number of utilities and energy companies, including Alliant Energy, American Electric Power, ChevronTexaco, Coserv Electric, Dominion, Duke Energy, Equitable Resources, Oncor and Progress Energy. Our relationships with Oncor and American Electric Power span more than 50 years. The basis for many of our long-term customer relationships has been and will continue to be the comprehensive, cost-efficient and timely maintenance and construction services we provide. The relationships we have with our core group of customers often allow us to be integrated into the planning stages of their larger projects, which we believe increases the likelihood of maintaining these relationships and securing additional bid work. In addition, these long-term relationships often lead to cross-selling opportunities as many customers prefer to deal with fewer, trusted service providers.
Enhanced revenue visibility and stability through MSAs and alliance agreements. We believe our long-term MSAs and our alliance agreement with Oncor provide us with enhanced revenue visibility and stability as compared to project-by-project bid work. Approximately 70% of our 2008 revenue was generated under MSAs and our alliance agreement. Our MSAs have allowed us to build and to strengthen enduring client relationships and have provided us key advantages in bidding projects and enhanced our opportunities to perform incremental maintenance and construction work. Our alliance agreement with Oncor includes incentives for Oncor to meet aggregate revenue thresholds more than 40% greater than our 2007 revenue from Oncor, a mechanism to provide us additional Oncor work if threshold spending levels are not projected to be met, indexed annual price adjustments and other key terms designed to further align our interests with those of Oncor.
Successful track record of completing and integrating acquisitions. Since 2000, we have enhanced our growth through a series of strategic acquisitions. These acquisitions have expanded our geographic footprint, the scope of services we offer and the number of customers we serve. In addition, we believe our acquisition strategy has allowed us to access new markets with lower risk and more quickly than entering as a new market participant. For example, our 2002 acquisition of Chapman Construction strengthened our position as a leading provider of electric power transmission and substation services in Texas and enhanced our relationship with Oncor. Our November 2006 acquisition of Hawkeye, LLC and certain of its affiliates, sometimes referred to in this prospectus as the “Hawkeye Acquisition,” broadened our capabilities in key electric power T&D services in the Northeast, particularly in underground transmission services. We believe our information systems, standardized processes and disciplined business practices around project management provide an effective platform for integrating acquired businesses, closely monitoring our projects across operating units and improving labor and equipment utilization.
High quality workforce and strong, experienced management team. Our track record in winning desirable and profitable projects and our commitment to safety have allowed us to attract and maintain a highly skilled workforce capable of handling complex projects, such as high-voltage electric power transmission and
4
Table of Contents
specialized underground utility projects. We believe our abilities to attract, develop, retain and deploy our workforce position us to capitalize on increasing demand for skilled services in an era of shrinking and aging utility workforces. We also have the ability to quickly mobilize, expand or contract our workforce to respond to customer needs and effectively staff our projects. Our high quality workforce is led by our strong, experienced management team.
Our Business Strategy
Our business strategy positions us to take advantage of a number of long-term favorable trends:
Capitalize on alternative energy trends. We believe our broad geographic platform and strong customer relationships will allow us to capitalize on favorable trends in key alternative energy end markets such as wind power development. For example, as a major provider of T&D maintenance and construction services in Texas, with approximately 1,600 total employees in the state as of June 30, 2009, we believe we are well positioned to perform a significant portion of the transmission work announced under the CREZ plan, which includes $1.3 billion of work awarded to Oncor, subject to certain state convenience and necessity approvals, although the substantial majority of this work has not yet been committed to InfrastruX. Similarly, with over 1,700 total employees in the Northeast, we believe we are a leading candidate to perform work resulting from RPS programs in the region.
Benefit from new natural gas development. We believe our comprehensive natural gas T&D capabilities and geographic presence will allow us to capitalize on the expected long-term demand for domestic natural gas resource development from traditional gas fields and unconventional resources such as tight sand, coal bed methane, methane hydrates and shale. These resources require significant infrastructure development of gathering systems and transmission pipelines to gather and transport the natural gas from remote regions of supply to areas of consumption.
Pursue alliance agreements. We will continue our efforts to capitalize on the trend of utilities outsourcing T&D maintenance and construction services. We have formalized long-term relationships with many of our customers by entering into MSAs. In addition to continuing to pursue MSAs, we will seek to establish alliance agreements with additional leading utilities, building on the model of the Oncor alliance agreement. We believe that these alliance agreements will improve the alignment of our goals and objectives with those of our customers and increase our revenue visibility and growth potential.
Focus on enhancing operating efficiencies, expanding margins and controlling risk. We seek to improve profitability and control risk by emphasizing the most profitable services in our portfolio, pursuing projects that we believe will generate attractive returns, enhancing safety measures and constantly monitoring our projects. We also continue to seek opportunities for improved labor and equipment resource utilization, to incentivize our management to create and realize profitable cross-selling opportunities across operating units and to share best practices across our operations.
Attract, develop and retain quality employees. A key tenet of our growth strategy has been and will continue to be our ability to attract and maintain the workforce and management talent necessary to provide quality, safe and timely services to our customers. We continue to invest in the recruiting, development and retention of our valuable workforce by focusing training and compensation on safe operation, efficient production and customer satisfaction. As our customers increasingly outsource energy infrastructure services and as their workforces continue to decline in number and grow older, our ability to maintain a highly skilled workforce will become increasingly valuable. To meet anticipated increased business demand, we have expanded our personnel recruiting efforts by extending our relationships with universities, technical colleges, unions and trade schools through scholarships, tuition assistance, course development and internships.
Pursue strategic acquisitions. To complement our organic growth, we continue to search for attractive acquisition opportunities that expand our geographic presence, enhance our service offerings and increase our
5
Table of Contents
customer base. We are particularly interested in opportunities that would expand our electric power T&D services or provide turn-key program management. We are also interested in technology-based services, including those that complement our CableCURE® offering. Geographically, we anticipate focusing on expanding the breadth and depth of our service offerings around our existing regional centers of operation in the Southwest, Midwest and East, as well as expanding our geographic reach into the West Coast. We believe that attractive acquisition opportunities will continue to be available due to the fragmented nature of our industry, the desire for many business owners to achieve liquidity and the difficulty many companies face in modernizing and expanding due to capital constraints, particularly under the current financial market conditions.
Risks Affecting Our Business and Strategy
There are a number of risks and uncertainties that may affect our financial and operating performance, including:
| • | if business conditions in the industries we serve do not improve or continue to deteriorate due to the current economic downturn, decreases in electricity demand, depressed oil and natural gas prices, the credit crisis or other factors, our customers’ current and future spending, as well as their ability to pay for our services, may continue to be adversely impacted, and as a result, our results of operations, cash flow and business prospects may continue to suffer; |
| • | a continued reduction or lack of improvement in the level of capital expenditures on infrastructure, particularly by oil and natural gas pipeline companies and electric power utilities, could continue to adversely affect our results of operations, cash flow and business prospects; |
| • | we derive a significant portion of our revenue from a small number of customers and the loss or reduction of business or projects from one or more of them (particularly Oncor) could negatively impact us; |
| • | federal and state legislation and regulations relating to electric power transmission and natural gas pipeline infrastructure, including alternative energy and related end markets, may fail to result in increased demand for our services; |
| • | our acquisition strategy or our integration of acquired businesses may be unsuccessful, and as a result, we may not achieve expected benefits and our performance could decline; |
| • | if we are unable to access the capital or credit markets, our future growth opportunities and ability to refinance indebtedness and to fund acquisitions and sufficient capital expenditures to meet our business needs could be adversely affected; and |
| • | skilled labor shortages and increased labor costs could negatively affect our ability to operate efficiently and profitably and delay or prevent achievement of our business strategy. |
These and other risks are discussed under “Risk Factors” and elsewhere in this prospectus and should be carefully considered before investing in our common stock.
Our Sponsor
Our sponsor, Tenaska Power Fund, L.P., or TPF, is a private equity fund that has investments in power generation, natural gas storage and electric power and natural gas T&D infrastructure. As of December 31, 2008, TPF had approximately $2.5 billion of assets under management. Tenaska Capital Management, LLC, an affiliate of TPF, provides portfolio management and administrative services to TPF and provides management services to us. TCM is also the manager of TPF II, L.P., or TPF II, the successor fund to TPF. As of December 31, 2008,
6
Table of Contents
TPF II, together with its affiliated funds, had approximately $2.4 billion of assets under management. As of June 30, 2009, InfrastruX Holdings, LLC (our parent and the selling shareholder in this offering) owned 48,950,360 shares (without giving effect to the -for- stock split), or 100%, of our common stock, and after giving effect to this offering, it will own shares, or %, of our common stock, assuming no exercise of the underwriters’ over-allotment option. In connection with the October 2009 amendment to our credit facilities, we issued and InfrastruX Holdings, LLC acquired 20,000 shares, or 100%, of our 15% Senior Redeemable Convertible Cumulative Preferred Stock. We intend to redeem all of such preferred stock with proceeds from this offering. InfrastruX Holdings, LLC, is approximately 95.3% owned on a fully-diluted basis by TPF InfrastruX Holdings, LLC, a wholly-owned subsidiary of TPF.
At an initial public offering price of $ per share (the mid-point of the estimated price range on the cover page of this prospectus), TPF will beneficially own more than 50% of the outstanding shares of our common stock, and we will be a “controlled company” under the rules of the New York Stock Exchange (NYSE). If we are a controlled company, we will be exempt from certain independence requirements with respect to the composition of our board and committees of the board, including the requirements that a majority of the board of directors be comprised of independent directors, and that the compensation committee and the nominating and corporate governance committee be comprised solely of independent directors. See “Risk Factors—Risks Relating to This Offering” and related information contained elsewhere in this prospectus.
Our acquisition by TPF in May 2006 is sometimes referred to in this prospectus as the “TPF Acquisition.”
Company Information
We were incorporated in the State of Washington in 2000. Our principal executive offices are located at 600 University Street, Suite 600, Seattle, Washington 98101-1176, and our telephone number is (206) 494-4010. Our website is located at www.infrastrux.com. The information on, or accessible through, our website does not constitute part of, and is not incorporated into, this prospectus.
7
Table of Contents
THE OFFERING
| Common stock offered by us |
shares |
| Common stock offered by the selling shareholder |
shares |
| Common stock to be outstanding immediately after this offering |
shares |
| Over-allotment option offered by the selling shareholder |
shares |
| Use of proceeds |
We estimate that the net proceeds from the sale of shares by us in the offering (based on an offering price of $ per share, the midpoint of the estimated price range shown on the cover page of this prospectus), after deducting estimated underwriting discounts and commissions and estimated offering expenses payable by us, will be $ million. We will not receive any of the proceeds from the sale of common stock by the selling shareholder. |
We intend to use the net proceeds of this offering to repay approximately $ million of indebtedness outstanding under our credit facilities, to redeem approximately $ of our 15% Senior Redeemable Convertible Cumulative Preferred Stock (representing all the outstanding shares of such stock), and to retain approximately $ for general corporate purposes, including working capital purposes and to fund future acquisitions. See “Use of Proceeds.”
| Risk Factors |
You should read the “Risk Factors” section of this prospectus for a discussion of some of the factors that you should consider carefully before deciding to invest in shares of our common stock. |
| Proposed New York Stock Exchange symbol |
“IFR” |
The number of shares of common stock to be outstanding after this offering is based on shares outstanding as of , 2009 (before giving effect to the -for- stock split) and:
| • | excludes shares and shares of common stock issuable upon the exercise of outstanding stock appreciation rights (SARs) and restricted stock units (RSUs), respectively; and |
| • | excludes shares of common stock reserved for issuance under our equity incentive plan. |
Unless otherwise indicated, this prospectus reflects and assumes the following:
| • | our common stock will be sold at $ per share, which is the midpoint of the estimated offering price range shown on the front cover page of this prospectus; |
| • | redemption of all outstanding shares of our 15% Senior Redeemable Convertible Cumulative Preferred Stock; |
| • | no exercise by the underwriters of their over-allotment option; |
| • | a -for- stock split of our outstanding common stock to be effective immediately prior to the effectiveness of this offering; and |
| • | the filing of our amended and restated articles of incorporation and the adoption of our amended and restated bylaws immediately prior to the effectiveness of the offering. |
8
Table of Contents
SUMMARY CONSOLIDATED FINANCIAL AND OTHER DATA
The summary consolidated statement of operations for the periods January 1, 2006 to May 7, 2006 and May 8, 2006 to December 31, 2006 and for the years ended December 31, 2007 and 2008 have been derived from our audited consolidated financial statements included elsewhere in this prospectus, which include, with respect to the periods presented below, our results prior to the TPF Acquisition for the period January 1, 2006 to May 7, 2006 and our results since the TPF Acquisition for the period May 8, 2006 (inception) to December 31, 2006 and for the years ended December 31, 2007 and 2008. The summary consolidated statement of operations for each of the six months ended June 30, 2008 and 2009 and the consolidated balance sheet data as of June 30, 2009 have been derived from our unaudited consolidated financial statements included elsewhere in this prospectus. You should read the following summary consolidated financial and other data in conjunction with “Selected Consolidated Financial and Other Data,” “Management’s Discussion and Analysis of Financial Condition and Results of Operations,” and our consolidated financial statements and related notes included elsewhere in this prospectus.
| Predecessor(1) | Successor(1) | |||||||||||||||||||||||||||||
| Period January 1, 2006 to May 7, 2006 |
Period May 8, 2006 to December 31, 2006 |
Combined Year Ended December 31, 2006 |
Year Ended December 31, |
Six Months Ended June 30, |
||||||||||||||||||||||||||
| 2007 | 2008 | 2008 | 2009 | |||||||||||||||||||||||||||
| (unaudited) | (unaudited) | |||||||||||||||||||||||||||||
| (dollars in thousands, except per share data) | ||||||||||||||||||||||||||||||
| Consolidated Statements of Operations Data: |
||||||||||||||||||||||||||||||
| Revenues |
$ | 141,606 | $ | 341,586 | $ | 483,192 | $ | 657,180 | $ | 826,962 | $ | 401,675 | $ | 316,788 | ||||||||||||||||
| Cost of revenues |
119,956 | 284,609 | 404,565 | 581,666 | 701,035 | 347,593 | 285,689 | |||||||||||||||||||||||
| Gross profit |
21,650 | 56,977 | 78,627 | 75,514 | 125,927 | 54,082 | 31,099 | |||||||||||||||||||||||
| Selling, general and administrative |
21,037 | 31,733 | 52,770 | 51,122 | 85,882 | (2) | 31,188 | 30,378 | ||||||||||||||||||||||
| Goodwill / intangibles impairment |
— | — | — | 35,484 | 52,888 | 34,104 | — | |||||||||||||||||||||||
| Amortization of intangibles(3) |
459 | 3,190 | 3,649 | 7,818 | 7,445 | 3,830 | 3,606 | |||||||||||||||||||||||
| Total operating expenses |
21,496 | 34,923 | 56,419 | 94,424 | 146,215 | 69,122 | 33,984 | |||||||||||||||||||||||
| Income (loss) from operations |
154 | 22,054 | 22,208 | (18,910 | ) | (20,288 | ) | (15,040 | ) | (2,885 | ) | |||||||||||||||||||
| Interest expense, net |
2,934 | 16,028 | 18,962 | 33,029 | 27,468 | 13,298 | 7,443 | |||||||||||||||||||||||
| Other expenses (income), net |
(11 | ) | 9,122 | 9,111 | 4,238 | 2,840 | 1,372 | 1,551 | ||||||||||||||||||||||
| Loss before income taxes |
(2,769 | ) | (3,096 | ) | (5,865 | ) | (56,177 | ) | (50,596 | ) | (29,710 | ) | (11,879 | ) | ||||||||||||||||
| Income tax benefit |
237 | 1,152 | 1,389 | 14,376 | 14,028 | 8,722 | 2,818 | |||||||||||||||||||||||
| Net loss |
$ | (2,532 | ) | $ | (1,944 | ) | $ | (4,476 | ) | $ | (41,801 | ) | $ | (36,568 | ) | $ | (20,988 | ) | $ | (9,061 | ) | |||||||||
| Net Loss Per Share Data: |
||||||||||||||||||||||||||||||
| Basic |
$ | (0.04 | ) | $ | (0.09 | ) | $ | (0.85 | ) | $ | (0.75 | ) | $ | (0.43 | ) | $ | (0.18 | ) | ||||||||||||
| Diluted |
$ | (0.04 | ) | $ | (0.09 | ) | $ | (0.85 | ) | $ | (0.75 | ) | $ | (0.43 | ) | $ | (0.18 | ) | ||||||||||||
| Weighted average shares outstanding, basic and diluted |
46,541,862 | 48,950,360 | 48,950,360 | 48,950,360 | 48,950,360 | 49,099,673 | ||||||||||||||||||||||||
| Other Data: |
||||||||||||||||||||||||||||||
| Adjusted EBITDA(4) |
$ | 11,146 | $ | 48,561 | $ | 59,707 | $ | 58,241 | $ | 95,155 | $ | 41,301 | $ | 21,439 | ||||||||||||||||
| Backlog(5) |
266,000 | 340,000 | 340,000 | 368,000 | 472,000 | 476,000 | 384,000 | |||||||||||||||||||||||
| Capital expenditures |
2,242 | 15,995 | 18,237 | 24,502 | 34,521 | 23,687 | 18,394 | |||||||||||||||||||||||
| Working capital(6) |
61,850 | 117,018 | 117,018 | 103,316 | 101,955 | 118,698 | 109,314 | |||||||||||||||||||||||
9
Table of Contents
| June 30, 2009 | ||||||
| Actual | As Adjusted | |||||
| (unaudited) | ||||||
| Consolidated Balance Sheet Data: |
(dollars in thousands) | |||||
| Cash and cash equivalents |
$ | 13,363 | $ | |||
| Total assets |
519,431 | |||||
| Long-term debt, including current portion |
279,170 | |||||
| Total shareholder’s equity |
97,591 | |||||
| (1) | Our financial statements for the period prior to May 8, 2006 (our predecessor period) were prepared on the historical cost basis of accounting. Our financial statements for periods subsequent to May 8, 2006 (our successor periods) reflect the application of purchase accounting to the TPF Acquisition, which required that we record our assets and liabilities at fair value as of May 8, 2006. This included $82.2 million of goodwill, $67.1 million of intangibles and $14.2 million of property and equipment, which caused an increase in amortization of intangibles and depreciation expense in our successor periods as compared to our predecessor period. In addition, our financial statements for the successor periods include Hawkeye from the date of the Hawkeye Acquisition on November 3, 2006. As a result, our results for the successor periods are not comparable to the predecessor period, and our combined results for the year ended December 31, 2006 are not comparable to other periods presented. Loss per share amounts for the combined year ended December 31, 2006 are based on 48,950,360 shares outstanding as of December 31, 2006. |
| (2) | Includes $17.5 million relating to an earnout paid to the former owners of Hawkeye and $4.3 million in share-based compensation under our equity incentive plan. |
| (3) | Excludes developed technology intangible amortization recorded to cost of revenues. See Note 4 of our consolidated financial statements. |
| (4) | Adjusted EBITDA is defined as net loss plus net interest expense, income tax benefit, depreciation and amortization, as adjusted for items that management does not consider to be reflective of our core operating performance. |
Our management uses Adjusted EBITDA:
| • | as a measurement of operating performance; |
| • | in developing our internal budgets, forecasts and strategic plan; |
| • | as a significant factor in evaluating our management for compensation purposes, see “Compensation Discussion and Analysis”; |
| • | to evaluate potential acquisitions; |
| • | in comparing our current operating results with corresponding historical periods and with the operational performance of other companies in our industry; and |
| • | in presentations to the members of our board of directors to enable our board to have the same measurement basis of operating performance as is used by management in their assessments of performance and in forecasting and budgeting, both for individual operating units and for our company as a whole. |
Most of the adjustments reflected in Adjusted EBITDA are also included in performance metrics under our credit facilities. However, Adjusted EBITDA is not a financial measurement recognized under U.S. generally accepted accounting principles, or GAAP, and when analyzing our operating performance, investors should use Adjusted EBITDA in addition to, and not as an alternative for, net income, operating income, or any other performance measure derived in accordance with GAAP, or as an alternative to cash flow from operating activities as a measure of our liquidity. Because not all companies use identical calculations, our presentation of Adjusted EBITDA may not be comparable to similarly titled measures of other companies. See “Management’s Discussion and Analysis of Financial Condition and Results of Operations—Non-GAAP Discussion.”
10
Table of Contents
The following table provides a reconciliation of net loss to Adjusted EBITDA:
| Predecessor(1) | Successor(1) | |||||||||||||||||||||||||||||
| Period January 1, 2006 to May 7, 2006 |
Period May 8, 2006 to December 31, 2006 |
Combined Year Ended December 31, 2006 |
Year Ended December 31, |
Six Months Ended June 30, |
||||||||||||||||||||||||||
| 2007 | 2008 | 2008 | 2009 | |||||||||||||||||||||||||||
| (unaudited) | (unaudited) | |||||||||||||||||||||||||||||
| (dollars in thousands) | ||||||||||||||||||||||||||||||
| Net loss |
$ | (2,532 | ) | $ | (1,944 | ) | $ | (4,476 | ) | $ | (41,801 | ) | $ | (36,568 | ) | $ | (20,988 | ) | $ | (9,061 | ) | |||||||||
| Plus: interest expense, net |
2,934 | 16,028 | 18,962 | 33,029 | 27,468 | 13,298 | 7,443 | |||||||||||||||||||||||
| Plus: income tax (benefit) |
(237 | ) | (1,152 | ) | (1,389 | ) | (14,376 | ) | (14,028 | ) | (8,722 | ) | (2,818 | ) | ||||||||||||||||
| Plus: depreciation and amortization |
7,150 | 22,806 | 29,956 | 42,469 | 41,582 | 20,822 | 20,137 | |||||||||||||||||||||||
| EBITDA |
7,315 | 35,738 | 43,053 | 19,321 | 18,454 | 4,410 | 15,701 | |||||||||||||||||||||||
| Plus: impairment of goodwill |
— | — | — | 35,484 | (a) | 45,268 | (b) | 26,484 | — | |||||||||||||||||||||
| Plus: impairment of intangible assets |
— | — | — | — | 7,620 | (c) | 7,620 | — | ||||||||||||||||||||||
| Plus: refinancing charges |
— | 8,518 | (d) | 8,518 | (d) | 1,373 | (e) | — | — | — | ||||||||||||||||||||
| Plus: financing costs and bank fees |
— | 1,750 | 1,750 | 2,569 | 2,839 | 1,377 | 1,586 | |||||||||||||||||||||||
| Plus: TCM management fees(f) |
— | 1,290 | 1,290 | 2,013 | 2,000 | 1,000 | 1,000 | |||||||||||||||||||||||
| Plus: Hawkeye earnout(g) |
— | — | — | — | 17,500 | — | — | |||||||||||||||||||||||
| Plus: change of control bonuses(h) |
3,537 | — | 3,537 | — | — | — | — | |||||||||||||||||||||||
| Plus: non-cash equity compensation(i) |
274 | — | 274 | — | 4,308 | 3,176 | 888 | |||||||||||||||||||||||
| Plus: restructuring costs |
— | — | — | — | — | — | 66 | |||||||||||||||||||||||
| Plus: other, net |
20 | (j) | 1,265 | (k) | 1,285 | (k) | (2,519 | )(l) | 1,419 | (m) | 34 | (j) | 2,198 | (n) | ||||||||||||||||
| Minus: gain on litigation resolution |
— | — | — | — | (4,253 | )(o) | (2,800 | )(o) | — | |||||||||||||||||||||
| Adjusted EBITDA |
$ | 11,146 | $ | 48,561 | $ | 59,707 | $ | 58,241 | $ | 95,155 | $ | 41,301 | $ | 21,439 | ||||||||||||||||
| (a) | Represents goodwill impairment charges of $29.5 million and $6.0 million in our Eastern and Midwest regions, respectively. See “Management’s Discussion and Analysis of Financial Condition and Results of Operations—Year Ended December 31, 2007 Compared to the Year Ended December 31, 2006—Impairment Charges.” |
| (b) | Represents a goodwill impairment charge of $26.5 million in our Eastern region, during the second quarter of 2008, as well as an additional $18.8 million impairment charge in the same region during the fourth quarter of 2008. See “Management’s Discussion and Analysis of Financial Condition and Results of Operations—Year Ended December 31, 2008 Compared to the Year Ended December 31, 2007—Impairment Charges.” |
| (c) | Represents a non-cash intangible asset impairment charge relating to a small operating unit that experienced the departure of its president and former owner during the year. See “Management’s Discussion and Analysis of Financial Condition and Results of Operations—Year Ended December 31, 2008 Compared to the Year Ended December 31, 2007—Impairment Charges.” |
| (d) | In 2006, we refinanced the debt we incurred to facilitate the TPF Acquisition and, as a result, wrote off $7.4 million of deferred financing costs and paid $1.1 million in prepayment penalties. |
| (e) | Represents bank costs we incurred in amending certain provisions of our credit facilities. |
| (f) | Represents the management fee payable to TCM. Excludes interest charges on the unpaid management fees, which are included in interest expense, net. This fee will no longer be payable upon completion of this offering. |
11
Table of Contents
| (g) | Represents a non-recurring earnout payment to the former owners of Hawkeye. |
| (h) | Represents payments funded by our predecessor owner in connection with the TPF Acquisition but reflected in our results of operations. |
| (i) | Represents non-cash share-based compensation under our equity incentive plan. |
| (j) | Represents gains and losses on the sale of certain assets. |
| (k) | Represents certain legal fees relating to an abandoned transaction, as well as gains and losses on the sale of certain assets. |
| (l) | Primarily represents a $2.5 million gain from the proceeds of a key person life insurance policy following the death of one of our operating unit executives. |
| (m) | Primarily represents $1.4 million of professional fees incurred in preparation for this offering. |
| (n) | Represents gains and losses on the sale of certain assets and professional fees incurred in preparation for this offering. |
| (o) | Represents a gain from the resolution of a litigation matter. |
| (5) | Backlog represents the amount of revenue that we expect to realize over the next 12 months from work to be performed on uncompleted contracts, including new contracts on which work has not begun. Our backlog estimate includes amounts under MSAs, our alliance agreement with Oncor and project-by-project bid work. We estimate the amount of work under MSAs to be disclosed as backlog based upon recurring historical trends inherent in the current MSAs, factoring in management’s expectations given seasonal demands and economic conditions and projected customer needs based upon ongoing communications with the customer. However, our MSAs rarely have minimum volume or spending obligations, and many of our contracts may be terminated on short notice, typically zero to 90 days. There can be no assurance as to our customers’ requirements or that our estimates are accurate. In addition, many of our MSAs are subject to renewal options. For purposes of calculating backlog, we have included future renewal options only to the extent we consider the renewals highly likely to occur. With respect to project-by-project bid work, we include the full amount of revenue we expect to realize in the next 12 months on the uncompleted portion of the contract in our estimate of backlog. Our reported backlog as of June 30, 2009 reflects only nominal amounts of work to be performed under the CREZ plan. |
| (6) | Working capital represents total current assets less total current liabilities. |
12
Table of Contents
Before deciding to invest in our common stock, you should carefully consider each of the following risk factors and all of the other information set forth in this prospectus. The following risks and the risks described elsewhere in this prospectus, including in the section entitled “Management’s Discussion and Analysis of Financial Condition and Results of Operations,” could materially harm our business, financial condition, results of operations, cash flow and business prospects. If any such event were to occur, the trading price of our common stock could decline, and you could lose all or part of your investment.
Risks Relating to Our Business and Our Industry
If the business conditions in the industries we serve do not improve, or continue to deteriorate, due to the current economic downturn, decreases in electricity demand, depressed oil and natural gas prices, the credit crisis or other factors, our customers’ current and future spending, as well as their ability to pay for our services, may be adversely impacted, and as a result, our operations, cash flow and business prospects may suffer.
The U.S. economy is experiencing a severe downturn. The rate at which the economy may further slow and the timing and strength of any recovery is uncertain. The recession is directly affecting our end markets. Electricity demand decreased in 2008 as compared to 2007 and has continued to decrease in 2009. Certain commodity prices, particularly natural gas, have not recovered from their decline in the second half of 2008. As a result of the current economic downturn and depressed energy prices, certain of our customers do not have the ability or desire to fund capital expenditures or have decided to outsource less work. For example, demand for wind generation equipment has fallen from pre-recession levels and depressed natural gas prices have led some of our customers to conclude that exploration and production of certain gas fields are not economically viable. Such capital and outsourcing decisions have led and may continue to lead to a decreased demand for our services and a reduction in the number of projects available for bid, and are adversely affecting our operations, cash flow and growth. In addition, the continuing weakness in the residential and commercial construction markets, which reduces demand for utility infrastructure, continues to adversely affect our distribution business.
Furthermore, many of our customers finance their projects through cash flow from operations, the incurrence of debt or the issuance of equity. The downturn and lower electricity and energy prices have adversely affected the operating performance and cash flow of many of our customers, has caused a significant decline in the availability of credit and has led to substantial declines in many of our customers’ equity values. A reduction in cash flow and the limited availability of debt or equity financing have adversely affected our customers’ capital expenditure plans and the economic viability of alternative energy and other projects and may also impact the ability of our customers to pay amounts owed to us, which could impact our operations, cash flow, growth and financial condition.
We cannot predict the impact of the current economic downturn, the declines in oil and natural gas prices, or the credit crisis, on our customers, our operations or our business prospects, and we cannot predict when or whether projected growth in demand for infrastructure services to the electric power and natural gas utility industries, including alternative energy infrastructure, will materialize.
In addition to the economy, a number of other factors beyond our control could significantly impact the level of capital expenditures by our customers and, as a result, adversely affect our operations, cash flow and business prospects.
Numerous factors beyond our control could also influence the level of capital expenditures by our customers, including:
| • | exploration, production and transportation costs; |
| • | the rate of discovery of new oil and natural gas reserves; |
13
Table of Contents
| • | the sale and expiration dates of oil and natural gas leases and concessions; |
| • | regulatory restraints on the rates that power companies may charge their customers and recoup capital expenditures; |
| • | new home construction rates; |
| • | local and international political conditions; and |
| • | technological advances. |
In addition, our customers may delay, suspend, postpone or fail to pursue any infrastructure project for other reasons. Changes in the expected return, anticipated completion date, planned cost to complete or other factors affecting the viability of a project may reduce the number or size of in-process and planned infrastructure projects and therefore may reduce the opportunities available to us. Our results of operations, cash flow and business prospects could be adversely affected if the level of capital expenditures of our customers does not recover for any of these or for other reasons.
The award of new contracts and the timing of these awards may result in unpredictable fluctuations in the size of our workforce and our revenue, cash flow and profitability.
A substantial portion of our revenue is derived from project-based work, including from our MSA customers. It is generally very difficult to predict with precision whether and when we will be awarded a project, when we may start work on a project once awarded and the expected project timetable or completion date, resulting in unpredictability in our revenue, cash flow and profitability. Going forward, we expect to generate a significant percentage of revenues from large-scale projects, particularly projects we may be awarded as a result of the implementation of CREZ but for which we have not yet received any significant commitments, further exacerbating the unpredictability of our operating results. In addition, some of our contracts are subject to regulatory approval, permitting, financing and other contingencies that may delay or result in termination of projects (including under CREZ), particularly in an economic environment where financing is difficult to obtain. The uncertainty of our contract award timing can also present difficulties in matching workforce size with contract needs. In some cases, we maintain and bear the cost of a ready workforce that is larger than necessary in anticipation of future workforce needs for expected contract awards. If expected contract awards are delayed or not received, or if the volume of projects is lower than expected under our MSAs, in some cases we could incur costs that could be substantial without receipt of corresponding revenues. Finally, the winding down or completion of work on significant projects that were active in previous periods will reduce our revenue and earnings if such significant projects are not replaced in the current period.
Our industry is highly competitive, which could adversely affect our business and profitability.
Our industry is served by numerous small, owner-operated private companies and several large national and regional private and public companies. Relatively few barriers prevent entry into some of the markets in which we operate. As a result, any organization that has adequate financial resources and access to technical expertise may become a competitor with respect to one or more of the services we provide. Competitiveness in our industry depends on a number of factors, including reputation, quality of services, safety record and price. The current economic recession has intensified competition in our industry as industry participants pursue reduced work volumes. Our competitors may have lower overhead cost structures, greater resources or other advantages and, therefore, may be able to provide their services at lower rates than ours or elect to place bids on projects that drive down margins to lower levels than we would accept. We cannot be certain that our competitors do not have or will not develop the expertise, experience and resources that allow them to offer lower prices, higher quality of services or both. Similarly, we cannot be certain that we will be able to maintain or enhance our competitive position in the markets in which we operate or maintain our customer base at current levels. We also face competition from our existing and prospective customers since electric power and natural gas companies often directly employ personnel to perform many of the same types of services we provide. This competition from some customers has increased during the economic recession and may increase further as they seek to keep their
14
Table of Contents
workforces engaged during periods of reduced demand and postponed projects. In addition, some of our customers’ ability to outsource work may be limited by their relations or agreements with their unions. We cannot be certain that our existing or prospective customers will continue to contract for or outsource services in the future at current levels or at all.
In recent years we have begun to face increasing competition from alternative technologies in our cable restoration business. Our CableCURE® product sales may be adversely affected by technological improvements by one or more of our competitors and/or the expiration of our exclusive intellectual property rights in such technology. If we are unable to keep pace with current or future technological advances in cable restoration, our business, financial condition and results of operations may suffer.
We derive a significant portion of our revenue from a small group of customers, including our largest customer, Oncor. The loss of, or our failure to sustain our revenues from, one or more of these customers could negatively impact our results of operations, cash flow and business prospects.
Our top ten customers accounted for 48.8% and 52.9% of our revenues for the year ended December 31, 2008, and the six months ended June 30, 2009, respectively. Our revenue could significantly decline if we lose one or more of our significant customers or if they significantly reduce their use of our services. In addition, revenues under our contracts with significant customers may vary from period-to-period depending on the timing and volume of work that such customers order in a given period due to their own spending plans and budgetary considerations or as a result of competition, including from the in-house service organizations of our customers.
Oncor accounted for $138.4 million, or 16.7%, of revenues for the year ended December 31, 2008 and $96.4 million, or 30.4%, of revenues for the six months ended June 30, 2009. At December 31, 2008 and June 30, 2009, Oncor represented $35.6 million, or 20.3%, and $48.9 million, or 35.6%, of accounts receivable, respectively. In 2008, we entered into an alliance agreement with Oncor. We expect this agreement and the approval of the CREZ buildout in Texas to increase the percentage of our revenues from Oncor. The agreement provides for certain anticipated levels of business from Oncor through 2018, subject to a reduction in levels of business and termination for cause by Oncor under agreed circumstances. The agreement provides for termination without cause at Oncor’s discretion or upon an anticipated or actual change of control of Oncor, subject to a termination fee payable to us as determined pursuant to the agreement. The consummation of this offering will not constitute a change of control of InfrastruX under the agreement. In some cases, the required termination payments could be similar to or less than the maximum volume-based adjustment Oncor would incur if threshold spending levels are not met, which could create an incentive for Oncor to terminate the contract. Oncor can also terminate without cause upon an anticipated or actual change of control of InfrastruX without paying any termination fee and can similarly terminate for cause. See “Business—Contractual Arrangements” for more information. Although the agreement contains certain anticipated spending levels, Oncor has not guaranteed any specific volume of business and revenue under the agreement (including CREZ- related revenue) may vary significantly from period-to-period. Furthermore, we may incur costs in maintaining a workforce available to service the Oncor alliance agreement that may not be fully utilized.
The agreement includes a provision whereby Oncor receives at least as favorable pricing as we charge to other customers for any “similar services” (which is not a defined term under the agreement). Management believes, based on our pricing practices and the nature and scope of the services we provide to Oncor, that we are in compliance with this provision, but we cannot assure you that obligations or disputes will not arise concerning this provision, which could adversely affect us and our revenues and profitability.
The agreement also requires that we continually meet or exceed minimum service levels as measured by specified performance indicators. We have had, and continue to have, service level issues with Oncor from time to time that we have historically been able to resolve to Oncor’s and our mutual satisfaction. However, we cannot assure you that we will be able to do so in the future. If we are unable to perform our obligations under our agreement with Oncor in a manner satisfactory to Oncor, Oncor could in some cases seek to terminate for cause or limit our activity or seek to assess penalties against us under the agreement, any of which could materially adversely affect our results of operations, cash flow and business prospects.
15
Table of Contents
Federal and state legislative and regulatory developments that we believe should encourage electric power transmission and natural gas pipeline infrastructure spending may fail to result in increased demand for our services.
In recent years, federal and state legislation has been passed and resulting regulations have been adopted that could significantly increase spending on electric power transmission and natural gas pipeline infrastructure, including the Energy Act of 2005, the American Recovery and Reinvestment Act of 2009 (ARRA) and state RPS programs. However, much fiscal, regulatory and other uncertainty remains as to the impact this legislation and regulation will ultimately have on the demand for our services. For instance, regulations implementing provisions of the Energy Act of 2005 that may affect demand for our services remain, in some cases, subject to review in various federal courts. In one such case, decided in February 2009, a federal court of appeals vacated FERC’s interpretation of the scope of its backstop transmission line siting authority for electric power transmission projects. Accordingly, the effect of these regulations, once finally implemented, is uncertain and may not result in increased spending on the electric power transmission infrastructure. Continued uncertainty regarding the implementation of the Energy Act of 2005 and ARRA may result in slower growth in demand for our services.
Renewable energy initiatives, including Texas’ CREZ plan, other RPS initiatives and ARRA, may not lead to increased demand for our services. While 29 states and Washington D.C. have mandatory RPS programs that require certain percentages of power to be generated from renewable sources, the RPS programs adopted in many states became law during periods of substantially higher oil and natural gas prices. As a result, or for budgetary or other reasons, states may reduce those mandates or make them optional or extend deadlines, which could reduce, delay or eliminate renewable energy development in the affected states. In addition, states may limit, delay or otherwise alter existing RPS programs in anticipation of a potential federal renewable energy standard. Furthermore, renewable energy is generally more expensive to produce and may require additional power generation sources as backup. Funding for RPS programs may not be available or may be further constrained as a result of the significant declines in government budgets and subsidies and in the availability of credit to finance the significant capital expenditures necessary to build renewable generation capacity. These factors could lead to fewer projects resulting from RPS programs than anticipated or a delay in the timing of these projects and the related infrastructure, which would negatively affect the demand for our services. Moreover, even if the RPS programs are fully developed and funded, we cannot be certain that we will be awarded any resulting contracts. In addition, we cannot predict when programs under ARRA will be implemented or the timing and scope of any investments to be made under these programs, particularly in light of capital constraints on potential developers of these projects. Infrastructure projects such as those envisioned by CREZ and RPS initiatives are also subject to delays or cancellation due to local factors such as siting disputes, protests and litigation. Before we will receive revenues from infrastructure buildouts associated with any of these projects, substantial advance preparations are required such as engineering, procurement, and acquisition and clearance of rights-of-way, all of which are beyond our control. Investments for renewable energy and electric power infrastructure under ARRA may not occur, may be less than anticipated or may be delayed, may be concentrated in locations where we do not have significant capabilities, and any resulting contracts may not be awarded to us, any of which could negatively impact demand for our services.
In addition, the increase in long-term demand for natural gas that we believe will benefit from anticipated U.S. greenhouse gas regulations, such as a cap-and-trade program or carbon taxes, may be delayed or may not occur. For example, we cannot predict whether or in what form the cap-and-trade provisions and renewable energy standards in the CERES bill recently passed by the U.S. House of Representatives will become law. We cannot predict the timing and scope of any potential greenhouse gas regulations or whether such regulation will ultimately be adopted or the extent to which demand for natural gas will increase as a result of any such regulations.
16
Table of Contents
Our customers often have no obligation to award work to us and many of our contracts may be terminated on short notice. As a result, we are at risk of losing significant business on short notice and may not realize our backlog.
Our customers generally have no obligation to assign work to us. Most of our contracts may be terminated by our customers on short notice, typically zero to 90 days. In addition, our customers could materially reduce, eliminate or reassign a portion of the work we have historically performed because our contracts rarely have any minimum volume or spending obligations. Moreover, many of our contracts, including our MSAs, are open to competitive bidding, and we have been displaced on these contracts by competitors from time to time. For example, one of our large customers recently switched a significant portion of its MSA work to a competitor after a bidding process. Our revenues and backlog could materially decline if our customers do not assign work to us or if they cancel a significant number of projects and we cannot replace them with similar projects.
Our backlog may not be realized or may not result in expected revenues and profits.
Our twelve-month backlog as of June 30, 2009 was $384.0 million. However, backlog is difficult to determine with certainty. Our backlog includes anticipated projects under MSAs based to a significant degree on recurring historical trends inherent in the current MSAs, factoring in seasonal demand and projected customer needs based upon ongoing communications with the customer. However, our MSAs rarely have minimum volume or spending obligations, and many of our contracts may be terminated by our customers on short notice, typically zero to 90 days. The failure of our customers to assign projects to us under our MSAs consistent with our expectations or the cancellation by our customers of any other projects could significantly reduce the revenue and profit we actually realize from projects included in backlog. In the event a project on which we have commenced work is cancelled, we may be reimbursed for certain costs but typically have no contractual right to the total revenues included in our backlog. Fixed-price contracts may also remain in our backlog for an extended period of time due to their long-term nature, delays and decisions by our customers to extend the timing of performance. In addition, the backlog we obtain in connection with any companies that we acquire may not be as large as we believe or may not result in the revenue or profit we expect. We cannot give any assurance that the estimates on which our backlog is based are accurate or that the backlog we report will accurately predict our results of operations for future periods.
Our storm restoration revenues are highly volatile and unpredictable, which could result in substantial variations in, and uncertainties regarding, our results of operations.
Revenues derived from our storm restoration services are highly volatile and uncertain due to the unpredictable nature of weather-related events. Our annual storm restoration revenues have been as high as $67.0 million in 2008 when we experienced the largest storm restoration revenues in our history as several significant hurricanes impacted the Gulf Coast and Florida and ice storms affected the Northeast, but storm restoration revenues have been substantially lower in 2009. Therefore, our storm restoration revenues for 2008 are not indicative of the revenues that we typically generate in any period or can be expected to generate in any future period. Our revenues and net income will likely continue to be subject to significant variations and uncertainties due to the volatility of our storm restoration volume. We may not be able to generate incremental revenues from storm activities to the extent that we do not receive permission from our regular customers (including Oncor) to divert resources to the restoration work for customers with which we do not have ongoing MSA relationships, sometimes referred to in this prospectus as “off-system” work. In addition, our storm restoration revenues are offset in part by declines in our T&D services because we staff storm restoration mobilizations by diverting resources from our T&D services.
Seasonal variations and inclement weather may cause significant fluctuations in our operating results, profitability, cash flow and working capital needs.
A significant portion of our business is performed outdoors, exposing our results of operations to seasonal variations and inclement weather. We perform less work in the winter months and work is hindered during other inclement weather events. Our revenue and profitability often decrease during the winter months and during
17
Table of Contents
severe weather conditions because work performed during these periods is more costly to complete. During periods of peak electric power demand in the summer, utilities generally are unable to remove their electric power T&D equipment from service, decreasing the demand for our maintenance services during such periods. Accordingly, our operating results in any particular quarter may not be indicative of the results that can be expected for any other quarter or for the entire year. The seasonality of our business also causes our working capital needs to fluctuate. Because our operating cash flow is usually lower during and following the winter months, we typically experience a need to finance a portion of our working capital during the spring and summer.
Our inability to hire, retain or replace key personnel could disrupt our business.
We depend on the continued efforts of our executive officers and senior management, including management at each operating unit. The relationships between our executive officers and operating unit management and our customers are often important to our being retained. A number of senior managers at our operating units, including the presidents of our operating units, have been working in the industry, or for companies we acquired, for decades and have developed extensive operating expertise in their markets, including strong working relationships with customers and unions. Many of these managers are approaching retirement age and have the ability and resources to leave at any time, and some have had health problems. Although we would seek to replace these managers as necessary with qualified senior personnel, preferably from management within our operating units, we can give no assurance that those replacements would be able to sustain or improve the performance levels achieved by their predecessors.
We are also dependent upon our project managers and field supervisors who are responsible for managing and staffing employees to our projects. Industry-wide competition for managerial talent has been substantial and the loss of one or more of our key employees could have an adverse effect on our business. There can be no assurance that any individual will continue in his or her capacity for any particular period of time. The loss of key personnel, or the inability to hire and retain qualified employees, could negatively impact our ability to manage our business and relationships with our customers. We generally do not carry key person life insurance on our officers or employees. In certain cases, we do not have employment or non-competition/non-solicitation agreements with our officers and key employees, and the non-competition agreements currently in place with other officers and key employees are limited in time and scope or could be found to be unenforceable. As a result, we could be materially adversely affected if any of our experienced managers becomes a competitor.
Our use of unit-price and fixed-price contracts could result in reduced profitability or losses on projects.
We currently generate, and expect to continue to generate, a significant portion of our revenues under unit-price and fixed-price contracts. Under our unit-price contracts, we agree to perform identified units of work for an agreed price. A “unit” can be as small as the installation of a single bolt or a foot of cable or as large as a transmission tower or foundation. The resulting profitability of a particular unit is primarily dependent upon the labor and equipment hours expended to complete the task that comprises the unit. Under fixed-price contracts, we agree to perform the contract for a fixed price. Failure to accurately estimate the costs of completing a particular project could result in reduced profits or losses, including reversals of previously estimated profits. We expect that industry trends could result in an increase in the proportion of our contracts being performed on a unit-price or fixed-price basis, resulting in more profitability risk.
Regulators may influence or require our utility customers to reduce, delay or eliminate spending on the services we perform, which could adversely affect our revenues and results of operations.
Due to the severity of the current economic downturn, state utility commissions may impose spending limits on our utility customers, resulting in a material reduction in spending from these customers that could adversely affect our revenues and results of operations. In May 2009, the State of New York Public Service Commission issued a notice requiring certain major electric and natural gas utilities in New York, including certain customers of ours, to file “austerity plans” with the commission that detail each utility’s current and future plans to reduce
18
Table of Contents
or postpone discretionary costs during the current economic downturn. Some of the T&D services we provide may be considered discretionary by our utility customers in New York, and, as a result, certain current and future projects with them may be subject to increased risk of being limited, delayed or eliminated, and other states or municipalities could impose similar restrictions.
Our failure to complete projects on time and on budget may result in additional costs to us, reductions in revenues or the payment of liquidated damages.
In certain circumstances, we guarantee project completion by a scheduled date or achievement of certain acceptance and performance testing levels. Our failure to meet any of these schedules or performance requirements could result in additional costs or penalties, including liquidated damages, that could adversely impact project profit margins. We may encounter difficulties in engineering, equipment and supply delivery, schedule changes, weather-related delays and other factors, some of which are beyond our control, that impact our ability to complete the project in accordance with the original delivery schedule. In addition, our project contracts may require that our customers or other parties provide us with design or engineering information or with equipment or materials to be used on a project. In some cases, we may be provided with deficient designs, engineering information, equipment or materials or provided with information, equipment or materials later than required by the project schedule.
Delays and additional costs may be substantial, and in some cases we may be required to compensate the project customer for these delays. We may not be able to recover all of these costs from our vendors and subcontractors. In extreme cases, the above-mentioned factors could cause project cancellations, and we may not be able to replace such projects with similar projects or at all. Such delays or cancellations may impact our reputation or relationships with customers, adversely affecting our ability to secure new contracts.
Our customers may also determine, after commencement of a project, to change various elements of the project which can materially decrease or increase the scope and extent of our work. Under these circumstances, we generally negotiate with the customer with respect to the reductions in or additions to the amount of time required and the compensation to be paid to us. However, we are subject to the risk that we are unable to obtain, through negotiation, arbitration, litigation or otherwise, adequate amounts to compensate us for the work performed, additional work or expenses we incur due to customer-requested change orders or failure by the customer to provide required items in a timely fashion. A failure to obtain adequate compensation for these matters could require us to record a negative adjustment to revenue and gross profit that were recognized in prior periods under the percentage-of-completion accounting method. Any such adjustments could be substantial.
We are self-insured against many potential liabilities.
Although we maintain insurance policies with respect to automobile liability, general liability, workers’ compensation and employee group health claims, many of those policies are subject to substantial deductibles, and we are self-insured up to the amount of the deductible. Since most claims against us do not exceed the deductibles under our insurance policies, we are effectively self-insured for substantially all claims. We actuarially determine any liabilities for unpaid claims and associated expenses, including incurred but not reported losses, and reflect those liabilities in our balance sheet as other current and non-current liabilities. The determination of such claims and expenses and the appropriateness of the liability is reviewed and updated quarterly. However, insurance liabilities are difficult to assess and estimate due to many relevant factors, the effects of which are often unknown, including the severity of an injury, the determination of our liability in proportion to other parties, the number of incidents not reported and the effectiveness of our safety program. If our insurance claims increase or costs exceed our estimates of insurance liabilities, we could experience a decline in profitability and liquidity. See “Management’s Discussion and Analysis of Financial Condition and Results of Operations—Critical Accounting Policies—Insurance.”
We also maintain a cash collateral and receivable balance for our comprehensive insurance coverage with a major insurer to support our obligations. Cash collateral and receivables due from our insurance company, which
19
Table of Contents
are recorded in prepaid expense and other current assets and other assets on our consolidated balance sheets, was $32.7 million as of June 30, 2009. If our insurance company files for bankruptcy or experiences financial difficulties, these balances could become unavailable and we could be required to identify and access additional sources of liquidity to fund claims.
Our projects are subject to numerous hazards and our record and reputation for safety is important to our business. If we do not maintain an adequate safety record, we may be ineligible to bid on certain projects, could be terminated from existing projects and could have difficulty procuring adequate insurance.
Our employees and customers are exposed to numerous hazards during the conduct of our business, including electric contacts and flashes, fires, natural gas explosions, mechanical failures, transportation accidents and damage to infrastructure upon which we work. These hazards can cause personal injury and loss of life, severe damage to or destruction of property and equipment and other consequential damages, including widespread blackouts and service interruptions, and may result in suspension of operations, civil damage claims and criminal fines and penalties that could have a material adverse effect on our business and results of operations. Further, regulatory changes implemented by OSHA could impose additional costs on us. Although most, if not all, of our operating units have safety performance records better than applicable OSHA safety metrics, from time to time in the past some of our operating units have not been successful in obtaining work as a result of their safety record and in some locations our 2008 safety performance declined from prior years.
Our safety record is important. If serious accidents or fatalities occur or our safety record deteriorates, we may be ineligible to bid on certain projects and could be terminated from existing projects. Our reputation and our prospects for being awarded future projects could be negatively affected. Further, our insurance carrier may be unwilling to provide current levels of coverage without a significant increase in premiums and collateral requirements to cover our deductible obligations, and as a result, we may not be able to maintain adequate insurance.
Our unionized workforce could adversely affect our operations and our ability to complete future acquisitions. In addition, we contribute to multi-employer plans that could result in liabilities to us if these plans are terminated or we withdraw.
As of June 30, 2009, approximately 19% of our employees were covered by collective bargaining agreements and that percentage could grow if more of our employees unionize or we expand our services in states that have predominantly unionized workforces in our industry. Strikes or work stoppages could occur that would adversely impact our relationships with our customers, hinder our ability to conduct business and increase costs. Our current workforce could experience an increase in union organizing activity, particularly if legislation that would facilitate such activity, such as the Employee Free Choice Act now pending before Congress, becomes law. Increased unionization could increase our costs, and we may not be able to recoup those cost increases by increasing prices for our services.
We contribute to several multi-employer pension plans for employees covered by collective bargaining agreements. These plans are not administered by us, and contributions are determined in accordance with provisions of negotiated labor contracts. The Employee Retirement Income Security Act of 1974 (ERISA), as amended by the Multi-employer Pension Plan Amendments Act of 1980, imposes certain liabilities upon employers who are contributors to a multi-employer plan in the event of the employer’s withdrawal from, or upon termination of, such plan. We do not routinely review information on the net assets and actuarial present value of the multi-employer pension plans’ unfunded vested benefits allocable to us, if any, and we are not presently aware of the amounts, if any, for which we may be contingently liable if we were to withdraw from any of these plans. In addition, if the funding of any of these multi-employer plans becomes in “critical status” under the Pension Protection Act of 2006, we could be required to make significant additional contributions to those plans.
20
Table of Contents
Our ability to complete future acquisitions could be adversely affected because of our union status for a variety of reasons. Our union agreements may be incompatible with the union agreements of a business we want to acquire, and some businesses may or may not want to become affiliated with a company that maintains a significantly unionized workforce. Additionally, we may increase our exposure to withdrawal liabilities for underfunded multi-employer pension plans to which an acquired company contributes.
Our use of percentage-of-completion accounting could result in a reduction, elimination or reversal of previously reported profits.
A portion of our revenues is recognized on a percentage-of-completion method of accounting, primarily using the cost-to-cost method. This method is used because management considers expended costs to be the best available measure of progress on these contracts. The percentage-of-completion accounting method we use results in our recognizing contract revenues and earnings over the contract term in proportion to our incurrence of contract costs. The earnings or losses recognized on individual contracts are based on estimates of contract revenues, costs and profitability. Contract losses are recognized in full when determined, and contract profit estimates are adjusted based on ongoing reviews of contract profitability. Our results could be adversely affected if we determine that a loss is likely to occur or profit is likely to be lower than previously estimated, including the impact of reversal of previously recorded profits on a contract.
Further, some of our contracts contain various cost and performance incentives. Penalties are recorded when known or finalized, which is generally during the latter stages of the contract. In addition, we record cost recovery claims when we believe recovery is highly likely and the amounts can be reasonably estimated. Actual collection of claims could differ from estimated amounts and could result in a reduction or elimination of previously recognized earnings. In certain circumstances, it is possible that such adjustments could be significant. See “Management’s Discussion and Analysis of Financial Condition and Results of Operations—Critical Accounting Policies” and the notes to our consolidated financial statements, all of which are included elsewhere in this prospectus for additional information.
Our financial results and any guidance we may issue are based upon estimates and assumptions that may differ from actual results.
In preparing our consolidated financial statements in conformity with GAAP, several estimates and assumptions are used by management in determining the reported amounts of assets and liabilities, revenues and expenses recognized during the periods presented and disclosures of contingent assets and liabilities known to exist as of the date of the financial statements. These estimates and assumptions must be made because certain information that is used in the preparation of our financial statements is dependent on future events, cannot be calculated with a high degree of precision from data available or is not possible to calculate based on generally accepted methodologies. In some cases, these estimates are particularly difficult to determine and we must exercise significant judgment. Material estimates are used in our revenue and cost recognition under percentage-of-completion accounting, assessment of the allowance for doubtful accounts, fair value assumptions in analyzing goodwill and long-lived asset impairments, determination of uninsured loss accruals, provision for income taxes and estimates relating to share-based compensation. See “Management’s Discussion and Analysis of Financial Condition and Results of Operations—Critical Accounting Policies” and the notes to our consolidated financial statements, all of which are included elsewhere in this prospectus for additional information.
In addition, from time to time we may publicly provide earnings or other forms of guidance, which reflect our predictions about future revenue, operating costs and capital structure, among other factors. These predictions are inherently uncertain and may be impacted by factors that are beyond our control and may be incorrect. Actual results for all estimates could differ materially from the estimates and assumptions that we use, which could have a material adverse effect on our financial condition, results of operations and cash flows.
21
Table of Contents
We had a material weakness in our internal control over financial reporting that required us to restate our financial statements. Failure to establish and maintain effective internal control over financial reporting could have a material adverse effect on our business, our operating results and the value of our common stock.
In connection with the audit of our 2008 financial statements and preparation of the registration statement of which this prospectus forms a part, we identified a material weakness in our system of internal control over financial reporting. The Public Company Accounting Oversight Boards Auditing Standard No. 5 defines a material weakness as a deficiency, or a combination of deficiencies, in internal controls over financial reporting, such that there is a reasonable possibility that a material misstatement of annual or interim financial statements will not be prevented or detected on a timely basis. The material weakness that we identified related to the Company’s entity-level processes for monitoring and assessing financial reporting risks and ensuring that appropriate procedures and controls are implemented in response to changes. Specifically, this material weakness arises from the combined effect of deficiencies related to (i) insufficient resources with the appropriate level of experience and training in the application of technical accounting guidance and (ii) inadequate monitoring, review and approval of the policies and procedures implemented to address new or non-recurring accounting transactions, including those designed to ensure relevant, sufficient and reliable data is accumulated to support assumptions and judgments. This material weakness resulted in errors in goodwill and income taxes and the restatement of the 2006 and 2007 consolidated financial statements.
If we were to conclude in future periods that our internal control over financial reporting was not effective, or if we fail to remediate the current or a future material weakness or design, implement and maintain new or improved controls and procedures designed to prevent additional material weaknesses, this could have a material adverse effect on our ability to timely meet our periodic reporting obligations or result in additional errors and material misstatements not detected by management in our financial statements. Any such failure could adversely affect the results of periodic management evaluations and annual auditor attestation reports regarding the effectiveness of our internal control over financial reporting that will be required when the rules of the Securities and Exchange Commission, or SEC, under Section 404 of the Sarbanes-Oxley Act of 2002 become applicable to us beginning with our Annual Report on Form 10-K for the year ending December 31, 2010, to be filed in early 2011. In addition, we may not be able to meet our reporting obligations as a public company in a timely manner. Any such failure could also cause investors to lose confidence in our reported financial information and adversely affect the value of our common stock or limit our access to the capital markets and other sources of liquidity.
Our acquisition strategy or our integration of acquired businesses may be unsuccessful, and, as a result, we may not achieve expected benefits and our performance could decline.
We have built our business, in part, through strategic acquisitions. We have completed numerous acquisitions and plan to continue to consider additional acquisitions. We expect to face competition for acquisition candidates, which may limit the number of acquisition opportunities and may lead to higher acquisition prices. We may not accurately assess the value or prospects of acquisition candidates and may not be able to identify, acquire or profitably manage additional businesses or to successfully integrate any acquired businesses without substantial costs, delays or other operational or financial problems. For example, the Hawkeye Acquisition required substantial management time and attention to integrate Hawkeye and to address contract performance issues and contributed significantly to goodwill impairment charges of $35.5 million and $45.3 million in 2007 and 2008, respectively.
Our operating units have historically maintained their own operating procedures, which make it more difficult for us to evaluate and integrate their systems and controls on a reliable company-wide basis. We have imposed and will continue to impose company-wide requirements on our operating units in a number of areas through our centralized oversight and our enterprise resource planning system as we continue the process of integrating our acquired businesses. We may experience difficulties implementing these company-wide systems at one or more acquired businesses and they may not be effective once fully implemented. Failure to implement proper overall business controls could adversely affect our operations, cash flow and business prospects.
22
Table of Contents
Acquisitions also involve a number of special risks, including failure of the acquired business to achieve expected results, diversion of management’s attention, failure to retain key personnel of the acquired business and risks associated with unanticipated events or liabilities, some or all of which could have an adverse effect on our business, financial condition and results of operations.
In addition, we may need additional capital or credit to finance our growth, particularly to pursue additional acquisitions, capital leases and letters of credit. The amount, timing and terms of such additional financing will vary principally depending on the timing and size of the acquisitions, capital leases and letters of credit we seek to undertake and the amount of cash flows from our operations. The capital and credit markets have become increasingly volatile as a result of adverse conditions that caused the failure and near failure of a number of large financial institutions. If the capital and credit markets continue to experience difficulties and the availability of debt and equity capital remains limited, we may not be able to obtain additional financing on terms acceptable to us or at all, and consequently, we may not be able to pursue acquisitions we consider attractive or fully implement our growth strategy.
We have incurred indebtedness under our credit facilities that may restrict our business and operations and may restrict our access to sufficient funding, including letters of credit, in the future. We may not be able to repay or refinance our indebtedness at maturity.
The terms of our credit facilities contain customary events of default and covenants that limit us from taking certain actions without obtaining the consent of the lenders. Our credit facilities also require us to achieve certain financial ratios on a quarterly basis, as described in “Management’s Discussion and Analysis of Financial Condition and Results of Operations—Liquidity and Capital Resources.” These restrictions and covenants limit our ability to respond to changing business and economic conditions, and we may be prevented from engaging in transactions that might otherwise be considered beneficial to us. For example, our credit facilities restrict our ability to incur indebtedness, subject to certain exceptions, which could prevent us from making investments and acquisitions in excess of certain amounts. Our credit facilities also limit our ability to make capital expenditures in excess of specified amounts, which could constrain our capacity to undertake additional large contracts that require significant capital outlays or to obtain equipment through operating leases, which could adversely impact our results of operations. We expect to spend approximately $30 million against our $40 million annual limit on capital expenditures in 2009. As of September 30, 2009 we had spent $27.8 on capital expenditures year to date. In addition, our credit facilities require that a portion of our “excess cash flow” (as defined in the credit agreement) be applied to prepay amounts borrowed under the facilities, thereby preventing us from using that cash for our operations or growth. The 2009 amendment to our credit facilities also requires us to repay outstanding amounts under our revolving line of credit with cash on hand in excess of $15 million until the earlier of September 30, 2011 and the date we meet leverage and interest coverage ratios in effect prior to this amendment, effectively limiting the amount of our cash on hand.
Our revolving line of credit and term loan mature in November 2011 and November 2012, respectively. Our ability to repay or refinance those arrangements at or prior to maturity, on acceptable terms or at all, depends on a number of factors including the condition of the credit markets and our performance.
If we breach our credit facilities, including if we are unable to meet the required financial ratios, we would be in default under our credit facilities. In the event of any default under our credit facilities, the lenders thereunder would be entitled to accelerate the repayment of amounts outstanding, plus accrued and unpaid interest. Moreover, in the event of a default we would lose the ability to draw on, and the lenders would have the option to terminate any obligation to make further extensions of credit under our revolving credit facility. In addition, in the event of a default under our credit facilities, which are secured by substantially all of our assets, the lenders thereunder could proceed to foreclose against the assets securing such obligations. In the event of an acceleration of our indebtedness or a foreclosure on all or substantially all of our assets, we may not be able to continue to operate as a going concern.
23
Table of Contents
Servicing our indebtedness will reduce our funds available for other purposes and may adversely affect our business and operations.
As of June 30, 2009, after giving effect to the use of proceeds from this offering, we would have had approximately $ million in indebtedness and approximately $ million in interest expense for the six months then ended. As a result, a substantial portion of our cash flow from operations will continue to be dedicated to the payment of principal and interest on our indebtedness, thereby reducing funds available to us for other purposes, including our operations, capital expenditures or future business and acquisition opportunities. Our level of indebtedness could affect the amount and cost of bonding capacity available to us. Our level of indebtedness could also, among other things, place us at a competitive disadvantage as compared with our competitors and make us more vulnerable in the event of a downturn in our business or a continued downturn in general economic conditions. In addition, our credit facilities require that a portion of our “excess cash flow” be applied to prepay amounts borrowed under the facilities, which reduces our funds available for other purposes. After giving effect to hedging arrangements, see “Management’s Discussion and Analysis of Financial Condition and Results of Operations—Quantitative and Qualitative Disclosure About Market Risk,” we are subject to interest rate risk on a portion of our credit facilities that accrue interest at variable rates.
Our business growth could outpace the capability of our equipment fleet, and we may be unable to rent or procure substitute or additional equipment on reasonable terms or at all.
We may be unable to procure equipment necessary for a project, particularly in any area of high demand such as the CREZ build out, either due to a lack of available funding, lack of covenant capacity under our credit facilities or equipment shortages in the marketplace. As a result, we may be forced to rent equipment on a short-term basis or to find alternative ways to perform the work without the benefit of equipment ideally suited for the job, which could increase the costs and risks of completing the project. Furthermore, we may be unable to buy or rent the specialty equipment and tooling we require due to the limited number of manufacturers and distributors in the marketplace. We often bid for work knowing that we will have to rent equipment on a short-term basis and we include our assumptions of market equipment rental rates into our bid. If market rates for rental equipment increase between the time of bid submission and project execution, our margins for the project may be reduced. In addition, our equipment requires continuous maintenance, which we generally provide through our own repair facilities. If we are unable to continue to maintain the equipment in our fleet, we may be forced to obtain additional third-party repair services at a higher cost or be unable to bid on contracts.
Claims, lawsuits and proceedings could reduce our profitability and liquidity and weaken our financial condition.
We have in the past been, and may in the future be, subject to various claims, lawsuits and proceedings which arise in the ordinary course of business. Claimants may seek large damage awards and defending claims can involve significant costs. When appropriate, we establish reserves that we believe to be adequate in light of current information, legal advice and professional indemnity insurance coverage, and we adjust such reserves from time to time according to case developments. If our reserves are inadequate, or if in the future our insurance coverage proves to be inadequate or unavailable or there is an increase in liabilities for which we self-insure, we could experience a reduction in our profitability and liquidity. An adverse determination on any such claim, lawsuit or proceeding could have a material adverse effect on our business, financial condition or results of operations. In addition, claims, lawsuits and proceedings may harm our reputation or divert management resources away from operating our business.
We extend credit to customers for purchases of our services. In the past we have had, and in the future we may have, difficulty collecting receivables from customers that are subject to protection under bankruptcy or insolvency laws, are otherwise experiencing financial difficulties or dispute the amount owed to us.
We grant credit, generally without collateral, to our customers located throughout the U.S. and abroad. Consequently, we are subject to potential credit risk related to changes in the electric power and gas utility
24
Table of Contents
industries and their performance. Please refer to Note 1(f) of our consolidated financial statements and “Management’s Discussion and Analysis of Financial Condition and Results of Operations—Concentration of Credit Risk” for additional information regarding the concentration of our credit risk among our larger customers. If any of our large customers, some of which are highly leveraged, file for bankruptcy or experience financial difficulties, we could suffer reduced cash flows and losses in excess of current allowances provided. We could also experience adverse financial effects if our customers dispute or refuse to pay the amounts owed to us for various reasons, such as disagreement as to the terms of the governing contract, or dissatisfaction with the quality or timing of the work we performed.
The current economic downturn has adversely affected many of our customers and increased the risk that a greater percentage of our accounts receivable will not be collectible. Our allowance for doubtful accounts was 1.1% of accounts receivable at June 30, 2009. We cannot assure you that this estimate will be realized or that the allowance will be sufficient.
Skilled labor shortages and increased labor costs could negatively affect our ability to operate efficiently and profitably and could delay or prevent achievement of our business strategy.
Our ability to maintain our productivity and profitability could be limited by our ability to employ, train and retain skilled personnel necessary to meet our requirements. We may not be able to maintain an adequately skilled labor force necessary to operate efficiently and to support our growth strategy. We have from time to time experienced shortages of certain types of qualified personnel such as project managers, field supervisors, linemen and other skilled workers capable of working on and supervising the construction of high-voltage electric power lines and substations. Labor shortages become particularly acute during periods with high volumes of storm restoration services work during which linemen are frequently recruited across geographic regions to satisfy demand. Many linemen are willing to travel in order to earn premium wages for such work, which from time to time makes it difficult for us to retain these workers for ongoing projects. The commencement of new, large-scale infrastructure projects or increased demand for infrastructure improvements as well as the aging utility workforce further depletes the pool of skilled workers available to us, even if we are not awarded such projects. Labor shortages or increased labor costs could impair our ability to maintain our business or grow our revenues. In particular, execution of CREZ work that we may be awarded under the Oncor alliance agreement will require us to hire several hundred additional skilled workers (including linemen). We can give no assurance that we will be able to hire these workers at reasonable costs or that we will not be required to reallocate labor resources from other jobs, which could reduce our anticipated profitability or our ability to fully realize the benefits of the Oncor alliance agreement.
We are subject to the risks associated with government construction projects.
Our utility customers often engage us to provide services on government construction projects, and we also provide services directly on government construction projects, primarily for state and local governments. We are therefore exposed to the risks associated with government construction projects, including the risks that spending on construction may be reduced, pending projects may be terminated or curtailed and planned projects may not be pursued as expected or at all as a result of the economic downturn or otherwise. In addition, government customers typically can terminate or modify any of their contracts at their convenience, and some of these government contracts are subject to renewal or extension annually. If a government customer terminates or modifies a contract, our backlog and revenue may be reduced or we may incur a loss, either of which could impair our financial condition and operating results. A termination due to our unsatisfactory performance could expose us to liability and adversely affect our ability to compete for future projects and orders. In cases where we are a subcontractor, the primary contract under which we subcontract could be terminated, regardless of the quality of our services as a subcontractor or our relationship with the relevant government customer.
The risks of government construction projects also include the increased risk of civil and criminal fines and penalties for violations of applicable regulations and statutes and the risk of public scrutiny of our performance
25
Table of Contents
on high profile sites. In addition, our failure to comply with the terms of one or more of our government contracts, other government agreements, or government regulations and statutes could result in our being suspended or barred from future government construction projects for a significant period of time. We could also be indirectly exposed to certain of these risks when we indemnify our customers performing work on government construction projects.
We may incur warranty costs that could adversely affect our profitability.
Under almost all of our contracts, we warrant certain aspects of our maintenance and construction services. For example, we provide warranties on certain work we perform for Oncor under our alliance agreement, with some of the warranty periods lasting for as long as 15 years. In the past, our warranty expense relating to these services have not been significant, and no reserve has been provided. However, we cannot assure you that significant warranty claims will not be made in the future. We maintain a 20-year warranty program relating to our cable remediation services. Warranty expense for this service was $1.8 million, $1.7 million and $0.6 million during the years ended December 31, 2007 and 2008 and the six months ended June 30, 2009, respectively. A warranty reserve of $1.9 million and $2.0 million was recorded as of December 31, 2008 and June 30, 2009, respectively. To the extent we incur substantial warranty claims in any period, our reputation, our ability to obtain future business from our customers and our profitability could be adversely affected.
Our failure to comply with environmental laws could result in significant liabilities.
We are subject to numerous federal, state and local environmental laws and regulations governing our operations, including the handling, transportation, remediation and disposal of non-hazardous and hazardous substances and wastes, as well as emissions and discharges into the environment, including discharges to air, surface water, groundwater and soil. We also are subject to laws and regulations that impose liability and clean-up responsibility for releases of hazardous substances into the environment. The presence of contamination from or wastes on our properties or at a job site could interfere with ongoing operations. In addition, a part of our business is done in the Southwestern U.S. where we run a greater risk of fines, work stoppages or other sanctions for disturbing Native American artifacts and archeological sites.
New laws and regulations, stricter enforcement of existing laws and regulations, the discovery of previously unknown contamination or leaks, or the imposition of new clean-up requirements could require us to incur significant costs or could become the basis for new or increased liabilities that could harm our financial condition and results of operations. In certain instances, we have obtained indemnification or covenants from third parties (including predecessors or lessors) for some or all of such clean-up and other obligations and liabilities. However, such third-party indemnities or covenants may not cover all of our costs and such unanticipated obligations or liabilities, or future obligations and liabilities, may have a material adverse effect on our financial condition, results of operations and cash flows.
We may be unable to retain the subcontractors we rely on to complete certain projects, and the use of subcontractors may cause project delays, result in additional costs, reduce profitability and/or damage customer relationships.
We use subcontractors to perform portions of some of our contracts, which can reduce our margins. We are not dependent on any single subcontractor. However, general market conditions may limit the availability of subcontractors on which we rely to perform portions of our contracts. In addition, we are responsible to our customers for the work performed by our subcontractors. Failure by a subcontractor to satisfactorily perform its portion of the project in a timely, safe and cost-effective manner may result in delays in the overall progress of the project, cause us to incur additional costs and/or damage customer relationships. While we typically receive indemnities from most of our subcontractors covering certain claims, we may not be able to recover under those indemnities or they may not be adequate.
26
Table of Contents
We may pay our suppliers and subcontractors before receiving payment from our customers for the related services.
We rely on suppliers to obtain the necessary materials and subcontractors to perform portions of our services. In some cases, we pay our suppliers and subcontractors before our customers pay us for the related services. If we pay our suppliers and subcontractors for materials purchased and work performed for customers who fail to pay, or delay paying, us for the related work, we could experience a material adverse effect on our financial condition, results of operations and cash flows.
Increases in the costs of fuel could reduce our operating margins.
The price of fuel is unpredictable and fluctuates based on circumstances outside our control, including global economic trends, geopolitical developments, supply and demand for oil and natural gas, actions by OPEC and other oil and natural gas producers, war and unrest in oil producing countries, regional production patterns and environmental concerns. Most of our contracts do not allow us to adjust our pricing to account for these circumstances and we have not hedged our fuel costs. Fuel costs adversely affected our 2007 and 2008 financial performance and future variability in fuel costs could reduce our profitability and liquidity.
We depend on our ability to protect our intellectual property and proprietary rights in our cable restoration and testing businesses, and we cannot be certain of their confidentiality and protection.
Our success in the cable restoration and testing markets depend in part on our ability to protect our proprietary products and services. If we are unable to do so, our cable restoration and testing businesses may be adversely affected. To protect our proprietary technology, we rely primarily on trade secrets and confidentiality restrictions in contracts with employees, customers and other third parties. We also have a license to the patents Dow Corning Corporation holds from the U.S. Patent and Trademark Office relating to our CableCURE® product, but the underlying patents and license expire in August 2010. In addition, we hold a number of U.S. and international patents, most of which relate to certain materials used in treating cables with CableCURE®. We also hold the patent and trademark to CableWISE®. If we fail to protect our intellectual property rights adequately, and upon expiration of those rights, our competitors may gain access to our technology, and our cable restoration business may be harmed. Any of our intellectual property rights may be challenged by others or invalidated through administrative processes or litigation proceedings. In addition, we may be unable to obtain protection on products that we spend significant time and expense to develop in the future. Despite our efforts to protect our proprietary technology, unauthorized persons may be able to copy, reverse engineer or otherwise use some of our proprietary technology. Furthermore, existing laws may afford only limited protection, and the laws of certain countries in which we operate do not protect proprietary technology as well as established law in the U.S. For these reasons, we may have difficulty protecting our proprietary technology against unauthorized copying or use or maintaining our market share with respect to our proprietary technology offerings. In addition, litigation may be necessary to protect our proprietary technology. This type of litigation is often costly and time consuming, with no assurance of success.
We may incur goodwill and amortizable intangible asset impairment charges which could harm our profitability.
In connection with the TPF Acquisition and the Hawkeye Acquisition, we recorded $138.1 million in goodwill and $124.3 million of amortizable intangible assets based on the application of purchase accounting.
Statement of Financial Accounting Standards No. 142, Goodwill and Other Intangible Assets (SFAS 142), provides that goodwill and other intangible assets that have indefinite useful lives not be amortized, but instead be tested at least annually for impairment and intangible assets that have finite useful lives continue to be amortized over their useful lives. SFAS 142 provides specific guidance for testing goodwill and other non-amortized intangible assets for impairment. SFAS 142 requires management to make certain estimates and assumptions when allocating goodwill to reporting units and determining the fair value of reporting unit net
27
Table of Contents
assets and liabilities, including, among other things, an assessment of market conditions, projected cash flows, investment rates, cost of capital and growth rates, which could significantly impact the reported value of goodwill and other intangible assets. Fair value is determined using accepted present value methodologies. Absent a change of circumstances indicating that additional impairment may have occurred (as we experienced in our Eastern reporting unit in 2008), we historically performed our impairment tests annually as of April 30. We recorded goodwill impairment charges of $35.5 million and $45.3 million in 2007 and 2008, respectively. No impairment charges were required as a result of our April 30, 2009 evaluation. See “Management’s Discussion and Analysis of Financial Condition and Results of Operations—Critical Accounting Policies” for additional information.
We review our intangible assets with finite lives for impairment when events or changes in business conditions indicate the carrying value of the asset groups may not be recoverable, as required by Statement of Financial Accounting Standards No. 144, Accounting for the Impairment or Disposal of Long-Lived Assets (SFAS 144). An indication of impairment of intangible assets or asset groups with finite lives exists if the sum of the undiscounted estimated future cash flows expected is less than the carrying value of the assets. If this measurement indicates a possible impairment, we compare the estimated fair value of the asset group to the net book value to measure the impairment charge, if any. In 2008, we recognized a $7.6 million intangible asset impairment charge relating to a small operating unit that experienced the departure of its president and former owner during the year and is now being combined with our other operating units.
We cannot predict the occurrence of future events or performance that might adversely affect the reported value of goodwill and other intangible assets that totaled $57.4 million and $91.1 million (net of accumulated amortization), respectively, as of June 30, 2009. Such events include strategic decisions made in response to economic and competitive conditions, the impact of the economic environment on our customer base, material negative changes in our relationships with material customers and other factors. Future impairments, if any, will be recognized as operating expenses and, as such, negatively impact our results of operations in the period in which the impairment is recorded.
Our future growth may require new levels of surety bonding, and we may be unable to compete for or work on certain projects if we are not able to obtain the necessary bonding.
Some of our customers require that we provide security for the bidding and performance of their projects. This security may be in the form of bonds whereby a commercial surety provides for the benefit of the customer a bond insuring we will undertake the work awarded to us, a “bid bond,” a bond insuring completion of the project, a “performance bond,” and/or a bond insuring persons furnishing labor and materials to the project are paid, a “payment bond.” Further, under standard terms in the surety market, sureties issue or continue bonds on a project-by-project basis and can decline to issue bonds at any time or require the posting of additional collateral as a condition to issuing or renewing any bonds. Surety market conditions are currently difficult given the severe disruption of the credit markets, and bonding capacity could become less available in the market or terms could become more expensive and restrictive. Our future growth and the projects we pursue may require significantly higher bonding levels, which may not be available.
In addition, our ability to obtain surety bonds depends upon various factors including our capitalization, working capital and amount of our indebtedness. These factors may limit our ability to incur additional indebtedness that could be necessary to refinance our existing credit facilities upon maturity or to execute our business plan.
Current or future market conditions, as well as changes in our surety’s assessment of our operating and financial risk, could cause our surety provider to decline to issue or renew, or substantially reduce the amount of, bonds for our work and could increase our bonding costs. These actions could be taken on short notice. If our surety provider was to limit or eliminate our access to bonding, our alternatives would include seeking bonding capacity from other sureties, finding more business that does not require bonds and posting other forms of
28
Table of Contents
collateral for project performance, such as letters of credit or cash. We may be unable to secure these alternatives in a timely manner, on acceptable terms, or at all. Accordingly, if we were to experience an interruption or reduction in the availability of bonding capacity, we may be unable to compete for or work on certain projects and such interruption or reduction could have a material adverse effect on our financial condition, results of operations and cash flows.
Risks Relating to This Offering
Our controlling shareholder may take actions that conflict with your interests.
Immediately following this offering and assuming the sale of all of the shares being registered on behalf of TPF, approximately % of our common stock will be beneficially owned by TPF ( % if the underwriters exercise their over-allotment option in full). If TPF sells less than all of the shares being registered on its behalf, these percentages would increase. Because of these holdings, TPF will be able to exercise control over all matters requiring shareholder approval, including the election of directors, amendment of our articles of incorporation and approval of significant corporate transactions, and it will have significant control over our management and policies. The directors elected by TPF will be able to significantly influence decisions affecting our capital structure. This control may delay or prevent changes in control or changes in management or limit the ability of our other shareholders to approve transactions that they may deem to be in their best interest.
We will be a “controlled company” within the meaning of the NYSE rules and, as a result, will rely on exemptions from certain corporate governance requirements that provide protection to shareholders of other companies.
Upon completion of this offering, TPF will own more than 50% of the total voting power of our common shares and we will be a controlled company under the NYSE corporate governance standards. As a controlled company, certain exemptions under the NYSE standards will free us from the obligation to comply with certain NYSE corporate governance requirements, including the requirements:
| • | that a majority of our board of directors consist of “independent directors,” as defined under the rules of the NYSE; |
| • | that we have a corporate governance and nominating committee that is composed entirely of independent directors with a written charter addressing the committee’s purpose and responsibilities; |
| • | that we have a compensation committee that is composed entirely of independent directors with a written charter addressing the committee’s purpose and responsibilities; and |
| • | for an annual performance evaluation of the nominating and governance committee and compensation committee. |
Accordingly, for as long as we are a controlled company, you will not have the same corporate governance protections afforded to shareholders of companies that are subject to all of the NYSE corporate governance requirements.
There has been no prior market for our common stock, and an active trading market may not develop.
Prior to this offering, there has been no public market for our common stock. An active trading market may not develop following the closing of this offering or, if developed, may not be sustained. The lack of an active market may impair your ability to sell your shares at the time you wish to sell them or at a price that you consider reasonable. The lack of an active market may also reduce the fair market value and increase the volatility of your shares. An inactive market may also impair our ability to raise capital by selling shares and may impair our ability to acquire other companies or assets by using our shares as consideration.
29
Table of Contents
The price of our common stock may fluctuate substantially.
The initial public offering price for the shares of our common stock sold in this offering will be determined by negotiation between the representatives of the underwriters and us. This price may not reflect the market price of our common stock following this offering. In addition, the market price of our common stock is likely to be highly volatile and may fluctuate substantially due to many factors, including:
| • | the timing and volume of work under contract; |
| • | weather-related disruptions; |
| • | the budgetary spending patterns of customers; |
| • | changes in government programs or spending, including Texas’ CREZ plan, other RPS initiatives and ARRA; |
| • | variations in the margins of projects performed during any particular quarter; |
| • | increases in design and construction costs that we are unable to pass through to our customers; |
| • | the termination of existing agreements; |
| • | the highly volatile and uncertain revenues derived from our storm restoration services; |
| • | losses experienced in our operations not otherwise covered by insurance; |
| • | a change in the mix of our customers, contracts and business; |
| • | fluctuations in fuel prices; |
| • | payment risk associated with the financial condition of our customers; |
| • | reduced profitability and cost overruns on fixed-price contracts; |
| • | availability of qualified labor hired for specific projects; |
| • | changes in bonding requirements applicable to existing and new agreements; |
| • | costs we incur to support growth internally or through acquisitions or otherwise; |
| • | actual or anticipated fluctuations in our results of operations; |
| • | variance in our financial performance from the expectations of market analysts; |
| • | conditions and trends in the end markets we serve and changes in the estimation of the size and growth rate of these markets; |
| • | announcements of significant contracts, acquisitions or capital commitments by us or our competitors; |
| • | loss of one or more of our significant customers; |
| • | terrorist attacks; |
| • | legislation; |
| • | regulation influencing or requiring our public utility customers to reduce, delay or eliminate spending on the services we perform; |
| • | availability of capital; |
| • | changes in market valuation or earnings of our competitors; |
| • | the trading volume of our common stock; |
| • | the current weakness in the financial and credit markets; and |
| • | general economic conditions, including the current economic downturn. |
30
Table of Contents
In addition, the U.S. stock markets in general, the NYSE and the trading market for infrastructure service companies in particular, have at times, including recently, experienced extreme price and volume fluctuations that have often been unrelated or disproportionate to the operating performance of particular companies affected. These broad market and industry factors may materially harm the market price of our common stock, regardless of our operating performance. In the past, following periods of volatility in the market price of a company’s securities, securities class-action litigation has often been instituted against that company. Such litigation, if instituted against us, could result in substantial costs and a diversion of management’s attention and resources.
We currently do not intend to pay dividends on our common stock and, consequently, your only opportunity to achieve a return on your investment is if the price of our common stock appreciates.
We currently do not plan to declare dividends on shares of our common stock in the foreseeable future. Further, the payment of dividends by us is restricted by our credit facilities. See “Dividend Policy” for more information. Consequently, your only opportunity to achieve a return on your investment in our company will be if the market price of our common stock appreciates and you sell your shares at a profit.
This offering will cause substantial immediate dilution in net tangible book value of your shares, and you may experience dilution of your ownership interests if we issue additional shares of our common stock in the future.
The initial public offering price of our common stock is considerably more than the net tangible book value per share of our outstanding common stock. Accordingly, investors purchasing shares of common stock in this offering will contribute % of the total amount invested to fund our company, but will own only % of the shares of common stock outstanding after this offering. See “Dilution” for more information.
We may in the future issue additional shares resulting in the dilution of the ownership interests of our present shareholders and purchasers of our common stock offered hereby. We are currently authorized to issue 300,000,000 shares of common stock and 200,000,000 shares of preferred stock with such designations, preferences and rights as determined by our board of directors. As of the date of this prospectus, there were shares of our common stock outstanding, which does not include shares reserved for issuance pursuant to our stock incentive plan, including outstanding options to purchase shares and options to purchase an additional shares available for future grants. The potential issuance of such additional shares of common stock may create downward pressure on the trading price of our common stock, if a market for our stock were to develop. Also, we have issued, and we may issue additional, shares of our common stock or other securities that are convertible into or exercisable for common stock in connection with additional equity-based compensation to existing employees, the hiring of personnel, future acquisitions, future private placements of our securities for capital raising purposes, or for other business purposes.
Future offerings of debt securities, which would rank senior to our common stock upon our liquidation, and future offerings of equity securities, which would dilute our existing shareholders and may be senior to our common stock for the purposes of dividend and liquidating distributions, may adversely affect the market value of common stock.
In the future, we may attempt to increase our capital resources by making offerings of debt or additional offerings of equity securities, including commercial paper, medium-term notes, senior or subordinated notes and classes of preferred stock. Upon liquidation, holders of our debt securities and preferred stock and lenders with respect to other borrowings will receive a distribution of our available assets prior to the holders of our common stock. Our preferred stock, if issued, could have a preference on liquidating distributions or a preference on dividend payments that could limit our ability to make a dividend distribution to the holders of our common stock. Because our decision to issue securities in any future offering will depend on market conditions and other factors beyond our control, we cannot predict or estimate the amount, timing or nature of our future offerings. Thus, holders of our common stock bear the risk of our future offerings reducing the market value of our common stock and diluting their share holdings in us.
31
Table of Contents
Future sales of our common stock could have an adverse effect on our share price.
In general, under Rule 144, a person (or persons whose shares are aggregated) who (i) is not an affiliate of ours, (ii) has not been one of our affiliates at any time during the three months preceding a sale and (iii) has beneficially owned the shares proposed to be sold for at least one year, including the holding period of any prior owner other than an affiliate, is entitled to sell his or her shares without registration and without complying with the manner of sale, public information, volume limitation, or notice provisions of Rule 144. In addition, under Rule 144, once we have been subject to the reporting requirements of the Exchange Act for at least 90 days, a person (or persons whose shares are aggregated) who is not an affiliate of ours and has not been one of our affiliates at any time during the three months preceding a sale, may sell his or her shares without registration, subject to the continued availability of current public information about us after only a six-month holding period, subject to any contractual lock-up restrictions. Any sales by affiliates under Rule 144, even after the applicable holding periods, are subject to requirements and/or limitations with respect to volume, manner of sale, notice and the availability of current public information about us. As shares of our common stock become eligible for sale under Rule 144, the volume of sales of our common stock on applicable securities markets may increase, which could reduce the market value of our common stock.
As of the date of this prospectus, there were shares of our common stock outstanding. The market price of the shares of our common stock could decline as a result of sales by our shareholders or the perception that such sales might occur after the termination of the lock-up restrictions to which our directors and certain members of management are subject. If any of our existing shareholders, including TPF, which will hold approximately % of our common stock following this offering, sell a significant number of shares, the market price of our common stock could be adversely affected and our ability to raise capital may be impaired.
We will incur increased costs as a result of being a public company.
As a privately held company, we have not been responsible for the corporate governance and financial reporting practices and policies required of a public company. Following the effectiveness of the registration statement of which this prospectus forms a part, we will be a public company. Once we become a public company, we will incur significant legal, accounting, investor relations and other expenses that we do not currently incur. In addition, the Sarbanes-Oxley Act of 2002, as well as other rules implemented by the SEC and, to the extent applicable to us, the NYSE or other stock exchanges, require changes in corporate governance practices of public companies. We expect these rules and regulations to increase our legal and financial compliance costs and to make some activities more time-consuming and costly.
Anti-takeover provisions in our charter documents and under Washington law could delay or prevent a change of control of our company and may result in an entrenchment of management and diminish the value of our common stock.
Our articles of incorporation and bylaws will, upon the closing of this offering, contain provisions that could depress the trading price of our common stock by acting to discourage, delay or prevent a change of control of our company or changes in management that our shareholders might deem advantageous. Specific provisions in our articles of incorporation and bylaws will include our ability to issue preferred stock with terms that the board of directors may determine without shareholder approval, advance notice requirements for shareholder proposals and nominations, the absence of cumulative voting in the election of directors, a staggered board of directors with classified terms, removal of directors only for cause and limitations on convening shareholder meetings. In addition, the provisions of Section 23B.19.040 of the Washington Business Corporation Act govern us. These provisions may prohibit large shareholders, in particular those owning 10% or more of our outstanding voting stock, from merging or combining with us for five years unless our board of directors approves such a transaction. These and other provisions in our articles of incorporation, our bylaws and under Washington law may frustrate attempts to effect a takeover transaction that is in the best interests of our minority shareholders. Even in the absence of a takeover attempt, the existence of these provisions may adversely affect the prevailing market price of our common stock if they are viewed as discouraging future takeover attempts.
32
Table of Contents
This prospectus contains forward-looking statements about us and our industry that involve substantial risks and uncertainties. All statements, other than statements of historical facts, included in this prospectus regarding our strategy, future operations, future financial position, future net sales, projected expenses, prospects and plans and objectives of management are forward-looking statements. In some cases, you can identify forward-looking statements by terms such as “anticipate,” “believe,” “estimate,” “expect,” “intend,” “may,” “might,” “plan,” “project,” “will,” “would,” “should,” “could,” “can,” “predict,” “potential,” “continue,” “objective,” or the negative of these terms and similar expressions intended to identify forward-looking statements. However, not all forward-looking statements contain these identifying words.
Forward-looking statements reflect our current views about future events and are based on assumptions and subject to risks and uncertainties. Given these uncertainties, you should not place undue reliance on these forward-looking statements. These statements involve known and unknown risks, uncertainties and other factors that may cause our actual results, levels of activity, performance or achievement to be materially different from those expressed or implied by the forward-looking statements. Important factors that could cause such differences include, but are not limited to:
| • | we are vulnerable to industry, regional and national downturns, including the current economic downturn; |
| • | reduction or lack of improvement in the level of maintenance and capital expenditures on infrastructure; |
| • | award of new contracts and the timing of these awards; |
| • | significant competition in our industry; |
| • | our loss of key customers; |
| • | federal and state legislation and regulations relating to electric power transmission and pipeline infrastructure may fail to result in increased demand for our services; |
| • | our ability to successfully implement our acquisition strategy or integrate acquired businesses; |
| • | our ability to access capital or credit markets as necessary to pursue our acquisition and growth strategy; |
| • | seasonal variations and inclement weather; |
| • | our customers often have no obligation to award us work and many of our contracts, including the Oncor alliance agreement, may be terminated on short notice; |
| • | our actual costs may be greater than estimated in performing our fixed-price and unit-price contracts; |
| • | high volatility and unpredictability of storm restoration services; |
| • | skilled labor shortages and increased labor costs; |
| • | our use of percentage-of-completion accounting; |
| • | our failure to complete projects on time and on budget; |
| • | risks associated with government construction projects; |
| • | impact of our unionized workforce; |
| • | incurrence of significant warranty costs; and |
| • | other factors discussed under the headings “Risk Factors,” “Management’s Discussion and Analysis of Financial Condition and Results of Operations,” and “Business.” |
Forward-looking statements speak only as of the date the statements are made. We assume no obligation to update forward-looking statements to reflect actual results, changes in assumptions, or changes in other factors affecting forward-looking information, except to the extent required by applicable securities laws. If we do update one or more forward-looking statements, no inference should be drawn that we will make additional updates with respect to those or other forward-looking statements.
33
Table of Contents
We estimate that the net proceeds to us from this offering will be approximately $ million after deducting estimated underwriting discounts and commissions and estimated offering expenses payable by us based on the midpoint of the range provided on the front cover of this prospectus. We will not receive any of the proceeds from the sale of shares by the selling shareholder. We intend to use the net proceeds to us from this offering to repay approximately $ million of indebtedness outstanding under our credit facilities, the weighted average interest rate of which was 4.6% as of June 30, 2009 and the revolving and term portions of which mature on November 3, 2011 and November 3, 2012, respectively, to redeem $ million of our 15% Senior Redeemable Convertible Cumulative Preferred Stock, and to retain approximately $ million for general corporate purposes, including working capital purposes and to fund future acquisitions, although we have no specific agreements or commitments to consummate any acquisitions. Accordingly, we will have considerable discretion in the application of these remaining proceeds. Pending the uses described above, we intend to invest the net proceeds from this offering received by us in short-term, interest-bearing, investment grade or similar securities.
We currently do not anticipate paying any cash dividends after the offering and for the foreseeable future. Instead, we anticipate that all of our earnings on our common stock will be used to provide working capital, to support our operations and to finance the growth and development of our business. Any future determination relating to dividend policy will be made at the discretion of our board of directors and will depend on a number of factors, including our future earnings, capital requirements, financial condition, future prospects and other factors as our board of directors may deem relevant.
34
Table of Contents
The following table sets forth our capitalization as of June 30, 2009 (without giving effect to the -for- stock split):
| • | on an actual basis; and |
| • | on an as adjusted basis to reflect our receipt and application of the estimated net proceeds, as discussed under “Use of Proceeds,” from the sale by us in this offering of shares of common stock at an assumed public offering price of $ , the midpoint of the estimated price range shown on the cover page of this prospectus, after deducting estimated underwriting discounts and commissions and estimated offering expenses payable by us, as if it had occurred at June 30, 2009. |
You should read the following table in conjunction with “Management’s Discussion and Analysis of Financial Condition and Results of Operations,” “Description of Capital Stock,” and our audited and unaudited consolidated financial statements and related notes appearing elsewhere in this prospectus.
| As of June 30, 2009 | |||||||
| Actual | As Adjusted(1) | ||||||
| (dollars in thousands) | |||||||
| Cash and cash equivalents |
$ | 13,363 | $ | ||||
| Debt (including current portion): |
|||||||
| Term loan |
249,730 | ||||||
| Revolving line of credit(2) |
27,000 | ||||||
| Equipment financing |
2,440 | ||||||
| Capital lease obligations |
10,222 | ||||||
| Total debt (including current portion) |
289,392 | ||||||
| Shareholder’s equity(3): |
|||||||
| Common stock, $0.01 par value, authorized 300,000,000 shares, 48,950,360 shares issued and outstanding, actual; issued and outstanding, as adjusted |
490 | ||||||
| Additional paid-in capital |
186,240 | ||||||
| Accumulated deficit |
(89,374 | ) | |||||
| Accumulated other comprehensive income |
235 | ||||||
| Total shareholder’s equity |
97,591 | ||||||
| Total capitalization |
$ | 386,983 | $ | ||||
The share information in the table above excludes, as of , 2009:
| • | shares of common stock issuable upon the exercise of options outstanding as of June 30, 2009 at a weighted average exercise price of per share; and |
| • | shares of common stock reserved for issuance under our equity incentive plan. |
| (1) | A $1.00 increase (decrease) in the assumed initial public offering price of $ per share of our common stock in this offering would increase (decrease) each of additional paid-in capital, total shareholder equity and total capitalization by $ million, assuming the number of shares offered by us, as set forth on the cover page of this prospectus, remains the same. Similarly, an increase (decrease) in the number of shares we sell in the offering will increase (decrease) our net proceeds by an amount equal to such number of shares multiplied by the public offering price, less underwriting discounts and commissions. |
| (2) | As of June 30, 2009 (actual), we had $59.2 million of availability under the $100.0 million revolving portion of our credit facilities, which is net of $27.0 million of borrowings and $13.8 million of outstanding letters of credit. |
| (3) | We issued $20 million of our 15% Senior Redeemable Convertible Cumulative Preferred Stock to InfrastruX Holdings, LLC in October 2009, $10 million of proceeds from which were used to pay down our term loan. Our “as adjusted” debt reflects this payment and shareholder’s equity reflects redemption of this preferred stock. |
35
Table of Contents
Purchasers of the common stock in the offering will suffer an immediate and substantial dilution in net tangible book value per share. Dilution is the amount by which the initial public offering price paid by purchasers of shares of our common stock exceeds the net tangible book value per share of our common stock after the offering. Net tangible book value represents the amount of our total tangible assets reduced by our total liabilities. Tangible assets equal our total assets less goodwill and intangible assets. Pro forma net tangible book value per share represents our net tangible book value divided by the number of shares of common stock outstanding. As of June 30, 2009, our net tangible book value was $(51.0) million and our net tangible book value per share was $(1.04).
After giving effect to the sale of shares of common stock in the offering at an initial public offering price of $ per share, which is the midpoint of the price range set forth on the cover page of this prospectus, our as adjusted net tangible book value as of June 30, 2009 would have been $ million, or $ per share. This represents an immediate decrease in net tangible book value of $ per share to existing shareholders and an immediate dilution of $ per share to new investors purchasing shares in the offering. The following table illustrates this per share dilution:
| Assumed initial public offering price per share of common stock |
$ | |||||
| As adjusted net tangible book value per share of common stock as of June 30, 2009 |
$ | |||||
| Increase per share of common stock attributable to new investors |
||||||
| Pro forma as adjusted net tangible book value per share of common stock after this offering |
||||||
| Dilution per share of common stock to new investors |
$ | |||||
Our as adjusted net tangible book value after the offering, and the dilution to new investors in the offering, will change from the amounts shown above if the underwriters’ over-allotment option is exercised.
A $1.00 increase or decrease in the assumed initial public offering price of $ per share would increase or decrease, as applicable, our as adjusted net tangible book value per share of common stock by $ and increase or decrease, as applicable, the dilution per share of common stock to new investors by $ , assuming the number of shares offered by us, as set forth on the cover page of this prospectus, remains the same, after deducting the estimated underwriting discounts and commissions and estimated offering expenses payable by us. Similarly, any increase or decrease in the number of shares that we sell in the offering will increase or decrease our net proceeds by such increase or decrease, as applicable, multiplied by the offering price per share, less underwriting discounts and commissions and offering expenses.
The following table sets forth, as of June 30, 2009, on the as-adjusted basis described above, the differences between existing shareholders and new investors with respect to the total number of shares of common stock purchased from us, the total consideration paid and the average price per share paid before deducting underwriting discounts and commissions and estimated offering expenses payable by us, at an assumed initial public offering price of $ per share of common stock (the midpoint of the range set forth on the cover page of this prospectus):
| Total Shares | Total Consideration | Average Price Per Share | ||||||||||||
| Number | Percentage | Amount | Percentage | |||||||||||
| Existing shareholder |
% | $ | % | $ | ||||||||||
| New shareholders in this offering |
$ | |||||||||||||
| Total |
100 | % | $ | 100 | % | |||||||||
36
Table of Contents
A $1.00 increase or decrease in the assumed initial public offering price of $ per share would increase or decrease, as applicable, total consideration paid by new investors, total consideration paid by all shareholders and average price per share paid by all shareholders by $ million, $ million and $ , respectively, assuming the number of shares offered by us, as set forth on the cover page of this prospectus, remains the same. Similarly, any increase or decrease in the number of shares that we sell in the offering will increase or decrease our net proceeds by such increase or decrease, as applicable, multiplied by the offering price per share, less underwriting discounts and commissions and offering expenses.
If the underwriters’ over-allotment option is exercised in full, the number of shares held by existing shareholders after this offering would be , or %, and the number of shares held by new investors would increase to , or %, of the total number of shares of our common stock outstanding after this offering.
37
Table of Contents
SELECTED CONSOLIDATED FINANCIAL AND OTHER DATA
The consolidated statement of operations for the years ended December 31, 2004 and 2005 and the consolidated balance sheet data as of December 31, 2004, 2005 and 2006 have been derived from our audited consolidated financial statements not included in this prospectus. The consolidated statement of operations for the periods January 1, 2006 to May 7, 2006 and May 8, 2006 to December 31, 2006 and for the years ended December 31, 2007 and 2008 and the consolidated balance sheet data as of December 31, 2007 and 2008 have been derived from our audited consolidated financial statements included elsewhere in this prospectus, which include, with respect to the periods presented below, our results prior to the TPF Acquisition for the period January 1, 2006 to May 7, 2006 and our results since TPF Acquisition for the period May 8, 2006 (inception) to December 31, 2006 and for the years ended December 31, 2007 and 2008. The consolidated statement of operations for each of the six months ended June 30, 2008 and 2009 and the consolidated balance sheet data as of June 30, 2009 have been derived from our unaudited consolidated financial statements included elsewhere in this prospectus. You should read the following selected consolidated financial and other data in conjunction with “Management’s Discussion and Analysis of Financial Condition and Results of Operations,” and our consolidated financial statements and related notes included elsewhere in this prospectus.
| Predecessor(1) | Successor(1) | |||||||||||||||||||||||||||||||||||||
| Years Ended December 31, |
Period January 1, 2006 to May 7, 2006 |
Period May 8, 2006 to December 31, 2006 |
Combined Year Ended December 31, 2006 |
Year Ended December 31, |
Six Months Ended June 30, |
|||||||||||||||||||||||||||||||||
| 2004 | 2005 | 2007 | 2008 | 2008 | 2009 | |||||||||||||||||||||||||||||||||
| (unaudited) | (unaudited) | |||||||||||||||||||||||||||||||||||||
| (dollars in thousands, except per share data) | ||||||||||||||||||||||||||||||||||||||
| Consolidated Statement of Operations Data: |
||||||||||||||||||||||||||||||||||||||
| Revenues |
$ | 369,936 | $ | 393,570 | $ | 141,606 | $ | 341,586 | $ | 483,192 | $ | 657,180 | $ | 826,962 | $ | 401,675 | $ | 316,788 | ||||||||||||||||||||
| Cost of revenues |
313,606 | 327,018 | 119,956 | 284,609 | 404,565 | 581,666 | 701,035 | 347,593 | 285,689 | |||||||||||||||||||||||||||||
| Gross profit |
56,330 | 66,552 | 21,650 | 56,977 | 78,627 | 75,514 | 125,927 | 54,082 | 31,099 | |||||||||||||||||||||||||||||
| Selling, general and administrative |
35,826 | 35,436 | 21,037 | 31,733 | 52,770 | 51,122 | 85,882 | (2) | 31,188 | 30,378 | ||||||||||||||||||||||||||||
| Goodwill / intangibles impairment |
91,196 | 13,874 | — | — | — | 35,484 | 52,888 | 34,104 | — | |||||||||||||||||||||||||||||
| Amortization of intangibles(3) |
2,097 | 2,123 | 459 | 3,190 | 3,649 | 7,818 | 7,445 | 3,830 | 3,606 | |||||||||||||||||||||||||||||
| Total operating expenses |
129,119 | 51,433 | 21,496 | 34,923 | 56,419 | 94,424 | 146,215 | 69,122 | 33,984 | |||||||||||||||||||||||||||||
| Income (loss) from operations |
(72,789 | ) | 15,119 | 154 | 22,054 | 22,208 | (18,910 | ) | (20,288 | ) | (15,040 | ) | (2,885 | ) | ||||||||||||||||||||||||
| Interest expense, net |
6,610 | 8,975 | 2,934 | 16,028 | 18,962 | 33,029 | 27,468 | 13,298 | 7,443 | |||||||||||||||||||||||||||||
| Other expenses (income), net |
108 | (199 | ) | (11 | ) | 9,122 | 9,111 | 4,238 | 2,840 | 1,372 | 1,551 | |||||||||||||||||||||||||||
| Income (loss) before income taxes |
(79,507 | ) | 6,343 | (2,769 | ) | (3,096 | ) | (5,865 | ) | (56,177 | ) | (50,596 | ) | (29,710 | ) | (11,879 | ) | |||||||||||||||||||||
| Income tax benefit (expense) |
19,818 | (8,482 | ) | 237 | 1,152 | 1,389 | 14,376 | 14,028 | 8,722 | 2,818 | ||||||||||||||||||||||||||||
| Net loss |
$ | (59,689 | ) | $ | (2,139 | ) | $ | (2,532 | ) | $ | (1,944 | ) | $ | (4,476 | ) | $ | (41,801 | ) | $ | (36,568 | ) | $ | (20,988 | ) | $ | (9,061 | ) | |||||||||||
| Net Loss Per Share Data: |
||||||||||||||||||||||||||||||||||||||
| Basic |
$ | (0.04 | ) | $ | (0.09 | ) | $ | (0.85 | ) | $ | (0.75 | ) | $ | (0.43 | ) | $ | (0.18 | ) | ||||||||||||||||||||
| Diluted |
$ | (0.04 | ) | $ | (0.09 | ) | $ | (0.85 | ) | $ | (0.75 | ) | $ | (0.43 | ) | $ | (0.18 | ) | ||||||||||||||||||||
| Weighted average shares outstanding, basic and diluted |
46,541,862 | 48,950,360 | 48,950,360 | 48,950,360 | 48,950,360 | 49,099,673 | ||||||||||||||||||||||||||||||||
| Other Data: |
||||||||||||||||||||||||||||||||||||||
| Adjusted EBITDA(4) |
$ | 43,542 | $ | 48,928 | $ | 11,146 | $ | 48,561 | $ | 59,707 | $ | 58,241 | $ | 95,155 | $ | 41,301 | $ | 21,439 | ||||||||||||||||||||
| Backlog(5) |
172,000 | 192,000 | 266,000 | 340,000 | 340,000 | 368,000 | 472,000 | 476,000 | 384,000 | |||||||||||||||||||||||||||||
| Capital expenditures |
15,891 | 13,768 | 2,242 | 15,995 | 18,237 | 24,502 | 34,521 | 23,687 | 18,394 | |||||||||||||||||||||||||||||
| Working capital(6) |
62,812 | 57,054 | 61,850 | 117,018 | 117,018 | 103,316 | 101,955 | 118,698 | 109,314 | |||||||||||||||||||||||||||||
38
Table of Contents
| December 31, | June 30, | |||||||||||||||||
| 2004 | 2005 | 2006 | 2007 | 2008 | 2009 | |||||||||||||
| (unaudited) | ||||||||||||||||||
| Consolidated Balance Sheet Data: | (dollars in thousands) | |||||||||||||||||
| Cash and cash equivalents |
$ | 6,817 | $ | 6,187 | $ | 17,281 | $ | 17,450 | $ | 20,580 | $ | 13,363 | ||||||
| Total assets |
276,016 | 257,552 | 588,330 | 568,469 | 557,873 | 519,431 | ||||||||||||
| Long-term debt, including current portion |
159,402 | 130,299 | 312,894 | 264,575 | 257,940 | 279,170 | ||||||||||||
| Total shareholder’s equity |
52,388 | 50,267 | 129,630 | 137,971 | 105,613 | 97,591 | ||||||||||||
| (1) | Our financial statements for the period prior to May 8, 2006 (our predecessor period) were prepared on the historical cost basis of accounting. Our financial statements for periods subsequent to May 8, 2006 (our successor periods) reflect the application of purchase accounting to the TPF Acquisition, which required that we record our assets and liabilities at fair value as of May 8, 2006. This included $82.2 million of goodwill, $67.1 million of intangibles and $14.2 million of property and equipment, which caused an increase in amortization of intangibles and depreciation expense in our successor periods as compared to our predecessor period. In addition, our financial statements for the successor periods include Hawkeye from the date of the Hawkeye Acquisition on November 3, 2006. As a result, our results for the successor periods are not comparable to the predecessor periods, and our combined results for the year ended December 31, 2006 are not comparable to other periods presented. Loss per share amounts for the combined year ended December 31, 2006 are based on 48,950,360 shares outstanding as of December 31, 2006. |
| (2) | Includes $17.5 million relating to an earnout paid to the former owners of Hawkeye and $4.3 million in share-based compensation under our equity incentive plan. |
| (3) | Excludes developed technology intangible amortization recorded to cost of revenues. See Note 4 of our consolidated financial statements. |
| (4) | See “Management’s Discussion and Analysis of Financial Condition and Results of Operations—Non-GAAP Discussion.” |
| (5) | Backlog represents the amount of revenue that we expect to realize over the next 12 months from work to be performed on uncompleted contracts, including new contracts on which work has not begun. Our backlog estimate includes amounts under MSAs, our alliance agreement with Oncor and project-by-project bid work. We estimate the amount of work under MSAs to be disclosed as backlog based upon recurring historical trends inherent in the current MSAs, factoring in management’s expectations given seasonal demands and economic conditions and projected customer needs based upon ongoing communications with the customer. However, our MSAs rarely have minimum volume or spending obligations, and many of our contracts may be terminated on short notice, typically zero to 90 days. There can be no assurance as to our customers’ requirements or that our estimates are accurate. In addition, many of our MSAs are subject to renewal options. For purposes of calculating backlog, we have included future renewal options only to the extent we consider the renewals highly likely to occur. With respect to project-by-project bid work, we include the full amount of revenue we expect to realize in the next 12 months on the uncompleted portion of the contract in our estimate of backlog. Our reported backlog as of December 31, 2008 and June 30, 2009 reflect only nominal amounts of work to be performed under the CREZ plan. |
| (6) | Working capital represents total current assets less total current liabilities. |
39
Table of Contents
MANAGEMENT’S DISCUSSION AND ANALYSIS OF FINANCIAL CONDITION AND RESULTS OF OPERATIONS
You should read the following discussion and analysis of our results of operations, financial condition and liquidity in conjunction with our consolidated financial statements and related notes included elsewhere in this prospectus. The following discussion gives effect to the TPF Acquisition. As a result, our consolidated financial statements reflect our financial position as of December 31, 2007 and 2008 and June 30, 2009 and the results of operations and cash flows for the period May 8, 2006 (the date of the TPF Acquisition) to December 31, 2006 and for each of the years ended December 31, 2007 and 2008 and the six months ended June 30, 2008 and 2009 and the results of operations and cash flows of InfrastruX Group, Inc. and its consolidated subsidiaries prior to the TPF Acquisition for the period January 1, 2006 to May 7, 2006. To assist in understanding our business, we have compared our results for the year ended December 31, 2007 to our combined results before and after the TPF Acquisition for the year ended December 31, 2006. Some of the information contained in this discussion and analysis or set forth elsewhere in this prospectus, including information with respect to our plans and strategies for our business, includes forward-looking statements. You should review the “Risk Factors” section of this prospectus for a discussion of important factors that could cause actual results to differ materially from the results described in or implied by these forward-looking statements. Please refer to “Forward-Looking Statements” included elsewhere in this prospectus for more information.
Overview
We are a leading national provider of maintenance and construction services to the electric power and natural gas T&D infrastructure markets based on revenue. We combine our project management expertise, large skilled workforce and equipment fleet to provide utilities and energy companies with a broad range of complementary T&D services, including maintenance, construction, repair and emergency storm response. We are one of only a small number of companies that can offer “end-to-end” energy infrastructure services, covering the entire delivery process from the energy source to the end user. In the electric power market, we are one of the largest national contractors servicing the T&D sector based on revenue, and our comprehensive infrastructure service capabilities include overhead and underground electric power transmission lines, substations and distribution lines. In the natural gas market, we serve our customers’ gas transportation infrastructure needs from the wellhead to gathering lines, pipelines, compressor stations and local distribution systems. We also provide a range of complementary services, including, CableCURE® underground cable restoration, which we also offer internationally, utility-line locating and large-bore directional drilling. From our regional centers in the Southwest, Midwest and East, we are able to pursue projects throughout the country.
History
We were originally organized in 2000 as a subsidiary of Puget Energy, Inc., a Seattle-based utility holding company. Since our inception, we have acquired 18 companies engaged in businesses that provide electric power and natural gas maintenance and construction services and other infrastructure services to the utility and energy industries. Most of these acquisitions occurred from 2000 to 2003. TPF acquired our company in May 2006. In November 2006, we completed our largest acquisition, Hawkeye. Hawkeye has established operations throughout the Northeast. The Hawkeye Acquisition expanded our geographic footprint and strengthened many of our service offerings including electric power T&D line construction, electrical substation construction, power generation facility construction, operation and maintenance, telecommunications/fiber-optic cable installation, natural gas distribution line construction and utility-line locating and mapping services. Our acquisition strategy has been successful in part because of our ability to integrate our systems and management best practices into these businesses.
Outlook
The statements in this section are based on our current expectations. These statements are forward-looking, and actual results may differ materially. Please refer to “Risk Factors” included elsewhere in this prospectus for more information on what may cause our actual results to differ.
40
Table of Contents
Like many companies that provide specialty contracting services, our results of operations are subject to market cycles in our end markets that can affect the capital and maintenance spending plans of our customers. Our customer and geographic diversity combined with our significant maintenance emphasis provide some insulation from these effects. We focus on the elements of the business we can control, including bidding, cost control, project management, receivables collection, safety and providing quality service to the end markets we serve. We monitor and analyze these activities through direct feedback from our operating unit managers in conjunction with our Enterprise Resource Planning, or ERP, system. Although other factors may impact us, including some we do not foresee, we believe our future period performance will be affected by the following:
| • | Market conditions for infrastructure services in 2009 have been poor as our customers have been adversely affected by weak demand conditions. Oil and natural gas prices were lower by over 50% and over 25%, respectively, at June 30, 2009 compared to June 30, 2008 prices, which has reduced the number of drilling projects that are economically viable and financeable. Similarly, cumulative electricity demand through June 30, 2009 decreased by approximately 5% compared to the same period in 2008. |
| • | We expect increasing demand for electric power transmission infrastructure services nationally over time as utilities look to make up for underinvestment in prior years. We expect that the increase in demand will be bolstered as alternative energy resource developments (particularly renewables such as wind) accelerate in response to federal and state legislative support and as utilities seek to maintain and improve reliability and efficiency, including through the addition of “Smart Grid” technology. However, the timing and magnitude of any increase in demand remain unclear, and the pace of alternative energy resource development continues to be adversely affected by low oil and natural gas prices, limited access to capital and the current economic downturn. |
| • | We expect an increase in demand for our electric power transmission infrastructure services as a result of the recent Texas Public Utility Commission, or PUC, adoption of the CREZ plan, which encompasses the construction or upgrade of approximately 2,400 miles of 345-kV transmission lines at a projected cost of $4.9 billion. We believe that, as a major builder of transmission lines in Texas with nearly 1,600 total employees in the state, together with our long-standing relationship with Oncor bolstered through our alliance agreement, we are in a position to deliver a significant portion of this work. In particular, we expect to benefit from the $1.3 billion of CREZ transmission projects recently allocated, subject to certain state convenience and necessity approvals, to Oncor. Although the timing is uncertain and we have not yet received any significant commitments of this work from Oncor, we expect CREZ to begin benefiting our operating results in 2010. As we ramp up for CREZ work, we will be required to increase our working capital, hire additional skilled personnel (including linemen) and expand our equipment fleet and our administrative support functions primarily in Texas. |
| • | We expect our alliance agreement with Oncor to continue to improve our prospects for increased T&D work in the Southwest region, beyond the benefits we expect from Oncor’s CREZ allocations. |
| • | We expect that environmental and energy independence considerations and improvements in technology will continue to drive increased domestic natural gas development and infrastructure requirements over time. However, low natural gas prices and the economic downturn are adversely affecting current expenditures on development of domestic natural gas resources and the related demand for infrastructure services associated with gathering systems and transmission pipelines and are adversely affecting our 2009 performance relative to 2008. For example, the number of active rotary drill rigs in the U.S. fell from more than 2,000 in September 2008 to less than 1,000 a year later. |
| • | Because of the U.S. economic downturn, many of our customers are delaying or reducing capital and maintenance spending on their electric power and natural gas T&D systems, which has reduced the number of available current and prospective projects and is having an adverse impact on our 2009 performance relative to 2008. Weak economic conditions may also affect the reliability of the portion of our backlog that is based on historical volume levels from our customers, although we have reduced our backlog based on current trends. |
41
Table of Contents
| • | We expect to see continued weakness in new home hookups and other electric power and natural gas-related distribution services, which are tied to residential home development, as long as the new home construction market remains weak. New housing starts in the U.S. through June 30, 2009 were 268,000 compared to 515,000 through the same period in 2008. |
| • | There was significant spending in 2008 on storm restoration work due primarily to the impact of Hurricanes Ike and Gustav and the December ice storm in the Northeast, and storm restoration revenues and profits have been substantially lower in 2009 and could be substantially lower in future periods, although storm restoration work is by nature unpredictable. |
| • | We expect capital expenditures of approximately $30 million in 2009, primarily for routine replacement of aging construction equipment and trucks, which could vary depending on the expected award and timing of commencement of CREZ work and other large electric power transmission projects. We expect to supplement this spending with operating leases and rental agreements as we ramp up for the CREZ buildout. |
| • | We expect an increase in our selling, general and administrative expenses related to the costs of operating as a public company, which will be offset in part by savings resulting from termination of our annual management fee to TCM which was $2.0 million for the year ended December 31, 2008. |
Components of Revenues and Expenses
Revenues
We report our revenues in one reportable segment reflecting specialized contracting services. We had revenues for the year ended December 31, 2008 of $827.0 million, of which approximately 64.2% was attributable to electric power T&D services and 30.6% to natural gas T&D services. These percentages include electric power and natural gas T&D specialty services performed for customers. Any other specialty services performed for customers are recorded as revenue from “other services,” which accounted for approximately 5.2% of our 2008 revenue. We had revenues for the six months ended June 30, 2009 of $316.8 million, of which approximately 70.9% was attributable to electric power T&D services, 22.6% to natural gas T&D services and 6.5% to other services.
We perform a significant majority of our services under MSAs, pursuant to which we generally provide services on a project-by-project basis in accordance with an agreed upon arrangement. MSAs are typically one to three year contracts, which are frequently renewed. MSAs establish a long-term working framework, including terms, conditions and pricing, for providing our customers a wide array of services. In late 2008, we expanded on the MSA concept by entering into a 10.5 year alliance agreement with Oncor. This agreement includes incentives for Oncor to meet an aggregate annual spending threshold more than 40% greater than our 2007 revenue from Oncor, a mechanism to provide us additional Oncor work if threshold spending levels are projected not to be met, indexed annual price adjustments, restrictions on and fees for termination for convenience and other key terms designed to further align our incentives and risks with those of our customer.
We enter into contracts principally on the basis of competitive bids, the final terms and prices of which we frequently negotiate with the customer and which are sometimes subject to changes in work scope during execution of the contract. Although the terms of our contracts vary considerably, pricing is typically based on a unit-price, fixed-price or time-and-materials structure. Under our unit-price contracts, we agree to perform identified units of work for an agreed price. A “unit” can be as small as the installation of a single bolt or a foot of cable or as large as a transmission tower or foundation. The resulting profitability of a particular unit is primarily dependent upon the labor and equipment hours expended to complete the task that comprises the unit. Under fixed-price contracts, we agree to perform the contract for a fixed fee based on our estimate of the aggregate costs of completing the particular project. In addition, any work encountered in the course of a unit-price project that does not have a defined unit is generally completed on a time-and-materials basis, under which we are paid for the labor hours expended to complete a project or task at agreed upon rates and for the materials used.
42
Table of Contents
Our storm restoration work, which involves high labor and equipment utilization as crews work around the clock to restore service, is typically performed on a time-and-materials basis and is generally more profitable when performed for customers with which we do not have ongoing MSA relationships, sometimes referred to in this prospectus as “off-system” work. Our ability to allocate resources to off-system storm restoration work depends on our available capacity at that time and our ability to obtain permission from existing customers to release some portion of our workforce from their projects.
Our bid work often includes payment provisions pursuant to which the customer withholds a 5% to 10% retainage from each progress payment, which we record as a receivable, and remits the retainage at some point in time, typically after project acceptance and as stipulated in the contract. The retention balances are generally due within one year of the initial billing. In addition, we perform a limited amount of bid work for which we are not paid until the project has been completed.
Cost of Revenues
Cost of revenues consists primarily of salaries, wages and benefits to employees, pension contributions, depreciation, fuel and other vehicle expenses, equipment leases and rentals, subcontracted services, insurance, facilities expenses, materials and parts and supplies. Our depreciation expense and equipment rental operating expense are affected by the extent to which our equipment fleet is owned versus leased under operating leases or rented. Gross profits are typically higher on projects where labor, rather than materials or subcontractors, constitutes a greater portion of the cost of services. Labor costs can vary based upon productivity, site conditions, weather and the degree to which our performance of the work can be impacted by third-party subcontractors, customers or regulatory bodies.
Our ability to monitor and control costs in a timely manner is facilitated by direct communication with operating unit management and use of our company-wide ERP system. The ERP system, which encompasses process, reporting, controls and technology, underpins key aspects of our organizational business strategy. It gives management timely access to operating information, which not only allows for improved project oversight, but also enables better resource utilization and more timely application of control processes. Specifically, the ERP system has led to more structured review of all elements of a project, including pricing and bidding, productivity tracking, job costing, project management oversight, change control and fixed asset utilization.
Due to the nature of our work, insurance is an important variable component of our cost of our services. We have a deductible of $750,000 per occurrence related to workers’ compensation, employer’s liability and general liability claims and a deductible of $500,000 per occurrence for auto liability claims, which we believe is an appropriate balance of insurance cost and risk retention. Our largest non-union employee-related health care benefit plan is subject to a deductible of $250,000 per claimant per year beginning in 2009. Losses up to the deductible amounts are accrued based upon our estimates of the ultimate liability for claims incurred (including an estimate of claims incurred but not reported). Fluctuations in insurance accruals related to these deductibles have an impact on gross margins in the period in which such adjustments are made. Safety programs and reductions in claims have a direct impact on our profitability, and we have been successful in controlling our retained claims costs. In addition, we believe that a track record of safety and environmental compliance is an important consideration among our customers and potential customers and that our ability to manage safety and environmental risks on our projects is an important factor in controlling costs and directly impacts our profitability.
Selling, General and Administrative Expenses
Selling, general and administrative expenses consist primarily of compensation and related benefits to management (including non-cash share-based compensation), administrative salaries and benefits, marketing, office rent and utilities, communications and professional fees.
43
Table of Contents
Critical Accounting Policies
The discussion and analysis of our financial condition and results of operations are based on our consolidated financial statements, which have been prepared in accordance with accounting principles generally accepted in the U.S. The preparation of these consolidated financial statements requires us to make estimates and assumptions that affect the reported amounts of assets and liabilities, disclosures of contingent assets and liabilities known to exist at the date of the consolidated financial statements and the reported amounts of revenues and expenses during the reporting period. We evaluate our estimates on an ongoing basis, based on historical experience and on various other assumptions that we believe to be reasonable under the circumstances. Actual results may differ from those estimates. We believe the following items to be the most important accounting policies including those that affect our more significant judgments and estimates used in the preparation of our consolidated financial statements:
Revenue and Cost Recognition
We recognize the majority of our revenues for services performed in accordance with American Institute of Certified Public Accountants Statement of Position 81-1, Accounting for Performance of Construction-Type and Certain Production-Type Contracts (SOP 81-1). Revenues generated from short-term projects (often with durations of less than one month) are predominantly performed under MSAs, which we typically bill on a unit-price basis and, less commonly, on a time-and-materials or fixed-price basis. We recognize revenue for unit-based services on an output basis as units are completed. Revenue for the services we perform on a time-and-materials basis is recognized as labor and equipment hours are incurred and services are performed. Our storm restoration work is generally billed on a time-and-materials basis at contract rates for customers with which we have MSAs and at negotiated rates for off-system customers.
Revenues for certain of our larger and longer duration projects, which tend to be performed on a fixed-price basis, are recognized based on percentage-of-completion accounting, using the cost-to-cost method. Under this method, revenue is recognized based on the ratio of estimated cost incurred to total estimated cost to complete the project. These costs include, but are not limited to, all direct material, labor and subcontract costs and indirect costs related to contract performance such as indirect labor, supplies, tools, repairs and depreciation. Changes in job performance, change orders, job conditions, final contract settlements, among other factors, may result in revisions to the estimated cost to complete these projects and our resulting profitability. Periodically, we perform work outside the specific requirements of a contract at the request of a customer. Generally, the revenue associated with such work is not recognized until a change order reflecting the scope and price for such work is executed. Occasionally we recognize costs of contract performance in the period in which they are incurred and contract revenue up to the amount of the costs incurred in the absence of an executed change order if we determine it is probable that the revenue is realizable and collectible. We charge revisions in profit estimates to income in the period in which the revisions are determined. Provisions for the total estimated losses on uncompleted projects are made in the period in which such losses are determined to be probable and can be reasonably estimated, including reversals of previously estimated profits. If actual results significantly differ from our estimates used for revenue recognition, our financial condition and results of operations could be materially impacted. Because our revenues are typically derived from projects of relatively short duration, many are completed or near completion within the period in which they were started, thus limiting our estimation risk exposure.
Our alliance agreement with Oncor provides for certain volume-based thresholds which correspond with volume-based incentives. Additionally, the agreement requires that we maintain certain service levels which, if not achieved, could result in payments from us to Oncor. Our revenue recognition includes estimates for the volume-based incentives based on current and projected performance relative to the thresholds and includes estimated payments that could result to Oncor if service levels are not achieved based on actual and projected performance relative to the service levels. Future changes in these estimates, or divergence in actual incentives or payments from these estimates, could have a material impact on revenue recognized in future periods.
44
Table of Contents
Unbilled revenues represent amounts earned and recognized in the period for which billings are issued in a subsequent period and are included in unbilled receivables. Unearned revenues represents amounts billed in excess of costs incurred and are included in other liabilities.
Accounts Receivable and Allowance for Doubtful Accounts
We record accounts receivable for all amounts billed and not collected. Also included in accounts receivable are unbilled revenues discussed above. The balances billed but not paid by customers pursuant to retainage provisions in construction contracts are due upon completion of the contracts and acceptance by the customer. The retention balances are generally due within one year of the initial billing.
We provide an allowance for doubtful accounts when collection of an account receivable is considered doubtful, and receivables are written off against the allowance when deemed uncollectible. We review the adequacy of the reserves on a regular basis. Inherent in the assessment of the allowance for doubtful accounts are certain judgments and estimates including, among others, our customer’s access to capital, our customer’s willingness or ability to pay, general economic conditions and ongoing relationship with the customer. Under certain circumstances such as foreclosure or negotiated settlements, we may be required to take title to the underlying assets in lieu of cash in settlement of receivables. Material changes in our customers’ cash flows, which may be further impacted by the current economic downturn, decreases in electricity demand, depressed oil and natural gas prices, the credit crisis or other factors discussed under “Risk Factors” and elsewhere in this prospectus, could affect our ability to collect amounts due from them. Should any major customers experience difficulties or file for bankruptcy, or should anticipated recoveries relating to the receivables in existing bankruptcies and other workout situations fail to materialize, we could experience reduced cash flows and losses in excess of current reserves.
Goodwill and Nonamortizable Intangible Assets
Statement of Financial Accounting Standards No. 142, Goodwill and Other Intangible Assets (SFAS 142), provides that goodwill and other intangible assets that have indefinite useful lives not be amortized but, instead, must be tested at least annually for impairment. SFAS 142 also provides specific guidance for testing goodwill and other nonamortized intangible assets for impairment. The first step in testing for goodwill impairment compares the fair value of a reporting unit to its carrying amount, including goodwill. If the carrying amount of a reporting unit exceeds its fair value, the second step is then performed. The second step compares the carrying amount of the reporting unit’s goodwill to the fair value of the goodwill. If the fair value of the goodwill is less than the carrying amount, an impairment loss would be recorded in income from operations.
Our annual impairment testing date has been April 30, and we will test for impairment between annual tests if an event occurs or circumstances change that would more likely than not reduce the fair value of a reporting unit below its carrying amount. Examples of such events or circumstances may include a significant change in business climate, loss of a significant customer or a loss of key personnel. SFAS 142 requires that we make certain estimates and assumptions in order to allocate goodwill to reporting units and to determine the fair value of reporting unit net assets and liabilities, including, among other things, an assessment of market conditions, projected cash flows, cost of capital and growth rates, which could significantly impact the reported value of goodwill and other intangible assets. The valuations employ present value techniques to measure fair value. These valuations are based on a discount rate we determined to be consistent with industry discount rates and the risks inherent in our business model.
Our goodwill is included in three reporting units for goodwill valuation and impairment testing purposes. The three reporting units for which goodwill impairment is assessed are as follows: West/Midwest/National region, Eastern region and Texas/Southwest/South Central region. Due primarily to the cyclical nature of our business, economic conditions throughout the country, competition from other companies in our industry and the impact of weather on our operations, the profitability of our individual reporting units may suffer from
45
Table of Contents
downturns in customer demand and other factors. These factors may have a disproportionate impact on the individual reporting units as compared to InfrastruX as a whole and might adversely affect the fair value of the individual reporting units. If material adverse conditions occur that impact our reporting units, our future estimates of fair value may not support the carrying amount of one or more of our reporting units, and the related goodwill would need to be written down to its estimated fair value.
We recorded goodwill of $138.1 million as a result of the TPF Acquisition and the Hawkeye Acquisition. We completed our annual evaluations for impairment of goodwill as of April 30, 2007 and 2008 and performed an additional evaluation for impairment of goodwill as of December 31, 2008 due to a change of circumstances that indicated additional impairment may have occurred in one of our regions. To estimate the fair value of each reporting unit for the years ended December 31, 2007 and 2008, we utilized the “income” valuation approach. Under the “income” approach, we estimated the fair value of the reporting units using the invested capital method, which discounts projected cash flows using a calculated weighted average cost of capital. We considered the following factors, among others, in performing this analysis: forecasted revenues, expense ratios and profit margins, working capital, cash flow, attrition/retention rates, tax rates, and long term discount rates. Assumptions for all of these factors require significant judgments by us.
We recorded an aggregate goodwill impairment charge of $35.5 million related to two of our regions for the year ended December 31, 2007 and $45.3 million related to one of our regions for the year ended December 31, 2008. As of December 31, 2008, all goodwill related to our Eastern reporting unit has been written off. See “—Year Ended December 31, 2008 Compared to the Year Ended December 31, 2007—Impairment Charges” for more information.
For the year ending December 31, 2009, we performed our annual evaluation of impairment of goodwill as of April 30, 2009. For our April 30, 2009 evaluation, we used a combination of “income” and “market” approaches as we believe this provided a better indicator of fair value. These valuation approaches were weighted 10% and 90% for the “income” and “market” approaches, respectively. Under the “market” approach, we estimated the fair value of each reporting unit based on earnings multiples of comparable public companies. Under the “income” approach, we used the same valuation method as used in our 2008 impairment test. No impairment charges were required as a result of this evaluation. We have changed our annual test date to November 30 to better align impairment testing with year end procedures and will perform our next annual evaluation of impairment of goodwill as of November 30, 2009.
Long-Lived Assets and Amortizable Intangible Assets
We review our long-lived assets, including our intangible assets with finite useful lives, for impairment if events or changes in circumstances indicate that the carrying value of such assets may not be recoverable, as required by Statement of Financial Accounting Standards No. 144, Accounting for the Impairment or Disposal of Long-Lived Assets (SFAS 144). If an evaluation is required, the estimated future undiscounted cash flows associated with the asset or asset group are compared to the asset or asset group’s carrying amount to determine if an impairment of such asset is necessary. This requires us to make long-term forecasts of the future revenues and costs related to the assets or asset group subject to review. Forecasts require assumptions about demand for our services and future conditions in the end markets we serve. Since estimating future cash flows requires significant judgment, our projections may vary from cash flows eventually realized. Future events and unanticipated changes to assumptions could require a provision for impairment in a future period. The effect of any impairment would be to expense the difference between the fair value of such asset or asset group and its carrying value. Such expense would be reflected in income from operations. In addition, we consolidated the asset groups that roll up into the Eastern reporting unit into a single asset group for the April 2009 evaluation. This change in estimate was incorporated into the April 2009 valuation in response to our efforts to streamline operations and recognize available synergies within the region. We incurred no SFAS 144 impairment charge in 2006 or 2007. However, in 2008, we recorded an impairment charge of $7.6 million related to certain customer relationship intangibles. See “—Year Ended December 31, 2008 Compared to the Year Ended December 31, 2007—Impairment Charges” for more information.
46
Table of Contents
Our intangible assets, all of which we determined to have finite useful lives, totaled $91.1 million (net of accumulated amortization) as of June 30, 2009. We estimate the useful life and fair value of purchased intangible assets at the time of acquisition with the assistance of third-party valuation experts and periodically review these estimates to determine whether these lives are appropriate. Our intangible assets, which primarily consist of customer relationships, trade names and developed technology, are amortized over their estimated useful lives using the straight-line method. We recorded intangible asset amortization of $9.2 million, $8.8 million and $4.3 million in the year ended December 31, 2007 and 2008 and the six months ended June 30, 2009, respectively.
In addition, our cable remediation operating unit has patents that have been issued, and patents and trademarks that are pending. We capitalize these costs, as they are considered probable of being issued, until such time as the patent or trademark is issued and then, as discussed above, amortize those costs over their estimated useful life. We capitalized $0.3 million, $0.1 million and $0.1 million of patents and trademarks pending as of December 31, 2007 and 2008 and June 30 , 2009, respectively.
Insurance
We are insured for workers’ compensation, employer’s liability and general liability claims, subject to a deductible of $750,000 per occurrence. We are also insured for auto liability claims, subject to a deductible of $500,000 per occurrence. Additionally, our largest non-union employee-related health care benefit plan is subject to a deductible of $250,000 per claimant per year.
Losses are accrued based upon our estimates of the ultimate liability for claims incurred (including an estimate of claims incurred but not reported), using actuarially calculated claims liability data based on our claims experience. For these claims, to the extent we have insurance coverage above the deductible amounts, we have recorded a receivable reflected in other current assets and other assets. These insurance liabilities are difficult to assess and estimate accurately due to unknown factors, including the severity of an injury, the determination of our liability in proportion to other parties and the number of incidents not reported. The accruals are based upon known facts and historical trends.
Income Taxes
We follow the asset and liability method of accounting for income taxes in accordance with Statement of Financial Accounting Standards No. 109, Accounting for Income Taxes. Under this method, deferred tax assets and liabilities are recognized for the future tax consequences attributable to differences between the financial statement carrying amounts of existing assets and liabilities and their respective tax basis and operating loss and tax credit carryforwards. Deferred tax assets and liabilities are measured using enacted tax rates expected to apply to taxable income in the years in which those temporary differences are expected to be recovered or settled. The effect on deferred tax assets and liabilities of a change in tax rates is recognized in the results of operations in the period that includes the enactment date. A valuation allowance is recorded to reduce the carrying amounts of deferred tax assets unless it is more likely than not that such asset will be realized.
We regularly evaluate valuation allowances established for deferred tax assets for which future realization is uncertain. The estimation of required valuation allowances includes estimates of future taxable income, reversals of deferred tax liabilities, carryback periods, and tax planning strategies.
In June 2006, the Financial Accounting Standards Board (FASB) issued Interpretation No. 48, Accounting for Uncertainty in Income Taxes—an Interpretation of FASB Statement No. 109 (FIN 48). This interpretation, among other things, creates a two step approach for evaluating uncertain tax positions. Recognition (step one) occurs when an enterprise concludes that a tax position, based solely on its technical merits, is more-likely-than-not to be sustained upon examination. Measurement (step two) determines the amount of benefit that more-likely-than-not will be realized upon settlement. Derecognition of a tax position that was previously recognized would occur when a company subsequently determines that a tax position no longer meets the more-likely-
47
Table of Contents
than-not threshold of being sustained. FIN 48 specifically prohibits the use of a valuation allowance as a substitute for derecognition of tax positions, and it has expanded disclosures. We have adopted FIN 48 effective January 1, 2007.
Share-Based Compensation Expense
We account for share-based compensation under Statement of Financial Accounting Standards No. 123 (revised 2004), Share-Based Payment (SFAS 123R). SFAS 123R requires that all share-based payments be recognized in the consolidated financial statements based on their grant date fair values. Under SFAS 123R, share-based compensation expense is recognized over the period the recipient is required to perform the services in exchange for the award (the vesting period). As permitted by SFAS 123R, we value awards with graded vesting as single awards and recognize the related compensation expense using a straight-line attribution method. SFAS 123R also requires that excess tax benefits be reported as financing cash inflows, rather than as a reduction of taxes paid, which is included within operating cash flows.
Material Weakness in Internal Control Over Financial Reporting
In connection with the audit of our 2008 financial statements and preparation of the registration statement of which this prospectus forms a part, we identified a material weakness in our system of internal control over financial reporting. The Public Company Accounting Oversight Boards Auditing Standard No. 5 defines a material weakness as a deficiency, or a combination of deficiencies, in internal controls over financial reporting, such that there is a reasonable possibility that a material misstatement of annual or interim financial statements will not be prevented or detected on a timely basis. The material weakness that we identified related to the Company’s entity-level processes for monitoring and assessing financial reporting risks and ensuring that appropriate procedures and controls are implemented in response to changes. Specifically, this material weakness arises from the combined effect of deficiencies related to (i) insufficient resources with the appropriate level of experience and training in the application of technical accounting guidance and (ii) inadequate monitoring, review and approval of the policies and procedures implemented to address new or non-recurring accounting transactions, including those designed to ensure relevant, sufficient and reliable data is accumulated to support assumptions and judgments. This material weakness resulted in errors in goodwill and income taxes and the restatement of our 2006 and 2007 consolidated financial statements.
We are developing a plan to remedy the material weakness, which includes hiring adequate high level accounting resources with the appropriate level of technical experience and training in the application of technical accounting guidance; implementing a policy of enhanced review and approval of relevant and sufficient data to support our assumptions and judgments in complex, non-routine accounting calculations and documenting that review and approval; establishing an internal audit department to assist with monitoring and compliance with control procedures and policies among other related duties; and hiring a third-party expert to assist us in highly complex, non-routine accounting calculations. These changes will be implemented in conjunction with our preparation for compliance with Section 404 of the Sarbanes-Oxley Act of 2002. However, we may not be successful in promptly and effectively remediating the material weakness and it is possible that we or our independent registered public accounting firm may identify additional significant deficiencies or material weaknesses in our internal control over financial reporting in the future. Any failure or difficulties in implementing and maintaining these controls could adversely affect the results of periodic management evaluations and annual auditor attestation reports regarding the effectiveness of our internal control over financial reporting that will be required when the SEC’s rules under Section 404 of the Sarbanes-Oxley Act of 2002 becomes applicable to us beginning with our Annual Report on Form 10-K for the year ending December 31, 2010, to be filed in early 2011. Any such failure could also cause investors to lose confidence in our reported financial information and adversely affect the value of our common stock.
48
Table of Contents
Results of Operations
The tables below set forth our results of operations for the periods January 1, 2006 through May 7, 2006 and May 8, 2006 (the date of the TPF Acquisition) through December 31, 2006 on a historical basis and on an as combined basis reflecting the combined results of operations of InfrastruX for the year ended December 31, 2006, which has been calculated by adding the results of InfrastruX prior to the TPF Acquisition to the results of operations after the TPF Acquisition, for the years ended December 31, 2007 and 2008 and for each of the six months ended June 30, 2008 and 2009. We have included the 2006 combined financial information in order to facilitate a comparison of our results of operations for comparable periods. This combined presentation is not consistent with GAAP and may yield results that are not comparable on a period–to–period basis primarily due to the impact of required purchase accounting adjustments and a different financing structure. These results are therefore not indicative of what the results for 2006 would have been had the TPF Acquisition occurred effective January 1, 2006. All references to the year ended December 31, 2006 in the following discussion are based on the as-combined information presented in the table below. The purpose of presenting this table is to provide a convenient reference for the discussion of the results of operations that follows due to the significant effects of these events on the comparability of the periods.
| Predecessor(1) | Successor(1) | |||||||||||||||||||||||||||||
| Period January 1, 2006 to May 7, 2006 |
Period May 8, 2006 to December 31, 2006 |
Combined Year Ended December 31, 2006 |
Year Ended December 31, |
Six Months Ended June 30, |
||||||||||||||||||||||||||
| 2007 | 2008 | 2008 | 2009 | |||||||||||||||||||||||||||
| (unaudited) | (unaudited) | |||||||||||||||||||||||||||||
| (dollars in thousands, except per share data) | ||||||||||||||||||||||||||||||
| Consolidated Statements of Operations Data: |
||||||||||||||||||||||||||||||
| Revenues |
$ | 141,606 | $ | 341,586 | $ | 483,192 | $ | 657,180 | $ | 826,962 | $ | 401,675 | $ | 316,788 | ||||||||||||||||
| Cost of revenues |
119,956 | 284,609 | 404,565 | 581,666 | 701,035 | 347,593 | 285,689 | |||||||||||||||||||||||
| Gross profit |
21,650 | 56,977 | 78,627 | 75,514 | 125,927 | 54,082 | 31,099 | |||||||||||||||||||||||
| Selling, general and administrative |
21,037 | 31,733 | 52,770 | 51,122 | 85,882 | (2) | 31,188 | 30,378 | ||||||||||||||||||||||
| Goodwill / intangibles impairment |
— | — | — | 35,484 | 52,888 | 34,104 | — | |||||||||||||||||||||||
| Amortization of intangibles(3) |
459 | 3,190 | 3,649 | 7,818 | 7,445 | 3,830 | 3,606 | |||||||||||||||||||||||
| Total operating expenses |
21,496 | 34,923 | 56,419 | 94,424 | 146,215 | 69,122 | 33,984 | |||||||||||||||||||||||
| Income (loss) from operations |
154 | 22,054 | 22,208 | (18,910 | ) | (20,288 | ) | (15,040 | ) | (2,885 | ) | |||||||||||||||||||
| Interest expense, net |
2,934 | 16,028 | 18,962 | 33,029 | 27,468 | 13,298 | 7,443 | |||||||||||||||||||||||
| Other expenses (income), net |
(11 | ) | 9,122 | 9,111 | 4,238 | 2,840 | 1,372 | 1,551 | ||||||||||||||||||||||
| Loss before income taxes |
(2,769 | ) | (3,096 | ) | (5,865 | ) | (56,177 | ) | (50,596 | ) | (29,710 | ) | (11,879 | ) | ||||||||||||||||
| Income tax benefit |
237 | 1,152 | 1,389 | 14,376 | 14,028 | 8,722 | 2,818 | |||||||||||||||||||||||
| Net loss |
$ | (2,532 | ) | $ | (1,944 | ) | $ | (4,476 | ) | $ | (41,801 | ) | $ | (36,568 | ) | $ | (20,988 | ) | $ | (9,061 | ) | |||||||||
| (1) | Our financial statements for periods prior to May 8, 2006 (our predecessor periods) were prepared on the historical cost basis of accounting. Our financial statements for periods subsequent to May 8, 2006 (our successor periods) reflect the application of purchase accounting to the TPF Acquisition, which required that we record our assets and liabilities at fair value as of May 8, 2006. This included $82.2 million of goodwill, |
49
Table of Contents
| $67.1 million of intangibles and $14.2 million of property and equipment, which caused an increase in amortization of intangibles and depreciation expense in our successor periods as compared to our predecessor period. In addition, our financial statements for the successor periods include Hawkeye from the November 2006 date of the Hawkeye Acquisition. As a result, our results for the successor periods are not comparable to the predecessor periods and our combined results in the year ended December 31, 2006 are not comparable to other periods. |
| (2) | Includes $17.5 million relating to an earnout paid to the former owners of Hawkeye and $4.3 million in share-based compensation under our equity incentive plan. |
| (3) | Excludes developed technology intangible amortization recorded to cost of revenues. See Note 4 of our consolidated financial statements included elsewhere in this prospectus. |
The following table sets forth consolidated statement of operations data as percentages of revenue for the periods indicated:
| Predecessor(1) | Successor(1) | ||||||||||||||||||||||
| Period January 1, 2006 to May 7, 2006 |
Period May 8, 2006 to December 31, 2006 |
Combined Year Ended December 31, 2006 |
Year Ended December 31, |
Six Months Ended June 30, |
|||||||||||||||||||
| 2007 | 2008 | 2008 | 2009 | ||||||||||||||||||||
| (unaudited) | (unaudited) | ||||||||||||||||||||||
| Consolidated Statements of Operations Data: |
|||||||||||||||||||||||
| Revenues |
100.0 | % | 100.0 | % | 100.0 | % | 100.0 | % | 100.0 | % | 100.0 | % | 100.0 | % | |||||||||
| Cost of revenues |
84.7 | 83.3 | 83.7 | 88.5 | 84.8 | 86.5 | 90.2 | ||||||||||||||||
| Gross profit |
15.3 | 16.7 | 16.3 | 11.5 | 15.2 | 13.5 | 9.8 | ||||||||||||||||
| Selling, general and administrative |
14.9 | 9.3 | 10.9 | 7.8 | 10.4 | 7.8 | 9.6 | ||||||||||||||||
| Goodwill / intangibles impairment |
— | — | — | 5.4 | 6.4 | 8.5 | — | ||||||||||||||||
| Amortization of intangibles |
0.3 | 0.9 | 0.8 | 1.2 | 0.9 | 0.9 | 1.1 | ||||||||||||||||
| Total operating expenses |
15.2 | 10.2 | 11.7 | 14.4 | 17.7 | 17.2 | 10.7 | ||||||||||||||||
| Income (loss) from operations |
0.1 | 6.5 | 4.6 | (2.9 | ) | (2.5 | ) | (3.7 | ) | (0.9 | ) | ||||||||||||
| Interest expense, net |
2.1 | 4.7 | 3.9 | 5.0 | 3.3 | 3.3 | 2.3 | ||||||||||||||||
| Other expenses (income), net |
0.0 | 2.7 | 1.9 | 0.7 | 0.3 | 0.3 | 0.5 | ||||||||||||||||
| Loss before income taxes |
(2.0 | ) | (0.9 | ) | (1.2 | ) | (8.6 | ) | (6.1 | ) | (7.3 | ) | (3.7 | ) | |||||||||
| Income tax benefit |
0.2 | 0.3 | 0.3 | 2.2 | 1.7 | 2.2 | 0.9 | ||||||||||||||||
| Net loss |
(1.8 | ) | (0.6 | ) | (0.9 | ) | (6.4 | ) | (4.4 | ) | (5.1 | ) | (2.8 | ) | |||||||||
| (1) | Our financial statements for the period prior to May 8, 2006 (our predecessor period) were prepared on the historical cost basis of accounting. Our financial statements for periods subsequent to May 8, 2006 (our successor periods) reflect the application of purchase accounting to the TPF Acquisition, which required that we record our assets and liabilities at fair value as of May 8, 2006. This included $82.2 million of goodwill, $67.1 million of intangibles and $14.2 million of property and equipment, which caused an increase in amortization of intangibles and depreciation expense in our successor periods as compared to our predecessor period. In addition, our financial statements for the successor periods include Hawkeye from the November 2006 date of the Hawkeye Acquisition. As a result, our results for the successor periods are not comparable to the predecessor period and our combined results in the year ended December 31, 2006 are not comparable to other periods. |
Six Months Ended June 30, 2009 Compared to the Six Months Ended June 30, 2008
Revenues
Revenues decreased $84.9 million, or 21.1%, to $316.8 million for the six months ended June 30, 2009 from $401.7 million for the six months ended June 30, 2008. This decrease was primarily due to a reduction in project-based bid work in our Eastern region of approximately $50.0 million due mainly to generally poor economic conditions affecting our utility customers and the closure of one of our smaller Eastern region operations in the second half of 2008. In addition, we also saw decreases in our recurring work of approximately $24.0 million primarily related to the loss of portions of a major customer’s business in the Eastern region and lower revenues
50
Table of Contents
in the natural gas and electric power distribution services in our Eastern and Midwestern regions related to continuing weakness in the new home construction market. Our natural gas transmission and field services sector was also adversely impacted by low natural gas prices as a number of customers sharply curtailed or stopped new drilling. These decreases were offset in part by increases in our Texas operations due primarily to work performed under the Oncor alliance agreement which was not in effect during the six months ended June 30, 2008.
Gross profit
Gross profit decreased $23.0 million, or 42.5%, to $31.1 million for the six months ended June 30, 2009 from $54.1 million for the six months ended June 30, 2008. Our gross profit percentage declined from 13.5% to 9.8%. These decreases were primarily due to the lower revenue described above as indirect costs remained relatively flat during the current period in comparison to the prior period, resulting in the period over period reduction in utilization of equipment and personnel and a resulting decline in gross profit. Our indirect costs declined $1.2 million from prior period levels against an $84.9 million decrease in revenue. In addition, overall market weakness resulted in increased competitive pricing pressure in certain markets and on certain projects.
Selling, general and administrative expenses
Selling, general and administrative expenses decreased $0.8 million, or 2.6%, to $30.4 million for the six months ended June 30, 2009 from $31.2 million for the six months ended June 30, 2008. As a percentage of revenues, selling, general and administrative expenses increased from 7.8% to 9.6% for the six months ended June 30, 2008 and 2009, respectively, primarily due to the revenue trends described above. The decrease in selling, general and administrative expenses was primarily attributable to a reduction in share-based compensation expense of $2.3 million and a net reduction in bad debt expense of $0.9 million primarily due to the collection of a previously reserved receivable in addition to normal reserve adjustments for the six months ended June 30, 2009, which was partially offset by an increase in professional fees due in part to preparations for this offering.
Amortization of intangibles
Intangible amortization expense decreased $0.2 million, or 5.8%, to $3.6 million for the six months ended June 30, 2009 from $3.8 million for the six months ended June 30, 2008. This decrease was primarily attributable to a lower amortizable intangible asset balance following the $7.6 million reduction in intangible assets resulting from the impairment charge we recognized during the six months ended June 30, 2008 described below.
Impairment Charges
We recognized no goodwill charge in the six months ended June 30, 2009 compared to a goodwill impairment charge of $26.5 million during the six months ended June 30, 2008 related to the reduction in current and forecasted future performance levels for our Eastern reporting unit, primarily Hawkeye, as viewed at April 30, 2008. We also recognized an intangible asset impairment charge of $7.6 million during the six months ended June 30, 2008 related to the elimination of one of our smaller subsidiaries within the Eastern reporting unit. We recognized no intangible asset impairment charges during the six months ended June 30, 2009.
Interest expense, net
Interest expense, net of interest income, decreased $5.9 million, or 44.0%, to $7.4 million for the six months ended June 30, 2009 from $13.3 million for the six months ended June 30, 2008. This decrease was primarily due to a net improvement of $3.2 million related to mark-to-market valuations of interest rate swap agreements due to increases in forward rates in the first six months of 2009, and a decrease in interest expense of $2.8 million due to lower average debt balances and lower average interest rates in the first half of 2009 as compared to the first half of 2008.
Net loss
We recorded net loss of $9.1 million for the six months ended June 30, 2009, compared to net loss of $21.0 million for the six months ended June 30, 2008 as a result of the factors discussed above.
51
Table of Contents
Year Ended December 31, 2008 Compared to the Year Ended December 31, 2007
Revenues
Revenues increased $169.8 million, or 25.8%, to $827.0 million for the year ended December 31, 2008 from $657.2 million for the year ended December 31, 2007. Electric power T&D services revenues increased by approximately $115.8 million, or 27.9%, natural gas T&D services revenues increased by approximately $52.8 million, or 26.3%, and other service revenues increased by approximately $0.7 million, or 1.7%. These increases were attributable to growth in our electric power end markets, including our storm restoration work which increased approximately $44.1 million to $67.0 million in 2008 from $22.9 million in 2007 due primarily to the impact of hurricanes Ike and Gustav in the Gulf Coast and the December ice storms in the Northeast, and in our natural gas gathering line and transmission business which benefited from strong gas drilling activity, primarily in the first half of the year. In addition, we benefited from new customer relationships and increased revenues from existing customers in many of our end markets, including strong results in our cable restoration business as we expanded our customer base. Our revenues from Oncor improved due in part to our alliance agreement, which became effective in August 2008, and recovery from lower 2007 spending levels. Overall revenue increased due primarily to increased work volumes, together with price increases in some markets that we negotiated to offset higher costs. These widespread improvements more than offset weakness in our electric power and natural gas distribution business that resulted from the continuing housing downturn.
Gross profit
Gross profit increased $50.4 million, or 66.8%, to $125.9 million for the year ended December 31, 2008 from $75.5 million for the year ended December 31, 2007. Our gross profit percentage increased from 11.5% to 15.2%. This increase was due primarily to our revenue growth, which accounted for approximately $19.5 million of the increase, and improved utilization across our regions and work mix, which accounted for approximately $30.6 million of the increase, including our storm restoration work. Profitability at Hawkeye in 2008 was improved in part due to its storm restoration work and through operational improvements as compared to 2007 when Hawkeye was completing a number of pre-acquisition low margin contracts. These favorable developments in 2008 more than offset the 2008 costs of ramping up for our Oncor alliance agreement, including additional personnel and a $3.1 million increase in lease expense reflecting our use of more operating leases to meet our equipment needs, as well as a $13.0 million increase in multi-employer pension and other post-retirement benefit plan costs due in part to higher volumes and a greater portion of work being performed by unionized employees, and higher labor and fuel costs.
Selling, general and administrative expenses
Selling, general and administrative expenses increased $34.8 million, or 68.0%, to $85.9 million for the year ended December 31, 2008 from $51.1 million for the year ended December 31, 2007. As a percentage of revenues, selling, general and administrative expenses increased from 7.8% in 2007 to 10.4% in 2008. This increase was primarily attributable to approximately $10.0 million in higher wages and bonuses associated with our growth and Adjusted EBITDA performance in 2008, a $17.5 million accrual for the earnout payable pursuant to our acquisition agreement with the prior owners of Hawkeye, $4.3 million in share-based compensation on awards first granted by us in 2008 and a $2.1 million increase in professional fees due in part to advanced preparations for this offering. These increases were offset in part by a $4.3 million favorable settlement of an indemnity agreement with our prior owner.
Impairment Charges
We recognized goodwill impairment charges of $35.5 million and $45.3 million in 2007 and 2008, respectively. The 2007 goodwill impairment charge resulted from impairment in our Eastern and Midwest regions of $29.5 million and $6.0 million, respectively. The impairment charge in the Eastern reporting unit was primarily attributable to the reduction in current and forecasted future performance levels for Hawkeye while the impairment charge in the Midwest reporting unit was attributable to the reduction in current and forecasted future
52
Table of Contents
performance levels across operating units within the region, as viewed at April 30, 2007, the testing date. The majority of the 2008 goodwill impairment charge, $26.5 million, related to the reduction in current and forecasted future performance levels for our Eastern reporting unit, primarily Hawkeye, as viewed at April 30, 2008. As discussed above, Hawkeye’s performance improved substantially after the impairment testing date due in part to operational improvements and the large volume of storm restoration work it performed in the third and fourth quarters. However, we conducted an additional impairment test at December 31, 2008 following a change in circumstances (the departure of a president and former owner of one of our small operating units) that indicated additional impairment may have occurred in our Eastern reporting unit. As a result, after factoring in the elimination of that operating unit and current and forecasted future performance levels under economic conditions at December 31, 2008, we recognized an additional $18.8 million goodwill impairment charge. As of December 31, 2008, all goodwill related to our Eastern reporting unit, primarily attributable to Hawkeye, was written off. Furthermore, we recognized a $7.6 million impairment charge to the intangible assets of the eliminated operating unit.
Interest expense, net
Interest expense, net of interest income, decreased $5.6 million, or 16.8%, to $27.5 million for the year ended December 31, 2008 from $33.0 million for the year ended December 31, 2007. This decrease was primarily attributable to lower average interest rates during 2008, as well as favorable mark-to-market valuation adjustments on our interest rate swap agreements.
Other expenses, net
Other expense, net decreased $1.4 million, or 33.0%, to $2.8 million for the year ended December 31, 2008 from $4.2 million for the year ended December 31, 2007. Included in 2007 were $1.4 million of debt modification costs we did not incur in 2008.
Net loss
We recorded net income loss of $36.6 million for the year ended December 31, 2008 compared to net income loss of $41.8 million for the year ended December 31, 2007 as a result of the factors discussed above.
Year Ended December 31, 2007 Compared to the Year Ended December 31, 2006 (combined)
Revenues
Revenues increased $174.0 million, or 36.0%, to $657.2 million for the year ended December 31, 2007 from $483.2 million for the year ended December 31, 2006 (on a combined basis). Substantially all of this increase ($172.3 million) was due to the inclusion of the full-year 2007 results of Hawkeye, acquired in November 2006. Electric power T&D services revenues increased by approximately $135.0 million, or 48.3%, natural gas T&D services revenues increased by approximately $58.1 million, or 40.8%, and other services revenues decreased by approximately $19.2 million, or 31.4%. Increases in our natural gas gathering line and transmission business, driven by natural gas drilling activity, were largely offset by weakness in our natural gas distribution business that resulted from the housing downturn in the second half of 2007, a decrease in revenues from Oncor in 2007 and the decline in other services due primarily to the inclusion of a large water pipeline project in our 2006 revenues.
Gross profit
Gross profit decreased $3.1 million, or 4.0%, to $75.5 million for the year ended December 31, 2007 from $78.6 million for the year ended December 31, 2006 (on a combined basis). Our gross profit percentage declined from 16.3% to 11.5%. The decrease was due primarily to revenue trends described above and the performance of Hawkeye, which suffered an approximate 48.6% decline in gross profit percentage during 2007, particularly due
53
Table of Contents
to certain contracts it had in place prior to our acquisition. As a result, we experienced a decreased gross margin in 2007 as we worked through Hawkeye’s legacy contracts and spent much of 2007 completing the integration of Hawkeye into our corporate infrastructure. Most of our businesses were also adversely affected by substantially higher fuel prices in 2007.
Selling, general and administrative expenses
Selling, general and administrative expenses decreased $1.7 million, or 3.1%, to $51.1 million for the year ended December 31, 2007 from $52.8 million for the year ended December 31, 2006 (on a combined basis). As a percentage of revenues, selling, general and administrative expense declined from 10.9% in 2006 to 7.8% in 2007 as we were able to leverage the fixed nature of our administrative costs. The benefits of our increased scale, combined with a $6.5 million reduction in professional fees that were higher than normal during 2006 due to the TPF Acquisition, the Hawkeye Acquisition and an abandoned transaction, more than offset the inclusion of the full-year 2007 results of Hawkeye ($12.3 million net impact). The impact of purchase accounting from the TPF Acquisition and Hawkeye Acquisition on depreciation and amortization expense included in selling, general and administrative expenses was less than $7.0 million in 2007.
Amortization of intangibles
Intangible amortization expense increased $4.2 million, or 114.3%, to $7.8 million for the year ended December 31, 2007 from $3.6 million for the year ended December 31, 2006 (on a combined basis). This increase was primarily due to the $3.7 million net impact of a full-year of amortization of intangibles established by the purchase price allocation associated with the Hawkeye Acquisition, which occurred in November 2006.
Impairment Charges
We recognized goodwill impairment of $35.5 million for the year ended December 31, 2007, which resulted from impairment in our Eastern and Midwest reporting units of $29.5 million and $6.0 million, respectively, as discussed above. We recognized no goodwill impairment for the year ended December 31, 2006.
Interest expense, net
Interest expense, net of interest income, increased $14.0 million, or 74.2%, to $33.0 million for the year ended December 31, 2007 from $19.0 million for the year ended December 31, 2006 (on a combined basis). This increase was primarily due to the full-year of interest on the debt we incurred to facilitate the TPF Acquisition and the Hawkeye Acquisition in May and November 2006, respectively.
Other expenses, net
Other expense, net decreased $4.9 million, or 53.5%, to $4.2 million for the year ended December 31, 2007 from $9.1 million for the year ended December 31, 2006 (on a combined basis). This decrease was primarily due to a reduction in expenses related to the early extinguishment of debt. In 2006, we refinanced the debt we incurred to facilitate the TPF Acquisition and, as a result, wrote off $7.4 million of deferred financing costs.
Net loss
We recorded a net loss of $41.8 million for the year ended December 31, 2007 compared to net loss of $4.5 million for the year ended December 31, 2006 (on a combined basis) as a result of the factors discussed above.
Liquidity and Capital Resources
Our primary liquidity requirements are for working capital and capital expenditures to support our operations, growth and debt service. Our primary sources of liquidity have been cash flow from operations and borrowings under our revolving line of credit. In addition, we have relied on term loans and equity financing to support acquisitions, including the Hawkeye Acquisition in 2006, and to a limited degree on vendor financing and capital leases.
54
Table of Contents
As of June 30, 2009, we had cash and cash equivalents of $13.4 million, working capital of $109.3 million and total debt of $279.2 million consisting of $249.7 million of borrowings under our term loan, $27.0 million under our $100 million revolving line of credit and $2.4 million of additional secured equipment debt provided by other parties. In addition, we had letters of credit of $13.8 million outstanding under our revolving line of credit at June 30, 2009, leaving $59.2 million available for additional borrowings. We have made several significant cash payments in 2009, including $15.6 million in management bonuses accrued in 2008 and paid in the first quarter of 2009 and a $17.5 million earnout paid to the former owners of Hawkeye in the second quarter of 2009. We made these payments with funds from our revolving credit facility and cash from operations. In addition, in connection with the October 2009 amendment to our credit facilities, we paid $10.0 million toward our term loan with proceeds from our issuance of our 15% Senior Redeemable Convertible Cumulative Preferred Stock.
The seasonality of our business also causes our working capital needs to fluctuate. Because our operating cash flow is usually lower during and following the winter months, we typically experience a need to finance a portion of our working capital during the spring and summer. We also expect to experience working capital build up as we ramp up for CREZ.
After giving effect to this offering and the use of proceeds as described under “Use of Proceeds,” we anticipate that our existing cash and cash equivalents, borrowing capacity under our revolving line of credit, letters of credit and future expected operating cash flow will be sufficient to meet operating expenses, working capital requirements, capital expenditures, debt service and other obligations, at least until our revolving credit agreement matures in November 2011.
Cash from operating activities. During the six months ended June 30, 2009, net cash used in operating activities from continuing operations was $3.9 million primarily due to our net loss for the period of $9.1 million and changes in operating assets and liabilities which were offset in part by the impact of non-cash expenses. Changes in operating assets and liabilities during the first six months of 2009 resulted in a net cash outflow of $17.5 million. A decrease in other current liabilities of $37.2 million (primarily attributable to payment of a $17.5 million earnout paid to the former owners of Hawkeye and $15.6 million in management bonuses accrued in 2008 and paid during the six months ended June 30, 2009), a $7.4 million increase in income tax receivable primarily due to utilization of net operating loss carry backs in the current period, a $5.1 million increase in prepaid expenses and other current assets (primarily attributable to insurance policy prepayments, which are typically highest in the first quarter of each year) and a $5.0 million decrease in accounts payable more than offset a decrease in accounts receivable of $37.7 million (primarily attributable to lower revenues during the six months ended June 30, 2009 compared to fourth quarter 2008 revenues). During the first six months of 2009, we incurred non-cash expenses, including $20.1 million of depreciation and amortization, a $1.6 million unrealized gain on an interest rate swap, and a $3.1 million deferred tax benefit.
During the year ended December 31, 2008, net cash provided by operating activities from continuing operations was $55.3 million as compared to $39.7 million for the year ended December 31, 2007. In 2008, we incurred substantial non-cash expenses, including a $45.3 million non-cash goodwill impairment charge under SFAS 142, $41.6 million of depreciation and amortization, $4.3 million of share-based compensation expense, $7.6 million of intangible impairment charges under SFAS 144 and $25.2 million in deferred tax expense. Changes in operating assets and liabilities during 2008 resulted in a net cash inflow of $12.0 million. An increase in other current liabilities of $51.7 million (primarily attributable to $13.9 million of accruals for bonuses, a $17.5 million earnout payable to the former owners of Hawkeye, a $4.3 million increase in accruals for job costs, a $6.5 million accrual for unrealized losses on a derivative transaction, a $4.4 million increase in accrued insurance and $3.6 million of billings in excess of revenues due largely to a year-end customer payment) more than offset a $30.7 million increase in accounts receivables and a $6.8 million increase in inventories reflecting the growth in our business. In 2007, we incurred a $35.5 million non-cash goodwill impairment charge under SFAS 142 relating primarily to our investment in Hawkeye and $42.5 million of depreciation and amortization, which more than offset a $11.9 million increase in our deferred tax liability, net of the increase in our deferred tax asset.
55
Table of Contents
Cash used in investing activities. During the six months ended June 30, 2009, net cash used in investing activities was $18.3 million, which was primarily for capital expenditures.
During the year ended December 31, 2008, net cash used by investing activities was $32.9 million compared to $26.0 million for the year ended December 31, 2007. The primary use of cash for the year ended December 31, 2008 was $34.5 million of capital expenditures compared to $24.5 million for the year ended December 31, 2007.
Cash from financing activities. During the six months ended June 30, 2009, net cash provided by financing activities was $15.0 million as the $29.0 million of revolver borrowings during the period was offset in part by $13.1 million of cash used to repay our revolver, term loan, capital leases and other long-term debt. In October 2009, we issued $20.0 million of our 15% Redeemable Convertible Cumulative Preferred Stock, the proceeds of which were used to pay down $10 million on our term loan and to pay $2.8 million for arrangement and amendment fees, as well as legal fees and expenses relating to the amendment of our credit facility. We retained the remaining proceeds for general corporate purposes.
During the year ended December 31, 2008, net cash used by financing activities was $19.2 million as cash used to repay our revolver, term loan, capital leases and other long-term debt more than offset $43.0 million of revolver borrowings during the year. We used $13.7 million in financing activities during the year ended December 31, 2007 to repay $51.9 million of our term loan and make payments on our revolver. Other long-term debt more than offset a $50.0 million contribution to equity from an affiliate of TPF and $25.0 million of revolving credit borrowings.
Capital Expenditures
We expect capital expenditures of approximately $30 million in 2009, primarily for equipment and vehicles, which could vary depending on the expected award and timing of commencement of CREZ work and other large electric power transmission projects. We intend to fund those expenditures primarily from operating cash flow and, depending on working capital and other requirements, our revolving line of credit, capital leases and, in some cases, vendor financing. Our credit facilities currently limit capital expenditures to $40 million in 2009 and $45 million in 2010 and vendor financing to an aggregate of $30 million. We expect to supplement this spending with operating leases in 2009 and 2010 as we ramp up for CREZ.
Financing Agreements
Our credit facilities include a $309 million term loan, of which $249.7 million was outstanding as of June 30, 2009, and a $100 million revolving line of credit. The term loan was established to refinance the debt used to fund the TPF Acquisition and to fund the Hawkeye Acquisition. Our credit facilities contain restrictive covenants, including financial covenants, as amended, to maintain an interest coverage ratio of not less than 2.50 to 1.00 at June 30, 2009 (with no test required for the quarters ending September 30, 2009, December 31, 2009, March 31, 2010 and June 30, 2010), and a maximum total leverage ratio of 4.60 to 1.00 at June 30, 2009 (with no test required for the quarters ending September 30, 2009, December 31, 2009, March 31, 2010 and June 30, 2010), in each case based on consolidated EBITDA (as defined in our credit facilities) for the trailing four quarters. These financial covenants adjust periodically (other than for the aforementioned periods when no leverage or interest coverage test is required). In connection with an amendment to the credit facilities in October 2009, which became effective as of September 30, 2009, a minimum consolidated EBITDA covenant and a minimum liquidity covenant were added to the financial covenants, requiring us to maintain a minimum level of consolidated EBITDA for the previous four fiscal quarters beginning with the quarter ending September 30, 2009 until the quarter ending June 30, 2010 (such minimum amount adjusted periodically) and at least $20.0 million in available liquidity as of any month ending on or prior to June 30, 2010. In addition, our credit facilities include other customary restrictions including changes in the business, other indebtedness, liens, disposition of property, capital expenditures, use of proceeds, restricted payments and investments. We were in default of the leverage ratio covenants under our credit facilities at September 30, 2009. Our lenders waived these defaults in connection with the October 2009 amendment to our credit facilities.
56
Table of Contents
The term loan, as amended, matures in November 2012, requires monthly interest payments, at a rate per annum equal to, at our option, either (i) the base rate (generally the applicable prime lending rate of Credit Suisse) plus a margin of 3.50% (subject to a base rate “floor” of 3.50% or LIBOR plus 1.00%) or (ii) LIBOR plus a margin of 4.50% (subject to a LIBOR “floor” of 2.50%), quarterly principal payments and excess cash flow payments, if any, due annually within 120 days of year end and is secured by substantially all of our assets. The revolving line of credit matures in November 2011, requires monthly interest payments at the same rates as the term loan with any outstanding principal balance due upon maturity and is also secured by substantially all of our assets. The revolving line of credit was established to provide working capital flexibility and is available for loans and letters of credit. The letters of credit outstanding at any time may not exceed $60 million. There was an outstanding balance of $5.0 million, $4.0 million and $27.0 million on the revolving line of credit at December 31, 2008 and 2007 and June 30, 2009, respectively. Additionally, there were letters of credit outstanding of $14.2 million, $25.9 million and $13.8 million at December 31, 2008 and 2007 and June 30, 2009, respectively. The revolving line of credit is subject to commitment fees, which are paid on the unutilized portion of the line.
In connection with an amendment to the credit facilities in September 2007, an affiliate of TPF made a $50 million loan (sometimes referred to in this prospectus as the “TPF loan”) in the form of a convertible note to InfrastruX Holdings, LLC, our parent, the proceeds of which were contributed to us for purposes of paying down the term loan principal balance. The pay down resulted in the write-off of $1.4 million of unamortized deferred financing costs and third-party fees, included in loss on modification of debt in the consolidated statements of operations. In connection with the October 2009 amendment to our credit facilities, we determined that the TPF loan had constituted a default under such facilities. In connection with the amendment, the TPF loan and $17.8 million of accrued interest were converted to preferred interests in InfrastruX Holdings, LLC and the default was waived by the lenders.
The October 2009 amendment to the credit facilities requires us to pay a supplemental revolver cash amount of 1.00% per annum plus, in the event of a ratings downgrade event, an additional 0.50% per annum (with no such supplemental revolver cash amount due so long as there has been no ratings downgrade event and the total leverage ratio is less than 3.50 to 1.00) on outstanding revolver and swing loan borrowings and a supplemental term loan cash amount of 0.50% per annum plus, in the event of a ratings downgrade event, an additional 0.50% per annum (with no such supplemental term loan cash amount due so long as there has been no ratings downgrade event and the total leverage ratio is less than 3.50 to 1.00) on the outstanding term loan principal balance. In addition, the amendment requires us to repay outstanding amounts under our revolving line of credit with cash on hand in excess of $15 million until the earlier of September 30, 2011 and the date we meet leverage and interest coverage ratios in effect prior to the October 2009 amendment. With respect to the term loan, the amendment requires us to increase the principal amount of the term loan at a rate of 0.50% per annum (unless there has been no ratings downgrade event and the total leverage is less than 3.50 to 1.00). Beginning with the fiscal quarter ending September 30, 2010, the amendment also requires us to increase the principal amount of the term loan at a rate of 1.00% per annum if consolidated EBITDA is less than a specified amount for the previous four fiscal quarters. Also, in connection with the amendment, we issued and InfrastruX Holdings, LLC acquired 20,000 shares of our 15% Senior Redeemable Convertible Cumulative Preferred Stock (which preferred shares were pledged as collateral under our credit facilities) for an aggregate purchase price of $20 million, and we made a $10 million mandatory prepayment on the term loan principal balance and paid an arrangement and amendment fee, as well as legal fees and expenses incurred by lenders’ counsel, in the aggregate amount of $2.8 million with a portion of the proceeds of the preferred stock.
57
Table of Contents
Use of Proceeds
We intend to use the net proceeds of this offering to repay approximately $ million of indebtedness outstanding under our credit facilities, to redeem approximately $ of our 15% Senior Redeemable Convertible Cumulative Preferred Stock (representing all the outstanding shares of such stock), and to retain approximately $ for general corporate purposes, including working capital purposes and to fund future acquisitions. See “Use of Proceeds.”
Contractual Obligations and Other Commitments
The following table identifies our future contractual obligations as of December 31, 2008:
| Payments Due by Period | |||||||||||||||||
| Total | Less than 1 Year |
1-3 Years | 4-5 Years | More than 5 Years | |||||||||||||
| (dollars in thousands) | |||||||||||||||||
| Long-term debt—principal |
$ | 257,940 | $ | 4,578 | (1) | $ | 253,362 | (1) | $ | — | $ | — | |||||
| Estimated interest payments on long-term debt(2) |
47,368 | 12,597 | 24,882 | 9,889 | — | ||||||||||||
| Capital lease obligations |
14,624 | 10,923 | 3,664 | 37 | — | ||||||||||||
| Operating lease obligations |
54,201 | 15,168 | 27,582 | 11,451 | — | ||||||||||||
| Interest rate swap obligations(3) |
6,450 | 6,450 | — | — | — | ||||||||||||
| Hawkeye earnout(4) |
17,500 | 17,500 | — | — | — | ||||||||||||
| Total |
$ | 398,083 | $ | 67,216 | $ | 309,490 | $ | 21,377 | $ | — | |||||||
| (1) | Does not reflect the 0.50% increase in principal balance per annum required by the September 2007 amendment to our credit facilities described above. |
| (2) | Estimated interest payments on long-term debt are based on outstanding principal balances and interest rates in effect as of December 31, 2008 through maturity as adjusted for future scheduled principal payments. |
| (3) | Amount equals the present value of estimated payments due on two interest rate swap obligations maturing during the year ended December 31, 2009 and is based on interest rates in effect as of December 31, 2008. |
| (4) | This earnout was paid in the second quarter of 2009. See “Certain Relationships and Related Party Transactions—Other Related Party Transactions.” |
Excluded from the above table are our multi-employer pension plan contributions which are determined annually based on our union employee payrolls, which cannot be determined for future periods in advance. See Note 1(p) of our consolidated financial statements for contributions made to multi-employer pension plans in 2006, 2007 and 2008. For further information regarding risks related to our unionized workforce see “Risk Factors.”
Off-Balance Sheet Arrangements
As is common in our industry, we have entered into certain off-balance sheet arrangements in the ordinary course of business that result in risks not directly reflected in our balance sheets. Our significant off-balance sheet transactions include liabilities associated with non-cancelable operating leases, letter of credit obligations and surety guarantees. We have not engaged in any off-balance sheet financing arrangements through variable interest entities, and we do not guarantee the work or obligations of third parties although in some circumstances we use subcontractors for work that we guarantee.
Operating Leases. We have historically owned a significant portion of our equipment fleet, but we regularly enter into cancelable and non-cancelable operating leases for many of our facilities and some of our vehicle and equipment needs. We have increased our use of operating leases to support our ramp up for the Oncor agreement, the expense for which was largely offset by reductions in short-term leases in 2008. Rent expense related to operating leases with terms greater than one year in duration was $8.2 million and $11.6 million for the years ended December 31, 2007 and 2008, respectively, and $7.6 million for the six month period ended June 30, 2009. Rent expense related to operating leases with terms less than one year in duration was $30.9 million and
58
Table of Contents
$28.4 million for the years ended December 31, 2007 and 2008, respectively, and $8.4 million for the six month period ended June 30, 2009. Operating leases allow us to conserve cash by paying a monthly lease rental fee for use of facilities, vehicles and equipment rather than purchasing them. We may decide to cancel or terminate a lease before the end of its term, in which case we are generally liable to the lessor for the remaining lease payments under the term of the lease. At the end of the lease, we generally have no further obligation to the lessor. However, we have from time to time guaranteed the residual value of certain of the equipment we lease. Under these arrangements, if the fair value of the underlying equipment at the termination of the lease is less than the residual value, we would be required to pay the lessor the difference. The maximum aggregate guaranteed residual value was approximately $4.8 million, $9.0 million and $7.9 million at December 31, 2007 and 2008 and June 30, 2009, respectively. We believe that no significant payments will be made as a result of our residual value guarantees. However, there can be no assurance that future payments will not be required.
Letters of Credit. Certain of our vendors require letters of credit to ensure reimbursement for amounts they are disbursing on behalf of us, such as to beneficiaries under our self-funded insurance programs. Such letters of credit are issued under our revolving credit facility. The letters of credit commit the issuer to pay specified amounts to the holder of the letter of credit if the holder demonstrates that we have failed to perform specified actions. If this were to occur, we would be required to reimburse the issuer of the letter of credit. Depending on the circumstances of such a reimbursement, we may also have to record a charge to earnings for the reimbursement. To date we have not had a claim made against a letter of credit.
At June 30, 2009, we had $13.8 million in letters of credit outstanding under our credit facilities, primarily to secure obligations under our surety program and, to a lesser extent, certain of our insurance obligations. We expect to continue to utilize a significant portion of our letter of credit availability to maintain our surety availability and cost structure. Although not actual borrowings, letters of credit do reflect potential liabilities under our credit facilities and therefore are treated as a use of borrowing capacity thereunder, reducing our borrowing availability for other purposes. These irrevocable stand-by letters of credit will expire at various times throughout 2009. Upon maturity, we expect that the majority of these letters of credit, which typically contain evergreen clauses, will be renewed for subsequent one-year periods.
Surety Bonds. Many customers, particularly in connection with new construction, require us to post performance and payment bonds issued by a financial institution known as a surety. These bonds provide a guarantee to the customer that we will perform under the terms of a contract and that we will pay subcontractors and vendors. If we fail to perform under a contract or to pay subcontractors and vendors, the customer may demand that the surety make payments or provide services under the bond. We must reimburse the surety for any expenses or outlays it incurs. Under our continuing indemnity and security agreement with the surety, with the consent of our lenders under our credit facilities, we have granted security interests in certain of our assets to collateralize our obligations to the surety. We are required to post letters of credit or other collateral in favor of the surety. Posting letters of credit in favor of the surety or our customers reduces the borrowing availability under our revolving credit facility. We believe that it is unlikely that we will have to fund significant claims under our surety arrangements in the foreseeable future. As of June 30, 2009, an aggregate of approximately $67.2 million in original face amount of bonds issued by the surety were outstanding. Our estimated cost to complete these bonded projects was approximately $25.2 million as of June 30, 2009.
Concentration of Credit Risk
We selectively grant credit, generally without collateral, to our customers. Consequently, we are subject to potential credit risk related to changes in business and economic factors throughout the U.S. However, we generally are entitled to payment for work performed and may have certain lien rights on our services provided. Under certain circumstances such as foreclosures or negotiated settlements, we may be required to take title to the underlying assets in lieu of cash in settlement of receivables. At December 31, 2008 and June 30, 2009, Oncor represented $35.6 million, or approximately 20.3%, and $48.9 million, or approximately 35.6%, of accounts receivable, respectively. No other customers represented 10% or more of accounts receivable as of such dates. Please refer to Note 1(f) of our consolidated financial statements for additional information.
59
Table of Contents
Many of our customers are experiencing challenges in the current business climate. These economic conditions expose us to increased risk related to collectibility of receivables for services we have performed. As a percentage of accounts receivable our allowance for doubtful accounts was 1.6%, 1.9% and 1.1% for the years ended December 31, 2007 and 2008 and the six months ended June 30, 2009, respectively. While our allowance for doubtful accounts fully reflects our estimate of our current exposure to collection of receivables, if and to the extent any of our large customers suffer financial difficulties, we could suffer reduced cash flows and losses in excess of these allowances.
We also maintain a cash collateral and receivable balance for our comprehensive insurance coverage with a major insurer to support our obligations. Cash collateral and receivables due from our insurance company, which are recorded in prepaid expense and other current assets and other assets on our consolidated balance sheets, was $32.7 million as of June 30, 2009. If our insurance company files for bankruptcy or experiences financial difficulties, these balances could become unavailable and we could be required to use additional sources of liquidity to fund claims.
Seasonality and Cyclicality
Our revenues and results of operations are subject to seasonal variations. These variations are influenced by weather, hours of daylight, customer spending patterns, available system outages from utilities, bidding seasons and holidays. During the winter months, demand for maintenance and construction services is typically lower due to inclement weather. However, demand for repair and maintenance services attributable to damage caused by storm damage during the winter months may partially offset the loss of revenues. Demand for our services generally increases during the spring and summer as a greater number of projects are underway and weather conditions improve. However, during periods of peak electricity demand in the summer months, utilities are often unable to remove their electric power T&D equipment from service, decreasing the demand for our maintenance services during such periods. Our working capital needs generally follow these seasonal patterns. Because our operating cash flow is usually lower during and following the winter months, we typically experience a need to finance a portion of our working capital during the spring and summer.
Additionally, our industry can be highly cyclical as evidenced by the weakness in new home hookups and other electric power and natural gas-related distribution services due to the new home construction downturn, the decline in expenditures on development of domestic natural gas resources and the related demand for infrastructure services resulting from reduced natural gas prices and the general reduction in spending by our customers due to the overall decline in the economy. The financial condition of our customers and their access to capital, variations in the margins of projects performed during any particular quarter, the timing and magnitude of acquisition assimilation costs, regional economic conditions and timing of acquisitions may also materially affect quarterly results. Accordingly, our operating results in any particular quarter may not be indicative of the results that can be expected for any other quarter or for the entire year.
Non-GAAP Discussion
In addition to our GAAP results, we use Adjusted EBITDA as a supplemental measure of our operating performance and as part of our compensation determinations. Adjusted EBITDA is not required by or presented in accordance with GAAP and should not be considered as an alternative to net income, operating income, or any other performance measure derived in accordance with GAAP, or as an alternative to cash flow from operating activities or as a measure of our liquidity.
In this prospectus, Adjusted EBITDA is defined as net income (loss) plus interest expense net of interest income, plus income tax expense (benefit) and plus depreciation and amortization (EBITDA), as adjusted for expenses and gains that we do not consider reflective of our core operating performance. Management considers our core operating performance to be that which can be affected by our managers in any particular period through their management of the resources that affect our underlying revenue and profit generating operations during that period.
60
Table of Contents
We present Adjusted EBITDA because we consider it to be an important supplemental measure of our operating performance. Adjusted EBITDA is the fundamental measure of our operating performance under our credit facilities and is regularly presented to and considered by our management and board of directors as the primary operating metric in their assessments of performance and in forecasting and budgeting, both for individual operating units and for our company as a whole. Historical and projected Adjusted EBITDA are also key operating measurements used by management in assessing potential acquisitions. We also make certain compensation decisions based, in part, on our operating performance, as measured by Adjusted EBITDA. See “Compensation Discussion and Analysis.” In addition, most adjustments reflected in Adjusted EBITDA are permitted adjustments in measuring our performance under our credit facilities.
We believe Adjusted EBITDA allows us to compare our current operating results with corresponding historical periods and with the operational performance of other companies in our industry because it does not give effect to potential differences caused by variations in capital structures (affecting relative interest expense, including the impact of write-offs of deferred financing costs when companies refinance their indebtedness), tax positions (such as the impact on periods or companies of changes in effective tax rates or net operating losses), the book amortization of intangibles (affecting relative amortization expense) and other items that we do not consider reflective of underlying operating performance. We also present Adjusted EBITDA because we believe it is frequently used by securities analysts, investors and other interested parties as a measure of performance and because it used by our lenders to monitor covenant compliance.
In evaluating Adjusted EBITDA, you should be aware that in the future we may incur expenses similar to the adjustments described above. Our presentation of Adjusted EBITDA should not be construed as an inference that our future results will be unaffected by expenses that are unusual, non-routine, or non-recurring. Adjusted EBITDA has limitations as an analytical tool and you should not consider it in isolation, or as a substitute for analysis of our results as reported under GAAP. Some of these limitations of adjusted EBITDA are:
| • | cash expenditures for capital expenditures or contractual commitments; |
| • | changes in, or cash requirements for, our working capital requirements; |
| • | non-cash share-based compensation, which is a key long-term element of our compensation strategy; |
| • | impairment charges for goodwill or assets that reflect our assessment of reduced values in accordance with SFAS 142 and 144; |
| • | interest expense, or the cash requirements necessary to service interest or principal payments on our indebtedness, and charges for financing fees and losses on extinguishment of debt; and |
| • | the cost or cash required to replace assets that are being depreciated or amortized. |
In addition, other companies, including other companies in our industry, may calculate these measures differently than we do, limiting the usefulness of Adjusted EBITDA as a comparative measure. Because of these limitations, Adjusted EBITDA should not be considered as a substitute for net income, operating income, or any other performance measure derived in accordance with GAAP, or as an alternative to cash flow from operating activities or as a measure of our liquidity. We compensate for these limitations by relying on our GAAP results in addition to using Adjusted EBITDA. For more information, see our consolidated financial statements and the notes to those statements included elsewhere in this prospectus.
61
Table of Contents
The following table presents data relating to Adjusted EBITDA, which is a non-GAAP measure, for the periods indicated:
| Predecessor(1) | Successor(1) | |||||||||||||||||||||||||||||
| Period January 1, 2006 to May 7, 2006 |
Period May 8, 2006 to December 31, 2006 |
Combined Year Ended December 31, 2006 |
Year Ended December 31, |
Six Months Ended June 30, |
||||||||||||||||||||||||||
| 2007 | 2008 | 2008 | 2009 | |||||||||||||||||||||||||||
| (unaudited) | (unaudited) | |||||||||||||||||||||||||||||
| (dollars in thousands) | ||||||||||||||||||||||||||||||
| Net loss |
$ | (2,532 | ) | $ | (1,944 | ) | $ | (4,476 | ) | $ | (41,801 | ) | $ | (36,568 | ) | $ | (20,988 | ) | $ | (9,061 | ) | |||||||||
| Plus: interest expense, net |
2,934 | 16,028 | 18,962 | 33,029 | 27,468 | 13,298 | 7,443 | |||||||||||||||||||||||
| Plus: income tax (benefit) expense |
(237 | ) | (1,152 | ) | (1,389 | ) | (14,376 | ) | (14,028 | ) | (8,722 | ) | (2,818 | ) | ||||||||||||||||
| Plus: depreciation and amortization |
7,150 | 22,806 | 29,956 | 42,469 | 41,582 | 20,822 | 20,137 | |||||||||||||||||||||||
| EBITDA |
7,315 | 35,738 | 43,053 | 19,321 | 18,454 | 4,410 | 15,701 | |||||||||||||||||||||||
| Plus: impairment of goodwill |
— | — | — | 35,484 | (2) | 45,268 | (3) | 26,484 | — | |||||||||||||||||||||
| Plus: impairment of intangible assets |
— | — | — | — | 7,620 | (4) | 7,620 | — | ||||||||||||||||||||||
| Plus: refinancing charges |
— | 8,518 | (5) | 8,518 | (5) | 1,373 | (6) | — | — | — | ||||||||||||||||||||
| Plus: financing costs and bank fees |
— | 1,750 | 1,750 | 2,569 | 2,839 | 1,377 | 1,586 | |||||||||||||||||||||||
| Plus: TCM management fees(7) |
— | 1,290 | 1,290 | 2,013 | 2,000 | 1,000 | 1,000 | |||||||||||||||||||||||
| Plus: Hawkeye earnout(8) |
— | — | — | — | 17,500 | — | — | |||||||||||||||||||||||
| Plus: change of control bonuses(9) |
3,537 | — | 3,537 | — | — | — | — | |||||||||||||||||||||||
| Plus: non-cash equity compensation(10) |
274 | — | 274 | — | 4,308 | 3,176 | 888 | |||||||||||||||||||||||
| Plus: restructuring costs |
— | — | — | — | — | — |
|
66 |
| |||||||||||||||||||||
| Plus: other, net |
20 | (11) | 1,265 | (12) | 1,285 | (12) | (2,519 | )(13) | 1,419 | (14) | 34 | (11) | 2,198 | (15) | ||||||||||||||||
| Minus: gain on litigation resolution |
— | — | — | — | (4,253 | )(16) | (2,800 | )(16) | — | |||||||||||||||||||||
| Adjusted EBITDA |
$ | 11,146 | $ | 48,561 | $ | 59,707 | $ | 58,241 | $ | 95,155 | $ | 41,301 | $ | 21,439 | ||||||||||||||||
| (1) | Our financial statements for the period prior to May 8, 2006 (our predecessor period) were prepared on the historical cost basis of accounting. Our financial statements for periods subsequent to May 8, 2006 (our successor periods) reflect the application of purchase accounting to the TPF Acquisition, which required that we record our assets and liabilities at fair value as of May 8, 2006. In addition, our financial statements for the successor periods include Hawkeye from the November 2006 date of the Hawkeye Acquisition. As a result, our results for the successor periods are not comparable to the predecessor period. |
| (2) | Represents goodwill impairment charges of $29.5 million and $6.0 million in our Eastern and Midwest regions, respectively. See “Management’s Discussion and Analysis of Financial Condition and Results of Operations—Year Ended December 31, 2007 Compared to the Year Ended December 31, 2006—Impairment Charges.” |
| (3) | Represents a goodwill impairment charge of $26.5 million in our Eastern region, during the second quarter of 2008, as well as an additional $18.8 million impairment charge in the same region during the fourth quarter of 2008. See “Management’s Discussion and Analysis of Financial Condition and Results of Operations—Year Ended December 31, 2008 Compared to the Year Ended December 31, 2007—Impairment Charges.” |
| (4) | Represents a non-cash intangible asset impairment charge relating to a small operating unit that experienced the departure of its president and former owner during the year. See “Management’s Discussion and |
62
Table of Contents
| Analysis of Financial Condition and Results of Operations—Year Ended December 31, 2008 Compared to the Year Ended December 31, 2007—Impairment Charges.” |
| (5) | In 2006, we refinanced the debt we incurred to facilitate the TPF Acquisition and, as a result, wrote off $7.4 million of deferred financing costs and paid $1.1 million in prepayment penalties. |
| (6) | Represents bank costs we incurred in amending certain provisions of our credit facilities. |
| (7) | Represents the management fee payable to TCM. Excludes interest charges on the unpaid management fees, which are included in interest expense, net. This fee will no longer be payable upon completion of this offering. |
| (8) | Represents a non-recurring earnout payment to the former owners of Hawkeye. |
| (9) | Represents payments funded by our predecessor owner in connection with the TPF Acquisition but reflected in our results of operations. |
| (10) | Represents non-cash share-based compensation under our equity incentive plan. |
| (11) | Represents gains and losses on the sale of certain assets. |
| (12) | Represents certain legal fees relating to an abandoned transaction, as well as gains and losses on the sale of certain assets. |
| (13) | Primarily represents a $2.5 million gain from the proceeds of a key person life insurance policy following the death of one of our operating unit executives. |
| (14) | Primarily represents $1.4 million of professional fees incurred in preparation for this offering. |
| (15) | Represents gains and losses on the sale of certain assets and professional fees incurred in preparation for this offering. |
| (16) | Represents a gain from the resolution of a litigation matter. |
Quantitative and Qualitative Disclosures About Market Risk
We are exposed to market risk primarily related to potential adverse changes in interest rates as discussed below. We have not historically used derivative financial instruments for trading or to speculate on changes in interest rates or commodity prices. In June 2006 and December 2006, we entered into interest rate swap agreements, each with a term of three years, neither of which is designated as a cash flow hedge for financial reporting purposes under issued Statement of Financial Accounting Standards No. 133, Accounting for Derivative Instruments and Hedging Activities, to hedge the variability of cash flows related to our variable rate term loan. At December 31, 2008, we had a $6.5 million current liability for these interest rate swap positions. In April 2009, we entered into a new two-year interest rate swap agreement, which becomes effective December 31, 2009. We are not exposed to any significant market risks, foreign currency exchange risk or interest rate risk from the use of derivative financial instruments.
The sensitivity analysis below, which illustrates our hypothetical potential market risk exposure, estimates the effects of hypothetical sudden and sustained changes in the applicable market conditions on 2008 earnings. The sensitivity analyses presented do not consider any additional actions we may take to mitigate our exposure to such changes. The hypothetical changes and assumptions may be different from what actually occurs in the future.
As of December 31, 2008, our $309 million term loan was subject to floating interest rates. On June 26, 2006, we entered into an interest rate swap of $102.5 million notional amount with a fixed rate of 5.639% in exchange for floating rates until June 26, 2009. On December 31, 2006, we entered into another interest rate swap of $62.5 million notional amount with a fixed rate of 4.78% in exchange for floating rates until June 25, 2009, at which time the notional amount increased to $165.0 million until maturity on December 31, 2009. As a result of these transactions, we had $86.1 million of our term loan subject to floating rate risk as of December 31, 2008. As such, we are exposed to earnings and fair value risk due to changes in interest rates with respect to our long-term obligations. The negative impact on our 2008 pre-tax earnings of a hypothetical 50 basis point increase in interest rates on the $86.1 million unhedged portion of our term loan would have been approximately $0.4 million. That negative impact on our pre-tax earnings would be $ on a consolidated as adjusted basis after utilizing a portion of the proceeds of this offering to pay down our term loans. See “—Liquidity and Capital Resources—Financing Arrangements” for further discussion of our debt instruments. In April 2009, we entered into an interest rate swap of $187.0 million notional amount (declining quarterly) with a fixed rate of 1.889% in exchange for floating rates until December 31, 2011. This swap is effective December 31, 2009. See Notes 1(i), 6 and 17 to our consolidated financial statements included elsewhere in this prospectus.
63
Table of Contents
Accounting Pronouncements Issued But Not Yet Adopted
In June 2009, the FASB issued Statement of Financial Accounting Standards No. 168, The FASB Accounting Standards Codification and the Hierarchy of Generally Accepted Accounting Principles (SFAS 168), which replaced Statement of Financial Accounting Standards No. 162, The Hierarchy of Generally Accepted Accounting Principles. This statement documents the hierarchy of the various sources of accounting principles and the framework for selecting the principles used in preparing financial statements. This statement shall be effective for interim and fiscal years ending after September 15, 2009. SFAS 168 will not have a material impact on the Company’s consolidated financial statements.
64
Table of Contents
Electric Power T&D
The electric power industry consists of investor-owned utilities, municipal utilities, cooperatives, federally-owned utilities, independent power producers, independent transmission companies and other companies that engage in the generation, transmission and/or distribution of electric power. The U.S. T&D network, sometimes referred to as the “grid,” consists of transmission lines, substations, distribution lines and other infrastructure components that connect and deliver power from generating facilities to residential, commercial and industrial end users. As of 2008, the U.S. electric power grid included approximately 160,000 miles of transmission lines and several million miles of distribution lines, with widely dispersed local and regional ownership and often overlapping local, state, regional and federal regulatory oversight. We focus on providing maintenance and construction services to customers that own electric power T&D infrastructure assets in the U.S.
Our typical customers include regulated electric power utilities which, subject to relevant public utility commission approval, are able to pass the construction, maintenance and other costs of transmission infrastructure ownership on to their rate paying customers. Energy providers regularly invest in T&D infrastructure to maintain existing operations, support demand growth and geographic changes, meet regulatory capacity margin requirements and ensure overall system reliability. According to a report by the American Society of Civil Engineers published in March 2009, electricity demand in the U.S. has increased by approximately 25% since 1990 while construction of transmission infrastructure decreased by approximately 30% during the same period. While annual investment in new transmission infrastructure has generally declined or been stagnant during the last 30 years, there has been an increase in investment during the past few years. Over the long-term there has been a strong correlation between GDP growth and electricity demand growth in industrialized nations. According to a 2009 report by the EIA, overall domestic electricity consumption is estimated to increase approximately 22% between 2008 and 2030. Despite the impact of the current economic downturn on electricity demand, we believe this long-term consumption growth, combined with the historic underinvestment in transmission infrastructure and other factors detailed below, will drive greater electric power T&D expenditures and create opportunity for specialty contractors focused on energy-related T&D end markets.
Inadequacy of existing electric power T&D infrastructure. The nation’s electric power T&D grid and other infrastructure are aging, overloaded and in need of maintenance, upgrade and expansion. According to the EIA, approximately 70% of transmission lines and power transformers are at least 25 years old. Increased electricity demand without corresponding transmission investment has exceeded the capacity of existing transmission infrastructure and has led to congestion on the grid. The cost of this congestion to the U.S. economy is significant and results in higher electricity costs and lower reliability.
More efficient use of energy generation. The current electric power infrastructure is congested and regionalized, which limits the efficient movement of electricity throughout the U.S. and results in areas with high electricity costs unable to efficiently receive power from areas with lower cost generation sources. We believe consumer demand for lower-cost energy will drive efforts to upgrade and improve electric power transmission and improve the efficiency and flexibility of the overall system throughout the U.S. For example, AEP and Allegheny Energy are jointly planning a $1.8 billion transmission project and Allegheny Energy is planning an $820 million transmission project to help bring lower-cost power from the western portion of their markets to the higher-cost eastern portion. A recent joint study by transmission grid operators in the U.S. shows that $80 billion of transmission investment designed to alleviate grid congestion in the Eastern U.S. would offset the costs of initial investment in seven years. We believe there is a growing recognition of the need for investment in T&D infrastructure and the development of a more flexible “Smart Grid” to achieve an overall reduction in electricity costs by increasing the efficiency of electric power delivery and more effectively matching electric power supply with demand.
65
Table of Contents
Increased development of wind and other renewable power sources. According to an AWEA report, from 2002 through 2008, wind energy generation capacity grew at a compounded annual growth rate of approximately 33%, making wind energy the fastest growing source of new electricity supply in the U.S during that period. According to a study by Emerging Energy Research, installed wind capacity is expected to grow from an estimated 29,400 MW as of June 2009 to over 50,000 MW by year end 2013. Annual investment in wind infrastructure in the U.S. was expected to average over $5 billion during this period. Because the major U.S. wind corridors are generally located away from urban demand centers, we expect significant transmission spending will be required to connect new wind generation facilities to end users. We also believe that state and federal legislation mandating increased levels of renewable energy generation will drive the growth of renewable and alternative energy generation even during periods when lower commodity prices make traditional energy sources more cost-efficient.
| • | Texas CREZ Case Study. Texas, which according to AWEA is the state with the most installed wind capacity, has implemented a program that will significantly expand the state’s wind power generation. Texas created Competitive Renewable Energy Zones, or CREZ, which are defined geographic areas in the state suitable for the development of renewable energy resources, principally wind power. As part of the Texas program, the CREZ plan outlines the constructing or upgrading of 2,400 miles of 345-kV transmission lines at a cost of approximately $4.9 billion. While the CREZ transmission projects were allocated to 13 different utilities, Oncor, our largest customer, received the largest transmission allocation of $1.3 billion. As a result, we believe CREZ will represent a significant opportunity, although a substantial amount of this work has not yet been committed to us. |
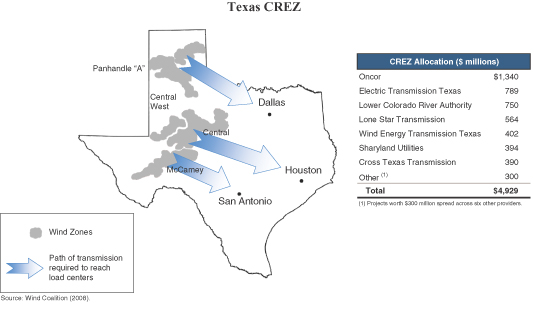
| • | State Renewable Portfolio Standards. As of July 2009, 29 states and Washington D.C. have adopted mandatory RPS programs. At least 5 other states have enacted non-binding RPS-like goals. In addition to Texas, many states in the Northeast have undertaken mandatory RPS programs, including a requirement that 24% of the state’s electric power be from renewable sources in New York by 2013, 18% in Pennsylvania by 2020 and 23% in Connecticut by 2020. |
66
Table of Contents
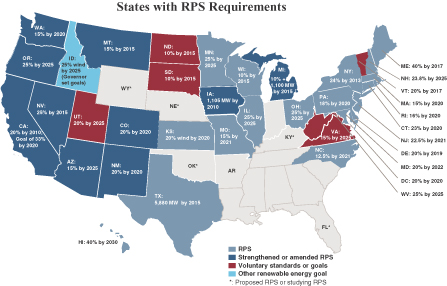
Source: Database of State Incentives for Renewables and Efficiency
| • | Federal Combined Efficiency and Renewable Electricity Standard. On June 26, 2009, the U.S. House of Representatives approved H.R. 2454—the American Clean Energy and Security Act of 2009. The comprehensive clean energy and climate change legislation is intended to cut greenhouse gas emissions, create new clean energy jobs and enhance the energy independence of the U.S. In addition to a cap-and-trade program, the bill also sets forth a federal combined efficiency and renewable electricity standard (CERES). Under the CERES, utilities would be required to meet 6% of their load with electricity generated from renewable resources by 2012, a requirement that would increase to 20% by 2020. The National Renewable Energy Laboratory estimates that more than 12,000 miles of new transmission lines would be needed to achieve the 20% goal (compared to the estimated 500 miles of transmission lines installed in 2008). Utilities would also be able to satisfy a portion of this target through the submission for demonstrated electricity savings. The legislation also aims to clarify and enhance FERC backstop authority beyond what was provided in the Energy Policy Act of 2005. The prospects for and timing of enactment of the bill into law are uncertain. |
Other key regulatory and legislative developments. In addition to RPS standards, federal and state governments have introduced numerous key changes to the regulatory, tax and legal landscape that we believe will lead to increased electric power T&D investment.
| • | American Recovery and Reinvestment Act of 2009. ARRA was enacted in February 2009 and includes $45 billion in provisions and loan subsidies for renewable energy, electric power transmission and energy efficiency projects. We expect to benefit from the appropriation of $11 billion for electric power grid development and transmission infrastructure upgrades (primarily in the Western U.S.), which includes $4.5 billion in funding to the DoE to support the modernization of the electric power grid and development of the “Smart Grid.” |
ARRA includes $6 billion of credit subsidies, which Congress expects will support more than $60 billion in financing activity for renewable energy and transmission loan guarantees, and several billion dollars of tax incentives. We believe these credit subsidies and tax incentives will result in increased renewable energy spending, particularly in wind and related transmission infrastructure, as renewable energy developers now have a means to more easily access capital and monetize tax benefits.
| • | Energy Policy Act of 2005. The Energy Policy Act of 2005 granted FERC increased oversight of the nation’s electric power grid, allowing for regionalized operations, streamlined approvals and reductions in the state and local political obstacles often associated with the construction and operation of electric |
67
Table of Contents
| power infrastructure. The Energy Policy Act of 2005 also provides for the designation of National Interest Electric Transmission Corridors (NIETCs), which are geographic areas where transmission congestion adversely affects the efficient flow of electric power and threatens reliability. Although the scope of FERC’s authority is uncertain, we believe the Energy Policy Act of 2005’s provisions allowing for enhanced and more coordinated enforcement of reliability standards and more streamlined allocation of new projects will support a favorable market environment for increased infrastructure spending. |
Natural Gas T&D
The U.S. has an extensive infrastructure network that transports natural gas throughout the country from its source of supply to the end user. Natural gas infrastructure primarily refers to gathering lines that connect domestic gas wells, including offshore wells, to processing plants, large pipelines that move the gas to areas of user demand and independently operating local distribution networks of smaller pipes that deliver gas to customers. Transmission infrastructure includes approximately 306,000 miles of large-diameter, high-pressure pipelines that are typically owned by transmission companies or utilities. The individual distribution systems are primarily operated by local distribution companies, which receive natural gas at delivery points and use an expansive network of over one million miles of small-diameter pipelines for delivery to end users. Within the natural gas industry, we focus on providing maintenance and construction services to customers that own T&D infrastructure assets in the U.S. Our customers include natural gas production firms, pipeline owners and operators and utilities that deliver natural gas to end customers.
Annual natural gas consumption in the U.S. increased approximately 36% from 1985 to 2008. According to the EIA, natural gas accounted for approximately 24% of U.S. energy consumption in 2008. The U.S. has extensive natural gas resources with capacity for expansion of production, especially from unconventional supply sources such as gas shales. Although the EIA projects a small decline in natural gas consumption in 2009 due to the current recession, we believe that a number of factors will drive growth for domestically produced natural gas over the long term, creating opportunities for specialty contractors providing natural gas T&D maintenance and construction services.
Inadequacy and deterioration of existing natural gas pipeline infrastructure. According to the DoE, nearly 65% of natural gas pipelines in the U.S. were built prior to 1970. Geographic shifts in production and demand and long-term increases in energy consumption have stressed the current infrastructure and created the need for new pipeline construction.
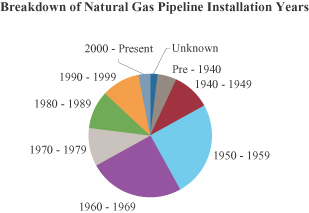
Source: DoE
Increased development of domestic natural gas resources. Unconventional natural gas production, which includes production from tight sand, coal bed methane, methane hydrates and shale, is an increasing contributor to the long-term U.S. natural gas supply and is projected to increase approximately 24% from 9.2 trillion cubic feet in 2007 to approximately 11.4 trillion cubic feet annually by 2020, according to the EIA. Advances in
68
Table of Contents
technology, notably horizontal drilling and hydraulic fracturing, have expanded the economic viability of extracting natural gas from the vast shale basins throughout the Eastern, Western and Southern U.S. As an example of the potential for growth from these new sources, the Barnett shale field in Texas, where commercial scale production started in 1999, contributed more than 7% of total natural gas production from the lower 48 states in 2008 according to the EIA. Additionally, advances in technology have enabled producers to extend production from conventional natural gas resources. We believe that, although current market conditions are weak, producers will continue to develop domestic natural gas reserves over time, creating opportunities for specialty contractors to build and maintain the associated gathering lines and transmission infrastructure to deliver the gas to market.
U.S. Unconventional Gas Production (Tcf/year)
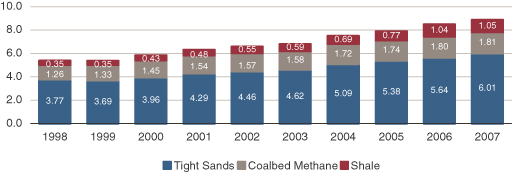
Source: EIA, 2008
Natural gas as an economic and environmentally favorable alternative to other fossil fuels. In some U.S. markets, lower natural gas prices have begun to compete with coal prices, causing electric power generators to switch some production from coal to natural gas for new power plants. Natural gas has significant benefits over coal because, when combusted to generate electricity, natural gas produces significantly less carbon emissions than coal. An April 2009 EPA study concluded that greenhouse gases, including carbon dioxide, cause global warming, create air pollution and endanger public health. We believe a major driver of long-term demand for domestic natural gas production will be the uncertainty surrounding potential U.S. greenhouse gas regulations that could restrict the use of coal, either directly or through a cap-and-trade program or carbon taxes that levy mandatory charges per amount of carbon dioxide emitted. Such resolutions would make natural gas a more economically attractive fuel for electricity generation. The EEI estimates that 55% of all new electric generating capacity additions through 2030 will be powered by natural gas. Furthermore, the EEI estimated that if all projected new coal-fired generation through 2020 were replaced by gas-fired generation, the natural gas demanded for electricity generation would increase by more than 60%. We believe we would benefit from an increase in domestic natural gas demand, which will require increased transmission infrastructure investment.
Outsourcing of Infrastructure Services
Due to cost control initiatives, the ability to improve service levels and workforce trends, utilities have increased outsourcing of their T&D maintenance and construction services needs. We believe that a majority of utility infrastructure services are still conducted in-house and that there is significant potential for increased outsourcing of utility infrastructure services, especially with respect to electric power utilities. Outsourcing these services provides a number of benefits to the utility, most notably by controlling payroll cost, increased flexibility and access to skilled workers. Outsourced service providers are often able to provide the same services at lower cost because of their specialization, greater scale and the ability to better utilize their workforce and equipment across a larger geographic footprint. Outsourced service providers also offer utilities the ability to better scale service levels to meet their needs and supply the necessary resource of skilled labor to provide infrastructure services. Although current economic conditions have recently caused some of our customers to do more of their work in house, we believe these workforce trends will cause utilities to increase the use of outsourcing to meet their infrastructure services needs over time.
69
Table of Contents
Our Company
We are a leading national provider of maintenance and construction services to the electric power and natural gas transmission and distribution, or T&D, infrastructure markets based on revenue. We combine our project management expertise, large skilled workforce and equipment fleet to provide utilities and energy companies with a broad range of complementary T&D services, including maintenance, construction, repair and emergency storm response. We are one of only a small number of companies that can offer “end-to-end” energy infrastructure services, covering the entire delivery process from the energy source to the end user.
In the electric power market, we are one of the largest national contractors serving the T&D sector based on revenue, and our comprehensive infrastructure capabilities include maintaining and constructing overhead and underground electric power transmission lines, substations and distribution lines. In the natural gas market, we serve our customers’ gas transportation infrastructure needs from the wellhead to gathering lines, pipelines, compressor stations and local distribution systems. To supplement our core offerings, we also provide a range of complementary specialty services, including CableCURE® underground cable restoration, which we also offer internationally, utility-line locating and large-bore directional drilling. From our regional centers in the Southwest, Midwest and East, we are able to pursue and execute projects throughout the country.
We have long-standing relationships with many electric power and natural gas utilities, cooperatives, municipalities, pipeline companies and other owners and developers of energy infrastructure. Our relationships with many of our customers, including Alliant Energy, American Electric Power, ChevronTexaco, Coserv Electric, Dominion, Duke Energy, Equitable Resources, Oncor and Progress Energy, extend for more than 20 years. In 2008, we served approximately 650 customers across electric power and natural gas end markets. The following chart presents the percentage of our consolidated revenue generated by end markets in 2008. Electric power and natural gas T&D specialty services performed for customers are reflected in our electric power and natural gas T&D revenues, respectively. Any other specialty services performed for customers are recorded as revenue from “other services.”
Our business consists of a mix of recurring work and project-based bid work. We have recurring revenues under long-term master service and alliance agreements, which generated approximately 70% of our 2008 revenues. MSAs are typically one to three year contracts and are often renewed. MSAs establish a long-term working framework, including terms, conditions and pricing, for providing our customers a wide array of maintenance and construction services. In late 2008, we expanded on the MSA concept by entering into what we describe as an “alliance agreement” with Oncor, the largest utility in Texas and our largest customer, which we
70
Table of Contents
believe represents a new contractual approach to strengthening our customer relationships. Through this 10.5 year contract, we currently serve as Oncor’s primary contractor for T&D maintenance and construction. This alliance approach significantly enhances the alignment of our interests with those of our customer through joint project planning, stipulated target work volumes and incentive structures. Based on the initial success of our alliance agreement with Oncor, we will seek to establish similar arrangements with other leading utilities.
History
InfrastruX Group, Inc. was organized in June 2000 as a subsidiary of Puget Energy, Inc. to take advantage of the long-term opportunity for utility infrastructure services in the U.S. Between September 2000 and June 2003, InfrastruX Group acquired most of its current operating units. In May 2006, we were acquired by TPF from Puget Energy and continued to operate under the same management team. Our acquisition by TPF offered us the opportunity to resume acquisition and growth projects, and, in November 2006, we acquired Hawkeye, our largest acquisition to date.
Our Competitive Strengths
Our competitive strengths include the following:
Comprehensive service offerings. We believe that utilities will continue to seek efficiencies by focusing on a more limited number of service providers that offer comprehensive capabilities. Our wide range of services allows us to address this demand and provides us with cross-selling opportunities. In particular, we believe our significant experience in more complex, high-voltage electric power transmission and substation work differentiates us from many of our electric T&D competitors. We also offer our natural gas T&D customers a full spectrum of maintenance and construction solutions from large diameter transmission pipelines to the maintenance and installation of local distribution infrastructure. Our specialty services, such as CableCURE® underground cable restoration, utility-line locating and large-bore directional drilling, complement our portfolio of services.
Critical scale and geographic presence. We have a significant presence in key U.S. energy markets including the Southwest, Midwest and East with approximately 4,400 employees as of June 30, 2009 and an equipment fleet that can be mobilized quickly throughout the continental U.S. Our geographic coverage allows us to serve customers whose operations span multiple states or regions, and our scale allows us to quickly deploy large numbers of skilled workers on short notice. We believe we are well positioned to assist our customers in constructing new electric power transmission infrastructure to connect remotely located alternative energy sources to the existing grid.
Long-term customer relationships. We have relationships of more than 20 years with a number of utilities and energy companies, including Alliant Energy, American Electric Power, ChevronTexaco, Coserv Electric, Dominion, Duke Energy, Equitable Resources, Oncor and Progress Energy. Our relationships with Oncor and American Electric Power span more than 50 years. The basis for many of our long-term customer relationships has been and will continue to be the comprehensive, cost-efficient and timely maintenance and construction services we provide. The relationships we have with our core group of customers often allow us to be integrated into the planning stages of their larger projects, which we believe increases the likelihood of maintaining these relationships and securing additional bid work. In addition, these long-term relationships often lead to cross-selling opportunities as many customers prefer to deal with fewer, trusted service providers.
Enhanced revenue visibility and stability through MSAs and alliance agreements. We believe our long-term MSAs and our alliance agreement with Oncor provide us with enhanced revenue visibility and stability as compared to project-by-project bid work. Approximately 70% of our 2008 revenue was generated under MSAs and our alliance agreement. Our MSAs have allowed us to build and to strengthen enduring client relationships and have provided us key advantages in bidding projects and enhanced our opportunities to perform incremental
71
Table of Contents
maintenance and construction work. Our alliance agreement with Oncor includes incentives for Oncor to meet aggregate revenue thresholds more than 40% greater than our 2007 revenue from Oncor, a mechanism to provide us additional Oncor work if threshold spending levels are not projected to be met, indexed annual price adjustments and other key terms designed to further align our interests with those of Oncor.
Successful track record of completing and integrating acquisitions. Since 2000, we have enhanced our growth through a series of strategic acquisitions. These acquisitions have expanded our geographic footprint, the scope of services we offer and the number of customers we serve. In addition, we believe our acquisition strategy has allowed us to access new markets with lower risk and more quickly than entering as a new market participant. For example, our 2002 acquisition of Chapman Construction strengthened our position as a leading provider of electric power transmission and substation services in Texas and enhanced our relationship with Oncor. Our November 2006 acquisition of Hawkeye, LLC and certain of its affiliates, sometimes referred to in this prospectus as the “Hawkeye Acquisition,” broadened our capabilities in key electric power T&D services in the Northeast, particularly in underground transmission services. In conjunction with our information systems, standardized processes and disciplined business practices around project management provide an effective platform for integrating acquired businesses, closely monitoring our projects across operating units and improving labor and equipment utilization.
High quality workforce and strong, experienced management team. Our track record in winning desirable and profitable projects and our commitment to safety have allowed us to attract and maintain a highly skilled workforce capable of handling complex projects, such as high-voltage electric power transmission and specialized underground utility projects. We believe our abilities to attract, develop, retain and deploy our workforce position us to capitalize on increasing demand for skilled services in an era of shrinking and aging utility workforces. We also have the ability to quickly mobilize, expand or contract our workforce to respond to customer needs and effectively staff our projects. Our high quality workforce is led by our strong, experienced management team.
Our Business Strategy
Our business strategy positions us to take advantage of a number of long-term favorable trends:
Capitalize on alternative energy trends. We believe our broad geographic platform and strong customer relationships will allow us to capitalize on favorable trends in key alternative energy end markets such as wind power development. For example, as a major provider of T&D maintenance and construction services in Texas, with approximately 1,600 total employees in the state as of June 30, 2009, we believe we are well positioned to perform a significant portion of the transmission work announced under the CREZ plan, which includes $1.3 billion of work awarded to Oncor, subject to certain state convenience and necessity approvals, although the substantial majority of this work has not yet been committed to InfrastruX. Similarly, with over 1,700 total employees in the Northeast, we believe we are a leading candidate to perform work resulting from RPS programs in the region.
Benefit from new natural gas development. We believe our comprehensive natural gas T&D capabilities and geographic presence will allow us to capitalize on the expected long-term demand for domestic natural gas resource development from traditional gas fields and unconventional resources such as tight sand, coal bed methane, methane hydrates and shale. These resources require significant infrastructure development of gathering systems and transmission pipelines to gather and transport the natural gas from remote regions of supply to areas of consumption.
Pursue alliance agreements. We will continue our efforts to capitalize on the trend of utilities outsourcing T&D maintenance and construction services. We have formalized long-term relationships with many of our customers by entering into MSAs. In addition to continuing to pursue MSAs, we will seek to establish alliance agreements with additional leading utilities, building on the model of the Oncor alliance agreement. We believe that these alliance agreements will improve the alignment of our goals and objectives with those of our customers and increase our revenue visibility and growth potential.
72
Table of Contents
Focus on enhancing operating efficiencies, expanding margins and controlling risk. We seek to improve profitability and control risk by emphasizing the most profitable services in our portfolio, pursuing projects that we believe will generate attractive returns, enhancing safety measures and constantly monitoring our projects. We also continue to seek opportunities for improved labor and equipment resource utilization, to incentivize our management to create and realize profitable cross-selling opportunities across operating units and to share best practices across our operations.
Attract, develop and retain quality employees. A key tenet of our growth strategy has been and will continue to be our ability to attract and maintain the workforce and management talent necessary to provide quality, safe and timely services to our customers. We continue to invest in the recruiting, development and retention of our valuable workforce by focusing training and compensation on safe operation, efficient production and customer satisfaction. As our customers increasingly outsource energy infrastructure services and as their workforces continue to decline in number and grow older, our ability to maintain a highly skilled workforce will become increasingly valuable. To meet anticipated increased business demand, we have expanded our personnel recruiting efforts by extending our relationships with universities, technical colleges, unions and trade schools through scholarships, tuition assistance, course development and internships.
Pursue strategic acquisitions. To complement our organic growth, we continue to search for attractive acquisition opportunities that expand our geographic presence, enhance our service offerings and increase our customer base. We are particularly interested in opportunities that would expand our electric power T&D services or provide turn-key program management. We are also interested in technology-based services, including those that complement our CableCURE® offering. Geographically, we anticipate focusing on expanding the breadth and depth of our service offerings around our existing regional centers of operation in the Southwest, Midwest and East, as well as expanding our geographic reach into the West Coast. We believe that attractive acquisition opportunities will continue to be available due to the fragmented nature of our industry, the desire for many business owners to achieve liquidity and the difficulty many companies face in modernizing and expanding due to capital constraints, particularly under current financial market conditions.
Services
Our broad range of services in electric power and natural gas T&D includes comprehensive maintenance and construction, repair and restoration of utility infrastructure.
Electric Power T&D Services
We provide a broad spectrum of overhead and underground electric power T&D services, from the maintenance and construction of high-voltage transmission lines to the installation of local service lines and meters.
Electric Power Transmission and Substation. We maintain and construct overhead and underground transmission lines up to 500-kV. Overhead transmission services include the installation, maintenance and repair of transmission structures involving wood, concrete, steel pole and steel lattice tower configurations. Underground transmission services include the installation and maintenance of underground transmission cable and its associated duct, conduit and manhole systems. Electric power transmission also includes substation services, which involve the maintenance, construction, expansion, calibration and testing of electric power substations and components. We subcontract related electric power design and engineering work if required.
Electric Power Distribution. We maintain, construct and upgrade underground and overhead electric power distribution lines from 34.5-kV to household voltage levels. Our services encompass all facets of electric power distribution systems, including primary and secondary voltage cables, wood and steel poles, transformers, switchgear, capacitors, underground duct, manhole systems, residential and commercial and electric meter installation.
73
Table of Contents
Emergency Storm Response. Our nationwide emergency storm response capabilities span both electric power transmission and distribution systems. We provide storm response services for our existing customers (“on-system”) as well as customers with which we have no ongoing MSA relationships (“off-system”). Typically with little notice, our crews deploy nationally in response to hurricanes, ice storms, tornadoes, floods and other natural disasters which damage critical electric T&D infrastructure. Some notable examples of major emergency storm response deployments in 2008 include the rebuilding of electric power distribution systems damaged by Hurricane Gustav in Louisiana, Hurricane Ike in Texas and ice storms in New England.
Cable Restoration and Assessment. In the U.S. and internationally, we offer two complementary services for the restoration and assessment of underground power cables to utilities:
| • | CableCURE® is a proprietary process for the restoration of aged underground electric power cables. Using the process, we inject silicone-based CableCURE® fluid into electrical cables at a transformer or other termination point while the lines remain energized. The fluid extends the life of electric power cables by creating a barrier to moisture and repairs and prevents damage caused by water treeing (a type of progressive failure of the insulation caused by water absorption). We perform initial testing to determine if the cable can be treated using CableCURE® technology, treat cables that we determine are good candidates and often provide replacement services for those that are not. We have a worldwide exclusive license for this technology from Dow Corning, which holds the patents on the CableCURE® fluid. The license and underlying patents expire in August 2010. We also hold a number of patents on certain of the materials associated with the treatment process. We have injected over 15,000 miles of cable to date and back the services with a 20-year warranty. |
| • | CableWISE® is a proprietary, non-destructive online electrical system-condition assessment process that enables electric power utilities and a wide range of commercial and industrial facilities to evaluate the condition of cable systems, transformers and switchgear. Knowing a cable system’s weaknesses enables owners, asset managers and reliability engineers to be proactive in finding and fixing problems before they cause outages. We hold the patent and trademark to CableWISE®. |
Natural Gas T&D Services
We provide a full spectrum of natural gas T&D services, from the maintenance and construction of large diameter transmission pipelines through the installation of residential natural gas service.
Natural Gas Transmission. We construct, maintain and upgrade steel natural gas transmission pipelines in diameters up to 42”. Our services include right-of-way clearing, trenching, transporting, welding and laying pipe, post-construction testing and restoration. We construct and maintain upstream gathering systems, including well connects and compressor stations, for our natural gas and, to a lesser extent, oil industry customers. While most of our projects have been in support of natural gas transmission, we have also constructed, maintained and upgraded pipelines for transportation of other gases and liquids. Additionally, we offer other complementary services including pipeline integrity assessments, hydrostatic testing, cathodic protection and spill remediation.
Natural Gas Distribution Pipeline. We construct, maintain and upgrade natural gas distribution pipelines. Our services include trenching, transporting, welding or fusing and laying pipe, post-construction integrity testing, site restoration and meter setting.
Specialty Services
We also provide other specialty services to customers nationwide. Electric power and natural gas T&D specialty services performed for customers are reflected in our electric power and natural gas T&D revenues, respectively. Any other specialty services performed for customers are recorded as revenue from “other services.”
| • | Utility-line Locating. Our crews locate underground electric power, gas, telecom, water, cable and sewer utilities prior to excavation. Our locating services sometimes require a physical visit to the location |
74
Table of Contents
| whereby our employees will locate and mark utility infrastructure. In other cases we are able to provide the excavating party a clearance to dig without having to physically visit the location. |
| • | Stray Voltage and Gas Leak Detection. Our crews test for stray voltage and gas leaks in areas where these problems are suspected. Stray voltage typically arises through a failure to properly ground electrical equipment and may result in injury to the public. Similarly, gas leaks often occur as a result of the deterioration of gas distribution infrastructure. |
| • | Large-Bore Horizontal Directional Drilling (HDD). We are a leading provider of HDD services nationwide with a total of five large-bore directional drills ranging from 220,000 to one million pounds of pullback force. These HDD rigs are typically deployed in support of large pipeline construction projects as well as underground crossings of environmentally sensitive areas and can be deployed on projects throughout North America. |
| • | Telecommunications. Our crews install and maintain overhead and underground telecommunications infrastructure, including conventional telephone cables, fiber optic installation cables, fiber to the premises (commonly referred to as FTTP), cellular towers, broadband-over-powerline and cable television lines. |
| • | Other. On a limited basis, we also offer certain commercial electric power, environmental remediation, water and sewer and civil construction services. |
Contractual Arrangements
We provide services under MSAs and on a project-by-project basis. MSAs are typically one to three years in duration, but can be longer. Under our MSAs, our customers generally agree to use us to provide certain services in a specified geographic region on stipulated terms and conditions, including pricing and escalation. However, most of our contracts, including MSAs and our alliance agreement with Oncor, may be terminated by our customers on short notice. Further, although our customers assign work to us under our MSAs, our customers often have no obligation to assign work to us and are not required to use us exclusively, in some cases subject to our right of first refusal. In addition, many of our contracts, including our MSAs, are opened to public bid and generally attract multiple bidders. Work performed under MSAs is typically billed on a unit-price or time-and-materials basis. In addition, any work encountered in the course of a unit-price project that does not have a defined unit is generally completed on a time-and-materials basis.
Although the terms of our contracts vary considerably, pricing is typically based on a unit-price or fixed-price structure. Under our unit-price contracts, we agree to perform identified units of work for an agreed price. A “unit” can be as small as the installation of a single bolt or a foot of cable or as large as a transmission tower or foundation. The resulting profitability of a particular unit is primarily dependent upon the labor and equipment hours expended to complete the task that comprises the unit. Under fixed-price contracts, we agree to perform the contract for a fixed fee based on our estimate of the aggregate costs of completing the particular project. We are sometimes unable to fully recover cost overruns on our fixed-price contracts. We expect that industry trends could result in an increase in the proportion of our contracts being performed on a unit-price or fixed-price basis resulting in more profitability risk.
Our storm restoration work, which involves high labor and equipment utilization, is typically performed on a time-and-materials basis and is generally more profitable when performed off-system rather than for customers with which we have MSAs. Our ability to allocate resources to storm restoration work depends on our capacity at that time and permission from existing customers to release some portion of our workforce from their projects.
Oncor alliance agreement
On June 12, 2008, we entered into a non-exclusive agreement with Oncor. Due to the extensive scope and long duration of the agreement, we refer to it as an alliance agreement. We summarize below the principal terms of the agreement. This summary is not a complete description of all the terms of the agreement, a copy of which
75
Table of Contents
is filed as an exhibit to the registration statement of which this prospectus forms a part and is available as set forth under “Where You Can Find More Information.”
Term, Renewals and Extensions. The agreement became effective on August 1, 2008 and will continue until expiration on December 31, 2018, unless extended, renewed or terminated in accordance with its terms. Oncor must notify us at least 180 days prior to the expiration of the agreement if it does not desire to renew the agreement. If Oncor fails to do so, the agreement will automatically renew for an additional twelve-month period after the expiration date under the terms and conditions in effect as of December 31, 2018.
Provision of Services, Spending Levels and Pricing. Under the agreement, it is anticipated that we will provide Oncor transmission construction and maintenance services, or TCM, and distribution construction and maintenance services, or DCM, pursuant to fixed-price, unit-price and time-and-materials structures. The fees we charge Oncor under unit-price and time-and-materials structures are set forth in the agreement, most of which are adjusted annually according to indices provided in the agreement. The agreement also includes a provision whereby Oncor receives at least as favorable pricing as we charge other customers for any “similar services” (which is not a defined term in the agreement). Management believes, based on our pricing practices and the nature and scope of the services we provide to Oncor, that we are in compliance with this provision.
The agreement includes incentives for Oncor to meet spending thresholds more than 40% greater than our 2007 revenue from Oncor. We frequently hold meetings with Oncor to discuss its forecasted monthly and annual TCM and DCM spending levels. If Oncor’s spending levels (which in agreed circumstances can include spending on other contractors or its forecasted spending on projects that we have declined) do not reach TCM and DCM biennial spending thresholds, we are entitled to a volume-based adjustment in an amount determined under the agreement. If Oncor’s forecasted annual spending levels show that spending is not projected to meet spending threshold levels, the agreement includes a mechanism to provide us additional Oncor work, subject to certain limitations. Similarly, if Oncor’s forecasted annual TCM or DCM spending levels show that spending is projected to exceed spending threshold levels and/or if the combination of forecasted and actual monthly TCM spending levels match certain agreed spending levels, Oncor is entitled to agreed incentives. Calculations based on projected spending levels are subject to subsequent adjustments based on actual spending levels.
The agreement also requires that we provide dedicated resources to Oncor and that we meet or exceed minimum service levels as measured by specified performance indicators. If we are unable to perform our obligations in a manner satisfactory to Oncor, Oncor could in some cases seek to terminate for cause or limit our activity or seek to assess penalties against us under the agreement.
Termination. Oncor may terminate the agreement upon 90-days notice or any work request thereunder without prior notice in each case in its sole discretion and may terminate the agreement upon 30-days notice in the event there is an announcement of the intent to undertake or an actual occurrence of a change in control of Oncor or InfrastruX. The consummation of this offering will not constitute a change of control of InfrastruX under the agreement. Oncor may also terminate the agreement for cause if, among other things, we breach and fail to adequately cure a representation or warranty under the agreement, we materially or repeatedly default in the performance of our material obligations under the agreement or we become insolvent.
In the event Oncor terminates the agreement for convenience or due to an anticipated or actual change of control of Oncor, Oncor must pay us a termination fee.
Competition
The end markets in which we operate are highly fragmented and competitive. In most cases we are bidding against numerous competitors for contract and project awards. Several of our competitors, particularly for large projects that require considerable resources, are large national or regional companies focused on providing services to larger utilities. Our competitors include several publicly-held companies such as Quanta Services, MYR Group, MasTec and Pike Electric and larger privately-held companies such as Henkels & McCoy, Northern Pipeline Construction, Michels Corporation and Miller Pipeline. We also frequently compete with a
76
Table of Contents
number of small, owner-operated companies that typically operate in a limited geographic area. In addition, we effectively compete with many of our utility customers that may choose to self-perform their infrastructure work. Competition from some customers has increased during the economic recession and may increase further as they seek to keep their workforce engaged during periods of reduced demand and postponed projects. In addition, some of our customers’ ability to outsource work may be limited by their relations or agreements with their unions. The current economic recession has intensified competition in our industry. Competitive factors in the end markets in which we operate include history of project execution (e.g., safety record, cost control, schedule adherence and experience), reputation and relationships with customers, geographic presence and breadth of service offerings, the availability of qualified and/or licensed personnel, strength of financial position, the ability to obtain surety bonding and price.
Backlog
Backlog represents the amount of revenue that we expect to realize from work to be performed in the future on uncompleted contracts, including new contracts on which work has not begun. Our reported backlog as of June 30, 2008 and 2009 was approximately $476.0 million and $384.0 million, respectively, which reflects only a nominal amount of work to be performed under the CREZ plan.
Our backlog estimate includes amounts under MSAs, our alliance agreement with Oncor and project-by-project bid work. We estimate the amount of work under MSAs to be disclosed as backlog based upon recurring historical trends inherent in the current MSAs, factoring in management’s expectations given seasonal demands and economic conditions and projected customer needs based upon ongoing communications with the customer. However, our MSAs rarely have minimum volume or spending obligations, and many of our contracts may be terminated on short notice, typically zero to 90 days. There can be no assurance as to our customers’ requirements or that our estimates are accurate. In addition, many of our MSAs are subject to renewal options. For purposes of calculating backlog, we have included future renewal options only to the extent we consider the renewals highly likely to occur. With respect to project-by-project bid work, we include the full amount of revenue we expect to realize in the next 12 months on the uncompleted portion of the contract in our estimate of backlog.
Trade Names, License and Patents
We operate under a number of trade names, including Bemis, B&H Maintenance & Construction, Chapman Construction, Flowers Construction, Gill Electric Services, Halpin, Hawkeye, InfrastruX Group, InfrastruX T&D Services, InterCon Construction, Lineal Industries, Premier, Skibeck Pipeline, Texas Electric Utility, Trafford Corporation and UtilX. With the exception of CableWISE®, we do not generally register our trademarks with the U.S. Patent and Trademark Office, but instead rely on state and common law protection. While we consider our trade names to be valuable assets, we do not consider any single trademark to be of such material importance that its absence would cause a material disruption to our business.
In addition, we have a worldwide exclusive license to patents that Dow Corning Corporation holds from the U.S. Patent and Trademark Office relating to our CableCURE® product. This license and the underlying U.S. patents expire in August 2010. We hold a number of U.S. and international patents, most of which relate to certain materials used in treating cables with CableCURE®. We also hold the patent and trademark to CableWISE®. Our success in the cable restoration and testing market depends in part on our ability to protect our proprietary rights relating to these products and services. If we are unable to do so, our cable restoration and testing businesses may be adversely affected.
Construction Materials
Our customers generally supply the majority of the materials necessary to carry out our contracted work. We do, however, from time to time, obtain materials for our own account from independent third-party providers. We do not manufacture any significant amount of materials for resale. We are not dependent on any one supplier for any materials that we obtain for our own account, with the exception of certain fluids and related materials in connection with our cable restoration business. We are not presently experiencing, nor do we anticipate experiencing, any difficulties in procuring an adequate amount of materials.
77
Table of Contents
Subcontractors
We directly perform the substantial majority of our work but frequently use subcontractors to perform portions of our contracts. These independent contractors are often sole proprietorships or small business entities. Independent contractors typically provide their own employees, vehicles, tools and insurance coverage. We are not dependent on any single subcontractor. Our contracts with our subcontractors hold them liable for their portion of the work or require indemnities and typically contain provisions limiting our obligation to pay the subcontractor if our client has not paid us. We often require surety bonding from our subcontractors on projects for which we supply surety bonds to our customers.
Equipment
We operate a fleet of owned and leased trucks and trailers, support vehicles and specialty construction equipment, such as backhoes, bucket trucks, excavators, trenchers, dozers, sidebooms, generators, directional drilling rigs, cranes and wire pullers and tensioners. Most of this fleet is serviced by our own mechanics who work at various maintenance sites and facilities. We believe that these vehicles generally are well-maintained and adequate for present operations. We seek to maintain high utilization of our equipment fleet by moving our fleet within regions as necessary to accommodate demand.
We own a majority of the units in our fleet and anticipate that we will in the future. However, in connection with entering into our alliance agreement with Oncor, we increased the number of leased units in our fleet to appropriately accommodate the anticipated levels of business under that agreement and may need do so in the future. Our current credit facilities limit our capital expenditure capacity to $40 million and $45 million in 2009 and 2010, respectively. Owned equipment is pledged as collateral under our credit facilities and, in certain instances, under our surety general agreement of indemnity.
Workforce
At June 30, 2009, we employed approximately 4,400 persons, of which approximately 19% were union members.
Particularly with respect to general laborers, our number of full-time employees fluctuates depending upon the number and size of the projects and contracts undertaken by us at a given time. We have contracts with numerous unions including the National Electrical Contractors Association, or NECA, and the International Brotherhood of Electrical Workers, or IBEW, among others. Our union contracts expire (after giving effect to “evergreen” provisions that automatically extend most of the agreements absent termination by either party) at various dates from 2009 to 2012. We periodically renegotiate our union agreements, which have varying terms, ranging from one to six years, and corresponding expiration dates. Further, our union agreements generally require us to make contributions to multi-employer pension plans. We believe that our relationships with our employees and union representatives are good.
Properties
Our headquarters are located in Seattle, Washington, and we maintain regional centers in the Southwest, Midwest and East. As of December 31, 2008, we owned three facilities and leased 70 properties. We also rent space on a temporary basis when our projects create the need. We have pledged our owned properties as collateral under our credit facilities. Most of our properties are used as offices or for fleet operations. We believe that our facilities are adequate for our current operations.
Safety Measures and Quality Assurance
Performance of our services requires the use of heavy equipment and exposure to potentially dangerous conditions. We are committed to a policy of operating safely and prudently and our safety record generally reflects
78
Table of Contents
this focus. We require that employees complete the prescribed training program of the operating unit for which they work and/or those required by NECA, IBEW and/or U.S. Department of Transportation Office of Pipeline Safety, where relevant, prior to performing more sophisticated and technical jobs. Each operating unit requires additional training, depending upon the sophistication and technical requirements of each particular job. In addition, certain of our employees maintain U.S. Department of Transportation Commercial Drivers Licenses and Operator Qualifications as required by their job functions. The OSHA safety metric performance of most of our operating units has historically been better than the industry rate, with certain operating units showing worse performance in 2008 than their historical averages. As is common in our industry, we have regularly been and will continue to be subject to claims by employees, customers and third parties for property damage and personal injuries. Moreover, safety is critical to the cost of our self-insurance program. See “Risk Factors.”
Governmental Regulations
Our operations are subject to various federal, state and local laws and regulations including:
| • | state-by-state licensing requirements applicable to electricians and engineers; |
| • | building and electrical codes; |
| • | U.S. Department of Transportation rules and regulations; |
| • | permitting and inspection requirements applicable to construction projects; |
| • | regulations relating to worker safety and environmental protection; |
| • | pipeline safety laws and federal regulations; |
| • | telecommunications licensing requirements; and |
| • | special bidding and procurement requirements on government projects. |
Many state and local regulations governing electrical and gas construction require permits and licenses to be held by individuals who have passed an examination or met other requirements. We believe we are in material compliance with applicable regulatory requirements and have all material licenses required to conduct our operations. Our failure to comply with applicable regulations could result in substantial fines or revocation of our operating licenses. The industries we serve are also affected by various federal, state and local laws and regulations, including the Energy Act of 2005, ARRA, the Pipeline Safety Improvement Act of 2002, the Pipeline Integrity, Protection, Enforcement and Safety Act of 2006 and alternative energy initiatives.
Environmental Matters
We are subject to numerous federal, state and local environmental laws and regulations governing our operations, including the handling, transportation, remediation and disposal of nonhazardous and hazardous substances and wastes, as well as emissions and discharges into the environment, including discharges to air, surface water and groundwater and soil. We also are subject to laws and regulations that impose liability and cleanup responsibility for releases of hazardous substances into the environment. Under certain of these laws and regulations, such liabilities can be imposed for cleanup of previously owned or operated properties, or properties to which substances or wastes were sent by current or former operations at our facilities, regardless of whether we directly caused the contamination or violated any law at the time of discharge or disposal. The presence of contamination from such substances or wastes could interfere with ongoing operations, adversely affect our ability to sell or lease our properties, or to use them as collateral for financing. In addition, we could be held liable for significant penalties and damages under environmental laws and could also be subject to a revocation of licenses or permits, which could materially and adversely affect our business and results of operations. We do not believe that any of our known environmental obligations will materially affect our results of operations or financial condition; however, environmental obligations are uncertain and material liabilities could arise in the future.
79
Table of Contents
In the normal course of business, we have incurred and are incurring costs and obligations for correcting environmental noncompliance matters and for remediation at or relating to certain of our properties. We believe we have complied with, or are currently complying with, our environmental obligations to date in all material respects. For a number of these matters, we have obtained indemnification or covenants from third parties (including predecessors or lessors) for such cleanup and other obligations and liabilities that we believe are adequate to cover such obligations and liabilities. However, such third-party indemnities or covenants may not cover all our costs, and such unanticipated obligations or liabilities, or future obligations and liabilities may have a material adverse effect on our business operations or financial condition. Further, we cannot be certain that we will be able to identify or be indemnified for all potential environmental liabilities relating to any acquired business.
Risk Management and Insurance
We are committed to ensuring that our employees perform their work safely. We regularly communicate with our employees to promote safety and to instill safe work habits. We have agreements to insure us for workers’ compensation, employer’s liability and general liability, subject to a deductible of $750,000 per occurrence. We are also insured for auto liability claims, subject to a deductible of $500,000 per occurrence. Because of these deductibles and the cost of insurance, we have a direct incentive to minimize claims. The nature and frequency of employee claims directly affects our operating performance. Because of the physical and sometimes dangerous nature of our business, we maintain substantial loss accruals for workers’ compensation and other claims. The accruals are based upon known facts and historical trends and management believes our accruals are adequate. In addition, some of our customer contracts require us to maintain specific insurance coverage. Our insurers sometimes require us to maintain letters of credit to support our deductible payment obligations, and the required support level can vary from year to year. We are also self-insured under our largest non-union health care benefit program to the extent of $250,000 per occurrence.
Legal Proceedings
From time to time, we are a party to various lawsuits, claims and other legal proceedings that arise in the ordinary course of our business. These actions typically seek, among other things, compensation for alleged personal injury, breach of contract, property damage, punitive damages, civil penalties or other losses, or injunctive or declaratory relief. With respect to such lawsuits, claims and proceedings, we accrue reserves when it is probable a liability has been incurred and the amount of loss can be reasonably estimated. We do not believe any of these proceedings, individually or in the aggregate, would be expected to have a material adverse effect on our results of operations, or of cash flows, or on our financial condition.
Pursuant to our service contracts, we also generally indemnify our customers for damages arising from the services we provide thereunder. Furthermore, because our services are integral to the operation and performance of the electric power T&D infrastructure, we may become subject to lawsuits or claims for any failure of the systems on which we work, even if our services are not the cause for such failures. We could be subject to civil and criminal liabilities to the extent that our services contributed to any property damage or blackout. The outcome of these proceedings could result in significant costs and diversion of management’s attention to our business. Payments of significant amounts, even if reserved, could adversely affect our reputation and liquidity position.
80
Table of Contents
Executive Officers and Directors
The following table sets forth the names and ages of the Company’s executive officers and directors. The descriptions below include each such person’s service as a board member of the Company and its predecessors.
| Name |
Age | Position | ||
| Michael T. Lennon |
47 | President and Chief Executive Officer, Director | ||
| Richard Schwartz |
46 | Chief Operating Officer | ||
| Lanny H. Michael |
57 | Chief Financial Officer | ||
| Craig S. Eudy |
44 | Chief Accounting Officer | ||
| Douglas Madison |
60 | Senior Vice President of Finance | ||
| Stanley B. Klimberg |
64 | Senior Vice President and General Counsel | ||
| John Higgins |
43 | Senior Vice President, Operations | ||
| Paul G. Smith |
52 | Director, Chairman of the Board of Directors | ||
| Michael Lebens |
57 | Director | ||
| Alan B. Levande |
53 | Director | ||
| Daniel E. Lonergan |
53 | Director |
Michael T. Lennon
Mr. Lennon has been our Chief Executive Officer since April 2003 and has been President and a member of our board of directors since May 2002. Prior to joining the Company, Mr. Lennon served as Managing Director of Lennon Smith Advisors, LLC, an investment banking firm, where he provided financial and strategic advice to a number of customers, including the Company since its inception. Mr. Lennon also served in various other operating and investment banking roles during the previous 13 years of his career. Mr. Lennon received a B.B.A. from the University of Notre Dame and an M.B.A. from Babson College.
Richard Schwartz
Mr. Schwartz has been our Chief Operating Officer since June 2003. Mr. Schwartz joined the Company in April 2002 as Vice President, Operations. Prior to joining the Company, Mr. Schwartz served as Vice President of Business Development for Avista Advantage, an energy services subsidiary of Avista Corporation. Mr. Schwartz also served as the Senior Vice President and Chief Operating Officer, North America, for Cambridge Technology Partners, a publicly-held technology consulting firm. Mr. Schwartz also held senior operating and technology positions at Excell Data Corporation and Digital Equipment Corporation before joining Cambridge Technology Partners in 1998. Mr. Schwartz received a B.S. from the University of California at Davis and an M.B.A. from the University of San Francisco.
Lanny H. Michael
Mr. Michael joined the Company as our Chief Financial Officer in May 2009. Prior to joining the Company, Mr. Michael served as Senior Vice President and Chief Financial Officer of Intermec, Inc., a publicly-held mobile device technology company, which he joined in September 2006. From 2004 to 2006, Mr. Michael served as a business consultant and advisor to various private firms, and from 2000 to February 2004 he served as Executive Vice President and Chief Financial Officer of Airborne, Inc., a then publicly-held air express and airfreight company, which he joined in 1981. Mr. Michael is a certified public accountant (inactive), holds a B.S. in business administration from the University of Montana and has completed the Financial Management Program at Stanford University’s Graduate School of Business.
81
Table of Contents
Craig S. Eudy
Mr. Eudy joined the Company as our Chief Accounting Officer in June 2009. Prior to joining the Company, Mr. Eudy served as Vice President and Corporate Controller of Sonus Pharmaceuticals, Inc., a publicly-held life sciences company, which he joined in January 2002. From 1994 to 2002, Mr. Eudy served in financial management roles at Mackie Designs, Inc., a publicly-held manufacturer of professional audio equipment, and ATL Ultrasound, Inc., a publicly-held developer and manufacturer of ultrasound-based technology. Mr. Eudy began his professional career at Ernst & Young LLP in 1991. Mr. Eudy is a certified public accountant and holds a B.B.A. in management and M.S. in accounting from Western Michigan University.
Douglas Madison
Mr. Madison has been our Senior Vice President of Finance since May 2009. Prior to assuming his current position, Mr. Madison served as our Chief Financial Officer since November 2000. Before joining the Company, Mr. Madison served as Chief Executive Officer of Hostar International, a private hotel equipment manufacturer that he helped launch in 1989. Between 1983 and 1989 Mr. Madison also served as Vice President of Finance for Durbin Corporation, a holding company with commercial real estate assets and operating companies in the heavy truck and construction equipment industries. Mr. Madison is a certified public accountant and holds a B.A. from the University of Washington and a B.S. in Accounting from Central Washington University.
Stanley B. Klimberg
Mr. Klimberg joined Hawkeye as Executive Vice President and General Counsel in April 2007 and became our Senior Vice President and General Counsel in July 2009. From September 1995 until he joined Hawkeye, Mr. Klimberg served as General Counsel of the Long Island Power Authority, a public power authority providing electricity to over one million electric customers on Long Island, New York. Mr. Klimberg joined the Authority in March 1987 as its General Counsel and served in that and other senior executive positions until being appointed again as General Counsel in September 1995. Before joining the Authority, Mr. Klimberg served as General Counsel of the New York State Energy Office and, prior to that, as Assistant General Counsel of the New York State Public Service Commission. Mr. Klimberg received a B.A. from Lehigh University and a J.D. from New York University School of Law.
John Higgins
Mr. Higgins joined the Company as Vice President, Operations, in January 2003 and was promoted to Senior Vice President in October 2008. Prior to joining the Company, Mr. Higgins held a number of operating positions including Vice President, Finance and Acquisitions, for ImageX, a publicly-held internet printing services business; International Business Manager for Simpson Investment Company, a privately-held timber and paper business; and officer in the U.S. Army Corps of Engineers. Mr. Higgins holds a B.S. from the U.S. Military Academy and an M.B.A. from Harvard Business School.
Paul G. Smith
Mr. Smith has served as a Director and the Chairman of the Board since May 2006. Mr. Smith is a co-founder and currently Chief Executive Officer and a Senior Managing Director of TCM and Chief Executive Officer and Managing Director of the Acquisitions Group of Tenaska, Inc., both of which are affiliates of the Company. Mr. Smith has been with Tenaska, Inc. and its affiliates for 19 years, serving in various capacities, including Executive Vice President and Managing Director of TCM from April 2003 until June of 2008 and CEO and Managing Director of the Acquisitions Group since January 2003. Prior to joining Tenaska, Inc., Mr. Smith held positions related to energy engineering and facilities operations, and natural gas production, acquisitions, storage and marketing with InterNorth, Inc. Mr. Smith holds a B.S. in mechanical engineering from Iowa State University and an M.B.A. from the University of Nebraska.
Michael C. Lebens
Mr. Lebens has served as a Director since May 2006. Mr. Lebens is President and Chief Executive Officer of the Engineering and Operations Group of Tenaska, Inc., an affiliate of the Company. Prior to assuming his
82
Table of Contents
current position in March 2008, Mr. Lebens served as Executive Vice President of Engineering, Construction and Operations of Tenaska, Inc. Before joining Tenaska in 1987, Inc., Mr. Lebens held positions with InterNorth, Inc., Gibbs and Hill and Burns and McDonnell. Mr. Lebens holds a B.S. and an M.S. in mechanical engineering from the University of Nebraska.
Alan B. Levande
Mr. Levande has served as a Director since May 2006. Mr. Levande is a co-founder and currently a Senior Managing Director of TCM, a position he has held since 2008. Prior to serving as a Senior Managing Director, Mr. Levande served as a Managing Director from June 2003 to March 2008. Before co-founding TCM, Mr. Levande was a senior investment banker at Goldman Sachs and Salomon Brothers. Mr. Levande holds a B.S. in accounting and an M.B.A. in finance from the University of Pennsylvania’s Wharton School.
Daniel E. Lonergan
Mr. Lonergan has served as a Director since May 2006. Mr. Lonergan is a co-founder and currently a Senior Managing Director of TCM, a position he has held since March 2008. Prior to servicing as a Senior Managing Director, Mr. Lonergan served as a Managing Director from June 2003 to March 2008. Mr. Lonergan joined Tenaska, Inc. in 1997 as a Vice President of its Finance Group. Prior to joining Tenaska, Inc., Mr. Lonergan served in a variety of executive positions in the energy industry with MidAmerican Energy Company and Iowa-Illinois Gas and Electric. Mr. Lonergan holds a B.A. in political science and an M.B.A. from the University of Iowa.
Board of Directors
Our business and affairs are managed under the direction of our board of directors. The board is currently composed of five directors, none of whom are “independent directors” under the applicable rules of the NYSE.
Status as a “Controlled Company”
At an initial public offering price of $ per share, TPF will beneficially own more than 50% of the outstanding shares of our common stock, and we will be a “controlled company” under the rules of the NYSE. If we are a controlled company, we will be exempt from certain independence requirements with respect to the composition of our board and committees of the board, including the requirements that a majority of the board of directors be comprised of independent directors and that the compensation committee and the nominating and corporate governance committee be comprised solely of independent directors. Accordingly, if we are a controlled company, pursuant to that exemption, a majority of our board of directors will not be comprised of independent directors, and our compensation committee and nominating and corporate governance committee will include directors who are not independent.
Board Committees
Our board of directors has the authority to appoint committees to perform certain management and administration functions.
Audit Committee
Upon the consummation of this offering, we will have an audit committee that has responsibility for, among other things:
| • | overseeing management’s maintenance of the reliability and integrity of our accounting policies and financial reporting and our disclosure practices; |
| • | overseeing management’s establishment and maintenance of processes to assure that an adequate system of internal control is functioning; |
| • | reviewing our annual and quarterly financial statements prior to their filing and prior to the release of earnings; and |
83
Table of Contents
| • | appointing and evaluating the independent accountants and considering and approving any non-audit services proposed to be performed by the independent accountants. |
, and serve on the audit committee, with serving as the committee’s chair and “financial expert,” as that term is defined by the applicable SEC and NYSE rules. We will appoint a new independent member to our audit committee by to replace so that all of our audit committee members will be independent as such term is defined under applicable SEC and NYSE rules. The audit committee will have the power to investigate any matter brought to its attention within the scope of its duties and to retain counsel for this purpose where appropriate.
Compensation Committee
Upon the consummation of this offering, we will have a compensation committee that has responsibility for, among other things:
| • | reviewing key employee compensation policies, plans and programs; |
| • | monitoring performance and compensation of our employee-directors, officers and other key employees; |
| • | preparing recommendations and periodic reports to the board of directors concerning these matters; and |
| • | administering the incentive program referred to under “Compensation Discussion and Analysis” below. |
, and serve on the compensation committee, with serving as the chair of the compensation committee. Unless we are a “controlled company” as discussed above, as permitted under applicable NYSE listing standards, our compensation committee will include one independent director, , upon the closing of this offering, will include a majority of independent directors within 90 days after the closing of this offering and will be comprised entirely of independent directors within one year after the closing of this offering.
Nominating and Corporate Governance Committee
Upon the consummation of this offering, we will have a nominating and corporate governance committee that has responsibility for, among other things:
| • | recommending persons to be selected by the board as nominees for election as directors and to fill any vacancies on the board; |
| • | considering and recommending to the board qualifications for the position of director and policies concerning the term of office of directors and the composition of the board; and |
| • | considering and recommending to the board other actions relating to corporate governance. |
, and serve on the nominating and corporate governance committee, with serving as the chair of the nominating and corporate governance committee. Unless we are a “controlled company” as discussed above, as permitted under applicable NYSE listing standards, our nominating and corporate governance committee will include one independent director, , upon the closing of this offering, will include a majority of independent directors within 90 days after the closing of this offering and will be comprised entirely of independent directors within one year after the closing of this offering.
Compensation Committee Interlocks and Insider Participation
None of the members expected to serve on our compensation committee is one of our officers or employees. No member of our board of directors and no member expected to serve on our compensation committee serves as a member of the board of directors or compensation committee of any entity that has one or more executive officers serving as a member of our board of directors.
Indemnification of Directors and Executive Officers and Limitations on Liability
For information concerning limitations of liability and indemnification applicable to our directors, executive officers and, in certain circumstances, employees, see “Description of Capital Stock” located elsewhere in this prospectus.
84
Table of Contents
COMPENSATION DISCUSSION AND ANALYSIS
Philosophy and Overview of Compensation
Our executive compensation philosophy is to provide compensation opportunities that:
| • | Provide salary and bonus compensation at levels which we deem appropriate to attract and retain talented executives. |
| • | Align the earnings opportunities and interests of management with those of shareholders through equity compensation. |
| • | Retain and motivate executives in order to maximize shareholder value. |
Our executive compensation program includes fixed and variable compensation as well as employee benefits. We provide the following compensation elements to our “named executive officers” or “NEOs”:
| Compensation Element |
Purpose |
Description | ||
| Base Salary | Fixed component of pay that fairly compensates the individual based upon level of responsibilities. | Fixed cash payments | ||
| Annual Bonus | Align compensation with our performance from year to year. | Variable annual cash award | ||
| Long-Term Incentives | Reward for creating long-term shareholder value and provide alignment with shareholders | Instruments of equity including stock appreciation rights and restricted stock units, as well as long-term bonus potential | ||
| Benefits | Retirement, health and other benefits that provide comprehensive long-term financial security to enable us to maintain a healthy and productive workforce and attract and retain employees. | 401(k) plan with matching contributions, health, life, and disability insurance as well as certain perquisites | ||
We have entered into employment agreements with Messrs. Lennon, Schwartz and Madison and a compensation and severance agreement with Mr. Higgins. These individuals are our NEOs as of December 31, 2008. Messrs. Lennon, Schwartz and Madison’s agreements were negotiated with TPF and entered into at the time of the TPF Acquisition. Mr. Higgins’ agreement was also entered into in 2006 but not in connection with the TPF Acquisition. These employment agreements establish each of the NEO’s entitlements to base salary, bonus opportunities and severance. In addition, Messrs. Lennon, Schwartz and Madison’s agreements require set equity compensation grants. These employment agreements are described in more detail below under the heading “—Employment Arrangements”.
Role of Compensation Consultants and Other Individuals in Setting Compensation.
In connection with the granting of the long-term bonus and equity based awards described below, we consulted with an outside compensation consultant, Compensation Strategies. Otherwise, we did not rely upon a compensation consultant when setting compensation for our named executive officers for 2008. Rather our board of directors made all compensation decisions with respect to our NEOs for 2008 in its sole discretion subject to the terms of the employment agreements. Mr. Lennon, however, did provide input and recommendations on the compensation for executives.
The following briefly describes each element of our executive compensation program:
Base Salary
Base salaries are reviewed annually and are adjusted as determined in the discretion of the board of directors or as may be required under an executive’s employment agreement. Factors that are taken into account to
85
Table of Contents
increase or decrease compensation include significant changes in individual job responsibilities, market forces and/or our performance.
Annual Bonuses
Each year our named executive officers are eligible to earn a bonus based on our performance.
Bonuses for 2008 performance were based on achievement of earnings before interest, taxes, depreciation and amortization, adjusted to eliminate the TPF management fee, bank fees and certain other non-recurring items into account (Adjusted EBITDA). Bonuses generally are determined based on a bonus pool, which for 2008 was determined according to the following formula:
| Adjusted EBITDA (in millions) |
$ | 75.0 | $ | 77.5 | $ | 80.0 | $ | 82.5 | $ | 85.0 | $ | 87.5 | $ | 90.0 | $ | 92.5 | $ | 95.0 | $ | 97.5 | ||||||||||
| Bonus Pool |
$ | 1.1 | $ | 1.5 | $ | 2.0 | $ | 2.5 | $ | 3.0 | $ | 3.4 | $ | 3.7 | $ | 4.1 | $ | 4.4 | $ | 4.8 |
Each NEO’s bonus as a percentage of the bonus pool was as follows:
| Bonus Pool Percentage | ||
| Michael T. Lennon |
35% | |
| Richard Schwartz |
23% | |
| Douglas Madison |
9% | |
| John Higgins |
9.5% |
Each NEO’s bonus as a percentage of the bonus pool was set approximately to correspond to achieving a target bonus as a percentage of the NEO’s salary if Adjusted EBITDA performance was at plan. The target annual bonuses for Messrs. Lennon, Schwartz and Higgins are specified in their employment agreements as 50% of base salary. Mr. Madison’s 2008 target annual bonus was set by our board of directors at 40% of his base salary. Accordingly, if the Adjusted EBITDA at plan was achieved, the amount of the bonus pool multiplied by the NEO’s bonus pool percentage would approximately equal the NEO’s target bonus as a percentage of his salary.
Our Adjusted EBITDA for 2008 was $95.2 million against plan of $74.1 million. However, it was determined by the board of directors with input from Mr. Lennon that this level of bonus pool would result in 2008 bonuses that were too high, based on their view of general overall performance levels. Accordingly, the bonus pool was adjusted downward to approximately $4 million, which corresponded to an Adjusted EBITDA achievement of $92 million. Notwithstanding this adjustment to the size of the aggregate bonus pool, our board of directors determined that the annual bonuses should reflect the company’s high Adjusted EBITDA performance against plan. Accordingly, our board of directors did not apply the bonus pool percentages mechanically, but adjusted the final bonus amounts in a manner that they believed to be fair and properly reward high performers. As a result, the bonuses reported on the Summary Compensation Table, in the column “Non-equity Incentive Plan Compensation”, were not purely formulaic, but reflect the discretion of the board of directors.
We have used this type of bonus pool calculation and allocation for several years and such methodology was set under our previous owners. We use Adjusted EBITDA as the only quantitative performance measure, as we believe that for a private company it is the most relevant indication of increases in our value year over year.
We have not maintained any policy on the adjustment or recovery of awards or payments if the relevant performance measures upon which such awards or payments are based are restated or otherwise adjusted in a manner that would reduce the size of an award or payment.
Equity Compensation
In 2008, we granted stock appreciation rights (SARs) and restricted stock units (RSUs) to our NEOs.
86
Table of Contents
The SARs and RSUs were designed to align the interests of management with those of TPF while also providing competitive long-term incentives. The terms of their employment agreements provide that Messrs. Lennon, Schwartz and Madison would receive grants of equity compensation equal to 1.8%, 1.2% and 0.4%, respectively, of our fully diluted equity at the time of the TPF Acquisition in the form of SARs and RSUs upon terms to be determined by the board of directors. In 2008 we made grants under our equity incentive plan that satisfied those obligations, as well as grants to other senior management, including Mr. Higgins. Mr. Higgins’ award in 2008 equaled 0.4% of our fully diluted equity at the time of the TPF Acquisition.
The SARs were 90% of an executive’s award, and the RSUs were 10%. SARs encourage management to increase our value, while RSUs are intended to provide some long-term compensation regardless of value increase. The structure of the SARs and RSUs, including the allocation of an executive’s award between SARs and RSUs, was developed with the input from Compensation Strategies and TPF taking into consideration the tax impact of the grants and the timing of delivery of shares while we were a private company. In particular, we did not want the executives to have taxable income at a time when they did not have sufficient liquidity in the shares to pay the taxes.
All SARs were granted at a base price of $3.53 per share. For Messrs. Lennon, Madison and Higgins, this represented the market value of our shares at the time of grant in January 2008, as determined by our board of directors. Mr. Schwartz’s SAR grant, however, was made in December, 2008, when based on a third party appraisal of our shares our board of directors had determined that the market value of our shares was $3.43 per share. However, for consistency among our NEOs, Mr. Schwartz’s SAR grant was made at the same base price as other NEOs, and has the same vesting terms and dates as the other NEOs.
Each SAR granted to our NEOs has the following characteristics:
| • | It gives the holder the right to receive, in shares of our common stock, the difference between $3.53 and the fair market value of a share of our common stock on the date of exercise; |
| • | It may be exercised only if vested. Twenty percent of the SAR was immediately vested on grant, with the remainder vesting over four years beginning on May 8, 2008 and on each anniversary thereafter, with full vesting on May 8, 2011. Accordingly, because of the delay in Mr. Schwartz’s grant date, his SAR was 40% vested upon grant in December 2008; |
| • | Fully vests upon a change in control, or if the cumulative proceeds to TPF upon an exit event, including an initial public offering, equal or exceed 2 times its investment if such exit event is prior to May 8, 2010; |
| • | May be exercised only after a termination of service, an initial public offering, change in control, recapitalization or other events upon which TPF liquidates its investment; and |
| • | Expires ten years after the date of grant. |
Each RSU granted to our NEOs has the following characteristics:
| • | Each RSU gives the holder the right to receive a share of our common stock on the earlier of a change in control, or six months and one day following the holder’s termination of service; |
| • | It is forfeitable until vested. Twenty percent of the RSU was immediately vested on grant, with the remainder vesting over four years beginning on May 8, 2008 and on each anniversary thereafter, with full vesting on May 8, 2011. Accordingly, because of the delay in Mr. Schwartz’s grant date, his SAR was 40% vested upon grant in December 2008; and |
| • | Fully vests upon a change in control, or if the cumulative proceeds to TPF upon an exit event, including an initial public offering, equal or exceed 2 times its investment if such exit event is prior to May 8, 2010. |
The partial vesting at grant and vesting in 2008 for the SARs and RSUs reflects that such grants were promised in 2006, but were not approved by our board of directors until 2008. Accordingly, executives were given at grant the vesting they would have had if the grants had been timely made in 2006.
87
Table of Contents
Long-Term Bonuses
Our value increased between the time Messrs. Lennon, Schwartz and Madison entered into their employment agreements in 2006 and the date we made the grants in 2008. As a result of this delay, the executives with SARs missed out on this increase in our value. Due to adverse tax treatment to the executives and accounting treatment to us, we could not grant the SARs with a base price less than current market value of the shares to make up for this missed value. Instead, we entered into long term incentive bonus agreements with our NEOs, with the intent to replace the value missed due to the delay in the SAR grants. The long term incentive bonus agreements are structured so as to avoid adverse tax consequences to the executives. The long term bonus vests and becomes payable provided the executive remains in our service through the earlier of:
| • | May 8, 2011; |
| • | a change in control; |
| • | an initial public offering; or |
| • | if the cumulative proceeds to TPF upon an exit event, not including an initial public offering, equal or exceeds 2 times its investment if such exit event occurs prior to May 8, 2010. |
The amount of each NEO’s long-term bonus equals the difference between the value of our common stock in 2008 when we granted the SARs and the value in May 2006 when the SARs were promised, multiplied by the number of SARs the executive was awarded. The named executive officers will vest in and be paid the following long term bonuses if they remain employed through the consummation of this offering:
| Long-Term Bonus Award | |||
| Michael T. Lennon |
$ | 171,000 | |
| Richard Schwartz |
$ | 108,000 | |
| Douglas Madison |
$ | 40,000 | |
| John Higgins |
$ | 40,000 | |
Benefits and Perquisites
Some of our NEOs are eligible for a special executive health plan. Otherwise they receive the benefits that are available to all of our employees, including a 401(k) plan with matching contributions, group health, life, accident and disability insurance.
SUMMARY COMPENSATION TABLE
The following table sets forth the compensation of our named executive officers, who are our Principal Executive Officer, Principal Financial Officer and the two most highly compensated executive officers for our fiscal year ending December 31, 2008.
| Name and Principal Position |
Year | Salary | Stock Awards(1) |
SAR Awards(2) |
Non-equity Incentive Plan Compensation |
All other Compensation(3) |
Total | |||||||||||||
| Michael T. Lennon President, and Chief Executive Officer (Principal Executive Officer) |
2008 | $ | 450,000 | $ | 135,243 | $ | 589,611 | $ | 1,500,000 | $ | 2,167 | $ | 2,677,021 | |||||||
| Richard Schwartz Chief Operating Officer |
2008 | $ | 334,374 | $ | 65,610 | $ | 324,771 | $ | 978,650 | $ | 11,554 | $ | 1,714,959 | |||||||
| Douglas Madison Chief Financial Officer (Principal Financial Officer)(4) |
2008 | $ | 176,800 | $ | 31,557 | $ | 137,567 | $ | 375,000 | $ | 10,708 | $ | 731,630 | |||||||
| John Higgins Senior Vice President, Operations |
2008 | $ | 200,000 | $ | 31,557 | $ | 137,567 | $ | 404,225 | $ | 8,104 | $ | 781,453 | |||||||
88
Table of Contents
| (1) | Represents the aggregate expense recognized for financial statement reporting purposes for the year ending December 31, 2008, disregarding the purposes of forfeitures related to vesting conditions, in accordance with the Financial Accounting Standards Board’s Statement of Financial Accounting Standards No. 123(R), Share-Based Payment (SFAS 123(R)) for grants of RSUs made in 2008 under our equity incentive plan. The assumptions we used for calculating the grant date fair values are set forth in Note 13 to our audited consolidated financial statements included in this prospectus. |
| (2) | Represents the aggregate expense recognized for financial statement reporting purposes for the year ending December 31, 2008, disregarding the purposes of forfeitures related to vesting conditions, in accordance with SFAS 123(R) for grants of SARs under our equity incentive plan. The assumptions we used for calculating the grant date fair values are set forth in Note 13 to our audited consolidated financial statements included in this prospectus. |
| (3) | Represents matching contributions under our 401(k) plan which has a matching contribution of 50% on each dollar the participant contributes up to 6% of compensation. Messrs. Madison, Schwartz and Higgins also received benefits under the executive health program. |
| (4) | Mr. Madison served as our Chief Financial Officer through May 2009. He continues to serve as our Vice President of Finance. |
GRANTS OF PLAN-BASED AWARDS IN FISCAL YEAR 2008
| Name |
Grant Date |
Estimated Future Payouts Under Non-Equity Incentive Plan Awards |
All Other Stock Awards: Number of Shares of Stock or Units |
All Other SAR Awards: Number of Securities Underlying SARs |
Exercise or Base Price of SAR Awards ($/Sh)(1) |
Grant Date Fair Value of SAR and RSU Awards(2) | |||||||||||||||
| Threshold | Target | Maximum | |||||||||||||||||||
| Michael T. Lennon |
$ | 90,000 | $ | 225,000 | $ | 360,000 | |||||||||||||||
| 1/17/08 | 75,000 | 675,000 | $ | 3.53 | $ | 1,418,963 | |||||||||||||||
| Richard Schwartz |
$ | 66,875 | $ | 167,187 | $ | 334,374 | |||||||||||||||
| 12/23/08 | 46,000 | 434,000 | $ | 3.53 | $ | 938,792 | |||||||||||||||
| Douglas Madison |
$ | — | $ | 70,720 | $ | — | |||||||||||||||
| 1/17/08 | 17,500 | 157,500 | $ | 3.53 | $ | 331,091 | |||||||||||||||
| John Higgins |
$ | — | $ | 100,000 | $ | — | |||||||||||||||
| 1/17/08 | 17,500 | 157,500 | $ | 3.53 | $ | 331,091 | |||||||||||||||
| (1) | Exercise price of the SARs is equal to or greater than the fair market value of our common stock as determined by our board of directors on the date of grant as determined by our board of directors. |
| (2) | Represents SFAS 123(R) grant date fair value, excluding forfeitures, based on the assumptions set forth in Note 13 to our audited consolidated financial statements included elsewhere in this prospectus. |
See “—Annual Bonuses” above for complete description of the targets for payment of annual incentives, as well as performance criteria on which such payments were based. See “—Equity Compensation” above for a description of the SAR and RSU grants.
89
Table of Contents
OUTSTANDING EQUITY AWARDS AS OF DECEMBER 31, 2008
| SAR Awards(1) | Stock Awards(2) | |||||||||||||
| Name |
Number of Securities Underlying Unexercised SARs (Exercisable) |
Number of Securities Underlying Unexercised SARs (Unexercisable) |
SAR Base Price |
SAR Expiration Date |
Number of RSUs that Have Not Vested |
Market Value of RSUs that Have Not Vested(3) | ||||||||
| Michael T. Lennon |
270,000 | 405,000 | $ | 3.53 | 1/17/2018 | 45,000 | $ | 154,350 | ||||||
| Richard Schwartz |
173,600 | 260,400 | $ | 3.53 | 12/23/2018 | 27,600 | $ | 94,668 | ||||||
| Douglas Madison |
63,000 | 94,500 | $ | 3.53 | 1/17/2018 | 10,500 | $ | 36,015 | ||||||
| John Higgins |
63,000 | 94,500 | $ | 3.53 | 1/17/2018 | 10,500 | $ | 36,015 | ||||||
| (1) | All SARs vest 20% on each anniversary of May 8, with full vesting on May 8, 2011; SARs fully vest upon a change in control, or if the cumulative proceeds to TPF upon an exit event, including an initial public offering equal or exceed 2 times TPF’s investment if such exit event occurs prior to May 8, 2010. |
| (2) | All RSUs vest 20% on each anniversary of May 8, with full vesting on May 8, 2011, RSUs also fully vest upon a change in control, or if the cumulative proceeds to TPF upon an exit event, including an initial public offering equal or exceed 2 times TPF’s investment if such exit event occurs prior to May 8, 2010. Shares underlying vested RSUs are not deliverable to the NEO under the terms of the RSU until a change in control or six months and one day following termination of employment. Accordingly, shares subject to RSUs which are vested but deferred until later delivery are reflected in the Nonqualified Deferred Compensation table below. |
| (3) | Based on $3.43 per share, which is the value assigned to our common stock by our board of directors as of December 2008, based on an independent third party appraisal. |
SAR EXERCISES AND STOCK VESTED DURING 2008
The following table provides information on RSU vesting in fiscal 2008. No SARs were exercised in fiscal 2008.
| Stock Awards | |||||
| Name |
No. of RSUs Acquired on Vesting(1) |
Value Realized Upon Vesting(2) | |||
| Michael T. Lennon |
30,000 | $ | 105,900 | ||
| Richard Schwartz |
18,400 | $ | 63,112 | ||
| Douglas Madison |
7,000 | $ | 24,710 | ||
| John Higgins |
7,000 | $ | 24,710 | ||
| (1) | Shares underlying RSUs which vested in 2008 are not deliverable to the NEO under the terms of the RSU until the earlier of six months and one day following termination of employment or a change in control. The value of vested RSUs are also reflected in the Nonqualified Deferred Compensation table below. |
| (2) | As no shares were delivered upon vesting of the RSUs, the NEOs received no actual value at the time of vesting. Shares underlying vested RSUs are not deliverable to the NEO under the terms of the RSU until a change in control or six months and one day following termination of employment. The amounts set forth in this column for Messrs. Lennon, Madison and Higgins is based on a share price of $3.53 per share, which is the value determined by our board of directors for our common stock in January 2008. The amount set forth for Mr. Schwartz is based on a share price of $3.43 per share, which is the value determined by our board of directors for our common stock in December 2008, when Mr. Schwartz’s RSUs were granted and vested, based on an independent third party valuation. |
90
Table of Contents
NON-QUALIFIED DEFERRED COMPENSATION IN 2008
| Name |
Executive Contributions in Last Fiscal Year |
Registrant Contributions in Last Fiscal Year(1) |
Aggregate Earnings in Last Fiscal Year(2) |
Aggregate Withdrawals/ Distributions |
Aggregate Balance at Last Fiscal Year- End(3) | |||||||||||
| Michael T. Lennon |
$ | — | $ | 105,900 | $ | (3,000 | ) | $ | — | $ | 102,900 | |||||
| Richard Schwartz |
$ | — | $ | 63,112 | $ | — | $ | — | $ | 63,112 | ||||||
| Douglas Madison |
$ | — | $ | 24,710 | $ | (700 | ) | $ | — | $ | 24,010 | |||||
| John Higgins |
$ | — | $ | 24,710 | $ | (700 | ) | $ | — | $ | 24,010 | |||||
| (1) | For Messrs. Lennon, Madison and Higgins represents the value of the shares underlying RSUs which vested in January 2008, based on a per share value of $3.53, as determined by our board of directors. For Mr. Schwartz represents the value of the shares underlying RSUs which vested in December 2008, based on a per share value of $3.43, as determined by our board of directors based on an independent third party valuation. |
| (2) | As the per share value as of December 2008 was $3.43, Messrs. Lennon, Madison and Higgins had a decrease in value of $.10 per RSU from the date of vesting and Mr. Schwartz had no change in value. |
| (3) | Represents the value of all shares underlying vested RSUs held at December 31, 2008 based on a per share value of $3.43. |
Employment Contracts
The following describes the material terms of each employment agreement applicable to our NEOs. Please note that this description is based on the salary and percentage equity as promised at the time the agreements were entered into. Those amounts have changed since such agreements were entered into in the case of salary and as a result of dilution with respect to the equity. None of the executives exercised their rights under their agreements to purchase equity.
Michael T. Lennon
On May 8, 2006 in connection with the TPF Acquisition, we entered into an employment agreement with Mr. Lennon. Under such agreement Mr. Lennon serves as our President and Chief Executive Officer. The initial term of the agreement was for two years through May 8, 2008, subject to automatic annual one year renewals unless notice of non-renewal is given at least six months in advance by either party. By the terms of his agreement Mr. Lennon is entitled to receive the following compensation:
| • | base salary of $400,000, subject to such increases as the board of directors may determine; |
| • | target bonus compensation of 50% of his base salary, with “in-the-money” bonus at 20% of his base salary and 80% of base salary for “outstanding” performance; |
| • | SAR and RSU grants equal to 1.8% of our equity on a fully diluted basis as of the date of the agreement subject to vesting and exercise as described above under “—Equity Compensation”; and |
| • | Opportunity to purchase, along with other senior management as selected by the board of directors up to 4% membership interest in InfrastruX Holdings, LLC, our direct parent, upon the same terms as provided to TPF. |
We may terminate Mr. Lennon’s employment at any time with or without cause by providing him 60 days notice. He may also terminate employment at any time, for any reason, after giving 60 days notice. However, if we terminate him without cause, or he terminates for “good reason” he will receive severance equal to one year of his then base salary payable in installments over 12 months, in addition to any compensation accrued for services through the date of termination.
For this purpose “cause” means:
| • | his willful misconduct that has a material adverse effect on us and our subsidiaries, taken as a whole; |
91
Table of Contents
| • | his engaging in (i) conduct which could reasonably result in his conviction of a felony or a crime against us, (ii) conduct involving fraud or moral turpitude, or (iii) substance abuse or other misconduct which would materially compromise our reputation or his ability to perform his duties; |
| • | his unreasonable refusal to perform the duties and responsibilities of his position in any material respect, unless he cures the refusal within 30 days after receipt of written notice specifying in reasonable detail the duties and responsibilities not being performed; or |
| • | violation of his confidentiality, non-compete, non-recruitment of employees, non-interference with our customers and non-diversion of business opportunities covenants. |
He will have “good reason” to terminate if:
| • | we materially breach the employment agreement and fail to cure such breach within 30 days after written notice; |
| • | we reduce, without his consent, his salary or we reduce or eliminate of any compensation or benefit plan benefiting him, unless the reduction or elimination of such benefit plan is generally applicable to all senior executive-level employees (or employees of a successor or controlling entity) and unless we reinstate the compensation or benefit within 30 days after written notice from him; |
| • | we assign him, without his consent, duties materially inconsistent with his position, authority, duties or responsibilities, which results in a material diminution in such position, authority, duties or responsibilities; or |
| • | we involuntarily relocate him by more than 45 miles. |
Mr. Lennon also agreed to keep all of our confidential and proprietary information confidential at all times and that, during employment and for a one year period following termination of his employment for any reason, he will not:
| • | interfere, sell, solicit to sell in the field of construction and other infrastructure services to electric power and/or gas utilities, a product that competes directly with us to any of our customers; |
| • | divert or attempt to divert of take advantage of any of our potential business opportunities; |
| • | compete in the field of construction and other infrastructure services provided to electric power and/or gas utilities; and |
| • | recruit or solicit any of our employees or contractors to leave our employment. |
Richard Schwartz
Mr. Schwartz’s employment agreement is substantially similar to Mr. Lennon’s, including with respect to the term, rights to severance and post-employment covenants, however, it differs in the following terms:
| • | his position is Chief Operating Officer; |
| • | his base salary was initially $225,000, subject to such increases as the board of directors may approve; |
| • | the amount of his bonus payable upon “outstanding” performance is 100% of his base salary; and |
| • | his RSU and SAR grants were equal to 1.2% of our fully diluted equity as of the date of the agreement. |
Douglas Madison
Mr. Madison’s employment agreement is also substantially similar to Mr. Lennon’s, including with respect to the term, rights to severance and post-employment covenants, however, it differs in the following terms:
| • | his position is Chief Financial Officer; |
92
Table of Contents
| • | his base salary was initially $176,800, subject to such increases as the board of directors may approve; |
| • | he does not have set target, threshold or maximum bonus set as a percentage of salary, only the right to be eligible to earn a bonus; and |
| • | his RSU and SAR grants were equal to 0.4% of our fully diluted equity as of the date of the agreement. |
John Higgins
Mr. Higgins has a compensation and severance agreement with us, which initially entitled him to an annual base salary of $175,000 and a target bonus of 50% of base salary. If we were to terminate Mr. Higgins without cause or he terminates for good reason, he would be entitled to one year base salary as severance, in addition to any unpaid current salary, accrued paid time off and COBRA continuation coverage. For this purpose, cause and good reason have the same meaning as under Mr. Lennon’s agreement, however, Mr. Higgins’s violation of any confidentiality, non-compete, non-recruitment of employees, non-interference with customers and non-diversion of business opportunities covenants would not constitute cause for termination of his employment.
Potential Payments upon Termination
The following chart set forth the cash severance that each of the named executive officers would receive pursuant to the terms of the named executive officer’s employment agreement assuming that their employment was terminated under circumstances entitling them to severance on December 31, 2008.
| Name |
Involuntary Not for Cause Termination/Good Reason | ||
| Michael T. Lennon |
$ | 450,000 | |
| Richard Schwartz |
$ | 400,000 | |
| Douglas Madison |
$ | 176,800 | |
| John Higgins |
$ | 200,000 | |
Potential Payments upon Change in Control
The following chart sets forth the value of the accelerated vesting on the RSUs and payment of the long-term bonus which would occur upon a change in control, assuming that the change in control occurred effective December 31, 2008 at a $3.43 per share price, which was the value of our shares as determined in December, 2008 by our board of directors based on an independent third party valuation. Although vesting in the SARs would also accelerate, since the exercise price of the SARs of $3.53 per share is more than the value at the assumed change in control we attributed no additional value to such accelerated vesting.
| Name |
Value of RSUs | Long Term Bonus Amount |
Total | ||||||
| Michael T. Lennon |
$ | 154,350 | $ | 171,000 | $ | 325,350 | |||
| Richard Schwartz |
$ | 94,668 | $ | 108,000 | $ | 202,668 | |||
| Douglas Madison |
$ | 36,015 | $ | 40,000 | $ | 76,015 | |||
| John Higgins |
$ | 36,015 | $ | 40,000 | $ | 76,015 | |||
Non-Executive Director Compensation for Fiscal 2008
During fiscal year 2008, no fees, options or shares of stock were paid or awarded to any of the non-executive members of our board of directors.
93
Table of Contents
CERTAIN RELATIONSHIPS AND RELATED PARTY TRANSACTIONS
The following is a description of transactions since January 1, 2006, in which we have been a participant, in which the amount involved exceeded or will exceed $120,000 and in which any of our directors, named executive officers, beneficial holders of more than 5% of our capital stock, or entities affiliated with them, had or will have a direct or indirect material interest.
Management Agreement
We are party to an Amended and Restated Management Agreement, dated as of November 3, 2006, with TCM, an affiliate of TPF. Under this agreement, TCM provides various management and support services to us for which we are obligated to pay an annual fee of $2.0 million, plus certain third-party expenses and accrued interest. Since, and in accordance with, the September 2007 amendment to our credit facilities, we have deferred payment of the fees incurred, which had accrued to $5.7 million as of June 30, 2009, including interest at a rate per annum equal to the greater of the base rate (generally the applicable prime lending rate of Credit Suisse) or the federal funds effective rate plus 0.5%. We intend to terminate the Management Agreement upon the consummation of this offering and pay the accrued fees and interest.
15% Senior Redeemable Convertible Cumulative Preferred Stock
In connection with the October 2009 amendment of our credit facilities, we issued to the selling shareholder 20,000 shares of our 15% Senior Redeemable Convertible Cumulative Preferred Stock for a purchase price of $20 million. See “Management’s Discussion and Analysis of Financial Condition and Results of Operations—Financing Agreements.” We intend to redeem all of the preferred stock with proceeds from this offering.
Registration Rights Agreement
Prior to the completion of this offering, we plan to enter into a registration rights agreement with the selling shareholder. Subject to certain conditions, the registration rights agreement will require us to register the selling shareholder’s shares with the SEC so that those shares may be publicly resold, and to include its shares in any registration statement we file. The underwriters of any underwritten offering will have the right to limit the number of shares to be included in the filed registration statement. See “Description of Capital Stock—Registration Rights Agreement.”
Other Transactions
In addition to the related party transactions set forth above with our named executive officers and an affiliate of our shareholder, we were party to the following transactions with the former owner and current president of one of our operating units.
In connection with the Hawkeye Acquisition, we entered into an LLC Membership Interest Purchase Agreement, dated as of November 3, 2006, which provides for an earnout payment to the former owners of Hawkeye, including William Haugland, based on, among other things, the performance of Hawkeye and its affiliates in 2007 and 2008 as measured by a formula set forth in the agreement. No amount was earned under the agreement in 2007. As of December 31, 2008, we accrued $17.5 million for amounts earned in 2008. We paid this earnout amount in April 2009 and have no further payment obligations under the LLC Membership Interest Purchase Agreement.
For more information regarding our transactions with certain current and former members of senior management of our operating units see Note 15 to our consolidated financial statements included elsewhere in this prospectus.
Policies and Procedures for Related Party Transactions
We regularly conduct market checks of comparable transactions and believe that the transactions set forth above are generally on terms no less favorable to us than we could have obtained from unaffiliated third parties. However, we have had no formal review process for these transactions. Following this offering, our board of directors or a disinterested committee thereof will review and approve related party transactions.
94
Table of Contents
PRINCIPAL AND SELLING SHAREHOLDER
The following table shows the beneficial ownership of our common stock on June 30, 2009 by:
| • | each person who we know beneficially owns more than 5% of our common stock; |
| • | our directors and named executive officers; |
| • | all of our directors and executive officers as a group; and |
| • | the selling shareholder. |
Beneficial ownership, which is determined in accordance with the rules and regulations of the SEC, means the sole or shared power to vote or direct the voting or to dispose or direct the disposition of our common stock. The number of shares of our common stock beneficially owned by a person includes shares of common stock issuable with respect to options held by the person that are exercisable within 60 days. The percentage of our common stock beneficially owned by a person assumes that the person has exercised all options the person holds which are exercisable within 60 days and that no other persons exercised any of their options. Except as otherwise indicated, the business address for each of the following persons is 600 University Street, Suite 600, Seattle, Washington 98101-1176. Except as otherwise indicated in the footnotes to the table or in cases where community property laws apply, we believe that each person identified in the table possesses sole voting and investment power over all shares of common stock shown as beneficially owned by the person. Percentage of beneficial ownership before the offering is based on shares of common stock outstanding as of June 30, 2009. Percentage of beneficial ownership after the offering is based on shares of common stock outstanding after the completion of this offering.
| Shares Beneficially Owned Before this Offering |
Shares to be Sold in this Offering |
Shares Beneficially Owned After this Offering |
Shares Beneficially Owned After this Offering Assuming Full Exercise of the Over- Allotment Option | ||||||||||||
| Name and Address of Beneficial Owner |
Number of Shares |
Percentage | Number of Shares |
Number of Shares |
Percentage | Number of Shares |
Percentage | ||||||||
| 5% Shareholders and the Selling shareholder: |
|||||||||||||||
| InfrastruX Holdings, LLC(1) |
48,950,360 | 100 | % | ||||||||||||
| Tenaska Power Fund, L.P.(1) |
48,950,360 | 100 | |||||||||||||
| TPF Power, Inc.(1) |
48,950,360 | 100 | |||||||||||||
| Directors and Named Executive Officers: |
|||||||||||||||
| Michael T. Lennon(2) |
— | — | |||||||||||||
| Richard Schwartz(3) |
— | — | |||||||||||||
| Lanny H. Michael(4) |
— | — | |||||||||||||
| Craig S. Eudy |
— | — | |||||||||||||
| Stanley B. Klimberg(5) |
— | — | |||||||||||||
| John Higgins(6) |
— | — | |||||||||||||
| Paul G. Smith(7) |
— | — | |||||||||||||
| Michael Lebens(7) |
— | — | |||||||||||||
| Alan B. Levande(7) |
— | — | |||||||||||||
| Daniel E. Lonergan(7) |
— | — | |||||||||||||
| Directors and Officers as a Group (10 persons) |
— | — | |||||||||||||
| (1) | InfrastruX Holdings, LLC is the holder of record of all of our shares of common stock. The address of InfrastruX Holdings, LLC is c/o TPF Power, Inc., 1044 North 115th Street, Suite 400, Omaha, Nebraska |
95
Table of Contents
| 68154. InfrastruX Holdings, LLC is managed by TPF Power, Inc. Tenaska Power Fund, L.P., through one or more of its affiliates, may be deemed to control TPF Power, Inc. TPF PF G, LLC is the general partner of Tenaska Power Fund, L.P. TPF PF G, LLC is managed by Tenaska PF, Inc. As a result, Tenaska Power Fund, L.P. and Tenaska PF, Inc. may be deemed to hold voting and disposition power with respect to all of the shares held by InfrastruX Holdings, LLC. Tenaska PF, Inc. is managed by a four-person board of directors, and all board action requires approval of a majority of the board. The address of Tenaska Power Fund, L.P. is c/o Tenaska PF, Inc. is 1044 North 115th Street, Suite 400, Omaha, Nebraska 68154. The address of Tenaska PF, Inc. is 1044 North 115th Street, Suite 400, Omaha, Nebraska 68154. Tenaska Power Fund, L.P. and its affiliates own on a fully-diluted basis approximately 95.3% of the interests of InfrastruX Holdings, LLC. Tenaska Capital Management, LLC, an affiliate of Tenaska Power Fund, L.P., provides portfolio management and administrative services to Tenaska Power Fund, L.P., and provides management services to us. |
| (2) | Does not include shares of common stock that may be issued pursuant to the 675,000 SARs and 75,000 RSUs. See “Compensation Discussion and Analysis.” |
| (3) | Does not include shares of common stock that may be issued pursuant to the 434,000 SARs and 46,000 RSUs. See “Compensation Discussion and Analysis.” |
| (4) | Does not include shares of common stock that may be issued pursuant to the 325,000 SARs and 25,000 RSUs. See “Compensation Discussion and Analysis.” |
| (5) | Does not include shares of common stock that may be issued pursuant to the 100,000 SARs. See “Compensation Discussion and Analysis.” |
| (6) | Does not include shares of common stock that may be issued pursuant to the 157,000 SARs and 17,500 RSUs. See “Compensation Discussion and Analysis.” |
| (7) | Messrs. Smith, Lebens, Levande and Lonergan are officers of affiliates of the selling shareholder, and Mr. Smith is a director of Tenaska PF, Inc. |
96
Table of Contents
Authorized Capitalization
Upon consummation of this offering, our authorized capital will consist of 300,000,000 shares of common stock, $0.01 par value per share, and 200,000,000 shares of preferred stock, $0.01 par value per share. The following is a description of our capital stock after giving effect to the amendment and restatement of our articles of incorporation and bylaws.
Common Stock
Voting Rights
Each holder of common stock is entitled to one vote for each share on all matters submitted to a vote of the shareholders. Our articles of incorporation eliminate the right of shareholders to cumulate votes for the election of directors. Accordingly, the holders of a majority of the shares of common stock entitled to vote in any election of directors can elect all of the directors standing for election, if they so choose.
Dividend Rights
Subject to preferences that may be applicable to any then outstanding preferred stock, holders of common stock are entitled to receive ratably those dividends, if any, as may be declared from time to time by the board of directors out of legally available funds. In the event of our liquidation, dissolution or winding up, holders of common stock will be entitled to share ratably in the net assets legally available for distribution to shareholders after the payment of all of our debts and other liabilities and the satisfaction of any liquidation preference granted to the holders of any outstanding shares of preferred stock. See “Dividend Policy.”
No Preemptive or Similar Rights
Holders of common stock have no preemptive or conversion rights or other subscription rights and there are no redemption or sinking fund provisions applicable to the common stock. The rights, preferences and privileges of the holders of common stock are subject to, and may be adversely affected by, the rights of the holders of shares of any series of preferred stock which we may designate in the future.
Right to Receive Liquidation Distributions
Upon our dissolution, liquidation or winding-up, the assets legally available for distribution to our shareholders are distributable ratably among the holders of our common stock, subject to prior satisfaction of all outstanding debt and liabilities and the preferential rights and payment of liquidation preferences, if any, on any outstanding shares of preferred stock.
Preferred Stock
Our board of directors is authorized to provide for the issuance of preferred stock in one or more series and to fix the preferences, powers and relative, participating, optional or other special rights and qualifications, limitations or restrictions thereof, including the dividend rate, conversion rights, voting rights, redemption rights and liquidation preference and to fix the number of shares to be included in any such series. Any preferred stock so issued may rank senior to our common stock with respect to the payment of dividends or amounts upon liquidation, dissolution or winding up, or both. In addition, any such shares of preferred stock may have class or series voting rights.
15% Senior Redeemable Convertible Cumulative Preferred Stock
As of the date of this prospectus, we have outstanding 20,000 shares of our 15% Senior Redeemable Convertible Cumulative Preferred Stock. We expect that all outstanding shares of our senior preferred
97
Table of Contents
stock will be redeemed upon the closing of this offering. We issued our senior preferred stock to the selling shareholder in connection with the October 2009 amendment to our credit facilities in a private offering not subject to the registration requirements of the Securities Act.
Liquidation Preference
The liquidation preference is $1,000 per share plus accrued and unpaid dividends. Upon our liquidation, dissolution or winding up, our senior preferred stock is entitled to receive the liquidation preference before any payment is made on our common stock or any other junior equity securities, and our senior preferred stock is entitled to participate in all payments with respect to our common stock as if the senior preferred stock were converted into common stock at the then applicable conversion price.
Mandatory Redemption
On the earlier of the first date we have satisfied certain conditions in our credit facilities, including the prepayment of at least $90 million on our term loan, and six months after the date there are no obligations or commitments outstanding under our credit facilities (such date referred to in this prospectus as the “earliest redemption date”), we must redeem, in cash, the number of then outstanding shares of senior preferred stock that can be redeemed (subject to contractual and other restrictions, including restrictions imposed by our credit facilities, and the legal availability of funds) at a redemption price equal to 100% of the liquidation preference as then in effect per share. In the event we redeem only a portion of the then outstanding shares of senior preferred stock on the earliest redemption date, we must, on a monthly basis thereafter, redeem the number of outstanding shares of the senior preferred stock that can be redeemed (subject to contractual and other restrictions, including restrictions imposed by our credit facilities, and the legal availability of funds) at a redemption price equal to 100% of the liquidation preference as then in effect per share.
Conversion Rights
Each share of our senior preferred stock is convertible, at the option of the holder, at any time and from time to time, into such shares of our common stock as is determined by dividing the liquidation preference for such share of senior preferred stock by the “conversion price” in effect at the time of conversion. The conversion price will be the average of the daily dollar volume-weighted average sale prices per share of our common stock on the New York Stock Exchange or another national securities exchange or automated quotation system for the 10 consecutive trading days ending on the trading day prior to the date of conversion or, if our common stock is not quoted on the New York Stock Exchange or another national securities exchange or automated quotation system, the fair market value per share of our common stock as determined by our board of directors, but in no event will the conversion price be less than $0.50.
Dividend Rights
Each share of our senior preferred stock is entitled to receive quarterly dividends at a rate per annum equal to 15% of the liquidation preference. All dividends accrue and are cumulative from the date of issuance of the senior preferred stock, whether or not we have funds legally available for such dividends or such dividends are declared by our board of directors. We are not permitted to pay cash dividends prior to the earliest redemption date. Subject to this and other restrictions, including restrictions imposed by our credit facilities, holders of senior preferred stock are entitled to receive ratably those cash dividends, if any, as may be declared from time to time by our board of directors out of legally available funds. Dividends accrued but not paid in cash for any quarterly dividend period compound and are added to the liquidation preference at the start of the next quarterly dividend period. In addition, holders of senior preferred stock are entitled to participate in any dividends declared with respect to our common stock as if the senior preferred stock were converted into common stock at the then applicable conversion price.
98
Table of Contents
Voting
Our senior preferred stock has no voting rights, except as required under Washington law and except for approval of issuances of senior or parity equity securities and certain amendments of our articles of incorporation.
Ranking
Our senior preferred stock, with respect to dividends and distributions upon our liquidation, dissolution or winding up, rank senior to our common stock and each other class of our capital stock or series of our preferred stock, the terms of which do not expressly provide that it ranks senior to or on a parity with our senior preferred stock.
Covenants
The provisions of our articles of incorporation governing our senior preferred stock, subject to specified exceptions, restrict our ability directly or indirectly to, among other things:
| • | declare or pay any dividend or make any other distribution in respect of shares of our capital stock or other equity securities; or |
| • | make any payment on account of the purchase, redemption or other acquisition for value of any of our capital stock or other equity securities. |
Anti-Takeover Effects of Washington law and Our Articles of Incorporation and Bylaws Anti-Takeover Provisions
Some of the provisions of Washington law, our articles of incorporation and our bylaws may have the effect of delaying, deferring or discouraging another person from acquiring control of our company.
Washington Law
Upon the closing of this offering, we will be subject to the provisions of Section 23B.19.040 of the Washington Business Corporation Act. Subject to exceptions, Section 23B.19.040 prohibits a “target corporation,” with certain exceptions, from engaging in certain “significant business transactions” with an “acquiring person,” which is defined as a person or group of persons that beneficially owns 10% or more of the voting shares of the target corporation, for a period of five years after that acquisition, unless the transaction or acquisition of shares is approved by a majority of the members of the target corporation’s board of directors prior to the time of acquisition. Prohibited transactions include, among others:
| • | a merger or consolidation with, disposition of assets to, or issuance or redemption of stock to or from, the acquiring person; |
| • | termination of 5% or more of the employees of the target corporation employed in Washington as a result of the acquiring person’s acquisition of 10% or more of the shares; or |
| • | allowing the acquiring person to receive any disproportionate benefits as a shareholder. |
After the five-year period, a “significant business transaction” may occur, as long as it complies with certain “fair price” provisions of the statute. A corporation may not “opt out” of this statute. This provision may have the effect of delaying, deferring or preventing a change in control.
99
Table of Contents
Articles of Incorporation and Bylaws
These provisions, summarized below, are expected to discourage coercive takeover practices and inadequate takeover bids and to promote stability in our management. These provisions are also designed to encourage persons seeking to acquire control of us to first negotiate with our board of directors.
| • | Undesignated Preferred Stock. Without shareholder approval, our board of directors may authorize the issuance of one or more series of preferred stock with voting or other rights or preferences that could impede the success of any attempt to change control of our company. These and other provisions may have the effect of deferring hostile takeovers or delaying changes in control or management of our company. |
| • | Shareholder Meetings. Our charter documents provide that a special meeting of shareholders may be called only by resolution of the board of directors, the chairman of the board or directors, the executive committee or the president. |
| • | Requirements for Advance Notification of Shareholder Proposals and Nominations. Our bylaws establish advance notice procedures with respect to shareholder proposals and the nomination of candidates for election as directors, other than nominations made by or at the direction of the board of directors or a committee of the board of directors. |
| • | Elimination of Shareholder Action by Written Consent. Our articles of incorporation eliminate the right of shareholders to act by written consent without a meeting. |
| • | Election and Removal of Directors. Our articles of incorporation provide for the division of our board of directors into three classes, as nearly equal in number as possible, with the directors in each class serving for three-year terms, and one class being elected each year by our shareholders. Holders of our common stock are not entitled to cumulative voting rights. In addition, our directors will be removable only for cause and, subject to certain exceptions, any vacancies of the board of directors shall be filled only by the affirmative vote of a majority of the directors then in office. Because this system of election, appointing, removing and replacing directors generally makes it more difficult for shareholders to replace a majority of the board of directors, it may discourage a third party from making a tender offer or otherwise attempting to gain control of us and may maintain the incumbency of the board of directors. |
Registration Rights Agreement
Prior to the completion of this offering, we plan to enter into a registration rights agreement with the selling shareholder. Under the registration rights agreement, the selling shareholder will have the right to demand that we file a registration statement under the Securities Act covering some or all of its registrable securities. The registration rights agreement will limit the number of demand registrations that we are required to make on behalf of the selling shareholder.
In addition, the selling shareholder will have “piggyback” registration rights under the registration rights agreement. If we propose to register any of our equity securities under the Securities Act other than pursuant to specified excluded registrations, the selling shareholder will have the right to require us to include all or a portion of its registrable securities in the registration and in any related underwriting.
In an underwritten offering, the managing underwriter, if any, will have the right, subject to specified conditions, to limit the number of registrable securities. In general, we will bear all fees, costs and expenses of any such registrations, other than underwriting discounts and commissions.
Transfer Agent and Registrar
The transfer agent and registrar of the common stock is .
Listing
We intend to apply to list our common stock on the NYSE under the symbol “IFR.”
100
Table of Contents
DESCRIPTION OF MATERIAL INDEBTEDNESS
We summarize below the principal terms of the agreement that governs our material outstanding indebtedness. You should refer to the relevant agreement for additional information, a copy of which is filed as an exhibit to the registration statement of which this prospectus forms a part.
In connection with the TPF Acquisition, on May 8, 2006, we entered into credit facilities with a syndicate of financial institutions. Those credit facilities were extinguished in November 2006 in connection with the Hawkeye Acquisition and replaced by our current credit facilities, sometimes referred to in this prospectus as “our credit facilities,” which we entered into with a syndicate of financial institutions.
Our credit facilities provide for a term loan of $309 million and a revolving line of credit of $100 million. It was subsequently amended in September 2007 to revise certain financial covenants and amended again in October 2009 to waive certain specified defaults and revise certain provisions, including among others, the interest rates and financial covenants. The term loan matures in November 2012, and the revolving line of credit matures in November 2011. As of June 30, 2009, our term loan balance was $249.7 million, and we had $59.2 million of availability under our revolving line of credit (after giving effect to $27.0 million of borrowings and $13.8 million of outstanding letters of credit at that date).
Guarantees; Collateral
Our credit facilities are fully and unconditionally guaranteed on a joint and several basis by our parent, InfrastruX Holdings, LLC, and our existing and future, direct and indirect domestic subsidiaries. Our credit facilities and guarantees are secured by first priority security interests in, and right of set off against, substantially all of our and our direct and indirect domestic subsidiaries’ tangible and intangible assets and first priority pledges of all equity interests of us, the equity interests owned by us in our existing and future direct and indirect domestic subsidiaries and 66% of the equity interests owned by us in our existing and future non-domestic subsidiaries.
Interest
Borrowings under the revolving line of credit and term loan bear interest, at a rate per annum equal to, at our option, either (i) the base rate (generally the applicable prime lending rate of Credit Suisse) plus a margin of 3.50% (subject to a base rate “floor” of 3.50% or LIBOR plus 1.00%) or (ii) LIBOR plus a margin of 4.50% (subject to a LIBOR “floor” of 2.50%). Swing loan borrowings bear interest at the base rate plus 3.50%. The October 2009 amendment to our credit facilities requires us to pay a supplemental revolver cash amount of 1.00% per annum plus, in the event of a ratings downgrade event, an additional 0.50% per annum (with no such supplemental revolver cash amount due so long as there has been no ratings downgrade event and the total leverage ratio is less than 3.50 to 1.00) on outstanding revolver and swing loan borrowings and a supplemental term loan cash amount of 0.50% per annum plus, in the event of a ratings downgrade event, an additional 0.50% per annum (with no such supplemental term loan cash amount due so long as there has been no ratings downgrade event and the total leverage ratio is less than 3.50 to 1.00) on the outstanding term loan principal balance. Additionally, with respect to the term loan, the amendment requires us to increase the outstanding principal balance by 0.50% per annum of the principal amount of the term loan and also requires us to increase the outstanding principal balance by an additional 1.00% per annum of the principal amount of the term loan, if consolidated EBITDA is less than a specified amount for any testing period, in each case, by capitalizing such deferred amounts at the time that the deferred amounts are paid. As of June 30, 2009, our revolving line of credit and term loan both had interest rates of 4.6%.
Optional and Mandatory Repayments
We are permitted to voluntarily prepay principal amounts outstanding or reduce commitments under our credit facilities at any time, in whole or in part, without premium or penalty, upon the giving of proper notice. In
101
Table of Contents
addition, subject to certain exceptions, we are required to prepay outstanding amounts under our credit facilities with a portion of our excess cash flow, the net proceeds of certain asset dispositions, casualty insurance and condemnation recovery events, certain joint-venture distributions and upon the issuance of certain debt or equity. In addition, the October 2009 amendment requires us to prepay outstanding amounts under our revolving line of credit with cash on hand in excess of $15 million until the earlier of September 30, 2011 and the date that we are in compliance with certain specified leverage and interest coverage ratios.
Certain Covenants
Our credit facilities contain customary and appropriate affirmative and negative covenants for financings of its type (and subject to customary exceptions). The financial covenants include:
| • | a minimum consolidated EBITDA test; |
| • | a minimum liquidity test; |
| • | a minimum fixed charge coverage ratio test; and |
| • | a maximum leverage ratio test. See “Management’s Discussion and Analysis of Financial Condition and Results of Operations—Liquidity and Capital Resources—Financing Arrangements” for details concerning these ratios. |
Other covenants, among other things, limit our ability to:
| • | incur liens or other encumbrances; |
| • | make investments; |
| • | make acquisitions; |
| • | incur additional debt; |
| • | enter into sale leaseback transactions |
| • | make certain restricted payments and other similar distributions; |
| • | enter into mergers, consolidations and similar combinations; |
| • | sell assets or engage in similar transfers; |
| • | cancel or amend certain material agreements; |
| • | make a substantial change from our general business; |
| • | make capital expenditures; and |
| • | engage in transactions with affiliates. |
Events of Default
Our credit facilities contain customary events of default, including but not limited to:
| • | failure to make payments when due; |
| • | defaults under other material agreements or instruments of indebtedness; |
| • | noncompliance with covenants; |
| • | breaches of representations and warranties; |
| • | bankruptcy; |
| • | judgments in excess of specified amounts; |
| • | failure of any loan documents supporting our credit facilities to be in full force and effect; and |
| • | a change of control (as such term is defined in our credit facilities). |
102
Table of Contents
SHARES ELIGIBLE FOR FUTURE SALE
Future sales of substantial amounts of our common stock in the public market could adversely affect the market price of our common stock. The number of shares available for future sale into the public markets is subject to legal and contractual restrictions, some of which are described below. The expiration of these restrictions will permit sales of substantial amounts of our common stock in the public market or could create the perception that these sales could occur, which could adversely affect the market price for our common stock. These factors could also make it more difficult for us to raise funds through future offerings of common stock.
Sale of Restricted Securities
Upon the closing of this offering, we will have shares of common stock outstanding assuming no exercise of the underwriters’ over-allotment option and no exercise of currently outstanding options. Of these shares, the shares of common stock sold in this offering, plus any additional shares sold upon exercise of the underwriters’ over-allotment option, will be freely tradable without restriction under the Securities Act, unless they are held by our affiliates, as that term is defined in Rule 144 under the Securities Act and the rules and regulations promulgated thereunder.
The remaining shares of common stock held by existing shareholders are restricted securities as that term is defined in Rule 144 under the Securities Act or are subject to the contractual restrictions described below. These shares may be sold upon expiration of the lock-up period described below, although a portion of those shares will be subject to volume limitations pursuant to Rule 144.
Restricted securities may be sold in the public market only if registered or if they qualify for an exemption from registration under Rule 144 or 701 under the Securities Act, which rules are summarized below.
Lock-up Agreements
In connection with this offering, we, each of our executive officers and directors and our direct parent and selling shareholder, InfrastruX Holdings, LLC, have entered into lock-up agreements described under “Underwriting” that restrict the sale of shares of our common stock, subject to certain exceptions, for up to 180 days after the date of this prospectus, subject to an extension in certain circumstances. Following the expiration of the lock-up period, the selling shareholder will have the right, subject to certain conditions, to require us to register the sale of its remaining shares of our common stock under federal securities laws. By exercising its registration rights and selling a large number of shares, the selling shareholder could cause the prevailing market price of our common stock to decline.
Rule 144
In general, under Rule 144, as currently in effect, once we have been subject to public company reporting requirements for at least 90 days, a person who is not deemed to have been one of our affiliates for purposes of the Securities Act at any time during the 90 days preceding a sale and who has beneficially owned the shares proposed to be sold for at least six months, including the holding period of any prior owner other than our affiliates, is entitled to sell those shares without complying with the manner of sale, volume limitation or notice provisions of Rule 144, subject to compliance with the public information requirements of Rule 144. If such a person has beneficially owned the shares proposed to be sold for at least one year, including the holding period of any prior owner other than our affiliates, then that person is entitled to sell those shares without complying with any of the requirements of Rule 144.
103
Table of Contents
In general, under Rule 144, as currently in effect, our affiliates or persons selling shares on behalf of our affiliates are entitled to sell upon expiration of the lock-up agreements described above, within any three-month period, a number of shares that does not exceed the greater of:
| • | 1% of the number of shares of common stock then outstanding, which will equal approximately shares immediately after this offering; or |
| • | the average weekly trading volume of the common stock during the four calendar weeks preceding the filing of a notice on Form 144 with respect to that sale. |
Sales under Rule 144 by our affiliates or persons selling shares on behalf of our affiliates are also subject to certain manner of sale provisions and notice requirements and to the availability of current public information about us.
Rule 701
Rule 701 generally allows a shareholder who purchased shares of our common stock pursuant to a written compensatory plan or contract and who is not deemed to have been an affiliate of our company during the immediately preceding 90 days to sell these shares in reliance upon Rule 144, but without being required to comply with the public information, holding period, volume limitation or notice provisions of Rule 144. Rule 701 also permits affiliates of our company to sell their Rule 701 shares under Rule 144 without complying with the holding period requirements of Rule 144. All holders of Rule 701 shares, however, are required to wait until 90 days after the date of this prospectus before selling such shares pursuant to Rule 701.
Registration Rights
Prior to the completion of this offering, we plan to enter into a registration rights agreement with the selling shareholder. The selling shareholder will have the right, subject to various conditions and limitations, to include its shares in registration statements relating to our securities. By exercising its registration rights and causing a large number of shares to be registered and sold in the public market, the selling shareholder could cause the price of the common stock to fall. In addition, any demand to include such shares in our registration statements could have a material adverse effect on our ability to raise needed capital. See “Description of Capital Stock—Registration Rights Agreement.”
Options
In addition to the shares of common stock outstanding immediately after this offering, as of , 2009, there were outstanding options to purchase shares of our outstanding common stock. As soon as practicable upon completion of this offering, we intend to file a registration statement on Form S-8 under the Securities Act covering shares of our common stock issued or reserved for issuance under our stock plans. Accordingly, shares of our common stock registered under such registration statement will be available for sale in the open market upon exercise by the holders, subject to vesting restrictions with us, contractual lock-up restrictions and/or market stand-off provisions applicable to each option agreement that prohibit the sale or other disposition of the shares of common stock underlying the options for a period of 180 days after the date of this prospectus without the prior written consent from us or our underwriters.
104
Table of Contents
MATERIAL U.S. FEDERAL INCOME TAX CONSEQUENCES FOR NON-U.S. HOLDERS OF OUR COMMON STOCK
The following is a summary of the material U.S. federal income tax consequences to non-U.S. holders (as defined below) of the acquisition, ownership and disposition of our common stock. This discussion is not a complete analysis of all the potential U.S. federal income tax consequences relating thereto, nor does it address any estate and gift tax consequences or any tax consequences arising under any state, local or foreign tax laws, or any other U.S. federal tax laws. This discussion is based on the Internal Revenue Code of 1986, as amended, or the Code, Treasury regulations promulgated thereunder, judicial decisions and published rulings and administrative pronouncements of the Internal Revenue Service, or the IRS, all as in effect as of the date of this offering. These authorities may change, possibly retroactively, resulting in U.S. federal income tax consequences different from those discussed below. No ruling has been or will be sought from the IRS with respect to the matters discussed below, and there can be no assurance that the IRS will not take a contrary position regarding the tax consequences of the acquisition, ownership or disposition of our common stock, or that any such contrary position would not be sustained by a court.
This discussion is limited to non-U.S. holders who purchase our common stock issued, and our common stock sold by the selling shareholder, pursuant to this offering and who hold our common stock as a “capital asset” within the meaning of Section 1221 of the Code (generally, property held for investment). This discussion does not address all of the U.S. federal income tax consequences that may be relevant to a particular holder in light of such holder’s particular circumstances. This discussion also does not consider any specific facts or circumstances that may be relevant to holders subject to special rules under the U.S. federal income tax laws, including, without limitation, U.S. expatriates; partnerships or other pass-through entities; real estate investment trusts; regulated investment companies; “controlled foreign corporations”; “passive foreign investment companies”; corporations that accumulate earnings to avoid U.S. federal income tax; financial institutions; insurance companies; brokers, dealers or traders in securities, commodities or currencies; tax-exempt organizations; tax-qualified retirement plans; persons subject to the alternative minimum tax; persons that own, or have owned, actually or constructively, more than 5% of our common stock; and persons holding our common stock as part of a hedging or conversion transaction or straddle, or a constructive sale, or other risk reduction strategy.
PROSPECTIVE INVESTORS SHOULD CONSULT THEIR TAX ADVISORS REGARDING THE PARTICULAR U.S. FEDERAL INCOME TAX CONSEQUENCES TO THEM OF ACQUIRING, OWNING AND DISPOSING OF OUR COMMON STOCK, AS WELL AS ANY TAX CONSEQUENCES ARISING UNDER ANY STATE, LOCAL OR FOREIGN TAX LAWS AND ANY OTHER U.S. FEDERAL TAX LAWS.
Definition of Non-U.S. Holder
For purposes of this discussion, a non-U.S. holder is any beneficial owner of our common stock that is not a “U.S. person” for U.S. federal income tax purposes. A U.S. person is any of the following:
| • | an individual citizen or resident of the U.S.; |
| • | a corporation (or other entity treated as a corporation for U.S. federal income tax purposes) created or organized under the laws of the U.S., any state thereof or the District of Columbia; |
| • | an estate the income of which is subject to U.S. federal income tax regardless of its source; or |
| • | a trust (1) whose administration is subject to the primary supervision of a U.S. court and which has one or more U.S. persons who have the authority to control all substantial decisions of the trust, or (2) that has a valid election in effect under applicable Treasury regulations to be treated as a U.S. person. |
105
Table of Contents
Distributions on Our Common Stock
If we make cash or other property distributions on our common stock, such distributions will constitute dividends for U.S. federal income tax purposes to the extent paid from our current earnings and profits for that taxable year or accumulated earnings and profits, as determined under U.S. federal income tax principles. Amounts not treated as dividends for U.S. federal income tax purposes will constitute a return of capital and will first be applied against and reduce a holder’s adjusted tax basis in the common stock, but not below zero. Any excess will be treated as gain realized on the sale or other disposition of the common stock and will be treated as described under “—Gain on Disposition of Our Common Stock” below.
Dividends paid to a non-U.S. holder of our common stock generally will be subject to U.S. federal withholding tax at a rate of 30% of the gross amount of the dividends, or such lower rate specified by an applicable income tax treaty. To receive the benefit of a reduced treaty rate, a non-U.S. holder must furnish to us or our paying agent a valid IRS Form W-8BEN (or applicable successor form) certifying, under penalties of perjury, such holder’s qualification for the reduced rate. This certification must be provided to us or our paying agent prior to the payment of dividends and must be updated periodically. Non-U.S. holders that do not timely provide us or our paying agent with the required certification, but that qualify for a reduced treaty rate, may obtain a refund of any excess amounts withheld by timely filing an appropriate claim for refund with the IRS.
If a non-U.S. holder holds our common stock in connection with the conduct of a trade or business in the U.S. and dividends paid on the common stock are effectively connected with such holder’s U.S. trade or business (and, if required by an applicable income tax treaty, attributable to a permanent establishment maintained by the non-U.S. holder in the U.S.), the non-U.S. holder will be exempt from U.S. federal withholding tax. To claim the exemption, the non-U.S. holder must furnish to us or our paying agent a properly executed IRS Form W-8ECI (or applicable successor form).
Any dividends paid on our common stock that are effectively connected with a non-U.S. holder’s U.S. trade or business (and, if required by an applicable income tax treaty, attributable to a permanent establishment maintained by the non-U.S. holder in the U.S.) generally will be subject to U.S. federal income tax on a net income basis at the regular graduated U.S. federal income tax rates in the same manner as if such holder were a resident of the U.S. A non-U.S. holder that is a foreign corporation also may be subject to an additional branch profits tax equal to 30% (or such lower rate specified by an applicable income tax treaty) of a portion of its effectively connected earnings and profits for the taxable year. Non-U.S. holders should consult any applicable income tax treaties that may provide for different rules.
A non-U.S. holder who claims the benefit of an applicable income tax treaty generally will be required to satisfy applicable certification and other requirements prior to the distribution date. Non-U.S. holders should consult their tax advisors regarding their entitlement to benefits under a relevant income tax treaty.
Gain on Disposition of Our Common Stock
Subject to the discussion below regarding backup withholding, a non-U.S. holder generally will not be subject to U.S. federal income tax on any gain realized upon the sale or other disposition of our common stock, unless:
| • | the gain is effectively connected with the non-U.S. holder’s conduct of a trade or business in the U.S. and, if required by an applicable income tax treaty, attributable to a permanent establishment maintained by the non-U.S. holder in the U.S.; |
| • | the non-U.S. holder is a nonresident alien individual present in the U.S. for 183 days or more during the taxable year of the disposition and certain other requirements are met; or |
| • | our common stock constitutes a “U.S. real property interest” by reason of our status as a U.S. real property holding corporation, or USRPHC, for U.S. federal income tax purposes at any time within the |
106
Table of Contents
| shorter of the five-year period preceding the disposition or the non-U.S. holder’s holding period for our common stock, and our common stock has ceased to be traded on an established securities market prior to the beginning of the calendar year in which the sale or other disposition occurs. The determination of whether we are a USRPHC depends on the fair market value of our U.S. real property interests relative to the fair market value of our other trade or business assets and our foreign real property interests. |
We believe we are not currently and do not anticipate becoming a USRPHC for U.S. federal income tax purposes.
Gain described in the first bullet point above will be subject to U.S. federal income tax on a net income basis at the regular graduated U.S. federal income tax rates in the same manner as if such holder were a resident of the U.S. A non-U.S. holder that is a foreign corporation also may be subject to an additional branch profits tax equal to 30% (or such lower rate specified by an applicable income tax treaty) of a portion of its effectively connected earnings and profits for the taxable year. Non-U.S. holders should consult any applicable income tax treaties that may provide for different rules.
Gain described in the second bullet point above will be subject to U.S. federal income tax at a flat 30% rate (or such lower rate specified by an applicable income tax treaty), but may be offset by U.S. source capital losses (even though the individual is not considered a resident of the U.S.) provided that the non-U.S. holder has timely filed U.S. federal income tax returns with respect to such losses.
Information Reporting and Backup Withholding
We must report annually to the IRS and to each non-U.S. holder the amount of distributions on our common stock paid to such holder and the amount of any tax withheld with respect to those distributions. This information also may be made available under a specific treaty or agreement with the tax authorities in the country in which the non-U.S. holder resides or is established. Backup withholding, currently at a 28% rate, however, generally will not apply to distributions to a non-U.S. holder of our common stock provided the non-U.S. holder furnishes to us or our paying agent the required certification as to its non-U.S. status, such as by providing a valid IRS Form W-8BEN or IRS Form W-8ECI, or certain other requirements are met. Notwithstanding the foregoing, backup withholding may apply if either we or our paying agent has actual knowledge, or reason to know, that the holder is a U.S. person that is not an exempt recipient.
Backup withholding is not an additional tax. Any amounts withheld under the backup withholding rules may be allowed as a refund or a credit against a non-U.S. holder’s U.S. federal income tax liability, provided the required information is timely furnished to the IRS.
107
Table of Contents
We, the selling shareholder and the underwriters named below have entered into an underwriting agreement with respect to the shares being offered. Subject to certain conditions, each underwriter has severally agreed to purchase the number of shares indicated in the following table. Credit Suisse Securities (USA) LLC and UBS Securities LLC are acting as representatives of the underwriters.
| Underwriters |
Number of Shares | |
| Credit Suisse Securities (USA) LLC |
||
| UBS Securities LLC |
||
| Total |
||
The underwriting agreement provides that the underwriters must purchase all the shares of common stock in the offering if any are purchased, other than those shares covered by the over-allotment option described below. The underwriting agreement also provides that if an underwriter defaults the purchase commitments of non-defaulting underwriters may be increased or the offering may be terminated.
The selling shareholder has granted to the underwriters a 30-day option to purchase on a pro rata basis up to additional shares at the initial public offering price less the underwriting discounts and commissions. The option may be exercised only to cover over-allotments of shares of common stock, if any.
Commissions and Expenses
The underwriters propose to offer the shares of common stock initially at the public offering price on the cover page of this prospectus and to selling group members at that price less a selling concession of $ per share. If all the shares are not sold at the initial public offering price, the representatives may change the offering price and the other selling terms. The offering of the shares by the underwriters is subject to receipt and acceptance and subject to the underwriters’ right to reject any order in whole or in part.
The following table show the per share and total underwriting discounts and commissions to be paid to the underwriters by us and the selling shareholder. Such amounts are shown assuming both no exercise and full exercise of the underwriters’ option to purchase additional shares:
| Per Share | Total | |||||||||||
| Without Over-allotment |
With Over-allotment |
Without Over-allotment |
With Over-allotment | |||||||||
| Underwriting discounts and commissions paid by us |
$ | $ | $ | $ | ||||||||
| Expenses payable by us |
$ | $ | $ | $ | ||||||||
| Underwriting discounts and commissions paid by selling shareholder |
$ | $ | $ | $ | ||||||||
| Expenses payable by the selling shareholder |
$ | $ | $ | $ | ||||||||
We estimate that the total expenses of this offering payable by us, not including the underwriting discounts and commissions, will be approximately $ million.
Lock-up Agreements/No Sales of Similar Securities
We, each of our executive officers and directors and our direct parent and selling shareholder, InfrastruX Holdings, LLC, have agreed with the underwriters, subject to certain exceptions, not to dispose of or hedge any of our common stock or securities convertible into or exchangeable for shares of common stock during the period from the date of this prospectus continuing through the date 180 days after the date of this prospectus, except with the prior written consent of the representatives.
108
Table of Contents
However, in the event that either (1) during the last 17 days of the “lock-up” period, we release earnings results or material news or a material event relating to us occurs or (2) prior to the expiration of the “lock-up” period, we announce that we will release earnings results during the 16-day period beginning on the last day of the “lock-up” period, then in either case the expiration of the “lock-up” will be extended until the expiration of the 18-day period beginning on the date of the release of the earnings results or the occurrence of the material news or event, as applicable, unless the representatives waive, in writing, such an extension.
Indemnification
We and the selling shareholder have agreed to indemnify the underwriters against liabilities under the Securities Act, or contribute to payments that the underwriters may be required to make in that respect.
The New York Stock Exchange Listing
We are applying to list the shares of common stock on the NYSE, under the symbol “IFR.”
Stabilization, Over-allotment, Short Positions, and Penalty Bids
In connection with the offering the underwriters may engage in stabilizing transactions, over-allotment transactions, syndicate covering transactions, and penalty bids in accordance with Regulation M under the Exchange Act.
| • | Stabilizing transactions permit bids to purchase the underlying security so long as the stabilizing bids do not exceed a specified maximum. |
| • | Over-allotment involves sales by the underwriters of shares in excess of the number of shares the underwriters are obligated to purchase, which creates a syndicate short position. The short position may be either a covered short position or a naked short position. In a covered short position, the number of shares over-allotted by the underwriters is not greater than the number of shares that they may purchase in the over-allotment option. In a naked short position, the number of shares involved is greater than the number of shares in the over-allotment option. The underwriters may close out any covered short position by either exercising their over-allotment option and/or purchasing shares in the open market. |
| • | Syndicate covering transactions involve purchases of the common stock in the open market after the distribution has been completed in order to cover syndicate short positions. In determining the source of shares to close out the short position, the underwriters will consider, among other things, the price of shares available for purchase in the open market as compared to the price at which they may purchase shares through the over-allotment option. If the underwriters sell more shares than could be covered by the over-allotment option, a naked short position, the position can only be closed out by buying shares in the open market. A naked short position is more likely to be created if the underwriters are concerned that there could be downward pressure on the price of the shares in the open market after pricing that could adversely affect investors who purchase in the offering. |
| • | Penalty bids permit the representatives to reclaim a selling concession from a syndicate member when the common stock originally sold by the syndicate member is purchased in a stabilizing or syndicate covering transaction to cover syndicate short positions. |
These stabilizing transactions, syndicate covering transactions and penalty bids may have the effect of raising or maintaining the market price of our common stock or preventing or retarding a decline in the market price of the common stock. As a result the price of our common stock may be higher than the price that might otherwise exist in the open market. These transactions may be effected on the NYSE and, if commenced, may be discontinued at any time.
109
Table of Contents
Electronic Distribution
A prospectus in electronic format may be made available on the web sites maintained by one or more of the underwriters, or selling group members, if any, participating in this offering and one or more of the underwriters participating in this offering may distribute prospectuses electronically. The representatives may agree to allocate a number of shares to underwriters and selling group members for sale to their online brokerage account holders. Internet distributions will be allocated by the underwriters and selling group members that will make internet distributions on the same basis as other allocations.
Relationships
The representatives have acted as joint lead arrangers, joint bookrunners and lenders under our senior secured credit facility. Affiliates of Credit Suisse Securities (USA) LLC have also acted as issuing bank, swingline lender and administrative agent and UBS Securities LLC has acted as syndication agent under our senior secured credit facility. In each role, such parties have received customary fees, including in connection with the amendment to our credit facilities in September 2007 and October 2009.
Determination of Offering Price
Prior to this offering, there was no public market for our common stock. The initial public offering price will be determined by negotiation by us and the representatives. The principal factors to be considered in determining the initial public offering price include:
| • | the information set forth in this prospectus and otherwise available to the representatives; |
| • | our history and prospects and the history of, and prospects for, the industry in which we compete; |
| • | our past and present financial performance and an assessment of our management; |
| • | our prospects for future earnings and the present state of our development; |
| • | the general condition of the securities markets at the time of this offering; |
| • | the recent market prices of, and the demand for, publicly traded common stock of generally comparable companies; and |
| • | other factors deemed relevant by the underwriters and us. |
Jurisdictional Sales Requirements
The shares are offered for sale in those jurisdictions in the United States, Europe, Asia and elsewhere where it is lawful to make such offers.
European Economic Area
In relation to each Member State of the European Economic Area which has implemented the Prospectus Directive (each, a “Relevant Member State”), with effect from and including the date on which the Prospectus Directive is implemented in that Relevant Member State an offer of the shares to the public may not be made in that Relevant Member State prior to the publication of a prospectus in relation to the shares which has been approved by the competent authority in that Relevant Member State or, where appropriate, approved in another Relevant Member State and notified to the competent authority in that Relevant Member State, all in accordance with the Prospectus Directive, except that an offer to the public in that Relevant Member State of any shares may be made at any time under the following exemptions under the Prospectus Directive if they have been implemented in the Relevant Member State:
| (a) | to legal entities which are authorized or regulated to operate in the financial markets or, if not so authorized or regulated, whose corporate purpose is solely to invest in securities; |
110
Table of Contents
| (b) | to any legal entity which has two or more of: (1) an average of at least 250 employees during the last financial year; (2) a total balance sheet of more than €43,000,000; and (3) an annual net turnover of more than €50,000,000, as shown in its last annual or consolidated accounts; or |
| (c) | in any other circumstances falling within Article 3 (2) of the Prospectus Directive, |
provided that no such offer of shares shall result in a requirement for the publication by the Company or any underwriter of a prospectus pursuant to Article 3 of the Prospectus Directive.
For the purposes of this provision, the expression an “offer of Shares to the public” in relation to any shares of the common stock in any Relevant Member State means the communication in any form and by any means of sufficient information on the terms of the offer and the shares to be offered so as to enable an investor to decide to purchase or subscribe the shares, as the same may be varied in that Member State by any measure implementing the Prospectus Directive in that Member State and the expression “Prospectus Directive” means Directive 2003/71/EC and includes any relevant implementing measure in each Relevant Member State.
United Kingdom
An invitation or inducement to engage in investment activity (within the meaning of Section 21 of the Financial Services and Markets Act 2000 (the “FSMA”)) has only been communicated or caused to be communicated and will only be communicated or caused to be communicated in connection with the issue or sale of the shares in circumstances in which Section 21(1) of the FSMA does not apply to us. All applicable provisions of the FSMA have been complied with and will be complied with, with respect to anything done in relation to the shares in, from or otherwise involving the United Kingdom. This document is only being distributed to and is only directed at (i) persons who are outside the United Kingdom or (ii) investment professionals falling within Article 19(5) of the Financial Services and Markets Act 2000 (Financial Promotion) Order 2005 (the “Order”) or (iii) high net worth entities, and other persons to whom it may lawfully be communicated, falling within Article 49(2)(a) to (d) of the Order (all such persons together being referred to as “relevant persons”). The shares are only available to, and any invitation, offer or agreement to subscribe, purchase or otherwise acquire such shares will be engaged only with, relevant persons. Any person who is not a relevant person should not act or rely on this document or any of its contents.
Switzerland
Our securities may not and will not be publicly offered, distributed or re-distributed on a professional basis in or from Switzerland, and neither this offering memorandum nor any other solicitation for investments in our securities may be communicated or distributed in Switzerland in any way that could constitute a public offering within the meaning of articles 652a or 1156 of the Swiss Federal Code of Obligations or of Article 2 of the Federal Act on Investment Funds of March 18, 1994. This offering memorandum may not be copied, reproduced, distributed or passed on to others without the underwriters’ and agents’ prior written consent. This offering memorandum is not a prospectus within the meaning of Articles 1156 and 652a of the Swiss Code of Obligations or a listing prospectus according to article 32 of the Listing Rules of the Swiss exchange and may not comply with the information standards required thereunder. We will not apply for a listing of our securities on any Swiss stock exchange or other Swiss regulated market and this offering memorandum may not comply with the information required under the relevant listing rules. The securities have not been and will not be approved by any Swiss regulatory authority. The securities have not been and will not be registered with or supervised by the Swiss Federal Banking Commission, and have not been and will not be authorized under the Federal Act on Investment Funds of March 18, 1994. The investor protection afforded to acquirers of investment fund certificates by the Federal Act on Investment Funds of March 18, 1994 does not extend to acquirers of our securities.
111
Table of Contents
The validity of the shares of common stock offered by us pursuant to this prospectus will be passed upon for us by Stoel Rives LLP, Seattle, Washington. Certain other legal matters will be passed upon for us by Latham & Watkins LLP, Los Angeles, California. The underwriters have been represented by Skadden, Arps, Slate, Meagher & Flom LLP, New York, New York.
The consolidated financial statements of InfrastruX Group, Inc. as of December 31, 2007 and 2008, and for the period from May 8, 2006 (inception) through December 31, 2006, and for the years ended December 31, 2007 and 2008 (Successor periods), the consolidated financial statements of the Predecessor to InfrastruX Group, Inc. for the period from January 1, 2006 through May 7, 2006, and the consolidated financial statements of Hawkeye, LLC for the period from January 1, 2006 through November 2, 2006, have been included herein and in the registration statement in reliance upon the reports of KPMG LLP, independent registered public accounting firm, appearing elsewhere herein, and upon the authority of said firm as experts in accounting and auditing.
WHERE YOU CAN FIND MORE INFORMATION
We have filed with the SEC a registration statement on Form S-1 (including the exhibits, schedules and amendments to the registration statement) under the Securities Act with respect to the shares of common stock offered by this prospectus. This prospectus does not contain all of the information set forth in the registration statement. For further information about us and the new shares of common stock to be sold in this offering, we refer you to the registration statement. Statements contained in this prospectus as to the contents of any contract, agreement or other document to which we make reference are not necessarily complete. In each instance, we refer you to the copy of such contract, agreement or other document filed as an exhibit to the registration statement, each such statement being qualified in all respects by the more complete description of the matter involved.
Upon completion of this offering, we will become subject to the reporting and information requirements of the Securities Exchange Act of 1934, as amended, and, as a result, will file periodic and current reports, proxy statements and other information with the SEC. You may read and copy this information at the Public Reference Room of the SEC located at 100 F Street, N.E., Washington, D.C. 20549. Please call the SEC at 1-800-SEC-0330 for further information on the operation of the Public Reference Room. Copies of all or any part of the registration statement may be obtained from the SEC’s offices upon payment of fees prescribed by the SEC. The SEC maintains an Internet site that contains periodic and current reports, proxy and information statements and other information regarding issuers that file electronically with the SEC. The address of the SEC’s website is http://www.sec.gov.
112
Table of Contents
| Page | ||
| InfrastruX Group, Inc. |
||
| F-2 | ||
| Consolidated Balance Sheets as of December 31, 2007 and 2008 and June 30, 2009 (unaudited) |
F-3 | |
| F-4 | ||
| F-5 | ||
| F-6 | ||
| F-8 | ||
| Hawkeye, LLC |
||
| F-44 | ||
| F-45 | ||
| F-46 | ||
| F-47 | ||
| F-48 | ||
F-1
Table of Contents
Report of Independent Registered Public Accounting Firm
The Board of Directors
InfrastruX Group, Inc.:
We have audited the accompanying consolidated balance sheets of InfrastruX Group, Inc. and subsidiaries as of December 31, 2007 and 2008, and the related consolidated statements of operations, shareholder’s equity and comprehensive loss, and cash flows for the period from May 8, 2006 (inception) through December 31, 2006, and for the years ended December 31, 2007 and 2008 (Successor periods). We have also audited the consolidated statements of operations, shareholder’s equity and comprehensive income, and cash flows of the Predecessor to InfrastruX Group, Inc. for the period from January 1, 2006 through May 7, 2006. These consolidated financial statements are the responsibility of the Company’s management. Our responsibility is to express an opinion on these consolidated financial statements based on our audits.
We conducted our audits in accordance with the standards of the Public Company Accounting Oversight Board (United States). Those standards require that we plan and perform the audit to obtain reasonable assurance about whether the financial statements are free of material misstatement. An audit includes examining, on a test basis, evidence supporting the amounts and disclosures in the financial statements. An audit also includes assessing the accounting principles used and significant estimates made by management, as well as evaluating the overall financial statement presentation. We believe that our audits provide a reasonable basis for our opinion.
In our opinion, the consolidated financial statements referred to above present fairly, in all material respects, the financial position of InfrastruX Group, Inc. and subsidiaries as of December 31, 2007 and 2008, and the related results of their operations and their cash flows for the period from May 8, 2006 (inception) through December 31, 2006, and the years ended December 31, 2007 and 2008 (Successor periods), and the results of operations and cash flows of the Predecessor to InfrastruX Group, Inc. for the period from January 1, 2006 through May 7, 2006, in conformity with U.S. generally accepted accounting principles.
/s/ KPMG LLP
Seattle, Washington
August 10, 2009 (except for the last paragraph of Note 9(a)
as to which the date is November 12, 2009)
F-2
Table of Contents
Consolidated Balance Sheets
(In thousands of dollars, except par value and shares)
| December 31, | June 30, 2009 |
|||||||||||
| 2007 | 2008 | |||||||||||
| (Unaudited) | ||||||||||||
| Assets |
||||||||||||
| Current assets: |
||||||||||||
| Cash and cash equivalents |
$ | 17,450 | $ | 20,580 | $ | 13,363 | ||||||
| Accounts receivable, net |
142,875 | 172,148 | 135,847 | |||||||||
| Inventories |
16,708 | 23,479 | 24,169 | |||||||||
| Prepaid expenses and other current assets, net |
21,083 | 23,383 | 28,772 | |||||||||
| Income taxes receivable |
— | — | 7,359 | |||||||||
| Deferred tax asset |
4,389 | 12,787 | 4,535 | |||||||||
| Total current assets |
202,505 | 252,377 | 214,045 | |||||||||
| Property and equipment, net |
130,224 | 133,347 | 137,318 | |||||||||
| Goodwill |
102,694 | 57,426 | 57,426 | |||||||||
| Intangibles, net |
111,518 | 95,260 | 91,121 | |||||||||
| Other assets |
21,528 | 19,463 | 19,521 | |||||||||
| Total assets |
$ | 568,469 | $ | 557,873 | $ | 519,431 | ||||||
| Liabilities and Shareholder’s Equity |
||||||||||||
| Current liabilities: |
||||||||||||
| Accounts payable |
$ | 21,038 | $ | 20,264 | $ | 15,036 | ||||||
| Other current liabilities |
65,992 | 118,954 | 80,733 | |||||||||
| Current portion of capital lease obligations |
7,193 | 6,363 | 5,212 | |||||||||
| Current portion of long-term debt |
4,801 | 4,578 | 3,750 | |||||||||
| Income taxes payable |
165 | 263 | — | |||||||||
| Total current liabilities |
99,189 | 150,422 | 104,731 | |||||||||
| Capital lease obligations, less current portion |
10,670 | 6,800 | 5,010 | |||||||||
| Deferred tax liability |
39,304 | 24,731 | 19,615 | |||||||||
| Long-term debt, less current portion |
259,774 | 253,362 | 275,420 | |||||||||
| Other long-term liabilities |
21,561 | 16,945 | 17,064 | |||||||||
| Total liabilities |
430,498 | 452,260 | 421,840 | |||||||||
| Commitments and contingencies (Note 16) |
||||||||||||
| Shareholder’s equity: |
||||||||||||
| Common stock, $0.01 par value. Authorized 300,000,000 shares; issued and outstanding 48,950,360 shares |
490 | 490 | 490 | |||||||||
| Additional paid-in capital |
181,044 | 185,352 | 186,240 | |||||||||
| Accumulated deficit |
(43,745 | ) | (80,313 | ) | (89,374 | ) | ||||||
| Accumulated other comprehensive income |
182 | 84 | 235 | |||||||||
| Total shareholder’s equity |
137,971 | 105,613 | 97,591 | |||||||||
| Total liabilities and shareholder’s equity |
$ | 568,469 | $ | 557,873 | $ | 519,431 | ||||||
See accompanying notes to consolidated financial statements.
F-3
Table of Contents
Consolidated Statements of Operations
(In thousands of dollars, except per share amounts and shares)
| Predecessor | Successor | |||||||||||||||||||||||||
| Period from January 1 to May 7, 2006 |
Period
from May 8 (inception) to December 31, 2006 |
Year Ended December 31, | Six Months Ended June 30, | |||||||||||||||||||||||
| 2007 | 2008 | 2008 | 2009 | |||||||||||||||||||||||
| (Unaudited) | ||||||||||||||||||||||||||
| Revenues |
$ | 141,606 | $ | 341,586 | $ | 657,180 | $ | 826,962 | $ | 401,675 | $ | 316,788 | ||||||||||||||
| Cost of revenues |
119,956 | 284,609 | 581,666 | 701,035 | 347,593 | 285,689 | ||||||||||||||||||||
| Gross profit |
21,650 | 56,977 | 75,514 | 125,927 | 54,082 | 31,099 | ||||||||||||||||||||
| Selling, general and administrative expenses |
21,037 | 31,733 | 51,122 | 85,882 | 31,188 | 30,378 | ||||||||||||||||||||
| Amortization of intangibles |
459 | 3,190 | 7,818 | 7,445 | 3,830 | 3,606 | ||||||||||||||||||||
| Goodwill impairment |
— | — | 35,484 | 45,268 | 26,484 | — | ||||||||||||||||||||
| Intangible asset impairment |
— | — | — | 7,620 | 7,620 | — | ||||||||||||||||||||
| Operating income (loss) |
154 | 22,054 | (18,910 | ) | (20,288 | ) | (15,040 | ) | (2,885 | ) | ||||||||||||||||
| Other (income) expense: |
||||||||||||||||||||||||||
| Interest expense |
3,004 | 16,590 | 33,565 | 27,719 | 13,471 | 7,475 | ||||||||||||||||||||
| Interest income |
(70 | ) | (562 | ) | (536 | ) | (251 | ) | (173 | ) | (32 | ) | ||||||||||||||
| Other, net |
(11 | ) | 1,704 | 2,865 | 2,840 | 1,372 | 1,551 | |||||||||||||||||||
| Loss on modification of debt |
— | 7,418 | 1,373 | — | — | — | ||||||||||||||||||||
| Total other expense |
2,923 | 25,150 | 37,267 | 30,308 | 14,670 | 8,994 | ||||||||||||||||||||
| Loss before income taxes |
(2,769 | ) | (3,096 | ) | (56,177 | ) | (50,596 | ) | (29,710 | ) | (11,879 | ) | ||||||||||||||
| Income tax benefit |
237 | 1,152 | 14,376 | 14,028 | 8,722 | 2,818 | ||||||||||||||||||||
| Net loss |
$ | (2,532 | ) | $ | (1,944 | ) | $ | (41,801 | ) | $ | (36,568 | ) | $ | (20,988 | ) | (9,061 | ) | |||||||||
| Net loss per share—basic and diluted |
$ | (0.04 | ) | $ | (0.85 | ) | $ | (0.75 | ) | $ | (0.43 | ) | $ | (0.18 | ) | |||||||||||
| Weighted average shares outstanding—basic and diluted |
46,541,862 | 48,950,360 | 48,950,360 | 48,950,360 | 49,099,673 | |||||||||||||||||||||
See accompanying notes to consolidated financial statements.
F-4
Table of Contents
Consolidated Statements of Shareholder’s Equity and Comprehensive Income (Loss)
(In thousands of dollars, except par values and shares)
| Common stock | Series A | Additional paid-in capital |
Accumulated deficit |
Accumulated other comprehensive income |
Total | |||||||||||||||||||||
| Convertible preferred stock |
||||||||||||||||||||||||||
| Shares | Amount | Shares | Amount | |||||||||||||||||||||||
| Predecessor |
||||||||||||||||||||||||||
| Balances at December 31, 2005 |
996,000 | $ | 10 | 22,888,500 | $ | 229 | $ | 97,378 | $ | (47,711) | $ | 361 | $ | 50,267 | ||||||||||||
| Share-based compensation expense |
— | — | — | — | 274 | — | — | 274 | ||||||||||||||||||
| Comprehensive loss: |
||||||||||||||||||||||||||
| Net loss |
— | — | — | — | — | (2,532) | — | (2,532 | ) | |||||||||||||||||
| Foreign currency translation adjustment, net of tax |
— | — | — | — | — | — | 103 | 103 | ||||||||||||||||||
| Total comprehensive loss |
— | — | — | — | — | — | — | (2,429 | ) | |||||||||||||||||
| Balances at May 7, 2006 |
996,000 | $ | 10 | 22,888,500 | $ | 229 | $ | 97,652 | $ | (50,243) | $ | 464 | $ | 48,112 | ||||||||||||
| Common stock | Additional paid-in capital |
Accumulated deficit |
Accumulated other comprehensive income |
Total | ||||||||||||||||||||||
| Shares | Amount | |||||||||||||||||||||||||
| Successor |
||||||||||||||||||||||||||
| Balances at May 8, 2006 (inception) |
— | $ | — | $ | — | $ | — | $ | — | $ | — | |||||||||||||||
| Common stock issued in May 2006 at $0.01 par value per share |
45,748,000 | 458 | (458 | ) | — | — | — | |||||||||||||||||||
| Distribution to InfrastruX Holdings, LLC for the acquisition of InfrastruX Group, Inc. |
— | — | (192,028 | ) | — | — | (192,028 | ) | ||||||||||||||||||
| Contribution from InfrastruX Holdings, LLC in May 2006 |
— | — | 282,139 | — | — | 282,139 | ||||||||||||||||||||
| Contribution from InfrastruX Holdings, LLC in November 2006 |
— | — | 30,223 | — | — | 30,223 | ||||||||||||||||||||
| Common stock issued in November 2006 at $0.01 par value per share |
3,202,360 | 32 | 11,168 | — | — | 11,200 | ||||||||||||||||||||
| Comprehensive loss: |
||||||||||||||||||||||||||
| Net loss |
— | — | — | (1,944 | ) | — | (1,944 | ) | ||||||||||||||||||
| Foreign currency translation adjustment, net of tax |
— | — | — | — | 40 | 40 | ||||||||||||||||||||
| Total comprehensive loss |
(1,904 | ) | ||||||||||||||||||||||||
| Balances at December 31, 2006 |
48,950,360 | 490 | 131,044 | (1,944 | ) | 40 | 129,630 | |||||||||||||||||||
| Contribution from InfrastruX Holdings, LLC in September 2007 |
— | — | 50,000 | — | — | 50,000 | ||||||||||||||||||||
| Comprehensive loss: |
||||||||||||||||||||||||||
| Net loss |
— | — | — | (41,801 | ) | — | (41,801 | ) | ||||||||||||||||||
| Foreign currency translation adjustment, net of tax |
— | — | — | — | 142 | 142 | ||||||||||||||||||||
| Total comprehensive loss |
(41,659 | ) | ||||||||||||||||||||||||
| Balances at December 31, 2007 |
48,950,360 | 490 | 181,044 | (43,745 | ) | 182 | 137,971 | |||||||||||||||||||
| Share-based compensation expense |
— | — | 4,308 | — | — | 4,308 | ||||||||||||||||||||
| Comprehensive loss: |
||||||||||||||||||||||||||
| Net loss |
— | — | — | (36,568 | ) | — | (36,568 | ) | ||||||||||||||||||
| Foreign currency translation adjustment, net of tax |
— | — | — | — | (98 | ) | (98 | ) | ||||||||||||||||||
| Total comprehensive loss |
(36,666 | ) | ||||||||||||||||||||||||
| Balances at December 31, 2008 |
48,950,360 | 490 | 185,352 | (80,313 | ) | 84 | 105,613 | |||||||||||||||||||
| Share-based compensation expense* |
— | — | 888 | — | — | 888 | ||||||||||||||||||||
| Comprehensive loss: |
||||||||||||||||||||||||||
| Net loss* |
— | — | — | (9,061 | ) | — | (9,061 | ) | ||||||||||||||||||
| Interest rate swap agreement* |
— | — | — | — | 180 | 180 | ||||||||||||||||||||
| Foreign currency translation adjustment, net of tax* |
— | — | — | — | (29 | ) | (29 | ) | ||||||||||||||||||
| Total comprehensive loss* |
(8,910 | ) | ||||||||||||||||||||||||
| Balances at June 30, 2009* |
48,950,360 | $ | 490 | $ | 186,240 | $ | (89,374 | ) | $ | 235 | $ | 97,591 | ||||||||||||||
| * | (Unaudited) |
See accompanying notes to consolidated financial statements.
F-5
Table of Contents
Consolidated Statements of Cash Flows
(In thousands of dollars)
| Predecessor | Successor | |||||||||||||||||||||||||
| Period from January 1 to May 7, 2006 |
Period from May 8 (inception) to December 31, 2006 |
Year Ended December 31, |
Six Months Ended June 30, |
|||||||||||||||||||||||
| 2007 | 2008 | 2008 | 2009 | |||||||||||||||||||||||
| (Unaudited) | ||||||||||||||||||||||||||
| Cash flows from operating activities: |
||||||||||||||||||||||||||
| Net loss |
$ | (2,532 | ) | $ | (1,944 | ) | $ | (41,801 | ) | $ | (36,568 | ) | $ | (20,988 | ) | $ | (9,061 | ) | ||||||||
| Adjustments to reconcile net loss to net cash provided by (used in) operating activities: |
||||||||||||||||||||||||||
| Depreciation and amortization |
7,150 | 22,806 | 42,469 | 41,582 | 20,822 | 20,137 | ||||||||||||||||||||
| Amortization of financing costs |
66 | 824 | 1,656 | 1,746 | 832 | 861 | ||||||||||||||||||||
| Share-based compensation expense |
274 | — | — | 4,308 | 3,176 | 888 | ||||||||||||||||||||
| Goodwill impairment |
— | — | 35,484 | 45,268 | 26,484 | — | ||||||||||||||||||||
| Intangible asset impairment |
— | — | — | 7,620 | 7,620 | — | ||||||||||||||||||||
| Bad debt expense |
208 | 381 | 12 | 1,475 | (479 | ) | (1,395 | ) | ||||||||||||||||||
| Deferred income taxes |
782 | (4,799 | ) | (11,923 | ) | (25,226 | ) | (10,024 | ) | 3,136 | ||||||||||||||||
| Loss on modification of debt |
— | 7,418 | 1,373 | — | — | — | ||||||||||||||||||||
| Unrealized loss (gain) on derivatives |
— | 1,053 | 3,555 | 1,842 | 45 | (1,570 | ) | |||||||||||||||||||
| Gain (loss) on sale of equipment |
(20 | ) | 114 | 257 | (8 | ) | 34 | (64 | ) | |||||||||||||||||
| Term loan interest not currently payable |
— | — | 335 | 1,293 | 646 | 631 | ||||||||||||||||||||
| Changes in assets and liabilities, net of effects of acquisitions: |
||||||||||||||||||||||||||
| Accounts receivable, net |
(7,433 | ) | (23,514 | ) | 3,156 | (30,748 | ) | (23,442 | ) | 37,696 | ||||||||||||||||
| Inventories |
917 | (279 | ) | (2,394 | ) | (6,771 | ) | (5,439 | ) | (690 | ) | |||||||||||||||
| Prepaid expenses and other current assets, net |
(1,329 | ) | 3,183 | (11,463 | ) | (3,818 | ) | (7,735 | ) | (5,086 | ) | |||||||||||||||
| Other long-term assets |
119 | (291 | ) | (910 | ) | 2,065 | (464 | ) | 12 | |||||||||||||||||
| Accounts payable |
1,830 | (851 | ) | 1,305 | (572 | ) | 6,548 | (5,013 | ) | |||||||||||||||||
| Income taxes receivable |
— | — | — | — | — | (7,359 | ) | |||||||||||||||||||
| Other current liabilities |
3,311 | 3,561 | 18,787 | 51,731 | 16,545 | (37,172 | ) | |||||||||||||||||||
| Other liabilities |
(39 | ) | 6,165 | (208 | ) | 99 | (2,875 | ) | 119 | |||||||||||||||||
| Net cash provided by (used in) operating activities |
3,304 | 13,827 | 39,690 | 55,318 | 11,306 | (3,930 | ) | |||||||||||||||||||
| Cash flows from investing activities: |
||||||||||||||||||||||||||
| Capital expenditures |
(2,242 | ) | (15,995 | ) | (24,502 | ) | (34,521 | ) | (23,687 | ) | (18,394 | ) | ||||||||||||||
| Acquisition of businesses, net of cash acquired |
— | (90,774 | ) | (2,676 | ) | — | — | — | ||||||||||||||||||
| Purchases of patents and trademarks |
— | — | (274 | ) | (140 | ) | (83 | ) | (133 | ) | ||||||||||||||||
| Proceeds from sale of equipment |
262 | 670 | 1,496 | 1,729 | 128 | 248 | ||||||||||||||||||||
| Net cash used in investing activities |
(1,980 | ) | (106,099 | ) | (25,956 | ) | (32,932 | ) | (23,642 | ) | (18,279 | ) | ||||||||||||||
| Cash flows from financing activities: |
||||||||||||||||||||||||||
| Proceeds from revolving line of credit |
25,118 | — | 25,000 | 43,000 | 24,000 | 29,000 | ||||||||||||||||||||
| Proceeds from May 8, 2006 term loan B |
— | 150,000 | — | — | — | — | ||||||||||||||||||||
| Proceeds from May 8, 2006 term loan C |
— | 55,000 | — | — | — | — | ||||||||||||||||||||
| Proceeds from November 3, 2006 term loan B |
— | 309,000 | — | — | — | — | ||||||||||||||||||||
| Payments of debt modification/issuance costs |
— | (16,204 | ) | (1,125 | ) | (228 | ) | (207 | ) | (928 | ) | |||||||||||||||
| Payments on term loan |
— | (772 | ) | (51,905 | ) | (6,824 | ) | (4,091 | ) | (2,028 | ) | |||||||||||||||
| Payments on revolving line of credit |
(14,945 | ) | — | (21,000 | ) | (42,000 | ) | (4,000 | ) | (7,000 | ) | |||||||||||||||
| Payments on long term debt – equipment financing |
(3,135 | ) | (291 | ) | (2,483 | ) | (2,594 | ) | (1,336 | ) | (839 | ) | ||||||||||||||
| Payments on capital lease obligations |
(1,183 | ) | (2,362 | ) | (7,528 | ) | (8,179 | ) | (4,001 | ) | (3,184 | ) | ||||||||||||||
| Payment on deferred purchase price obligation |
— | — | (4,666 | ) | (2,333 | ) | (2,333 | ) | — | |||||||||||||||||
| Payments on May 8, 2006 term loan B |
— | (750 | ) | — | — | — | — | |||||||||||||||||||
| Extinguishment of May 8, 2006 term loan B |
— | (149,250 | ) | — | — | — | — | |||||||||||||||||||
| Extinguishment of May 8, 2006 term loan C |
— | (55,000 | ) | — | — | — | — | |||||||||||||||||||
| Contribution from InfrastruX Holdings, LLC |
— | — | 50,000 | — | — | — | ||||||||||||||||||||
| Contribution from InfrastruX Holdings, LLC from the acquisition of InfrastruX Group, Inc. |
— | 12,170 | — | — | — | — | ||||||||||||||||||||
| Distribution to InfrastruX Holdings, LLC for the acquisition of InfrastruX Group, Inc. |
— | (192,028 | ) | — | — | — | — | |||||||||||||||||||
| Net cash provided by (used in) financing activities |
5,855 | 109,513 | (13,707 | ) | (19,158 | ) | 8,032 | 15,021 | ||||||||||||||||||
| Effect on cash flow of foreign currency transactions |
103 | 40 | 142 | (98 | ) | (40 | ) | (29 | ) | |||||||||||||||||
| Net increase (decrease) in cash |
7,282 | 17,281 | 169 | 3,130 | (4,344 | ) | (7,217 | ) | ||||||||||||||||||
| Cash and cash equivalents: |
||||||||||||||||||||||||||
| Beginning of year |
6,187 | — | 17,281 | 17,450 | 17,450 | 20,580 | ||||||||||||||||||||
| End of year |
$ | 13,469 | $ | 17,281 | $ | 17,450 | $ | 20,580 | $ | 13,106 | $ | 13,363 | ||||||||||||||
F-6
Table of Contents
INFRASTRUX GROUP, INC.
Consolidated Statements of Cash Flows—(Continued)
(In thousands of dollars)
| Predecessor | Successor | |||||||||||||||||||
| Period from January 1 to May 7, 2006 |
Period from May 8 (inception) to December 31, 2006 |
Year Ended December 31, |
Six Months Ended June 30, | |||||||||||||||||
| 2007 | 2008 | 2008 | 2009 | |||||||||||||||||
| (Unaudited) | ||||||||||||||||||||
| Supplemental disclosures of noncash investing and financing activities: |
||||||||||||||||||||
| Noncash investing and financing activities: |
||||||||||||||||||||
| Assets acquired with capital lease obligations |
$ | 747 | $ | 267 | $ | 4,267 | $ | 3,479 | $ | 3,310 | $ | 243 | ||||||||
| Assets acquired with vendor debt |
2,969 | 228 | 1,734 | 490 | 490 | 1,466 | ||||||||||||||
| Accrued capital expenditures |
— | — | 1,305 | 463 | 93 | 404 | ||||||||||||||
| Payable for business acquisition of Hawkeye, LLC |
— | 7,000 | — | — | — | — | ||||||||||||||
| Contributions from Infrastrux Holdings, LLC |
— | 311,392 | — | — | — | — | ||||||||||||||
| Interest rate swap agreement |
— | — | — | — | — | 180 | ||||||||||||||
| Incomes taxes paid |
1,294 | 6,000 | 542 | 5,793 | 4,984 | 1,906 | ||||||||||||||
| Cash paid for interest |
2,726 | 15,635 | 29,790 | 24,278 | 12,538 | 9,443 | ||||||||||||||
See accompanying notes to consolidated financial statements.
F-7
Table of Contents
Notes to Consolidated Financial Statements
For the period from January 1, 2006 to May 7, 2006,
for the period from May 8, 2006 (inception), to December 31, 2006,
for the years ended December 31, 2007 and 2008,
and the six months ended June 30, 2008 and 2009 (unaudited)
(In thousands of dollars, except par values, per share amounts and shares)
(1) The Company and Summary of Significant Accounting Policies
On April 28, 2006, TPF InfrastruX, Inc. was incorporated in the state of Washington. TPF InfrastruX, Inc. was a wholly owned subsidiary of InfrastruX Holdings, LLC. InfrastruX Holdings, LLC is a holding company for Tenaska Power Fund, L.P. (TPF).
On May 8, 2006, TPF through InfrastruX Holdings, LLC, acquired the “Predecessor” company of InfrastruX Group, Inc. and merged it with TPF Infrastrux, Inc. to form the “Successor” company of InfrastruX Group, Inc. (the “Company” or “InfrastruX” or “Successor”). In connection with the acquisition, InfrastruX Holdings, LLC contributed the stock, assets and operations of the Predecessor company of InfrastruX Group, Inc. to the Successor company of InfrastruX.
InfrastruX is a wholly owned subsidiary of InfrastruX Holdings, LLC which is an approximately 93.5% owned subsidiary of TPF InfrastruX Holdings, LLC, a wholly owned subsidiary of TPF.
InfrastruX provides design, construction, maintenance, engineering and other infrastructure services to the utility industry. The Company also has subsidiaries that perform work in the United Kingdom, Germany and India. All significant operations for the Company commenced on May 8, 2006 upon the acquisition.
(a) Consolidation and Basis of Presentation
The consolidated financial statements include the accounts of the Company and its subsidiaries. All intercompany accounts and transactions have been eliminated in consolidation.
The Company, including the results of InfrastruX Group, Inc. since the date of its acquisition, is referred to as the “Successor” in the accompanying consolidated financial statements. The consolidated statements of operations, shareholder’s equity and comprehensive income (loss) and cash flows representing InfrastruX results prior to May 8, 2006 have been presented as the “Predecessor” for the period from January 1, 2006 to May 7, 2006. The Company’s consolidated financial results for the periods subsequent to the acquisition are not comparable to the financial statements of the Predecessor presented for the prior period as those financial statements were prepared under different basis of accounting. While the consolidated financial results are not comparable, the accounting policies followed by the Company for both the Predecessor and Successor are substantially similar.
(b) Unaudited Interim Financial Information
The accompanying consolidated balance sheet as of June 30, 2009, the consolidated statements of operations and cash flows for the six months ended June 30, 2008 and 2009 and the consolidated statement of shareholder’s equity and comprehensive loss for the six months ended June 30, 2009 are unaudited. The unaudited interim financial statements have been prepared on the same basis as the Successor’s annual consolidated financial statements and, in the opinion of management, reflect all adjustments, which include only normal recurring adjustments, necessary to present fairly the Company’s financial position and results of operations and cash flows for the six months ended June 30, 2008 and 2009. The financial data and other information disclosed in these notes to the consolidated financial statements related to the six-month periods are unaudited. The results of the six months ended June 30, 2009 are not necessarily indicative of the results to be expected for the year ending December 31, 2009 or for any other interim period for any other future years.
F-8
Table of Contents
INFRASTRUX GROUP, INC.
Notes to Consolidated Financial Statements
For the period from January 1, 2006 to May 7, 2006,
for the period from May 8, 2006 (inception), to December 31, 2006,
for the years ended December 31, 2007 and 2008,
and the six months ended June 30, 2008 and 2009 (unaudited)
(In thousands of dollars, except par values, per share amounts and shares)
(c) Immaterial Error Correction
The Company has included in the consolidated statement of cash flows for the period from May 8, 2006 through December 31, 2006 an adjustment to correct an immaterial error in its previously issued statement of cash flows. The Company has reduced cash flows from operations by $7,000 and has reduced cash flows from financing activities by $7,000 as compared to its previously issued statement of cash flows. In its previously issued financial statements the Company had incorrectly included a $7,000 note payable to the seller related to the Hawkeye acquisition as a cash flow provided by operating activities and a cash flow used in investing activities.
(d) Revenue and Cost Recognition
The Company recognizes the majority of its revenues for services performed in accordance with American Institute of Certified Public Accountants Statement of Position 81-1, Accounting for Performance of Construction-Type and Certain Production-Type Contracts. Revenues generated from short-term projects (often with durations of less than one month) are performed under Master Service Arrangements (MSA), which typically are billed on a unit-price basis and, less commonly, on a time-and-materials basis. The Company recognizes revenues for unit-based services on an output basis as units are completed. Revenues for the services performed on a time-and-materials basis are recognized as labor hours are incurred and services are performed. Storm restoration work is generally billed on a time-and-materials basis at contract rates for customers with which the Company has MSAs and at negotiated rates for off-system (non-MSA) customers.
Revenues for certain larger and longer duration projects, which tend to be performed on a fixed-price basis, are recognized based on percentage-of-completion accounting, using the cost-to-cost method. Under this method, revenue is recognized based on the ratio of estimated cost incurred to total estimated cost to complete the project. These costs include, but are not limited to, all direct material, labor and subcontract costs and indirect costs related to contract performance such as indirect labor, supplies, tools, repairs and depreciation. The Company records changes in its percent complete computations in the period in which the revisions are determined. Periodically, we perform work outside the specific requirements of a contract at the request of a customer. Generally, the revenue associated with such work is not recognized until a change order reflecting the scope and price for such work is executed. Occasionally we recognize costs of contract performance in the period in which they are incurred and contract revenue up to the amount of the costs incurred in the absence of an executed change order if we determine it is probable that the revenue is realizable and collectible. Provisions for the total estimated losses on uncompleted projects are made in the period in which such losses are determined to be probable and can be reasonably estimated. If actual results significantly differ from estimates used for revenue recognition, the Company’s financial condition and results of operations could be materially impacted.
The Company also generates some revenues from providing certain services that do not result in the construction of a tangible asset and are accounted for as service transactions. These revenues are recognized as the services are performed and amounts are earned in accordance with SEC Staff Accounting Bulletin (SAB) No. 104, Revenue Recognition. The Company considers amounts to be earned once evidence of an arrangement has been obtained, services are delivered, fees are fixed or determinable, and collectability is reasonably assured.
Unbilled revenues represent amounts earned and recognized in the period for which billings are issued in a subsequent period and are included in unbilled receivables. Unearned revenues represents amounts billed in excess of costs and estimated earnings and are included in other liabilities.
F-9
Table of Contents
INFRASTRUX GROUP, INC.
Notes to Consolidated Financial Statements
For the period from January 1, 2006 to May 7, 2006,
for the period from May 8, 2006 (inception), to December 31, 2006,
for the years ended December 31, 2007 and 2008,
and the six months ended June 30, 2008 and 2009 (unaudited)
(In thousands of dollars, except par values, per share amounts and shares)
(e) Accounts Receivable and Allowance for Doubtful Accounts
The Company records accounts receivable for all amounts billed and not collected. Also included in accounts receivable are unbilled revenues discussed in Note 1(d). The balances billed but not paid by customers pursuant to retainage provisions in construction contracts are due upon completion of the contracts and acceptance by the customer. The retention balances are generally due within one year of the initial billing.
The Company provides an allowance for doubtful accounts when collection of an account receivable is considered doubtful, and receivables are written off against the allowance when deemed uncollectible. The Company reviews the adequacy of the reserves on a regular basis. Inherent in the assessment of the allowance for doubtful accounts are certain judgments and estimates including, among others, the customer’s access to capital, the customer’s willingness or ability to pay, general economic conditions and the ongoing relationship with the customer.
(f) Concentration of Risk
Financial instruments that potentially subject the Company to concentrations of credit risk are accounts receivable. The Company maintains accounts receivable balances, in the normal course of business, from companies primarily in the utility industry or supporting the energy industry. As of December 31, 2007 and 2008, and June 30, 2009 (unaudited), two customers accounted for 22.5%, 29.3% and 43.3%, respectively, of the total accounts receivable, which customer A accounted for 18.2%, 20.3% and 35.6% of the total accounts receivable and customer B accounted for 4.3%, 9.0% and 7.7% of the total accounts receivable, respectively.
The percentage of revenue earned from customers representing more than 5% of consolidated revenues consisted of the following:
| Predecessor | Successor | |||||||||||||||||||
| Period from January 1 to May 7, 2006 |
Period from May 8 (inception) to December 31, 2006 |
Year Ended December 31, |
Six Months Ended June 30, |
|||||||||||||||||
| 2007 | 2008 | 2008 | 2009 | |||||||||||||||||
| (Unaudited) | ||||||||||||||||||||
| Customer A |
24.4 | % | 23.5 | % | 15.9 | % | 16.7 | % | 13.8 | % | 30.4 | % | ||||||||
| Customer B |
— | — | 7.4 | 11.8 | 16.3 | 10.2 | ||||||||||||||
| Customer C |
5.0 | — | — | — | — | — | ||||||||||||||
| Customer D |
— | — | — | — | — | 5.0 | ||||||||||||||
| Customer E |
— | — | — | — | — | 7.3 | ||||||||||||||
| 29.4 | % | 23.5 | % | 23.3 | % | 28.5 | % | 30.1 | % | 52.9 | % | |||||||||
The Company also maintains a cash collateral and receivable balance for its comprehensive insurance coverage with a major insurer to support its obligations. Cash collateral and receivables due from the insurance company, are recorded in prepaid expense and other current assets and other assets on the consolidated balance sheets, were $23,301, $28,461 and $32,690 as of December 31, 2007 and 2008, and June 30, 2009 (unaudited), respectively.
As of June 30, 2009 (unaudited), approximately 19.2% of the Company’s hourly employees are represented by various unions and collective bargaining agreements. The Company does not directly negotiate with unions,
F-10
Table of Contents
INFRASTRUX GROUP, INC.
Notes to Consolidated Financial Statements
For the period from January 1, 2006 to May 7, 2006,
for the period from May 8, 2006 (inception), to December 31, 2006,
for the years ended December 31, 2007 and 2008,
and the six months ended June 30, 2008 and 2009 (unaudited)
(In thousands of dollars, except par values, per share amounts and shares)
but instead is represented by assorted contractor associations. Current collective bargaining agreements have varying terms depending on the union and have been renewed as necessary.
(g) Cash Equivalents
The Company considers all highly liquid investments purchased with maturities of three months or less at the date of purchase to be cash equivalents. As of December 31, 2007 and 2008, and June 30, 2009 (unaudited), the Company had cash equivalents of $7,573, $11,863 and $9,611, respectively. Cash equivalents represent money market funds and certificates of deposit. At times, bank balances may exceed federally insured limits.
(h) Inventories
Inventories are stated at the lower of cost, determined on the moving average basis, or replacement costs. Inventories primarily consist of pipe, small tools and other construction-related materials that are charged to a contract upon delivery and installation at the construction site. Other inventory items include maintenance parts, spare component parts, and parts related to the Company’s cable restoration line of service. The Company evaluates inventory regularly and writes down obsolete inventory based on a detailed review of inventory quantities, aging, and expected usage.
(i) Derivative Instruments and Hedging Activities
The Company accounts for derivatives and hedging activities in accordance with Statement of Financial Accounting Standards No. 133, Accounting for Derivative Instruments and Certain Hedging Activities (SFAS 133), as amended, which requires entities to recognize all derivative instruments as either assets or liabilities in the balance sheet at their respective fair values. The Company has not designated its December 2006 interest rate swap as an effective hedge and reflects the changes in fair value through interest expense on the consolidated statements of operations.
The Company designated at inception its April 2009 interest rate swap as an effective cash flow hedge (i.e., hedging the exposure to variability in expected future cash flows that is attributable to interest rate risk), and thus the gain or loss on the interest rate swap is reported as a component of other comprehensive income and reclassified into earnings in the same period or periods during which the hedged transaction affects earnings. This cash flow hedge is evaluated for hedge effectiveness on a quarterly basis.
F-11
Table of Contents
INFRASTRUX GROUP, INC.
Notes to Consolidated Financial Statements
For the period from January 1, 2006 to May 7, 2006,
for the period from May 8, 2006 (inception), to December 31, 2006,
for the years ended December 31, 2007 and 2008,
and the six months ended June 30, 2008 and 2009 (unaudited)
(In thousands of dollars, except par values, per share amounts and shares)
(j) Property and Equipment
Property and equipment are stated at cost. Depreciation of property and equipment is provided using the straight-line method for financial reporting purposes at rates based on the following estimated useful lives:
| Machinery and equipment: |
||
| Light trucks, autos, light drills, equipment, |
5.0 – 7.0 years | |
| Medium/heavy drills, trenching equipment, field electronics |
8.0 – 10.0 years | |
| Heavy trucks, aerial and earth moving equipment, misc. |
10.0 – 20.0 years | |
| Office furniture and equipment |
3.0 – 7.0 years | |
| Buildings |
50.0 years | |
| Leasehold improvements |
Lesser of life of lease or useful life | |
| Equipment under capital lease |
Lesser of life of lease or useful life |
Equipment under capital leases is stated at the lower of the present value of minimum lease payments or fair value and is depreciated on a straight-line basis over the estimated useful life of the asset or the lease term. Expenditures for refurbishment and improvements that extend the useful life of an asset are capitalized. Expenditures for normal repairs and maintenance are charged to expense as incurred. The cost and accumulated depreciation of assets sold or otherwise disposed of are removed from the accounts, and the related gains and losses are included in other, net in the consolidated statements of operations.
(k) Goodwill and Nonamortizable Intangible Assets
Statement of Financial Accounting Standards No. 142, Goodwill and Other Intangible Assets (SFAS 142), provides that goodwill and other intangible assets that have indefinite useful lives not be amortized but, instead, must be tested at least annually for impairment. SFAS 142 also provides specific guidance for testing goodwill and other nonamortized indefinite lived intangible assets for impairment. The first step in testing for goodwill impairment compares the fair value of a reporting unit to its carrying amount, including goodwill. If the carrying amount of a reporting unit exceeds its fair value, the second step is then performed. The second step compares the carrying amount of the reporting unit’s goodwill to the fair value of the goodwill. If the fair value of the goodwill is less than the carrying amount, an impairment loss would be recorded in income from operations.
The Company’s annual impairment testing date has been April 30, and the Company will test for impairment between annual tests if an event occurs or circumstances change that would more likely than not reduce the fair value of a reporting unit below its carrying amount. Examples of such events or circumstances may include a significant change in business climate, loss of a significant customer or a loss of key personnel. SFAS 142 requires that the Company make certain estimates and assumptions in order to allocate goodwill to reporting units and to determine the fair value of reporting unit net assets and liabilities, including, among other things, an assessment of market conditions, projected cash flows, cost of capital and growth rates, which could significantly impact the reported value of goodwill and other intangible assets. The valuations employ present value techniques to measure fair value. These valuations are based on a discount rate the Company determined to be consistent with industry discount rates and the risks inherent in the Company’s current business model.
F-12
Table of Contents
INFRASTRUX GROUP, INC.
Notes to Consolidated Financial Statements
For the period from January 1, 2006 to May 7, 2006,
for the period from May 8, 2006 (inception), to December 31, 2006,
for the years ended December 31, 2007 and 2008,
and the six months ended June 30, 2008 and 2009 (unaudited)
(In thousands of dollars, except par values, per share amounts and shares)
The Company’s goodwill is included in three reporting units for goodwill valuation and impairment testing purposes. The three reporting units for which goodwill impairment is assessed are as follows: West/Midwest/National region, Eastern region and Texas/Southwest/South Central region. Due primarily to the cyclical nature of our business, economic conditions throughout the country, competition from other companies in the industry and the impact of weather on the Company’s operations, the profitability of the Company’s individual reporting units may suffer from downturns in customer demand and other factors. These factors may have a disproportionate impact on the individual reporting units as compared to the Company as a whole and might adversely affect the fair value of the individual reporting units. If material adverse conditions occur that impact the Company’s reporting units, future estimates of fair value may not support the carrying amount of one or more of the Company’s reporting units, and the related goodwill would need to be written down to its estimated fair value.
The Company recorded goodwill of $138.1 million as a result of the TPF Acquisition and the Hawkeye Acquisition. The Company also recorded $50 thousand of goodwill in 2007 as a result of our acquisition of CableWISE®. The Company completed its annual evaluations for impairment of goodwill as of April 30, 2007 and 2008 and performed an additional evaluation for impairment of goodwill as of December 31, 2008 due to a change of circumstances that indicated additional impairment may have occurred in one of its regions. To estimate the fair value of each reporting unit for the years ended December 31, 2007 and 2008, the Company utilized the “income” valuation approach. Under the “income approach”, the Company estimated the fair value of the reporting units using the invested capital method, which discounts projected cash flows using a calculated weighted average cost of capital. The Company considered the following assumptions, among others, in performing this analysis: forecasted revenues, expense ratios and profit margins, working capital cash flow, attrition/retention rates, tax rates, and long term discount rates. All of these assumptions require significant judgments by the Company.
The Company recorded an aggregate goodwill impairment charge of $35.5 million related to two of its regions for the year ended December 31, 2007 and $45.3 million related to one of its regions for the year ended December 31, 2008. As of December 31, 2008, all goodwill related to the Company’s Eastern reporting unit has been written off.
For the year ending December 31, 2009, the Company performed its annual evaluation of impairment of goodwill at April 30, 2009. For the April 30, 2009 evaluation, the Company used a combination of “income” and “market” approaches as the Company believes this provided a better indicator of fair value. These valuation approaches were weighted 10% and 90% for the “income” and “market” approaches, respectively. Under the “market” approach, the Company estimated the fair value of each reporting unit based on earnings multiples of comparable public companies. Under the “income” approach, the Company used the same valuation method as used in its 2008 impairment test. No impairment charges were required as a result of this evaluation. The Company will change its annual test date to November 30 to better align impairment testing with year end procedures and will perform its next annual evaluation of impairment of goodwill on November 30, 2009.
F-13
Table of Contents
INFRASTRUX GROUP, INC.
Notes to Consolidated Financial Statements
For the period from January 1, 2006 to May 7, 2006,
for the period from May 8, 2006 (inception), to December 31, 2006,
for the years ended December 31, 2007 and 2008,
and the six months ended June 30, 2008 and 2009 (unaudited)
(In thousands of dollars, except par values, per share amounts and shares)
(l) Long-Lived Assets and Amortizable Intangible Assets
The Company reviews its long-lived assets, including intangible assets with finite useful lives, for impairment if events or changes in circumstances indicate that the carrying value of such asset or asset groups may not be recoverable, as required by Statement of Financial Accounting Standards No. 144, Accounting for the Impairment or Disposal of Long-Lived Assets (SFAS 144). If an evaluation is required, the estimated future undiscounted cash flows associated with the asset or asset groups are compared to its carrying amount to determine if an impairment is necessary. The effect of any impairment would be to expense the difference between the fair value of such asset or asset groups and its carrying value. Such expense would be reflected in income from operations. In addition, the Company consolidated the asset groups that roll up into the Eastern reporting unit into a single asset group for the April 2009 evaluation. This change in estimate was incorporated into the April 2009 valuation in response to the Company’s efforts to streamline operations and recognize available synergies within the region. In 2008, the Company recorded an impairment charge of $7,620 related to certain customer relationship intangible assets.
The Company estimates the useful life and fair value of purchased intangible assets at the time of acquisition and periodically reviews these estimates to determine whether these lives are appropriate. The Company’s intangible assets, which primarily consist of customer relationships, trade names, and developed technology, are amortized over their estimated useful lives using the straight-line method.
In addition, the Company’s cable remediation operating unit has patents that have been issued, and patents and trademarks that are pending. The Company capitalizes these costs, as they are considered probable of being issued, until such time as the patent or trademark is issued and then amortizes those costs over its estimated useful life. The Company capitalized $274, $140 and $133 of patents and trademarks pending as of December 31, 2007 and 2008, and June 30, 2009 (unaudited), respectively.
(m) Other Assets
Other current assets and other assets consist primarily of prepaid insurance costs and deferred financing costs.
(n) Income Taxes
The Company records income taxes using the asset and liability method which requires the recognition of deferred tax assets and liabilities for the expected future tax consequences attributed to differences between the financial statement carrying amounts of existing assets and liabilities and their respective tax bases and tax credits and loss carry forwards. Deferred tax assets and liabilities are measured using enacted tax rates expected to apply to taxable income in the years in which the temporary differences and carry forwards are expected to be recovered or settled. The effect on deferred tax assets and liabilities of a change in tax rates is recognized in income in the period that includes the enactment date. Valuation allowances are provided when necessary to reduce deferred tax assets to the amount expected to be realized.
The Company operates in various tax jurisdictions and is subject to audit by various tax authorities. Prior to January 1, 2007, the Company provided for tax contingencies whenever a tax position was deemed not probable of being upheld. Tax contingencies are based upon their technical merits, relative tax law, and the specific facts and circumstances as of each reporting period. Changes in facts and circumstances could result in material changes to the amounts recorded for such tax contingencies.
F-14
Table of Contents
INFRASTRUX GROUP, INC.
Notes to Consolidated Financial Statements
For the period from January 1, 2006 to May 7, 2006,
for the period from May 8, 2006 (inception), to December 31, 2006,
for the years ended December 31, 2007 and 2008,
and the six months ended June 30, 2008 and 2009 (unaudited)
(In thousands of dollars, except par values, per share amounts and shares)
Effective January 1, 2007, the Company adopted Financial Accounting Standards Board (“FASB”) Interpretation No. 48, Accounting for Uncertainty in Income Taxes—an interpretation of FASB Statement No. 109 (FIN 48), which supplements SFAS No. 109, Accounting for Income Taxes, by defining the confidence level that a tax position must meet in order to be recognized in the financial statements. FIN 48 requires that the tax effects of a position be recognized only if it is “more-likely-than-not” to be sustained based solely on its technical merits as of the reporting date. The Company considers many factors when evaluating and estimating its tax positions and tax benefits, which may require periodic adjustments and which may not accurately anticipate actual outcomes.
With the adoption of FIN 48, the Company was required to adjust its financial statements to reflect only those tax positions that are more-likely-than-not to be sustained. FIN 48 prescribes a comprehensive model for the financial statement recognition, measurement, presentation and disclosure of uncertain tax positions taken or expected to be taken in income tax returns. Upon adoption, adjustment to the liability for tax uncertainties was offset by an increase in a deferred tax asset or an indemnification from the Predecessor’s parent company. There was no impact to retained earnings for the change in accounting principle. See Note 11 for additional information, including the effects of adoption on the Company’s consolidated financial position, results of operations and cash flows.
The Predecessor was included in its parent’s consolidated tax group. The income tax provision for the period of January 1, 2006 to May 7, 2006 for the Predecessor was calculated as if it were on a separate return basis.
(o) Insurance
The Company is insured for workers’ compensation, employer’s liability and general liability claims, subject to a deductible of $750 per occurrence. The Company is also insured for auto liability claims, subject to a deductible of $500 per occurrence. Additionally, the Company’s non-union employee-related health care benefit plan is subject to a deductible of $250 per claimant per year.
Losses in respect to claims, including deductibles, are accrued based upon the Company’s estimates of the ultimate liability for claims incurred (including an estimate of claims incurred but not reported), using actuarially calculated claims liability data based on the Company’s claims experience. For these claims, to the extent the Company has insurance coverage above the deductible amounts, the Company has recorded a receivable reflected in other current assets and other assets. These insurance liabilities are difficult to assess and estimate due to unknown factors, including the severity of an injury, the determination of the Company’s liability in proportion to other parties and the number of incidents not reported. The accruals are based upon known facts and historical trends.
F-15
Table of Contents
INFRASTRUX GROUP, INC.
Notes to Consolidated Financial Statements
For the period from January 1, 2006 to May 7, 2006,
for the period from May 8, 2006 (inception), to December 31, 2006,
for the years ended December 31, 2007 and 2008,
and the six months ended June 30, 2008 and 2009 (unaudited)
(In thousands of dollars, except par values, per share amounts and shares)
(p) Retirement Plans
The Company has defined contribution plans benefiting eligible full-time non-unionized employees who elect to participate, qualifying under section 401(k) of the Internal Revenue Code. Subject to the applicable plan and its respective design, the plans allow eligible employees to make pre-tax compensation contributions and each plan provides matching Company contributions for which employees vest in accordance with the applicable plan’s vesting schedule. The Company’s contribution expenses consisted of the following:
| Predecessor | Successor | |||||||||||||||||||
| Period from January 1 to May 7, 2006 |
Period from May 8 (inception) to December 31, 2006 |
Year Ended December 31, |
Six Months Ended June 30, | |||||||||||||||||
| 2007 | 2008 | 2008 | 2009 | |||||||||||||||||
| (Unaudited) | ||||||||||||||||||||
| Contribution expense |
$ | 422 | $ | 1,294 | $ | 2,948 | $ | 3,316 | $ | 1,583 | $ | 1,995 | ||||||||
In connection with its collective bargaining agreements with various unions, InfrastruX participates with other companies in the unions’ multi-employer pension and other postretirement benefit plans. These plans cover all of InfrastruX’s employees who are members of such unions. The Employee Retirement Income Act of 1974, as amended by the Multi-Employer Pension Plan Amendments Act of 1980, imposes certain liabilities upon employers who are contributors to a multi-employer plan in the event of the employer’s withdrawal from, or upon termination of, such plan. InfrastruX has no intention to withdraw from these plans. The plans do not maintain information on the net assets and actuarial present value of the plans’ unfunded vested benefits allocable to InfrastruX, and the amounts, if any, for which InfrastruX may be contingently liable, are not ascertainable at this time. Contributions to all union multi-employer pension and other postretirement plans by InfrastruX consisted of the following:
| Predecessor | Successor | ||||||||||||||||||
| Period from January 1 to May 7, 2006 |
Period from May 8 (inception) to December 31, 2006 |
Year Ended December 31, |
Six Months Ended June 30, | ||||||||||||||||
| 2007 | 2008 | 2008 | 2009 | ||||||||||||||||
| (Unaudited) | |||||||||||||||||||
| Other contribution expense |
$1,741 | $ | 9,999 | $ | 27,270 | $ | 40,298 | $ | 20,058 | $ | 12,769 | ||||||||
(q) Segment Reporting
The Company follows the provisions of SFAS No. 131, “Disclosures about Segments of an Enterprise and Related Information” which established standards for reporting information about operating segments in annual financial statements and requires selected information about operating segments to be reported in interim financial reports filed with the SEC. It also established standards for related disclosures about products and services, geographic areas and major customers. An operating segment is defined as a component of an enterprise that engages in business activities from which it may earn revenues and incur expenses whose separate financial information is available and is evaluated regularly by the Company’s chief operating decision makers, or decision making group, to perform resource allocations and performance assessments.
F-16
Table of Contents
INFRASTRUX GROUP, INC.
Notes to Consolidated Financial Statements
For the period from January 1, 2006 to May 7, 2006,
for the period from May 8, 2006 (inception), to December 31, 2006,
for the years ended December 31, 2007 and 2008,
and the six months ended June 30, 2008 and 2009 (unaudited)
(In thousands of dollars, except par values, per share amounts and shares)
The Company’s chief operating decision makers are the Chief Executive Officer and other senior executive officers of the Company. The chief operating decision makers manage the business primarily on a geographic basis, as the Company’s subsidiaries are generally grouped within discrete regions of the country and all offer similar maintenance and construction services to the electric power and natural gas transmission and distribution infrastructure markets. Based on information available to the chief operating decision makers and the manner in which they review operating results and allocate resources, the Company has determined that it has three operating segments based on these geographic areas. Due to the similarities in economic characteristics, service offerings, types of customers, methods of distribution and regulatory environments in which they operate in these geographic areas, management believes that the financial information is properly aggregated into one reportable segment.
(r) Foreign Currency Translation
The Company’s foreign subsidiaries’ assets and liabilities are denominated in the local currency (British Pounds, Euros and Rupees) and these currencies represent the functional currency of the respective subsidiaries. As such, the Company’s foreign subsidiaries’ assets and liabilities are translated at current exchange rates at the end of each reporting period, while income and expense are translated at average rates for the period. Translation gains and losses are reported as a component of accumulated other comprehensive income (loss).
(s) Warranty Costs
The Company does not have a general warranty program for a majority of its work. For certain contracts, the Company warrants labor for new installations and construction and servicing of existing infrastructure. The anticipated costs are not considered significant and no reserve has been provided. One of the subsidiary companies maintains a warranty program which specifically covers its cable remediation services. A warranty reserve of $1,350, $1,897 and $2,016 for cable remediation services is recorded in other long-term liabilities on the balance sheet as of December 31, 2007 and 2008 and June 30, 2009 (unaudited), respectively. Warranty activity for this service consisted of the following:
| Predecessor | Successor | |||||||||||||||||||||||||
| Period from January 1 to May 7, 2006 |
Period from May 8 (inception) to December 31, 2006 |
Year Ended December 31, |
Six Months Ended June 30, |
|||||||||||||||||||||||
| 2007 | 2008 | 2008 | 2009 | |||||||||||||||||||||||
| (Unaudited) | ||||||||||||||||||||||||||
| Balance at the beginning of the period |
$ | 798 | $ | — | $ | 900 | $ | 1,350 | $ | 1,350 | $ | 1,897 | ||||||||||||||
| Acquired through acquisition |
— | 1,119 | — | — | — | — | ||||||||||||||||||||
| Warranty expense |
371 | 634 | 1,771 | 1,662 | 676 | 596 | ||||||||||||||||||||
| Warranty claims |
(50 | ) | (853 | ) | (1,321 | ) | (1,115 | ) | (606 | ) | (477 | ) | ||||||||||||||
| Balance at the end of the period |
$ | 1,119 | $ | 900 | $ | 1,350 | $ | 1,897 | $ | 1,420 | $ | 2,016 | ||||||||||||||
(t) Deferred Financing Costs
In November 2006, the Company refinanced the debt related to the Infrastrux Credit Facility (Note 9). As a result of this refinancing, the Company expensed $7,418 of deferred financing costs and incurred $1,100 in prepayment penalties. The prepayment penalties of $1,100 are included in interest expense.
F-17
Table of Contents
INFRASTRUX GROUP, INC.
Notes to Consolidated Financial Statements
For the period from January 1, 2006 to May 7, 2006,
for the period from May 8, 2006 (inception), to December 31, 2006,
for the years ended December 31, 2007 and 2008,
and the six months ended June 30, 2008 and 2009 (unaudited)
(In thousands of dollars, except par values, per share amounts and shares)
In September 2007, the Company modified the covenants related to the InfrastruX Credit Facility (Note 9). As a result of this modification, the Company expensed $1,373 of deferred financing costs during the year ended December 31, 2007.
The current portion of deferred financing costs is included in prepaid expenses and other current assets. The long-term portion is included in other assets. Deferred financing costs are amortized in Other, net and consisted of the following:
| Predecessor | Successor | |||||||||||||||||||
| Period from January 1 to May 7, 2006 |
Period from May 8 (inception) to December 31, 2006 |
Year Ended December 31, |
Six Months Ended June 30, | |||||||||||||||||
| 2007 | 2008 | 2008 | 2009 | |||||||||||||||||
| (Unaudited) | ||||||||||||||||||||
| Amortization of financing cost |
$ | 66 | $ | 824 | $ | 1,656 | $ | 1,746 | $ | 832 | $ | 861 | ||||||||
(u) Fair Value of Financial Instruments
Fair Value Measurements
The Company adopted SFAS No. 157, Fair Value Instruments, as amended by Financial Accounting Standards Board (FASB) Statement of Position (FSP) No. 157-1, Application of FASB Statement No. 157 to FASB Statement No. 13 and Other Accounting Pronouncements That Address Fair Value Measurements for Purposes of Lease Classification or Measurement under Statement 13, and FSP No. 157-2, Effective Date of FASB Statement No. 157 (together referred to as SFAS 157), on January 1, 2008. The Company, in accordance with FSP 157-2, delayed implementation of SFAS 157 for all nonfinancial assets and liabilities recognized or disclosed at fair value in the financial statements on a non-recurring basis until January 1, 2009.
SFAS 157 defines the fair value as the price that would be received to sell an asset or paid to transfer a liability (an exit price) in an orderly transaction between market participants at the measurement date. SFAS 157 also establishes a fair value hierarchy, which requires an entity to maximize the use of observable inputs when measuring fair value. The standard describes three levels of inputs:
| Level 1: | Quoted market prices in active markets for identical assets or liabilities. | |
| Level 2: | Observable market based inputs or unobservable inputs that are corroborated by market data or quoted prices for similar instruments in active markets. | |
| Level 3: | Significant inputs to the valuation model are unobservable. | |
F-18
Table of Contents
INFRASTRUX GROUP, INC.
Notes to Consolidated Financial Statements
For the period from January 1, 2006 to May 7, 2006,
for the period from May 8, 2006 (inception), to December 31, 2006,
for the years ended December 31, 2007 and 2008,
and the six months ended June 30, 2008 and 2009 (unaudited)
(In thousands of dollars, except par values, per share amounts and shares)
Financial Liabilities Measured at Fair Value on a Recurring Basis
The following table presents information about the Company’s financial assets and liabilities that are measured at fair value on a recurring basis and indicates the fair value hierarchy of the valuation techniques utilized to determine such fair value:
| Level 2 | ||||||
| December 31, 2008 | June 30, 2009 | |||||
| (Unaudited) | ||||||
| Assets: |
||||||
| Interest rate swap |
$ | — | $ | 306 | ||
| Liabilities: |
||||||
| Interest rate swap |
$ | 6,581 | $ | 3,408 | ||
The valuation techniques used to measure the fair value of the Company’s level 2 liabilities include quoted prices for similar liabilities or other inputs that are observable or can be corroborated by observable market data for substantially the full term of the liabilities. All data is observable in the market or can be derived principally from, or corroborated by, observable market data for which the Company typically receives external valuation information.
Other Financial Instruments
The Company’s other financial instruments include cash and cash equivalents, receivables, accounts payable and accrued expenses, and certain short-term and long-term borrowings. The Company believes that the fair value of these financial instruments approximates their carrying amounts based on current market indicators, such as prevailing interest rates and market pricing models, with the exception of its term loan.
The estimated fair value of the term loan, based on the quoted offer price is as follows:
| December 31, | June 30, 2009 | ||||||||
| 2007 | 2008 | ||||||||
| (Unaudited) | |||||||||
| Financial liabilities: |
|||||||||
| Term loan |
|||||||||
| Carrying value |
$ | 256,658 | $ | 251,127 | $ | 249,730 | |||
| Fair value |
$ | 242,542 | $ | 200,902 | $ | 224,757 | |||
(v) Share-Based Compensation Expense
The Company accounts for share-based compensation under SFAS No. 123 (revised 2004), Share-Based Payment (SFAS 123R). SFAS 123R requires that all share-based payments be recognized in the consolidated financial statements based on their grant date fair values. Under SFAS 123R, share-based compensation expense is recognized over the period the recipient is required to perform the services in exchange for the award (the vesting period). As permitted by SFAS 123R, the Company values awards with graded vesting as single awards
F-19
Table of Contents
INFRASTRUX GROUP, INC.
Notes to Consolidated Financial Statements
For the period from January 1, 2006 to May 7, 2006,
for the period from May 8, 2006 (inception), to December 31, 2006,
for the years ended December 31, 2007 and 2008,
and the six months ended June 30, 2008 and 2009 (unaudited)
(In thousands of dollars, except par values, per share amounts and shares)
and recognizes the related compensation expense using a straight-line attribution method. SFAS 123R also requires that excess tax benefits be reported as financing cash inflows, rather than as a reduction of taxes paid, which is included within operating cash flows.
(w) Common Shares
During 2008, the Board of Directors approved a 45,748:1 stock split, which was retroactively applied to all shares in the consolidated financial statements and notes thereto since the inception of the Successor Company on May 8, 2006. The stock split was effected to increase the number of shares available for grant under the InfrastruX 2007 Equity Incentive Plan.
(x) Net Loss Per Share
Basic net loss per share is computed by dividing net loss by the weighted-average number of common shares outstanding during the period. Diluted net loss per share is computed by dividing net loss by the weighted-average number of common shares outstanding during the period and potentially dilutive common stock equivalents, except in cases where the effect of the common stock equivalent would be antidilutive. Potential common stock equivalents that have been issued by the Company relate to both stock appreciation rights and restricted stock units and are determined using the treasury stock method. As the Company had a net loss since inception, May 8, 2006, basic and diluted net loss per share are the same.
The amounts and shares used to compute basic and diluted net loss per shares are as follows:
| Period from May 8 (inception) to December 31, 2006 |
Years Ended December 31, |
Six Months Ended June 30, |
||||||||||||||||||
| 2007 | 2008 | 2008 | 2009 | |||||||||||||||||
| (Unaudited) | ||||||||||||||||||||
| Net loss |
$ | (1,944 | ) | $ | (41,801 | ) | $ | (36,568 | ) | $ | (20,988 | ) | $ | (9,061 | ) | |||||
| Net loss per share, basic and diluted |
(0.04 | ) | (0.85 | ) | (0.75 | ) | (0.43 | ) | (0.18 | ) | ||||||||||
| Weighted average common shares outstanding basic and diluted |
46,541,862 | 48,950,360 | 48,950,360 | 48,950,360 | 49,099,673 | |||||||||||||||
Outstanding stock appreciation rights and restricted stock units to purchase approximately 4,370,660, 4,179,500 and 4,258,740 shares of common stock were excluded from the calculation of diluted net loss per share for the year ended December 31, 2008 and the six months ended June 30, 2008 (unaudited) and 2009 (unaudited), respectively, because they were antidilutive. The Company had no outstanding stock appreciation rights or restricted stock units prior to January 2008.
F-20
Table of Contents
INFRASTRUX GROUP, INC.
Notes to Consolidated Financial Statements
For the period from January 1, 2006 to May 7, 2006,
for the period from May 8, 2006 (inception), to December 31, 2006,
for the years ended December 31, 2007 and 2008,
and the six months ended June 30, 2008 and 2009 (unaudited)
(In thousands of dollars, except par values, per share amounts and shares)
(y) Accounting Pronouncements Issued Not yet Adopted
In June 2009, the FASB issued SFAS No. 168, The FASB Accounting Standards Codification and the Hierarchy of Generally Accepted Accounting Principles (SFAS 168), which replaced SFAS No. 162, The Hierarchy of Generally Accepted Accounting Principles (SFAS 162). This statement documents the hierarchy of the various sources of accounting principles and the framework for selecting the principles used in preparing financial statements. This statement shall be effective for interim and fiscal years ending after September 15, 2009. SFAS 168 will not have a material impact on the Company’s consolidated financial statements.
(2) Use of Estimates in the Preparation of Financial Statements
The preparation of the financial statements in conformity with accounting principles generally accepted in the United States of America requires management to make estimates and assumptions that affect the reported amounts of assets and liabilities and disclosure of contingent assets and liabilities at the date of the financial statements and reported amounts of revenues and expenses during the reporting period. Material estimates that are particularly susceptible to significant change include percent complete and estimated losses on construction projects, the allocation of the purchase price of acquired companies, the allowance for doubtful accounts, the fair value of goodwill, asset impairments, the fair value of derivatives, the net realizable value of inventories, the useful lives of long-lived assets, the valuation of deferred tax assets, warranty reserves related to restoration service, and insurance reserves. Actual results could differ from those estimates.
During 2008, the Company entered into a new agreement with a significant customer to provide certain transmission and distribution maintenance and construction services over a 10.5 year term that became effective on August 1, 2008 and superseded all previous contracts with this customer. The arrangement provides for certain volume-based thresholds which correspond with volume-based and other customer incentives. Additionally, the contract requires the Company to maintain certain service levels which, if not achieved, could result in payments to the customer by the Company. The Company’s revenue recognition includes estimates for the volume-based customer incentives based on current and projected performance relative to the thresholds, and includes estimated payments that could result to the customer if service levels are not achieved based on actual and projected performance relative to the service levels. Future changes in these estimates, or divergence in actual incentives or payments from these estimates, could have a material impact on revenue recognized in future periods.
F-21
Table of Contents
INFRASTRUX GROUP, INC.
Notes to Consolidated Financial Statements
For the period from January 1, 2006 to May 7, 2006,
for the period from May 8, 2006 (inception), to December 31, 2006,
for the years ended December 31, 2007 and 2008,
and the six months ended June 30, 2008 and 2009 (unaudited)
(In thousands of dollars, except par values, per share amounts and shares)
(3) Acquisitions
InfrastruX
On May 8, 2006, through InfrastruX Holdings, LLC, TPF acquired 100.0% of the outstanding shares of the Predecessor (InfrastruX Acquisition). The total consideration, net of cash acquired, paid for by InfrastruX Holdings, LLC consisted of the following:
| Cash distribution to InfrastruX Holdings, LLC |
$ | 192,028 | ||
| Cash payment by InfrastruX Holdings, LLC |
90,111 | |||
| Cash paid in 2007 |
7 | |||
| Less: cash acquired |
(12,170 | ) | ||
| Total consideration |
$ | 269,976 | ||
The Company utilized proceeds from the issuances of notes payable (Note 9) of $205,000 to fund the cash distribution of $192,028 to InfrastruX Holdings, LLC.
Upon the completion of the InfrastruX acquisition, InfrastruX Holdings, LLC contributed the stock, assets and operations of the Predecessor company of InfrastruX Group, Inc. to the Successor company of InfrastruX. The following table summarizes the estimated fair value of the assets acquired and liabilities contributed, which have been pushed down to InfrastruX and reflect a new basis of accounting as follows:
| Preliminary purchase price allocation as of December 31, 2006 |
Purchase price adjustments during 2007 |
Final purchase price allocation | |||||||
| Current assets |
$ | 26,633 | $ | — | $ | 26,633 | |||
| Accounts receivable, net |
86,458 | — | 86,458 | ||||||
| Property and equipment |
107,867 | — | 107,867 | ||||||
| Other assets |
9,644 | — | 9,644 | ||||||
| Intangible asset |
67,072 | — | 67,072 | ||||||
| Goodwill |
82,202 | 7 | 82,209 | ||||||
| Total assets acquired |
379,876 | 7 | 379,883 | ||||||
| Current liabilities |
39,958 | — | 39,958 | ||||||
| Deferred tax liabilities |
52,642 | — | 52,642 | ||||||
| Long term liabilities |
17,307 | — | 17,307 | ||||||
| Total liabilities assumed |
109,907 | — | 109,907 | ||||||
| Net assets acquired |
$ | 269,969 | $ | 7 | $ | 269,976 | |||
As part of the acquisition of InfrastruX, the Company entered into employment agreements with certain members of senior management that call for future issuances of share-based instruments, the terms of which were finalized in 2008 (Note 13).
F-22
Table of Contents
INFRASTRUX GROUP, INC.
Notes to Consolidated Financial Statements
For the period from January 1, 2006 to May 7, 2006,
for the period from May 8, 2006 (inception), to December 31, 2006,
for the years ended December 31, 2007 and 2008,
and the six months ended June 30, 2008 and 2009 (unaudited)
(In thousands of dollars, except par values, per share amounts and shares)
The acquired intangible assets, all of which are being amortized, have a weighted average useful life of approximately 14.0 years as of the acquisition date of May 8, 2006. Intangible assets consist of customer relationships of $42,159 (13.0 year weighted average useful life), developed technology of $20,004 (15.0 year useful life), and trade name of $4,909 (20.0 year useful life). At the date of acquisition, tax deductible goodwill acquired was $52,237.
Hawkeye
On November 3, 2006, the Company acquired 100.0% of Hawkeye, LLC and its affiliates, Bemis, Halpin and Premier (Hawkeye Acquisition). The results of Hawkeye’s operations have been included in the consolidated financial statements since the date of acquisition. Hawkeye is an electrical and gas contractor servicing the utility industry primarily in the Eastern United States. Hawkeye, through its affiliates, also provides telecommunications/fiber-optic installation, utility locating and mapping services, and an array of general contracting services, including civil/structural, electrical, and mechanical projects.
The total consideration, net of cash acquired of $4,249, paid for Hawkeye and its affiliates was $139,296. The total cash consideration paid by the Company, net of cash acquired was $90,774 in 2006 and $99 in 2007. The Company paid an additional cash amount of $7,000 in equal installments every six months through May 2008, with interest accruing at the three-month LIBOR rate fixed as of November 3, 2006 (5.4%). TPF, through InfrastruX Holdings, LLC, paid for a portion of the acquisition on the Company’s behalf in the form of $41,423 in cash and equity interest in InfrastruX Holdings, LLC, plus the Company issued 3,202,360 common shares to InfrastruX Holdings, LLC for consideration of the transfer of interest in Hawkeye and one of its affiliates. In connection with the Hawkeye acquisition, the Company issued notes payable in the amount of $309,000 (Note 9).
The purchase agreement contains a provision allowing the sellers to realize additional consideration in 2008 based on certain earnings performance measures of the acquired Hawkeye companies in 2007 and 2008. The provision required the seller to maintain employment through December 31, 2008 in order to be eligible to receive the full amount of any potential payout. No amounts were earned under this agreement in 2007 and amounts earned in 2008 of $17,500 were expensed in 2008 and are included in selling, general and administrative expenses in the statement of operations. The outstanding accrued payable as of December 31, 2008 for the earned payout was $17,500.
The allocation of the purchase price was subject to refinement as of December 31, 2006 as the Company was waiting for certain information related to the determination of fair values. Specifically, additional equipment appraisal information and revisions to inventory valuation, taxes, cash, contracts acquired, union related accruals, certain lease values and customer relationship values were not finalized until 2007.
F-23
Table of Contents
INFRASTRUX GROUP, INC.
Notes to Consolidated Financial Statements
For the period from January 1, 2006 to May 7, 2006,
for the period from May 8, 2006 (inception), to December 31, 2006,
for the years ended December 31, 2007 and 2008,
and the six months ended June 30, 2008 and 2009 (unaudited)
(In thousands of dollars, except par values, per share amounts and shares)
The following table summarizes the estimated fair value of the assets acquired, excluding cash acquired of $4,249, and liabilities assumed at the date of acquisition and upon final allocation of the purchase price:
| Preliminary Purchase price allocation as of December 31, 2006 |
Purchase price adjustments during 2007 |
Final purchase price allocation | ||||||||
| Current assets |
$ | 5,457 | $ | — | $ | 5,457 | ||||
| Accounts receivable, net |
45,316 | (8,866 | ) | 36,450 | ||||||
| Property and equipment |
14,187 | 12,076 | 26,263 | |||||||
| Other assets |
145 | 2,586 | 2,731 | |||||||
| Intangible assets |
57,251 | — | 57,251 | |||||||
| Goodwill |
46,915 | 9,004 | 55,919 | |||||||
| Total assets acquired |
169,271 | 14,800 | 184,071 | |||||||
| Current liabilities |
27,071 | (1,497 | ) | 25,574 | ||||||
| Capital leases |
— | 14,020 | 14,020 | |||||||
| Deferred tax liability |
— | 2,178 | 2,178 | |||||||
| Long term liabilities |
3,003 | — | 3,003 | |||||||
| Total liabilities assumed |
30,074 | 14,701 | 44,775 | |||||||
| Net assets acquired |
$ | 139,197 | $ | 99 | $ | 139,296 | ||||
The acquired intangible assets, all of which are being amortized, consist of customer relationships and have a weighted average useful life of approximately 13.0 years as of the acquisition date of November 3, 2006. At the date of acquisition, tax deductible goodwill acquired was $48,281.
CableWise
On January 29, 2007, the Company acquired the operating assets and other rights relating to the CableWise operations. The results of CableWise’s operations have been included in the consolidated financial statements since that date. CableWise utilizes an online, passive technique that utilizes radio frequency pulses emitted by a cable system while it is in service, to assess the remaining life of the cable, splices, terminations and other electrical equipment connected to the circuit. The aggregate purchase price of $100 was paid in cash.
The purchase agreement contains a provision requiring future payments, which are contingent upon the amount of testing performed using the CableWise technology, not to exceed $2,000. The Company charged amounts due under this provision as royalty expense beginning in 2007.
The estimated fair value of assets acquired was $50, which consisted of vehicles and testing equipment; no liabilities were assumed. The $50 of goodwill is expected to be fully deductible for tax purposes.
RTS Construction Company
On August 10, 2007, the Company acquired the operating assets and other rights relating to RTS’s operations. The results of RTS have been included in the consolidated financial statements since that date. The aggregate purchase price of $2,470 was paid in cash.
F-24
Table of Contents
INFRASTRUX GROUP, INC.
Notes to Consolidated Financial Statements
For the period from January 1, 2006 to May 7, 2006,
for the period from May 8, 2006 (inception), to December 31, 2006,
for the years ended December 31, 2007 and 2008,
and the six months ended June 30, 2008 and 2009 (unaudited)
(In thousands of dollars, except par values, per share amounts and shares)
The following table summarizes the estimated fair value of assets acquired and liabilities assumed at the date of acquisition:
| Final purchase price allocation | |||
| Property and equipment |
$ | 2,386 | |
| Prepaid taxes |
16 | ||
| Intangible assets |
95 | ||
| Total assets acquired |
2,497 | ||
| Accrued liabilities |
27 | ||
| Net assets acquired |
$ | 2,470 | |
(4) Goodwill and Intangible Assets
Goodwill
Goodwill represents the excess of cost over net tangible and identifiable intangible assets of the business acquired. The Company completed its annual evaluation for impairment of goodwill as of April 30, 2007 and April 30, 2008. The 2007 impairment analysis indicated impairment in two of the Company’s reporting units of $35,484, which is recognized as operating expense presented as goodwill impairment on the consolidated statements of operations for the year ended December 31, 2007. The primary factor contributing to the impairment charge was the reduction in current and forecasted future performance levels for the Eastern reporting unit and for the Midwest/National reporting unit, as of April 30, 2007, the testing date. The 2008 impairment analyses indicated goodwill impairment of $26,484 in the Company’s Eastern reporting unit. The primary factor contributing to the impairment charge was the reduction in current and forecasted performance levels for that reporting unit. In the fourth quarter of 2008, there was an additional change in current and forecasted future performance levels for the Company’s Eastern reporting unit and the departure of a key executive and former owner of one of the Company’s smaller subsidiaries in the Eastern reporting unit that indicated additional impairment may have occurred. As a result, the Company performed an additional SFAS 142 impairment test, which considered the elimination of that subsidiary and current and forecasted future performance levels under then existing economic conditions and resulted in an additional $18,784 in goodwill impairment in the Eastern reporting unit. Accordingly, the Company recognized total goodwill impairment of $45,268 in 2008.
A summary of changes in the Company’s goodwill consisted of the following:
| December 31, | June 30, 2009 | |||||||||||||
| 2006 | 2007 | 2008 | ||||||||||||
| (Unaudited) | ||||||||||||||
| Goodwill |
||||||||||||||
| Beginning Balance |
$ | — | $ | 129,117 | $ | 102,694 | $ | 57,426 | ||||||
| Additions |
129,117 | 50 | — | — | ||||||||||
| Adjustments |
— | 9,011 | — | — | ||||||||||
| Impairment |
— | (35,484 | ) | (45,268 | ) | — | ||||||||
| $ | 129,117 | $ | 102,694 | $ | 57,426 | $ | 57,426 | |||||||
F-25
Table of Contents
INFRASTRUX GROUP, INC.
Notes to Consolidated Financial Statements
For the period from January 1, 2006 to May 7, 2006,
for the period from May 8, 2006 (inception), to December 31, 2006,
for the years ended December 31, 2007 and 2008,
and the six months ended June 30, 2008 and 2009 (unaudited)
(In thousands of dollars, except par values, per share amounts and shares)
Intangible Assets
Intangible assets consisted of the following:
| Useful Life |
December 31, | June 30, 2009 |
||||||||||||
| 2007 | 2008 | |||||||||||||
| (Unaudited) | ||||||||||||||
| Intangible Assets |
||||||||||||||
| Customer relationships |
13.0 yrs | $ | 99,458 | $ | 90,453 | $ | 90,453 | |||||||
| Trade name valuation |
20.0 yrs | 4,909 | 4,909 | 4,909 | ||||||||||
| Developed technology |
15.0 yrs | 20,004 | 20,004 | 20,004 | ||||||||||
| Patents issued |
12.0 yrs | 31 | 57 | 56 | ||||||||||
| Patents pending |
269 | 360 | 481 | |||||||||||
| Trademarks pending |
19 | 43 | 56 | |||||||||||
| 124,690 | 115,826 | 115,959 | ||||||||||||
| Less: accumulated amortization |
(13,172 | ) | (20,566 | ) | (24,838 | ) | ||||||||
| $ | 111,518 | $ | 95,260 | $ | 91,121 | |||||||||
As a result of the departure of a key executive and former owner of one of the Company’s smaller subsidiaries, deterioration of business, and the sale of the tangible assets of that subsidiary, an impairment charge to customer relationship intangibles in the amount of $7,620 was recognized in 2008. The impairment charge was calculated using an income approach. The impairment charge is reflected in the intangible asset impairment line item on the consolidated statement of operations and consolidated statement of cash flows.
Intangible assets are amortized straight-line over the periods noted above. Amortization expense, including developed technology intangible amortization recorded in cost of revenues, for amortizing intangible assets consisted of the following:
| Predecessor | Successor | |||||||||||||||||||
| Period from January 1 to May 7, 2006 |
Period from May 8 (inception) to December 31, 2006 |
Year Ended December 31, |
Six Months Ended June 30, | |||||||||||||||||
| 2007 | 2008 | 2008 | 2009 | |||||||||||||||||
| (Unaudited) | ||||||||||||||||||||
| Cost of revenues—development technology |
$ | 247 | $ | 831 | $ | 1,333 | $ | 1,333 | $ | 666 | $ | 666 | ||||||||
| Selling, general and administrative expenses |
459 | 3,190 | 7,818 | 7,445 | 3,830 | 3,606 | ||||||||||||||
| Total amortization expense |
$ | 706 | $ | 4,021 | $ | 9,151 | $ | 8,778 | $ | 4,496 | $ | 4,272 | ||||||||
The remaining weighted average amortization period for all intangible assets as of June 30, 2009 is 10.6 years. Estimated amortization charges for the next five years, 2009 – 2013, from intangible assets as of December 31, 2008 are $8,545 per year.
F-26
Table of Contents
INFRASTRUX GROUP, INC.
Notes to Consolidated Financial Statements
For the period from January 1, 2006 to May 7, 2006,
for the period from May 8, 2006 (inception), to December 31, 2006,
for the years ended December 31, 2007 and 2008,
and the six months ended June 30, 2008 and 2009 (unaudited)
(In thousands of dollars, except par values, per share amounts and shares)
(5) Accounts Receivable, Net
Accounts receivable, net consisted of the following:
| December 31, | June 30, 2009 |
|||||||||||
| 2007 | 2008 | |||||||||||
| (Unaudited) | ||||||||||||
| Trade receivables—billed |
$ | 112,024 | $ | 131,904 | $ | 95,496 | ||||||
| Unbilled receivables |
22,273 | 33,363 | 37,922 | |||||||||
| Retainage |
10,919 | 10,287 | 3,940 | |||||||||
| 145,216 | 175,554 | 137,358 | ||||||||||
| Less: allowance for doubtful accounts |
(2,341 | ) | (3,406 | ) | (1,511 | ) | ||||||
| $ | 142,875 | $ | 172,148 | $ | 135,847 | |||||||
The Company expects all accounts receivable to be collected within one year. The unbilled receivables include work that has been performed and is billable, but not yet billed, as well as work that has been performed, but is not yet allowed to be billed due to contractual terms. Retainage represents amounts held by customers for work performed pending completion of a project or the passage of an agreed upon date pursuant to contractual provisions.
The Company’s allowance for doubtful accounts activity consisted of the following:
| Predecessor | Successor | ||||||||||||||||||||||||
| Period from January 1 to May 7, 2006 |
Period from May 8 (inception) to December 31, 2006 |
Year Ended December 31, |
Six Months Ended June 30, |
||||||||||||||||||||||
| 2007 | 2008 | 2008 | 2009 | ||||||||||||||||||||||
| (Unaudited) | |||||||||||||||||||||||||
| Balance at the beginning of the period |
$ | 1,275 | $ | — | $ | 1,978 | $ | 2,341 | $ | 2,341 | $ | 3,406 | |||||||||||||
| Acquired through acquisitions |
— | 1,831 | — | — | — | — | |||||||||||||||||||
| Provision for bad debts |
208 | 381 | 12 | 1,475 | (479 | ) | (1,395 | ) | |||||||||||||||||
| Deductions for write offs, net of recoveries |
(12 | ) | (234 | ) | 351 | (410 | ) | (370 | ) | (500 | ) | ||||||||||||||
| Balance at the end of the period |
$ | 1,471 | $ | 1,978 | $ | 2,341 | $ | 3,406 | $ | 1,492 | $ | 1,511 | |||||||||||||
The provision for bad debts is included in selling, general and administrative expense in the consolidated statements of operations.
(6) Derivative Instruments
In June 2006 and December 2006, the Company entered into interest rate swap agreements for notional amounts of $102,500 and $62,500, respectively, to partially offset interest rate exposure with respect to its term loans. The commencement date of the June 2006 swap transaction was June 26, 2006, and it expired on June 26, 2009. The commencement date of the December 2006 swap transaction was December 31, 2006, with $62,500 maturing June 25, 2009, at which time the notional amount increased to $165,000 with a final maturity date of December 31, 2009.
F-27
Table of Contents
INFRASTRUX GROUP, INC.
Notes to Consolidated Financial Statements
For the period from January 1, 2006 to May 7, 2006,
for the period from May 8, 2006 (inception), to December 31, 2006,
for the years ended December 31, 2007 and 2008,
and the six months ended June 30, 2008 and 2009 (unaudited)
(In thousands of dollars, except par values, per share amounts and shares)
In accordance with SFAS 133, the fair values of the June 2006 and December 2006 swap agreements are included in other long-term liabilities on the consolidated balance sheet in the amount of $4,608 as of December 31, 2007 and other current liabilities on the consolidated balance sheet in the amount of $6,450 and $3,408 as of December 31, 2008 and June 30, 2009 (unaudited), respectively.
In April 2009, the Company entered into an interest rate swap for a notional amount of $187,027 declining quarterly with a fixed rate of 1.889% in exchange for floating rates until December 31, 2011. This interest rate swap’s term commences December 31, 2009. The fair value of this interest rate swap is included in other long term assets in the amount of $306 at June 30, 2009.
(7) Property and Equipment, Net
Property and equipment, net, all of which secure debt of the Company, at cost, consisted of the following:
| December 31, | June 30, 2009 |
|||||||||||
| 2007 | 2008 | |||||||||||
| (Unaudited) | ||||||||||||
| Machinery and equipment |
$ | 168,028 | $ | 200,564 | $ | 218,196 | ||||||
| Office furniture and equipment |
9,964 | 10,294 | 11,839 | |||||||||
| Land |
1,370 | 1,488 | 1,488 | |||||||||
| Building |
1,123 | 1,425 | 1,503 | |||||||||
| 180,485 | 213,771 | 233,026 | ||||||||||
| Less: accumulated depreciation |
(50,261 | ) | (80,424 | ) | (95,708 | ) | ||||||
| $ | 130,224 | $ | 133,347 | $ | 137,318 | |||||||
Included in machinery and equipment is $32,664, $27,438 and $23,210, and included in office furniture and equipment is $1,067, $867 and $371, at cost as of December 31, 2007 and 2008, and June 30, 2009 (unaudited), respectively, for the cost of property which has been capitalized under capital leases.
Depreciation expense, including amortization for assets under capital leases, consisted of the following:
| Predecessor | Successor | |||||||||||||||||||
| Period from January 1 to May 7, 2006 |
Period from May 8 (inception) to December 31, 2006 |
Year Ended December 31, |
Six Months Ended June 30, | |||||||||||||||||
| 2007 | 2008 | 2008 | 2009 | |||||||||||||||||
| (Unaudited) | ||||||||||||||||||||
| Depreciation expense |
$ | 6,444 | $ | 18,785 | $ | 33,318 | $ | 32,804 | $ | 16,326 | $ | 15,865 | ||||||||
F-28
Table of Contents
INFRASTRUX GROUP, INC.
Notes to Consolidated Financial Statements
For the period from January 1, 2006 to May 7, 2006,
for the period from May 8, 2006 (inception), to December 31, 2006,
for the years ended December 31, 2007 and 2008,
and the six months ended June 30, 2008 and 2009 (unaudited)
(In thousands of dollars, except par values, per share amounts and shares)
(8) Other Current Liabilities
Other current liabilities consisted of the following:
| December 31, | June 30, 2009 | ||||||||
| 2007 | 2008 | ||||||||
| (Unaudited) | |||||||||
| Accrued payroll, bonuses and related costs |
$ | 23,412 | $ | 37,332 | $ | 28,007 | |||
| Accrued insurance |
19,361 | 23,718 | 21,464 | ||||||
| Accrued earnout |
— | 17,500 | — | ||||||
| Accrued job costs |
9,761 | 14,064 | 5,045 | ||||||
| Billings in excess of earnings |
5,995 | 9,621 | 5,484 | ||||||
| Derivative interest rate swap |
— | 6,450 | 3,408 | ||||||
| Accrued management fee |
2,422 | 4,592 | 5,673 | ||||||
| Deferred purchase price |
2,333 | — | — | ||||||
| Other |
2,708 | 5,677 | 11,652 | ||||||
| $ | 65,992 | $ | 118,954 | $ | 80,733 | ||||
(9) Long-Term Debt
(a) Long-term debt consisted of the following:
| December 31, | June 30, 2009 |
|||||||||||
| 2007 | 2008 | |||||||||||
| (Unaudited) | ||||||||||||
| InfrastruX Credit Facility: |
||||||||||||
| $309,000 term loan |
$ | 256,658 | $ | 251,127 | $ | 249,730 | ||||||
| $100,000 revolving line of credit |
4,000 | 5,000 | 27,000 | |||||||||
| Other obligations: |
||||||||||||
| Various equipment financing |
3,917 | 1,813 | 2,440 | |||||||||
| Total debt |
264,575 | 257,940 | 279,170 | |||||||||
| Less: current portion |
(4,801 | ) | (4,578 | ) | (3,750 | ) | ||||||
| Total long-term debt |
$ | 259,774 | $ | 253,362 | $ | 275,420 | ||||||
InfrastruX Credit Facility (originated 2006, amended 2007)
On May 8, 2006, the Company entered into a credit agreement with a group of banks providing financing to facilitate TPF’s purchase of InfrastruX and a line of credit to support working capital requirements. The credit agreement provided a first lien term loan of $150,000, a second lien term loan of $55,000 and a revolving credit facility of $70,000. The loans plus accrued interest of $1,264 were extinguished in November 2006. As a result of this extinguishment, the Company expensed $7,418 of deferred financing costs and $1,100 of prepayment penalties in November 2006.
In November 2006, the Company entered into a credit agreement with a group of banks (InfrastruX Credit Facility), providing a six year term loan B of up to $309,000, a $21,000 delayed draw loan subject to unutilized
F-29
Table of Contents
INFRASTRUX GROUP, INC.
Notes to Consolidated Financial Statements
For the period from January 1, 2006 to May 7, 2006,
for the period from May 8, 2006 (inception), to December 31, 2006,
for the years ended December 31, 2007 and 2008,
and the six months ended June 30, 2008 and 2009 (unaudited)
(In thousands of dollars, except par values, per share amounts and shares)
fees, and a five-year revolving line of credit of $100,000 with an interest rate of an ABR or Eurodollar rate at the Company’s option. ABR is a fluctuating interest rate equal to the higher of (a) the prime rate or (b) the sum of the Federal Funds Effective Rate most recently determined plus 0.5% per annum. Eurodollar rate means the applicable London interbank-offered rate (LIBOR) plus a margin of 3.3%. The term loan was established to refinance the debt used to fund the purchase of InfrastruX by TPF and to fund InfrastruX’s purchase of Hawkeye and its affiliates. The InfrastruX Credit Facility was amended in September 2007 when the Company secured changes to certain covenants.
The InfrastruX Credit Facility, as amended, contains restrictive covenants, including financial covenants to maintain an interest coverage ratio of not less than 2.25:1.00 based on information from the trailing four quarters; and to maintain a maximum total leverage ratio of 4.75:1.00, based on information from the trailing four quarters. The Company is required to be in compliance with these covenants on a quarterly basis. The Company’s ability to maintain compliance with these financial covenants depends on the Company’s operating performance, which could be impacted by the current economic downturn and the impact of that downturn upon the industries and customers the Company serves. In addition, the credit facility includes other customary restrictions including requirements to furnish audited financial statements, changes in the business, other indebtedness, liens, disposition of property, capital expenditures, use of proceeds, restricted payments and investments.
The term loan matures in November 2012 and requires monthly interest payments at LIBOR plus a margin of 4.3% (3.3% plus 1.0% per the amendment signed on September 28, 2007). The rate was 4.7% and 4.6% as of December 31, 2008 and June 30, 2009 (unaudited), respectively. The term loan requires quarterly principal payments. Excess cash flow payments, if required under the Credit Facility, are due within 120 days of year end. The term loan is secured by substantially all of the assets of the Company. The revolving line of credit matures in November 2011 and requires monthly interest payments with any outstanding principal balance due upon maturity, and is also secured by substantially all of the assets of the Company. The revolving line of credit was established to provide working capital flexibility and is available for loans and letters of credit. The letters of credit outstanding at any time shall not exceed $60,000. There was an outstanding balance of $4,000, $5,000 and $27,000 on the revolving line of credit as of December 31, 2007 and 2008, and June 30, 2009 (unaudited), respectively. Additionally, there were letters of credit outstanding of $25,915, $14,246 and $13,809 as of December 31, 2007 and 2008, and June 30, 2009 (unaudited), respectively. The total amount available for borrowing under the revolving line of credit was $70,085, $80,754 and $59,191 as of December 31, 2007 and 2008, and June 30, 2009 (unaudited), respectively. The Company has reclassified $753 of long-term debt to current portion for the required 2008 excess cash flow payment. The revolving credit facility is subject to commitment fees, which are paid on the unutilized portion of this line.
As part of the September 28, 2007 amendment process, a $50,000 equity contribution was made to InfrastruX and those proceeds, net of expenses, were immediately used to pay down the term loan principal balance, which resulted in the write off of $1,373 of unamortized deferred financing costs and third party fees, included in loss on modification of debt in the consolidated statements of operations. The amendment requires InfrastruX to pay a Supplemental Revolver Cash Amount of 1.3% per annum (1.0% per annum if and so long as the total leverage ratio is less than 4.75:1.00) on outstanding Revolver or Swing Loan borrowings and a Supplemental Term Loan Cash Amount of 0.8% per annum (0.5% per annum if and so long as the total leverage ratio is less than 4.75:1.00) on the outstanding term loan principal balance until the Company is back in
F-30
Table of Contents
INFRASTRUX GROUP, INC.
Notes to Consolidated Financial Statements
For the period from January 1, 2006 to May 7, 2006,
for the period from May 8, 2006 (inception), to December 31, 2006,
for the years ended December 31, 2007 and 2008,
and the six months ended June 30, 2008 and 2009 (unaudited)
(In thousands of dollars, except par values, per share amounts and shares)
compliance with its original covenants. Additionally, with respect to the term loan, the amendment requires InfrastruX to increase the outstanding principal balance by 0.5% per annum of the principal amount of the term loan by capitalizing this Supplemental Term Loan Deferred Fee Amount (Payment in Kind – PIK) at the time that the Supplemental Term Loan Cash Amount is paid. The total amount capitalized for the supplemental term loan deferred fee was $335, $1,628 and $2,259 as of December 31, 2007 and 2008, and June 30, 2009 (unaudited), respectively.
On May 8, 2009, the Company executed a consent and waiver agreement for the credit agreement related to its failure to provide audited financial statements issued within 120 days of year end. In exchange for the consent and waiver agreement, the Company paid a fee of $1,164.
The principal amounts of long-term debt maturities for the next five years at December 31, 2008 are as follows:
| Years ending December 31: |
|||
| 2009 |
$ | 4,578 | |
| 2010 |
2,993 | ||
| 2011 |
7,634 | ||
| 2012 |
242,735 | ||
| $ | 257,940 | ||
In October 2009, in connection with an amendment to its credit facilities, the Company determined that the issuance of a $50.0 million convertible note by InfrastruX Holdings, LLC to an affiliate of TPF (the proceeds of which were contributed to the Company as equity) as part of the September 2007 amendment to the Company’s credit facilities had constituted a default under such facilities. In connection with the amendment, this $50.0 million convertible note, along with $17.8 million in accrued interest, was converted into preferred equity interests in InfrastruX Holdings, LLC, and the default was waived by the lenders.
(b) Various Equipment Financing
The Company’s subsidiaries have entered into various long-term equipment financing agreements requiring monthly payments at interest rates ranging from 0.0% to 10.5%, which mature at various dates through May 2012. These loans are collateralized by the equipment and some are guaranteed by InfrastruX.
F-31
Table of Contents
INFRASTRUX GROUP, INC.
Notes to Consolidated Financial Statements
For the period from January 1, 2006 to May 7, 2006,
for the period from May 8, 2006 (inception), to December 31, 2006,
for the years ended December 31, 2007 and 2008,
and the six months ended June 30, 2008 and 2009 (unaudited)
(In thousands of dollars, except par values, per share amounts and shares)
(10) Lease Commitments
The Company has operating lease agreements for premises and equipment that expire on various dates, including building leases from related parties as discussed in Note 15. The terms of these agreements vary from lease to lease, including some that are subject to escalation clauses. The Company recognizes rent expense on a straight-line basis over the lease period. Rent expense related to operating leases consisted of the following:
| Predecessor | Successor | |||||||||||||||||||
| Period from January 1 to May 7, 2006 |
Period
from May 8 (inception) to December 31, 2006 |
Year Ended December 31, |
Six Months Ended June 30, | |||||||||||||||||
| 2007 | 2008 | 2008 | 2009 | |||||||||||||||||
| (Unaudited) | ||||||||||||||||||||
| Rent expense—cost of revenue |
$ | 6,693 | $ | 16,068 | $ | 36,800 | $ | 37,277 | $ | 17,733 | $ | 14,007 | ||||||||
| Rent expense—selling, general and administrative |
508 | 1,417 | 2,329 | 2,677 | 1,369 | 1,970 | ||||||||||||||
| Total rent expense |
$ | 7,201 | $ | 17,485 | $ | 39,129 | $ | 39,954 | $ | 19,102 | $ | 15,977 | ||||||||
Rent expense related to operating leases with terms greater than one year in duration was $8.2 million and $11.6 million for the years ended December 31, 2007 and 2008, respectively, and $7.6 million for the six months ended June 30, 2009. Rent expense related to operating leases with terms less than one year in duration was $30.9 million and $28.4 million for the years ended December 31, 2007 and 2008, respectively, and $8.4 million for the six months ended June 30, 2009.
The Company also has capital lease agreements for equipment with terms that vary from lease to lease.
Minimum future lease commitments under noncancelable operating leases, including the effect of certain renewal options and escalation clauses, and future minimum lease payments for capital leases in effect at December 31, 2008 are as follows:
| Operating leases |
Capital leases |
||||||
| Years ending December 31: |
|||||||
| 2009 |
$ | 15,168 | 10,923 | ||||
| 2010 |
11,745 | 2,064 | |||||
| 2011 |
8,437 | 769 | |||||
| 2012 |
7,400 | 831 | |||||
| 2013 |
5,617 | 37 | |||||
| Thereafter |
5,834 | — | |||||
| Total future minimum lease payments |
$ | 54,201 | 14,624 | ||||
| Less interest included in minimum capital lease payments |
(1,461 | ) | |||||
| Capital lease obligations |
13,163 | ||||||
| Less current portion |
(6,363 | ) | |||||
| Long-term portion of capital lease obligations |
$ | 6,800 | |||||
F-32
Table of Contents
INFRASTRUX GROUP, INC.
Notes to Consolidated Financial Statements
For the period from January 1, 2006 to May 7, 2006,
for the period from May 8, 2006 (inception), to December 31, 2006,
for the years ended December 31, 2007 and 2008,
and the six months ended June 30, 2008 and 2009 (unaudited)
(In thousands of dollars, except par values, per share amounts and shares)
InfrastruX has guaranteed the residual value on certain of its equipment leases. InfrastruX guarantees the difference between this residual value and the fair value of the underlying asset at the date of termination of the leases. The maximum aggregate guaranteed residual value was approximately $4,751, $9,025 and $7,930 as of December 31, 2007 and 2008, and June 30, 2009 (unaudited), respectively. InfrastruX believes that no significant payments will be made as a result of the difference between the fair value of the leased equipment and the guaranteed residual value. However, there can be no assurance that future significant payments will not be required.
(11) Income Taxes
The provision for income tax benefit consisted of the following:
| Predecessor | Successor | |||||||||||||||||
| Period from January 1 to May 7, 2006 |
Period from May 8 (inception) to December 31, 2006 |
Year Ended December 31, |
||||||||||||||||
| 2007 | 2008 | |||||||||||||||||
| Current provision (benefit): |
||||||||||||||||||
| Federal |
$ | (1,077 | ) | $ | 3,379 | $ | (3,230 | ) | $ | 8,495 | ||||||||
| State |
58 | 268 | 777 | 2,703 | ||||||||||||||
| Total current provision (benefit) |
(1,019 | ) | 3,647 | (2,453 | ) | 11,198 | ||||||||||||
| Deferred provision (benefit): |
||||||||||||||||||
| Federal |
665 | (3,530 | ) | (12,639 | ) | (21,887 | ) | |||||||||||
| State |
117 | (1,269 | ) | 716 | (3,339 | ) | ||||||||||||
| Total deferred provision (benefit) |
782 | (4,799 | ) | (11,923 | ) | (25,226 | ) | |||||||||||
| Total provision (benefit) for income taxes |
$ | (237 | ) | $ | (1,152 | ) | $ | (14,376 | ) | $ | (14,028 | ) | ||||||
F-33
Table of Contents
INFRASTRUX GROUP, INC.
Notes to Consolidated Financial Statements
For the period from January 1, 2006 to May 7, 2006,
for the period from May 8, 2006 (inception), to December 31, 2006,
for the years ended December 31, 2007 and 2008,
and the six months ended June 30, 2008 and 2009 (unaudited)
(In thousands of dollars, except par values, per share amounts and shares)
The following is a reconciliation of the difference between the amount of federal income tax computed by multiplying pre-tax book income by the statutory rate and the amount of federal income tax in the consolidated statements of operations. The most significant reconciling items are state income taxes and nondeductible expenses, comprised of nondeductible goodwill impairment charges and the cost to provide meals to company work crews. Reconciliations between the statutory federal income tax rate and the Company’s effective income tax rate were as follows:
| Predecessor | Successor | |||||||||||||
| Period from January 1 to May 7, 2006 |
Period from May 8 (inception) to December 31, 2006 |
Year Ended December 31, |
||||||||||||
| 2007 | 2008 | |||||||||||||
| Income tax at statutory rate |
35.0 | % | 34.0 | % | 35.0 | % | 35.0 | % | ||||||
| State income tax, net of federal expense |
(2.3 | ) | 21.2 | 3.8 | 3.7 | |||||||||
| Non deductible Goodwill impairment |
— | — | (5.0 | ) | (6.1 | ) | ||||||||
| Excess compensation limitation |
(8.9 | ) | — | — | — | |||||||||
| Nondeductible permanent differences—meals and entertainment |
(8.1 | ) | (11.0 | ) | (2.9 | ) | (3.1 | ) | ||||||
| State net operating loss valuation allowance |
(3.3 | ) | — | (6.5 | ) | (0.6 | ) | |||||||
| Other |
(3.9 | ) | (7.0 | ) | 1.2 | (1.2 | ) | |||||||
| 8.5 | % | 37.2 | % | 25.6 | % | 27.7 | % | |||||||
Deferred income taxes reflect the net tax effects of temporary differences between the carrying amount of assets and liabilities for financial reporting purposes and the amounts used for income tax purposes, net operating losses, and tax credit carryforwards. The tax effects of significant items comprising the Company’s net deferred tax assets and liabilities consisted of the following:
| December 31, | ||||||||
| 2007 | 2008 | |||||||
| Deferred tax assets: |
||||||||
| Goodwill |
$ | 6,292 | $ | 17,261 | ||||
| Net operating loss—state, foreign |
5,267 | 5,612 | ||||||
| Bonuses |
— | 7,308 | ||||||
| Capital lease obligations |
4,223 | 3,965 | ||||||
| Self insurance |
2,411 | — | ||||||
| Derivatives |
1,791 | 2,501 | ||||||
| Other |
2,923 | 8,128 | ||||||
| Total deferred tax asset |
22,907 | 44,775 | ||||||
| Less: valuation allowance state and foreign net operating losses |
(5,243 | ) | (5,588 | ) | ||||
| Net deferred tax asset |
17,664 | 39,187 | ||||||
F-34
Table of Contents
INFRASTRUX GROUP, INC.
Notes to Consolidated Financial Statements
For the period from January 1, 2006 to May 7, 2006,
for the period from May 8, 2006 (inception), to December 31, 2006,
for the years ended December 31, 2007 and 2008,
and the six months ended June 30, 2008 and 2009 (unaudited)
(In thousands of dollars, except par values, per share amounts and shares)
| December 31, | ||||||||
| 2007 | 2008 | |||||||
| Deferred tax liabilities: |
||||||||
| Property, plant, and equipment |
(24,433 | ) | (29,900 | ) | ||||
| Intangibles |
(22,338 | ) | (17,353 | ) | ||||
| Capital leases |
(5,732 | ) | (3,875 | ) | ||||
| Other |
(76 | ) | (3 | ) | ||||
| Deferred tax liability |
(52,579 | ) | (51,131 | ) | ||||
| Net deferred tax liability |
$ | (34,915 | ) | $ | (11,944 | ) | ||
In assessing deferred tax assets, the Company considers whether it is more likely than not that some portion or all of the deferred tax assets will not be realized. The ultimate realization of deferred tax assets is dependant upon the generation of future taxable income during the periods in which those temporary differences become deductible.
The Company analyzed its deferred tax assets and liabilities by significant jurisdiction and considered a number of factors, including both positive and negative evidence, in determining the realizability of its deferred tax assets. Most significantly, the Company’s taxable temporary differences are expected to reverse in the same periods as the Company’s deductible temporary differences. Based upon weighing the evidence available, the Company believes that, other than the state and foreign net operating loss (NOL) carryforwards discussed below, it is more likely than not that the deferred tax assets will be realized.
The Company had state and foreign net operating loss (NOL) carryforwards as of December 31, 2007 and 2008 of $5,267 and $5,612, respectively, for state and foreign income tax purposes. State losses expire in 2009 through 2028. Foreign losses are perpetual until utilized. A valuation allowance has been established due to the uncertainty of realizing these state and foreign NOL carryforwards. The valuation allowance, of approximately $5,243 and $5,588 as of December 31, 2007 and, 2008, respectively, was established for losses that may not be realizable due to uncertainty in future business operations in individual jurisdictions. For the years ended December 31, 2007 and 2008, the valuation allowance increased $4,036 and $345, respectively.
Additionally, restrictions imposed as a result of ownership changes, may limit the amount of state NOL carryforwards available to offset future taxable income in a given state. Planned future restructuring of foreign operations may limit the amount of foreign NOL carryforwards available to offset future taxable income in given nations.
Effective January 1, 2007, the Company adopted FIN 48, which prescribes the minimum recognition threshold a tax position is required to meet before being recognized in the financial statements. Upon adoption, there was no impact to retained earnings for the change in accounting principle. The total amount of unrecognized tax benefits, including interest and penalties, as of the date of adoption was $3,985. This gross liability was offset by a corresponding increase of $3,053 in a receivable resulting from an indemnification of tax liabilities by the Predecessor’s parent company and also an increase in a deferred tax asset of $932.
F-35
Table of Contents
INFRASTRUX GROUP, INC.
Notes to Consolidated Financial Statements
For the period from January 1, 2006 to May 7, 2006,
for the period from May 8, 2006 (inception), to December 31, 2006,
for the years ended December 31, 2007 and 2008,
and the six months ended June 30, 2008 and 2009 (unaudited)
(In thousands of dollars, except par values, per share amounts and shares)
Changes in the FIN 48 Liability for unrecognized tax benefits during 2007 and 2008 were as follows:
| Unrecognized tax benefits at January 1, 2007 |
$ | 3,702 | ||
| Gross increases—current period tax positions |
1,424 | |||
| Unrecognized tax benefits as of December 31, 2007 |
5,126 | |||
| Gross decreases—settlement of uncertain tax positions |
(5,126 | ) | ||
| Unrecognized tax benefits as of December 31, 2008 |
$ | — | ||
There are no tax benefits included in the balance of unrecognized tax benefits at December 31, 2007 or 2008 that, if recognized, would affect the effective tax rate. The Company’s policy is to classify interest accrued or penalties related to unrecognized tax benefits as a component of income tax expense. As of the balance sheet date of December 31, 2007 and 2008, the Company had an accrual included in the FIN 48 liability of approximately $519 of which $464 is indemnified and $0, respectively, for the payment of interest and penalties.
All federal and state tax years since inception remain open to examination by major taxing jurisdictions to which the Company is subject. The Company is indemnified by the Predecessor’s parent for tax liabilities incurred and unsettled prior to the acquisition date. At December 31, 2007, the Company anticipated a significant decrease in its unrecognized tax benefits within the next twelve months of $5,126 as a result of filing an accounting method change request with the Internal Revenue Service. At December 31, 2008, the Company does not anticipate a significant increase or decrease with respect to its unrecognized tax benefits within the next twelve months.
(12) Shareholders’ Equity—Predecessor Period
Common Stock and Preferred Stock
The Predecessor was authorized to issue 300,000,000 shares of common stock, of which 996,000 shares were issued and outstanding at a par value of $0.01 during the Predecessor period. In addition, the Predecessor was authorized to issue 23,388,500 shares of Series A convertible preferred stock, of which 22,888,500 shares were issued and outstanding at a par value of $0.01 during the Predecessor period.
The holders of Series A convertible preferred stock were entitled to vote together with the holders of common stock and are considered the same in regards to rights and privileges. The holders of Series A convertible preferred stock were entitled to the number of votes equal to the number of shares of common stock into which such holder’s shares are convertible.
Each share of Series A convertible preferred stock would have been automatically converted into one share of common stock, subject to certain potential adjustments, in the event of an initial public offering of the Predecessor’s common stock. Each share of Series A convertible preferred stock was convertible into common stock at any time at the option of the holder. In addition, each share of Series A convertible preferred stock could have been automatically converted into shares of common stock immediately upon the conversion of or vote to convert by the holders of a majority of the originally issued Series A convertible preferred stock.
F-36
Table of Contents
INFRASTRUX GROUP, INC.
Notes to Consolidated Financial Statements
For the period from January 1, 2006 to May 7, 2006,
for the period from May 8, 2006 (inception), to December 31, 2006,
for the years ended December 31, 2007 and 2008,
and the six months ended June 30, 2008 and 2009 (unaudited)
(In thousands of dollars, except par values, per share amounts and shares)
The holders of Series A convertible preferred stock were entitled to receive a cumulative dividend of 8.0% per annum on the then current liquidation value. Dividends were payable only when and if declared by the Predecessor board of directors. No dividends could have been paid to holders of common stock unless all accrued but unpaid dividends were first paid to the holders of preferred stock. No dividends were declared as of May 7, 2006.
In the event of liquidation, dissolution or winding up of the Predecessor, the holders of Series A convertible preferred stock would have been entitled to be paid out of any assets of the Predecessor legally available in amount equal to the greater of $4 per share plus all accrued and unpaid dividends or pro rata portion of the assets of the Predecessor available for distribution that the holders of Series A convertible preferred stock would be entitled to receive on as-converted basis together with the holders of common stock. If the assets of the Predecessor were insufficient to permit payment in full, the assets of the Predecessor available for distribution would have been distributed ratably among the holders of preferred stock in proportion to the full amount to which they would otherwise be entitled.
At the consummation of the merger, each share of Series A convertible preferred stock was converted into the right to receive a portion of the residual consideration from the paying agent.
Stock Option Plan
Under the Predecessor’s 2000 Stock Incentive Plan, the Predecessor had 3,862,500 shares of common stock authorized to be awarded to employees, directors, or consultants. Under the 2000 Stock Incentive Plan, the Predecessor grants incentive stock options and nonqualified stock options. Employees could have received incentive stock options to purchase shares of the Predecessor’s stock at a price not less than 100.0% of the fair value of the common stock on the date of grant. A 10.0% shareholder is generally eligible for stock options if the exercise price is at least 110.0% of the fair value of the stock on the date of grant. Generally, the stock options would have been subject to the Company’s first right of refusal and or rights on repurchase. All options had a term of 10.0 years or less from the date of grant. Generally, options granted vested at a 25.0% per year over a four year period commencing one year after the date of grant.
For the period from January 1, 2006 to May 7, 2006, the Predecessor granted no stock options, 5,000 options were cancelled and 138,500 options were vested. As of May 7, 2006, all outstanding vested options, totaling 2,372,064, and all unvested options, totaling 109,311, were cancelled.
On January 1, 2006, the Predecessor adopted SFAS No. 123R, Share-Based Payment (SFAS 123R), and elected to use the modified-prospective application method to transition to the new accounting standard. SFAS 123R requires that compensation costs related to share-based payment transactions be recognized in the financial statements. Measurement of the cost of employee service is based on the grant-date fair value of the equity or liability instrument issued. SFAS 123R also prescribes that estimated forfeitures of shares are to be included in the calculation of compensation expense. Under the modified-prospective transition method, compensation cost is recognized for the portion of outstanding awards for which the requisite service has not yet been rendered. The cost was being recognized over the period during which the employees are required to provide service.
The Predecessor has also applied the provisions of Staff Accounting Bulletin No. 107, issued by the SEC in March 2005, in it its adoption of SFAS 123R. The Predecessor utilizes the Black-Scholes option pricing model to
F-37
Table of Contents
INFRASTRUX GROUP, INC.
Notes to Consolidated Financial Statements
For the period from January 1, 2006 to May 7, 2006,
for the period from May 8, 2006 (inception), to December 31, 2006,
for the years ended December 31, 2007 and 2008,
and the six months ended June 30, 2008 and 2009 (unaudited)
(In thousands of dollars, except par values, per share amounts and shares)
estimate the fair value of the share-based compensation at the date of grant, which requires the use of accounting judgment and financial estimates, including estimates of the expected term option holders will retain their vested stock options before exercising them, the estimated volatility of the Predecessor’s stock price over the expected term, and the number of options that will be forfeited prior to the completion of their vesting requirements. The value of the portion of the award that is ultimately expected to vest is recognized as expense over the requisite service period on a straight line basis.
For the period from January 1, 2006 to May 7, 2006, the stock based compensation expense included in selling, general and administrative expenses in the consolidated statement of operations was $274 before provision for income taxes. As result, the Predecessor received an income tax benefit in the consolidated statement of operations of $23. The weighted average estimated fair value of options during the period from January 1 to May 7, 2006 was $5.00 per share using the following assumptions:
| Dividend yield |
— | |
| Risk-free interest rate |
4.3% | |
| Expected volatility |
70.0% | |
| Expected term |
7.0 years | |
| Forfeiture rate |
— | |
(13) Shareholders’ Equity—Successor Period
Share-Based Compensation Expense
(a) Overview
On December 12, 2007, the InfrastruX Board of Directors and Shareholder approved the adoption of the InfrastruX 2007 Equity Incentive Plan which reserved 5,400,000 shares for issuance. In January 2008, the Company granted 4,179,500 stock appreciation rights and restricted stock units to a number of employees within the organization as approved by the Board of Directors. In December 2008, the Company granted 582,500 of stock appreciation rights and restricted stock units to a number of employees within the organization as approved by the Board of Directors. Stock appreciation rights have a term of 10.0 years from the date of grant. The restricted stock units have a term of six months and one day following termination of service or a change in control of the Company. All stock appreciation rights and restricted stock units fully vest upon a change in control, or if the cumulative proceeds to TPF upon an exit event, including an initial public offering, equal or exceed 2 times its investment if such exit event is prior to May 8, 2010.
For the stock appreciation rights and restricted stock units issued in January 2008, 20.0% vested on the date of grant, 20.0% vested in May 2008 and 20.0% vest per year thereafter over the next three year period commencing one year after May 2008. For the stock appreciation rights of 42,500 issued in December 2008, 20.0% vested on the date of grant and 20.0% vest per year thereafter over the next four year period commencing one year after the grant date. The remaining stock appreciation rights and restricted stock units of 540,000 issued in December 2008, they follow the vesting schedule of the grants issued in January 2008, except 40.0% vested upon issuance.
F-38
Table of Contents
INFRASTRUX GROUP, INC.
Notes to Consolidated Financial Statements
For the period from January 1, 2006 to May 7, 2006,
for the period from May 8, 2006 (inception), to December 31, 2006,
for the years ended December 31, 2007 and 2008,
and the six months ended June 30, 2008 and 2009 (unaudited)
(In thousands of dollars, except par values, per share amounts and shares)
Once vested, each holder of a stock appreciation right is entitled to the positive difference or spread, if any, between the base price and the fair market value of a share of common stock of the Company on the date of exercise. Upon exercise the spread will be paid in whole shares of the Company’s common stock with a fair market value equal to the spread.
The holders of restricted stock units are not entitled to receive dividends nor share the same rights and privileges as the holders of common stock. Once vested, each holder of a restricted stock unit is entitled to receive the same number of common shares of the Company.
The Company recorded expense related to its share-based compensation plans of $4,308 for the year ended December 31, 2008, $3,176 for the six months ended June 30, 2008 (unaudited) and $888 for the six months ended June 30, 2009 (unaudited). As of December 31, 2008 and June 30, 2009 (unaudited), there were 898,500 and 948,500, respectively, shares available for future issuance under the Company’s share-based compensation plan.
(b) Stock Appreciation Rights
For purposes of determining compensation expense for stock appreciation right awards, the fair value of each stock appreciation right award is estimated on the date of grant using the Black-Scholes option pricing model. The key assumptions used in the Black-Scholes model for stock appreciation rights granted were as follows:
| Year ended December 31, 2008 | ||
| Dividend yield |
— | |
| Risk-free interest rate |
1.7% – 3.1% | |
| Expected volatility |
48.0% – 56.0% | |
| Expected term |
5.8 – 6.0 years |
The dividend yield assumption is based on the Company’s current intent not to declare or issue dividends. The risk-free interest rate is based on the U.S. Treasury rate for the expected term of the award at the time of grant. The Company’s expected volatility is based on the average volatilities of peer companies. The Company is using the “simplified method” to calculate expected terms of the awards as allowed under the provisions of SAB 107 and SAB 110, which represents the period of time that stock appreciation rights granted are expected to be outstanding.
F-39
Table of Contents
INFRASTRUX GROUP, INC.
Notes to Consolidated Financial Statements
For the period from January 1, 2006 to May 7, 2006,
for the period from May 8, 2006 (inception), to December 31, 2006,
for the years ended December 31, 2007 and 2008,
and the six months ended June 30, 2008 and 2009 (unaudited)
(In thousands of dollars, except par values, per share amounts and shares)
A summary of stock appreciation rights activity consisted of the following:
| Stock appreciation rights |
Weighted average base price |
Weighted average remaining life (years) |
Aggregate intrinsic value | ||||||||
| Stock appreciation rights outstanding, December 31, 2007 |
— | $ | — | ||||||||
| Granted |
4,434,900 | 3.53 | |||||||||
| Forfeited |
(150,000 | ) | 3.53 | ||||||||
| Expired unexercised |
(100,000 | ) | 3.53 | ||||||||
| Stock appreciation rights outstanding, December 31, 2008 |
4,184,900 | 3.53 | 9.0 | $ | 7,160 | ||||||
| Forfeited |
(30,000 | ) | 3.53 | ||||||||
| Expired unexercised |
(20,000 | ) | 3.53 | ||||||||
| Stock appreciation rights outstanding, June 30, 2009 (unaudited) |
4,134,900 | 3.53 | 8.6 | 5,830 | |||||||
| Stock appreciation rights vested December 31, 2008 |
1,665,460 | 3.53 | 9.0 | 2,849 | |||||||
| Stock appreciation rights exercisable, December 31, 2008 |
— | — | — | — | |||||||
| Stock appreciation rights vested June 30, 2009 (unaudited) |
2,463,940 | 3.53 | 8.7 | 3,474 | |||||||
| Stock appreciation rights exercisable, June 30, 2009 (unaudited) |
2,463,940 | 3.53 | 8.7 | 3,474 | |||||||
The weighted average grant-date fair value of stock appreciation rights granted during fiscal 2008 was $1.71. As of December 31, 2008, there was $3,217 of unrecognized compensation expense related to outstanding stock appreciation rights which is expected to be recognized over a weighted average period of 2.4 years. As of June 30, 2009 (unaudited), there was $2,447 of unrecognized compensation expense related to outstanding stock appreciation rights which is expected to be recognized over a weighted average period of 1.9 years.
(c) Other Share-Based Compensation
A summary of nonvested restricted stock units’ activity consisted of the following:
| Restricted stock units |
Weighted average grant-date fair value | |||||
| Nonvested shares, December 31, 2007 |
— | $ | — | |||
| Granted |
327,100 | 3.52 | ||||
| Vested |
(130,840 | ) | 3.52 | |||
| Forfeited |
(10,500 | ) | 3.53 | |||
| Nonvested shares, December 31, 2008 |
185,760 | 3.52 | ||||
| Vested |
(61,920 | ) | 3.52 | |||
| Nonvested shares, June 30, 2009 |
123,840 | $ | 3.52 | |||
F-40
Table of Contents
INFRASTRUX GROUP, INC.
Notes to Consolidated Financial Statements
For the period from January 1, 2006 to May 7, 2006,
for the period from May 8, 2006 (inception), to December 31, 2006,
for the years ended December 31, 2007 and 2008,
and the six months ended June 30, 2008 and 2009 (unaudited)
(In thousands of dollars, except par values, per share amounts and shares)
As of December 31, 2008 and June 30, 2009 (unaudited) there was $484 and $367, respectively, of unrecognized compensation expense related to nonvested restricted stock which is expected to be recognized over a weighted average period of 2.4 years and 1.9 years, respectively. The total grant date fair value of shares vested during the year ended December 31, 2008 and June 30, 2009 (unaudited) was $460 and $218, respectively.
(14) Other, net
Other, net in other (income) expense consisted of the following:
| Predecessor | Successor | |||||||||||||||||||||||
| Period from January 1 to May 7, 2006 |
Period from May 8 (inception) to December 31, 2006 |
Year Ended December 31, |
Six Months Ended June 30, |
|||||||||||||||||||||
| 2007 | 2008 | 2008 | 2009 | |||||||||||||||||||||
| (Unaudited) | ||||||||||||||||||||||||
| Financing costs (Note 9) and bank fees |
$ | — | $ | 1,750 | $ | 2,569 | $ | 2,839 | $ | 1,377 | $ | 1,586 | ||||||||||||
| Other (income) expense |
(11 | ) | (46 | ) | 296 | 1 | (5 | ) | (35 | ) | ||||||||||||||
| Other, net |
$ | (11 | ) | $ | 1,704 | $ | 2,865 | $ | 2,840 | $ | 1,372 | $ | 1,551 | |||||||||||
(15) Related-Party Transactions
The Company leases a number of facilities from certain of its subsidiaries’ former owners, many of whom continue to be employed by the Company in senior management positions of operating units. Related-party rent expense is recorded in selling, general and administrative expenses and consisted of the following:
| Predecessor | Successor | |||||||||||||||||||
| Period from January 1 to May 7, 2006 |
Period from May 8 (inception) to December 31, 2006 |
Year Ended December 31, |
Six Months Ended June 30, | |||||||||||||||||
| 2007 | 2008 | 2008 | 2009 | |||||||||||||||||
| (Unaudited) | ||||||||||||||||||||
| Related-party rent expense |
$ | 467 | $ | 915 | $ | 1,811 | $ | 2,117 | $ | 1,063 | $ | 1,095 | ||||||||
The Company on occasion provides services to companies owned or operated by certain of its subsidiaries’ former owner, whom continues to be employed by the Company in a senior management position of operating units. Related-party service income is recorded in revenues and consisted of the following:
| Predecessor | Successor | |||||||||||||||||||
| Period from January 1 to May 7, 2006 |
Period from May 8 (inception) to December 31, 2006 |
Year Ended December 31, |
Six Months Ended June 30, | |||||||||||||||||
| 2007 | 2008 | 2008 | 2009 | |||||||||||||||||
| (Unaudited) | ||||||||||||||||||||
| Related-party service income |
$ | — | $ | 59 | $ | 726 | $ | 766 | $ | 400 | $ | 1,017 | ||||||||
F-41
Table of Contents
INFRASTRUX GROUP, INC.
Notes to Consolidated Financial Statements
For the period from January 1, 2006 to May 7, 2006,
for the period from May 8, 2006 (inception), to December 31, 2006,
for the years ended December 31, 2007 and 2008,
and the six months ended June 30, 2008 and 2009 (unaudited)
(In thousands of dollars, except par values, per share amounts and shares)
From time to time, the Company employs the services of a related parties’ subcontractor who performs services the Company itself cannot perform. These services fees are expensed in cost of revenues and consisted of the following:
| Predecessor | Successor | |||||||||||||||||||
| Period from January 1 to May 7, 2006 |
Period from May 8 (inception) to December 31, 2006 |
Year Ended December 31, |
Six Months Ended June 30, | |||||||||||||||||
| 2007 | 2008 | 2008 | 2009 | |||||||||||||||||
| (Unaudited) | ||||||||||||||||||||
| Related-party service fee expense |
$ | 218 | $ | 970 | $ | 1,202 | $ | 1,162 | $ | 823 | $ | 194 | ||||||||
The Company also accrued fees payable to Tenaska Capital Management LLC pursuant to a Management Agreement for assistance it provides in banking relationships, customer relationships, and industry knowledge. These management fees, reflecting a $2,000 annual fee plus interest, consisted of the following:
| Predecessor | Successor | |||||||||||||||||||
| Period from January 1 to May 7, 2006 |
Period from May 8 (inception) to December 31, 2006 |
Year Ended December 31, |
Six Months Ended June 30, | |||||||||||||||||
| 2007 | 2008 | 2008 | 2009 | |||||||||||||||||
| (Unaudited) | ||||||||||||||||||||
| Management fees |
$ | — | $ | 1,290 | $ | 2,422 | $ | 2,170 | $ | 1,083 | $ | 1,081 | ||||||||
These management fees are recorded in selling, general and administrative expenses and the interest is recorded in interest expense.
Pursuant to the Company’s Credit Agreement, as amended (Note 9), payment of these fees is deferred. The total amount due, including accrued interest, to Tenaska Capital Management LLC as of December 31, 2007 and 2008, and June 30, 2009 (unaudited) was $2,422, $4,592, and $5,673, respectively and is included in the other current liabilities (Note 8) on the Company’s balance sheet.
(16) Commitments and Contingencies
Litigation
The Company is from time to time a party to legal proceedings and claims that arise in the ordinary course of business. With respect to all such lawsuits, claims and proceedings, management records reserves when it is probable that a liability has been incurred and the amount of the loss can be reasonably estimated. Management does not believe that any of these proceedings, separately or in the aggregate, would be expected to have a material adverse effect on the Company’s consolidated financial results.
In March 2007, InfrastruX’s subsidiary, B&H, and two of its employees were indicted by a federal grand jury for alleged bid-rigging related to alleged incidents prior to the acquisition of the Company on May 8, 2006. The Predecessor’s sellers had provided the Company indemnification up to an aggregate amount of $15,000 to cover legal costs and certain other costs and other adverse financial impacts the Company’s B&H subsidiary
F-42
Table of Contents
INFRASTRUX GROUP, INC.
Notes to Consolidated Financial Statements
For the period from January 1, 2006 to May 7, 2006,
for the period from May 8, 2006 (inception), to December 31, 2006,
for the years ended December 31, 2007 and 2008,
and the six months ended June 30, 2008 and 2009 (unaudited)
(In thousands of dollars, except par values, per share amounts and shares)
could incur as a result of this matter. In April 2008, the Predecessor’s sellers renegotiated the terms of the indemnification agreement with the Company. The Company agreed to receive a settlement payment from the Predecessor’s sellers in the amount of $6,812 in exchange for terminating the indemnification agreement and for the Company assuming full responsibility for these matters.
On June 19, 2008, the jury, sitting in the Federal District Court for Colorado, returned unanimous verdicts of not guilty as to B&H and both individuals on all counts. In November 2008, the Company received a letter from Department of Justice confirming this case was closed for these matters. Upon the receipt of the letter, the Company determined these matters closed. Upon the Company’s assessments, the Company recognized a total reduction of legal expenses in selling, general and administrative expenses of $4,253, which was the settlement payment of $6,812 less the specified legal costs of $2,559.
Performance Bonds
In certain circumstances, the Company is required to provide performance bonds in connection with its contractual commitments. The Company has a surety bond program that is supported by letters of credit and the total surety amount of outstanding performance bonds was $88,402, $74,527 and $67,225 at December 31, 2007 and 2008, and June 30, 2009 (unaudited), respectively. InfrastruX estimates that the actual amount of work still to be completed on jobs covered by these performance bonds was $34,208, $26,130 and $25,160 as of December 31, 2007 and 2008, and June 30, 2009 (unaudited), respectively.
(17) Subsequent Events
In October 2009, the Company finalized an amendment to its credit facilities as it was in default of certain specified covenants as of September 30, 2009 in addition to the covenant default since September 2007 as discussed at Note 9. As part of the October 2009 amendment, selected financial covenants were changed and/or modified for a specified period of time. These covenant defaults were waived through September 30, 2009 in connection with the amended agreement. In connection with the amendment, the Company incurred arrangement and amendment fees, as well as legal fees and expenses, in the aggregate amount of $2.8 million and will be subject to increased interest rates, limited borrowing restrictions under the revolving line of credit and modified covenants over the term of the agreement which has a final maturity date of November 2012. Due to the change in terms associated with the amendment, the Company’s April 2009 interest rate swap no longer qualifies as an effective hedge as of September 30, 2009 and thus changes in fair value of that swap will be reflected through interest expense on the consolidated statement of operations.
In connection with the amendment to the credit facilities, the TPF loan to InfrastruX Holdings, LLC and accrued interest were converted to preferred interests in InfrastruX Holdings, LLC, and the Company issued and InfrastruX Holdings, LLC acquired 20,000 shares, or 100%, of the Company’s 15% Senior Redeemable Convertible Cumulative Preferred Stock (such preferred shares were pledged as collateral under our credit facilities) for an aggregate purchase price of $20,000.
The Company has evaluated subsequent events and transactions for potential recognition or disclosure in the financial statements through November 12, 2009, the day the financial statements were issued.
F-43
Table of Contents
The Board of Directors
InfrastruX Group, Inc.:
We have audited the accompanying consolidated statements of operations, members’ equity, and cash flows of Hawkeye, LLC and subsidiaries for the period from January 1, 2006 through November 2, 2006. These consolidated financial statements are the responsibility of the Company’s management. Our responsibility is to express an opinion on these consolidated financial statements based on our audit.
We conducted our audit in accordance with auditing standards generally accepted in the United States of America. Those standards require that we plan and perform the audit to obtain reasonable assurance about whether the financial statements are free of material misstatement. An audit includes consideration of internal control over financial reporting as a basis for designing audit procedures that are appropriate in the circumstances, but not for the purpose of expressing an opinion on the effectiveness of the Company’s internal control over financial reporting. Accordingly, we express no such opinion. An audit also includes examining, on a test basis, evidence supporting the amounts and disclosures in the financial statements, assessing the accounting principles used and significant estimates made by management, as well as evaluating the overall financial statement presentation. We believe that our audit provides a reasonable basis for our opinion.
In our opinion, the consolidated financial statements referred to above present fairly, in all material respects, the results of operations and cash flows of Hawkeye, LLC and subsidiaries for the period from January 1, 2006 through November 2, 2006 in conformity with U.S. generally accepted accounting principles.
/s/ KPMG LLP
Seattle, Washington
August 10, 2009
F-44
Table of Contents
Consolidated Statement of Operations
Period from January 1, 2006 to November 2, 2006
(In thousands of dollars)
| Revenues |
$ | 168,469 | ||
| Cost of revenues |
143,391 | |||
| Gross profit |
25,078 | |||
| Selling, general and administrative expenses |
14,044 | |||
| Operating income |
11,034 | |||
| Other (income) expense: |
||||
| Interest expense |
2,143 | |||
| Other, net |
(8 | ) | ||
| Net income |
$ | 8,899 | ||
See accompanying notes to consolidated financial statements.
F-45
Table of Contents
Consolidated Statement of Members’ Equity
Period from January 1, 2006 to November 2, 2006
(In thousands of dollars)
| Balance at December 31, 2005 |
$ | 26,479 | ||
| Members’ distribution |
(5,744 | ) | ||
| Net income |
8,899 | |||
| Other comprehensive income: |
||||
| Unrealized gain on marketable equity securities |
77 | |||
| Comprehensive income |
8,976 | |||
| Balance at November 2, 2006 |
$ | 29,711 | ||
See accompanying notes to consolidated financial statements.
F-46
Table of Contents
Consolidated Statement of Cash Flows
Period from January 1, 2006 to November 2, 2006
(In thousands of dollars)
| Cash flows from operating activities: |
||||
| Net income |
$ | 8,899 | ||
| Adjustments to reconcile net income to net cash provided by operating activities: |
||||
| Depreciation and amortization |
7,079 | |||
| Amortization of debt issuance costs |
110 | |||
| Bad debt expense |
238 | |||
| Unrealized loss on derivative |
72 | |||
| Changes in assets and liabilities, net of effects of acquisition: |
||||
| Accounts receivable, net |
1,232 | |||
| Inventories |
(1,270 | ) | ||
| Prepaid expenses and other current assets |
(2,314 | ) | ||
| Accounts payable |
3,606 | |||
| Other current liabilities |
383 | |||
| Net cash provided by operating activities |
18,035 | |||
| Cash flows from investing activities: |
||||
| Capital expenditures |
(3,296 | ) | ||
| Acquisition of Bemis Line Construction Company, Inc. |
(1,636 | ) | ||
| Net cash used in investing activities |
(4,932 | ) | ||
| Cash flows from financing activities: |
||||
| Proceeds from revolving line of credit |
35,178 | |||
| Payments of debt issuance costs |
(165 | ) | ||
| Payments on revolving line of credit |
(39,019 | ) | ||
| Payments on long term debt—equipment financing |
(2,299 | ) | ||
| Payments on capital lease obligations |
(3,063 | ) | ||
| Members’ distribution |
(615 | ) | ||
| Net cash used in financing activities |
(9,983 | ) | ||
| Net increase in cash |
3,120 | |||
| Cash and cash equivalents: |
||||
| Beginning of year |
1,844 | |||
| End of year |
$ | 4,964 | ||
| Supplemental disclosures of noncash investing and financing activities: |
||||
| Noncash investing and financing activities: |
||||
| Assets acquired with capital lease obligations |
$ | 8,363 | ||
| Assets acquired with vendor debt |
1,828 | |||
| Distribution to members |
5,129 | |||
| Cash paid for interest |
2,521 |
See accompanying notes to consolidated financial statements.
F-47
Table of Contents
Notes to Consolidated Financial Statements
Period from January 1, 2006 to November 2, 2006
(In thousands)
(1) The Company and Summary of Significant Accounting Policies
Hawkeye, LLC (the Company) provides design, construction, maintenance, engineering and other infrastructure services to the utility industry. The Company primarily operates in the northeastern region of the United States.
(a) Consolidation and Basis of Presentation
The consolidated financial statements include the accounts of the Company and its wholly owned subsidiaries. All intercompany accounts and transactions have been eliminated in consolidation.
(b) Use of Estimates
The preparation of the consolidated financial statements in conformity with accounting principles generally accepted in the United States of America requires management to make estimates and assumptions that affect the amounts reported in the consolidated financial statements. Actual results could differ from these estimates.
(c) Revenue Recognition
The Company recognizes the majority of its revenues for services performed in accordance with American Institute of Certified Public Accountants Statement of Position 81-1, Accounting for Performance of Construction-Type and Certain Production-Type Contracts (SOP 81-1). Revenues generated from short-term projects (often with durations of less than one month) are performed under Master Service Arrangements or MSAs, which typically are billed on a unit-price basis and, less commonly, on a time-and-materials basis. The Company recognizes revenues for unit-based services on an output basis as units are completed. Revenues for the services performed on a time-and-materials basis are recognized as labor hours are incurred and services are performed.
Revenues for certain of the larger and longer duration projects, which tend to be performed on a fixed-price basis, are recognized based on percentage-of-completion accounting, using the cost-to-cost method. Under this method, revenue is recognized based on the ratio of estimated cost incurred to total estimated cost to complete the project. These costs include, but are not limited to, all direct material, labor and subcontract costs and indirect costs related to contract performance such as indirect labor, supplies, tools, repairs and depreciation. The Company records changes in its percent complete computations in the period in which the revisions are determined. Provisions for the total estimated losses on uncompleted projects are made in the period in which such losses are determined to be probable and can be reasonably estimated. If actual results significantly differ from estimates used for revenue recognition, the Company’s financial condition and results of operations could be materially impacted.
The Company also generates some revenues from providing certain services that do not result in the construction of a tangible asset and are accounted for as service transactions. These revenues are recognized as the services are performed and amounts are earned in accordance with SEC Staff Accounting Bulletin (SAB) 104, Revenue Recognition. The Company considers amounts to be earned once evidence of an arrangement has been obtained, services are delivered, fees are fixed or determinable, and collectibility is reasonably assured.
Unbilled revenues represent amounts earned and recognized in the period for which billings are issued in a subsequent period and are included in unbilled receivables. Unearned revenues represent amounts billed in excess of costs and estimated earnings and are included in other liabilities.
F-48
Table of Contents
HAWKEYE, LLC
Notes to Consolidated Financial Statements
Period from January 1, 2006 to November 2, 2006
(In thousands)
(d) Allowance for Doubtful Accounts
The Company provides an allowance for doubtful accounts when collection of an account receivable is considered doubtful, and receivables are written off against the allowance when deemed uncollectible. The Company reviews the adequacy of the reserves on a regular basis. Inherent in the assessment of the allowance for doubtful accounts are certain judgments and estimates including, among others, the customer’s access to capital, the customer’s willingness or ability to pay, general economic conditions, and the ongoing relationship with the customer.
For the period from January 1, 2006 to November 2, 2006, the provision for bad debts included in selling, general and administrative expense in the consolidated statement of operations was $238.
(e) Concentration of Risk
The Company maintains accounts receivable balances in the normal course of business for companies primarily in the utility industry or supporting the utility industry. For the period from January 1, 2006 to November 2, 2006, five customers accounted for 69.7% of total revenues.
The Company also maintains a cash collateral and receivable balance for its comprehensive insurance coverage with a major insurer to support its obligations.
In addition, approximately 51.5% of the Company’s hourly employees are represented by various unions and collective bargaining agreements. The Company does not directly negotiate with unions, but instead is represented by assorted contractor associations. Current collective bargaining agreements have varying terms depending on the union and are renewed as necessary.
(f) Cash and Cash Equivalents
Cash and cash equivalents represent cash on deposit with financial institutions. At times, bank balances may exceed federally insured limits.
(g) Marketable Equity Securities
The Company maintains a portfolio of domestic equity securities. The securities are carried at fair value, and the unrealized gains and losses are reported in members’ equity under the caption “Other comprehensive income.” Realized gains and losses are included in “Other, net” in the consolidated statement of operations.
(h) Small Tools Inventory
Small tools inventory, which is stated at the lower of cost or market, primarily consists of small tools and other construction related equipment. The Company evaluates inventory regularly and provides an allowance for obsolete inventory based on a detailed review of inventory quantities, aging, and expected usage.
F-49
Table of Contents
HAWKEYE, LLC
Notes to Consolidated Financial Statements
Period from January 1, 2006 to November 2, 2006
(In thousands)
(i) Property and Equipment
Property and equipment are stated at cost. Depreciation of property and equipment is provided using the straight-line method for financial reporting purposes at rates based on the following estimated useful lives:
| Machinery and equipment |
3.0 – 8.0 years | |||||||
| Office furniture and equipment |
4.0 – 7.0 years | |||||||
| Buildings |
39.0 years | |||||||
| Leasehold improvements |
Lesser of life of lease or useful life | |||||||
| Equipment under capital lease |
Lesser of life of lease or useful life | |||||||
Equipment under capital leases is stated at the lower of the present value of minimum lease payments or fair value and is depreciated on a straight-line basis over the estimated useful life of the asset or the lease term. Expenditures for refurbishment and improvements that extend the useful life of an asset are capitalized. Expenditures for normal repairs and maintenance are charged to expense as incurred.
For the period from January 1, 2006 to November 2, 2006, depreciation expense, including amortization for assets under capital leases, was $7,079.
(j) Goodwill
Statement of Financial Accounting Standards (SFAS) No. 142, Goodwill and Other Intangible Assets (SFAS 142), provides that goodwill and other intangible assets that have indefinite useful lives not be amortized but, instead, must be tested at least annually for impairment. SFAS 142 also provides specific guidance for testing goodwill and other nonamortized intangible assets for impairment. The first step compares the fair value of a reporting unit to its carrying amount, including goodwill. If the carrying amount of a reporting unit exceeds its fair value, the second step is then performed. The second step compares the carrying amount of the reporting unit’s goodwill to the implied fair value of the goodwill. If the fair value of the goodwill is less than the carrying amount, an impairment loss would be recorded in income from operations.
The Company performs an annual impairment test, and the Company will test for impairment between annual tests if an event occurs or circumstances change that would more likely than not reduce the fair value of a reporting unit below its carrying amount. Examples of such events or circumstances may include a significant change in business climate, loss of a significant customer or a loss of key personnel, among others. SFAS 142 requires that the Company make certain estimates and assumptions in order to allocate goodwill to reporting units and to determine the fair value of reporting unit net assets and liabilities, including, among other things, an assessment of market conditions, projected cash flows and the cost of capital growth rates, which could significantly impact the reported value of goodwill. In estimating reporting unit fair values, the Company utilizes an income approach. Under the income approach, the Company discounts the reporting unit’s expected cash flows based on a discount rate the Company determined to be consistent with industry discount rates and the risks inherent in the Company’s current business model. For the period from January 1, 2006 to November 2, 2006, there were no goodwill impairments recorded.
(k) Long-Lived Assets
The Company reviews its long-lived assets for impairment if events or changes in circumstances indicate that the carrying value of such assets may not be recoverable, as required by SFAS No. 144, Accounting for the Impairment or Disposal of Long-Lived Assets. If an evaluation is required, the estimated future undiscounted
F-50
Table of Contents
HAWKEYE, LLC
Notes to Consolidated Financial Statements
Period from January 1, 2006 to November 2, 2006
(In thousands)
cash flows associated with the asset are compared to the asset’s carrying amount to determine if an impairment of such asset is necessary. The effect of any impairment would be to expense the difference between the fair value of such asset and its carrying value.
(l) Litigation
The Company is from time to time a party to legal proceedings and claims that arise in the ordinary course of business. With respect to all such lawsuits, claims and proceedings, management records reserves when it is probable that a liability has been incurred and the amount of the loss can be reasonably estimated. Management does not believe that any of these proceedings, separately or in the aggregate, would be expected to have a material adverse effect on the Company’s consolidated financial results.
(m) Income Taxes
The Company is a limited liability company. Therefore, the Company’s taxable income is reported by the Company’s members on the members’ income tax returns. Accordingly, there is no provision for federal or state income taxes herein.
(n) Insurance
The Company is insured for workers’ compensation, employer’s liability and general liability claims, and auto liability claims. Losses are accrued based upon the Company’s estimates of the ultimate liability for claims incurred (including an estimate of claims incurred but not reported), with assistance from third-party actuaries. These insurance liabilities are difficult to assess and estimate due to unknown factors, including the severity of an injury, the determination of the Company’s liability in proportion to other parties and the number of incidents not reported. The accruals are based upon known facts and historical trends.
(2) Acquisition
On April 14, 2006, the Company acquired the operating assets and other rights relating to Bemis Line Construction Company, Inc.’s (Bemis) operations. The transaction was accounted for as an acquisition under the purchase method of accounting in accordance with SFAS No. 141, Business Combinations. The Company acquired Bemis in order to expand its presence in the northeastern region of the United States. The results of Bemis have been included in the consolidated financial statements since the acquisition date. The aggregate purchase price of $1,636 was paid in cash.
The following table summarizes the estimated fair value of assets acquired at the date of acquisition:
| Final purchase price allocation | |||
| Property and equipment |
$ | 1,225 | |
| Prepaid expenses and other current assets |
1 | ||
| Goodwill |
410 | ||
| Total assets acquired |
$ | 1,636 | |
F-51
Table of Contents
HAWKEYE, LLC
Notes to Consolidated Financial Statements
Period from January 1, 2006 to November 2, 2006
(In thousands)
(3) Loan Agreements
In June 2005, the Company entered into a $28,000 credit agreement with a financial institution providing borrowings up to $18,000 through a revolving credit facility and $10,000 through a term loan facility, which is to be used for business acquisitions. In August 2006, the Company amended the agreement with the financial institution and increased the revolving credit facility borrowings to $29,000. In addition, the amended agreement increased the $3,000 letters of credit maximums to $4,000. In connection with the issuance of the agreements, the Company paid fees in the amount of $564, of which $399 was paid in June 2005 and the remaining $165 was paid in August 2006. These fees are being amortized over the life of the agreements. The credit agreements are due on the earlier of June 10, 2007 or a change in control of the Company.
The revolving credit facility accrues interest at the higher of LIBOR plus 2.0% or the Federal Funds Rate or Prime less 50 basis points. The term loan facility accrues interest at the higher of LIBOR plus 2.5% or the Federal Funds Rate plus 25 basis points or Prime plus 25 basis points. The interest rate on the credit agreement at November 2, 2006 was 7.3%. The Company was required to comply with certain covenants in connection with its credit agreement. As of November 2, 2006, the Company was in compliance with these debt covenants.
The Company has entered into various long-term equipment financing agreements requiring monthly payments at interest rates ranging from 0.0% to 10.8%, which mature at various dates through April 2011. These financing agreements are collateralized by the equipment.
(4) Commitments and Contingencies
The Company leases its office space, vacant land, equipment and automobiles under operating leases that expire at various dates through 2018. The Company also has capital lease agreements for equipment and automobiles with terms that vary from lease to lease that expire at various dates through 2012. The Company’s corporate headquarters in Hauppauge, New York, and vacant land in Yaphank, New York, are leased from companies partially or wholly owned by the President and Member of the Company. Future minimum lease commitments under noncancelable operating leases and future minimum lease payments for capital leases in effect at November 2, 2006 were as follows:
| Operating leases |
Capital leases |
||||||
| Years ending December 31: |
|||||||
| From November 3, 2006 to December 31, 2006 |
$ | 326 | 514 | ||||
| 2007 |
2,418 | 4,951 | |||||
| 2008 |
2,265 | 3,984 | |||||
| 2009 |
1,558 | 3,946 | |||||
| 2010 |
1,199 | 1,433 | |||||
| 2011 |
1,107 | 518 | |||||
| Thereafter |
7,345 | 758 | |||||
| Total future minimum lease payments |
$ | 16,218 | 16,104 | ||||
| Less interest included in minimum capital lease payments |
(2,070 | ) | |||||
| Capital lease obligations |
14,034 | ||||||
| Less current portion |
(4,128 | ) | |||||
| Long-term portion of capital lease obligations |
$ | 9,906 | |||||
F-52
Table of Contents
HAWKEYE, LLC
Notes to Consolidated Financial Statements
Period from January 1, 2006 to November 2, 2006
(In thousands)
For the period from January 1, 2006 to November 2, 2006, rent expense of $6,967 related to operating leases and month-to-month rentals for equipment and automobiles was included in cost of revenues in the consolidated statement of operations.
The Company’s rent expense for office space for the period from January 1, 2006 to November 2, 2006 was $849. Included in the rent expense was a reduction of $718 for rental income for subleases. Expected future minimum rental income under the operating subleases is $153, $720, $75, $77, $79, $82 and $55 for the period from November 3, 2006 to December 31, 2006, for the years ended December 31, 2007, 2008, 2009, 2010, 2011 and thereafter, respectively.
(5) Related-Party Transactions
Future minimum rental payments payable by the Company, as included in Note 4, under the operating leases to the companies partially or wholly owned by the President and Member of the Company are $84, $1,001, $1,001, $1,001, $1,001, $1,001 and $7,008 for the period from November 3, 2006 to December 31, 2006, for the years ended December 31, 2007, 2008, 2009, 2010, 2011 and thereafter, respectively. For the period from January 1, 2006 to November 2, 2006, total rent expense for operating leases to the companies partially or wholly owned by the President and Member of the Company was $1,227. Included in the total rent expense in the amount of $392 is a month-to-month lease related to the companies partially or wholly owned by the President and Member of the Company.
For the period from January 1, 2006 to November 2, 2006, as the manager of the Greenport Power Plant (HEG), which is owned by a company controlled by the President and Member of the Company, the Company charged HEG a fee of $417 for services rendered. The fees are included in revenues in the accompanying statement of operations. The Company provides direct labor support on an as-needed basis to aid in the operations of HEG. Such charges are included in revenues and total $84 for the period from January 1, 2006 to November 2, 2006.
In September 2006, the Company made a distribution to its President and Members totaling $5,129, which excludes cash distributed of $615. The distribution included the net of a building, land, the forgiveness by the Company of related party receivables due from its President and Members, the forgiveness of certain related party payables and a mortgage payable by its Members. The mortgage payable balance at the time of the distribution was $2,625. Interest expense on the mortgage payable for the period from January 1, 2006 to November 2, 2006 was $165 and was netted against interest income of $165 earned on a related party receivable from the Company’s President and Members.
(6) Subsequent Event
On November 3, 2006, the Company was acquired by InfrastruX Group, Inc. for an aggregate purchase price of $143,545. In connection with the acquisition, the Company paid outstanding amounts owed under the revolving credit facility in full.
F-53
Table of Contents
Table of Contents
PART II
INFORMATION NOT REQUIRED IN PROSPECTUS
Item 13. Other Expenses of Issuance and Distribution.
The expenses, other than underwriting commissions, we expect to incur in connection with the issuance and distribution of the securities being registered under this Registration Statement are estimated to be as follows:
| Type |
Amount | |||
| Securities and Exchange Commission Registration Fee |
$ | 16,182 | ||
| Financial Industry Regulatory Authority, Inc. Filing Fee |
29,500 | |||
| New York Stock Exchange Fee |
* | |||
| Printing and Engraving Expenses |
* | |||
| Legal Fees and Expenses |
* | |||
| Accounting Fees and Expenses |
* | |||
| Transfer Agent and Registrar Fees |
* | |||
| Miscellaneous Expenses |
* | |||
| Total |
$ | * | ||
| * | To be filed by amendment. |
Item 14. Indemnification of Directors and Officers.
Sections 23B.08.500 through 23B.08.600 of the Washington Business Corporation Act, or WBCA, authorize a court to award, or a corporation’s board of directors to grant, indemnification to directors and officers on terms sufficiently broad to permit indemnification under certain circumstances for liabilities arising under the Securities Act of 1933, as amended (the “Securities Act”). The directors and officers of the registrant also may be indemnified against liability they may incur for serving in that capacity pursuant to a liability insurance policy maintained by the registrant for this purpose.
Section 23B.08.320 of the WBCA authorizes a corporation to limit a director’s liability to the corporation or its shareholders for monetary damages for acts or omissions as a director, except in certain circumstances involving intentional misconduct, knowing violations of law or illegal corporate loans or distributions, or any transaction from which the director personally receives a benefit in money, property or services to which the director is not legally entitled. The registrant plans to amend and restate its articles of incorporation (to be filed by amendment as Exhibit 3.1 hereto) and bylaws (to be filed by amendment as Exhibit 3.2 hereto) to contain provisions for implementing, to the fullest extent permitted by Washington law, these limitations on a director’s liability to the registrant and its shareholders.
The registrant expects to enter into certain indemnification agreements with its directors and certain of its officers, the form of which is to be filed by amendment as Exhibit 10.1 to this registration statement. The indemnification agreements will provide the registrant’s directors and certain of its officers with indemnification to the maximum extent permitted by the WBCA.
The underwriting agreement (to be filed by amendment as Exhibit 1.1 hereto) provides for indemnification by the registrant of the underwriters for certain liabilities, including liabilities arising under the Securities Act.
Item 15. Recent Sales of Unregistered Securities.
The following information relates to all securities issued by the registrant since January 1, 2006 and not registered under the Securities Act. There were no underwriters employed in connection with any of the transactions set forth in this Item 15.
II-1
Table of Contents
On May 6, 2006, the registrant issued 45,748,000 shares of its common stock to InfrastruX Holdings, LLC, the registrant’s parent, in connection with the TPF Acquisition. Total consideration paid for this acquisition was $282.1 million. The issuance of such shares was conducted in reliance upon the available exemptions from the registration requirements of the Securities Act, including those contained in Section 4(2), on the basis that such transactions did not involve a public offering.
In December 2006, the registrant issued 3,202,360 shares of its common stock to InfrastruX Holdings, LLC in connection with the transfer of its contributed interest in Halpin Line Construction. Total consideration paid for this issuance was $11.2 million. The issuance of such shares was conducted in reliance upon the available exemptions from the registration requirements of the Securities Act, including those contained in Section 4(2), on the basis that such transactions did not involve a public offering.
In October 2009, the registrant issued 20,000 shares of its 15% Senior Redeemable Convertible Cumulative Preferred Stock to InfrastruX Holdings, LLC in connection with the October 2009 amendment to the registrant’s credit facilities. Total consideration paid for this issuance was $20.0 million. The issuance of such shares was conducted in reliance upon the available exemptions from the registration requirements of the Securities Act, including those contained in Section 4(2), on the basis that such transactions did not involve a public offering.
Since January 1, 2006, the registrant has issued 4,434,900 stock appreciation rights to employees with a base value of $3.53 per stock appreciation right. The issuances of such stock appreciation rights were conducted in reliance upon the available exemptions from the registration requirements of the Securities Act, including those contained in Rule 701 promulgated under Section 3(b), which relates to exemptions for offers and sales of securities pursuant to certain compensatory benefit plans.
Since January 1, 2006, the registrant has issued 327,100 restricted stock units to employees representing 327,100 shares of its common stock. The issuances of such restricted stock units were conducted in reliance upon the available exemptions from the registration requirements of the Securities Act, including those contained in Rule 701 promulgated under Section 3(b), which relates to exemptions for offers and sales of securities pursuant to certain compensatory benefit plans.
Item 16. Exhibits and Financial Statement Schedules.
See “Exhibit Index.”
Item 17. Undertakings.
The undersigned hereby undertakes as follows:
(a) For purposes of determining any liability under the Securities Act of 1933, the information omitted from the form of prospectus filed as part of this registration statement in reliance upon Rule 430A and contained in a form of prospectus filed by the registrant pursuant to Rule 424(b)(1) or (4) or 497(h) under the Securities Act of 1933 shall be deemed to be part of this Registration Statement as of the time it was declared effective; and
(b) For the purpose of determining any liability under the Securities Act of 1933, each post-effective amendment that contains a form of prospectus shall be deemed to be a new registration statement relating to the securities offered therein, and the offering of such securities at that time shall be deemed to be the initial bona fide offering thereof.
(c) The undersigned will provide to the underwriters at the closing specified in the underwriting agreement, certificates in such denominations and registered in such names as required by the underwriters to permit prompt delivery to each purchaser.
II-2
Table of Contents
Insofar as indemnification for liabilities arising under the Securities Act of 1933 may be permitted to directors, officers and controlling persons of the registrant pursuant to the foregoing provisions, or otherwise, the registrant has been advised that in the opinion of the Securities and Exchange Commissions such indemnification is against public policy as expressed in the Securities Act of 1933 and is, therefore, unenforceable. In the event that a claim for indemnification against such liabilities (other than the payment by the registrant of expenses incurred or paid by a director, officer or controlling person of the registrant in the successful defense of any action, suite or proceeding) is asserted by such director, officer or controlling person in connection with the securities being registered, the registrant will, unless in the opinion of its counsel the matter has been settled by controlling precedent, submit to a court of appropriate jurisdiction the question whether such indemnification by it is against public policy as expressed in the Securities Act of 1933 and will be governed by the final adjudication of such issue.
II-3
Table of Contents
SIGNATURES
Pursuant to the requirements of the Securities Act of 1933, as amended, the registrant has duly caused this Amendment No. 2 to the Registration Statement to be signed on its behalf by the undersigned, thereunto duly authorized, in the City of Seattle, State of Washington, on this 12th day of November, 2009.
| INFRASTRUX GROUP, INC. | ||
| By: |
/S/ LANNY H. MICHAEL | |
| Lanny H. Michael | ||
| Chief Financial Officer | ||
Pursuant to the requirements of the Securities Act of 1933, as amended, this Amendment No. 2 to the Registration Statement has been signed by the following persons in the capacities indicated on this 12th day of November, 2009.
| Name |
Title | |
| * Michael T. Lennon |
President, Chief Executive Officer and Director (Principal Executive Officer) | |
| /S/ LANNY H. MICHAEL Lanny H. Michael |
Chief Financial Officer (Principal Financial Officer) | |
| * Craig S. Eudy |
Chief Accounting Officer (Principal Accounting Officer) | |
| * Paul G. Smith |
Director | |
| * Alan B. Levande |
Director | |
| * Daniel E. Lonergan |
Director | |
| *By: |
/S/ LANNY H. MICHAEL | |||
| Lanny H. Michael | ||||
| Attorney-in-fact | ||||
II-4
Table of Contents
EXHIBIT INDEX
| Exhibit |
Exhibit Description | |
| 1.1* | Underwriting Agreement. | |
| 2.1* | LLC Membership Interest Purchase Agreement, dated as of November 3, 2006, by and among Registrant, William J. Haugland, Hawkeye Group LLC and InfrastruX Hawkeye Holdings, LLC. Portions of this exhibit have been omitted pursuant to a request for confidential treatment submitted to the Securities and Exchange Commission. | |
| 3.1* | Amended and Restated Articles of Incorporation of Registrant. | |
| 3.2* | Amended and Restated Bylaws of Registrant. | |
| 3.3 | Articles of Amendment to the Articles of Incorporation Containing the Statement of Rights and Preferences of the 15% Senior Redeemable Convertible Cumulative Preferred Stock of Registrant. | |
| 4.1* | Form of Common Stock Certificate. | |
| 4.2* | Registration Rights Agreement, dated as of , between Registrant and InfrastruX Holdings, LLC. | |
| 5.1* | Opinion of Stoel Rives LLP. | |
| 10.1* | Form of Indemnity Agreement. | |
| 10.2** | Credit Agreement, dated as of November 3, 2006, among Registrant, as Borrower, the Other Credit Parties party thereto, the Lenders party thereto, as Lenders, and Credit Suisse, Cayman Islands Branch, as an Issuing Bank, the Swing Line Lender and the Administrative Agent. | |
| 10.3** | First Amendment to Credit Agreement, dated as of September 28, 2007, among Registrant, as Borrower, the Other Credit Parties party thereto, the Lenders party thereto, as Lenders, and Credit Suisse, Cayman Islands Branch, as an Issuing Bank, the Swing Line Lender and the Administrative Agent. | |
| 10.4** | Second Amendment to Credit Agreement, dated as of September 30, 2009, among Registrant, as Borrower, the Other Credit Parties party thereto, the Lenders party thereto, as Lenders, and Credit Suisse, Cayman Islands Branch, as an Issuing Bank, the Swing Line Lender and the Administrative Agent. | |
| 10.5** | Security and Pledge Agreement, dated November 3, 2006, among Registrant, as Borrower, InfrastruX Holdings LLC, certain domestic subsidiaries of Registrant, as Subsidiary Guarantors, and Credit Suisse, Cayman Islands Branch, as Administrative Agent for holders of the Secured Obligations. | |
| 10.6** | Master Services Agreement, dated June 12, 2008, between Registrant and Oncor Electric Delivery Company LLC. Portions of this exhibit have been omitted pursuant to a request for confidential treatment submitted to the Securities and Exchange Commission. The omitted information has been filed separately with the Securities and Exchange Commission. | |
| 10.7** | 2007 Equity Incentive Plan. | |
| 10.8** | Form Restricted Stock Unit Award Agreement. | |
| 10.9** | Form Stock Appreciation Rights Agreement. | |
| 10.10** | Form Long Term Incentive Bonus Agreement. | |
| 10.11** | Stockholders Agreement, dated as of December 12, 2007, between Registrant, InfrastruX Holdings, LLC and certain management stockholders party thereto. | |
| 10.12** | Employment Agreement, dated as of May 8, 2006, between Registrant and Michael T. Lennon. | |
| 10.13** | Employment Agreement, dated as of July 11, 2008, between Registrant and Richard Schwartz. | |
II-5
Table of Contents
| Exhibit |
Exhibit Description | |
| 10.14** | Amendment to Employment Agreement, dated as of December 31, 2008, between Registrant and Richard Schwartz. | |
| 10.15** | Employment Agreement, dated as of May 2, 2009, between Registrant and Lanny H. Michael. | |
| 10.16** | Employment Agreement, dated as of July 14, 2009, between Registrant and Stanley B. Klimberg. | |
| 10.17** | Employment Agreement, dated as of May 8, 2006, between Registrant and Douglas Madison. | |
| 10.18** | Amendment to Employment Agreement, dated as of December 31, 2008, between Registrant and Douglas Madison. | |
| 10.19** | Non-Competition/Non-Solicitation/Non-Disclosure Agreement, dated as of May 5, 2006, between Registrant and John Higgins. | |
| 10.20** | Compensation and Severance Agreement, dated as of November 30, 2006, between Registrant and John Higgins. | |
| 10.21** | Severance Agreement, dated as of November 20, 2008, between Registrant and John Higgins. | |
| 10.22** | Amendment to Compensation and Severance Agreement, dated as of December 31, 2008, between Registrant and John Higgins. | |
| 10.23** | Non-Competition/Non-Solicitation/Non-Disclosure Agreement, dated as of June 23, 2009, between Registrant and Craig S. Eudy. | |
| 10.24** | Amended and Restated Management Agreement, dated November 3, 2006, between Registrant and Tenaska Capital Management, LLC. | |
| 21.1** | List of Subsidiaries. | |
| 23.1 | Consent of KPMG LLP | |
| 23.2 | Consent of KPMG LLP | |
| 23.3 | Consent of Stoel Rives LLP (included in Exhibit 5.1). | |
| 24.1** | Power of Attorney (see page II-3 of this Registration Statement). | |
| * | To be filed by amendment. |
| ** | Previously filed. |
II-6