Attached files
Table of Contents
UNITED STATES
SECURITIES AND EXCHANGE COMMISSION
WASHINGTON, DC 20549
FORM 10-Q
| x | QUARTERLY REPORT PURSUANT TO SECTION 13 OR 15(d) OF THE SECURITIES EXCHANGE ACT OF 1934 |
For the Period Ended September 30, 2009
OR
| ¨ | TRANSITION REPORT PURSUANT TO SECTION 13 OR 15(d) OF THE SECURITIES EXCHANGE ACT OF 1934 |
Commission File Number 000-51274
THE FRONTIER FUND
FRONTIER DIVERSIFIED SERIES; FRONTIER DYNAMIC SERIES; FRONTIER LONG/SHORT
COMMODITY SERIES; FRONTIER MASTERS SERIES
BALANCED SERIES; CAMPBELL/GRAHAM/TIVERTON SERIES; CURRENCY SERIES; LONG
ONLY COMMODITY SERIES; MANAGED FUTURES INDEX SERIES; WINTON SERIES;
WINTON/GRAHAM SERIES
(Exact Name of Registrant as specified in its Charter)
| Delaware | 36-6815533 | |
| (State of Organization) | (IRS Employer Identification No.) |
c/o Equinox Fund Management, LLC
1660 Lincoln Street, Suite 100
Denver, Colorado 80264
(Address of Principal Executive Offices)
(303) 837-0600
(Registrant’s Telephone Number)
Securities to be registered pursuant to Section 12(b) of the Act: None
Securities registered pursuant to Section 12(g) of the Act:
Frontier Diversified Series Class 1, Class 2 and Class 3 Units;
Frontier Dynamic Series Class 1, Class 2 and Class 3 Units;
Frontier Long/Short Commodity Series Class 1, Class 2, Class 3, Class 1a, Class 2a and Class 3a Units;
Frontier Masters Series Class 1, Class 2 and Class 3 Units;
Balanced Series Class 1, Class 2, Class 3, Class 1a, Class 2a and Class 3a Units;
Campbell/Graham/Tiverton Series Class 1, Class 2 and Class 3 Units;
Currency Series Class 1, Class 2 and Class 3 Units;
Long Only Commodity Series Class 1, Class 2 and Class 3 Units;
Managed Futures Index Series Class 1, Class 2 and Class 3 Units
Winton Series Class 1, Class 2 and Class 3 Units;
Winton/Graham Series Class 1, Class 2 and Class 3 Units
Indicate by check mark whether the registrant: (1) has filed all reports required to be filed by Section 13 or 15(d) of the Securities Exchange Act of 1934 during the preceding 12 months (or for such shorter period that the registrant was required to file such reports), and (2) has been subject to such filing requirements for the past 90 days. Yes x No ¨
Indicate by check mark whether the registrant has submitted electronically and posted on its corporate Web site, if any, every Interactive Data File required to be submitted and posted pursuant to Rule 405 of Regulation S-T (§232.405 of this chapter) during the preceding 12 months (or for such shorter period that the registrant was required to submit and post such files) Yes ¨ No ¨
Indicate by check mark whether the registrant is a large accelerated filer, an accelerated filer, a non-accelerated filer, or a smaller reporting company. See the definitions of “large accelerated filer,” “accelerated filer” and “smaller reporting company” in Rule 12b-2 of the Exchange Act.
| Large Accelerated Filer | ¨ | Accelerated Filer | ¨ | |||
| Non-Accelerated Filer | x (Do not check if a smaller reporting company) | Smaller reporting company | ¨ | |||
Indicate by check mark whether the registrant is a shell company (as defined in Rule 12b-2 of the Exchange Act). Yes ¨ No x
Table of Contents
2
Table of Contents
Special Note About Forward-Looking Statements
THIS REPORT CONTAINS STATEMENTS WHICH CONSTITUTE FORWARD-LOOKING STATEMENTS WITHIN THE MEANING OF THE PRIVATE SECURITIES LITIGATION REFORM ACT OF 1995 AND OTHER FEDERAL SECURITIES LAWS. THESE FORWARD-LOOKING STATEMENTS REFLECT THE MANAGING OWNER’S CURRENT EXPECTATIONS ABOUT THE FUTURE RESULTS, PERFORMANCE, PROSPECTS AND OPPORTUNITIES OF THE TRUST. THE MANAGING OWNER HAS TRIED TO IDENTIFY THESE FORWARD-LOOKING STATEMENTS BY USING WORDS SUCH AS “MAY,” “WILL,” “EXPECT,” “ANTICIPATE,” “BELIEVE,” “INTEND,” “SHOULD,” “ESTIMATE” OR THE NEGATIVE OF THOSE TERMS OR SIMILAR EXPRESSIONS. THESE FORWARD-LOOKING STATEMENTS ARE BASED ON INFORMATION CURRENTLY AVAILABLE TO THE MANAGING OWNER AND ARE SUBJECT TO A NUMBER OF RISKS, UNCERTAINTIES AND OTHER FACTORS, BOTH KNOWN, SUCH AS THOSE DESCRIBED IN THE “RISK FACTORS” SECTION UNDER ITEM 1A AND ELSEWHERE IN THIS REPORT, AND UNKNOWN, THAT COULD CAUSE THE TRUST’S ACTUAL RESULTS, PERFORMANCE, PROSPECTS OR OPPORTUNITIES TO DIFFER MATERIALLY FROM THOSE EXPRESSED IN, OR IMPLIED BY, THESE FORWARD-LOOKING STATEMENTS.
YOU SHOULD NOT PLACE UNDUE RELIANCE ON ANY FORWARD-LOOKING STATEMENTS. EXCEPT AS EXPRESSLY REQUIRED BY THE FEDERAL SECURITIES LAWS, THE MANAGING OWNER UNDERTAKES NO OBLIGATION TO PUBLICLY UPDATE OR REVISE ANY FORWARD-LOOKING STATEMENTS OR THE RISKS, UNCERTAINTIES OR OTHER FACTORS DESCRIBED HEREIN, AS A RESULT OF NEW INFORMATION, FUTURE EVENTS OR CHANGED CIRCUMSTANCES OR FOR ANY OTHER REASON AFTER THE DATE OF THIS REPORT.
UNLESS EXPRESSLY STATED OTHERWISE, ALL INFORMATION IN THIS REPORT IS AS OF SEPTEMBER 30, 2009, AND THE MANAGING OWNER UNDERTAKES NO OBLIGATION TO UPDATE THIS INFORMATION.
3
Table of Contents
PART I. FINANCIAL INFORMATION
| ITEM 1. | Financial Statements |
Statements of Financial Condition
September 30, 2009 and December 31, 2008
| Frontier Diversified Series (1) | Frontier Dynamic Series (1) | Frontier Long/Short Commodity Series | ||||||||||||||||
| 9/30/2009 | 12/31/2008 | 9/30/2009 | 12/31/2008 | 9/30/2009 | 12/31/2008 | |||||||||||||
| (Unaudited) | (Unaudited) | (Unaudited) | ||||||||||||||||
| ASSETS | ||||||||||||||||||
| Cash and cash equivalents |
$ | 14,790,336 | $ | — | $ | 699,529 | $ | — | $ | 1,353,178 | $ | — | ||||||
| U.S. Treasury securities, at fair value |
5,260,038 | — | 3,019,383 | — | 8,886,927 | 10,554,571 | ||||||||||||
| Custom time deposits |
25,157,828 | — | 14,441,173 | — | 42,504,591 | 42,008,320 | ||||||||||||
| Certificates of deposit |
— | — | — | — | — | 10,923,009 | ||||||||||||
| Receivable from futures commission merchants |
— | — | — | — | 47,198,942 | — | ||||||||||||
| Open trade equity |
— | — | — | — | — | 10,753,763 | ||||||||||||
| Swap contracts |
10,036,654 | — | 11,401,259 | — | — | — | ||||||||||||
| Investments in unconsolidated trading companies |
1,856,353 | — | — | — | 1,233,271 | — | ||||||||||||
| Prepaid service fees—Class 1 |
95,813 | — | 4,402 | — | 76,347 | 266,272 | ||||||||||||
| Interest receivable |
24,060 | — | 13,811 | — | 40,649 | 159,949 | ||||||||||||
| Receivable from related parties |
25,254 | — | — | — | — | 9,162 | ||||||||||||
| Other assets |
— | — | 640 | — | — | 11,333 | ||||||||||||
| Total Assets |
$ | 57,246,336 | $ | — | $ | 29,580,197 | $ | — | $ | 101,293,905 | $ | 74,686,379 | ||||||
| LIABILITIES & OWNERS’ CAPITAL | ||||||||||||||||||
| LIABILITIES |
||||||||||||||||||
| Payable to other Series |
$ | — | $ | — | $ | — | $ | — | $ | — | $ | 4,856,404 | ||||||
| Payable to futures commission merchants |
— | — | — | — | — | 1,508,493 | ||||||||||||
| Open trade deficit |
— | — | — | — | 5,707,759 | — | ||||||||||||
| Inter-series payables |
34,826,151 | — | 29,126,036 | — | — | — | ||||||||||||
| Pending owner additions |
2,773,181 | — | 8,000 | — | 20,500 | 129,636 | ||||||||||||
| Owner redemptions payable |
— | — | — | — | 28,717 | — | ||||||||||||
| Incentive fees payable to Managing Owner |
85,313 | — | — | — | 309,053 | 39,178 | ||||||||||||
| Management fees payable to Managing Owner |
17,273 | — | — | — | 162,510 | 21,889 | ||||||||||||
| Interest fees payable to Managing Owner |
11,600 | — | 6,205 | — | 15,062 | 329 | ||||||||||||
| Trading fees payable to Managing Owner |
69,241 | — | 37,714 | — | 17,909 | 2,699 | ||||||||||||
| Trailing service fees payable to Managing Owner |
191 | — | — | — | 50,917 | 5,319 | ||||||||||||
| Payables to related parties |
2,133 | — | — | — | 19,001 | 249,809 | ||||||||||||
| Other liabilities |
7,139 | — | 7,364 | — | 2,327 | 16,172 | ||||||||||||
| Total Liabilities |
37,792,222 | — | 29,185,319 | — | 6,333,755 | 6,829,928 | ||||||||||||
| OWNERS’ CAPITAL |
||||||||||||||||||
| Non-Controlling Interests |
— | — | — | — | 27,712,627 | 10,124,156 | ||||||||||||
| Managing Owner Units—Class 1 |
27,212 | — | 26,553 | — | — | — | ||||||||||||
| Managing Owner Units—Class 1a |
— | — | — | — | 27,108 | — | ||||||||||||
| Managing Owner Units—Class 2 |
177,305 | — | 26,699 | — | 1,047,337 | 933,708 | ||||||||||||
| Managing Owner Units—Class 2a |
— | — | — | — | 27,249 | — | ||||||||||||
| Limited Owner Units—Class 1 |
10,448,019 | — | 225,822 | — | 45,829,180 | 46,525,406 | ||||||||||||
| Limited Owner Units—Class 1a |
— | — | — | — | 305,087 | — | ||||||||||||
| Limited Owner Units—Class 2 |
8,801,578 | — | 115,804 | — | 13,546,448 | 10,273,181 | ||||||||||||
| Limited Owner Units—Class 2a |
— | — | — | — | 260,437 | — | ||||||||||||
| Limited Owner Units—Class 3 |
— | — | — | — | 6,204,677 | — | ||||||||||||
| Total Owners’ Capital |
19,454,114 | — | 394,878 | — | 94,960,150 | 67,856,451 | ||||||||||||
| Total Liabilities and Owner’s Capital |
$ | 57,246,336 | $ | — | $ | 29,580,197 | $ | — | $ | 101,293,905 | $ | 74,686,379 | ||||||
| Units Outstanding |
||||||||||||||||||
| Class 1 |
105,862 | — | 2,614 | — | 415,810 | 463,448 | ||||||||||||
| Class 1a |
N/A | N/A | N/A | N/A | 3,370 | N/A | ||||||||||||
| Class 2 |
90,237 | — | 1,468 | — | 119,056 | 102,552 | ||||||||||||
| Class 2a |
N/A | N/A | N/A | N/A | 2,903 | N/A | ||||||||||||
| Class 3 |
N/A | N/A | N/A | N/A | 50,618 | N/A | ||||||||||||
| Net Asset Value per Unit |
||||||||||||||||||
| Class 1 |
$ | 98.95 | N/A | $ | 96.56 | $ | — | $ | 110.22 | $ | 100.39 | |||||||
| Class 1a |
N/A | N/A | N/A | N/A | $ | 98.57 | N/A | |||||||||||
| Class 2 |
$ | 99.50 | N/A | $ | 97.09 | $ | — | $ | 122.58 | $ | 109.28 | |||||||
| Class 2a |
N/A | N/A | N/A | N/A | $ | 99.09 | N/A | |||||||||||
| Class 3 |
N/A | N/A | N/A | N/A | $ | 122.58 | N/A | |||||||||||
| (1) | The Frontier Diversified Series and Frontier Dynamic Series began trading operations on June 9, 2009 |
The accompanying notes are an integral part of these statements.
4
Table of Contents
The Frontier Fund
Statements of Financial Condition
September 30, 2009 and December 31, 2008
| Frontier Masters Series (1) | Balanced Series | Campbell/Graham/Tiverton Series | ||||||||||||||||
| 9/30/2009 | 12/31/2008 | 9/30/2009 | 12/31/2008 | 9/30/2009 | 12/31/2008 | |||||||||||||
| (Unaudited) | (Unaudited) | (Unaudited) | ||||||||||||||||
| ASSETS | ||||||||||||||||||
| Cash and cash equivalents |
$ | 4,761,984 | $ | — | $ | 6,778,642 | $ | 17,181,551 | $ | 2,183,680 | $ | 4,943,881 | ||||||
| U.S. Treasury securities, at fair value |
3,459,933 | — | 25,209,114 | 43,042,540 | 10,280,937 | 9,371,661 | ||||||||||||
| Custom time deposits |
16,548,246 | — | 120,570,714 | 104,125,017 | 49,171,895 | 39,748,693 | ||||||||||||
| Certificates of deposit |
— | — | — | 34,091,481 | — | 12,866,065 | ||||||||||||
| Receivable from futures commission merchants |
— | — | 46,467,881 | 37,015,384 | — | 5,221,709 | ||||||||||||
| Open trade equity |
— | — | 24,770,538 | 23,149,527 | — | — | ||||||||||||
| Swap contracts |
9,636,598 | — | 51,300,320 | 53,072,356 | — | — | ||||||||||||
| Investments in unconsolidated trading companies |
1,204,624 | — | 39,610,131 | 19,528,370 | 21,036,365 | 8,559,112 | ||||||||||||
| Inter-series receivables |
— | — | 104,726,495 | 14,679,460 | — | — | ||||||||||||
| Prepaid service fees—Class 1 |
39,470 | — | 1,057,623 | 793,431 | 138,616 | 180,639 | ||||||||||||
| Interest receivable |
15,826 | — | 115,307 | 492,171 | 47,025 | 112,684 | ||||||||||||
| Receivable from related parties |
6,192 | — | 135,686 | 213,555 | 1,376 | — | ||||||||||||
| Other assets |
— | — | 962 | 55,234 | 748 | — | ||||||||||||
| Total Assets |
$ | 35,672,873 | $ | — | $ | 420,743,413 | $ | 347,440,077 | $ | 82,860,642 | $ | 81,004,444 | ||||||
| LIABILITIES & OWNERS’ CAPITAL | ||||||||||||||||||
| LIABILITIES |
||||||||||||||||||
| Open trade deficit |
$ | — | $ | — | $ | — | $ | — | $ | — | $ | 111,526 | ||||||
| Inter-series payables |
27,683,889 | — | — | — | — | — | ||||||||||||
| Pending owner additions |
1,047,160 | — | — | 1,966,385 | — | 136,277 | ||||||||||||
| Owner redemptions payable |
— | — | 588,662 | 287,672 | 40,887 | — | ||||||||||||
| Incentive fees payable to Managing Owner |
— | — | 1,075,207 | 1,857,583 | 205,702 | 488,067 | ||||||||||||
| Management fees payable to Managing Owner |
34,521 | — | 100,975 | 16,398 | 130,668 | 25,665 | ||||||||||||
| Interest fees payable to Managing Owner |
7,146 | — | 211,451 | 63,212 | 76,539 | 16,616 | ||||||||||||
| Trading fees payable to Managing Owner |
44,792 | — | 81,078 | 21,319 | 21,274 | 5,334 | ||||||||||||
| Trailing service fees payable to Managing Owner |
271 | — | 248,181 | 60,329 | 89,325 | 23,635 | ||||||||||||
| Payables to related parties |
146 | — | — | 14,451 | — | 27,118 | ||||||||||||
| Other liabilities |
1,801 | — | 1,928 | 139,642 | 547 | 14,050 | ||||||||||||
| Total Liabilities |
28,819,726 | — | 2,307,482 | 4,426,991 | 564,942 | 848,288 | ||||||||||||
| OWNERS’ CAPITAL |
||||||||||||||||||
| Non-Controlling Interests |
— | — | 16,211,186 | 9,330,079 | — | 2,391,227 | ||||||||||||
| Managing Owner Units—Class 1 |
27,037 | — | — | — | — | — | ||||||||||||
| Managing Owner Units—Class 1a |
— | — | — | 224 | — | — | ||||||||||||
| Managing Owner Units—Class 2 |
42,234 | — | 4,066,733 | 3,612,130 | 295,021 | 302,878 | ||||||||||||
| Managing Owner Units—Class 2a |
— | — | 149,502 | 120,378 | — | — | ||||||||||||
| Limited Owner Units—Class 1 |
4,246,584 | — | 302,366,242 | 256,550,829 | 71,804,566 | 69,957,155 | ||||||||||||
| Limited Owner Units—Class 1a |
— | — | 10,129,451 | 8,135,941 | — | — | ||||||||||||
| Limited Owner Units—Class 2 |
2,537,292 | — | 81,511,366 | 63,497,532 | 10,196,113 | 7,504,896 | ||||||||||||
| Limited Owner Units—Class 2a |
— | — | 3,335,654 | 1,765,973 | — | — | ||||||||||||
| Limited Owner Units—Class 3a |
— | — | 665,797 | — | — | — | ||||||||||||
| Total Owners’ Capital |
6,853,147 | — | 418,435,931 | 343,013,086 | 82,295,700 | 80,156,156 | ||||||||||||
| Total Liabilities and Owner’s Capital |
$ | 35,672,873 | $ | — | $ | 420,743,413 | $ | 347,440,077 | $ | 82,860,642 | $ | 81,004,444 | ||||||
| Units Outstanding |
||||||||||||||||||
| Class 1 |
43,468 | — | 2,469,306 | 2,049,590 | 681,952 | 632,847 | ||||||||||||
| Class 1a |
N/A | N/A | 92,753 | 72,586 | N/A | N/A | ||||||||||||
| Class 2 |
26,090 | — | 600,468 | 471,143 | 86,759 | 62,893 | ||||||||||||
| Class 2a |
N/A | N/A | 28,845 | 15,552 | N/A | N/A | ||||||||||||
| Class 3a |
N/A | N/A | 5,511 | — | N/A | N/A | ||||||||||||
| Net Asset Value per Unit |
||||||||||||||||||
| Class 1 |
$ | 98.32 | N/A | $ | 122.45 | $ | 125.17 | $ | 105.29 | $ | 110.54 | |||||||
| Class 1a |
N/A | N/A | $ | 109.21 | $ | 112.09 | N/A | N/A | ||||||||||
| Class 2 |
$ | 98.87 | N/A | $ | 142.52 | $ | 142.44 | $ | 120.92 | $ | 124.14 | |||||||
| Class 2a |
N/A | N/A | $ | 120.82 | $ | 121.30 | N/A | N/A | ||||||||||
| Class 3a |
N/A | N/A | $ | 120.82 | N/A | N/A | N/A | |||||||||||
| (1) | The Frontier Masters Series began trading operations on June 9, 2009 |
The accompanying notes are an integral part of these statements.
5
Table of Contents
The Frontier Fund
Statements of Financial Condition
September 30, 2009 and December 31, 2008
| Currency Series | Long Only Commodity Series |
Managed Futures Index Series | ||||||||||||||||
| 9/30/2009 | 12/31/2008 | 9/30/2009 | 12/31/2008 | 9/30/2009 | 12/31/2008 | |||||||||||||
| (Unaudited) | (Unaudited) | (Unaudited) | ||||||||||||||||
| ASSETS | ||||||||||||||||||
| Cash and cash equivalents |
$ | 375,590 | $ | — | $ | 229,088 | $ | — | $ | 315,330 | $ | 400,351 | ||||||
| U.S. Treasury securities, at fair value |
3,045,397 | 3,770,011 | 614,075 | 1,241,289 | 490,562 | 140,111 | ||||||||||||
| Custom time deposits |
14,565,593 | 12,616,208 | 2,937,010 | 2,425,332 | 2,346,270 | 1,630,221 | ||||||||||||
| Certificates of deposit |
— | 3,506,438 | — | 440,781 | — | 488,470 | ||||||||||||
| Receivable from futures commission merchants |
477,496 | 670,927 | — | — | — | — | ||||||||||||
| Open trade equity |
24,236 | 12,810 | — | — | — | — | ||||||||||||
| Swap Contracts |
6,479,642 | 9,122,121 | 639,797 | 836,554 | — | — | ||||||||||||
| Investments in unconsolidated trading companies |
— | — | — | — | 1,117,433 | 770,967 | ||||||||||||
| Prepaid service fees—Class 1 |
772 | 33,974 | 2,993 | 11,435 | 6,971 | 8,848 | ||||||||||||
| Interest receivable |
13,930 | 83,036 | 2,809 | 18,659 | 2,244 | 2,502 | ||||||||||||
| Receivable from related parties |
438 | 444 | — | 63,133 | 39 | — | ||||||||||||
| Other assets |
230 | 12,627 | — | 95 | 53 | 1,220 | ||||||||||||
| Total Assets |
$ | 24,983,324 | $ | 29,828,596 | $ | 4,425,772 | $ | 5,037,278 | $ | 4,278,902 | $ | 3,442,690 | ||||||
| LIABILITIES & OWNERS’ CAPITAL | ||||||||||||||||||
| LIABILITIES |
||||||||||||||||||
| Payable to other Series |
$ | — | $ | 279,582 | $ | — | $ | 983,248 | $ | — | $ | — | ||||||
| Inter-series payables |
13,090,419 | 14,679,460 | — | — | — | — | ||||||||||||
| Pending owner additions |
— | 10,000 | — | — | — | 30,000 | ||||||||||||
| Owner redemptions payable |
18,306 | — | — | — | 5,615 | — | ||||||||||||
| Incentive fees payable to Managing Owner |
2,171 | — | — | — | — | — | ||||||||||||
| Management fees payable to Managing Owner |
7,787 | 2,260 | 4,562 | 4,167 | 7,232 | 5,102 | ||||||||||||
| Interest fees payable to Managing Owner |
23,467 | 4,708 | 1,505 | 1,493 | 1,494 | 1,318 | ||||||||||||
| Trading fees payable to Managing Owner |
6,981 | 2,039 | 1,771 | 1,665 | 1,777 | 1,276 | ||||||||||||
| Trailing service fees payable to Managing Owner |
9,686 | 1,235 | 4,807 | 3,943 | 2,132 | 1,597 | ||||||||||||
| Payables to related parties |
— | 2,527 | 57 | — | — | 346 | ||||||||||||
| Other liabilities |
165 | — | 25 | 289 | 7 | — | ||||||||||||
| Total Liabilities |
13,158,982 | 14,981,811 | 12,727 | 994,805 | 18,257 | 39,639 | ||||||||||||
| OWNERS’ CAPITAL |
||||||||||||||||||
| Managing Owner Units—Class 2 |
612,951 | 687,357 | 122,978 | 110,092 | 269,806 | 77,559 | ||||||||||||
| Limited Owner Units—Class 1 |
9,277,783 | 11,900,185 | 3,528,604 | 3,254,226 | 2,021,313 | 2,266,977 | ||||||||||||
| Limited Owner Units—Class 2 |
1,933,608 | 2,259,243 | 761,463 | 678,155 | 1,969,526 | 1,058,515 | ||||||||||||
| Total Owners’ Capital |
11,824,342 | 14,846,785 | 4,413,045 | 4,042,473 | 4,260,645 | 3,403,051 | ||||||||||||
| Total Liabilities and Owner’s Capital |
$ | 24,983,324 | $ | 29,828,596 | $ | 4,425,772 | $ | 5,037,278 | $ | 4,278,902 | $ | 3,442,690 | ||||||
| Units Outstanding |
||||||||||||||||||
| Class 1 |
110,617 | 123,719 | 45,543 | 46,285 | 17,169 | 17,151 | ||||||||||||
| Class 2 |
26,127 | 26,959 | 10,643 | 10,587 | 17,739 | 8,132 | ||||||||||||
| Net Asset Value per Unit |
||||||||||||||||||
| Class 1 |
$ | 83.87 | $ | 96.19 | $ | 77.48 | $ | 70.31 | $ | 117.73 | $ | 132.18 | ||||||
| Class 2 |
$ | 97.47 | $ | 109.30 | $ | 83.10 | $ | 74.46 | $ | 126.24 | $ | 139.70 | ||||||
The accompanying notes are an integral part of these statements.
6
Table of Contents
The Frontier Fund
Statements of Financial Condition
September 30, 2009 and December 31, 2008
| Winton Series | Winton/Graham Series | |||||||||||
| 9/30/2009 | 12/31/2008 | 9/30/2009 | 12/31/2008 | |||||||||
| (Unaudited) | (Unaudited) | |||||||||||
| ASSETS | ||||||||||||
| Cash and cash equivalents |
$ | 1,663,120 | $ | 1,283,671 | $ | 1,519,887 | $ | 10,000,528 | ||||
| U.S. Treasury securities, at fair value |
9,869,092 | 12,899,592 | 8,634,882 | 1,424,286 | ||||||||
| Custom time deposits |
47,202,114 | 45,207,225 | 41,299,106 | 26,043,287 | ||||||||
| Certificates of deposit |
— | 14,085,571 | — | 8,675,748 | ||||||||
| Receivable from futures commission merchants |
— | 9,653,595 | 16,159,866 | — | ||||||||
| Open trade equity |
— | 2,158,369 | 1,361,413 | — | ||||||||
| Investments in unconsolidated trading companies |
3,322,573 | — | 2,536,697 | 4,342,658 | ||||||||
| Prepaid service fees—Class 1 |
— | 89,142 | 250,218 | 365,708 | ||||||||
| Interest receivable |
45,141 | 54,314 | 39,496 | 157,574 | ||||||||
| Receivable from related parties |
— | 64,844 | 8,284 | 20,000 | ||||||||
| Other assets |
781 | — | 624 | — | ||||||||
| Total Assets |
$ | 62,102,821 | $ | 85,496,323 | $ | 71,810,473 | $ | 51,029,789 | ||||
| LIABILITIES & OWNERS’ CAPITAL | ||||||||||||
| LIABILITIES |
||||||||||||
| Pending owner additions |
$ | — | $ | — | $ | — | $ | 710,128 | ||||
| Owner redemptions payable |
45,030 | — | 108,949 | — | ||||||||
| Incentive fees payable to Managing Owner |
— | — | 256,842 | 76,168 | ||||||||
| Management fees payable to Managing Owner |
89,324 | 17,845 | 108,377 | 12,020 | ||||||||
| Interest fees payable to Managing Owner |
58,962 | 12,314 | 59,460 | 15,101 | ||||||||
| Trading fees payable to Managing Owner |
18,085 | 4,462 | 16,368 | 2,204 | ||||||||
| Trailing service fees payable |
69,115 | 17,576 | 35,200 | 5,634 | ||||||||
| Payables to related parties |
472 | 25,597 | — | 5,124 | ||||||||
| Other liabilities |
22,370 | 35,858 | 416 | 8,181 | ||||||||
| Total Liabilities |
303,358 | 113,652 | 585,612 | 834,560 | ||||||||
| OWNERS’ CAPITAL |
||||||||||||
| Non-Controlling Interests |
— | 11,355,645 | 8,577,592 | — | ||||||||
| Managing Owner Units—Class 1 |
— | 1,304 | — | — | ||||||||
| Managing Owner Units—Class 2 |
453,954 | 277,935 | 55,013 | 56,315 | ||||||||
| Limited Owner Units—Class 1 |
51,465,175 | 62,282,355 | 49,794,837 | 35,760,835 | ||||||||
| Limited Owner Units—Class 2 |
9,880,334 | 11,465,432 | 12,797,419 | 14,378,079 | ||||||||
| Total Owners’ Capital |
61,799,463 | 85,382,671 | 71,224,861 | 50,195,229 | ||||||||
| Total Liabilities and Owner’s Capital |
$ | 62,102,821 | $ | 85,496,323 | $ | 71,810,473 | $ | 51,029,789 | ||||
| Units Outstanding |
||||||||||||
| Class 1 |
435,704 | 477,605 | 448,829 | 307,804 | ||||||||
| Class 2 |
79,664 | 83,855 | 100,063 | 109,779 | ||||||||
| Net Asset Value per Unit |
||||||||||||
| Class 1 |
$ | 118.12 | $ | 130.41 | $ | 110.94 | $ | 116.18 | ||||
| Class 2 |
$ | 129.72 | $ | 140.04 | $ | 128.44 | $ | 131.49 | ||||
The accompanying notes are an integral part of these statements.
7
Table of Contents
Condensed Schedule of Investments
September 30, 2009 (Unaudited)
| Frontier Diversified Series | Frontier Dynamic Series | Frontier Long/Short Commodity Series |
Frontier Masters Series | ||||||||||||||||||||||
| Description |
Value | % of Net Asset Value |
Value | % of Net Asset Value |
Value | % of Net Asset Value |
Value | % of Net Asset Value |
|||||||||||||||||
| LONG FUTURES CONTRACTS * | |||||||||||||||||||||||||
| Various base metals futures contracts (U.S.) |
$ | — | 0.00 | % | $ | — | 0.00 | % | $ | 571,839 | 0.60 | % | $ | — | 0.00 | % | |||||||||
| Various currency futures contracts (U.S.) |
— | 0.00 | % | — | 0.00 | % | 73,158 | 0.08 | % | — | 0.00 | % | |||||||||||||
| Various currency futures contracts (Canada) |
— | 0.00 | % | — | 0.00 | % | — | 0.00 | % | — | 0.00 | % | |||||||||||||
| Various currency futures contracts (Europe) |
— | 0.00 | % | — | 0.00 | % | — | 0.00 | % | — | 0.00 | % | |||||||||||||
| Various currency futures contracts (Far East) |
— | 0.00 | % | — | 0.00 | % | — | 0.00 | % | — | 0.00 | % | |||||||||||||
| Various energy futures contracts (U.S.) |
— | 0.00 | % | — | 0.00 | % | 6,928,606 | 7.30 | % | — | 0.00 | % | |||||||||||||
| Crude Oil, Light 12/1/2009 (Number of Contracts: 791) |
— | 0.00 | % | — | 0.00 | % | 3,363,910 | 3.54 | % | — | 0.00 | % | |||||||||||||
| Various energy futures contracts (Far East) |
— | 0.00 | % | — | 0.00 | % | — | 0.00 | % | — | 0.00 | % | |||||||||||||
| Various interest rates futures contracts (U.S.) |
— | 0.00 | % | — | 0.00 | % | 31,453 | 0.03 | % | — | 0.00 | % | |||||||||||||
| Various interest rates futures contracts (Canada) |
— | 0.00 | % | — | 0.00 | % | — | 0.00 | % | — | 0.00 | % | |||||||||||||
| Various interest rates futures contracts (Europe) |
— | 0.00 | % | — | 0.00 | % | — | 0.00 | % | — | 0.00 | % | |||||||||||||
| Various interest rates futures contracts (Far East) |
— | 0.00 | % | — | 0.00 | % | — | 0.00 | % | — | 0.00 | % | |||||||||||||
| Various precious metals futures contracts (U.S.) |
— | 0.00 | % | — | 0.00 | % | 148,420 | 0.16 | % | — | 0.00 | % | |||||||||||||
| Various soft futures contracts (U.S.) |
— | 0.00 | % | — | 0.00 | % | (742,366 | ) | -0.78 | % | — | 0.00 | % | ||||||||||||
| Coffee @ CSCE Settling 3/1/2010 (Number of Contracts: 417) |
— | 0.00 | % | 0.00 | % | (1,430,831 | ) | -1.51 | % | — | 0.00 | % | |||||||||||||
| Various soft futures contracts (Far East) |
— | 0.00 | % | — | 0.00 | % | (6,202 | ) | -0.01 | % | — | 0.00 | % | ||||||||||||
| Various soft futures contracts (Europe) |
— | 0.00 | % | — | 0.00 | % | 46,493 | 0.05 | % | — | 0.00 | % | |||||||||||||
| Various soft futures contracts (Canada) |
— | 0.00 | % | — | 0.00 | % | — | 0.00 | % | — | 0.00 | % | |||||||||||||
| Various stock index futures contracts (U.S.) |
— | 0.00 | % | — | 0.00 | % | 150,693 | 0.16 | % | — | 0.00 | % | |||||||||||||
| Various stock index futures contracts (Canada) |
— | 0.00 | % | — | 0.00 | % | — | 0.00 | % | — | 0.00 | % | |||||||||||||
| Various stock index futures contracts (Europe) |
— | 0.00 | % | — | 0.00 | % | — | 0.00 | % | — | 0.00 | % | |||||||||||||
| Various stock index futures contracts (Far East) |
— | 0.00 | % | — | 0.00 | % | (2,954 | ) | 0.00 | % | — | 0.00 | % | ||||||||||||
| Total Long Futures Contracts |
$ | — | 0.00 | % | $ | — | 0.00 | % | $ | 9,132,219 | 9.62 | % | $ | — | 0.00 | % | |||||||||
| LONG OPTIONS * | $ | — | 0.00 | % | $ | — | 0.00 | % | 62,538 | 0.07 | % | $ | — | 0.00 | % | ||||||||||
| LONG CURRENCY FORWARDS * | $ | — | 0.00 | % | $ | — | 0.00 | % | $ | — | 0.00 | % | $ | — | 0.00 | % | |||||||||
| SHORT FUTURES CONTRACTS | |||||||||||||||||||||||||
| Various base metals futures contracts (U.S.) |
$ | — | 0.00 | % | $ | — | 0.00 | % | $ | (313,868 | ) | -0.33 | % | $ | — | 0.00 | % | ||||||||
| Various currency futures contracts (U.S.) |
— | 0.00 | % | — | 0.00 | % | — | 0.00 | % | — | 0.00 | % | |||||||||||||
| Various currency futures contracts (Canada) |
— | 0.00 | % | — | 0.00 | % | — | 0.00 | % | — | 0.00 | % | |||||||||||||
| Various currency futures contracts (Europe) |
— | 0.00 | % | — | 0.00 | % | — | 0.00 | % | — | 0.00 | % | |||||||||||||
| Various currency futures contracts (Far East) |
— | 0.00 | % | — | 0.00 | % | — | 0.00 | % | — | 0.00 | % | |||||||||||||
| Various energy futures contracts (U.S.) |
— | 0.00 | % | — | 0.00 | % | (12,524,752 | ) | -13.19 | % | — | 0.00 | % | ||||||||||||
| Crude Oil, Light 11/1/2009 (Number of Contracts: 791) |
— | 0.00 | % | — | 0.00 | % | (3,456,870 | ) | -3.64 | % | — | 0.00 | % | ||||||||||||
| Various interest rates futures contracts (US) |
— | 0.00 | % | — | 0.00 | % | (68,891 | ) | -0.07 | % | — | 0.00 | % | ||||||||||||
| Various interest rates futures contracts (Canada) |
— | 0.00 | % | — | 0.00 | % | — | 0.00 | % | — | 0.00 | % | |||||||||||||
| Various interest rates futures contracts (Europe) |
— | 0.00 | % | — | 0.00 | % | — | 0.00 | % | — | 0.00 | % | |||||||||||||
| Various interest rates futures contracts (Far East) |
— | 0.00 | % | — | 0.00 | % | — | 0.00 | % | — | 0.00 | % | |||||||||||||
| Various precious metals futures contracts (U.S.) |
— | 0.00 | % | — | 0.00 | % | — | 0.00 | % | — | 0.00 | % | |||||||||||||
| Various soft futures contracts (U.S.) |
— | 0.00 | % | — | 0.00 | % | (936,950 | ) | -0.99 | % | — | 0.00 | % | ||||||||||||
| Coffee @ CSCE Settling 12/1/2009 (Number of Contracts: 587) |
— | 0.00 | % | — | 0.00 | % | 2,498,419 | 2.63 | % | — | 0.00 | % | |||||||||||||
| Various soft futures contracts (Europe) |
— | 0.00 | % | — | 0.00 | % | — | 0.00 | % | — | 0.00 | % | |||||||||||||
| Various stock index futures contracts (U.S.) |
— | 0.00 | % | — | 0.00 | % | (470 | ) | 0.00 | % | — | 0.00 | % | ||||||||||||
| Various stock index futures contracts (Europe) |
— | 0.00 | % | — | 0.00 | % | — | 0.00 | % | — | 0.00 | % | |||||||||||||
| Various stock index futures contracts (Far East) |
— | 0.00 | % | — | 0.00 | % | — | 0.00 | % | — | 0.00 | % | |||||||||||||
| Total Short Futures Contracts |
$ | — | 0.00 | % | $ | — | 0.00 | % | $ | (14,803,382 | ) | -15.59 | % | $ | — | 0.00 | % | ||||||||
| SHORT OPTIONS * | $ | — | 0.00 | % | $ | — | 0.00 | % | $ | (99,134 | ) | -0.10 | % | $ | — | 0.00 | % | ||||||||
| SHORT CURRENCY FORWARDS * | $ | — | 0.00 | % | $ | — | 0.00 | % | $ | — | 0.00 | % | $ | — | 0.00 | % | |||||||||
| Total Open Trade Equity |
$ | — | $ | — | $ | (5,707,759 | ) | -6.00 | % | $ | — | ||||||||||||||
| SWAPS (1) | $ | 10,036,654 | 51.59 | % | $ | 11,401,259 | 2887.29 | % | $ | — | 0.00 | % | $ | 9,636,598 | 140.62 | % | |||||||||
U.S. TREASURY SECURITIES
| FACE VALUE |
Fair Value | Fair Value | Fair Value | Fair Value | ||||||||||||||||||||||
| $36,500,000.00 | US Treasury Note 3.875% due 02/15/2013 (Cost $38,125,391) (2) |
2,619,396 | 13.46 | % | 1,503,594 | 380.77 | % | 4,425,516 | 4.66 | % | 1,722,979 | 25.14 | % | |||||||||||||
| $36,700,000.00 | US Treasury Note 4.000% due 02/15/2015 (Cost $38,016,039) (2) |
2,640,642 | 13.57 | % | 1,515,789 | 383.86 | % | 4,461,411 | 4.70 | % | 1,736,954 | 25.35 | % | |||||||||||||
| $ | 5,260,038 | 27.03 | % | $ | 3,019,383 | 764.63 | % | $ | 8,886,927 | 9.36 | % | $ | 3,459,933 | 50.49 | % | |||||||||||
| * | Except for those items disclosed, no individual futures, forwards and option on futures contract position constituted greater than 1 percent of Net Asset Value. Accordingly, the number of contracts and expiration dates are not presented. |
| (1) | See Notes to Financial Statements, Note 4. |
| (2) | Assets have been allocated to Series based on net assets which include inter-Series investments. Percentages are computed using net assets excluding inter-Series investments. |
The accompanying notes are an integral part of these statements.
| Additional Disclosure on U.S. Government Securities |
Face Value | Face Value | Face Value | Face Value | |||||
| US Treasury Note 3.875% due 02/15/2013 |
2,437,356 | 1,399,099 | 4,117,957 | 1,603,237 | |||||
| US Treasury Note 4.000% due 02/15/2015 |
2,450,712 | 1,406,765 | 4,140,521 | 1,612,022 | |||||
| 4,888,068 | 2,805,864 | $ | 8,258,478 | 3,215,259 | |||||
| Cost | Cost | Cost | Cost | ||||||
| US Treasury Note 3.875% due 02/15/2013 |
2,545,895 | 1,461,402 | 4,301,334 | 1,674,632 | |||||
| US Treasury Note 4.000% due 02/15/2015 |
2,538,593 | 1,457,211 | 4,288,997 | 1,669,828 | |||||
| 5,084,488 | 2,918,613 | $ | 8,590,331 | 3,344,460 | |||||
8
Table of Contents
The Frontier Fund
Condensed Schedule of Investments
September 30, 2009 (Unaudited)
| Balanced Series | Campbell/Graham/Tiverton Series | Currency Series | Long Only Series | |||||||||||||||||||||||
| Description |
Value | % of Net Asset Value |
Value | % of Net Asset Value |
Value | % of Net Asset Value |
Value | % of Net Asset Value |
||||||||||||||||||
| LONG FUTURES CONTRACTS * | ||||||||||||||||||||||||||
| Various base metals futures contracts (U.S.) |
$ | 11,052,660 | 2.64 | % | $ | — | 0.00 | % | $ | — | 0.00 | % | $ | — | 0.00 | % | ||||||||||
| Various base metals futures contracts (Far East) |
(49,930 | ) | -0.01 | % | — | 0.00 | % | — | 0.00 | % | — | 0.00 | % | |||||||||||||
| Various currency futures contracts (U.S.) |
555,621 | 0.13 | % | — | 0.00 | % | — | 0.00 | % | — | 0.00 | % | ||||||||||||||
| Various currency futures contracts (Canada) |
— | 0.00 | % | — | 0.00 | % | — | 0.00 | % | — | 0.00 | % | ||||||||||||||
| Various currency futures contracts (Europe) |
— | 0.00 | % | — | 0.00 | % | — | 0.00 | % | — | 0.00 | % | ||||||||||||||
| Various currency futures contracts (Far East) |
— | 0.00 | % | — | 0.00 | % | — | 0.00 | % | — | 0.00 | % | ||||||||||||||
| Various energy futures contracts (U.S.) |
866,874 | 0.21 | % | — | 0.00 | % | — | 0.00 | % | — | 0.00 | % | ||||||||||||||
| Various interest rates futures contracts (U.S.) |
386,612 | 0.09 | % | — | 0.00 | % | — | 0.00 | % | — | 0.00 | % | ||||||||||||||
| Various interest rates futures contracts (Canada) |
79,176 | 0.02 | % | — | 0.00 | % | — | 0.00 | % | — | 0.00 | % | ||||||||||||||
| Various interest rates futures contracts (Europe) |
1,279,493 | 0.31 | % | — | 0.00 | % | — | 0.00 | % | — | 0.00 | % | ||||||||||||||
| Various interest rates futures contracts (Far East) |
128,636 | 0.03 | % | — | 0.00 | % | — | 0.00 | % | — | 0.00 | % | ||||||||||||||
| Various precious metals futures contracts (U.S.) |
2,553,680 | 0.61 | % | — | 0.00 | % | — | 0.00 | % | — | 0.00 | % | ||||||||||||||
| Various soft futures contracts (U.S.) |
769,785 | 0.18 | % | — | 0.00 | % | — | 0.00 | % | — | 0.00 | % | ||||||||||||||
| Various soft futures contracts (Europe) |
192,432 | 0.05 | % | — | 0.00 | % | — | 0.00 | % | — | 0.00 | % | ||||||||||||||
| Various soft futures contracts (Canada) |
— | 0.00 | % | — | 0.00 | % | — | 0.00 | % | — | 0.00 | % | ||||||||||||||
| Various stock index futures contracts (U.S.) |
(77,571 | ) | -0.02 | % | — | 0.00 | % | — | 0.00 | % | — | 0.00 | % | |||||||||||||
| Various stock index futures contracts (Canada) |
— | 0.00 | % | — | 0.00 | % | — | 0.00 | % | — | 0.00 | % | ||||||||||||||
| Various stock index futures contracts (Europe) |
106,482 | 0.02 | % | — | 0.00 | % | — | 0.00 | % | — | 0.00 | % | ||||||||||||||
| Various stock index futures contracts (Far East) |
43,408 | 0.01 | % | — | 0.00 | % | — | 0.00 | % | — | 0.00 | % | ||||||||||||||
| Total Long Futures Contracts |
$ | 17,887,359 | 4.27 | % | $ | — | 0.00 | % | $ | — | 0.00 | % | $ | — | 0.00 | % | ||||||||||
| LONG OPTIONS * | $ | 16,334,807 | 3.90 | % | $ | — | 0.00 | % | $ | 881 | 0.01 | % | $ | — | 0.00 | % | ||||||||||
| LONG CURRENCY FORWARDS * | $ | 4,951,868 | 1.18 | % | $ | — | 0.00 | % | $ | 155,363 | 1.31 | % | $ | — | 0.00 | % | ||||||||||
| SHORT FUTURES CONTRACTS * | ||||||||||||||||||||||||||
| Various base metals futures contracts (U.S.) |
$ | (9,027,108 | ) | -2.16 | % | $ | — | 0.00 | % | $ | — | 0.00 | % | $ | — | 0.00 | % | |||||||||
| Various currency futures contracts (US) |
(12,110 | ) | 0.00 | % | — | 0.00 | % | — | 0.00 | % | — | 0.00 | % | |||||||||||||
| Various currency futures contracts (Canada) |
— | 0.00 | % | — | 0.00 | % | — | 0.00 | % | — | 0.00 | % | ||||||||||||||
| Various currency futures contracts (Europe) |
— | 0.00 | % | — | 0.00 | % | — | 0.00 | % | — | 0.00 | % | ||||||||||||||
| Various currency futures contracts (Far East) |
(1,509 | ) | 0.00 | % | — | 0.00 | % | — | 0.00 | % | — | 0.00 | % | |||||||||||||
| Various energy futures contracts (U.S.) |
(1,116,974 | ) | -0.27 | % | — | 0.00 | % | — | 0.00 | % | — | 0.00 | % | |||||||||||||
| Various interest rates futures contracts (U.S.) |
(36,139 | ) | -0.01 | % | — | 0.00 | % | — | 0.00 | % | — | 0.00 | % | |||||||||||||
| Various interest rates futures contracts (Canada) |
— | 0.00 | % | — | 0.00 | % | — | 0.00 | % | — | 0.00 | % | ||||||||||||||
| Various interest rates futures contracts (Europe) |
27,136 | 0.01 | % | — | 0.00 | % | — | 0.00 | % | — | 0.00 | % | ||||||||||||||
| Various interest rates futures contracts (Far East) |
(15,783 | ) | 0.00 | % | — | 0.00 | % | — | 0.00 | % | — | 0.00 | % | |||||||||||||
| Various precious metals futures contracts (U.S.) |
(785,492 | ) | -0.19 | % | — | 0.00 | % | — | 0.00 | % | — | 0.00 | % | |||||||||||||
| Various soft futures contracts (U.S.) |
(25,961 | ) | -0.01 | % | — | 0.00 | % | — | 0.00 | % | — | 0.00 | % | |||||||||||||
| Various soft futures contracts (Canada) |
— | 0.00 | % | — | 0.00 | % | 0.00 | % | 0.00 | % | ||||||||||||||||
| Various soft futures contracts (Europe) |
— | 0.00 | % | — | 0.00 | % | — | 0.00 | % | — | 0.00 | % | ||||||||||||||
| Various stock index futures contracts (U.S.) |
23,575 | 0.01 | % | — | 0.00 | % | — | 0.00 | % | — | 0.00 | % | ||||||||||||||
| Various stock index futures contracts (Canada) |
— | 0.00 | % | — | 0.00 | % | — | 0.00 | % | — | 0.00 | % | ||||||||||||||
| Various stock index futures contracts (Europe) |
(1,008 | ) | 0.00 | % | — | 0.00 | % | — | 0.00 | % | — | 0.00 | % | |||||||||||||
| Various stock index futures contracts (Far East) |
63,833 | 0.02 | % | — | 0.00 | % | — | 0.00 | % | — | 0.00 | % | ||||||||||||||
| Total Short Futures Contracts |
$ | (10,907,538 | ) | -2.61 | % | $ | — | 0.00 | % | $ | — | 0.00 | % | $ | — | 0.00 | % | |||||||||
| SHORT OPTIONS * | $ | (2,748,027 | ) | -0.66 | % | $ | — | 0.00 | % | $ | 367 | 0.00 | % | $ | — | 0.00 | % | |||||||||
| SHORT CURRENCY FORWARDS * | $ | (747,931 | ) | -0.18 | % | $ | — | 0.00 | % | $ | (132,375 | ) | -1.12 | % | $ | — | 0.00 | % | ||||||||
| Total Open Trade Equity |
$ | 24,770,538 | 5.92 | % | $ | — | 0.00 | % | $ | 24,236 | 0.20 | % | $ | — | 0.00 | % | ||||||||||
| SWAPS (1) | $ | 51,300,320 | 12.26 | % | $ | — | 0.00 | % | $ | 6,479,642 | 54.80 | % | $ | 639,797 | 14.50 | % | ||||||||||
U.S. TREASURY SECURITIES
| FACE VALUE |
Fair Value | Fair Value | Fair Value | Fair Value | ||||||||||||||||||||||
| $36,500,000.00 | US Treasury Note 3.875% due 02/15/2013 (Cost $38,125,391 ) |
12,553,646 | 3.00 | % | 5,119,706 | 6.22 | % | 1,516,548 | 12.83 | % | 305,797 | 6.93 | % | |||||||||||||
| $36,700,000.00 | US Treasury Note 4.000% due 02/15/2015 (Cost $38,016,039 ) |
12,655,468 | 3.02 | % | 5,161,231 | 6.27 | % | 1,528,849 | 12.93 | % | 308,278 | 6.99 | % | |||||||||||||
| $ | 25,209,114 | 6.02 | % | $ | 10,280,937 | 12.49 | % | $ | 3,045,397 | 25.76 | % | $ | 614,075 | 13.92 | % | |||||||||||
| * | No individual futures, forwards and option on futures contract position constituted greater than 1 percent of Net Asset Value. Accordingly, the number of contracts and expiration dates are not presented. |
| (1) | See Notes to Financial Statements, Note 4. |
The accompanying notes are an integral part of these statements.
| Additional Disclosure on U.S. Government Securities |
Face Value | Face Value | Face Value | Face Value | |||||||
| US Treasury Note 3.875% due 02/15/2013 |
11,681,207 | 4,763,902 | 1,411,153 | 284,545 | |||||||
| US Treasury Note 4.000% due 02/15/2015 |
11,745,214 | 4,790,006 | 1,418,885 | 286,105 | |||||||
| 23,426,421 | $ | 9,553,908 | $ | 2,830,038 | $ | 570,650 | |||||
| Cost | Cost | Cost | Cost | ||||||||
| US Treasury Note 3.875% due 02/15/2013 |
12,201,386 | 4,976,045 | 1,473,993 | 297,217 | |||||||
| US Treasury Note 4.000% due 02/15/2015 |
12,166,390 | 4,961,772 | 1,469,766 | 296,364 | |||||||
| 24,367,776 | $ | 9,937,817 | $ | 2,943,759 | $ | 593,581 | |||||
9
Table of Contents
The Frontier Fund
Condensed Schedule of Investments
September 30, 2009 (Unaudited)
| Managed Futures Index Series | Winton Series | Winton/Graham Series | |||||||||||||||||
| Description |
Value | % of Net Asset Value |
Value | % of Net Asset Value |
Value | % of Net Asset Value |
|||||||||||||
| LONG FUTURES CONTRACTS |
|||||||||||||||||||
| Various base metals futures contracts (U.S.) |
$ | — | 0.00 | % | $ | — | 0.00 | % | $ | (41,391 | ) | -0.06 | % | ||||||
| Various currency futures contracts (U.S.) |
— | 0.00 | % | — | 0.00 | % | 2,638 | 0.00 | % | ||||||||||
| Various currency futures contracts (Canada) |
— | 0.00 | % | — | 0.00 | % | — | 0.00 | % | ||||||||||
| Various currency futures contracts (Europe) |
— | 0.00 | % | — | 0.00 | % | — | 0.00 | % | ||||||||||
| Various currency futures contracts (Far East) |
— | 0.00 | % | — | 0.00 | % | — | 0.00 | % | ||||||||||
| Various energy futures contracts (U.S.) |
— | 0.00 | % | — | 0.00 | % | 15,465 | 0.02 | % | ||||||||||
| Various energy futures contracts (Far East) |
— | 0.00 | % | — | 0.00 | % | — | 0.00 | % | ||||||||||
| Various interest rates futures contracts (U.S.) |
— | 0.00 | % | — | 0.00 | % | 28,688 | 0.04 | % | ||||||||||
| Various interest rates futures contracts (Canada) |
— | 0.00 | % | — | 0.00 | % | — | 0.00 | % | ||||||||||
| Various interest rates futures contracts (Europe) |
— | 0.00 | % | — | 0.00 | % | 387,982 | 0.54 | % | ||||||||||
| Various interest rates futures contracts (Far East) |
— | 0.00 | % | — | 0.00 | % | (38,426 | ) | -0.05 | % | |||||||||
| Various precious metals futures contracts (U.S.) |
— | 0.00 | % | — | 0.00 | % | 76,930 | 0.11 | % | ||||||||||
| Various soft futures contracts (U.S.) |
— | 0.00 | % | — | 0.00 | % | 121,125 | 0.17 | % | ||||||||||
| Various soft futures contracts (Far East) |
— | 0.00 | % | — | 0.00 | % | — | 0.00 | % | ||||||||||
| Various soft futures contracts (Europe) |
— | 0.00 | % | — | 0.00 | % | 104,773 | 0.15 | % | ||||||||||
| Various soft futures contracts (Canada) |
— | 0.00 | % | — | 0.00 | % | — | 0.00 | % | ||||||||||
| Various stock index futures contracts (U.S.) |
— | 0.00 | % | — | 0.00 | % | 9,172 | 0.01 | % | ||||||||||
| Various stock index futures contracts (Canada) |
— | 0.00 | % | — | 0.00 | % | (9,354 | ) | -0.01 | % | |||||||||
| Various stock index futures contracts (Europe) |
— | 0.00 | % | — | 0.00 | % | (18,330 | ) | -0.03 | % | |||||||||
| Various stock index futures contracts (Far East) |
— | 0.00 | % | — | 0.00 | % | (130,643 | ) | -0.18 | % | |||||||||
| Total Long Futures Contracts |
$ | — | 0.00 | % | $ | — | 0.00 | % | $ | 508,629 | 0.71 | % | |||||||
| LONG OPTIONS * |
$ | — | 0.00 | % | $ | — | 0.00 | % | $ | — | 0.00 | % | |||||||
| LONG CURRENCY FORWARDS * |
$ | — | 0.00 | % | $ | — | 0.00 | % | $ | (65,112 | ) | -0.09 | % | ||||||
| SHORT FUTURES CONTRACTS |
|||||||||||||||||||
| Various base metals futures contracts (U.S.) |
$ | — | 0.00 | % | $ | — | 0.00 | % | $ | (30,643 | ) | -0.04 | % | ||||||
| Various currency futures contracts (U.S.) |
— | 0.00 | % | — | 0.00 | % | 2,488 | 0.00 | % | ||||||||||
| Various currency futures contracts (Canada) |
— | 0.00 | % | — | 0.00 | % | — | 0.00 | % | ||||||||||
| Various currency futures contracts (Europe) |
— | 0.00 | % | — | 0.00 | % | (48 | ) | 0.00 | % | |||||||||
| Various currency futures contracts (Far East) |
— | 0.00 | % | — | 0.00 | % | — | 0.00 | % | ||||||||||
| Various energy futures contracts (U.S.) |
— | 0.00 | % | — | 0.00 | % | (156,618 | ) | -0.22 | % | |||||||||
| Various interest rates futures contracts (US) |
— | 0.00 | % | — | 0.00 | % | — | 0.00 | % | ||||||||||
| Various interest rates futures contracts (Canada) |
— | 0.00 | % | — | 0.00 | % | (2,422 | ) | 0.00 | % | |||||||||
| Various interest rates futures contracts (Europe) |
— | 0.00 | % | — | 0.00 | % | — | 0.00 | % | ||||||||||
| Various interest rates futures contracts (Far East) |
— | 0.00 | % | — | 0.00 | % | 4,510 | 0.01 | % | ||||||||||
| Various precious metals futures contracts (U.S.) |
— | 0.00 | % | — | 0.00 | % | — | 0.00 | % | ||||||||||
| Various soft futures contracts (U.S.) |
— | 0.00 | % | — | 0.00 | % | 218,825 | 0.31 | % | ||||||||||
| Various soft futures contracts (Europe) |
— | 0.00 | % | — | 0.00 | % | — | 0.00 | % | ||||||||||
| Various stock index futures contracts (U.S.) |
— | 0.00 | % | — | 0.00 | % | 28,870 | 0.04 | % | ||||||||||
| Various stock index futures contracts (Europe) |
— | 0.00 | % | — | 0.00 | % | — | 0.00 | % | ||||||||||
| Various stock index futures contracts (Far East) |
— | 0.00 | % | — | 0.00 | % | — | 0.00 | % | ||||||||||
| Total Short Futures Contracts |
$ | — | 0.00 | % | $ | — | 0.00 | % | $ | 64,962 | 0.09 | % | |||||||
| SHORT OPTIONS * |
$ | — | 0.00 | % | $ | — | 0.00 | % | $ | — | 0.00 | % | |||||||
| SHORT CURRENCY FORWARDS * |
$ | — | 0.00 | % | $ | — | 0.00 | % | $ | 852,934 | 1.20 | % | |||||||
| Total Open Trade Equity |
$ | — | 0.00 | % | $ | — | 0.00 | % | $ | 1,361,413 | 1.91 | % | |||||||
| SWAPS (1) |
$ | — | 0.00 | % | $ | — | 0.00 | % | $ | — | 0.00 | % | |||||||
U.S. TREASURY SECURITIES
| FACE VALUE |
Fair Value | Fair Value | Fair Value | |||||||||||||||||
| $36,500,000.00 | US Treasury Note 3.875% due 02/15/2013 (Cost $38,125,391) |
244,290 | 5.73 | % | 4,914,615 | 7.95 | % | 4,300,002 | 6.04 | % | ||||||||||
| $36,700,000.00 | US Treasury Note 4.000% due 02/15/2015 (Cost $38,016,039) |
246,272 | 5.78 | % | 4,954,477 | 8.02 | % | 4,334,880 | 6.09 | % | ||||||||||
| $ | 490,562 | 11.51 | % | $ | 9,869,092 | 15.97 | % | $ | 8,634,882 | 12.13 | % | |||||||||
| * | Except for those items disclosed, no individual futures, forwards and option on futures contract position constituted greater than 1 percent of Net Asset Value. Accordingly, the number of contracts and expiration dates are not presented. |
| (1) | See Notes to Financial Statements, Note 4. |
The accompanying notes are an integral part of these statements.
| Additional Disclosure on U.S. Government Securities |
Face Value | Face Value | Face Value | ||||||
| US Treasury Note 3.875% due 02/15/2013 |
227,313 | 4,573,065 | 4,001,166 | ||||||
| US Treasury Note 4.000% due 02/15/2015 |
228,558 | 4,598,123 | 4,023,090 | ||||||
| $ | 455,871 | $ | 9,171,188 | $ | 8,024,256 | ||||
| Cost | Cost | Cost | |||||||
| US Treasury Note 3.875% due 02/15/2013 |
237,435 | 4,776,709 | 4,179,343 | ||||||
| US Treasury Note 4.000% due 02/15/2015 |
236,755 | 4,763,008 | 4,167,356 | ||||||
| $ | 474,190 | $ | 9,539,717 | $ | 8,346,699 | ||||
10
Table of Contents
The Frontier Fund
Condensed Schedule of Investments
December 31, 2008
| Balanced Series | Winton Series | Campbell/Graham/Tiverton Series | Currency Series | |||||||||||||||||||||||||
| Description |
Value | % of Net Asset Value |
Value | % of Net Asset Value |
Value | % of Net Asset Value |
Value | % of Net Asset Value |
||||||||||||||||||||
| LONG FUTURES CONTRACTS * |
||||||||||||||||||||||||||||
| Various base metals futures contracts (U.S.) |
$ | (12,295,591 | ) | -3.68 | % | $ | (61,704 | ) | -0.08 | % | $ | (16,604 | ) | -0.02 | % | $ | — | 0.00 | % | |||||||||
| Various base metals futures contracts (Far East) |
— | 0.00 | % | — | 0.00 | % | — | 0.00 | % | — | 0.00 | % | ||||||||||||||||
| Various currency futures contracts (U.S.) |
729,987 | 0.22 | % | 706,944 | 0.95 | % | 16,123 | 0.02 | % | — | 0.00 | % | ||||||||||||||||
| Various currency futures contracts (Canada) |
6,889 | 0.00 | % | — | 0.00 | % | — | 0.00 | % | — | 0.00 | % | ||||||||||||||||
| Various currency futures contracts (Europe) |
38,129 | 0.01 | % | 8,268 | 0.01 | % | 1,315 | 0.00 | % | — | 0.00 | % | ||||||||||||||||
| Various currency futures contracts (Far East) |
11,609 | 0.00 | % | — | 0.00 | % | — | 0.00 | % | — | 0.00 | % | ||||||||||||||||
| Various energy futures contracts (U.S.) |
(742,136 | ) | -0.22 | % | — | 0.00 | % | — | 0.00 | % | — | 0.00 | % | |||||||||||||||
| Various interest rates futures contracts (U.S.) |
(144,841 | ) | -0.04 | % | 595,492 | 0.80 | % | (80,680 | ) | -0.10 | % | — | 0.00 | % | ||||||||||||||
| Various interest rates futures contracts (Canada) |
25,302 | 0.01 | % | 57,298 | 0.08 | % | — | 0.00 | % | — | 0.00 | % | ||||||||||||||||
| Various interest rates futures contracts (Europe) |
400,577 | 0.12 | % | 1,120,595 | 1.52 | % | 152,684 | 0.20 | % | — | 0.00 | % | ||||||||||||||||
| Various interest rates futures contracts (Far East) |
214,448 | 0.06 | % | 210,136 | 0.29 | % | 38,094 | 0.05 | % | — | 0.00 | % | ||||||||||||||||
| Various precious metals futures contracts (U.S.) |
760,620 | 0.23 | % | — | 0.00 | % | 3,340 | 0.00 | % | — | 0.00 | % | ||||||||||||||||
| Various soft futures contracts (U.S.) |
1,450,205 | 0.43 | % | 8,930 | 0.01 | % | 290 | 0.00 | % | — | 0.00 | % | ||||||||||||||||
| Various soft futures contracts (Europe) |
155,590 | 0.05 | % | 51,098 | 0.07 | % | 2,660 | 0.00 | % | — | 0.00 | % | ||||||||||||||||
| Various soft futures contracts (Canada) |
— | 0.00 | % | — | 0.00 | % | — | 0.00 | % | — | 0.00 | % | ||||||||||||||||
| Various stock index futures contracts (U.S.) |
119,055 | 0.04 | % | 935 | 0.00 | % | 2,274 | 0.00 | % | — | 0.00 | % | ||||||||||||||||
| Various stock index futures contracts (Canada) |
— | 0.00 | % | — | 0.00 | % | — | 0.00 | % | — | 0.00 | % | ||||||||||||||||
| Various stock index futures contracts (Europe) |
34,898 | 0.01 | % | — | 0.00 | % | — | 0.00 | % | — | 0.00 | % | ||||||||||||||||
| Various stock index futures contracts (Far East) |
133,008 | 0.03 | % | — | 0.00 | % | — | 0.00 | % | — | 0.00 | % | ||||||||||||||||
| Total Long Futures Contracts |
$ | (9,102,251 | ) | -2.73 | % | $ | 2,697,992 | 3.65 | % | $ | 119,496 | 0.15 | % | $ | — | 0.00 | % | |||||||||||
| LONG OPTIONS * |
$ | 19,791,432 | 5.93 | % | $ | — | 0.00 | % | $ | — | 0.00 | % | $ | — | 0.00 | % | ||||||||||||
| LONG CURRENCY FORWARDS * |
$ | 119,914 | 0.04 | % | $ | — | 0.00 | % | $ | 148,701 | 0.19 | % | $ | (53,532 | ) | -0.36 | % | |||||||||||
| SHORT FUTURES CONTRACTS * |
||||||||||||||||||||||||||||
| Various base metals futures contracts (U.S.) |
$ | 15,978,874 | 4.79 | % | $ | 501,985 | 0.68 | % | $ | 41,677 | 0.04 | % | $ | — | 0.00 | % | ||||||||||||
| Various currency futures contracts (US) |
117,766 | 0.04 | % | (456,100 | ) | -0.62 | % | 625 | 0.00 | % | — | 0.00 | % | |||||||||||||||
| Various currency futures contracts (Canada) |
(9,283 | ) | 0.00 | % | — | 0.00 | % | — | 0.00 | % | — | 0.00 | % | |||||||||||||||
| Various currency futures contracts (Europe) |
37,430 | 0.01 | % | — | 0.00 | % | (5,097 | ) | -0.01 | % | — | 0.00 | % | |||||||||||||||
| Various currency futures contracts (Far East) |
(36,957 | ) | -0.01 | % | — | 0.00 | % | — | 0.00 | % | — | 0.00 | % | |||||||||||||||
| Various energy futures contracts (U.S.) |
830,528 | 0.25 | % | 109,091 | 0.15 | % | (7,363 | ) | -0.01 | % | — | 0.00 | % | |||||||||||||||
| Various interest rates futures contracts (U.S.) |
(340,369 | ) | -0.10 | % | — | 0.00 | % | — | 0.00 | % | — | 0.00 | % | |||||||||||||||
| Various interest rates futures contracts (Canada) |
(2,139 | ) | 0.00 | % | — | 0.00 | % | — | 0.00 | % | — | 0.00 | % | |||||||||||||||
| Various interest rates futures contracts (Europe) |
(26,077 | ) | -0.01 | % | — | 0.00 | % | — | 0.00 | % | — | 0.00 | % | |||||||||||||||
| Various interest rates futures contracts (Far East) |
(58,831 | ) | -0.02 | % | (3,652 | ) | 0.00 | % | (1,075 | ) | 0.00 | % | — | 0.00 | % | |||||||||||||
| Various precious metals futures contracts (U.S.) |
(172,610 | ) | -0.05 | % | (11,840 | ) | -0.02 | % | (4,930 | ) | -0.01 | % | — | 0.00 | % | |||||||||||||
| Various soft futures contracts (U.S.) |
(841,206 | ) | -0.25 | % | (628,657 | ) | -0.85 | % | (83,229 | ) | -0.10 | % | — | 0.00 | % | |||||||||||||
| Various soft futures contracts (Canada) |
— | 0.00 | % | (1,171 | ) | 0.00 | % | — | 0.00 | % | 0.00 | % | ||||||||||||||||
| Various soft futures contracts (Europe) |
(56,202 | ) | -0.02 | % | — | 0.00 | % | — | 0.00 | % | — | 0.00 | % | |||||||||||||||
| Various stock index futures contracts (U.S.) |
(25,725 | ) | -0.01 | % | (22,255 | ) | -0.03 | % | (290 | ) | 0.00 | % | — | 0.00 | % | |||||||||||||
| Various stock index futures contracts (Canada) |
— | 0.00 | % | (4,155 | ) | -0.01 | % | — | 0.00 | % | — | 0.00 | % | |||||||||||||||
| Various stock index futures contracts (Europe) |
(24,304 | ) | -0.01 | % | (22,869 | ) | -0.03 | % | (5,296 | ) | -0.01 | % | — | 0.00 | % | |||||||||||||
| Various stock index futures contracts (Far East) |
(18,424 | ) | -0.01 | % | — | 0.00 | % | (4,799 | ) | -0.01 | % | — | 0.00 | % | ||||||||||||||
| Total Short Futures Contracts |
$ | 15,352,471 | 4.60 | % | $ | (539,623 | ) | -0.73 | % | $ | (69,777 | ) | -0.09 | % | $ | — | 0.00 | % | ||||||||||
| SHORT OPTIONS * |
$ | (3,378,636 | ) | -1.01 | % | $ | — | 0.00 | % | $ | — | 0.00 | % | $ | — | 0.00 | % | |||||||||||
| SHORT CURRENCY FORWARDS * |
$ | 366,597 | 0.11 | % | $ | — | 0.00 | % | $ | (309,946 | ) | -0.39 | % | $ | 66,342 | 0.45 | % | |||||||||||
| Total Open Trade Equity |
$ | 23,149,527 | 6.94 | % | $ | 2,158,369 | 2.92 | % | $ | (111,526 | ) | -0.14 | % | $ | 12,810 | 0.09 | % | |||||||||||
| SWAPS (1) |
$ | 53,072,356 | 15.91 | % | $ | — | 0.00 | % | $ | — | 0.00 | % | $ | 9,122,121 | 62.73 | % | ||||||||||||
U.S. TREASURY SECURITIES
| FACE VALUE |
Fair Value | Fair Value | Fair Value | Fair Value | ||||||||||||||||||||||
| $36,500,000.00 | US Treasury Note 3.875% due 02/15/2013 (Cost $38,125,391) |
21,217,648 | 6.36 | % | 6,358,802 | 8.59 | % | 4,619,723 | 5.94 | % | 1,858,412 | 12.51 | % | |||||||||||||
| $36,700,000.00 | US Treasury Note 4.000% due 02/15/2015 (Cost $38,016,039) |
21,824,892 | 6.54 | % | 6,540,790 | 8.84 | % | 4,751,938 | 6.11 | % | 1,911,599 | 12.88 | % | |||||||||||||
| $ | 43,042,540 | 12.90 | % | $ | 12,899,592 | 17.43 | % | $ | 9,371,661 | 12.05 | % | $ | 3,770,011 | 25.39 | % | |||||||||||
Certificate of Deposits
| FACE VALUE |
Fair Value | Fair Value | Fair Value | Fair Value | ||||||||||||||||||||||
| $85,000,000.00 | Certificate of Deposits 2.19% due 09/15/2009 (Cost $85,000,000) |
$ | 34,091,481 | 10.22 | % | $ | 14,085,571 | 19.03 | % | $ | 12,866,065 | 16.54 | % | $ | 3,506,438 | 23.62 | % | |||||||||
| * | No individual futures, forwards and option on futures contract position constituted greater than 1 percent of Net Asset Value. Accordingly, the number of contracts and expiration dates are not presented. |
| (1) | See Notes to Financial Statements, Note 4. |
The accompanying notes are an integral part of these statements.
| Additional Disclosure on U.S. Government Securities |
Face Value | Face Value | Face Value | Face Value | ||||||||
| US Treasury Note 3.875% due 02/15/2013 |
19,098,065 | 5,801,607 | 4,111,522 | 1,652,416 | ||||||||
| US Treasury Note 4.000% due 02/15/2015 |
19,202,712 | 5,833,397 | 4,134,051 | 1,661,471 | ||||||||
| $ | 38,300,778 | $ | 11,635,004 | $ | 8,245,573 | $ | 3,313,887 | |||||
| Cost | Cost | Cost | Cost | |||||||||
| US Treasury Note 3.875% due 02/15/2013 |
19,948,526 | 6,059,960 | 4,294,613 | 1,726,000 | ||||||||
| US Treasury Note 4.000% due 02/15/2015 |
19,891,310 | 6,042,579 | 4,282,295 | 1,721,050 | ||||||||
| $ | 39,839,836 | $ | 12,102,539 | $ | 8,576,908 | $ | 3,447,050 | |||||
11
Table of Contents
The Frontier Fund
Condensed Schedule of Investments
December 31, 2008
| Winton/Graham Series | Long Only Commodity Series | Long/Short Commodity Series | Managed Futures Index Series | ||||||||||||||||||||||
| Value | % of Net Asset Value |
Value | % of Net Asset Value |
Value | % of Net Asset Value |
Value | % of Net Asset Value |
||||||||||||||||||
| LONG FUTURES CONTRACTS |
|||||||||||||||||||||||||
| Various base metals futures contracts (U.S.) |
$ | — | 0.00 | % | $ | — | 0.00 | % | $ | (5,895,303 | ) | -10.21 | % | $ | — | 0.00 | % | ||||||||
| Silver @ Comex Settling 5/1/2009 (Number of Contracts: 647) |
— | 0.00 | % | — | 0.00 | % | 2,997,465 | 5.19 | % | — | 0.00 | % | |||||||||||||
| Silver @ Comex Settling 7/1/2009 (Number of Contracts: 1,096) |
— | 0.00 | % | — | 0.00 | % | 3,008,100 | 5.21 | % | — | 0.00 | % | |||||||||||||
| Silver @ Comex Settling 12/1/2009 (Number of Contracts: 736) |
— | 0.00 | % | — | 0.00 | % | 2,138,080 | 3.70 | % | — | 0.00 | % | |||||||||||||
| Various currency futures contracts (U.S.) |
— | 0.00 | % | — | 0.00 | % | 166,320 | 0.29 | % | — | 0.00 | % | |||||||||||||
| Various currency futures contracts (Canada) |
— | 0.00 | % | — | 0.00 | % | — | 0.00 | % | — | 0.00 | % | |||||||||||||
| Various currency futures contracts (Europe) |
— | 0.00 | % | — | 0.00 | % | — | 0.00 | % | — | 0.00 | % | |||||||||||||
| Various currency futures contracts (Far East) |
— | 0.00 | % | — | 0.00 | % | — | 0.00 | % | — | 0.00 | % | |||||||||||||
| Various energy futures contracts (U.S.) |
— | 0.00 | % | — | 0.00 | % | (522,392 | ) | -0.90 | % | — | 0.00 | % | ||||||||||||
| Various energy futures contracts (Far East) |
— | 0.00 | % | — | 0.00 | % | — | 0.00 | % | — | 0.00 | % | |||||||||||||
| Various interest rates futures contracts (U.S.) |
— | 0.00 | % | — | 0.00 | % | (391 | ) | 0.00 | % | — | 0.00 | % | ||||||||||||
| Various interest rates futures contracts (Canada) |
— | 0.00 | % | — | 0.00 | % | — | 0.00 | % | — | 0.00 | % | |||||||||||||
| Various interest rates futures contracts (Europe) |
— | 0.00 | % | — | 0.00 | % | — | 0.00 | % | — | 0.00 | % | |||||||||||||
| Various interest rates futures contracts (Far East) |
— | 0.00 | % | — | 0.00 | % | — | 0.00 | % | — | 0.00 | % | |||||||||||||
| Various precious metals futures contracts (U.S.) |
— | 0.00 | % | — | 0.00 | % | 342,510 | 0.59 | % | — | 0.00 | % | |||||||||||||
| Various soft futures contracts (U.S.) |
— | 0.00 | % | — | 0.00 | % | 248,808 | 0.43 | % | — | 0.00 | % | |||||||||||||
| Sugar #11 Settling 7/1/2009 (Number of Contracts: 459) |
— | 0.00 | % | — | 0.00 | % | (1,403,438 | ) | -2.43 | % | — | 0.00 | % | ||||||||||||
| Various soft futures contracts (Far East) |
— | 0.00 | % | — | 0.00 | % | (35 | ) | 0.00 | % | — | 0.00 | % | ||||||||||||
| Various soft futures contracts (Europe) |
— | 0.00 | % | — | 0.00 | % | 100,872 | 0.18 | % | — | 0.00 | % | |||||||||||||
| Various soft futures contracts (Canada) |
— | 0.00 | % | — | 0.00 | % | 377 | 0.00 | % | — | 0.00 | % | |||||||||||||
| Various stock index futures contracts (U.S.) |
— | 0.00 | % | — | 0.00 | % | — | 0.00 | % | — | 0.00 | % | |||||||||||||
| Various stock index futures contracts (Canada) |
— | 0.00 | % | — | 0.00 | % | — | 0.00 | % | — | 0.00 | % | |||||||||||||
| Various stock index futures contracts (Europe) |
— | 0.00 | % | — | 0.00 | % | — | 0.00 | % | — | 0.00 | % | |||||||||||||
| Various stock index futures contracts (Far East) |
— | 0.00 | % | — | 0.00 | % | — | 0.00 | % | — | 0.00 | % | |||||||||||||
| Total Long Futures Contracts |
$ | — | 0.00 | % | $ | — | 0.00 | % | $ | 1,180,974 | 2.05 | % | $ | — | 0.00 | % | |||||||||
| LONG OPTIONS * |
$ | — | 0.00 | % | $ | — | 0.00 | % | 285,120 | 0.49 | % | $ | — | 0.00 | % | ||||||||||
| LONG CURRENCY FORWARDS * |
$ | — | 0.00 | % | $ | — | 0.00 | % | $ | — | 0.00 | % | $ | — | 0.00 | % | |||||||||
| SHORT FUTURES CONTRACTS |
|||||||||||||||||||||||||
| Various base metals futures contracts (U.S.) |
$ | — | 0.00 | % | $ | — | 0.00 | % | $ | 132,765 | 0.23 | % | $ | — | 0.00 | % | |||||||||
| Silver @ Comex Settling 3/1/2009 (Number of Contracts: 2,054) |
— | 0.00 | % | — | 0.00 | % | 10,272,220 | 17.79 | % | — | 0.00 | % | |||||||||||||
| Silver @ Comex Settling 9/1/2009 (Number of Contracts: 356) |
— | 0.00 | % | — | 0.00 | % | (1,034,180 | ) | -1.79 | % | — | 0.00 | % | ||||||||||||
| Various currency futures contracts (U.S.) |
— | 0.00 | % | — | 0.00 | % | (29,640 | ) | -0.05 | % | — | 0.00 | % | ||||||||||||
| Various currency futures contracts (Canada) |
— | 0.00 | % | — | 0.00 | % | — | 0.00 | % | — | 0.00 | % | |||||||||||||
| Various currency futures contracts (Europe) |
— | 0.00 | % | — | 0.00 | % | — | 0.00 | % | — | 0.00 | % | |||||||||||||
| Various currency futures contracts (Far East) |
— | 0.00 | % | — | 0.00 | % | — | 0.00 | % | — | 0.00 | % | |||||||||||||
| Various energy futures contracts (U.S.) |
— | 0.00 | % | — | 0.00 | % | (1,329,703 | ) | -2.30 | % | — | 0.00 | % | ||||||||||||
| Various interest rates futures contracts (US) |
— | 0.00 | % | — | 0.00 | % | (234 | ) | 0.00 | % | — | 0.00 | % | ||||||||||||
| Various interest rates futures contracts (Canada) |
— | 0.00 | % | — | 0.00 | % | — | 0.00 | % | — | 0.00 | % | |||||||||||||
| Various interest rates futures contracts (Europe) |
— | 0.00 | % | — | 0.00 | % | — | 0.00 | % | — | 0.00 | % | |||||||||||||
| Various interest rates futures contracts (Far East) |
— | 0.00 | % | — | 0.00 | % | — | 0.00 | % | — | 0.00 | % | |||||||||||||
| Various precious metals futures contracts (U.S.) |
— | 0.00 | % | — | 0.00 | % | — | 0.00 | % | — | 0.00 | % | |||||||||||||
| Various soft futures contracts (U.S.) |
— | 0.00 | % | — | 0.00 | % | 408,296 | 0.71 | % | — | 0.00 | % | |||||||||||||
| Coffee @ CSCE Settling 3/1/2009 (Number of Contracts 740) |
— | 0.00 | % | — | 0.00 | % | 1,345,875 | 2.32 | % | — | 0.00 | % | |||||||||||||
| Various soft futures contracts (Europe) |
— | 0.00 | % | — | 0.00 | % | — | 0.00 | % | — | 0.00 | % | |||||||||||||
| Various stock index futures contracts (U.S.) |
— | 0.00 | % | — | 0.00 | % | (12,545 | ) | -0.02 | % | — | 0.00 | % | ||||||||||||
| Various stock index futures contracts (Europe) |
— | 0.00 | % | — | 0.00 | % | — | 0.00 | % | — | 0.00 | % | |||||||||||||
| Various stock index futures contracts (Far East) |
— | 0.00 | % | — | 0.00 | % | — | 0.00 | % | — | 0.00 | % | |||||||||||||
| Total Short Futures Contracts |
$ | — | 0.00 | % | $ | — | 0.00 | % | $ | 9,752,854 | 16.89 | % | $ | — | 0.00 | % | |||||||||
| SHORT OPTIONS * |
$ | — | 0.00 | % | $ | — | 0.00 | % | $ | (465,185 | ) | -0.80 | % | $ | — | 0.00 | % | ||||||||
| SHORT CURRENCY FORWARDS * |
$ | — | 0.00 | % | $ | — | 0.00 | % | $ | — | 0.00 | % | $ | — | 0.00 | % | |||||||||
| Total Open Trade Equity |
$ | — | 0.00 | % | $ | — | 0.00 | % | $ | 10,753,763 | 18.63 | % | $ | — | 0.00 | % | |||||||||
| SWAPS (1) |
$ | — | 0.00 | % | $ | 836,554 | 20.69 | % | $ | — | 0.00 | % | $ | — | 0.00 | % | |||||||||
U.S. TREASURY SECURITIES
| FACE VALUE |
Fair Value | Fair Value | Fair Value | Fair Value | ||||||||||||||||||||||
| $36,500,000.00 | US Treasury Note 3.875% due 02/15/2013 (Cost $38,125,391) |
702,096 | 1.40 | % | 611,888 | 15.14 | % | 5,202,833 | 9.01 | % | 69,067 | 2.03 | % | |||||||||||||
| $36,700,000.00 | US Treasury Note 4.000% due 02/15/2015 (Cost $38,016,039) |
722,190 | 1.44 | % | 629,401 | 15.57 | % | 5,351,738 | 9.27 | % | 71,044 | 2.09 | % | |||||||||||||
| $ | 1,424,286 | 2.84 | % | $ | 1,241,289 | 30.71 | % | $ | 10,554,571 | 18.28 | % | $ | 140,111 | 4.12 | % | |||||||||||
Certificate of Deposits
| FACE VALUE |
Fair Value | Fair Value | Fair Value | Fair Value | ||||||||||||||||||||||
| $85,000,000.00 | Certificate of Deposits 2.19% due 09/15/2009 (Cost $85,000,000) |
$ | 8,675,748 | 17.28 | % | $ | 440,781 | 10.90 | % | $ | 10,923,009 | 18.92 | % | $ | 488,470 | 14.35 | % | |||||||||
| * | No individual futures, forwards and option on futures contract position constituted greater than 1 percent of Net Asset Value. Accordingly, the number of contracts and expiration dates are not presented. |
| (1) | See Notes to Financial Statements, Note 4. |
The accompanying notes are an integral part of these statements.
| Additional Disclosure on U.S. Government Securities |
Face Value | Face Value | Face Value | Face Value | ||||||||
| US Treasury Note 3.875% due 02/15/2013 |
465,088 | 569,909 | 4,750,169 | 51,223 | ||||||||
| US Treasury Note 4.000% due 02/15/2015 |
467,636 | 573,032 | 4,776,197 | 51,504 | ||||||||
| $ | 932,724 | $ | 1,142,941 | $ | 9,526,366 | $ | 102,727 | |||||
| Cost | Cost | Cost | Cost | |||||||||
| US Treasury Note 3.875% due 02/15/2013 |
485,799 | 595,288 | 4,961,700 | 53,504 | ||||||||
| US Treasury Note 4.000% due 02/15/2015 |
484,406 | 593,581 | 4,947,469 | 53,351 | ||||||||
| $ | 970,204 | $ | 1,188,869 | $ | 9,909,169 | $ | 106,855 | |||||
12
Table of Contents
Statements of Operations
For the Three Months Ended September 30, 2009 and 2008
| Frontier Diversified Series (1) (Unaudited) |
Frontier Dynamic Series (1) (Unaudited) |
Frontier Long/Short Commodity Series (Unaudited) |
||||||||||||||||||||
| 9/30/2009 | 9/30/2008 | 9/30/2009 | 9/30/2008 | 9/30/2009 | 9/30/2008 | |||||||||||||||||
| Investment Income: |
||||||||||||||||||||||
| Interest—net |
$ | 173,574 | $ | — | $ | 129,833 | $ | — | $ | 292,640 | $ | 262,117 | ||||||||||
| Total Income |
173,574 | — | 129,833 | — | 292,640 | 262,117 | ||||||||||||||||
| Expenses: |
||||||||||||||||||||||
| Incentive Fees |
103,872 | — | — | — | 394,978 | 215,120 | ||||||||||||||||
| Management Fees |
61,573 | — | — | — | 756,119 | 522,660 | ||||||||||||||||
| Service Fees—Class 1 |
37,029 | — | 19,136 | — | 355,681 | 383,515 | ||||||||||||||||
| Trading Fees |
238,385 | — | 175,705 | — | 84,684 | 74,726 | ||||||||||||||||
| Total Expenses |
440,859 | — | 194,841 | — | 1,591,462 | 1,196,021 | ||||||||||||||||
| Investment gain/(loss)—net |
(267,285 | ) | — | (65,008 | ) | — | (1,298,822 | ) | (933,904 | ) | ||||||||||||
| Realized and unrealized gain (loss) on investments: |
||||||||||||||||||||||
| Net realized gain/(loss) on futures and forwards |
— | — | — | — | 53,306,171 | 2,449,546 | ||||||||||||||||
| Net change in open trade equity |
— | — | — | — | (51,160,135 | ) | (4,358,191 | ) | ||||||||||||||
| Net unrealized gain/(loss) on swap contracts |
129,598 | — | 8,640 | — | — | — | ||||||||||||||||
| Net unrealized gain/(loss) on treasuries |
44,283 | — | 28,009 | — | 65,992 | 403,667 | ||||||||||||||||
| Trading commissions |
— | — | — | — | (819,160 | ) | (306,310 | ) | ||||||||||||||
| Earnings in investments in inter-series payables |
(451,702 | ) | — | 26,501 | — | — | — | |||||||||||||||
| Equity in earnings/(loss) from trading companies |
693,855 | — | — | — | 266,024 | — | ||||||||||||||||
| Net gain/(loss) on investments |
416,034 | — | 63,150 | — | 1,658,892 | (1,811,288 | ) | |||||||||||||||
| NET INCREASE/(DECREASE) IN OWNERS’ CAPITAL RESULTING FROM OPERATIONS |
$ | 148,749 | $ | — | $ | (1,858 | ) | $ | — | $ | 360,070 | $ | (2,745,192 | ) | ||||||||
| Less: Operations attributable to Non-controlling interests |
— | — | — | — | (424,637 | ) | 1,604,993 | |||||||||||||||
| NET INCREASE/(DECREASE) IN OWNERS’ CAPITAL RESULTING FROM OPERATIONS ATTRIBUTABLE TO CONTROLLING INTERESTS |
$ | 148,749 | $ | — | $ | (1,858 | ) | $ | — | $ | 784,707 | $ | (4,350,185 | ) | ||||||||
| NET INCOME/(LOSS) PER UNIT |
||||||||||||||||||||||
| Class 1 |
$ | 0.84 | N/A | $ | (0.51 | ) | N/A | $ | 1.04 | $ | (8.17 | ) | ||||||||||
| Class 1a |
N/A | N/A | N/A | N/A | $ | 1.04 | N/A | |||||||||||||||
| Class 2 |
$ | 1.29 | N/A | $ | (0.09 | ) | N/A | $ | 2.06 | $ | (7.91 | ) | ||||||||||
| Class 2a |
N/A | N/A | N/A | N/A | $ | 1.45 | N/A | |||||||||||||||
| Class 3 |
N/A | N/A | N/A | N/A | $ | 2.07 | N/A | |||||||||||||||
| (1) | The Frontier Diversified Series and Frontier Dynamic Series began trading operations on June 9, 2009 |
The accompanying notes are an integral part of these statements.
13
Table of Contents
The Frontier Fund
Statements of Operations
For the Three Months Ended September 30, 2009 and 2008
| Frontier Masters (1) (Unaudited) |
Balanced Series (Unaudited) |
Campbell/Graham/Tiverton Series (Unaudited) |
|||||||||||||||||||||
| 9/30/2009 | 9/30/2008 | 9/30/2009 | 9/30/2008 | 9/30/2009 | 9/30/2008 | ||||||||||||||||||
| Investment Income: |
|||||||||||||||||||||||
| Interest—net |
$ | 127,057 | $ | — | $ | 304,459 | $ | 196,535 | $ | 70,057 | $ | 50,305 | |||||||||||
| Total Income |
127,057 | — | 304,459 | 196,535 | 70,057 | 50,305 | |||||||||||||||||
| Expenses: |
|||||||||||||||||||||||
| Incentive Fees |
— | — | 1,617,711 | 1,136,659 | 218,702 | 121,505 | |||||||||||||||||
| Management Fees |
114,063 | — | 258,424 | 320,409 | 577,342 | 516,447 | |||||||||||||||||
| Service Fees—Class 1 |
22,973 | — | 2,346,679 | 1,664,320 | 537,325 | 448,880 | |||||||||||||||||
| Trading Fees |
173,101 | — | 426,936 | 469,193 | 101,597 | 104,899 | |||||||||||||||||
| Total Expenses |
310,137 | — | 4,649,750 | 3,590,581 | 1,434,966 | 1,191,731 | |||||||||||||||||
| Investment gain/(loss)—net |
(183,080 | ) | — | (4,345,291 | ) | (3,394,046 | ) | (1,364,909 | ) | (1,141,426 | ) | ||||||||||||
| Realized and unrealized gain (loss) on investments: |
|||||||||||||||||||||||
| Net realized gain/(loss) on futures and forwards |
— | — | (173,572 | ) | (5,135,240 | ) | — | (29,190,201 | ) | ||||||||||||||
| Net change in open trade equity |
— | — | 11,495,083 | 3,400,142 | — | 27,382,678 | |||||||||||||||||
| Net unrealized gain/(loss) on swap contracts |
(191,513 | ) | — | 463,817 | 1,096,125 | — | — | ||||||||||||||||
| Net unrealized gain/(loss) on treasuries |
28,097 | — | 268,598 | 1,697,797 | 76,368 | 419,574 | |||||||||||||||||
| Trading commissions |
— | — | (440,022 | ) | (201,029 | ) | — | (33,578 | ) | ||||||||||||||
| Earnings in investments in inter-series receivables |
— | — | 141,506 | (1,256,626 | ) | — | — | ||||||||||||||||
| Earnings in investments in inter-series payables |
(222,585 | ) | — | — | — | — | |||||||||||||||||
| Equity in earnings/(loss) from trading companies |
651,946 | — | 220,063 | (1,501,740 | ) | 3,933,641 | 87,138 | ||||||||||||||||
| Net gain/(loss) on investments |
265,945 | — | 11,975,473 | (1,900,571 | ) | 4,010,009 | (1,334,389 | ) | |||||||||||||||
| NET INCREASE/(DECREASE) IN OWNERS’ CAPITAL RESULTING FROM OPERATIONS |
$ | 82,865 | $ | — | $ | 7,630,182 | $ | (5,294,617 | ) | $ | 2,645,100 | $ | (2,475,815 | ) | |||||||||
| Less: Operations attributable to Non-controlling interests |
— | — | 2,478,828 | (38,902 | ) | — | (573,067 | ) | |||||||||||||||
| NET INCREASE/(DECREASE) IN OWNERS’ CAPITAL RESULTING FROM OPERATIONS ATTRIBUTABLE TO CONTROLLING INTERESTS |
$ | 82,865 | $ | — | $ | 5,151,354 | $ | (5,255,715 | ) | $ | 2,645,100 | $ | (1,902,748 | ) | |||||||||
| NET INCOME/(LOSS) PER UNIT |
|||||||||||||||||||||||
| Class 1 |
$ | 0.35 | N/A | $ | 1.39 | $ | (2.43 | ) | $ | 3.26 | $ | (2.91 | ) | ||||||||||
| Class 1a |
N/A | N/A | $ | 1.07 | $ | (2.21 | ) | N/A | N/A | ||||||||||||||
| Class 2 |
$ | 0.79 | N/A | $ | 2.68 | $ | (1.77 | ) | $ | 4.63 | $ | (2.39 | ) | ||||||||||
| Class 2a |
N/A | N/A | $ | 2.09 | $ | (1.54 | ) | N/A | N/A | ||||||||||||||
| Class 3 |
N/A | N/A | $ | 2.08 | N/A | N/A | N/A | ||||||||||||||||
| (1) | The Frontier Masters Series began trading operations on June 9, 2009 |
The accompanying notes are an integral part of these statements.
14
Table of Contents
The Frontier Fund
Statements of Operations
For the Three Months Ended September 30, 2009 and 2008
| Currency Series (Unaudited) |
Long Only Commodity Series (Unaudited) |
Managed Futures Index Series (Unaudited) |
||||||||||||||||||||||
| 9/30/2009 | 9/30/2008 | 9/30/2009 | 9/30/2008 | 9/30/2009 | 9/30/2008 | |||||||||||||||||||
| Investment Income: |
||||||||||||||||||||||||
| Interest—net |
$ | 21,513 | $ | 15,163 | $ | 19,060 | $ | 31,699 | $ | 19,088 | $ | 8,831 | ||||||||||||
| Total Income |
21,513 | 15,163 | 19,060 | 31,699 | 19,088 | 8,831 | ||||||||||||||||||
| Expenses: |
||||||||||||||||||||||||
| Management Fees |
38,751 | 41,643 | 13,603 | 21,859 | 21,711 | 9,295 | ||||||||||||||||||
| Service Fees—Class 1 |
72,949 | 94,503 | 17,712 | 31,286 | 10,670 | 7,293 | ||||||||||||||||||
| Trading Fees |
31,210 | 35,478 | 5,423 | 8,742 | 5,491 | 2,323 | ||||||||||||||||||
| Total Expenses |
142,910 | 171,624 | 36,738 | 61,887 | 37,872 | 18,911 | ||||||||||||||||||
| Investment gain/(loss)—net |
(121,397 | ) | (156,461 | ) | (17,678 | ) | (30,188 | ) | (18,784 | ) | (10,080 | ) | ||||||||||||
| Realized and unrealized gain (loss) on investments: |
||||||||||||||||||||||||
| Net realized gain/(loss) on futures and forwards |
(103,475 | ) | 66,774 | — | — | — | — | |||||||||||||||||
| Net realized gain/(loss) on swap contracts |
— | 142,148 | 152,294 | (2,035,103 | ) | — | — | |||||||||||||||||
| Net change in open trade equity |
32,902 | (63,121 | ) | — | — | — | — | |||||||||||||||||
| Net unrealized gain/(loss) on swap contracts |
(892,495 | ) | (2,686,817 | ) | — | — | — | — | ||||||||||||||||
| Net unrealized gain/(loss) on treasuries |
22,748 | 188,362 | 4,481 | 48,689 | 3,933 | 12,510 | ||||||||||||||||||
| Earnings in investments in inter-series payables |
506,280 | 1,256,626 | — | — | — | — | ||||||||||||||||||
| Equity in earnings/(loss) from trading companies |
— | — | — | — | (86,313 | ) | (126,040 | ) | ||||||||||||||||
| Net gain/(loss) on investments |
(434,040 | ) | (1,096,028 | ) | 156,775 | (1,986,414 | ) | (82,380 | ) | (113,530 | ) | |||||||||||||
| NET INCREASE/(DECREASE) IN OWNERS’ CAPITAL RESULTING FROM OPERATIONS |
$ | (555,437 | ) | $ | (1,252,489 | ) | $ | 139,097 | $ | (2,016,602 | ) | $ | (101,164 | ) | $ | (123,610 | ) | |||||||
| NET INCOME/(LOSS) PER UNIT |
||||||||||||||||||||||||
| Class 1 |
$ | (3.91 | ) | $ | (8.21 | ) | $ | 2.35 | $ | (35.13 | ) | $ | (3.08 | ) | $ | (7.36 | ) | |||||||
| Class 2 |
$ | (3.77 | ) | $ | (8.37 | ) | $ | 2.75 | $ | (36.25 | ) | $ | (2.65 | ) | $ | (7.25 | ) | |||||||
The accompanying notes are an integral part of these statements.
15
Table of Contents
The Frontier Fund
Statements of Operations
For the Three Months Ended September 30, 2009 and 2008
| Winton Series (Unaudited) |
Winton/Graham Series (Unaudited) |
|||||||||||||||
| 9/30/2009 | 9/30/2008 | 9/30/2009 | 9/30/2008 | |||||||||||||
| Investment Income: |
||||||||||||||||
| Interest—net |
$ | 53,124 | $ | 54,392 | $ | 55,724 | $ | 20,175 | ||||||||
| Total Income |
53,124 | 54,392 | 55,724 | 20,175 | ||||||||||||
| Expenses: |
||||||||||||||||
| Incentive Fees |
— | 68,029 | 256,842 | (4,296 | ) | |||||||||||
| Management Fees |
328,132 | 309,407 | 438,658 | 169,037 | ||||||||||||
| Service Fees—Class 1 |
387,216 | 459,437 | 367,929 | 153,363 | ||||||||||||
| Trading Fees |
76,757 | 77,496 | 76,851 | 33,823 | ||||||||||||
| Total Expenses |
792,105 | 914,369 | 1,140,280 | 351,927 | ||||||||||||
| Investment gain/(loss)—net |
(738,981 | ) | (859,977 | ) | (1,084,556 | ) | (331,752 | ) | ||||||||
| Realized and unrealized gain (loss) on investments: |
||||||||||||||||
| Net realized gain/(loss) on futures and forwards |
— | (4,411,169 | ) | 4,142,722 | — | |||||||||||
| Net change in open trade equity |
— | (5,110,363 | ) | 1,987,351 | — | |||||||||||
| Net unrealized gain/(loss) on treasuries |
54,429 | 459,506 | 58,162 | 179,143 | ||||||||||||
| Trading commissions |
— | (38,011 | ) | (156,002 | ) | — | ||||||||||
| Equity in earnings/(loss) from trading companies |
1,101,443 | 492,187 | (1,635,848 | ) | ||||||||||||
| Net gain/(loss) on investments |
1,155,872 | (9,100,037 | ) | 6,524,420 | (1,456,705 | ) | ||||||||||
| NET INCREASE/(DECREASE) IN OWNERS’ CAPITAL RESULTING FROM OPERATIONS |
$ | 416,891 | $ | (9,960,014 | ) | $ | 5,439,864 | $ | (1,788,457 | ) | ||||||
| Less: Operations attributable to Non-controlling interests |
— | (4,169,514 | ) | 2,782,172 | — | |||||||||||
| NET INCREASE/(DECREASE) IN OWNERS’ CAPITAL RESULTING FROM OPERATIONS ATTRIBUTABLE TO CONTROLLING INTERESTS |
$ | 416,891 | $ | (5,790,500 | ) | $ | 2,657,692 | $ | (1,788,457 | ) | ||||||
| NET INCOME/(LOSS) PER UNIT |
||||||||||||||||
| Class 1 |
$ | 0.68 | $ | (9.90 | ) | $ | 4.49 | $ | (7.58 | ) | ||||||
| Class 2 |
$ | 1.72 | $ | (9.52 | ) | $ | 6.14 | $ | (7.57 | ) | ||||||
The accompanying notes are an integral part of these statements.
16
Table of Contents
The Frontier Fund
Statements of Operations
For the Nine Months Ended September 30, 2009 and 2008
| Frontier Diversified Series (1) (Unaudited) |
Frontier Dynamic Series (1) (Unaudited) |
Frontier Long/Short Commodity Series (Unaudited) |
||||||||||||||||||||
| 9/30/2009 | 9/30/2008 | 9/30/2009 | 9/30/2008 | 9/30/2009 | 9/30/2008 | |||||||||||||||||
| Investment Income: |
||||||||||||||||||||||
| Interest—net |
$ | 208,849 | $ | — | $ | 160,028 | $ | — | $ | 936,679 | $ | 681,270 | ||||||||||
| Total Income |
208,849 | — | 160,028 | — | 936,679 | 681,270 | ||||||||||||||||
| Expenses: |
||||||||||||||||||||||
| Incentive Fees |
145,898 | — | — | — | 1,660,433 | 1,458,260 | ||||||||||||||||
| Management Fees |
74,811 | — | — | — | 2,056,185 | 1,155,599 | ||||||||||||||||
| Service Fees—Class 1 |
42,281 | — | 23,633 | — | 1,083,458 | 963,659 | ||||||||||||||||
| Trading Fees |
287,854 | — | 218,030 | — | 259,232 | 164,841 | ||||||||||||||||
| Total Expenses |
550,844 | — | 241,663 | — | 5,059,308 | 3,742,359 | ||||||||||||||||
| Investment gain/(loss)—net |
(341,995 | ) | — | (81,635 | ) | — | (4,122,629 | ) | (3,061,089 | ) | ||||||||||||
| Realized and unrealized gain (loss) on investments: |
||||||||||||||||||||||
| Net realized gain/(loss) on futures and forwards |
— | — | 15 | — | 41,623,183 | (8,102,626 | ) | |||||||||||||||
| Net change in open trade equity |
— | — | — | — | (20,647,197 | ) | 21,219,824 | |||||||||||||||
| Net unrealized gain/(loss) on swap contracts |
(243,013 | ) | — | (873,506 | ) | — | — | — | ||||||||||||||
| Net unrealized gain/(loss) on treasuries |
102,544 | — | 77,722 | — | (299,932 | ) | 187,885 | |||||||||||||||
| Trading commissions |
— | — | — | — | (1,827,550 | ) | (773,889 | ) | ||||||||||||||
| Earnings in investments in inter-series payables |
173,849 | — | 873,964 | — | — | — | ||||||||||||||||
| Equity in earnings/(loss) from trading companies |
456,353 | — | — | — | 233,271 | — | ||||||||||||||||
| Net gain/(loss) on investments |
489,733 | — | 78,195 | — | 19,081,775 | 12,531,194 | ||||||||||||||||
| NET INCREASE/(DECREASE) IN OWNERS’ CAPITAL RESULTING FROM OPERATIONS |
$ | 147,738 | $ | — | $ | (3,440 | ) | $ | — | $ | 14,959,146 | $ | 9,470,105 | |||||||||
| Less: Operations attributable to Non-controlling interests |
— | — | — | — | 8,757,728 | 9,516,808 | ||||||||||||||||
| NET INCREASE/(DECREASE) IN OWNERS’ CAPITAL RESULTING FROM OPERATIONS ATTRIBUTABLE TO CONTROLLING INTERESTS |
$ | 147,738 | $ | — | $ | (3,440 | ) | $ | — | $ | 6,201,418 | $ | (46,703 | ) | ||||||||
| NET INCOME/(LOSS) PER UNIT |
||||||||||||||||||||||
| Class 1 |
$ | (1.05 | ) | N/A | $ | (3.44 | ) | N/A | $ | 9.83 | $ | 2.92 | ||||||||||
| Class 1a |
N/A | N/A | N/A | N/A | $ | (1.43 | ) | N/A | ||||||||||||||
| Class 2 |
$ | (0.50 | ) | N/A | $ | (2.91 | ) | N/A | $ | 13.30 | $ | 5.59 | ||||||||||
| Class 2a |
N/A | N/A | N/A | N/A | $ | (0.91 | ) | N/A | ||||||||||||||
| Class 3 |
N/A | N/A | N/A | N/A | $ | (0.12 | ) | N/A | ||||||||||||||
| (1) | The Frontier Diversified Series and Frontier Dynamic Series began trading operations on June 9, 2009 |
The accompanying notes are an integral part of these statements.
17
Table of Contents
The Frontier Fund
Statements of Operations
For the Nine Months Ended September 30, 2009 and 2008
| Frontier Masters Series(1) (Unaudited) |
Balanced Series (Unaudited) |
Campbell/Graham/Tiverton Series (Unaudited) |
|||||||||||||||||||||
| 9/30/2009 | 9/30/2008 | 9/30/2009 | 9/30/2008 | 9/30/2009 | 9/30/2008 | ||||||||||||||||||
| Investment Income: |
|||||||||||||||||||||||
| Interest—net |
$ | 155,405 | $ | — | $ | 707,619 | $ | 1,030,977 | $ | 267,239 | $ | 236,839 | |||||||||||
| Total Income |
155,405 | — | 707,619 | 1,030,977 | 267,239 | 236,839 | |||||||||||||||||
| Expenses: |
|||||||||||||||||||||||
| Incentive Fees |
9,073 | — | 5,567,945 | 8,755,231 | 216,562 | 1,157,276 | |||||||||||||||||
| Management Fees |
139,150 | — | 1,115,570 | 1,094,981 | 1,677,638 | 1,301,201 | |||||||||||||||||
| Service Fees—Class 1 |
27,199 | — | 6,776,656 | 4,768,834 | 1,606,061 | 1,297,045 | |||||||||||||||||
| Trading Fees |
212,853 | — | 1,489,970 | 1,455,128 | 319,092 | 298,574 | |||||||||||||||||
| Total Expenses |
388,275 | — | 14,950,141 | 16,074,174 | 3,819,353 | 4,054,096 | |||||||||||||||||
| Investment gain/(loss)—net |
(232,870 | ) | — | (14,242,522 | ) | (15,043,197 | ) | (3,552,114 | ) | (3,817,257 | ) | ||||||||||||
| Realized and unrealized gain (loss) on investments: |
|||||||||||||||||||||||
| Net realized gain/(loss) on futures and forwards |
— | — | 7,833,223 | 18,096,994 | (1,617,478 | ) | (21,610,207 | ) | |||||||||||||||
| Net realized gain/(loss) on swap contracts |
— | — | — | (1,429,946 | ) | — | — | ||||||||||||||||
| Net change in open trade equity |
— | — | (1,580,619 | ) | 18,541,312 | (760,231 | ) | 28,274,595 | |||||||||||||||
| Net unrealized gain/(loss) on swap contracts |
(381,111 | ) | — | (1,772,033 | ) | 11,895,301 | — | — | |||||||||||||||
| Net unrealized gain/(loss) on treasuries |
75,024 | — | (2,012,107 | ) | 575,879 | (405,814 | ) | 129,849 | |||||||||||||||
| Trading commissions |
— | — | (1,023,480 | ) | (1,111,955 | ) | (99,835 | ) | (111,822 | ) | |||||||||||||
| Earnings in investments in inter-series receivables |
— | — | (2,952,965 | ) | (1,039,282 | ) | — | — | |||||||||||||||
| Earnings in investments in inter-series payables |
316,111 | — | — | — | — | — | |||||||||||||||||
| Equity in earnings/(loss) from trading companies |
304,624 | — | 6,916,896 | 8,044,771 | 1,327,034 | 2,739,024 | |||||||||||||||||
| Net gain/(loss) on investments |
314,648 | — | 5,408,915 | 53,573,074 | (1,556,324 | ) | 9,421,439 | ||||||||||||||||
| NET INCREASE/(DECREASE) IN OWNERS’ CAPITAL RESULTING FROM OPERATIONS |
$ | 81,778 | $ | — | $ | (8,833,607 | ) | $ | 38,529,877 | $ | (5,108,438 | ) | $ | 5,604,182 | |||||||||
| Less: Operations attributable to Non-controlling interests |
— | — | (1,443,690 | ) | 9,664,065 | (1,336,526 | ) | 1,820,727 | |||||||||||||||
| NET INCREASE/(DECREASE) IN OWNERS’ CAPITAL RESULTING FROM OPERATIONS ATTRIBUTABLE TO CONTROLLING INTERESTS |
$ | 81,778 | $ | — | $ | (7,389,917 | ) | $ | 28,865,812 | $ | (3,771,912 | ) | $ | 3,783,455 | |||||||||
| NET INCOME/(LOSS) PER UNIT |
|||||||||||||||||||||||
| Class 1 |
$ | (1.68 | ) | N/A | $ | (2.72 | ) | $ | 11.58 | $ | (5.25 | ) | $ | 5.56 | |||||||||
| Class 1a |
N/A | N/A | $ | (2.88 | ) | $ | 10.28 | N/A | N/A | ||||||||||||||
| Class 2 |
$ | (1.13 | ) | N/A | $ | 0.08 | $ | 15.66 | $ | (3.22 | ) | $ | 8.48 | ||||||||||
| Class 2a |
N/A | N/A | $ | (0.48 | ) | $ | 13.20 | N/A | N/A | ||||||||||||||
| Class 3a |
N/A | N/A | $ | (1.15 | ) | N/A | N/A | N/A | |||||||||||||||
| (1) | The Frontier Masters Series began trading operations on June 9, 2009 |
The accompanying notes are an integral part of these statements.
18
Table of Contents
The Frontier Fund
Statements of Operations
For the Nine Months Ended September 30, 2009 and 2008
| Currency Series (Unaudited) |
Long Only Commodity Series (Unaudited) |
Managed Futures Index Series (Unaudited) |
||||||||||||||||||||||
| 9/30/2009 | 9/30/2008 | 9/30/2009 | 9/30/2008 | 9/30/2009 | 9/30/2008 | |||||||||||||||||||
| Investment Income: |
||||||||||||||||||||||||
| Interest—net |
$ | 56,439 | $ | 68,817 | $ | 55,508 | $ | 91,076 | $ | 51,136 | $ | 20,959 | ||||||||||||
| Total Income |
56,439 | 68,817 | 55,508 | 91,076 | 51,136 | 20,959 | ||||||||||||||||||
| Expenses: |
||||||||||||||||||||||||
| Management Fees |
120,235 | 124,129 | 38,594 | 61,241 | 56,805 | 21,635 | ||||||||||||||||||
| Service Fees—Class 1 |
236,328 | 259,902 | 50,304 | 88,818 | 31,533 | 16,797 | ||||||||||||||||||
| Trading Fees |
110,991 | 87,451 | 15,413 | 24,493 | 14,694 | 5,406 | ||||||||||||||||||
| Total Expenses |
467,554 | 471,482 | 104,311 | 174,552 | 103,032 | 43,838 | ||||||||||||||||||
| Investment gain/(loss)—net |
(411,115 | ) | (402,665 | ) | (48,803 | ) | (83,476 | ) | (51,896 | ) | (22,879 | ) | ||||||||||||
| Realized and unrealized gain (loss) on investments: |
||||||||||||||||||||||||
| Net realized gain/(loss) on futures and forwards |
(190,562 | ) | 88,091 | — | — | — | — | |||||||||||||||||
| Net realized gain/(loss) on swap contracts |
— | 1,047,794 | 510,253 | (364,033 | ) | — | — | |||||||||||||||||
| Net change in open trade equity |
7,757 | (70,306 | ) | — | — | — | — | |||||||||||||||||
| Net unrealized gain/(loss) on swap contracts |
(2,642,481 | ) | (2,686,817 | ) | — | — | — | — | ||||||||||||||||
| Net unrealized gain/(loss) on treasuries |
(140,507 | ) | 100,440 | (18,199 | ) | 21,612 | (18,568 | ) | 5,153 | |||||||||||||||
| Earnings in investments in inter-series payables |
1,589,041 | 1,039,282 | — | — | — | — | ||||||||||||||||||
| Equity in earnings/(loss) from trading companies |
— | — | — | — | (324,097 | ) | (2,211 | ) | ||||||||||||||||
| Net gain/(loss) on investments |
(1,376,752 | ) | (481,516 | ) | 492,054 | (342,421 | ) | (342,665 | ) | 2,942 | ||||||||||||||
| NET INCREASE/(DECREASE) IN OWNERS’ CAPITAL RESULTING FROM OPERATIONS |
$ | (1,787,867 | ) | $ | (884,181 | ) | $ | 443,251 | $ | (425,897 | ) | $ | (394,561 | ) | $ | (19,937 | ) | |||||||
| NET INCOME/(LOSS) PER UNIT |
||||||||||||||||||||||||
| Class 1 |
$ | (12.32 | ) | $ | (4.95 | ) | $ | 7.17 | $ | (2.45 | ) | $ | (14.45 | ) | $ | 2.17 | ||||||||
| Class 2 |
$ | (11.83 | ) | $ | (3.06 | ) | $ | 8.64 | $ | (0.83 | ) | $ | (13.46 | ) | $ | 3.79 | ||||||||
The accompanying notes are an integral part of these statements.
19
Table of Contents
The Frontier Fund
Statements of Operations
For the Nine Months Ended September 30, 2009 and 2008
| Winton Series | Winton/Graham Series | |||||||||||||||
| (Unaudited) | (Unaudited) | |||||||||||||||
| 9/30/2009 | 9/30/2008 | 9/30/2009 | 9/30/2008 | |||||||||||||
| Investment Income: |
||||||||||||||||
| Interest—net |
$ | 296,808 | $ | 240,620 | $ | 199,524 | $ | 47,920 | ||||||||
| Total Income |
296,808 | 240,620 | 199,524 | 47,920 | ||||||||||||
| Expenses: |
||||||||||||||||
| Incentive Fees |
(21,347 | ) | 1,835,567 | 251,038 | 465,834 | |||||||||||
| Management Fees |
1,049,242 | 813,951 | 1,093,344 | 294,043 | ||||||||||||
| Service Fees—Class 1 |
1,249,973 | 1,231,078 | 1,031,526 | 283,959 | ||||||||||||
| Trading Fees |
255,442 | 203,317 | 207,959 | 58,787 | ||||||||||||
| Total Expenses |
2,533,310 | 4,083,913 | 2,583,867 | 1,102,623 | ||||||||||||
| Investment gain/(loss)—net |
(2,236,502 | ) | (3,843,293 | ) | (2,384,343 | ) | (1,054,703 | ) | ||||||||
| Realized and unrealized gain (loss) on investments: |
||||||||||||||||
| Net realized gain/(loss) on futures and forwards |
(4,684,999 | ) | (2,007,569 | ) | 4,592,315 | — | ||||||||||
| Net change in open trade equity |
(3,608,807 | ) | (2,370,507 | ) | 2,233,216 | — | ||||||||||
| Net unrealized gain/(loss) on treasuries |
(361,497 | ) | 74,383 | (286,546 | ) | 153,000 | ||||||||||
| Trading commissions |
(36,659 | ) | (83,458 | ) | (229,556 | ) | — | |||||||||
| Equity in earnings/(loss) from trading companies |
316,100 | 6,927,252 | (3,259,357 | ) | 953,158 | |||||||||||
| Net gain/(loss) on investments |
(8,375,862 | ) | 2,540,101 | 3,050,072 | 1,106,158 | |||||||||||
| NET INCREASE/(DECREASE) IN OWNERS’ CAPITAL RESULTING FROM OPERATIONS |
$ | (10,612,364 | ) | $ | (1,303,192 | ) | $ | 665,729 | $ | 51,455 | ||||||
| Less: Operations attributable to Non-controlling interests |
(4,066,993 | ) | (2,339,606 | ) | 3,081,608 | — | ||||||||||
| NET INCREASE/(DECREASE) IN OWNERS’ CAPITAL RESULTING FROM OPERATIONS ATTRIBUTABLE TO CONTROLLING INTERESTS |
$ | (6,545,371 | ) | $ | 1,036,414 | $ | (2,415,879 | ) | $ | 51,455 | ||||||
| NET INCOME/(LOSS) PER UNIT |
||||||||||||||||
| Class 1 |
$ | (12.29 | ) | $ | 3.95 | $ | (5.24 | ) | $ | 9.26 | ||||||
| Class 2 |
$ | (10.32 | ) | $ | 6.91 | $ | (3.05 | ) | $ | 12.78 | ||||||
The accompanying notes are an integral part of these statements.
20
Table of Contents
Statements of Changes in Owners’ Capital
For the Nine Months Ended September, 2009 (Unaudited)
| Frontier Diversified Series (1) | Frontier Dynamic Series (1) | ||||||||||||||||||||||||||||||||||||||
| Class 1 | Class 1 | Class 2 | Class 2 | Total | Class 1 | Class 1 | Class 2 | Class 2 | Total | ||||||||||||||||||||||||||||||
| Managing Owner |
Limited Owners |
Managing Owner |
Limited Owners |
Managing Owner |
Limited Owners |
Managing Owner |
Limited Owners |
||||||||||||||||||||||||||||||||
| Owners’ Capital, January 1, 2009 |
$ | — | $ | — | $ | — | $ | — | $ | — | $ | — | $ | — | $ | — | $ | — | $ | — | |||||||||||||||||||
| Sale of Units |
27,500 | 10,382,812 | 177,500 | 8,718,564 | 19,306,376 | 27,500 | 226,618 | 27,500 | 116,700 | 398,318 | |||||||||||||||||||||||||||||
| Redemption of Units |
— | — | — | — | — | — | — | — | — | — | |||||||||||||||||||||||||||||
| Contributions |
— | — | — | — | — | — | — | — | — | — | |||||||||||||||||||||||||||||
| Distributions |
— | — | — | — | — | — | — | — | — | — | |||||||||||||||||||||||||||||
| Net increase/(decrease) in Owners’ Capital resulting from operations |
(288 | ) | 65,207 | (195 | ) | 83,014 | 147,738 | (947 | ) | (796 | ) | (801 | ) | (896 | ) | (3,440 | ) | ||||||||||||||||||||||
| Owners’ Capital, September 30, 2009 |
$ | 27,212 | $ | 10,448,019 | $ | 177,305 | $ | 8,801,578 | $ | 19,454,114 | $ | 26,553 | $ | 225,822 | $ | 26,699 | $ | 115,804 | $ | 394,878 | |||||||||||||||||||
| Owners’ Capital—Units, January 1, 2009 |
— | — | — | — | — | — | — | — | — | — | |||||||||||||||||||||||||||||
| Sale of Units |
275 | 105,587 | 1,782 | 88,455 | 196,099 | 275 | 2,339 | 275 | 1,193 | 4,082 | |||||||||||||||||||||||||||||
| Redemption of Units |
— | — | — | — | — | — | — | — | — | — | |||||||||||||||||||||||||||||
| Owners’ Capital—Units, September 30, 2009 |
275 | 105,587 | 1,782 | 88,455 | 196,099 | 275 | 2,339 | 275 | 1,193 | 4,082 | |||||||||||||||||||||||||||||
| Net asset value per unit at start of operations |
$ | 100.00 | $ | 100.00 | $ | 100.00 | $ | 100.00 | |||||||||||||||||||||||||||||||
| Change in net asset value per unit for three months ended June 30, 2009 |
(1.89 | ) | (1.79 | ) | (2.93 | ) | (2.82 | ) | |||||||||||||||||||||||||||||||
| Net asset value per unit at June 30, 2009 |
$ | 98.11 | $ | 98.21 | $ | 97.07 | $ | 97.18 | |||||||||||||||||||||||||||||||
| Change in net asset value per unit for three months ended September 30, 2009 |
0.84 | 1.29 | (0.51 | ) | (0.09 | ) | |||||||||||||||||||||||||||||||||
| Net asset value per unit at September 30, 2009 |
$ | 98.95 | $ | 99.50 | $ | 96.56 | $ | 97.09 | |||||||||||||||||||||||||||||||
| (1) | The Frontier Diversified Series and Dynamic Series began trading operations on June 9, 2009 |
The accompanying notes are an integral part of these statements.
21
Table of Contents
The Frontier Fund
Statements of Changes in Owners’ Capital
For the Nine Months Ended September 30, 2009 (Unaudited)
| Frontier Long/Short Commodity Series | |||||||||||||||||||||||||||||||||||||||
| Class 1 | Class 2 | Class 3 (1) | Class 1a (2) | Class 1a (2) | Class 2a (2) | Class 2a (2) | Non-Controlling Interests |
Total | |||||||||||||||||||||||||||||||
| Limited Owners |
Managing Owner |
Limited Owners |
Limited Owners |
Managing Owner |
Limited Owners |
Managing Owner |
Limited Owners |
||||||||||||||||||||||||||||||||
| Owners’ Capital, January 1, 2009 |
$ | 46,525,406 | $ | 933,708 | $ | 10,273,181 | $ | — | $ | — | $ | — | $ | — | $ | — | $ | 10,124,156 | $ | 67,856,451 | |||||||||||||||||||
| Sale of Units |
7,034,013 | — | 3,221,195 | 6,696,779 | 27,500 | 303,039 | 27,500 | 259,500 | 17,569,526 | ||||||||||||||||||||||||||||||
| Redemption of Units |
(12,427,347 | ) | — | (1,365,434 | ) | (462,935 | ) | — | — | (14,255,716 | ) | ||||||||||||||||||||||||||||
| Contributions |
— | — | — | — | — | 40,000,000 | 40,000,000 | ||||||||||||||||||||||||||||||||
| Distributions |
— | — | — | — | — | (31,169,257 | ) | (31,169,257 | ) | ||||||||||||||||||||||||||||||
| Operations attributable to Non-controlling interests |
8,757,728 | 8,757,728 | |||||||||||||||||||||||||||||||||||||
| Net increase/(decrease) in Owners’ Capital resulting from operations attributable to controlling interests |
4,697,108 | 113,629 | 1,417,506 | (29,167 | ) | (392 | ) | 2,048 | (251 | ) | 937 | 6,201,418 | |||||||||||||||||||||||||||
| Owners’ Capital, September 30, 2009 |
$ | 45,829,180 | $ | 1,047,337 | $ | 13,546,448 | $ | 6,204,677 | $ | 27,108 | $ | 305,087 | $ | 27,249 | $ | 260,437 | $ | 27,712,627 | $ | 94,960,150 | |||||||||||||||||||
| Owners’ Capital—Units, January 1, 2009 |
463,448 | 8,544 | 94,008 | — | — | — | — | — | — | 566,000 | |||||||||||||||||||||||||||||
| Sale of Units |
66,714 | — | 28,148 | 54,425 | 275 | 3,095 | 275 | 2,628 | 155,560 | ||||||||||||||||||||||||||||||
| Redemption of Units |
(114,352 | ) | — | (11,644 | ) | (3,807 | ) | — | — | — | — | (129,803 | ) | ||||||||||||||||||||||||||
| Owners’ Capital—Units, September 30, 2009 |
415,810 | 8,544 | 110,512 | 50,618 | 275 | 3,095 | 275 | 2,628 | — | 591,757 | |||||||||||||||||||||||||||||
| Net asset value per unit at January 1, 2009 or start of operations |
$ | 100.39 | $ | 109.28 | $ | 122.70 | $ | 100.00 | $ | 100.00 | |||||||||||||||||||||||||||||
| Change in net asset value per unit for three months ended March 31, 2009 |
3.75 | 4.92 | — | — | — | ||||||||||||||||||||||||||||||||||
| Net asset value per unit at March 31, 2009 |
$ | 104.14 | $ | 114.20 | $ | 122.70 | $ | 100.00 | $ | 100.00 | |||||||||||||||||||||||||||||
| Change in net asset value per unit for three months ended June 30, 2009 |
5.04 | 6.32 | (2.19 | ) | (2.47 | ) | (2.36 | ) | |||||||||||||||||||||||||||||||
| Net asset value per unit at June 30, 2009 |
$ | 109.18 | $ | 120.52 | $ | 120.51 | $ | 97.53 | $ | 97.64 | |||||||||||||||||||||||||||||
| Change in net asset value per unit for three months ended September 30, 2009 |
1.04 | 2.06 | 2.07 | 1.04 | 1.45 | ||||||||||||||||||||||||||||||||||
| Net asset value per unit at September 30, 2009 |
$ | 110.22 | $ | 122.58 | $ | 122.58 | $ | 98.57 | $ | 99.09 | |||||||||||||||||||||||||||||
| (1) | Long/Short Series Class 3 began trading operations on May 30, 2009 |
| (2) | Long/Short Series Class 1a and 2a began trading operations on June 9, 2009 |
The accompanying notes are an integral part of these statements.
22
Table of Contents
The Frontier Fund
Statements of Changes in Owners’ Capital
For the Nine Months Ended September, 2009 (Unaudited)
| Frontier Masters Series (1) | Balanced Series | ||||||||||||||||||||||||||||||
| Class 1 | Class 1 | Class 2 | Class 2 | Total | Class 1 | Class 1a | |||||||||||||||||||||||||
| Managing Owner |
Limited Owners |
Managing Owner |
Limited Owners |
Limited Owners |
Managing Owner |
Limited Owners |
|||||||||||||||||||||||||
| Owners’ Capital, January 1, 2009 |
$ | — | $ | — | $ | — | $ | — | $ | — | $ | 256,550,829 | $ | 224 | $ | 8,135,941 | |||||||||||||||
| Sale of Units |
27,500 | 4,203,162 | 42,500 | 2,498,207 | 6,771,369 | 75,390,578 | — | 3,813,107 | |||||||||||||||||||||||
| Redemption of Units |
— | — | — | — | — | (22,615,409 | ) | (221 | ) | (1,535,910 | ) | ||||||||||||||||||||
| Change in control of ownership—Trading Companies |
— | — | — | — | — | — | — | — | |||||||||||||||||||||||
| Contributions |
— | — | — | — | — | — | — | — | |||||||||||||||||||||||
| Distributions |
— | — | — | — | — | — | — | — | |||||||||||||||||||||||
| Operations attributable to Non-controlling interests |
|||||||||||||||||||||||||||||||
| Net increase/(decrease) in Owners’ Capital resulting from operations |
(463 | ) | 43,422 | (266 | ) | 39,085 | 81,778 | (6,959,756 | ) | (3 | ) | (283,687 | ) | ||||||||||||||||||
| Owners’ Capital, September 30, 2009 |
$ | 27,037 | $ | 4,246,584 | $ | 42,234 | $ | 2,537,292 | $ | 6,853,147 | $ | 302,366,242 | $ | — | $ | 10,129,451 | |||||||||||||||
| Owners’ Capital—Units, January 1, 2009 |
— | — | — | — | — | 2,049,590 | 2 | 72,584 | |||||||||||||||||||||||
| Sale of Units |
275 | 43,193 | 427 | 25,663 | 69,558 | 603,206 | — | 34,111 | |||||||||||||||||||||||
| Redemption of Units |
— | — | — | — | — | (183,490 | ) | (2 | ) | (13,942 | ) | ||||||||||||||||||||
| Owners’ Capital—Units, September 30, 2009 |
275 | 43,193 | 427 | 25,663 | 69,558 | 2,469,306 | — | 92,753 | |||||||||||||||||||||||
| Net asset value per unit at January 1, 2009 |
$ | 125.17 | $ | 112.09 | |||||||||||||||||||||||||||
| Change in net asset value per unit for three months ended March 31, 2009 |
0.04 | (0.23 | ) | ||||||||||||||||||||||||||||
| Net asset value per unit at March 31, 2009 or start of operations |
$ | 100.00 | $ | 100.00 | $ | 125.21 | $ | 111.86 | |||||||||||||||||||||||
| Change in net asset value per unit for three months ended June 30, 2009 |
(2.03 | ) | (1.92 | ) | (4.15 | ) | (3.72 | ) | |||||||||||||||||||||||
| Net asset value per unit at June 30, 2009 |
$ | 97.97 | $ | 98.08 | $ | 121.06 | $ | 108.14 | |||||||||||||||||||||||
| Change in net asset value per unit for three months ended September 30, 2009 |
0.35 | 0.79 | 1.39 | 1.07 | |||||||||||||||||||||||||||
| Net asset value per unit at September 30, 2009 |
$ | 98.32 | $ | 98.87 | $ | 122.45 | $ | 109.21 | |||||||||||||||||||||||
| Balanced Series | ||||||||||||||||||||||||||||
| Class 2 | Class 2a | Class 3a (2) | Non-Controlling Interests |
Total | ||||||||||||||||||||||||
| Managing Owner |
Limited Owners |
Managing Owner |
Limited Owners |
Limited Owners |
||||||||||||||||||||||||
| Owners’ Capital, January 1, 2009 |
$ | 3,612,130 | $ | 63,497,532 | $ | 120,378 | $ | 1,765,973 | $ | — | $ | 9,330,079 | $ | 343,013,086 | ||||||||||||||
| Sale of Units |
460,000 | 25,457,174 | 30,000 | 1,772,212 | 687,282 | 107,610,353 | ||||||||||||||||||||||
| Redemption of Units |
— | (7,317,608 | ) | — | (184,699 | ) | (24,851 | ) | (31,678,698 | ) | ||||||||||||||||||
| Change in control of ownership—Trading Companies |
— | — | — | — | — | 350,058 | 350,058 | |||||||||||||||||||||
| Contributions |
— | — | — | — | — | 10,212,897 | 10,212,897 | |||||||||||||||||||||
| Distributions |
— | — | — | — | — | (2,238,158 | ) | (2,238,158 | ) | |||||||||||||||||||
| Operations attributable to Non-controlling interests |
(1,443,690 | ) | (1,443,690 | ) | ||||||||||||||||||||||||
| Net increase/(decrease) in Owners’ Capital resulting from operations attributable to controlling interests |
(5,397 | ) | (125,732 | ) | (876 | ) | (17,832 | ) | 3,366 | (7,389,917 | ) | |||||||||||||||||
| Owners’ Capital, September 30, 2009 |
$ | 4,066,733 | $ | 81,511,366 | $ | 149,502 | $ | 3,335,654 | $ | 665,797 | $ | 16,211,186 | $ | 418,435,931 | ||||||||||||||
| Owners’ Capital—Units, January 1, 2009 |
25,359 | 445,784 | 992 | 14,560 | — | — | 2,608,871 | |||||||||||||||||||||
| Sale of Units |
3,176 | 177,866 | 245 | 14,604 | 5,718 | 838,926 | ||||||||||||||||||||||
| Redemption of Units |
— | (51,717 | ) | — | (1,556 | ) | (207 | ) | (250,914 | ) | ||||||||||||||||||
| Owners’ Capital—Units, September 30, 2009 |
28,535 | 571,933 | 1,237 | 27,608 | 5,511 | — | 3,196,883 | |||||||||||||||||||||
| Net asset value per unit at January 1, 2009 |
$ | 142.44 | $ | 121.30 | ||||||||||||||||||||||||
| Change in net asset value per unit for three months ended March 31, 2009 |
1.10 | 0.65 | ||||||||||||||||||||||||||
| Net asset value per unit at March 31, 2009 or start of operations |
$ | 143.54 | $ | 121.95 | $ | 121.97 | ||||||||||||||||||||||
| Change in net asset value per unit for three months ended June 30, 2009 |
(3.70 | ) | (3.22 | ) | (3.23 | ) | ||||||||||||||||||||||
| Net asset value per unit at June 30, 2009 |
$ | 139.84 | $ | 118.73 | $ | 118.74 | ||||||||||||||||||||||
| Change in net asset value per unit for three months ended September 30, 2009 |
2.68 | 2.09 | 2.08 | |||||||||||||||||||||||||
| Net asset value per unit at September 30, 2009 |
$ | 142.52 | $ | 120.82 | $ | 120.82 | ||||||||||||||||||||||
| (1) | The Frontier Masters Series began trading operations on June 9, 2009 |
| (2) | Balanced Series Class 3a began trading operations on June 4, 2009 |
The accompanying notes are an integral part of these statements.
23
Table of Contents
The Frontier Fund
Statements of Changes in Owners’ Capital
For the Nine Months Ended September 30, 2009 (Unaudited)
| Campbell/Graham/Tiverton Series | Currency Series | |||||||||||||||||||||||||||||||||||
| Class 1 | Class 2 | Non-Controlling Interests |
Total | Class 1 | Class 2 | Total | ||||||||||||||||||||||||||||||
| Limited Owners |
Managing Owner |
Limited Owners |
Limited Owners |
Managing Owner |
Limited Owners |
|||||||||||||||||||||||||||||||
| Owners’ Capital, January 1, 2009 |
$ | 69,957,155 | $ | 302,878 | $ | 7,504,896 | $ | 2,391,227 | $ | 80,156,156 | $ | 11,900,185 | $ | 687,357 | $ | 2,259,243 | $ | 14,846,785 | ||||||||||||||||||
| Sale of Units |
10,892,203 | — | 4,025,676 | 14,917,879 | 551,301 | — | 82,125 | 633,426 | ||||||||||||||||||||||||||||
| Redemption of Units |
(5,522,023 | ) | — | (1,093,173 | ) | (6,615,196 | ) | (1,698,922 | ) | — | (169,080 | ) | (1,868,002 | ) | ||||||||||||||||||||||
| Change in control of ownership—Trading Companies |
— | — | — | (4,388,979 | ) | (4,388,979 | ) | — | — | — | — | |||||||||||||||||||||||||
| Contributions |
— | — | — | 4,400,000 | 4,400,000 | — | — | — | — | |||||||||||||||||||||||||||
| Distributions |
— | — | — | (1,065,722 | ) | (1,065,722 | ) | — | — | — | — | |||||||||||||||||||||||||
| Operations attributable to Non-controlling interests |
(1,336,526 | ) | (1,336,526 | ) | ||||||||||||||||||||||||||||||||
| Net increase/(decrease) in Owners’ Capital resulting from operations attributable to controlling interests |
(3,522,769 | ) | (7,857 | ) | (241,286 | ) | (3,771,912 | ) | (1,474,781 | ) | (74,406 | ) | (238,680 | ) | (1,787,867 | ) | ||||||||||||||||||||
| Owners’ Capital, September 30, 2009 |
$ | 71,804,566 | $ | 295,021 | $ | 10,196,113 | $ | — | $ | 82,295,700 | $ | 9,277,783 | $ | 612,951 | $ | 1,933,608 | $ | 11,824,342 | ||||||||||||||||||
| Owners’ Capital—Units, January 1, 2009 |
632,847 | 2,439 | 60,454 | — | 695,740 | 123,719 | 6,289 | 20,670 | 150,678 | |||||||||||||||||||||||||||
| Sale of Units |
101,491 | — | 32,911 | 134,402 | 6,056 | — | 787 | 6,843 | ||||||||||||||||||||||||||||
| Redemption of Units |
(52,386 | ) | — | (9,045 | ) | (61,431 | ) | (19,158 | ) | — | (1,619 | ) | (20,777 | ) | ||||||||||||||||||||||
| Owners’ Capital—Units, September 30, 2009 |
681,952 | 2,439 | 84,320 | — | 768,711 | 110,617 | 6,289 | 19,838 | 136,744 | |||||||||||||||||||||||||||
| Net asset value per unit at January 1, 2009 |
$ | 110.54 | $ | 124.14 | $ | 96.19 | $ | 109.30 | ||||||||||||||||||||||||||||
| Change in net asset value per unit for three months ended March 31, 2009 |
(2.91 | ) | (2.37 | ) | (5.56 | ) | (5.55 | ) | ||||||||||||||||||||||||||||
| Net asset value per unit at March 31, 2009 |
$ | 107.63 | $ | 121.77 | $ | 90.63 | $ | 103.75 | ||||||||||||||||||||||||||||
| Change in net asset value per unit for three months ended June 30, 2009 |
(5.60 | ) | (5.48 | ) | (2.85 | ) | (2.51 | ) | ||||||||||||||||||||||||||||
| Net asset value per unit at June 30, 2009 |
$ | 102.03 | $ | 116.29 | $ | 87.78 | $ | 101.24 | ||||||||||||||||||||||||||||
| Change in net asset value per unit for three months ended September 30, 2009 |
3.26 | 4.63 | (3.91 | ) | (3.77 | ) | ||||||||||||||||||||||||||||||
| Net asset value per unit at September 30, 2009 |
$ | 105.29 | $ | 120.92 | $ | 83.87 | $ | 97.47 | ||||||||||||||||||||||||||||
The accompanying notes are an integral part of these statements.
24
Table of Contents
The Frontier Fund
Statements of Changes in Owners’ Capital
For the Nine Months Ended September 30, 2009 (Unaudited)
| Long Only Commodity Series | Managed Futures Index Series | ||||||||||||||||||||||||||||||
| Class 1 | Class 2 | Total | Class 1 | Class 2 | Total | ||||||||||||||||||||||||||
| Limited Owners |
Managing Owner |
Limited Owners |
Limited Owners |
Managing Owner |
Limited Owners |
||||||||||||||||||||||||||
| Owners’ Capital, January 1, 2009 |
$ | 3,254,226 | $ | 110,092 | $ | 678,155 | $ | 4,042,473 | $ | 2,266,977 | $ | 77,559 | $ | 1,058,515 | $ | 3,403,051 | |||||||||||||||
| Sale of Units |
409,118 | — | 86,800 | 495,918 | 708,699 | 200,000 | 1,071,138 | 1,979,837 | |||||||||||||||||||||||
| Redemption of Units |
(481,572 | ) | — | (87,025 | ) | (568,597 | ) | (720,251 | ) | — | (7,431 | ) | (727,682 | ) | |||||||||||||||||
| Contributions |
— | — | — | — | — | — | — | — | |||||||||||||||||||||||
| Distributions |
— | — | — | — | — | — | — | — | |||||||||||||||||||||||
| Net increase/(decrease) in Owners’ Capital resulting from operations |
346,832 | 12,886 | 83,533 | 443,251 | (234,112 | ) | (7,753 | ) | (152,696 | ) | (394,561 | ) | |||||||||||||||||||
| Owners’ Capital, September 30, 2009 |
$ | 3,528,604 | $ | 122,978 | $ | 761,463 | $ | 4,413,045 | $ | 2,021,313 | $ | 269,806 | $ | 1,969,526 | $ | 4,260,645 | |||||||||||||||
| Owners’ Capital—Units, January 1, 2009 |
46,285 | 1,479 | 9,108 | 56,872 | 17,151 | 555 | 7,577 | 25,283 | |||||||||||||||||||||||
| Sale of Units |
6,182 | — | 1,231 | 7,413 | 5,862 | 1,582 | 8,084 | 15,528 | |||||||||||||||||||||||
| Redemption of Units |
(6,924 | ) | — | (1,175 | ) | (8,099 | ) | (5,844 | ) | — | (59 | ) | (5,903 | ) | |||||||||||||||||
| Owners’ Capital—Units, September 30, 2009 |
45,543 | 1,479 | 9,164 | 56,186 | 17,169 | 2,137 | 15,602 | 34,908 | |||||||||||||||||||||||
| Net asset value per unit at January 1, 2009 |
$ | 70.31 | $ | 74.46 | $ | 132.18 | $ | 139.70 | |||||||||||||||||||||||
| Change in net asset value per unit for three months ended March 31, 2009 |
(4.27 | ) | (4.18 | ) | (8.50 | ) | (8.37 | ) | |||||||||||||||||||||||
| Net asset value per unit at March 31, 2009 |
$ | 66.04 | $ | 70.28 | $ | 123.68 | $ | 131.33 | |||||||||||||||||||||||
| Change in net asset value per unit for three months ended June 30, 2009 |
9.09 | 10.07 | (2.87 | ) | (2.44 | ) | |||||||||||||||||||||||||
| Net asset value per unit at June 30, 2009 |
$ | 75.13 | $ | 80.35 | $ | 120.81 | $ | 128.89 | |||||||||||||||||||||||
| Change in net asset value per unit for three months ended September 30, 2009 |
2.35 | 2.75 | (3.08 | ) | (2.65 | ) | |||||||||||||||||||||||||
| Net asset value per unit at September 30, 2009 |
$ | 77.48 | $ | 83.10 | $ | 117.73 | $ | 126.24 | |||||||||||||||||||||||
The accompanying notes are an integral part of these statements.
25
Table of Contents
The Frontier Fund
Statements of Changes in Owners’ Capital
For the Nine Months Ended September 30, 2009 (Unaudited)
| Winton Series | Winton/Graham Series | |||||||||||||||||||||||||||||||||||||||||||
| Class 1 | Class 2 | Total | Class 1 | Class 2 | Total | |||||||||||||||||||||||||||||||||||||||
| Managing Owner |
Limited Owners |
Managing Owner |
Limited Owners |
Non- Controlling Interests |
Limited Owners |
Managing Owner |
Limited Owners |
Non- Controlling Interests |
||||||||||||||||||||||||||||||||||||
| Owners’ Capital, January 1, 2009 |
$ | 1,304 | $ | 62,282,355 | $ | 277,935 | $ | 11,465,432 | $ | 11,355,645 | $ | 85,382,671 | $ | 35,760,835 | $ | 56,315 | $ | 14,378,079 | $ | — | $ | 50,195,229 | ||||||||||||||||||||||
| Sale of Units |
— | 220,835 | 200,000 | — | 420,835 | 20,167,922 | — | 360,401 | 20,528,323 | |||||||||||||||||||||||||||||||||||
| Redemption of Units |
(1,165 | ) | (5,358,998 | ) | — | (742,864 | ) | (6,103,027 | ) | (4,094,963 | ) | — | (1,565,441 | ) | (5,660,404 | ) | ||||||||||||||||||||||||||||
| Change in control of ownership - Trading Companies |
— | — | — | — | (13,830,805 | ) | (13,830,805 | ) | — | — | — | 2,258,238 | 2,258,238 | |||||||||||||||||||||||||||||||
| Contributions |
— | — | — | — | 8,850,000 | 8,850,000 | — | — | — | 6,600,000 | 6,600,000 | |||||||||||||||||||||||||||||||||
| Distributions |
— | — | — | — | (2,307,847 | ) | (2,307,847 | ) | — | — | — | (3,362,254 | ) | (3,362,254 | ) | |||||||||||||||||||||||||||||
| Operations attributable to Non-controlling interests |
(4,066,993 | ) | (4,066,993 | ) | 3,081,608 | 3,081,608 | ||||||||||||||||||||||||||||||||||||||
| Net increase/(decrease) in Owners’ Capital resulting from operations attributable to controlling interests |
(139 | ) | (5,679,017 | ) | (23,981 | ) | (842,234 | ) | (6,545,371 | ) | (2,038,957 | ) | (1,302 | ) | (375,620 | ) | (2,415,879 | ) | ||||||||||||||||||||||||||
| Owners’ Capital, September 30, 2009 |
$ | — | $ | 51,465,175 | $ | 453,954 | $ | 9,880,334 | $ | — | $ | 61,799,463 | $ | 49,794,837 | $ | 55,013 | $ | 12,797,419 | $ | 8,577,592 | $ | 71,224,861 | ||||||||||||||||||||||
| Owners’ Capital—Units, January 1, 2009 |
10 | 477,595 | 1,985 | 81,870 | — | 561,460 | 307,804 | 428 | 109,351 | — | 417,583 | |||||||||||||||||||||||||||||||||
| Sale of Units |
— | 1,804 | 1,514 | — | 3,318 | 178,132 | — | 2,732 | 180,864 | |||||||||||||||||||||||||||||||||||
| Redemption of Units |
(10 | ) | (43,695 | ) | — | (5,705 | ) | (49,410 | ) | (37,107 | ) | — | (12,448 | ) | (49,555 | ) | ||||||||||||||||||||||||||||
| Owners’ Capital—Units, September 30, 2009 |
— | 435,704 | 3,499 | 76,165 | — | 515,368 | 448,829 | 428 | 99,635 | — | 548,892 | |||||||||||||||||||||||||||||||||
| Net asset value per unit at January 1, 2009 |
$ | 130.41 | $ | 140.04 | $ | 116.18 | $ | 131.49 | ||||||||||||||||||||||||||||||||||||
| Change in net asset value per unit for three months ended March 31, 2009 |
|
(2.98 | ) | (2.18 | ) | (3.06 | ) | (2.50 | ) | |||||||||||||||||||||||||||||||||||
| Net asset value per unit at March 31, 2009 |
$ | 127.43 | $ | 137.86 | $ | 113.12 | $ | 128.99 | ||||||||||||||||||||||||||||||||||||
| Change in net asset value per unit for three months ended June 30, 2009 |
|
(9.99 | ) | (9.86 | ) | (6.67 | ) | (6.69 | ) | |||||||||||||||||||||||||||||||||||
| Net asset value per unit at June 30, 2009 |
$ | 117.44 | $ | 128.00 | $ | 106.45 | $ | 122.30 | ||||||||||||||||||||||||||||||||||||
| Change in net asset value per unit for three months ended September 30, 2009 |
|
0.68 | 1.72 | 4.49 | 6.14 | |||||||||||||||||||||||||||||||||||||||
| Net asset value per unit at September 30, 2009 |
$ | 118.12 | $ | 129.72 | $ | 110.94 | $ | 128.44 | ||||||||||||||||||||||||||||||||||||
The accompanying notes are an integral part of these statements.
26
Table of Contents
Notes to Financial Statements
As of September 30, 2009 (Unaudited)
1. Organization
The Frontier Fund (the “Trust”), was formed as a Delaware statutory trust on August 8, 2003, with separate Series of Units. The Trust’s term will expire on December 31, 2053 (unless terminated earlier in certain circumstances). The Trust is a multi-advisor commodity pool as described in Commodity Futures Trading Commission, or CFTC Regulation § 4.10(d)(2).
The Trust has eleven (11) separate and distinct Series of Units issued and outstanding: Frontier Diversified Series, Frontier Dynamic Series, Frontier Long/Short Commodity Series, Frontier Masters Series, Balanced Series, Campbell/Graham/Tiverton Series, Currency Series, Long Only Commodity Series, Managed Futures Index Series, Winton Series and Winton/Graham Series (each a “Series” and collectively, the “Series”). The Trust may issue additional Series of Units. The Units of each Series are separated into three or six sub-classes of Units. The Trust, with respect to each Series:
| • | engages in the speculative trading of a diversified portfolio of futures, forward (including interbank foreign currencies), options contracts and other derivative instruments (including swap contracts) may, from time to time, engage in cash and spot transactions; |
| • | allocates funds to an affiliated limited liability trading company or companies (“Trading Company”). Except as otherwise described in these notes, each Trading Company has one-year renewable contracts with its own independent commodity trading advisor(s), or each, a Trading Advisor, that will manage all or a portion of such Trading Company’s assets, make the trading decisions for the assets of each Series vested in such Trading Company. Each Trading Company will segregate its assets from any other Trading Company; |
| • | maintains separate, distinct records for each Series, and accounts for the assets of each Series separately from the other Series. |
| • | calculates the Net Asset Value (“NAV”) of its Units for each Series separately from the other Series; |
| • | has an investment objective of increasing the value of each Series’ Units over the long term (capital appreciation), while controlling risk and volatility; further, to offer exposure to the investment programs of individual Trading Advisors and to specific instruments (currencies); and |
| • | maintains each Series of Units in three or six sub-classes—Class 1, Class 1a, Class 2, Class 2a, Class 3, and Class 3a. Investors who have purchased Class 1 or Class 1a Units of any Series are charged a service fee of up to three percent (3.0%) annually of the NAV of each Unit purchased, for the benefit of Selling Agents selling such Class 1 or Class 1a Units. The initial service fee, which is amortized monthly at an annual rate of up to three percent (3.0%) of the average daily NAV of Class 1 or Class 1a of such Series, is prepaid to Equinox Fund Management, LLC (the “Managing Owner”) by each Series, and paid to the selling agents by the Managing Owner in the month following sale; provided, however, that investors who redeem all or a portion of their Class 1 or Class 1a Units of any Series during the first twelve (12) months following the effective date of their purchase are subject to a redemption fee of up to three percent (3.0%) of the NAV at which such investor redeemed to reimburse the Managing Owner for the then-unamortized balance of the prepaid initial service fee. With respect to Class 2 and Class 2a Units of any Series, the Managing Owner pays an ongoing service fee to Selling Agents of up to one half percent (0.5%) annually of the NAV of each Class 2 or Class 2a Unit (of which 0.25% will be charged to Limited Owners holding Class 2 Units of the Frontier Diversified Series, Frontier Dynamic Series and Frontier Masters Series or Class 2a Units of the Frontier Long/Short Commodity Series) sold until such Class 2 or Class 2a Units which are subject to the fee limitation are reclassified as Class 3 or Class 3a Units of the applicable Series for administrative purposes. The Managing Owner may also pay Selling Agents certain additional fees and expenses for administrative and other services rendered and expenses incurred by such Selling Agents. |
27
Table of Contents
The Frontier Fund
Notes to Financial Statements—(Continued)
As of September 30, 2009 (Unaudited)
| • | All payments made to Selling Agents who are members of the Financial Industry Regulatory |
Authority, Inc. (“FINRA”) and their associated persons that constitute underwriting compensation will
be subject to the limitations set forth in Rule 2310(b)(4)(B)(ii) (formerly Rule 2810(b)(4)(B)(ii)) of the Conduct Rules of FINRA
(“Rule 2310”). An investor’s Class 1 Units or Class 2 Units of any Series, or Class 1a Units or Class 2a Units of the Frontier Long/Short Commodity Series or
Balanced Series will be classified as Class 3 Units of such Series, or Class 3a Units of the Frontier Long/Short Commodity Series or Balanced Series, as applicable when the Managing Owner determines that the fee limitation set forth
in Rule 2310 with respect to such Units has been reached or will be reached. No service fees are paid with respect to Class 3 or Class 3a Units.
| • | Units of any Class in a Series may be redeemed, in whole or in part, on a daily basis, at the then current NAV per Unit for such Series on the day of the week after the date the Managing Owner is in receipt of a redemption request for at least one (1) Business Day to be received by the Managing Owner prior to 4:00 PM in New York. |
As of September 30, 2009, the total Units outstanding of each Series of the Trust was 196,099 with respect to the Frontier Diversified Series, 4,082 with respect to the Frontier Dynamic Series, 591,757 with respect to the Frontier Long/Short Commodity Series, 69,558 with respect to the Frontier Masters Series, 3,196,883 with respect to the Balanced Series, 768,711 with respect to the Campbell/Graham/Tiverton Series, 136,744 with respect to the Currency Series, 56,186 with respect to the Long Only Commodity Series, 34,908 with respect to the Managed Futures Index Series, 515,368 with respect to the Winton Series, and 548,892 with respect to the Winton/Graham Series. As of September 30, 2009, the Trust, with respect to the Frontier Diversified Series, Frontier Dynamic Series, Frontier Masters Series, Campbell/Graham/Tiverton Series, Currency Series, Long Only Commodity Series, Managed Futures Index Series, Winton Series and Winton/Graham Series separates Units into three separate Classes – Class 1, Class 2, and Class 3. The Trust, with respect to the Balanced Series, and Frontier Long/Short Commodity Series separates Units into six separate Classes – Class 1, Class 2, Class 3, Class 1a, Class 2a and Class 3a. It is expected that between 10% and 30% of each Series’ assets normally will be invested in one or more Trading Companies to be committed as margin for trading positions, but from time to time these percentages may be substantially more or less. The remainders of each Series’ assets are maintained at the Trust level for cash management.
As of September 30, 2009, each of the Frontier Dynamic Series, Long Only Commodity Series, Managed Futures Index Series and Winton Series has invested a portion of its assets in a single Trading Company, and a single Trading Advisor manages 100% of the assets invested in each such Trading Company, except the Trading Company for the Frontier Dynamic Series and for the Long Only Commodity Series allocate assets only to Swaps. The Currency Series invests a portion of its assets in a single Trading Company, which allocates assets to one Trading Advisor and one Swap. The Frontier Long/Short Commodity Series invests its assets in a single Trading Company and has multiple Trading Advisors that manage the assets invested in such Trading Company. Each of the Frontier Diversified Series, Frontier Masters Series, Balanced Series, Campbell/Graham/Tiverton Series, and Winton/Graham Series has invested a portion of its assets in several different Trading Companies and has multiple Trading Advisors that manage the assets invested in such Trading Companies. Trading Advisors are responsible for the trading decisions of the respective Trading Companies for which they trade. It is expected that between 10% and 30% of each Series’ assets normally will be invested in one or more Trading Companies to be committed as margin for trading positions but from time to time these percentages may be substantially more or less. The remainders of each Series’ assets are maintained at the Trust level for cash management. Each of the respective Series has invested monies into pooled cash management assets which include purchases of certificates of deposit, custom time deposits and U.S. Treasury securities. Each Series’ ownership in these investments is based on its percentage ownership in the pooled cash management assets on the reporting date.
2. Significant Accounting Policies
The following are the significant accounting policies of the Trust.
Basis of Presentation—The financial statements of each Series of the Trust included herein have been prepared in accordance with accounting principles generally accepted in the United States (“GAAP”). Effective September 15, 2009, references to GAAP have changed due to the adoption of Financial Accounting Standards Board (“FASB”) Accounting Standard Codification (“ASC”) 105, Generally Accepted Accounting Principles.
28
Table of Contents
The Frontier Fund
Notes to Financial Statements—(Continued)
As of September 30, 2009 (Unaudited)
Consolidation—The Series, through investing in the Trading Companies, authorize certain Trading Advisors to place trades and manage assets at pre-determined investment levels. The Trading Companies were organized by the Managing Owner for the purpose of investing in securities and derivative instruments, and have no operating income or expenses, except for trading income and expenses, all of which is allocated to the Series. Trading Companies in which a Series has a majority equity interest are consolidated by such Series. Investments in Trading Companies in which a Series does not have a controlling or majority interest are carried in the statement of financial condition of such Series at fair value. Fair value represents the proportionate share of the equity of a Series in a Trading Company.
The consolidated financial statements of the Frontier Diversified Series include the assets, liabilities and earnings of its wholly-owned trading company, Frontier Trading Company X, LLC.
The consolidated financial statements of the Frontier Dynamic Series include the assets, liabilities and earnings of its wholly-owned trading company, Frontier Trading Company XII, LLC.
The consolidated financial statements of the Frontier Long/Short Commodity Series include the assets, liabilities and earnings of its majority-owned trading company, Frontier Trading Company VII, LLC.
The consolidated financial statements of the Frontier Masters Series include the assets, liabilities and earnings of its wholly-owned trading company, Frontier Trading Company XI, LLC.
The consolidated financial statements of the Balanced Series include the assets, liabilities and earnings of its majority owned Trading Companies, Frontier Trading Company I, LLC, Frontier Trading Company VI, LLC, Frontier Trading Company IX, LLC and Frontier Trading Company XIII, LLC as well as earnings of Frontier Trading Company II, LLC through May 28, 2009.
The consolidated financial statements of the Currency Series include the assets, liabilities and earnings of its wholly owned trading company, Frontier Trading Company III, LLC.
The consolidated financial statements of the Long Only Commodity Series include the assets, liabilities and earnings of its wholly-owned trading company, Frontier Trading Company VIII, LLC.
The consolidated financial statements of the Winton/Graham Series include the assets, liabilities and earnings of its majority-owned trading company, Frontier Trading Company V, LLC.
The consolidated financial statements of Campbell/Graham/Tiverton Series included earnings of its majority-owned trading company, Frontier Trading Company V, LLC, through April 2009.
Cash and Cash Equivalents—Cash and cash equivalents include cash and overnight investments in interest-bearing demand deposits with banks and cash managers with maturities of three months or less. The Trust maintains deposits with high quality financial institutions in amounts that are in excess of federally insured limits. Aggregate interest income from all sources, including assets held at clearing brokers, up to two percentage points of the aggregate percentage yield (annualized) is paid to the Managing Owner by the Balanced Series (Class 1 and Class 2 only), Campbell/Graham/Tiverton Series, Currency Series, Winton Series and Winton/Graham Series. For the Frontier Diversified Series, Frontier Dynamic Series, Frontier Long/Short Commodity Series, Frontier Masters Series, Balanced Series (Class 1a, Class 2a and Class 3a only), Long Only Commodity Series and Managed Futures Index Series, 20% of the total interest allocated to each Series is paid to the Managing Owner. Any excess is accrued as income allocated to these Series in proportion to their daily NAV, excluding non-controlling interests and including the effects of inter-Series advances.
Certificates of Deposit—Certificates of deposit include interest-bearing instruments issued by U.S Bank National Association, have maturities greater than three months and interest is paid at maturity. Certificates of Deposit are allocated to each Series based on their percentage ownership in the pooled cash management assets on the reporting date. The Certificates of Deposits matured on September 15, 2009 and were not renewed. The Trust valued the
29
Table of Contents
The Frontier Fund
Notes to Financial Statements—(Continued)
As of September 30, 2009 (Unaudited)
certificates of deposit at face value plus accrued interest, which approximates fair value, and reports these instruments as Level 2 inputs under FASB ASC 820 formerly recognized as SFAS 157, Fair Value Measurements and Disclosures.
Custom Time Deposits—Custom time deposits are structured deposit agreements with U.S. Bank National Association that earn a guaranteed fixed interest rate between 2.17% and 3.75% and will mature six months from the deposit date and are subject to automatic six-month rollovers through October 2013. Interest is paid monthly or at least every six months. Unscheduled withdrawals will be subject to certain penalties and other costs up to 1.0% of the amount deposited if withdrawn within the first six months from the deposit date. Custom time deposits were purchased on September 15, 2009, October 30, 2008 and October 21, 2008. The withdrawal fee is set at 0.225% for the period from six months to one year subsequent to the deposit date and decreases by .05% increments for each year thereafter through the maturity date. Custom time deposits are allocated to each Series based on their percentage ownership in the pooled cash management assets as of the reporting date. The Trust values the custom time deposits at face value plus accrued interest as it is considered a deposit account under paragraph 7.23 of the Investment Company Audit Guide, and accordingly, this deposit is not subject to FASB ASC 820.
Payable to Other Series—Each of the Series has invested monies into pooled cash management assets from which purchases were made for certificates of deposit, custom time deposits and U.S. Treasury securities. Each Series’ ownership in these investments is based on its percentage ownership in the pooled cash management assets on the date of their purchase, except that a portion of these investments were allocated to the Frontier Diversified Series, the Frontier Dynamic Series and the Frontier Masters Series in proportion to and as a part of the inter-series advance from Balanced Series upon the commencement of trading for such Series. Because these investments were fixed, subsequent withdrawals of cash from these pooled cash management assets by some Series has resulted in a negative cash position or a “Payable to Other Series.” These payables will be settled with either an additional investment in the cash management pool by the Series with the deficiency of cash, or when the underlying investments are liquidated, or both.
Receivable From Futures Commission Merchants—The Trust deposits assets with a broker subject to CFTC regulations and various exchange and broker requirements. Margin requirements are satisfied by the deposit of cash with such broker. The Trust earns interest income on its assets deposited with the broker.
Use of Estimates—The preparation of financial statements in conformity with generally accepted accounting principles requires the Managing Owner to make estimates and assumptions that affect the reported amounts of assets and liabilities and disclosure of contingent assets and liabilities at the date of the financial statements and the reported amounts of revenue and expenses during the reporting period. Actual results could differ from those estimates.
Revenue recognition—Futures, options on futures, forward and swap contracts are recorded on a trade date basis and realized gains or losses are recognized when contracts are liquidated. Unrealized gains or losses on open contracts (the difference between contract trade price and market price) are reported in the statement of financial condition as a net unrealized gain or loss, as there exists a right of offset of unrealized gains or losses in accordance with FASB ASC 815, Derivatives and Hedging.
Any change in net unrealized gain or loss from the preceding period is reported in the statement of operations. Fair value of exchange-traded contracts is based upon exchange settlement prices. Fair value of non-exchange-traded contracts is based on third party quoted dealer values on the Interbank market. For U.S. Treasury Securities, interest is recognized in the period earned and the instruments are marked-to-market daily based on third party information. Certificates of Deposit and Custom Time Deposits are valued at face value plus accrued interest and the interest income is recognized in the period earned. Transaction costs are recognized as incurred and reflected separately in the Statement of Operations.
Allocation of Earnings—Each Series of the Trust maintains three or six classes of Units—Class 1, Class 2, Class 3, Class 1a, Class 2a and Class 3a). All classes have identical voting, dividend, liquidation and other rights and the same terms and conditions, except that fees charged to a Class or Series differ as described below. Revenues, expenses (other than expenses attributable to a specific class), and realized and unrealized trading profits and losses of each Series are allocated daily to Class 1, Class 1a, Class 2, Class 2a, Class 3 and Class 3a Units based on each Class’ respective owners’ capital balances.
30
Table of Contents
The Frontier Fund
Notes to Financial Statements—(Continued)
As of September 30, 2009 (Unaudited)
Each Series allocates funds to an affiliated Trading Company, or Companies, of the Trust. Each Trading Company allocates all of its daily trading profits or losses to the Series in proportion to each Series’ ownership interest in the Trading Company, adjusted on a daily basis. As of September 30, 2009, the value of all open contracts and cash held at clearing brokers is similarly allocated to the Series in proportion to each Series’ funds allocated to the Trading Company, or Companies.
Inter-Series Receivables/Payables—The Balanced Series, for the purposes of diversification of investments and trading advisors through the other Series’ access to trading companies in which the Balanced Series does not have a direct interest, advances funds to the Currency Series, Frontier Diversified Series, Frontier Dynamic Series and Frontier Masters Series. The amount of the funds advanced by the Balanced Series to each of the Currency Series, Frontier Diversified Series, Frontier Dynamic Series and Frontier Masters Series participates on a pari passu basis with the Class 2 Units of such investee Series. The Balanced Series and investee Series reflect the changes in values of these investments as “Earnings in investments in inter-series receivables/payables” in the Statement of Operations. The Balanced Series is subject to the same allocations of income and fees as the Limited Owners of such Series. As a result of fees charged by the investee Series, fees are not charged by the Balanced Series on the capital allocated to advances in affiliated Series, and the Managing Owner monitors such allocations so that aggregate fees of the investee Series on the Balanced Series advances do not exceed the allowable fees of the Balanced Series as provided in the Trust’s Prospectus. Pertaining to interest credited to the investee Series, interest is not credited to the Balanced Series on the capital allocated to its inter-series advances to avoid the duplication of interest.
Foreign Currency Transactions—The Trust’s functional currency is the U.S. Dollar, however, it transacts business in currencies other than the U.S. Dollar. Assets and liabilities denominated in currencies other than the U.S. Dollar are translated into U.S. Dollars at the rates in effect at the date of the statement of financial condition. Income and expense items denominated in currencies other than the U.S. Dollar are translated into U.S. Dollars at the rates in effect during the period. Gains and losses resulting from the translation to U.S. Dollars are reported in income.
Investments and Swaps—The Trust records investment transactions on trade date and all investments are recorded at fair value in its financial statements, with changes in fair value reported as a component of realized and unrealized gains/(losses) on investments in the Statements of Operations. Generally, fair values will be based on quoted market prices; however, in certain circumstances, significant judgments and estimates may be required in determining fair value in the absence of an active market closing price. At September 30, 2009 all investments in futures and forward contracts were based on quoted market prices. The valuation of investments in swap contracts (“Swaps”) involves estimates.
Estimates—The Managing Owner may make judgments that can frequently require estimates about matters that are inherently uncertain. The Managing Owner provides a good faith estimate of the daily NAV for each Series based on such uncertain information. The Managing Owner’s good faith estimates of each Series’ NAV is published daily by the Trust and is used for subscriptions, redemptions and exchanges of all Trust Units, and such Unit transactions are final and not subject to subsequent adjustment unless the estimate of NAV varies from the actual NAV by more than one percent (1.0%) of the actual NAV as described within the Prospectus.
Income Taxes—The Trust applies the provisions of FASB ASC 740 Income Taxes (“ASC 740”), which provides guidance for how uncertain tax positions should be recognized, measured, presented and disclosed in the financial statements. This interpretation also provides guidance on derecognition, classification, interest and penalties, accounting in interim periods and disclosure. ASC 740 requires the evaluation of tax positions taken or expected to be taken in the course of preparing the Trust’s financial statements to determine whether the tax positions are “more-likely-than-not” of being sustained by the applicable tax authority. Tax positions with respect to tax at the Trust’s level not deemed to meet the “more-likely-than-not” threshold would be recorded as a tax benefit or expense in the current year. The Managing Owner has concluded there is no tax expense, interest or penalties to be recorded by the Trust for the periods ended September 30, 2009 and December 31, 2008. The 2005 through 2008 tax years generally remain subject to examination by U.S. federal and most state tax authorities.
In the opinion of the Managing Owner, (i) the Trust is treated as a partnership for Federal income tax purposes and, assuming that at least 90% of the gross income of the Trust constitutes “qualifying income” within the meaning of Section 7704(d) of the Code, the Trust is not a publicly traded partnership treated as a corporation, and (ii) the discussion set forth in the Prospectus under the heading “Federal Income Tax Consequences” correctly summarizes the material Federal income tax consequences as of the date of the Prospectus to potential U.S. Limited Owners of the purchase, ownership and disposition of Units of the Trust.
31
Table of Contents
The Frontier Fund
Notes to Financial Statements—(Continued)
As of September 30, 2009 (Unaudited)
Fees and Expenses—All management fees, incentive fees, and service fees of the Trust are paid to the Managing Owner. Additionally, the trading fees are paid to the Managing Owner. It is the responsibility of the Managing Owner to pay all Trading Advisor management and incentive fees, Selling Agent Service fees and all other operating expenses and continuing offering costs of the Trust.
Service Fees—The Trust maintains each Series of Units in three or six sub-classes—Class 1, Class 1a, Class 2, Class 2a, Class 3, and Class 3a. Investors who have purchased Class 1 or Class 1a Units of any Series are charged a service fee of up to three percent (3.0%) annually of the NAV of each Unit purchased, for the benefit of Selling Agents selling such Class 1 or Class 1a Units. The initial service fee, which is amortized monthly at an annual rate of up to three percent (3.0%) of the average daily NAV of Class 1 or Class 1a of such Series, is prepaid to Equinox Fund Management, LLC (the “Managing Owner”) by each Series, and paid to the selling agents by the Managing Owner in the month following sale; provided, however, that investors who redeem all or a portion of their Class 1 or Class 1a Units of any Series during the first twelve (12) months following the effective date of their purchase are subject to a redemption fee of up to three percent (3.0%) of the NAV at which such investor redeemed to reimburse the Managing Owner for the then-unamortized balance of the prepaid initial service fee. With respect to Class 2 and Class 2a Units of any Series, the Managing Owner pays an ongoing service fee to Selling Agents of up to one half percent (0.5%) annually of the NAV of each Class 2 or Class 2a Unit (of which 0.25% will be charged to Limited Owners holding Class 2 Units of the Frontier Diversified Series, Frontier Dynamic Series and Frontier Masters Series or Class 2a Units of the Frontier Long/Short Commodity Series) sold until such Class 2 or Class 2a Units which are subject to the fee limitation are reclassified as Class 3 or Class 3a Units of the applicable Series for administrative purposes. The Managing Owner may also pay Selling Agents certain additional fees and expenses for administrative and other services rendered and expenses incurred by such Selling Agents.
All payments made to Selling Agents who are members of FINRA and their associated persons that constitute underwriting compensation will be subject to the limitations set forth in Rule 2310. An investor’s Class 1 Units or Class 2 Units of any Series, or Class 1a Units or Class 2a Units of the Frontier Long/Short Commodity Series or Balanced Series will be classified as Class 3 Units of such Series, or Class 3a Units of the Frontier Long/Short Commodity Series or Balanced Series, as applicable, when the Managing Owner determines that the fee limitation set forth in Rule 2310 with respect to such Units has been reached or will be reached. No service fees are paid with respect to Class 3 or Class 3a Units.
These service fees are part of the offering costs of the Trust, which include registration and filing fees, legal and blue sky expenses, accounting and audit, printing, marketing support and other offering costs which are born by the Managing Owner. With respect to the service fees, the initial service fee (for the first 12 months) relating to a purchase of Class 1 and Class 1a Units by an investor is prepaid by the Managing Owner to the relevant selling agent in the month following such purchase and is reimbursed for such payment by the Series monthly in arrears in an amount based upon a corresponding percentage of NAV, calculated daily. Consequently, the Managing Owner bears the risk of the downside and enjoys the benefit of the upside potential of any difference between the amount of the initial service fee prepaid by it and the amount of the reimbursement thereof, which may result from variations in NAV over the following 12 months.
Pending Owner Additions—Funds received for new subscriptions and for additions to existing owner interests are recorded as capital additions at the NAV per unit of the second business day following receipt.
Statement of Cash Flows—In April 2009, the FASB issued ASC 230—formerly recognized as Statement of Financial Accounting Standards No. 102, Statements of Cash Flows – Exemption of Certain Enterprises and Classification of Cash Flows from Certain Securities Acquired for Resale. The Trust has elected not to provide statements of cash flows as permitted by FASB ASC 230.
Recently Adopted Accounting Pronouncements—In June 2009, the FASB issued ASC 105, formerly recognized as SFAS No. 168, The FASB Accounting Standards Codification™ and the Hierarchy of Generally Accepted Accounting Principles, the guidance of which was incorporated in ASC 105-10 Generally Accepted Accounting Principles (“GAAP”) – Overall. Effective September 15, 2009, the FASB ASC will become the source of authoritative U.S. GAAP recognized by the FASB to be applied by nongovernmental entities. Rules and interpretive releases of the Securities and Exchange Commission (“SEC”) are also sources of authoritative GAAP for SEC registrants pursuant to federal securities laws. On the effective date of this guidance, the FASB ASC will supersede all then-existing non-SEC accounting and reporting standards. All other non-grandfathered non-SEC accounting literature not included in the ASC will become non-authoritative. This guidance is effective for financial statements issued for interim and annual periods ending after September 15, 2009. The adoption of FASB ASC 105 did not impact the Trust’s or the Series’ financial positions or results of operations.
32
Table of Contents
The Frontier Fund
Notes to Financial Statements—(Continued)
As of September 30, 2009 (Unaudited)
In April 2009, the FASB issuedASC 820, formerly recognized as Fair Value Measurements and Disclosures. FASB ASC 820 requires disclosures about fair value of financial instruments for interim reporting periods of publicly traded companies as well as in annual financial statements. This guidance is effective for interim and annual periods ending after June 15, 2009. The Trust adopted this standard effective April 1, 2009, the results of which are disclosed in Note 3 Fair Value Measurements.
In December 2007, the FASB issued ASC 805-10 Business Combinations – Overall (“ASC 805-10”), formerly recognized as SFAS No. 141 (revised 2007), Business Combinations (SFAS 141(R)) and SFAS No. 160, Noncontrolling Interests in Consolidated Financial Statements – an amendment of Accounting Review Bulletin (“ARB”) No. 51 (SFAS 160), the provisions of which have been incorporated in ASC 810 Business Combinations – Overall and FASB ASC 805-20 (“ASC 805-20) Business Combinations – Identifiable Assets and Liabilities, and Any Noncontrolling Interest. ASC 805-10 will significantly change current practices regarding business combinations. Among the more significant changes, ASC 805-10 expands the definition of a business and a business combination; requires the acquirer to recognize the assets acquired, liabilities assumed and noncontrolling interests (including goodwill), measured at fair value at the acquisition date; requires acquisition-related expenses and restructuring costs to be recognized separately from the business combination; requires assets acquired and liabilities assumed from contractual and non-contractual contingencies to be recognized at their acquisition date fair values with subsequent changes recognized in earnings; and requires in-process research and development to be capitalized at fair value as an indefinite-lived intangible asset. ASC 805-20 will change the accounting and reporting for minority interests, reporting them as equity separate from the parent entity’s equity, as well as requiring expanded disclosures. ASC 805-10 and ASC 805-20 are effective for financial statements issued for fiscal years beginning after December 15, 2008. The adoption of ASC 805-10 and ASC 805-20 required consolidated net income to be reported at amounts that include the amounts attributable to both the parent and the non-controlling interest. It also requires disclosure, on the face of the consolidated income statement, of the amounts of consolidated net income attributable to the parent and to the non-controlling interest.
In March 2008, the FASB issued ASC 815, Derivatives and Hedging (“ASC 815”), formerly recognized as SFAS No. 161, Disclosures about Derivative Instruments and Hedging Activities, an amendment of FASB Statement No. 133). ASC 815 requires enhanced disclosures about an entity’s derivative and hedging activities including how and why an entity uses derivative instruments, how an entity accounts for derivative instruments; and related hedged items and how derivative instruments and related hedged items affect an entity’s financial position, financial performance and cash flows. ASC 815 became effective beginning January 1, 2009. The provisions of ASC 815 are effective prospectively for the Trust’s consolidated financial statements issued for fiscal years and interim periods beginning after November 15, 2008. Refer to Note 8 Derivative Instruments and Hedging Activities.
In April 2009, the FASB issued ASC 825, Financial Instruments (“ASC 825”), formerly recognized as Financial Staff Position (“FSP”) No. 107-1 and Accounting Principles Board (“APB”) 28-1 (FSP No. 107-1 and APB 28-1), Interim Disclosures about Fair Value of Financial Instruments. ASC 825 requires disclosures of fair value for any financial instruments not currently reflected at fair value on the balance sheet for all interim periods. ASC 825 enhances consistency in financial reporting by increasing the frequency of fair value disclosures and is effective for interim and annual periods ending after June 15, 2009. The Trust, however, has been applying fair value to all financial instruments on either daily or weekly frequency to meet the daily valuation requirement of the Trust to deliver a daily per unit net asset value, thus these provisions did not have a material impact on the Trust’s consolidated financial statements.
In May 2009, the FASB issued ASC 855, Subsequent Events. The objective of this guidance is to establish general standards of accounting for and disclosure of events that occur after the balance sheet date but before financial statements are issued or are available to be issued. In particular, this guidance sets forth:
| 1. | The period after the balance sheet date during which management of a reporting entity should evaluate events or transactions that may occur for potential recognition or disclosure in the financial statements; |
| 2. | The circumstances under which an entity should recognize events or transactions occurring after the balance sheet date in its financial statements; and |
33
Table of Contents
The Frontier Fund
Notes to Financial Statements—(Continued)
As of September 30, 2009 (Unaudited)
| 3. | The disclosures that an entity should make about events or transactions that occurred after the balance sheet date. |
In accordance with this guidance, an entity should apply the requirements to interim or annual financial periods ending after June 15, 2009. The Trust adopted this standard effective April 1, 2009 and has and will make the appropriate disclosures, as required under ASC 855.
Recently Issued Accounting Pronouncements—In June 2009, the FASB issued ASC 860, Transfers and Servicing (“ASC 860”) formerly recognized as to SFAS No. 166, Accounting for Transfers of Financial Assets. ASC 860 requires more information about transfers of financial assets and where companies have continuing exposure to the risk related to transferred financial assets. ASC 860 eliminates the concept of a qualifying special purpose entity, changes the requirements for derecognizing financial assets and requires additional disclosure. This Statement is effective as of the beginning of each reporting entity’s first annual reporting period that begins after November 15, 2009, for interim periods within that first annual reporting period, and for interim and annual reporting periods thereafter. Earlier application is prohibited. The recognition and measurement provisions of this Statement shall be applied to transfers that occur on or after the effective date. The Trust intends to adopt ASC 860 for the period beginning January 1, 2010, and it anticipates that it will not have a material effect.
In applying these policies, the Managing Owner may make judgments that may require estimates about matters that are inherently uncertain.
Reclassification—Certain amounts in the financial statements have been reclassified to conform to the 2009 presentation.
3. Fair Value Measurements
Effective January 1, 2008, the Trust adopted ASC 820. ASC 820 provides clarification that when a quoted price in an active market for the identical asset or liability is not available, a reporting entity is required to measure fair value using certain techniques. ASC 820 also clarifies that when estimating the fair value of a liability, a reporting entity is not required to include a separate input or adjustment to other inputs relating to the existence of a restriction that prevents the transfer of an asset or liability. ASC 820 also clarifies that both a quoted price in an active market for the identical liability at the measurement date and the quoted price for the identical liability when traded as an asset in an active market when no adjustments to the quoted price of the asset are required are Level 1 fair value measurements.
Level 1 Inputs
Unadjusted quoted prices in active markets for identical financial assets that the reporting entity has the ability to access at the measurement date.
Level 2 Inputs
Inputs other than quoted prices included in Level 1 that are observable for the financial asset or liabilities, either directly or indirectly. These might include quoted prices for similar financial assets in active markets, quoted prices for identical or similar financial assets in markets that are not active, inputs other than quoted prices that are observable for the financial asset or inputs that are derived principally from or corroborated by market data by correlation or other means.
Level 3 Inputs
Unobservable inputs for determining the fair value of financial assets that reflect an entity’s own assumptions about the assumptions that market participants would use in pricing the financial asset.
The Trust uses the following methodologies to value instruments within its financial asset portfolio at fair value:
Trading Securities. These instruments include U.S. Treasury Securities and Open Trade Equity Positions (Futures Contracts and Currency Forwards) that are actively traded on public markets with quoted pricing for corroboration. U.S. Treasury Securities, Futures Contracts, and Currency Forward are reported at fair value using Level 1 inputs. Trading Securities instruments further include Open Trade Equity that are quoted prices for identical or similar assets that are not traded on active markets. Trading Options are reported at fair value using Level 2 inputs.
34
Table of Contents
The Frontier Fund
Notes to Financial Statements—(Continued)
As of September 30, 2009 (Unaudited)
Swap Contracts. Certain Swap Contracts are reported utilizing Level 2 inputs. These Swap Contracts are reported at fair value based on daily reports from the swap counterparty that may be corroborated against independent valuation/rate of return information published and available on a daily recurring frequency. Other Swap Contracts are reported utilizing Level 3 Inputs. These Swap Contracts are reported at fair value based upon returns/values that are provided on less than a daily frequency from the swap counterparty, require additional internal financial modeling to develop pricing, and these swaps may not be corroborated against independent valuation/rate of return information published and available on a daily recurring frequency.
Investment in Unconsolidated Trading Companies. This investment represents the fair value of the allocation of net assets, consisting of futures, forwards and options, to each respective Series relative to its trading allocations to unconsolidated Trading Companies.
The Trust, under the same management as the Trading Companies, has the benefit of full look through to the assets underlying the positions listed in the following table as “Investment in Unconsolidated Trading Companies”, and as such maintains this line item as the same Level 1 input as all the underlying positions on the financial statements of the Trading Companies.
The following table summarizes the instruments that comprise the Trust’s financial asset portfolio, by Series, measured at fair value on a recurring basis as of September 30, 2009, segregated by the level of valuation inputs within the fair value hierarchy utilized to measure fair value:
35
Table of Contents
The Frontier Fund
Notes to Financial Statements—(Continued)
As of September 30, 2009 (Unaudited)
| September 30, 2009 | Level 1 Inputs |
Level 2 Inputs |
Level 3 Inputs |
Total Fair Value |
||||||||||
| Frontier Diversified Series |
||||||||||||||
| Swap Contracts |
$ | 10,036,654 | $ | 10,036,654 | ||||||||||
| Investment in Unconsolidated Trading Companies |
$ | 1,856,353 | 1,856,353 | |||||||||||
| U.S. Treasury Securities |
5,260,038 | 5,260,038 | ||||||||||||
| Frontier Dynamic Series |
||||||||||||||
| Swap Contracts |
11,401,259 | 11,401,259 | ||||||||||||
| U.S. Treasury Securities |
3,019,383 | 3,019,383 | ||||||||||||
| Frontier Long Short Commodity Series |
||||||||||||||
| Open Trade Equity |
(5,671,163 | ) | (36,596 | ) | (5,707,759 | ) | ||||||||
| Investment in Unconsolidated Trading Companies |
1,233,271 | 1,233,271 | ||||||||||||
| U.S. Treasury Securities |
8,886,927 | 8,886,927 | ||||||||||||
| Frontier Masters Series |
||||||||||||||
| Swap Contracts |
9,636,598 | 9,636,598 | ||||||||||||
| Investment in Unconsolidated Trading Companies |
1,204,624 | 1,204,624 | ||||||||||||
| U.S. Treasury Securities |
3,459,933 | 3,459,933 | ||||||||||||
| Balanced Series |
||||||||||||||
| Open Trade Equity |
11,183,758 | 13,586,780 | 24,770,538 | |||||||||||
| Swap Contracts |
51,300,320 | 51,300,320 | ||||||||||||
| Investment in Unconsolidated Trading Companies |
39,610,131 | 39,610,131 | ||||||||||||
| U.S. Treasury Securities |
25,209,114 | 25,209,114 | ||||||||||||
| Campbell/Graham/Tiverton Series |
||||||||||||||
| Investment in Unconsolidated Trading Companies |
21,036,365 | 21,036,365 | ||||||||||||
| U.S. Treasury Securities |
10,280,937 | 10,280,937 | ||||||||||||
| Currency Series |
||||||||||||||
| Open Trade Equity |
22,988 | 1,248 | 24,236 | |||||||||||
| Swap Contracts |
6,479,642 | 6,479,642 | ||||||||||||
| U.S. Treasury Securities |
3,045,397 | 3,045,397 | ||||||||||||
| Long Only Commodity Series |
||||||||||||||
| Swap Contracts |
639,797 | 639,797 | ||||||||||||
| U.S. Treasury Securities |
614,075 | 614,075 | ||||||||||||
| Managed Futures Index Series |
||||||||||||||
| Investment in Unconsolidated Trading Companies |
1,117,433 | 1,117,433 | ||||||||||||
| U.S. Treasury Securities |
490,562 | 490,562 | ||||||||||||
| Winton Series |
||||||||||||||
| Investment in Unconsolidated Trading Companies |
3,322,573 | 3,322,573 | ||||||||||||
| U.S. Treasury Securities |
9,869,092 | 9,869,092 | ||||||||||||
| Winton/Graham Series |
||||||||||||||
| Open Trade Equity |
1,361,413 | 1,361,413 | ||||||||||||
| Investment in Unconsolidated Trading Companies |
2,536,697 | 2,536,697 | ||||||||||||
| U.S. Treasury Securities |
8,634,882 | 8,634,882 | ||||||||||||
36
Table of Contents
The Frontier Fund
Notes to Financial Statements—(Continued)
As of September 30, 2009 (Unaudited)
| December 31, 2008 | Level 1 Inputs |
Level 2 Inputs |
Level 3 Inputs |
Total Fair Value |
||||||||||
| Balanced Series |
||||||||||||||
| Open Trade Equity |
$ | 6,736,731 | $ | 16,412,796 | $ | 23,149,527 | ||||||||
| Swap Contracts |
53,072,356 | 53,072,356 | ||||||||||||
| Investment in Unconsolidated Trading Companies |
19,528,370 | 19,528,370 | ||||||||||||
| U.S. Treasury Securities |
43,042,540 | 43,042,540 | ||||||||||||
| Certificate of Deposits |
34,091,481 | 34,091,481 | ||||||||||||
| Winton Series |
||||||||||||||
| Open Trade Equity |
2,158,369 | 2,158,369 | ||||||||||||
| U.S. Treasury Securities |
12,899,592 | 12,899,592 | ||||||||||||
| Certificate of Deposits |
14,085,571 | 14,085,571 | ||||||||||||
| Campbell/Graham/Tiverton Series |
||||||||||||||
| Open Trade Equity |
(111,526 | ) | (111,526 | ) | ||||||||||
| Investment in Unconsolidated Trading Companies |
8,559,112 | 8,559,112 | ||||||||||||
| U.S. Treasury Securities |
9,371,661 | 9,371,661 | ||||||||||||
| Certificate of Deposits |
12,866,065 | 12,866,065 | ||||||||||||
| Currency Series |
||||||||||||||
| Open Trade Equity |
12,810 | 12,810 | ||||||||||||
| Swap Contracts |
9,122,121 | 9,122,121 | ||||||||||||
| U.S. Treasury Securities |
3,770,011 | 3,770,011 | ||||||||||||
| Certificate of Deposits |
3,506,438 | 3,506,438 | ||||||||||||
| Winton/Graham Series |
||||||||||||||
| Investment in Unconsolidated Trading Companies |
4,342,658 | 4,342,658 | ||||||||||||
| U.S. Treasury Securities |
1,424,286 | 1,424,286 | ||||||||||||
| Certificate of Deposits |
8,675,748 | 8,675,748 | ||||||||||||
| Long Only Series |
||||||||||||||
| Swap Contracts |
836,554 | 836,554 | ||||||||||||
| U.S. Treasury Securities |
1,241,289 | 1,241,289 | ||||||||||||
| Certificate of Deposits |
440,781 | 440,781 | ||||||||||||
| Long Short Series |
||||||||||||||
| Open Trade Equity |
10,933,828 | (180,065 | ) | 10,753,763 | ||||||||||
| U.S. Treasury Securities |
10,554,571 | 10,554,571 | ||||||||||||
| Certificate of Deposits |
10,923,009 | 10,923,009 | ||||||||||||
| Managed Futures Index Series |
||||||||||||||
| Investment in Unconsolidated Trading Companies |
770,967 | 770,967 | ||||||||||||
| U.S. Treasury Securities |
140,111 | 140,111 | ||||||||||||
| Certificate of Deposits |
488,470 | 488,470 | ||||||||||||
The changes in Level 3 assets measured at fair value on a recurring basis are summarized in the following tables. Swap Contract asset gains and losses (realized/unrealized) included in earnings are classified in “realized and unrealized gain (loss) on investments – net unrealized gain/(loss) on swap contracts” on the consolidated statement of operations. During the three months and nine months ended September 30, 2009, all identified Level 3 assets are components of the Frontier Diversified Series, Frontier Dynamic Series, Frontier Masters Series, Balanced Series and the Currency Series.
37
Table of Contents
The Frontier Fund
Notes to Financial Statements—(Continued)
As of September 30, 2009 (Unaudited)
| Swap Contracts | Frontier Diversified Series | Frontier Dynamic Series | Frontier Masters Series | |||||||
| For The Three Months Ended September 30, 2009 |
For The Three Months Ended September 30, 2009 |
For The Three Months Ended September 30, 2009 |
||||||||
| Balance of recurring Level 3 assets as of June 30, 2009 |
$ | 4,627,389 | $ | 11,392,619 | $ | 6,810,402 | ||||
| Total gains or losses (realized/unrealized): |
||||||||||
| Included in earnings-realized |
— | — | — | |||||||
| Included in earnings-unrealized |
129,598 | 8,640 | (191,513 | ) | ||||||
| Purchases, sales, issuances, and settlements, net |
5,279,667 | — | 3,017,709 | |||||||
| Transfers in and/or out of Level 3 |
— | — | — | |||||||
| Balance of recurring Level 3 assets as of September 30, 2009 |
$ | 10,036,654 | $ | 11,401,259 | $ | 9,636,598 | ||||
| Swap Contracts | Balanced Series | Currency Series | |||||
| For The Three Months Ended September 30, 2009 |
For The Three Months Ended September 30, 2009 |
||||||
| Balance of recurring Level 3 assets as of June 30, 2009 |
$ | 50,836,503 | $ | 7,372,137 | |||
| Total gains or losses (realized/unrealized): |
|||||||
| Included in earnings-realized |
— | — | |||||
| Included in earnings-unrealized |
463,817 | (892,495 | ) | ||||
| Included in other comprehensive income |
— | — | |||||
| Purchases, sales, issuances, and settlements, net |
— | — | |||||
| Transfers in and/or out of Level 3 |
— | — | |||||
| Balance of recurring Level 3 assets as of September 30, 2009 |
$ | 51,300,320 | $ | 6,479,642 | |||
| Swap Contracts | Frontier Diversified Series | Frontier Dynamic Series | Frontier Masters Series | |||||||||
| For The Nine Months Ended September 30, 2009 |
For The Nine Months Ended September 30, 2009 |
For The Nine Months Ended September 30, 2009 |
||||||||||
| Balance of recurring Level 3 assets as of January 1, 2009 |
$ | — | $ | — | $ | — | ||||||
| Total gains or losses (realized/unrealized): |
||||||||||||
| Included in earnings-realized |
— | — | — | |||||||||
| Included in earnings-unrealized |
(243,013 | ) | (873,506 | ) | (381,111 | ) | ||||||
| Included in other comprehensive income |
— | — | — | |||||||||
| Purchases, sales, issuances, and settlements, net |
10,279,667 | 12,274,765 | 10,017,709 | |||||||||
| Transfers in and/or out of Level 3 |
— | — | — | |||||||||
| Balance of recurring Level 3 assets as of September 30, 2009 |
$ | 10,036,654 | $ | 11,401,259 | $ | 9,636,598 | ||||||
| Swap Contracts | Balanced Series | Currency Series | ||||||
| For The Nine Months Ended September 30, 2009 |
For The Nine Months Ended September 30, 2009 |
|||||||
| Balance of recurring Level 3 assets as of January 1, 2009 |
$ | 53,072,353 | $ | 9,122,123 | ||||
| Total gains or losses (realized/unrealized): |
||||||||
| Included in earnings-realized |
— | — | ||||||
| Included in earnings-unrealized |
(1,772,033 | ) | (2,642,481 | ) | ||||
| Included in other comprehensive income |
— | — | ||||||
| Purchases, sales, issuances, and settlements, net |
— | — | ||||||
| Transfers in and/or out of Level 3 |
— | — | ||||||
| Balance of recurring Level 3 assets as of September 30, 2009 |
$ | 51,300,320 | $ | 6,479,642 | ||||
4. Swaps
In addition to authorizing Trading Advisors to manage pre-determined investment levels of futures and forward contracts, certain Series of the Trust will strategically invest a portion or all of their assets in total return Swaps, selected at the direction of the Managing Owner. Swaps are privately negotiated contracts designed to provide investment returns linked to those produced by one or more investment products or indices. In a typical Swap, two parties agree to exchange the returns (or differentials in rates of return) earned or realized on one or more particular predetermined investments or instruments. The gross returns to be exchanged or “swapped” between the parties are calculated with respect to a “notional amount” (i.e., the amount or value of the underlying asset used in computing the particular interest rate, return, or other amount to be exchanged) in a particular investment, or in a “basket” of securities.
Each Series’ investment in Swaps will likely differ substantially over time due to cash flows, portfolio management decisions and market movements. For the Balanced Series, Currency Series, Frontier Diversified Series and Frontier Masters Series, the Swaps serve to diversify the investment holdings of each Series and to provide access to programs and advisors that would not be otherwise available to the Series, and are not used for hedging purposes.
The Managing Owner follows a procedure in selecting well-established financial institutions which the Managing Owner, in its sole discretion, considers to be reputable, reliable, financially responsible and well established to act as swap counterparties. The procedure includes due diligence review of documentation on all new and existing financial institution counterparties prior to initiation of the relationship, and quarterly ongoing review during the
38
Table of Contents
The Frontier Fund
Notes to Financial Statements—(Continued)
As of September 30, 2009 (Unaudited)
relationship, to ensure that counterparties meet the Managing Owner’s minimum credit requirements, the counterparty average rating being no less than an investment grade rating as defined by the rating agencies. As of September 30, 2009, approximately 11.5% of the Trust’s assets were deposited with over-the-counter counterparties in order to initiate and maintain Swaps.
The Balanced Series, Currency Series, Frontier Diversified Series, Frontier Dynamic Series and Frontier Masters Series strategically invest assets in one or more Swaps linked to certain underlying investments or indices at the direction of the Managing Owner. The Trading Company in which the assets of these Series will be invested will not own any of the investments or indices referenced by any Swap entered into by these Series. In addition, neither the swap counterparty to the Trading Company of these Series nor any advisor referenced by any such Swap is a Trading Advisor to these Series.
The Long Only Commodity Series, through the Trading Company in which the assets of the Long Only Commodity Series have been allocated, have entered into various Swaps with one or more swap counterparties. The Swaps enable the Long Only Commodity Series to earn returns similar to returns (less the fees and expenses of the Long Only Commodities Series, including the expenses associated with the Swaps) of the Reuters/Jefferies CRB Index (the “RJ/CRB Index”), and the Jefferies Commodity Performance Index (the “JCPI”). Specifically, the Trading Company, which will hold the assets allocable to the Long Only Commodity Series, will enter into Swaps linked to the RJ/CRB Index and the JCPI at the direction of the Managing Owner.
The Trust has invested in the following Swaps as of September 30, 2009:
| Option Basket Balanced Series |
Option Basket Currency Series |
Reuters/Jefferies CRB Index |
Jefferies Commodity Performance Index | |||||||||||
| Series: | Balanced | Currency | Long Only | Long Only | ||||||||||
| Counterparty |
Company A | Company B | Company C | Company C | ||||||||||
| Notional Amount |
$ | 112,958,718 | $ | 20,979,642 | $ | 2,250,000 | $ | 2,250,000 | ||||||
| Termination Date |
November 6, 2012 | July 26, 2013 | February 26, 2010 | February 26, 2010 | ||||||||||
| Investee Returns |
Total Return | Total Return | Total Return | Total Return | ||||||||||
| Realized Gain/(Loss) on Option/Swap Contracts |
$ | — | $ | — | $ | 265,186 | $ | 245,067 | ||||||
| Unrealized Gain / (Loss) on Option/Swap Contracts |
$ | (1,882,690 | ) | $ | (2,642,481 | ) | $ | — | $ | — | ||||
| Fair value of Swap Contracts at 09/30/2009 |
$ | 51,300,320 | $ | 6,479,642 | $ | 318,194 | $ | 321,603 | ||||||
39
Table of Contents
The Frontier Fund
Notes to Financial Statements—(Continued)
As of September 30, 2009 (Unaudited)
| Option Basket Frontier Diversified Series |
Option Basket Frontier Dynamic Series |
Total Returns Swap Frontier Masters Series |
||||||||||
| Series: | Frontier Diversified | Frontier Dynamic | Frontier Masters | |||||||||
| Counterparty |
Company D | Company E | Company F | |||||||||
| Notional Amount |
$ | 27,218,501 | $ | 28,491,909 | $ | 9,742,916 | ||||||
| Termination Date |
June 10, 2014 | June 10, 2014 | June 10, 2014 | |||||||||
| Investee Returns |
Total Return | Total Return | Total Return | |||||||||
| Realized Gain/(Loss) on Option/Swap Contracts |
$ | — | $ | — | $ | — | ||||||
| Unrealized Gain / (Loss) on Option/Swap Contracts |
$ | (243,013 | ) | $ | (873,506 | ) | $ | (381,111 | ) | |||
| Fair value of Swap Contracts at 09/30/2009 |
$ | 10,036,654 | $ | 11,401,259 | $ | 9,636,598 | ||||||
40
Table of Contents
The Frontier Fund
Notes to Financial Statements—(Continued)
As of September 30, 2009 (Unaudited)
5. Investments in Unconsolidated Trading Companies
The following table summarizes the Balanced Series, Winton Series, Campbell/Graham/Tiverton Series, Winton/Graham Series, Frontier Long/Short Commodity Series, Managed Futures Index Series, Frontier Diversified Series, and Frontier Masters Series investments in unconsolidated Trading Companies as of September 30, 2009, and December 31, 2008. These investments represent cash and open trade equity invested in the Trading Companies by each Series and cumulative trading profits or losses allocated to each Series by the Trading Companies. Trading Companies allocate trading profits or losses on the basis of the proportion of each Series’ capital allocated for trading to each respective Trading Company, which bears no relationship to the amount of cash invested by a Series in the Trading Company.
41
Table of Contents
The Frontier Fund
Notes to Financial Statements—(Continued)
As of September 30, 2009 (Unaudited)
| As of September 30, 2009 | As of December 31, 2008 | |||||||||||
| Trading Company | Percentage of Series Net Assets Invested in Trading Co. |
Fair Value | Percentage of Series Net Assets Invested in Trading Co. |
Fair Value | ||||||||
| Balanced Series— |
||||||||||||
| Frontier Trading Company II LLC and Frontier Trading Company VII, LLC |
9.47 | % | $ | 39,610,131 | 5.85 | % | $ | 19,528,370 | ||||
| Winton Series— |
||||||||||||
| Frontier Trading Company II LLC |
5.38 | % | $ | 3,322,573 | — | $ | — | |||||
| Campbell/Graham/Tiverton Series— |
||||||||||||
| Frontier Trading Company I LLC, Frontier Trading Company V LLC and Frontier Trading Company VI LLC |
25.56 | % | $ | 21,036,365 | 11.01 | % | $ | 8,559,112 | ||||
| Winton/Graham Series— |
||||||||||||
| Frontier Trading Company II LLC |
3.56 | % | $ | 2,536,697 | 8.65 | % | $ | 4,342,658 | ||||
| Frontier Long/Short Commodity Series— |
||||||||||||
| Frontier Trading Company XIII, LLC |
1.30 | % | $ | 1,233,271 | — | $ | — | |||||
| Managed Futures Index Series— |
||||||||||||
| Frontier Trading Company IX, LLC |
26.23 | % | $ | 1,117,433 | 22.66 | % | $ | 770,967 | ||||
| Frontier Diversified Series— |
||||||||||||
| Frontier Trading Company I LLC, Frontier Trading Company II LLC, Frontier Trading Company V LLC, Frontier Trading Company VI LLC and Frontier Trading Company VII, LLC |
3.42 | % | $ | 1,856,353 | — | $ | — | |||||
| Frontier Masters Series— |
||||||||||||
| Frontier Trading Company I LLC and Frontier Trading Company II LLC |
3.49 | % | $ | 1,204,624 | — | $ | — | |||||
42
Table of Contents
The Frontier Fund
Notes to Financial Statements—(Continued)
As of September 30, 2009 (Unaudited)
The following tables summarize the Balanced Series, Winton Series, Campbell/Graham/Tiverton Series, Winton/Graham Series, Frontier Long/Short Commodity Series, Managed Futures Index Series, Frontier Diversified Series and Frontier Masters Series equity in earnings from Trading Companies for the three months ended September 30, 2009, and 2008.
| Three Months Ended September 30, 2009 | Three Months Ended September 30, 2008 | |||||||||||||||||||||||||||||||
| Trading Company | Trading Commissions |
Realized Gain (Loss) |
Change in Unrealized Gain (Loss) |
Net Income (Loss) |
Trading Commissions |
Realized Gain (Loss) |
Change in Unrealized Gain (Loss) |
Net Income (Loss) |
||||||||||||||||||||||||
| Balanced Series— |
||||||||||||||||||||||||||||||||
| Frontier Trading Company II LLC |
$ | (10,224 | ) | $ | (655,732 | ) | $ | 1,276,175 | $ | 610,219 | $ | (11,241 | ) | $ | (1,212,751 | ) | $ | (1,882,741 | ) | $ | (3,106,733 | ) | ||||||||||
| Frontier Trading Company VII, LLC |
(545,362 | ) | 39,899,274 | (39,744,068 | ) | (390,156 | ) | (173,863 | ) | 3,001,894 | (1,223,038 | ) | 1,604,993 | |||||||||||||||||||
| Total |
$ | (555,586 | ) | $ | 39,243,542 | $ | (38,467,893 | ) | $ | 220,063 | $ | (185,104 | ) | $ | 1,789,143 | $ | (3,105,779 | ) | $ | (1,501,740 | ) | |||||||||||
| Winton Series— |
||||||||||||||||||||||||||||||||
| Frontier Trading Company II LLC |
$ | (16,030 | ) | $ | (898,583 | ) | $ | 2,016,056 | $ | 1,101,443 | — | — | — | — | ||||||||||||||||||
| Campbell/Graham/ Tiverton Series— |
||||||||||||||||||||||||||||||||
| Frontier Trading Company I LLC |
$ | (12,413 | ) | $ | (582,464 | ) | $ | 549,157 | $ | (45,720 | ) | $ | (12,006 | ) | $ | 1,190,705 | $ | (304,010 | ) | $ | 874,689 | |||||||||||
| Frontier Trading Company V LLC |
(71,763 | ) | 1,844,101 | 958,366 | 2,730,704 | — | — | — | — | |||||||||||||||||||||||
| Frontier Trading Company VI LLC |
(9,764 | ) | 37,136 | 1,221,285 | 1,248,657 | (7,497 | ) | 918,043 | (1,698,097 | ) | (787,551 | ) | ||||||||||||||||||||
| Total |
$ | (93,940 | ) | $ | 1,298,773 | $ | 2,728,808 | $ | 3,933,641 | $ | (19,503 | ) | $ | 2,108,748 | $ | (2,002,107 | ) | $ | 87,138 | |||||||||||||
| Winton/Graham Series— |
||||||||||||||||||||||||||||||||
| Frontier Trading Company II, LLC |
$ | (8,935 | ) | $ | (610,875 | ) | $ | 1,111,997 | $ | 492,187 | $ | — | $ | — | $ | — | $ | — | ||||||||||||||
| Frontier Trading Company V LLC |
— | — | — | — | (17,622 | ) | (13,167,968 | ) | 11,549,742 | (1,635,848 | ) | |||||||||||||||||||||
| Total |
$ | (8,935 | ) | $ | 610,875 | $ | 1,111,997 | $ | 492,187 | $ | (17,622 | ) | $ | (13,167,968 | ) | $ | 11,549,742 | $ | (1,635,848 | ) | ||||||||||||
43
Table of Contents
The Frontier Fund
Notes to Financial Statements—(Continued)
As of September 30, 2009 (Unaudited)
| Frontier Long/Short Series— |
||||||||||||||||||||||||||||||||
| Frontier Trading Company XIII, LLC– |
$ | (2,617 | ) | $ | (5,415 | ) | $ | 274,056 | $ | 266,024 | — | — | — | — | ||||||||||||||||||
| Frontier Diversified Series— |
||||||||||||||||||||||||||||||||
| Frontier Trading Company I LLC |
$ | (25,344 | ) | $ | (7,402 | ) | $ | 455,543 | $ | 422,797 | — | — | — | — | ||||||||||||||||||
| Frontier Trading Company II LLC |
(973 | ) | (54,619 | ) | 126,120 | 70,528 | — | — | — | |
— |
| ||||||||||||||||||||
| Frontier Trading Company V LLC |
(1,273 | ) | 33,738 | 19,003 | 51,468 | — | — | — | — | |||||||||||||||||||||||
| Frontier Trading Company VI LLC |
(1,102 | ) | 12,372 | 140,845 | 152,115 |
|
— |
|
— |
|
— |
|
— | |||||||||||||||||||
| Frontier Trading Company VII, LLC |
(50,306 | ) | 3,315,379 | (3,299,554 | ) | (34,481 | ) | |||||||||||||||||||||||||
| Frontier Trading Company XIII, LLC |
$ | (313 | ) | 15,519 | 16,222 | 31,428 |
|
— |
|
— |
|
— |
|
— | ||||||||||||||||||
| Total |
$ | (79,311 | ) | $ | 3,314,987 | $ | (2,541,821 | ) | $ | 693,855 | — | — | — | — | ||||||||||||||||||
| Frontier Masters Series— |
||||||||||||||||||||||||||||||||
| Frontier Trading Company I LLC |
$ | (14,224 | ) | $ | (63,434 | ) | $ | 567,498 | $ | 489,840 | — | — | — | — | ||||||||||||||||||
| Frontier Trading Company II LLC |
(1,938 | ) | (86,439 | ) | 250,483 | 162,106 | — | — | — | — | ||||||||||||||||||||||
| Total |
$ | (16,162 | ) | $ | (149,873 | ) | $ | 817,981 | $ | 651,946 | — | — | — | — | ||||||||||||||||||
| Managed Futures Index Series— |
||||||||||||||||||||||||||||||||
| Frontier Trading Company IX, LLC |
$ | (3,313 | ) | $ | (65,852 | ) | $ | (17,148 | ) | $ | (86,313 | ) | $ | (1,178 | ) | $ | (63,140 | ) | $ | (61,722 | ) | $ | (126,040 | ) | ||||||||
44
Table of Contents
The Frontier Fund
Notes to Financial Statements—(Continued)
As of September 30, 2009 (Unaudited)
The following tables summarize the Balanced Series, Winton Series, Campbell/Graham/Tiverton Series, Winton/Graham Series, Frontier Long/Short Commodity Series, Managed Futures Index Series, Frontier Diversified Series and Frontier Masters Series equity in earnings from Trading Companies for the nine months ended September 30, 2009, and 2008.
| Nine Months Ended September 30, 2009 | Nine Months Ended September 30, 2008 | |||||||||||||||||||||||||||||||
| Trading Company |
Trading Commissions |
Realized Gain (Loss) |
Change in Unrealized Gain (Loss) |
Net Income (Loss) |
Trading Commissions |
Realized Gain (Loss) |
Change in Unrealized Gain (Loss) |
Net Income (Loss) |
||||||||||||||||||||||||
| Balanced Series— |
||||||||||||||||||||||||||||||||
| Frontier Trading Company II LLC |
$ | (23,472 | ) | $ | (2,656,602 | ) | $ | 872,349 | $ | (1,807,725 | ) | $ | (27,064 | ) | $ | (426,033 | ) | $ | (1,018,940 | ) | $ | (1,472,037 | ) | |||||||||
| Frontier Trading Company VII, LLC |
(1,219,711 | ) | 25,863,431 | (15,919,099 | ) | 8,724,621 | (458,471 | ) | (1,676,142 | ) | 11,651,421 | 9,516,808 | ||||||||||||||||||||
| Total |
$ | (1,243,183 | ) | $ | 23,206,829 | $ | (15,046,750 | ) | $ | 6,916,896 | $ | (485,535 | ) | $ | (2,102,175 | ) | $ | 10,632,481 | $ | 8,044,771 | ||||||||||||
| Winton Series— |
||||||||||||||||||||||||||||||||
| Frontier Trading Company II LLC |
$ | (23,033 | ) | $ | (2,361,228 | ) | $ | 2,700,361 | $ | 316,100 | $ | (38,401 | ) | $ | 6,765,536 | $ | 200,117 | $ | 6,927,252 | |||||||||||||
| Campbell/Graham/ Tiverton Series— |
||||||||||||||||||||||||||||||||
| Frontier Trading Company I LLC |
$ | (46,889 | ) | $ | 2,417,043 | $ | (3,636,680 | ) | $ | (1,266,526 | ) | $ | (15,017 | ) | $ | 1,323,763 | $ | 79,205 | $ | 1,387,951 | ||||||||||||
| Frontier Trading Company V LLC |
(106,342 | ) | 2,059,182 | 1,095,206 | 3,048,046 | — | — | — | — | |||||||||||||||||||||||
| Frontier Trading Company VI LLC |
(21,615 | ) | (1,336,451 | ) | 903,580 | (454,486 | ) | (25,348 | ) | 596,068 | 780,353 | 1,351,073 | ||||||||||||||||||||
| Total |
$ | (174,846 | ) | $ | 3,139,774 | $ | (1,637,894 | ) | $ | 1,327,034 | $ | (40,365 | ) | $ | 1,919,831 | $ | 859,558 | $ | 2,739,024 | |||||||||||||
| Winton/Graham Series— |
||||||||||||||||||||||||||||||||
| Frontier Trading Company II LLC |
$ | (20,399 | ) | $ | (2,705,362 | ) | $ | 802,930 | $ | (1,922,831 | ) | $ | — | $ | — | $ | — | $ | — | |||||||||||||
| Frontier Trading Company V LLC |
(46,668 | ) | (892,742 | ) | (397,116 | ) | (1,336,526 | ) | (40,869 | ) | (11,090,962 | 12,084,989 | 953,158 | |||||||||||||||||||
| Total |
$ | (67,067 | ) | $ | (3,598,104 | ) | $ | 405,814 | $ | (3,259,357 | ) | $ | (40,869 | ) | $ | (11,090,962 | ) | $ | 12,084,989 | $ | 953,158 | |||||||||||
45
Table of Contents
The Frontier Fund
Notes to Financial Statements—(Continued)
As of September 30, 2009 (Unaudited)
| Frontier Long/Short Series— |
|||||||||||||||||||||||||||||||
| Frontier Trading Company XIII, LLC |
$ | (5,776 | ) | $ | (58,816 | ) | $ | 297,863 | $ | 233,271 | — | — | — | — | |||||||||||||||||
| Frontier Diversified Series— |
|||||||||||||||||||||||||||||||
| Frontier Trading Company I LLC |
$ | (30,082 | ) | $ | (73,518 | ) | $ | 246,565 | $ | 142,965 | — | — | — | — | |||||||||||||||||
| Frontier Trading Company II LLC |
(1,208 | ) | (110,535 | ) | 211,913 | 100,170 | |||||||||||||||||||||||||
| Frontier Trading Company V LLC |
(1,531 | ) | 25,408 | 9,685 | 33,562 | — | — | — | — | ||||||||||||||||||||||
| Frontier Trading Company VI LLC |
(1,366 | ) | (88,709 | ) | 205,196 | 115,121 | — | — | — | — | |||||||||||||||||||||
| Frontier Trading Company VII, LLC |
(62,761 | ) | 990,987 | (895,119 | ) | 33,107 | — | — | — | — | |||||||||||||||||||||
| Frontier Trading Company XIII, LLC |
(313 | ) | 15,519 | 16,222 | 31,428 | — | — | — | — | ||||||||||||||||||||||
| Total |
$ | (97,261 | ) | $ | 759,152 | $ | (205,538 | ) | $ | 456,353 | — | — | — | — | |||||||||||||||||
| Frontier Masters Series— |
|||||||||||||||||||||||||||||||
| Frontier Trading Company I LLC |
$ | (18,100 | ) | $ | (81,406 | ) | $ | 178,140 | $ | 78,634 | — | — | — | — | |||||||||||||||||
| Frontier Trading Company II LLC |
(2,426 | ) | (202,376 | ) | 430,792 | 225,990 | — | — | — | — | |||||||||||||||||||||
| Total |
$ | (20,526 | ) | $ | (283,782 | ) | $ | 608,932 | $ | 304,624 | — | — | — | — | |||||||||||||||||
| Managed Futures Index Series— |
|||||||||||||||||||||||||||||||
| Frontier Trading Company IX, LLC |
$ | (7,510 | ) | $ | (260,261 | ) | $ | (56,326 | ) | $ | (324,097 | ) | $ | (3,335 | ) | $ | 61,154 | $ | (60,030 | ) | $ | (2,211 | ) | ||||||||
46
Table of Contents
The Frontier Fund
Notes to Financial Statements—(Continued)
As of September 30, 2009 (Unaudited)
The statements of financial condition as of September 30, 2009, and December 31, 2008, for the unconsolidated Trading Companies are as follows:
| Statements of Financial Condition—September 30, 2009 | Frontier Trading Company II LLC |
Frontier Trading Company VI LLC |
Frontier Trading Company IX, LLC |
Frontier Trading Company XIII, LLC | ||||||||
| Cash held at futures commission merchants |
$ | 14,310,085 | $ | 9,501,199 | $ | 1,380,043 | $ | 4,821,271 | ||||
| Open trade equity |
5,105,956 | 2,808,808 | 4,116 | 910,012 | ||||||||
| Total assets |
$ | 19,416,041 | $ | 12,310,007 | $ | 1,384,159 | $ | 5,731,283 | ||||
| Members’ equity |
$ | 19,416,041 | $ | 12,310,007 | $ | 1,384,159 | $ | 5,731,283 | ||||
| Statements of Financial Condition—December 31, 2008 | Frontier Trading Company V LLC |
Frontier Trading Company VI LLC |
Frontier Trading Company IX, LLC | |||||||
| Cash held at futures commission merchants |
$ | 5,221,709 | $ | 6,271,352 | $ | 1,794,715 | ||||
| Open trade equity |
(111,526 | ) | 109,880 | 203,419 | ||||||
| Total assets |
$ | 5,110,183 | $ | 6,381,232 | $ | 1,998,134 | ||||
| Members’ equity |
$ | 5,110,183 | $ | 6,382,232 | $ | 1,998,134 | ||||
47
Table of Contents
The Frontier Fund
Notes to Financial Statements—(Continued)
As of September 30, 2009 (Unaudited)
The statements of income for the three and nine months ended September 30, 2009 for the unconsolidated Trading Companies are as follows:
| Statements of Income—For the Three Months Ended September 30, 2009 | Frontier Trading Company II LLC |
Frontier Trading Company VI LLC |
Frontier Trading Company IX, LLC |
Frontier Trading Company XIII, LLC |
||||||||||||
| Interest income |
$ | (17 | ) | $ | 392 | $ | 1,151 | $ | — | |||||||
| Net realized gain (loss) on investments, less commissions |
(2,344,349 | ) | 76,341 | (138,585 | ) | (8,999 | ) | |||||||||
| Change in open trade equity |
4,780,831 | 2,973,249 | (44,297 | ) | 838,460 | |||||||||||
| Net income (loss) |
$ | 2,436,465 | $ | 3,049,982 | $ | (181,731 | ) | $ | 829,461 | |||||||
| Statements of Income—For the Nine Months Ended September 30, 2009 | Frontier Trading Company II LLC |
Frontier Trading Company VI LLC |
Frontier Trading Company IX, LLC |
Frontier Trading Company XIII, LLC |
||||||||||||
| Interest income |
$ | 11,216 | $ | 8,808 | $ | 4,089 | $ | — | ||||||||
| Net realized gain (loss) on investments, less commissions |
(10,338,765 | ) | (3,586,528 | ) | (743,101 | ) | (178,729 | ) | ||||||||
| Change in open trade equity |
2,986,998 | 2,698,878 | (199,302 | ) | 910,012 | |||||||||||
| Net income (loss) |
$ | (7,340,551 | ) | $ | (878,842 | ) | $ | (938,314 | ) | $ | 731,283 | |||||
6. Transactions with Affiliates
The Managing Owner contributes funds to the Trust in order to have a 1% interest in the aggregate capital, profits and losses of all Series and in return will receive units designated as general units in the Series in which the Managing Owner invests such funds. The general units may only be purchased by the Managing Owner and may be subject to no advisory fees or advisory fees at reduced rates. Otherwise, the general units hold the same rights as the limited units. The Managing Owner is required to maintain at least a 1% interest (“Minimum Purchase Commitment”) in the aggregate capital, profits and losses of all Series so long as it is acting as the Managing Owner of the Trust. Such contribution was made by the Managing Owner before trading commenced for the Trust and will be maintained throughout the existence of the Trust, and the Managing Owner will make such purchases as are necessary to effect this requirement. Additionally, the Managing Owner agreed with certain regulatory bodies to maintain a 1% interest specifically in the Balanced Series Class 1a Units and Balanced Series Class 2a Units, aggregated, and each of the Long Only Commodity Series, Frontier Long/Short Commodity Series, Managed Futures Index Series, Frontier Diversified Series, Frontier Dynamic Series and Frontier Masters Series. The 1% interest in these specific Series is included in computing the Minimum Purchase Commitment in aggregate capital. In addition to the General Units the Managing Owner receives in respect of its Minimum Purchase Commitment, the Managing Owner may purchase Limited Units in any Series as a Limited Owner. Principals of the Managing Owner or affiliates are allowed to own beneficial interests in the Trust, as well. All Units purchased by the Managing Owner are held for investment purposes only and not for resale. The Managing Owner may make purchases or redemptions at any time on the same terms as any Limited Owner. The Trust has and will continue to have certain relationships with the Managing Owner and its affiliates.
The Balanced Series, in order to make investments in the Currency Series, Frontier Diversified Series, Frontier Dynamic Series and Frontier Masters Series, advances funds to such Series, for the purpose of investing in the respective Trading Company for such Series on behalf of the Balanced Series.
The following table summarizes the Balanced Series advances to and reductions from the Currency Series, Frontier Diversified Series, Frontier Dynamic Series and Frontier Masters Series of the Trust for the nine months ending September 30, 2009.
48
Table of Contents
The Frontier Fund
Notes to Financial Statements—(Continued)
As of September 30, 2009 (Unaudited)
Balanced Series
Summary by Quarter
2009
| Currency Series | Frontier Diversified Series |
Frontier Dynamic Series |
Frontier Masters Series |
Total | ||||||||||||||||
| Inter-series receivables January 1, 2009 |
$ | 14,679,460 | $ | — | $ | — | $ | — | $ | 14,679,460 | ||||||||||
| Additions during period |
— | — | — | — | — | |||||||||||||||
| Reduction during period |
— | — | — | — | — | |||||||||||||||
| Earnings in investments in Inter-Series Receivables |
(745,512 | ) | — | — | — | (745,512 | ) | |||||||||||||
| Inter-series receivables March 31, 2009 |
$ | 13,933,948 | $ | — | $ | — | $ | — | $ | 13,933,948 | ||||||||||
| — | ||||||||||||||||||||
| Additions during period |
— | 35,000,000 | 30,000,000 | 28,000,000 | 93,000,000 | |||||||||||||||
| Reduction during period |
— | — | — | — | — | |||||||||||||||
| Earnings in investments in Inter-Series Receivables |
(337,249 | ) | (625,551 | ) | (847,463 | ) | (538,696 | ) | (2,348,959 | ) | ||||||||||
| Inter-series receivables June 30, 2009 |
$ | 13,596,699 | $ | 34,374,449 | $ | 29,152,537 | $ | 27,461,304 | $ | 104,584,989 | ||||||||||
| Additions during period |
— | — | — | — | — | |||||||||||||||
| Reduction during period |
— | — | — | — | — | |||||||||||||||
| Earnings in investments in Inter-Series Receivables |
(506,280 | ) | 451,702 | (26,501 | ) | 222,585 | 141,506 | |||||||||||||
| Inter-series receivables September 30, 2009 |
$ | 13,090,419 | $ | 34,826,151 | $ | 29,126,036 | $ | 27,683,889 | $ | 104,726,495 | ||||||||||
Each Series of Units pays to the Managing Owner a monthly management fee equal to a certain percentage of such Series’ assets, calculated on a daily basis. The annual rate of the management fee is 0.5% for the Balanced Series, 2.0% for the Winton Series, Currency Series, Long Only Commodity Series, Frontier Long/Short Commodity Series Class 1a and Class 2a, Managed Futures Index Series, Frontier Diversified Series, Frontier Dynamic Series and Frontier Masters Series, 2.5% for the Winton/Graham Series and Campbell/Graham/Tiverton Series, and 3.5% for the Frontier Long/Short Commodity Series Class 1 and Class 2. The Managing Owner may pay all or a portion of such management fees to the Trading Advisor(s) for such Series.
In connection with each Series’ trading activities, each Series of Units pays to the Managing Owner a monthly trading fee of up to 0.75% of such Series’ NAV annually.
Some Series pay to the Managing Owner an incentive fee of a certain percentage of new net trading profits generated by such Series, monthly or quarterly. Because the Balanced Series, Winton/Graham Series, Campbell/Graham/Tiverton Series, Currency Series and Frontier Long/Short Commodity Series may each employ multiple Trading Advisors, these Series will pay the Managing Owner a monthly incentive fee calculated on a Trading Advisor by Trading Advisor basis. It is therefore possible that in any given period the Balanced Series or the Frontier Long/Short Commodity Series may pay incentive fees to the Managing Owner for one or more Trading Advisors while each of these Series as a whole experiences losses. The incentive fee is 25% for the Balanced Series and the Frontier Diversified Series and 20% for the Winton Series Currency Series, Winton/Graham Series Campbell/Graham/Tiverton Series, Frontier Long/Short Commodity Series, Frontier Dynamic Series and Frontier Masters Series. There is no incentive fee for the Long Only Commodity Series or the Managed Futures Index Series. The Managing Owner may pay all or a portion of such incentive fees to the Trading Advisor(s) for such Series.
In addition, with respect to Class 1 and Class 1a Units of each Series, as applicable, the Series pays monthly or quarterly to the Managing Owner a service fee at an annualized rate, as described in more detail above, which the Managing Owner pays to selling agents of the Trust.
49
Table of Contents
The Frontier Fund
Notes to Financial Statements—(Continued)
As of September 30, 2009 (Unaudited)
The following table summarizes fees earned by the Managing Owner for the three and nine months ended September 30, 2009.
| Series: Three Months |
Management Fee | Trading Fee | Incentive Fee | Service Fee | ||||||||
| Frontier Diversified |
$ | 61,573 | $ | 238,385 | $ | 103,872 | $ | 37,029 | ||||
| Frontier Dynamic |
— | 175,075 | — | 19,136 | ||||||||
| Frontier Long/Short Commodity |
756,119 | 84,684 | 394,978 | 355,681 | ||||||||
| Frontier Masters |
114,063 | 173,101 | — | 22,973 | ||||||||
| Balanced |
258,424 | 426,936 | 1,617,711 | 2,346,679 | ||||||||
| Campbell/Graham/Tiverton |
577,342 | 101,597 | 218,702 | 537,325 | ||||||||
| Currency |
38,751 | 31,210 | — | 72,949 | ||||||||
| Long Only Commodity |
13,603 | 5,423 | — | 17,712 | ||||||||
| Managed Futures Index |
21,711 | 5,491 | — | 10,670 | ||||||||
| Winton |
328,132 | 76,757 | — | 387,216 | ||||||||
| Winton/Graham |
438,658 | 76,851 | 256,842 | 367,929 | ||||||||
| Series: Nine Months |
Management Fee | Trading Fee | Incentive Fee | Service Fee | |||||||||
| Frontier Diversified |
$ | 74,811 | $ | 287,854 | $ | 145,898 | $ | 42,281 | |||||
| Frontier Dynamic |
— | 218,030 | — | 23,633 | |||||||||
| Frontier Long/Short Commodity |
2,056,185 | 259,232 | 1,660,433 | 1,083,458 | |||||||||
| Frontier Masters |
139,150 | 212,853 | 9,073 | 27,199 | |||||||||
| Balanced |
1,115,570 | 1,489,970 | 5,567,945 | 6,776,656 | |||||||||
| Campbell/Graham/Tiverton |
1,677,638 | 319,092 | 216,562 | 1,606,061 | |||||||||
| Currency |
120,235 | 110,991 | — | 236,328 | |||||||||
| Long Only Commodity |
38,594 | 15,413 | — | 50,304 | |||||||||
| Managed Futures Index |
56,805 | 14,694 | — | 31,533 | |||||||||
| Winton |
1,049,242 | 255,442 | (21,347 | ) | 1,249,973 | ||||||||
| Winton/Graham |
1,093,344 | 207,959 | 251,038 | 1,031,526 | |||||||||
The following table summarizes fees payable to the Managing Owner as of September 30, 2009.
| Series: |
Management Fee | Trading Fee | Incentive Fee | Service Fee | ||||||||
| Frontier Diversified |
$ | 17,273 | $ | 69,241 | $ | 85,313 | $ | 191 | ||||
| Frontier Dynamic |
— | 37,714 | — | — | ||||||||
| Frontier Long/Short Commodity |
162,510 | 17,909 | 309,053 | 50,917 | ||||||||
| Frontier Masters |
34,521 | 44,792 | — | 271 | ||||||||
| Balanced |
100,975 | 81,078 | 1,075,207 | 248,181 | ||||||||
| Campbell/Graham/Tiverton |
130,668 | 21,274 | 205,702 | 89,325 | ||||||||
| Currency |
7,787 | 6,981 | 2,171 | 9,686 | ||||||||
| Long Only Commodity |
4,562 | 1,771 | — | 4,807 | ||||||||
| Managed Futures Index |
7,232 | 1,777 | — | 2,132 | ||||||||
| Winton |
89,324 | 18,085 | — | 69,115 | ||||||||
| Winton/Graham |
108,377 | 16,368 | 256,842 | 35,200 | ||||||||
50
Table of Contents
The Frontier Fund
Notes to Financial Statements—(Continued)
As of September 30, 2009 (Unaudited)
With respect to the service fees, the initial service fee (for the first 12 months) relating to a sale of the Units is prepaid by the Managing Owner by each Series, and paid to the selling agents by the Managing Owner in the month following the sale. Since the Managing Owner is prepaying the initial service fee for the first year and is being reimbursed for such payment by the Series monthly in arrears based upon a corresponding percentage of NAV, it bears the risk of the downside and enjoys the benefit of the upside potential of any difference between the amount of the initial service fee prepaid by it and the amount of the reimbursement thereof which may result from variations in NAV over the following 12 months. For the nine months ended September 30, 2009, due to variations in NAVs, amounts paid or payable to the Managing Owner for the difference in monthly service fees from the prepaid initial service fees was $32,160 for the Balanced Series, $7,637 for the Campbell/Graham/Tiverton Series, $874 for the Managed Futures Index Series, $8,724 for the Winton Series, $$2,136 for the Diversified Series and $345 for the Masters Series. For the nine months ended September 30, 2009, amounts received or receivable from the Managing Owner for the difference in monthly service fees from prepaid initial service fees was $6,370 for the Winton/Graham Series, $3,880 from the Frontier Long/Short Commodity Series, $4,211 for the Currency Series, $7 for the Masters Series and $5,279 from the Long Only Commodity Series.
Aggregate interest income from all sources, including assets held at clearing brokers, up to 2% (annualized) is paid to the Managing Owner by the Balanced Series (Class 1 and Class 2 only), Campbell/Graham/Tiverton Series, Currency Series, Winton Series, and Winton/Graham Series. In addition, if interest rates fall below 0.75% (calculated daily based on each Series’ NAV), the Managing Owner will be paid the difference between the Trust’s annualized interest income allocated to the foregoing Series and 0.75%. For the Frontier Diversified Series, Frontier Dynamic Series, Frontier Long/Short Commodity Series, Frontier Masters Series, Balanced Series (Class 1a and Class 2a only), Long Only Commodity Series and Managed Futures Index Series, 20% of the total interest allocated to each Series is paid to the Managing Owner. During the nine months ended September 30, 2009, the Trust paid $7,959,941 of such interest income to the Managing Owner.
The Managing Owner pays to The Bornhoft Group Corporation, an affiliate of the Trust, a monthly fee of 0.25% (annualized) of the NAV of the Trust, for services in connection with the daily valuation of each Series and Class. The amount paid under this agreement was $1,275,479 for the nine months ended September 30, 2009. Additionally, The Bornhoft Group Corporation provides office space to the Managing Owner, prorates office expenses, and advances certain direct expenses on behalf of the Managing Owner. Under this agreement, the Managing Owner reimbursed The Bornhoft Group Corporation $340,784 for the nine months ended September 30, 2009.
Solon Capital, LLC, an affiliate of the Trust, provides product development and marketing services. For these services, the Managing Owner paid Solon Capital, LLC, $2,295,863 for the nine months ended September 30, 2009.
Equinox Distributors, Inc. (“EDI”), a wholly owned subsidiary of the Managing Owner, served as wholesaler of the Trust until the termination of the agreement to provide such wholesaling services on April 21, 2009. Its results are consolidated with the results of the Managing Owner. On April 21, 2009, Bornhoft Group Securities Corporation, an affiliate of the Managing Owner, entered into an agreement to provide wholesaling services to the Trust.
51
Table of Contents
The Frontier Fund
Notes to Financial Statements—(Continued)
As of September 30, 2009 (Unaudited)
7. Financial Highlights
The following information presents the financial highlights of the Fund for the three months ended September 30, 2009 and 2008. This data has been derived from information presented in the financial statements.
| Balanced | Winton | Campbell/Graham/Tiverton | ||||||||||||||||||||||||||||||||||
| Class 1 | Class 1a | Class 2 | Class 2a | Class 3a | Class 1 | Class 2 | Class 1 | Class 2 | ||||||||||||||||||||||||||||
| Per unit operating performance (1) |
||||||||||||||||||||||||||||||||||||
| Net asset value, June 30, 2009 |
$ | 121.06 | $ | 108.14 | $ | 139.84 | $ | 118.73 | $ | 118.74 | $ | 117.44 | $ | 128.00 | $ | 102.03 | $ | 116.29 | ||||||||||||||||||
| Net operating results: |
||||||||||||||||||||||||||||||||||||
| Interest income |
0.09 | 0.08 | 0.11 | 0.09 | 0.09 | 0.10 | 0.11 | 0.09 | 0.10 | |||||||||||||||||||||||||||
| Expenses |
(1.60 | ) | (1.43 | ) | (0.80 | ) | (0.68 | ) | (0.68 | ) | (1.64 | ) | (0.83 | ) | (1.90 | ) | (1.31 | ) | ||||||||||||||||||
| Net gain/(loss) on investments, net of non-controlling interests |
2.90 | 2.42 | 3.38 | 2.68 | 2.67 | 2.22 | 2.44 | 5.08 | 5.83 | |||||||||||||||||||||||||||
| Net income |
1.39 | 1.07 | 2.68 | 2.09 | 2.08 | 0.68 | 1.72 | 3.26 | 4.63 | |||||||||||||||||||||||||||
| Net asset value, September 30, 2009 |
$ | 122.45 | $ | 109.21 | $ | 142.52 | $ | 120.82 | $ | 120.82 | $ | 118.12 | $ | 129.72 | $ | 105.29 | $ | 120.92 | ||||||||||||||||||
| Ratios to average net assets (3) |
||||||||||||||||||||||||||||||||||||
| Net investment gain/(loss) |
-5.03 | % | -5.03 | % | -2.01 | % | -2.01 | % | -1.00 | % | -5.32 | % | -2.29 | % | -8.65 | % | -4.96 | % | ||||||||||||||||||
| Expenses before incentive fees |
3.72 | % | 3.72 | % | 0.69 | % | 0.69 | % | 0.34 | % | 5.67 | % | 2.63 | % | 7.76 | % | 4.07 | % | ||||||||||||||||||
| Expenses after incentive fees |
5.34 | % | 5.34 | % | 2.31 | % | 2.31 | % | 1.16 | % | 5.67 | % | 2.63 | % | 9.07 | % | 5.38 | % | ||||||||||||||||||
| Total return before incentive fees (2) |
1.53 | % | 1.35 | % | 2.28 | % | 2.14 | % | 2.93 | % | 0.55 | % | 1.31 | % | 4.17 | % | 5.05 | % | ||||||||||||||||||
| Total return after incentive fees (2) |
1.13 | % | 0.95 | % | 1.87 | % | 1.73 | % | 2.52 | % | 0.55 | % | 1.31 | % | 3.84 | % | 4.72 | % | ||||||||||||||||||
| Currency | Winton/Graham | Frontier Long/Short | ||||||||||||||||||||||||||||||||||
| Class 1 | Class 2 | Class 1 | Class 2 | Class 1 | Class 2 | Class 3 | Class 1a | Class 2a | ||||||||||||||||||||||||||||
| Per unit operating performance (1) |
||||||||||||||||||||||||||||||||||||
| Net asset value, June 30, 2009 |
$ | 87.78 | $ | 101.24 | $ | 106.45 | $ | 122.30 | $ | 109.18 | $ | 120.52 | $ | 120.51 | $ | 97.53 | $ | 97.64 | ||||||||||||||||||
| Net operating results: |
||||||||||||||||||||||||||||||||||||
| Interest income |
0.15 | 0.17 | 0.10 | 0.11 | 0.49 | 0.56 | 0.36 | 0.39 | 0.52 | |||||||||||||||||||||||||||
| Expenses |
(1.12 | ) | (0.56 | ) | (2.15 | ) | (1.55 | ) | (2.88 | ) | (2.35 | ) | (1.52 | ) | (2.31 | ) | (2.20 | ) | ||||||||||||||||||
| Net gain/(loss) on investments, net of non-controlling interests |
(2.94 | ) | (3.38 | ) | 6.55 | 7.58 | 3.43 | 3.85 | 3.23 | 2.96 | 3.13 | |||||||||||||||||||||||||
| Net income |
(3.91 | ) | (3.77 | ) | 4.49 | 6.14 | 1.04 | 2.06 | 2.07 | 1.04 | 1.45 | |||||||||||||||||||||||||
| Net asset value, September 30, 2009 |
$ | 83.87 | $ | 97.47 | $ | 110.94 | $ | 128.44 | $ | 110.22 | $ | 122.58 | $ | 122.58 | $ | 98.57 | $ | 99.09 | ||||||||||||||||||
| Ratios to average net assets (3) |
||||||||||||||||||||||||||||||||||||
| Net investment gain/(loss) |
-4.63 | % | -1.59 | % | -7.72 | % | -4.68 | % | -9.37 | % | -6.13 | % | -3.07 | % | -4.68 | % | -3.07 | % | ||||||||||||||||||
| Expenses before incentive fees |
5.33 | % | 2.30 | % | 6.40 | % | 3.37 | % | 8.70 | % | 5.47 | % | 2.73 | % | 4.35 | % | 2.73 | % | ||||||||||||||||||
| Expenses after incentive fees |
5.33 | % | 2.30 | % | 8.08 | % | 5.05 | % | 11.27 | % | 8.03 | % | 4.02 | % | 5.63 | % | 4.02 | % | ||||||||||||||||||
| Total return before incentive fees (2) |
-4.73 | % | -3.89 | % | 4.60 | % | 5.31 | % | 1.66 | % | 2.41 | % | 3.08 | % | 2.74 | % | 1.77 | % | ||||||||||||||||||
| Total return after incentive fees (2) |
-4.73 | % | -3.89 | % | 4.18 | % | 4.89 | % | 1.02 | % | 1.77 | % | 2.44 | % | 2.10 | % | 1.13 | % | ||||||||||||||||||
| Long Only | Managed Futures Index | Frontier Diversified | Frontier Dynamic | Frontier Masters | ||||||||||||||||||||||||||||||||||||
| Class 1 | Class 2 | Class 1 | Class 2 | Class 1 | Class 2 | Class 1 | Class 2 | Class 1 | Class 2 | |||||||||||||||||||||||||||||||
| Per unit operating performance (1) |
||||||||||||||||||||||||||||||||||||||||
| Net asset value, June 30, 2009 |
$ | 75.13 | $ | 80.35 | $ | 120.81 | $ | 128.89 | $ | 98.11 | $ | 98.21 | $ | 97.07 | $ | 97.18 | $ | 97.97 | $ | 98.08 | ||||||||||||||||||||
| Net operating results: |
||||||||||||||||||||||||||||||||||||||||
| Interest income |
0.33 | 0.38 | 0.52 | 0.56 | 2.94 | 2.94 | 59.35 | 59.60 | 6.56 | 6.58 | ||||||||||||||||||||||||||||||
| Expenses |
(0.71 | ) | (0.37 | ) | (1.34 | ) | (0.79 | ) | (8.14 | ) | (6.85 | ) | (94.51 | ) | (80.66 | ) | (16.86 | ) | (14.88 | ) | ||||||||||||||||||||
| Net gain/(loss) on investments, net of non-controlling interests |
2.73 | 2.75 | (2.26 | ) | (2.41 | ) | 6.04 | 5.20 | 34.65 | 20.97 | 10.65 | 9.09 | ||||||||||||||||||||||||||||
| Net income |
2.35 | 2.75 | (3.08 | ) | (2.65 | ) | 0.84 | 1.29 | (0.51 | ) | (0.09 | ) | 0.35 | 0.79 | ||||||||||||||||||||||||||
| Net asset value, September 30, 2009 |
$ | 77.48 | $ | 83.10 | $ | 117.73 | $ | 126.24 | $ | 98.95 | $ | 99.50 | $ | 96.56 | $ | 97.09 | $ | 98.32 | $ | 98.87 | ||||||||||||||||||||
| Ratios to average net assets (3) |
||||||||||||||||||||||||||||||||||||||||
| Net investment gain/(loss) |
-1.43 | % | 0.00 | % | -2.77 | % | -0.74 | % | -10.58 | % | -7.92 | % | -72.54 | % | -43.26 | % | -21.12 | % | -16.95 | % | ||||||||||||||||||||
| Expenses before incentive fees |
2.65 | % | 1.22 | % | 4.51 | % | 2.49 | % | 12.98 | % | 10.32 | % | 194.96 | % | 165.68 | % | 34.57 | % | 30.40 | % | ||||||||||||||||||||
| Expenses after incentive fees |
2.65 | % | 1.22 | % | 4.51 | % | 2.49 | % | 16.55 | % | 13.89 | % | 194.96 | % | 165.68 | % | 34.57 | % | 30.40 | % | ||||||||||||||||||||
| Total return before incentive fees (2) |
2.22 | % | 2.23 | % | -2.55 | % | -2.08 | % | 4.12 | % | 4.53 | % | -0.72 | % | -1.13 | % | 3.93 | % | 5.00 | % | ||||||||||||||||||||
| Total return after incentive fees (2) |
2.22 | % | 2.23 | % | -2.55 | % | -2.08 | % | 2.34 | % | 2.75 | % | -0.72 | % | -1.13 | % | 3.93 | % | 5.00 | % | ||||||||||||||||||||
| (1) | Interest income and expenses per unit are calculated by dividing these amounts by the weighted average number of units outstanding during the period. The net gain/(loss) on investments, net of non-controlling interests is a balancing amount necessary to reconcile the change in net asset value per unit with the other per unit information. |
| (2) | Computed using weighted average net assets outstanding during the period. An owner’s total returns may vary from the above returns based on the timing of contributions and withdrawals. Total returns are not annualized. |
| (3) | Annualized |
52
Table of Contents
The Frontier Fund
Notes to Financial Statements—(Continued)
As of September 30, 2009 (Unaudited)
Three Months Ended September 30, 2008
| Balanced | Winton | |||||||||||||||||||||||
| Class 1 | Class 1a | Class 2 | Class 2a | Class 1 | Class 2 | |||||||||||||||||||
| Per unit operating performance (1) |
||||||||||||||||||||||||
| Net asset value, June 30, 2008 |
$ | 115.47 | $ | 103.39 | $ | 129.43 | $ | 110.21 | $ | 127.68 | $ | 135.04 | ||||||||||||
| Net operating results: |
||||||||||||||||||||||||
| Interest income |
0.08 | 0.07 | 0.09 | 0.08 | 0.09 | 0.10 | ||||||||||||||||||
| Expenses |
(1.66 | ) | (1.48 | ) | (0.90 | ) | (0.77 | ) | (1.68 | ) | (0.82 | ) | ||||||||||||
| Net gain/(loss) on investments, net of non-controlling interests |
(0.85 | ) | (0.80 | ) | (0.96 | ) | (0.85 | ) | (8.31 | ) | (8.80 | ) | ||||||||||||
| Net income |
(2.43 | ) | (2.21 | ) | (1.77 | ) | (1.54 | ) | (9.90 | ) | (9.52 | ) | ||||||||||||
| Net asset value, September 30, 2008 |
$ | 113.04 | $ | 101.18 | $ | 127.66 | $ | 108.67 | $ | 117.78 | $ | 125.52 | ||||||||||||
| Ratios to average net assets (3) |
||||||||||||||||||||||||
| Net investment gain/(loss) |
-5.52 | % | -5.52 | % | -2.52 | % | -2.52 | % | -5.22 | % | -2.21 | % | ||||||||||||
| Expenses before incentive fees |
4.15 | % | 4.15 | % | 1.15 | % | 1.15 | % | 5.14 | % | 2.14 | % | ||||||||||||
| Expenses after incentive fees |
5.81 | % | 5.81 | % | 2.81 | % | 2.81 | % | 5.52 | % | 2.52 | % | ||||||||||||
| Total return before incentive fees (2) |
-1.66 | % | -1.71 | % | -0.90 | % | -0.82 | % | -8.09 | % | -7.32 | % | ||||||||||||
| Total return after incentive fees (2) |
-2.08 | % | -2.13 | % | -1.31 | % | -1.24 | % | -8.19 | % | -7.42 | % | ||||||||||||
| Campbell/Graham/Tiverton | Currency | Winton/Graham | ||||||||||||||||||||||
| Class 1 | Class 2 | Class 1 | Class 2 | Class 1 | Class 2 | |||||||||||||||||||
| Per unit operating performance (1) |
||||||||||||||||||||||||
| Net asset value, June 30, 2008 |
$ | 100.37 | $ | 111.07 | $ | 103.92 | $ | 116.31 | $ | 111.88 | $ | 124.72 | ||||||||||||
| Net operating results: |
||||||||||||||||||||||||
| Interest income |
0.08 | 0.08 | 0.10 | 0.12 | 0.07 | 0.08 | ||||||||||||||||||
| Expenses |
(1.85 | ) | (1.23 | ) | (1.31 | ) | (0.60 | ) | (1.54 | ) | (0.82 | ) | ||||||||||||
| Net gain/(loss) on investments, net of non-controlling interests |
(1.13 | ) | (1.24 | ) | (7.01 | ) | (7.89 | ) | (6.12 | ) | (6.83 | ) | ||||||||||||
| Net income |
(2.91 | ) | (2.39 | ) | (8.21 | ) | (8.37 | ) | (7.58 | ) | (7.57 | ) | ||||||||||||
| Net asset value, September 30, 2008 |
$ | 97.46 | $ | 108.68 | $ | 95.71 | $ | 107.94 | $ | 104.30 | $ | 117.15 | ||||||||||||
| Ratios to average net assets (3) |
||||||||||||||||||||||||
| Net investment gain/(loss) |
-7.19 | % | -4.19 | % | -4.66 | % | -1.66 | % | -5.45 | % | -2.46 | % | ||||||||||||
| Expenses before incentive fees |
6.76 | % | 3.76 | % | 5.06 | % | 2.06 | % | 5.79 | % | 2.80 | % | ||||||||||||
| Expenses after incentive fees |
7.49 | % | 4.49 | % | 5.06 | % | 2.06 | % | 5.73 | % | 2.74 | % | ||||||||||||
| Total return before incentive fees (2) |
-2.80 | % | -1.90 | % | -8.20 | % | -9.80 | % | -6.65 | % | -5.25 | % | ||||||||||||
| Total return after incentive fees (2) |
-2.99 | % | -2.09 | % | -8.20 | % | -9.80 | % | -6.63 | % | -5.24 | % | ||||||||||||
| Long Only | Long/Short | Managed Futures Index | ||||||||||||||||||||||
| Class 1 | Class 2 | Class 1 | Class 2 | Class 1 | Class 2 | |||||||||||||||||||
| Per unit operating performance (1) |
||||||||||||||||||||||||
| Net asset value, June 30, 2008 |
$ | 143.47 | $ | 150.46 | $ | 112.56 | $ | 120.69 | $ | 110.12 | $ | 115.46 | ||||||||||||
| Net operating results: |
||||||||||||||||||||||||
| Interest income |
0.55 | 0.57 | 0.47 | 0.51 | 0.47 | 0.49 | ||||||||||||||||||
| Expenses |
(1.15 | ) | (0.55 | ) | (2.28 | ) | (1.58 | ) | (1.15 | ) | (0.65 | ) | ||||||||||||
| Net gain/(loss) on investments, net of non-controlling interests |
(34.52 | ) | (36.27 | ) | (6.36 | ) | (6.84 | ) | (6.68 | ) | (7.09 | ) | ||||||||||||
| Net income |
(35.13 | ) | (36.25 | ) | (8.17 | ) | (7.91 | ) | (7.36 | ) | (7.25 | ) | ||||||||||||
| Net asset value, September 30, 2008 |
$ | 108.34 | $ | 114.21 | $ | 104.39 | $ | 112.78 | $ | 102.76 | $ | 108.21 | ||||||||||||
| Ratios to average net assets (3) |
||||||||||||||||||||||||
| Net investment gain/(loss) |
-1.93 | % | 0.06 | % | -6.66 | % | -3.67 | % | -2.55 | % | -0.55 | % | ||||||||||||
| Expenses before incentive fees |
3.68 | % | 1.69 | % | 6.98 | % | 3.98 | % | 4.31 | % | 2.31 | % | ||||||||||||
| Expenses after incentive fees |
3.68 | % | 1.69 | % | 8.41 | % | 5.42 | % | 4.31 | % | 2.31 | % | ||||||||||||
| Total return before incentive fees (2) |
-27.99 | % | -28.06 | % | -7.13 | % | -5.91 | % | -5.89 | % | -7.00 | % | ||||||||||||
| Total return after incentive fees (2) |
-27.99 | % | -28.06 | % | -7.49 | % | -6.27 | % | -5.89 | % | -7.00 | % | ||||||||||||
| (1) | Interest income and expenses per unit are calculated by dividing these amounts by the weighted average number of units outstanding during the period. The net gain/(loss) on investments, net of non-controlling interests is a balancing amount necessary to reconcile the change in net asset value per unit with the other per unit information. |
| (2) | Computed using weighted average net assets outstanding during the period. An owner’s total returns may vary from the above returns based on the timing of contributions and withdrawals. Total returns are not annualized. |
| (3) | Annualized |
53
Table of Contents
The Frontier Fund
Notes to Financial Statements—(Continued)
As of September 30, 2009 (Unaudited)
The following information presents the financial highlights of the Fund for the nine months ended September 30, 2009 and 2008. This data has been derived from information presented in the financial statements.
| Balanced | Winton | Campbell/Graham/Tiverton | ||||||||||||||||||||||||||||||||||
| Class 1 | Class 1a | Class 2 | Class 2a | Class 3a | Class 1 | Class 2 | Class 1 | Class 2 | ||||||||||||||||||||||||||||
| Per unit operating performance (1) |
||||||||||||||||||||||||||||||||||||
| Net asset value, December 31, 2008 or beginning of operations |
$ | 125.17 | $ | 112.09 | $ | 142.44 | $ | 121.30 | $ | 121.97 | $ | 130.41 | $ | 140.04 | $ | 110.54 | $ | 124.14 | ||||||||||||||||||
| Net operating results: |
||||||||||||||||||||||||||||||||||||
| Interest income |
0.23 | 0.20 | 0.26 | 0.22 | 0.22 | 0.54 | 0.59 | 0.35 | 0.39 | |||||||||||||||||||||||||||
| Expenses |
(5.36 | ) | (4.79 | ) | (2.99 | ) | (2.54 | ) | (2.51 | ) | (5.09 | ) | (2.55 | ) | (5.24 | ) | (3.26 | ) | ||||||||||||||||||
| Net gain/(loss) on investments, net of non-controlling interests |
2.41 | 1.71 | 2.82 | 1.84 | 1.14 | (7.74 | ) | (8.36 | ) | (0.36 | ) | (0.36 | ) | |||||||||||||||||||||||
| Net income |
(2.72 | ) | (2.88 | ) | 0.08 | (0.48 | ) | (1.15 | ) | (12.29 | ) | (10.32 | ) | (5.25 | ) | (3.22 | ) | |||||||||||||||||||
| Net asset value, September 30, 2009 |
$ | 122.45 | $ | 109.21 | $ | 142.52 | $ | 120.82 | $ | 120.82 | $ | 118.12 | $ | 129.72 | $ | 105.29 | $ | 120.92 | ||||||||||||||||||
| Ratios to average net assets (3) |
||||||||||||||||||||||||||||||||||||
| Net investment gain/(loss) |
-5.58 | % | -5.58 | % | -2.58 | % | -2.58 | % | -5.88 | % | -4.98 | % | -1.98 | % | -6.96 | % | -3.59 | % | ||||||||||||||||||
| Expenses before incentive fees |
3.90 | % | 3.90 | % | 0.90 | % | 0.90 | % | 2.05 | % | 5.61 | % | 2.61 | % | 7.05 | % | 3.68 | % | ||||||||||||||||||
| Expenses after incentive fees |
5.83 | % | 5.83 | % | 2.83 | % | 2.83 | % | 6.43 | % | 5.57 | % | 2.57 | % | 7.45 | % | 4.08 | % | ||||||||||||||||||
| Total return before incentive fees (2) |
-0.94 | % | -1.41 | % | 1.28 | % | 0.80 | % | 2.21 | % | -10.23 | % | -7.90 | % | -5.23 | % | -2.56 | % | ||||||||||||||||||
| Total return after incentive fees (2) |
-2.38 | % | -2.85 | % | -0.16 | % | -0.65 | % | 0.77 | % | -10.19 | % | -7.86 | % | -5.53 | % | -2.86 | % | ||||||||||||||||||
| Currency | Winton/Graham | Frontier Long/Short | ||||||||||||||||||||||||||||||||||
| Class 1 | Class 2 | Class 1 | Class 2 | Class 1 | Class 2 | Class 3 | Class 1a | Class 2a | ||||||||||||||||||||||||||||
| Per unit operating performance (1) |
||||||||||||||||||||||||||||||||||||
| Net asset value, December 31, 2008 or beginning of operations |
$ | 96.19 | $ | 109.30 | $ | 116.18 | $ | 131.49 | $ | 100.39 | $ | 109.28 | $ | 122.70 | $ | 100.00 | $ | 100.00 | ||||||||||||||||||
| Net operating results: |
||||||||||||||||||||||||||||||||||||
| Interest income |
0.38 | 0.44 | 0.37 | 0.42 | 1.52 | 1.71 | 1.12 | 1.21 | 1.62 | |||||||||||||||||||||||||||
| Expenses |
(3.55 | ) | (1.78 | ) | (5.33 | ) | (3.30 | ) | (8.85 | ) | (7.27 | ) | (4.75 | ) | (7.05 | ) | (6.86 | ) | ||||||||||||||||||
| Net gain/(loss) on investments, net of non-controlling interests |
(9.15 | ) | (10.48 | ) | (0.28 | ) | (0.18 | ) | 17.15 | 18.85 | 3.51 | 4.41 | 4.33 | |||||||||||||||||||||||
| Net income |
(12.32 | ) | (11.83 | ) | (5.24 | ) | (3.05 | ) | 9.83 | 13.30 | (0.12 | ) | (1.43 | ) | (0.91 | ) | ||||||||||||||||||||
| Net asset value, September 30, 2009 |
$ | 83.87 | $ | 97.47 | $ | 110.94 | $ | 128.44 | $ | 110.22 | $ | 122.58 | $ | 122.58 | $ | 98.57 | $ | 99.09 | ||||||||||||||||||
| Ratios to average net assets (3) |
||||||||||||||||||||||||||||||||||||
| Net investment gain/(loss) |
-4.77 | % | -1.77 | % | -6.03 | % | -3.04 | % | -9.48 | % | -6.39 | % | -14.53 | % | -9.48 | % | -6.39 | % | ||||||||||||||||||
| Expenses before incentive fees |
5.34 | % | 2.34 | % | 5.92 | % | 2.92 | % | 7.96 | % | 4.87 | % | 11.07 | % | 7.96 | % | 4.87 | % | ||||||||||||||||||
| Expenses after incentive fees |
5.34 | % | 2.34 | % | 6.48 | % | 3.48 | % | 11.45 | % | 8.36 | % | 19.01 | % | 11.45 | % | 8.36 | % | ||||||||||||||||||
| Total return before incentive fees (2) |
-14.01 | % | -11.62 | % | -4.01 | % | -2.36 | % | 12.67 | % | 13.95 | % | 1.70 | % | 4.38 | % | 3.29 | % | ||||||||||||||||||
| Total return after incentive fees (2) |
-14.01 | % | -11.62 | % | -4.43 | % | -2.78 | % | 10.06 | % | 11.34 | % | -0.91 | % | 1.77 | % | 0.68 | % | ||||||||||||||||||
| Long Only | Managed Futures Index | Frontier Diversified | Frontier Dynamic | Frontier Masters | ||||||||||||||||||||||||||||||||||||
| Class 1 | Class 2 | Class 1 | Class 2 | Class 1 | Class 2 | Class 1 | Class 2 | Class 1 | Class 2 | |||||||||||||||||||||||||||||||
| Per unit operating performance (1) |
||||||||||||||||||||||||||||||||||||||||
| Net asset value, December 31, 2008 or beginning of operations |
$ | 70.31 | $ | 74.46 | $ | 132.18 | $ | 139.70 | $ | 100.00 | $ | 100.00 | $ | 100.00 | $ | 100.00 | $ | 100.00 | $ | 100.00 | ||||||||||||||||||||
| Net operating results: |
||||||||||||||||||||||||||||||||||||||||
| Interest income |
0.93 | 1.05 | 1.55 | 1.64 | 4.41 | 4.42 | 153.15 | 134.74 | 22.70 | 22.42 | ||||||||||||||||||||||||||||||
| Expenses |
(1.97 | ) | (1.02 | ) | (4.01 | ) | (2.30 | ) | (12.59 | ) | (10.76 | ) | (245.77 | ) | (183.58 | ) | (59.55 | ) | (52.09 | ) | ||||||||||||||||||||
| Net gain/(loss) on investments, net of non-controlling interests |
8.21 | 8.61 | (11.99 | ) | (12.81 | ) | 7.14 | 5.84 | 89.19 | 45.93 | 35.17 | 28.54 | ||||||||||||||||||||||||||||
| Net income |
7.17 | 8.64 | (14.45 | ) | (13.46 | ) | (1.05 | ) | (0.50 | ) | (3.44 | ) | (2.91 | ) | (1.68 | ) | (1.13 | ) | ||||||||||||||||||||||
| Net asset value, September 30, 2009 |
$ | 77.48 | $ | 83.10 | $ | 117.73 | $ | 126.24 | $ | 98.95 | $ | 99.50 | $ | 96.56 | $ | 97.09 | $ | 98.32 | $ | 98.87 | ||||||||||||||||||||
| Ratios to average net assets (3) |
||||||||||||||||||||||||||||||||||||||||
| Net investment gain/(loss) |
-1.48 | % | 0.04 | % | -2.67 | % | -0.67 | % | -26.57 | % | -20.53 | % | -171.22 | % | -102.60 | % | -52.92 | % | -43.14 | % | ||||||||||||||||||||
| Expenses before incentive fees |
2.80 | % | 1.29 | % | 4.37 | % | 2.36 | % | 30.88 | % | 24.84 | % | 454.30 | % | 385.68 | % | 83.62 | % | 73.84 | % | ||||||||||||||||||||
| Expenses after incentive fees |
2.80 | % | 1.29 | % | 4.37 | % | 2.36 | % | 40.87 | % | 34.83 | % | 454.30 | % | 385.68 | % | 85.52 | % | 75.74 | % | ||||||||||||||||||||
| Total return before incentive fees (2) |
7.80 | % | 8.36 | % | -11.11 | % | -8.29 | % | 6.02 | % | 6.53 | % | -1.58 | % | -2.40 | % | 5.42 | % | 6.70 | % | ||||||||||||||||||||
| Total return after incentive fees (2) |
7.80 | % | 8.36 | % | -11.11 | % | -8.29 | % | 2.90 | % | 3.41 | % | -1.58 | % | -2.40 | % | 4.82 | % | 6.11 | % | ||||||||||||||||||||
| (1) | Interest income and expenses per unit are calculated by dividing these amounts by the weighted average number of units outstanding during the period. The net gain/(loss) on investments, net of non-controlling interests is a balancing amount necessary to reconcile the change in net asset value per unit with the other per unit information. |
| (2) | Computed using weighted average net assets outstanding during the period. An owner’s total returns may vary from the above returns based on the timing of contributions and withdrawals. Total returns are not annualized. |
| (3) | Annualized |
54
Table of Contents
The Frontier Fund
Notes to Financial Statements—(Continued)
As of September 30, 2009 (Unaudited)
Nine Months Ended September 30, 2008
| Balanced | Winton | |||||||||||||||||||||||
| Class 1 | Class 1a | Class 2 | Class 2a | Class 1 | Class 2 | |||||||||||||||||||
| Per unit operating performance (1) |
||||||||||||||||||||||||
| Net asset value, December 31, 2007 |
$ | 101.46 | $ | 90.90 | $ | 112.00 | $ | 95.47 | $ | 113.83 | $ | 118.61 | ||||||||||||
| Net operating results: |
||||||||||||||||||||||||
| Interest income |
0.43 | 0.39 | 0.48 | 0.41 | 0.45 | 0.47 | ||||||||||||||||||
| Expenses |
(7.19 | ) | (6.43 | ) | (5.28 | ) | (4.51 | ) | (8.04 | ) | (5.57 | ) | ||||||||||||
| Net gain/(loss) on investments, net of non-controlling interests |
18.34 | 16.32 | 20.46 | 17.30 | 11.54 | 12.01 | ||||||||||||||||||
| Net income |
11.58 | 10.28 | 15.66 | 13.20 | 3.95 | 6.91 | ||||||||||||||||||
| Net asset value, September 30, 2008 |
$ | 113.04 | $ | 101.18 | $ | 127.66 | $ | 108.67 | $ | 117.78 | $ | 125.52 | ||||||||||||
| Ratios to average net assets (3) |
||||||||||||||||||||||||
| Net investment gain/(loss) |
-8.28 | % | -8.28 | % | -5.26 | % | -5.26 | % | -8.31 | % | -5.31 | % | ||||||||||||
| Expenses before incentive fees |
4.33 | % | 4.33 | % | 1.31 | % | 1.31 | % | 5.07 | % | 2.07 | % | ||||||||||||
| Expenses after incentive fees |
8.81 | % | 8.81 | % | 5.79 | % | 5.79 | % | 8.80 | % | 5.80 | % | ||||||||||||
| Total return before incentive fees (2) |
13.97 | % | 13.72 | % | 16.36 | % | 14.51 | % | 3.56 | % | 8.32 | % | ||||||||||||
| Total return after incentive fees (2) |
10.62 | % | 10.37 | % | 13.00 | % | 11.16 | % | 0.77 | % | 5.53 | % | ||||||||||||
| Campbell/Graham/Tiverton | Currency | Winton/Graham | ||||||||||||||||||||||
| Class 1 | Class 2 | Class 1 | Class 2 | Class 1 | Class 2 | |||||||||||||||||||
| Per unit operating performance (1) |
||||||||||||||||||||||||
| Net asset value, December 31, 2007 |
$ | 91.90 | $ | 100.20 | $ | 100.66 | $ | 111.00 | $ | 95.04 | $ | 104.37 | ||||||||||||
| Net operating results: |
||||||||||||||||||||||||
| Interest income |
0.36 | 0.39 | 0.55 | 0.61 | 0.29 | 0.33 | ||||||||||||||||||
| Expenses |
(6.33 | ) | (4.59 | ) | (4.01 | ) | (1.89 | ) | (7.34 | ) | (5.58 | ) | ||||||||||||
| Net gain/(loss) on investments, net of non-controlling interests |
11.53 | 12.68 | (1.49 | ) | (1.79 | ) | 16.31 | 18.04 | ||||||||||||||||
| Net income |
5.56 | 8.48 | (4.95 | ) | (3.06 | ) | 9.26 | 12.78 | ||||||||||||||||
| Net asset value, September 30, 2008 |
$ | 97.46 | $ | 108.68 | $ | 95.71 | $ | 107.94 | $ | 104.30 | $ | 117.15 | ||||||||||||
| Ratios to average net assets (3) |
||||||||||||||||||||||||
| Net investment gain/(loss) |
-8.31 | % | -5.30 | % | -4.50 | % | -1.48 | % | -8.93 | % | -5.98 | % | ||||||||||||
| Expenses before incentive fees |
6.38 | % | 3.36 | % | 5.21 | % | 2.20 | % | 5.69 | % | 2.74 | % | ||||||||||||
| Expenses after incentive fees |
8.81 | % | 5.80 | % | 5.21 | % | 2.20 | % | 9.30 | % | 6.35 | % | ||||||||||||
| Total return before incentive fees (2) |
7.56 | % | 9.80 | % | -6.04 | % | -13.94 | % | 3.26 | % | 2.24 | % | ||||||||||||
| Total return after incentive fees (2) |
5.74 | % | 7.98 | % | -6.04 | % | -13.94 | % | 0.56 | % | -0.46 | % | ||||||||||||
| Long Only | Long/Short | Managed Futures Index | ||||||||||||||||||||||
| Class 1 | Class 2 | Class 1 | Class 2 | Class 1 | Class 2 | |||||||||||||||||||
| Per unit operating performance (1) |
||||||||||||||||||||||||
| Net asset value, December 31, 2007 |
$ | 110.79 | $ | 115.04 | $ | 101.47 | $ | 107.19 | $ | 100.59 | $ | 104.42 | ||||||||||||
| Net operating results: |
||||||||||||||||||||||||
| Interest income |
1.76 | 1.82 | 1.51 | 1.62 | 1.45 | 1.52 | ||||||||||||||||||
| Expenses |
(3.54 | ) | (1.71 | ) | (8.62 | ) | (6.60 | ) | (3.48 | ) | (1.96 | ) | ||||||||||||
| Net gain/(loss) on investments, net of non-controlling interests |
(0.67 | ) | (0.94 | ) | 10.02 | 10.57 | 4.20 | 4.23 | ||||||||||||||||
| Net income |
(2.45 | ) | (0.83 | ) | 2.92 | 5.59 | 2.17 | 3.79 | ||||||||||||||||
| Net asset value, September 30, 2008 |
$ | 108.34 | $ | 114.21 | $ | 104.39 | $ | 112.78 | $ | 102.76 | $ | 108.21 | ||||||||||||
| Ratios to average net assets (3) |
||||||||||||||||||||||||
| Net investment gain/(loss) |
-1.89 | % | 0.11 | % | -8.76 | % | -5.75 | % | -2.53 | % | -0.52 | % | ||||||||||||
| Expenses before incentive fees |
3.77 | % | 1.76 | % | 6.63 | % | 3.62 | % | 4.33 | % | 2.33 | % | ||||||||||||
| Expenses after incentive fees |
3.77 | % | 1.76 | % | 10.62 | % | 7.62 | % | 4.33 | % | 2.33 | % | ||||||||||||
| Total return before incentive fees (2) |
-4.23 | % | -30.58 | % | 2.99 | % | 2.21 | % | -1.60 | % | -0.45 | % | ||||||||||||
| Total return after incentive fees (2) |
-4.23 | % | -30.58 | % | 0.00 | % | -0.78 | % | -1.60 | % | -0.45 | % | ||||||||||||
| (1) | Interest income and expenses per unit are calculated by dividing these amounts by the weighted average number of units outstanding during the period. The net gain/(loss) on investments, net of non-controlling interests is a balancing amount necessary to reconcile the change in net asset value per unit with the other per unit information. |
| (2) | Computed using weighted average net assets outstanding during the period. An owner’s total returns may vary from the above returns based on the timing of contributions and withdrawals. Total returns are not annualized. |
| (3) | Annualized |
8. Derivative Instruments and Hedging Activities
The Trust’s primary business is to engage in the speculative trading of a diversified portfolio of futures, forwards (including interbank foreign currencies), options contracts and other derivative instruments (including swap contracts). It does not enter into or hold positions for hedging purposes as defined under ASC 815. The detail of the fair
55
Table of Contents
The Frontier Fund
Notes to Financial Statements—(Continued)
As of September 30, 2009 (Unaudited)
value of the Trust’s derivatives by instrument type as of September 30, 2009 and December 31, 2008 is included in the Condensed Schedules of Investments. See note 4 for further disclosure related to the Trust’s positions in swap contracts.
For the nine months ended September 30, 2009, the monthly average of futures contracts bought for the Trust was approximately 118,700 and sold for the Trust was approximately 114,800. The following table summarizes the trading revenue for the three months and nine months ended September 30, 2009 approximately by sector:
Realized Trading Revenue from Futures and Forwards and Options
for the Three Months Ended September 30, 2009 (1)
| Type of contract |
Frontier Long/Short Series |
Balanced Series | Currency Series | Winton/Graham Series |
||||||||||||
| Metals |
$ | 3,712,916 | $ | 412,579 | $ | — | $ | 557,289 | ||||||||
| Currencies |
271,636 | (171,014 | ) | (103,475 | ) | (367,998 | ) | |||||||||
| Energies |
46,822,429 | (680,213 | ) | — | (968,939 | ) | ||||||||||
| Agriculturals |
2,183,737 | (174,313 | ) | — | 425,314 | |||||||||||
| Interest rates |
(141,718 | ) | (1,271,066 | ) | — | (1,479,451 | ) | |||||||||
| Stock indices |
457,171 | 1,710,455 | — | 5,976,507 | ||||||||||||
| Realized trading income/(loss)(2) |
$ | 53,306,171 | $ | (173,572 | ) | $ | (103,475 | ) | $ | 4,142,722 | ||||||
56
Table of Contents
The Frontier Fund
Notes to Financial Statements—(Continued)
As of September 30, 2009 (Unaudited)
Realized Trading Revenue from Futures and Forwards and Options
for the Nine Months Ended September 30, 2009 (1)
| Type of contract |
Frontier Dynamic Series |
Frontier Long/Short Series |
Balanced Series | Campbell/Graham/ Tiverton Series |
||||||||||
| Metals |
— | $ | 14,703,688 | $ | (15,145,761 | ) | $ | (523,662 | ) | |||||
| Currencies |
$ | 15 | 1,327,231 | 5,263,619 | 1,073,618 | |||||||||
| Energies |
— | 17,716,577 | (15,384,679 | ) | (185,872 | ) | ||||||||
| Agriculturals |
— | 5,083,309 | 10,551,983 | (1,331,375 | ) | |||||||||
| Interest rates |
— | 269,751 | (27,683,526 | ) | (249,380 | ) | ||||||||
| Stock indices |
— | 2,522,627 | 50,231,587 | (400,807 | ) | |||||||||
| Realized trading income/(loss)(2) |
$ | 15 | $ | 41,623,183 | $ | 7,833,223 | $ | (1,617,478 | ) | |||||
| Type of contract |
Currency Series | Winton Series | Winton/Graham Series |
|||||||||
| Metals |
— | $ | (349,440 | ) | $ | 336,567 | ||||||
| Currencies |
(190,562 | ) | (2,603,191 | ) | 446,430 | |||||||
| Energies |
— | (447,390 | ) | (1,592,428 | ) | |||||||
| Agriculturals |
— | (12,665 | ) | (599,144 | ) | |||||||
| Interest rates |
— | (558,286 | ) | (2,399,818 | ) | |||||||
| Stock indices |
— | (714,027 | ) | 8,400,708 | ||||||||
| Realized trading income/(loss)(2) |
$ | (190,562 | ) | $ | (4,684,999 | ) | $ | 4,592,315 | ||||
| (1) | The Frontier Diversified Series, Frontier Masters Series and Managed Futures Index Series participate in trading activities through equity in earnings/(loss) from trading companies. The Long Only Commodity Series participates in trading activities through realized gain/(loss) on swap contracts. Campbell/Graham/Tiverton Series deconsolidated Frontier Trading Company V LLC as of April 23, 2009, and thereafter participates in trading activities through equity in earnings/(loss) from trading companies. Winton Series deconsolidated Frontier Trading Company II LLC as of May 28, 2009, and thereafter participates in trading activities through equity in earnings/(loss) from Frontier Trading Company II LLC. |
| (2) | In the Statements of Operations under Net realized gain/(loss) on futures and forwards. |
57
Table of Contents
The Frontier Fund
Notes to Financial Statements—(Continued)
As of September 30, 2009 (Unaudited)
Net Change in Open Trade Equity from Futures and Forwards and Options
for the Three Months Ended September 30, 2009 (1)
| Type of contract |
Frontier Long/Short Series |
Balanced Series | Currency Series | Winton/Graham Series |
|||||||||||
| Metals |
$ | (2,321,541 | ) | $ | 5,088,525 | — | $ | 39,998 | |||||||
| Currencies |
124,871 | 1,396,165 | 32,902 | 1,337,836 | |||||||||||
| Energies |
(46,210,400 | ) | (438,636 | ) | — | (51,500 | ) | ||||||||
| Agriculturals |
(3,205,966 | ) | 2,452,611 | — | 423,249 | ||||||||||
| Interest rates |
(51,203 | ) | 3,137,589 | — | 490,810 | ||||||||||
| Stock indices |
504,104 | (141,171 | ) | — | (253,042 | ) | |||||||||
| Unrealized trading income/(loss)(2) |
$ | (51,160,135 | ) | $ | 11,495,083 | $ | 32,902 | $ | 1,987,351 | ||||||
Net Change in Open Trade Equity from Futures and Forwards
for the Nine Months Ended September 30, 2009 (1)
| Type of contract |
Frontier Long/Short Series |
Balanced Series | Campbell/Graham/ Tiverton Series |
|||||||||
| Metals |
$ | (15,266,759 | ) | $ | (1,313,660 | ) | $ | 86,477 | ||||
| Currencies |
(141,274 | ) | (2,502,114 | ) | (970,417 | ) | ||||||
| Energies |
(4,420,641 | ) | (364,540 | ) | 121,454 | |||||||
| Agriculturals |
(1,321,448 | ) | 1,497,641 | (150,188 | ) | |||||||
| Interest rates |
117,652 | 344,151 | 246,961 | |||||||||
| Stock indices |
385,273 | 757,903 | (94,518 | ) | ||||||||
| Unrealized trading income/(loss)(2) |
$ | (20,647,197 | ) | $ | (1,580,619 | ) | $ | (760,231 | ) | |||
| Type of contract |
Currency Series | Winton Series | Winton/Graham Series |
|||||||||
| Metals |
— | $ | (2,294,483 | ) | $ | (16,595 | ) | |||||
| Currencies |
7,757 | 1,977,629 | 1,780,673 | |||||||||
| Energies |
— | (60,860 | ) | (119,397 | ) | |||||||
| Agriculturals |
— | 1,048,578 | 468,525 | |||||||||
| Interest rates |
— | (4,484,327 | ) | 288,675 | ||||||||
| Stock indices |
— | 204,656 | (168,665 | ) | ||||||||
| Unrealized trading income/(loss)(2) |
$ | 7,757 | $ | (3,608,807 | ) | $ | 2,233,216 | |||||
| (1) | The Frontier Diversified Series, Frontier Masters Series and Managed Futures Index Series participate in trading activities through equity in earnings/(loss) from trading companies. The Long Only Commodity Series participates in trading activities through realized gain/(loss) on swap contracts. Campbell/Graham/Tiverton Series deconsolidated Frontier Trading Company V LLC as of April 23, 2009, and thereafter participates in trading activities through equity in earnings/(loss) from trading companies. Winton Series deconsolidated Frontier Trading Company II LLC as of May 28, 2009, and thereafter participates in trading activities through equity in earnings/(loss) from Frontier Trading Company II LLC. |
| (2) | In the Statements of Operations under Net change in open trade equity. |
58
Table of Contents
The Frontier Fund
Notes to Financial Statements—(Continued)
As of September 30, 2009 (Unaudited)
9. Trading Activities and Related Risks
The purchase and sale of futures and options on futures contracts require margin deposits with Futures Commission Merchants (each, an “FCM”). Additional deposits may be necessary for any loss on contract value. The Commodity Exchange Act requires an FCM to segregate all customer transactions and assets from the FCM’s proprietary activities. A customer’s cash and other property (for example, U.S. Treasury bills) deposited with an FCM are considered commingled with all other customer funds subject to the FCM’s segregation requirements. In the event of an FCM’s insolvency, recovery may be limited to a pro rata share of segregated funds available. It is possible that the recovered amount could be less than the total of cash and other property deposited.
The term “off-balance sheet risk” refers to an unrecorded potential liability that, even though it does not appear on the Statement of Financial Condition, may result in future obligation or loss in excess of the amount paid by the Series for a particular investment. Each Trading Company expects to trade in futures, options, forward and swap contracts and will therefore be a party to financial instruments with elements of off-balance sheet market and credit risk. In entering into these contracts, there exists a market risk that such contracts may be significantly influenced by market conditions, such as interest rate volatility, resulting in such contracts being less valuable. If the markets should move against all of the futures positions held by a Trading Company in respect of any Series at the same time, and if the Trading Advisor(s) of such Trading Company are unable to offset such futures interests positions, such Trading Company could lose all of its assets and the holders of Units of such Series would realize a 100% loss. The Managing Owner will seek to minimize market risk through real-time monitoring of open positions and the level of diversification of each Trading Advisor’s portfolio. It is anticipated that any Trading Advisor’s margin-to-equity ratio will typically not exceed approximately 35% although the actual ratio could be higher or lower from time to time.
In addition to market risk, trading futures, forward and swap contracts entails credit risk in that a counterparty will not be able to meet its obligations to a Trading Company. The counterparty for futures contracts traded in the United States and on most foreign exchanges is the clearinghouse associated with such exchange. In general, clearinghouses are backed by the corporate members of the clearinghouse who are required to share any financial burden resulting from the non-performance by one of their members and, as such, should significantly reduce this credit risk. In cases where the clearinghouse is not backed by the clearing members, like some foreign exchanges, it is normally backed by a consortium of banks or other financial institutions. Some non-U.S. exchanges, in contrast to U.S. exchanges, are principals’ markets in which performance is the responsibility only of the individual counterparty with whom the Trading Company has entered into the transaction, and not of the exchange or clearing corporation. In these kinds of markets, there is risk of bankruptcy or other failure or refusal to perform by the counterparty.
In the case of forward contracts traded on the interbank market and swaps, neither is traded on exchanges. The counterparty is generally a single bank or other financial institution, rather than a group of financial institutions; thus there may be a greater counterparty credit risk. The Managing Owner expects the Trading Advisors to trade only with those counterparties which it believes to be creditworthy. All positions of each Trading Company will be valued each day on a mark-to-market basis. There can be no assurance that any clearing member, clearinghouse or other counterparty will be able to meet its obligations to any Trading Company.
The Managing Owner has established procedures to actively monitor and minimize market and credit risks. The Limited Owners bear the risk of loss only to the extent of the market value of their respective investments and, in certain specific circumstances, distributions and redemptions received.
10. Indemnifications
The Trust has entered into agreements, which provide for the indemnification of futures clearing brokers, currency trading companies, and commodity trading advisors, among others, against losses, costs, claims and liabilities arising from the performance of their individual obligations under such agreements, except for gross negligence or bad faith. The Trust has had no prior claims or payments pursuant to these agreements. The Trust’s individual maximum exposure under these arrangements is unknown, as this would involve future claims that may be made against the Trust that have not yet occurred. However, based on experience the Trust expects the risk of loss to be remote.
59
Table of Contents
The Frontier Fund
Notes to Financial Statements—(Continued)
As of September 30, 2009 (Unaudited)
11. Subsequent Events
The Trust has evaluated the need to disclose events subsequent to the balance sheet date through the filing date of this 10-Q and have the following events to report:
None.
| Item 2. | MANAGEMENT’S DISCUSSION AND ANALYSIS OF FINANCIAL CONDITION AND RESULTS OF OPERATIONS |
Introduction
The following discussion and tables should be read in conjunction with our consolidated financial statements and notes thereto included in this quarterly report and our 2008 Annual Report on Form 10-K for the year ended December 31, 2008.
Overview
The Frontier Fund (the “Trust”), is a Delaware statutory trust formed on August 8, 2003. The Trust is a multi-advisor commodity pool, as described in CFTC Regulation § 4.10(d)(2). The Trust is authorized to issue multiple Series of Units, pursuant to the requirements of the Trust Act. The assets of each Series are held and accounted for in separate and distinct records separately from the assets of other Series. The Trust is managed by the Managing Owner, and its term will expire on December 31, 2053 (unless terminated earlier in certain circumstances).
The Trust, with respect to each Series of Units, engages in the speculative trading of a diversified portfolio of futures, forward (including interbank foreign currencies) and options contracts and other derivative instruments (including Swaps) and may, from time to time, engage in cash and spot transactions and allocates funds to an affiliated limited liability trading company (each a “Trading Company”). Each Trading Company has one-year renewable contracts with its own independent Trading Advisor(s) that will manage all or a portion of the applicable Trading Company’s assets, and make the trading decisions for the assets of each Series vested in such Trading Company (other than the Frontier Dynamic and the Long Only Commodity Series which allocate assets only to Swaps). The assets of each Trading Company will be segregated from the assets of each other Trading Company. The Trust has an investment objective of increasing the value of the Units over the long term (capital appreciation), while controlling risk and volatility; further, to offer exposure to the investment programs of individual Trading Advisors and to specific instruments (currencies).
As of September 30, 2009 the Trust had eleven separate Series of Units issued and outstanding: the Frontier Diversified Series, Frontier Dynamic Series, Frontier Long/Short Commodity Series, Frontier Masters Series, Balanced Series, Campbell/Graham/Tiverton Series, Currency Series, Long Only Commodity Series, Managed Futures Index Series, Winton Series and Winton/Graham Series. Each Series of Units has between three and six separate classes issued and/or outstanding—Class 1, Class 2, Class 3, Class 1a, Class 2a, and Class 3a.
Critical Accounting Policies and Estimates
The financial statements of the Trust in this Quarterly Report on Form 10-Q have not been audited by an independent registered public accounting firm, but in the opinion of management, reflect all adjustments necessary for a fair presentation of the Company’s financial position and results of operations. The financial statements have been prepared in accordance with accounting principles generally accepted in the United States of America (“GAAP”). These interim financial statements have been prepared in accordance with the instructions to Form 10-Q and Rule 10-01 of Regulation S-X and serve to update the Trust’s 2008 Annual Report on Form 10-K (“Form 10-K”). These financial statements do not include all of the information and notes necessary to constitute a complete set of financial statements under GAAP applicable to annual periods. Accordingly, they should be read in conjunction with the financial information contained in the Form 10-K. In the opinion of management, all adjustments necessary for a fair presentation have been included. The results of operations for the interim periods disclosed herein are not necessarily indicative of results that may be expected for the full year or any future period.
60
Table of Contents
The Trust’s critical accounting policies and related estimates and judgments underlying the financial statements are as identified below.
Investment and Swap Transactions and Valuation—The Trust records investment transactions on a trade date basis and all investments are recorded at fair value in its financial statements, with changes in fair value reported as a component of Trading Profits (Losses) and unrealized equity in earnings on investments in each Series in the Statements of Operations. Generally, fair values are based on quoted market prices; however, in certain circumstances, significant judgments and estimates may be required in determining fair value in the absence of an active market closing price.
Allocation of Trading Profits or Losses—Each Series of the Trust has three or six classes of Units – Class 1, Class 2, Class 3, Class 1a, Class 2a and Class 3a). All classes have identical voting, dividend, liquidation and other rights and the same terms and conditions, except that Class 1 and 1a Units of each Series bear certain expenses related to the servicing of such Units. Revenues, expenses (other than expenses attributable to a specific class), and realized and unrealized trading profits and losses of each Series are allocated daily to Class 1, Class 1a, Class 2, Class 2a, Class 3 and Class 3a Units based on each Class’ respective owners’ capital balances.
Each Series allocates funds to a Trading Company, or Trading Companies, which allocate all of their daily trading profits or losses to the Series in proportion to each Series’ funds allocated to the Trading Company, adjusted on a daily basis. As of September 30, 2009, the value of all open contracts and cash held at clearing brokers is similarly allocated to the Series in proportion to each Series’ funds allocated to the Trading Company, or Trading Companies.
Interest Income—Interest income from all sources, including assets held at clearing brokers and cash and cash equivalents held at banks, is aggregated and allocated across all Series in proportion to their daily NAV, including the effects of inter-series advances and excluding non-controlling interests.
In applying these policies, the Managing Owner may make judgments that can frequently require estimates about matters that are inherently uncertain.
Investment Transactions and Valuation
The Managing Owner has evaluated the nature and type of transactions processed and estimates that it makes in preparing the Trust’s financial statements and related disclosures and has adopted ASC 820, and implemented the framework for measuring fair value for assets and liabilities.
The Trust utilizes valuation techniques that are consistent with the market approach per the requirement of FASB ASC 820 for the valuation of futures (exchange traded) contracts, currencies, forward (non-exchange traded) contracts, swap contracts and other non-cash assets. The market approach uses prices and other relevant information generated by market transactions involving identical or comparable assets or liabilities. The Trust applies the valuation techniques in a consistent manner for each asset or liability. The Trust records all investments at fair value in its Statement of Financial Condition, with changes in fair value reported as a component of realized and unrealized gain/(loss) on investments in the Statements of Operations.
Inputs to valuation techniques refer to the assumptions that market participants would use in pricing the assets or liabilities. Inputs may be observable, meaning those that reflect the assumptions market participants would use in pricing the financial asset or liability based on market data obtained from independent sources, or unobservable, meaning those that reflect the reporting entity’s own assumptions about the assumptions market participants would use in pricing the financial asset or liability based on the best information available in the circumstances.
In addition, the Trust monitors counterparty credit risk and incorporates any identified risk factors when assigning input levels to underlying financial assets or liabilities. In that regard ASC 820 establishes a fair value hierarchy for valuation inputs that gives the highest priority to quoted prices in active markets for identical financial assets and the lowest priority to unobservable inputs. A full disclosure of the fair value hierarchy is presented in Note 3 of the financial statements—Fair Value Measurements.
61
Table of Contents
Custom Time Deposits and Certificates of Deposit
Custom time deposits and certificates of deposit are allocated to each Series based on the Series’ percentage ownership in the pooled cash management assets as of the reporting date. The Trust values the custom time deposits at face value plus accrued interest as it is considered a deposit account under paragraph 7.23 of the Investment Company Audit Guide, and accordingly, this deposit is not subject to fair value measurements under ASC 820. The Trust values the certificates of deposit at face value plus accrued interest and reports these instruments as Level 2 inputs under ASC 820.
Liquidity and Capital Resources
The Trust will raise additional capital only through the sale of Units offered pursuant to the continuing offering, and does not intend to raise any capital through borrowing. Due to the nature of the Trust’s business, it makes no capital expenditures and has no capital assets that are not operating capital or assets.
The Managing Owner is responsible for the payment of all of the ordinary expenses associated with the organization of the Trust and the offering of each Series of Units, except for the initial and ongoing service fee, if any, and no Series will be required to reimburse these expenses. As a result, 100% of each Series’ offering proceeds are initially available for that Series’ trading activities.
A portion of each Trading Company’s assets is used as margin to maintain that Trading Company’s forward currency contract positions, and another portion is deposited in cash in segregated accounts in the name of each Trading Company maintained for each Trading Company at the clearing brokers in accordance with CFTC segregation requirements. At September 30, 2009, cash deposited at the clearing brokers was $47,198,942 for the Frontier Long/Short Commodity Series, $46,467,881 for the Balanced Series, $477,496 for the Currency Series and $16,159,866 for the Winton/Graham Series. The clearing brokers are expected to credit each Trading Company with approximately 80%-100% of the interest earned on its average net assets on deposit with the clearing brokers each week. Currently, this amount is estimated to be 0.20%. In an attempt to increase interest income earned, the Managing Owner also may invest the non-margin assets in U.S. government securities which include any security issued or guaranteed as to principal or interest by the United States, or by a person controlled by or supervised by and acting as an instrumentality of the government of the United States pursuant to authority granted by Congress or any certificate of deposit for any of the foregoing, including U.S. treasury bonds, U.S. treasury bills and issues of agencies of the U.S. government, and certain cash items such as money market funds, certificates of deposit (under nine months) and time deposits. Aggregate interest income from all sources, including assets held at clearing brokers, up to 2% (annualized) is paid to the Managing Owner by the Balanced Series (Class 1 and Class 2 only), Campbell/Graham/Tiverton Series, Currency Series, Winton Series, and Winton/Graham Series. For the Frontier Diversified Series, Frontier Dynamic Series, Frontier Long/Short Commodity Series, Frontier Masters Series, Balanced Series (Class 1a and Class 2a only), Long Only Commodity Series and Managed Futures Index Series, 20% of the total interest allocated to each Series is paid to the Managing Owner.
Approximately 10% to 20% of the Trust’s assets are expected to be committed as required margin for futures contracts and forward and options trading and held by the respective broker, although the amount committed may vary significantly. Such assets are maintained in the form of cash or U.S. Treasury bills in segregated accounts with the futures broker pursuant to the Commodity Exchange Act and regulations thereunder. Approximately 2% to 6% of the Trust’s assets are expected to be deposited with over-the-counter counterparties in order to initiate and maintain forward and swap contracts. Such assets are not held in segregation or otherwise regulated under the Commodity Exchange Act, unless such over-the-counter counterparty is registered as a futures commission merchant. These assets are held in either U.S. government securities or short-term time deposits with U.S.-regulated bank affiliates of the over-the-counter counterparties. The remaining approximately 74% to 88% of the Trust’s assets will normally be invested in cash equivalents and short-term investments, such as money market funds, and time deposits and held by the clearing broker, the over-the-counter counterparties and by U.S. Federally chartered banks. As of September 30, 2009, total cash and cash equivalents (including cash payables to other Series) and custom time deposits held at banking institutions were $39,948,164 for the Frontier Diversified Series, $15,140,702 for the Frontier Dynamic Series, $43,857,769 for the Frontier Long/Short Commodity Series, $21,310,230 for the Frontier Masters Series $127,349,356 for the Balanced Series, $51,355,575 for the Campbell/Graham/Tiverton Series, $14,941,183 for the Currency Series, $3,166,098 for the Long Only Commodity Series, $2,661,600 for the Managed Futures Index Series, $48,865,234 for the Winton Series and $42,818,993 for the Winton/Graham Series.
62
Table of Contents
Off-Balance Sheet Risk
The term “off-balance sheet risk” refers to an unrecorded potential liability that, even though it does not appear on the balance sheet, may result in future obligation or loss. Each Trading Company trades in futures, forward and swap contracts and is therefore a party to financial instruments with elements of off-balance sheet market and credit risk. In entering into these contracts there exists a market risk that such contracts may be significantly influenced by market conditions, such as interest rate volatility, resulting in such contracts being less valuable. If the markets should move against all of the futures interests positions held by a Trading Company in respect of any Series at the same time, and if the Trading Advisor(s) of such Trading Company are unable to offset such futures interests positions, such Trading Company could lose all of its assets and the holders of Units of such Series would realize a 100% loss. The Managing Owner seeks to minimize market risk through real-time monitoring of open positions and the level of diversification of each Trading Advisor’s portfolio. It is anticipated that any Trading Advisor’s margin-to-equity ratio will typically not exceed approximately 35% although the actual ratio could be higher or lower from time to time.
In addition to market risk, trading futures, forward and swap contracts entails credit risk which is the risk that a counterparty will not be able to meet its obligations to a Trading Company. The counterparty for futures contracts traded in the United States and on most foreign exchanges is the clearinghouse associated with such exchange. In general, clearinghouses are backed by the corporate members of the clearinghouse who are required to share any financial burden resulting from the non-performance by one of their members and, as such, should significantly reduce this credit risk. In cases where the clearinghouse is not backed by the clearing members, like some foreign exchanges, it is normally backed by a consortium of banks or other financial institutions. Some non-U.S. exchanges, in contrast to U.S. exchanges are principals’ markets in which performance is the responsibility only of the individual counterparty with whom the Trading Company has entered into the transaction with and not of the exchange or clearing corporation. In these kinds of markets, there is risk of bankruptcy or other failure or refusal to perform by the counterparty.
In the case of forward contracts traded on the interbank market and swaps, neither is traded on an exchange. The counterparty is generally a single bank or other financial institution, rather than a group of financial institutions; thus, there may be a greater counterparty credit risk. The Managing Owner expects the Trading Advisors to trade only with those counterparties which it believes to be creditworthy. All positions of each Trading Company are valued each day on a mark-to-market basis. There can be no assurance that any clearing member, clearinghouse or other counterparty will be able to meet its obligations to any Trading Company.
The Trust has entered into agreements, which provide for the indemnification of futures clearing brokers, currency trading companies, and commodity trading advisors, among others, against losses, costs, claims and liabilities arising from the performance of their individual obligations under such agreements, except for gross negligence or bad faith. The Trust has had no prior claims or payments pursuant to these agreements. The Trust’s individual maximum exposure under these arrangements is unknown, as this would involve future claims that may be made against the Trust that have not yet occurred. However, based on experience the Trust expects the risk of loss to be remote.
Results of Operations
Three Months Ended September 30, 2009 Compared to Three Months Ended September 30, 2008
Frontier Diversified Series
The Frontier Diversified Series began trading operations on June 9, 2009. The Frontier Diversified Series – Class 1 Net Asset Value gained 0.9% for the three months ended September 30, 2009, net of fees and expenses; the Frontier Diversified Series – Class 2 Net Asset Value gained 1.3% for the three months ended September 30, 2009, net of fees and expenses.
For the three months ended September 30, 2009, the Frontier Diversified Series recorded a net gain on investments of $416,034, net interest of $173,574, and total expenses of $440,859, resulting in a net decrease in Owners’ capital from operations of $148,749.
Please see additional discussion under “Nine Months Ended September 30, 2009 Compared to Nine Months Ended September 30, 2008 – Frontier Diversified Series.”
63
Table of Contents
Frontier Dynamic Series
The Frontier Dynamic Series began trading operations on June 9, 2009. The Frontier Dynamic Series – Class 1 Net Asset Value lost 0.5% for the three ended September 30, 2009, net of fees and expenses; the Frontier Dynamic Series – Class 2 Net Asset Value lost 0.1% for the three months ended September 30, 2009, net of fees and expenses.
For the three months ended September 30, 2009 the Frontier Dynamic Series recorded a net gain on investments of $63,150, net interest of $129,833, and total expenses of $194,841, resulting in a net decrease in Owners’ capital from operations of $1,858.
Please see additional discussion under “Nine Months Ended September 30, 2009 Compared to Nine Months Ended September 30, 2008 – Frontier Dynamic Series.”
Frontier Long/Short Commodity Series
The Frontier Long/Short Commodity Series – Class 1 Net Asset Value gained 1.0% and lost 7.3%, respectively, for the three months ended September 30, 2009 and 2008, net of fees and expenses; the Frontier Long/Short Commodity Series – Class 2 Net Asset Value gained 1.7% and lost 6.6%, respectively, for the three months ended September 30, 2009 and 2008, net of fees and expenses; the Frontier Long/Short Commodity Series – Class 3 Net Asset Value gained 1.7% for the three months ended September 30, 2009, net of fees and expenses; the Frontier Long/Short Commodity Series – Class 1a Net Asset Value gained 1.1% for the three months ended September 30, 2009, net of fees and expenses; the Frontier Long/Short Commodity Series – Class 2a Net Asset Value gained 1.5% for the three months ended September 30, 2009, net of fees and expenses. For the three months ended September 30, 2009, the Frontier Long/Short Commodity Series recorded net gain on investments of $1,658,892, net interest of $292,640, and total expenses of $1,591,462, resulting in a net increase in Owners’ capital from operations of $784,707 after non-controlling interests of $424,637. For the three months ended September 30, 2008, the Long/Short Commodity Series recorded net loss on investments of $1,811,288, net interest of $262,117, and total expenses of $1,196,021, resulting in a net decrease in Owners’ capital from operations of $4,350,185 after non-controlling interests of ($1,604,993).
The Frontier Long/Short Commodity Series was previously designated as the “Long/Short Commodity Series.” The Long/Short Commodity Series was renamed the Frontier Long/Short Commodity Series in May 2009.
Please see additional discussion under “Nine Months Ended September 30, 2009 Compared to Nine Months Ended September 30, 2008 – Frontier Long/Short Commodity Series.”
Frontier Masters Series
The Frontier Masters Series began trading operations on June 9, 2009. The Frontier Masters Series – Class 1 Net Asset Value gained 0.4% for the three months ended September 30, 2009, net of fees and expenses; the Frontier Masters Series – Class 2 Net Asset Value gained 0.8% for the three months ended September 30, 2009, net of fees and expenses.
For the three months ended September 30, 2009 the Frontier Masters Series recorded a net gain on investments of $265,945, net interest of $127,057, and total expenses of $310,137, resulting in a net increase in Owners’ capital from operations of $82,865.
Please see additional discussion under “Nine Months Ended September 30, 2009 Compared to Nine Months Ended September 30, 2008 – Frontier Masters Series.”
64
Table of Contents
Balanced Series
The Balanced Series – Class 1 Net Asset Value gained 1.1% and lost 2.1%, respectively, for the three months ended September 30, 2009 and 2008, net of fees and expenses; the Balanced Series – Class 1a Net Asset Value gained 1.0% and lost 2.1%, respectively, for the three months ended September 30, 2009 and 2008, net of fees and expenses; the Balanced Series – Class 2 Net Asset Value gained 1.9% and lost 1.4%, respectively, for the three months ended September 30, 2009 and 2008, net of fees and expenses; the Balanced Series – Class 2a Net Asset Value gained 1.8% and lost 1.4%, respectively, for the three months ended September 30, 2009 and 2008, net of fees and expenses; the Balanced Series – Class 3a Net Asset Value gained 1.8% for the three months ended September 30, 2009, net of fees and expenses.
For the three months ended September 30, 2009, the Balanced Series recorded net gain on investments of $11,975,473, net interest of $304,459, and total expenses of $4,649,750, resulting in a net decrease in Owners’ capital from operations of $5,151,354 after non-controlling interests of ($2,478,828). For the three months ended September 30, 2008, the Balanced Series recorded net loss on investments of $1,900,571, net interest of $196,535, and total expenses of $3,590,581, resulting in a net decrease in Owners’ capital from operations of $5,255,715 after non-controlling interests of $38,902.
The Balanced Series, through Frontier Trading Company I, LLC, has engaged in a fund option transaction, whereby the Balanced Series obtains exposure to the performance of additional commodity funds held by a counterparty to the option, for the purpose of further diversification among trading advisors and styles. The Trust does not have transparency to the underlying investments of these commodity funds, so the returns from this program cannot be characterized.
Please see additional discussion under “Nine Months Ended September 30, 2009 Compared to Nine Months Ended September 30, 2008 – Balanced Series.”
Campbell/Graham/Tiverton Series
The Campbell/Graham/Tiverton Series – Class 1 Net Asset Value gained 3.2% and lost 2.9%, respectively, for the three months ended September 30, 2009 and 2008, net of fees and expenses; the Campbell/Graham/Tiverton Series – Class 2 Net Asset Value gained 4.0% and lost 2.2%, respectively for the three months ended September 30, 2009 and 2008, net of fees and expenses.
For the three months ended September 30, 2009, the Campbell/Graham/Tiverton Series recorded net gain on investments of $4,010,009, net interest of $70,057, and total expenses of $1,434,966, resulting in a net increase in Owners’ capital from operations of $2,645,100. For the three months ended September 30, 2008, the Campbell/Graham/Tiverton Series recorded net loss on investments of $1,334,389, net interest of $50,305, and total expenses of $1,191,731, resulting in a net decrease in Owners’ capital from operations of $1,902,748 after non-controlling interests of 573,067.
The Campbell/Graham/Tiverton Series was previously designated as the “Campbell/Graham Series,” and trading for the Series was directed only by Campbell and Graham. The Campbell/Graham Series was renamed the “Campbell/Graham/Tiverton Series” in May 2008 and Tiverton was added as a Trading Advisor to the Series on June 2, 2008.
Please see additional discussion under “Nine Months Ended September 30, 2009 Compared to Nine Months Ended September 30, 2008 – Campbell/Graham/Tiverton Series.”
Currency Series
The Currency Series – Class 1 Net Asset Value lost 4.5% and 7.9%, respectively, for the three months ended September 30, 2009 and 2008, net of fees and expenses; the Currency Series – Class 2 Net Asset Value lost 3.7% and 7.2%, respectively for the three months ended September 30, 2009 and 2008, net of fees and expenses.
65
Table of Contents
For the three months ended September 30, 2009, the Currency Series recorded net loss on investments of $434,040, net interest of $21,513, and total expenses of $142,910, resulting in a net decrease in Owners’ capital from operations of $555,437. For the three months ended September 30, 2008, the Currency Series recorded net loss on investments of $1,096,028, net interest of $15,163, and total expenses of $171,624, resulting in a net decrease in Owners’ capital from operations of $1,252,489.
All commodity interest positions of the Currency Series during 2009 were within the Currencies sector.
Please see additional discussion under “Nine Months Ended September 30, 2009 Compared to Nine Months Ended September 30, 2008 – Currency Series.”
Long Only Commodity Series
The Long Only Commodity Series – Class 1 Net Asset Value gained 3.1% and lost 24.5%, respectively, for the three months ended September 30, 2009 and 2008, net of fees and expenses; the Long Only Commodity Series – Class 2 Net Asset Value gained 3.4% and lost 24.1% respectively, for the three months ended September 30, 2009 and 2008, net of fees and expenses.
For the three months ended September 30, 2009, the Long Only Commodity Series recorded net gain on investments of $156,775, net interest of $19,060, and total expenses of $36,738, resulting in a net increase in Owners’ capital from operations of $139,097. For the three months ended September 30, 2008, the Long Only Commodity Series recorded net loss on investments of $1,986,414, net interest of $31,699, and total expenses of $61,887, resulting in a net decrease in Owners’ capital from operations of $2,016,602.
Please see additional discussion under “Nine Months Ended September 30, 2009 Compared to Nine Months Ended September 30, 2008 – Long Only Commodity Series.”
Managed Futures Index Series
The Managed Futures Index Series – Class 1 Net Asset Value lost 2.5% and 6.7%, respectively, for the three months ended September 30, 2009 and 2008, respectively, net of fees and expenses; the Managed Futures Index Series – Class 2 Net Asset Value lost 2.1% and 6.3%, respectively, for the three months ended September 30, 2009 and 2008, net of fees and expenses.
For the three months ended September 30, 2009, the Managed Futures Index Series recorded a net loss on investments of $82,380, net interest of $19,088, and total expenses of $37,872, resulting in a net decrease in Owners’ capital from operations of $101,164. For the three months ended September 30, 2008 the Managed Futures Index Series recorded a net loss on investments of $113,530, net interest of $8,831, and total expenses of $18,911, resulting in a net decrease in Owners’ capital from operations of $123,610.
Please see additional discussion under “Nine Months Ended September 30, 2009 Compared to Nine Months Ended September 30, 2008 – Managed Futures Index Series.”
Winton Series
The Winton Series – Class 1 Net Asset Value gained 0.6% and lost 7.8%, respectively, for the three months ended September 30, 2009 and 2008, net of fees and expenses; the Winton Series – Class 2 Net Asset Value gained 1.3% and lost 7.0%, respectively, for the three months ended September 30, 2009 and 2008, net of fees and expenses.
For the three months ended September 30, 2009, the Winton Series recorded net gain on investments of $1,155,872, net interest of $53,124, and total expenses of $792,105, resulting in a net increase in Owners’ capital from operations of $416,891. For the three months ended September 30, 2008, the Winton Series recorded net loss on investments of $9,100,037 net interest of $54,392, and total expenses of $914,369, resulting in a net decrease in Owners’ capital from operations of $5,790,500 after non-controlling interests of 4,169,514.
Please see additional discussion under “Nine Months Ended September 30, 2009 Compared to Nine Months Ended September 30, 2008 – Winton Series.”
66
Table of Contents
Winton/Graham Series
The Winton/Graham Series – Class 1 Net Asset Value gained 4.2% and lost 6.8%, respectively, for the three months ended September 30, 2009 and 2008, net of fees and expenses; the Winton/Graham Series – Class 2 Net Asset Value gained 5.0% and lost 6.1%, respectively for the three months ended September 30, 2009 and 2008, net of fees and expenses.
For the three months ended September 30, 2009, the Winton/Graham Series recorded net gain on investments of $6,524,420, net interest of $55,724, and total expenses of $1,140,280, resulting in a net increase in Owners’ capital from operations of $2,657,692 after non-controlling interests of ($2,782,172). For the three months ended September 30, 2008, the Winton/Graham Series recorded net loss on investments of $1,456,705, net interest of $20,175, and total expenses of $351,927, resulting in a net decrease in Owners’ capital from operations of $1,788,457.
The Winton/Graham Series was previously designated as the “Graham Series,” and trading for the Series was directed only by Graham. The Graham Series was renamed the “Winton/Graham Series” in May 2008 and Winton was added as a Trading Advisor to the Series on June 18, 2008. Please see additional discussion under “Nine Months Ended September 30, 2009 Compared to Nine Months Ended September 30, 2008 – Winton/Graham Series.”
Nine Months Ended September 30, 2009 Compared to Nine Months Ended September 30, 2008
Market Conditions for Nine Months Ended September 30, 2009
January 2009
Interest Rates
The Federal Open Market Committee decided to keep its target range for the federal funds rate at 0 to 0.25 percent in January, as economic data suggested that the economy has weakened further. The Federal Open Market Committee continued to purchase large quantities of agency debt and mortgage-backed securities to provide support to the mortgage and housing markets, and announced that it will employ all available tools to promote sustainable economic growth, including possibly purchasing long-term U.S. Treasury notes. U.S. interest rate futures, as well as European interest rate futures, finished mixed for the month.
Currencies
The U.S. Dollar strengthened against most other major currencies in January. The U.S. Dollar Index recouped the December loss and finished the month up 5.8%. The Euro and the British Pound weakened against the U.S. Dollar, finishing lower by -8.3% and -0.6% respectively for the month. The Australian Dollar and the Canadian Dollar also weakened again their U.S. counterpart, finishing down 9.6% and 0.7% respectively. The Swiss Franc weakened against the U.S. Dollar, down 7.7% and the Japanese Yen gained against the U.S. dollar, up 0.9%.
Stock Indices
All major U.S. and European stock indices weakened in January. The Dow Jones Industrial Average (DJIA) finished the month down 8.8%, and the S&P 500 Index and NASDAQ Composite Index dropped 8.6% and 6.4% respectively in January. The DJIA, S&P 500 Index and NASDAQ Composite Index have dropped 30.7%, 35.6% and 37.6% respectively since August 2008. In Europe, FTSE index futures finished down 6.8%, CAC-40 futures dropped 8.4% and DAX index futures finished lower by 10.3% for the month.
Energy
Crude oil futures for March delivery finished the month down 14.2%. Crude oil futures have dropped more than 60.7% since August last year. Natural gas futures and heating oil futures for March delivery dropped as well, finishing lower by 21.9% and 2.3%. Gasoline futures prices finished the month up 14.3%.
67
Table of Contents
Metals
Gold futures for April delivery finished up 4.9% settling at $928/oz. Silver, platinum and palladium futures also finished higher, up 11.2%, 5.3% and 2.4% respectively. Copper futures finished higher by 4.1%.
Agriculturals
Corn and wheat futures for March delivery weakened in January, finishing down 6.9% and 7.0% respectively. Rough rice futures dropped sharply during the month, finishing lower by 22.8%. Soybean oil futures dropped 2.6% and soybean futures for March delivery finished the month unchanged. Cocoa futures and coffee futures for March 2009 delivery finished the month higher by 4.0% and 6.1% respectively. Lumber futures continued its downward path finishing lower by 21.1% for the month.
February 2009
Interest Rates
European rate futures continued to climb on bad news regarding toxic assets in European banks, U.S. rate futures were flat to slightly down. There is general consensus that much of the bad news about U.S. banks has already been addressed, while Europe is still to deal with its toxic asset problems.
Currencies
The U.S. Dollar strengthened against most other major currencies in February. The U.S. Dollar Index continued its January gains and finished February up 2.3%. The Euro and the British Pound continued their declines against the U.S. Dollar, finishing lower by 1.2% and 1.6% respectively for the month.
Stock Indices
All major U.S. and European stock indices continued their dramatic declines in February, as the new U.S. administration struggled with resolving the complex economic issues before the nation, and passed a huge spending bill in an attempt to stimulate the economy. The DJIA plummeted 11.7%, with global markets responding to the economic downturn.
Energy
Crude oil and natural gas futures continued their declines in February on continuing weak demand.
Metals
Gold futures for April delivery finished up 1.5% for the month. Silver, platinum and palladium futures also finished higher, up 4.2%, 9.5% and .66% respectively. Copper futures finished higher by 3.7%.
Agriculturals
Corn and wheat futures for May continued their declines in February, finishing down 8.0% and 10.2% respectively. The soybean complex was down for the month, with meats mixed. With the softs, sugar showed a 5.6% gain, and cotton, coffee, and cocoa showing substantial declines.
68
Table of Contents
March 2009
Interest Rates
The Federal Open Market Committee decided on March 18th to maintain the target range for the federal funds rate at 0 to 0.25 %, and anticipates that the weak economic conditions are likely to warrant exceptionally low levels of the federal funds rate for an extended period of time. To support the mortgage lending and housing markets, the Federal Open Market Committee decided to increase the size of the Federal Reserve’s balance sheet further by purchasing an additional $750 billion of agency mortgage-backed securities, bringing its total purchases of these securities to up to $1.25 trillion this year. In addition, the Committee decided to increase its purchases of agency debt this year to a total of $200 billion and to purchase up to $300 billion of longer-term Treasury securities over the next six months. U.S. interest rate futures, as well as European interest rate futures, finished higher for the month.
Currencies
The U.S. Dollar weakened against most other major currencies in March. The U.S. Dollar Index finished the month down 2.7%. The Euro and the Swiss Franc strengthened against the U.S. Dollar, finishing up 4.6% and 2.7% respectively. The Australian Dollar and the Canadian Dollar also strengthened against their U.S. counterpart, finishing up 8.2% and 1.2% respectively. The Japanese Yen weakened against the U.S. Dollar, down 1.4% and British Pound finished the month nearly unchanged against the U.S. Dollar.
Stock Indices
All major U.S. and European stock indices strengthened in March. The DJIA finished the month up 7.7%, and the S&P 500 Index and NASDAQ Composite Index gained 8.5% and 10.9% respectively. In Europe, FTSE index futures finished up 3.6%, CAC-40 futures gained 4.6% and DAX index futures finished higher by 6.5% for the month.
Energy
Crude oil futures, heating oil futures and gasoline futures for May delivery finished the month up 5.9%, 7.1% and 3.6% respectively. Natural gas futures finished the month down 11.7%.
Metals
Gold futures for June delivery finished the month down 2.1% settling at $925/oz. Silver futures also finished lower for the month, down 1.0%. Platinum, palladium and copper futures finished higher in March, up 3.6%, 11.8% and 19.9% respectively.
Agriculturals
Corn and soybean futures for May delivery strengthened in March, finishing up 12.7% and 9.2% respectively. Cotton, cocoa and coffee futures for May delivery finished the month higher by 7.4%, 8.4% and 3.4% respectively. Live cattle and lean hogs finished the month slightly down.
April 2009
Interest Rates
The FOMC decided in April to maintain the target range for the Fed Funds rate at 0 to 0.25 percent, as recent economic data suggests that the economy continues to contract. To support the mortgage lending and housing markets, the FOMC has decided to purchase $1.25 trillion of agency mortgage-backed securities this year. In addition, the Committee has decided to increase its purchases of agency debt this year to a total of $200 billion and to purchase up to $300 billion of longer-term Treasury securities over the next six months. U.S. interest rate futures finished lower for the month and European interest rate futures finished mixed for the month.
69
Table of Contents
Currencies
The U.S. Dollar weakened against most other major currencies in April. The U.S. Dollar index finished the month down 0.9%. The British Pound strengthened against the U.S. dollar, finishing up 3.2%. The Australian Dollar and the Canadian Dollar also strengthened against their U.S. counterpart, finishing up 5.0% and 5.7%, respectively. The Euro weakened slightly against the U.S. Dollar, down 0.2% and the Japanese Yen finished the month up 0.3% against the U.S. dollar.
Stock Indices
All major U.S. and European stock indices continued to strengthen in April. The DJIA finished the month up 7.3%, and the S&P 500 Index and NASDAQ Composite Index gained 9.4% and 12.4% respectively. In Europe, FTSE index futures finished up 7.6%, CAC-40 futures gained 12.3% and DAX index futures finished higher by 16.2% for the month.
Energy
Natural gas futures continued their downward path, finishing down 13.8% in April. Natural gas futures have dropped more than 40% since December 2008. Gasoline futures for June delivery finished the month up 2.5%. Crude oil futures and heating oil futures finished lower by 0.5% and 3.9%, respectively.
Metals
Gold futures for June delivery finished the month down 3.7% settling at $891/oz. Copper futures continued to climb, up 10.4% for the month. Silver, platinum and palladium finished lower in April, down 5.3%, 2.0% and 0.3%, respectively.
Agriculturals
The soybean complex was up for the month; soybean oil futures for July delivery finished up 7.6%, soybeans and soybean meal futures finished higher by 11.0% and 13.3% respectively. Corn and wheat futures for July delivery finished slightly down 2.7% and 1.6% respectively. Cotton continued its upward path, finishing up 14.8% for the month.
May 2009
Interest Rates
U.S. interest rate futures at the longer end of the curve moved significantly lower in May, as investors digested the inflationary potential of the massive borrowing planned by the Federal Reserve. Standard & Poor’s moved its outlook on UK sovereign debt from “stable” to “negative” in response to skyrocketing public debt. Fear of a similar downgrade occurring to the U.S. and rumors of large investors, especially China, diversifying away from the U.S. Dollar caused a widespread pullback in bond prices in the U.S., Great Britain, and across Europe.
Currencies
The U.S. Dollar continued to weaken against most other major currencies in May. The U.S. Dollar index which measures the performance of the U.S. Dollar against a basket of currencies, finished down 6.4%. The Euro and the British Pound strengthened against the U.S. Dollar, finishing up 7.0% and 9.5% respectively. The Australian Dollar and the Canadian Dollar also continued their climb against their U.S. counterpart, finishing up 10.4% and 9.3% respectively. The Japanese Yen finished the month up 3.5% against the U.S. Dollar.
Stock Indices
All major U.S. and European stock indices continued to strengthen in May. The DJIA finished the month up 4.1%, and the S&P 500 Index and NASDAQ Composite Index gained 5.3% and 3.3% respectively. In Europe, FTSE index futures finished up 6.6%, CAC-40 futures gained 8.4% and DAX index futures finished higher by 4.8% for the month.
Energy
Energy futures saw an upswing in prices in May. Crude oil futures, heating oil futures and gasoline futures for July delivery gained 26.8%, 22.5% and 28.8% for the month. Natural gas futures regained some of the April loss, finishing higher by 9.1%.
70
Table of Contents
Metals
The combination of a declining U.S. Dollar, low interest rates and inflation expectations has been contributing to the rise in precious metals futures prices recently. Silver futures for July delivery strengthened during the month, finishing higher by 26.7%. Gold futures for June delivery finished the month up 9.8% settling at $979/oz. Platinum and palladium finished higher by 8.1% and 8.3% respectively. Copper futures continued to climb, up 7.3% for the month.
Agriculturals
The soybean complex was up for the month; soybean oil futures for July delivery finished up 7.0%, soybeans and soybean meal futures finished higher by 12.2% and 15.7% respectively. Corn and wheat futures for July delivery also finished higher, up 8.1% and 18.8% for the month. Coffee and cocoa futures prices for July delivery also strengthened, finishing higher by 18.6% and 9.0% for the month.
June 2009
Interest Rates
After a dramatic early-month sell-off, short-term interest rate futures on both sides of the Atlantic recovered to finish the month nearly unchanged. Longer term U.S. rate futures finished the month unchanged to slightly down, but the European BOBL (5-year note) and Bund (10-year note) were up strongly in anticipation of continued recession and banking problems in the Euro zone.
Currencies
The U.S. Dollar strengthened slightly in June. The U.S. Dollar index, which measures the performance of the U.S. Dollar against a basket of currencies, finished up 1.0%. The Euro weakened against the U.S. Dollar, finishing lower by 0.9%. The British Pound continued to strengthen again the U.S. Dollar, up 1.6% for the month. The Australian Dollar also continued climbing against its U.S. counterpart, finishing up 0.6%. The Canadian Dollar lost against the U.S. Dollar, finishing lower by 6.1%. The Japanese Yen finished the month down 1.1 % against the U.S. Dollar.
Stock Indices
The DJIA finished the month slightly lower, 0.6% for the month. The NASDAQ Composite Index gained 3.4% while the S&P 500 Index finished the month nearly unchanged. All major European stock indices weakened in June. FTSE index futures finished down 3.8%, CAC-40 futures lost 4.4% and DAX index futures finished lower by 3.1% for the month.
Energy
Crude oil futures, heating oil futures and gasoline futures for August delivery gained 4.2%, 4.4% and 1.2%, respectively, for the month. Natural gas futures for August delivery finished lower by 3.1% in June.
Metals
Gold futures for August delivery weakened during the month, finishing lower by 5.4% settling at $927/oz. Silver futures for September delivery finished the month lower as well, down 13.0%. Palladium finished higher by 5.7% and platinum dropped 1.4%. Copper futures continued to climb, up 3.1% for the month.
Agriculturals
Corn and wheat futures dropped during the month, down 20.0% and 18.5% respectively. The soybean complex also dropped; soybean oil futures finished down 10.0%, soybeans and soybean meal futures finished lower by 7.7% and 5.2% respectively. Coffee and orange juice futures weakened as well, finishing down 14.0% and 19.0% respectively.
71
Table of Contents
July 2009
Interest Rates
Interest rate futures on both sides of the Atlantic finished mixed to slightly up after a range-bound performance in July. Health care dominated the debate in the U.S., and there was little financial news to push the market one way or the other.
Currencies
The U.S. Dollar weakened in July. The US Dollar Index, which measures the performance of the U.S. Dollar against a basket of currencies, finished down 2.2%. The Euro strengthened against the U.S. Dollar, finishing higher by 1.6%. The British Pound continued to strengthen against the U.S. Dollar, up 1.6% for the month. In spite of volatile energy prices, both the Australian and Canadian Dollars also continued climbing against their U.S. counterpart, finishing up 3.7% and 7.9%, respectively. The Japanese Yen finished the month up 1.8% against the U.S. Dollar.
Stock Indices
Stock markets around the world were generally strong in July. The DJIA finished the month higher by 8.6% for the month. The NASDAQ Composite Index gained 8.5% while the S&P 500 Index finished the month up by 7.4%. All major European stock indices strengthened in July. FTSE index futures finished up 7.9%, CAC-40 futures gained 8.7% and DAX index futures finished higher by 10.7% for the month.
Energy
After a volatile month, the energy complex finished little changed in July. Crude oil and heating oil futures for September delivery lost 2.0% and 0.3%, respectively, while gasoline futures gained 6.1% for the month. Natural gas futures for September delivery finished lower by 8.3% in July.
Metals
Gold futures for December delivery strengthened during the month, finishing higher by 2.8%, settling at $956/oz. Silver futures for September delivery finished the month higher as well, up 2.5%. Palladium finished higher by 5.4% and platinum gained 2.4%. Copper futures continued to climb, finishing up +15.5% for the month.
Agriculturals
Corn and wheat futures dropped during the month, down 4.8% and 2.3%, respectively. After a volatile month, the soybean complex finished little changed. After a dramatic drop in June, coffee strengthened, gaining 6.6%.
August 2009
Interest Rates
After falling earlier in the month, interest rate futures on both sides of the Atlantic recovered. While European rate futures finished little changed, American futures continued climbing to close out August significantly higher, especially those at the shorter end of the curve.
Currencies
Both the U.S. Dollar and the Euro traded in tight ranges throughout August. The British Pound weakened slightly against the U.S. Dollar, down 2.6% for the month. The Japanese Yen also weakened, finishing down 1.6% against the U.S. Dollar.
Stock Indices
Stock markets around the world took a breather to consolidate the gains from July, and generally finished August somewhat higher than the month before. The DJIA finished the month higher by 3.5%. The NASDAQ Composite Index gained 1.5% while the S&P 500 Index finished the month up by 3.4%. Some of the major European stock indices were more volatile in August, with FTSE index futures finishing up 7.6% and CAC-40 futures gaining 7.3%. DAX index futures finished higher by 2.5% for the month.
72
Table of Contents
Energy
Energy prices fell slightly in August, with October crude prices down 1.7%. Heating oil and gasoline futures were also down, 2.9% and 4.7%, respectively. The big mover of the month was natural gas prices due to healthy supplies and a relatively cool summer, were down 24%.
Metals
Gold futures for December delivery remained in a tight trading range during the month, finishing almost unchanged at $953/oz. Silver futures for December delivery finished the month higher, up 6.8%. Palladium finished higher by 10.4% and platinum gained 2.5%. Copper futures continued to climb, finishing up 7.5% for the month.
Agriculturals
After starting the month with a rally, corn and wheat futures continued to fall, down 5.7% and 10.3%, respectively. The soybean complex had another volatile month but finished little changed.
September 2009
Interest Rates
Recent data suggests that economic activity has picked up to some extent. Financial markets have improved and activity in the housing sector has increased. However, businesses are still cutting back on fixed investment and staffing, though at a slower pace. Interest rate futures, across the curve and on both sides of the Atlantic, finished higher for the month.
Currencies
The U.S. Dollar index dropped during the month, finishing down 1.9%. The Euro strengthened against the U.S. Dollar, up 2.1% for the month. The Canadian Dollar and the Australian Dollar strengthened against their U.S. counterpart as well, finishing up 2.3% and 4.6%, respectively. The British Pound continued to weaken against the U.S. Dollar, down 1.9% for the month. The Japanese Yen strengthened, finishing up 3.8% against the U.S. dollar.
Stock Indices
The DJIA finished September higher by 2.8%. The S&P 500 Index and the NASDAQ Composite Index gained as well, up 3.6% and 1.5%, respectively. Most of the major European stock indices also finished higher. FTSE index futures gained 4.5%, CAC-40 futures finished up 3.7% and DAX index futures finished higher by 4.0% for the month.
Energy
Crude oil futures finished the month nearly unchanged. Heating oil and gasoline futures finished down 0.4% and 2.8%, respectively. Natural gas futures recouped most of the August loss, up 21.1% for the month.
Metals
Most precious metals futures finished higher in September. Gold futures for December delivery finished higher by 5.9% at $1,009/oz. Silver futures for December delivery also finished higher, up 11.6% for the month. Palladium and platinum also gained, up 1.9% and 4.3% in September. Copper futures remained in a tight trading range during the month, finishing nearly unchanged.
73
Table of Contents
Agriculturals
Wheat futures continued to fall in September, down 8.3%. The soybean complex had another volatile month but finished lower. Corn recouped some of the August loss, finishing higher by 4.3%. Coffee futures rallied mid-month, but dropped later in the month to finish higher by 4.5%.
Market Conditions for Nine Months Ended September 30, 2008
January 2008
Interest Rates
In response to widespread fear of a U.S. recession, interest rate futures on both sides of the Atlantic and across the entire curve climbed steadily for most of the month. The U.S. Federal Reserve cut the Fed Funds rate by 1.25% during January after the release of weaker than expected U.S. growth statistics and amid concerns that more debt write-offs are on the horizon. A late-month pullback after very high volatility, particularly in the European rate futures, was not enough to counter the significant increase in futures prices during the beginning of the month.
Currencies
The Federal Reserve’s rate cuts, which brought the Fed Funds rate down to 3%, contributed to the decline of the U.S. Dollar Index which finished the month down 2%. The Euro and the Japanese Yen strengthened against the U.S. Dollar, finishing up 1.9% and 5% respectively. The British Pound finished the month nearly unchanged against the U.S. Dollar.
Stock Indices
Widespread fear of a U.S. recession contributed to steep declines in all major U.S. Stock Market indices in January. The Dow Jones Industrial Average (DJIA) fell precipitously the first part of the month, finishing at 12,650, down 4.6%. The S&P 500 index and the NASDAQ Composite finished down 6.0% and 9.9% respectively. Stock indices in Europe and Asia also fell significantly during January. DAX index futures fell 15%, CAC-40 futures were down 13.2% and FTSE Index futures were lower by 9.3%. Nikkei index futures dropped as well, finishing lower by 11%.
Energy
After setting a new all-time intraday high of $99.77/bbl on January 3rd, March crude oil futures reversed course, finishing down 4.2% at $91.75/bbl after reports of larger than expected increases in crude oil and gasoline inventories. Gasoline and heating oil futures for March delivery also dropped during the month, finishing lower by 6.5% and 4.1% respectively. Natural gas futures prices finished higher by 7.4%.
Metals
Gold futures prices soared to a record high after the Federal Reserve’s rate cuts in January, which boosted the metal’s appeal as a stable investment. Gold futures gained 9.9% during January and surged to an all-time high of $942/oz on January 30th, finishing at $928/oz for the month. Silver futures also strengthened during the month and reached a new 25-year intraday high, finishing up 13.9%. Platinum and Copper futures finished up 14% and 8.5% respectively.
Commodities
Soybean and corn futures continued their upward paths, finishing higher by 5% and 10% respectively. Wheat also strengthened, finishing higher by 5%. Coffee and cocoa futures gained during the latter part of January, settling up 1.4% and 14.3%. Live cattle futures dropped sharply during the first part of the month, finishing down 4.3%.
74
Table of Contents
February 2008
Interest Rates
After declining for most of the month, U.S. interest rate futures across the entire curve shot upwards in the last few trading sessions to finish mixed for the month. European interest rate futures behaved similarly.
Currencies
The U.S. Dollar Index plummeted even further in February and finished down 2.2% at another new record low monthly close. The Euro and the Australian Dollar strengthened against the U.S. Dollar, finishing up 2.1% and 4.3% respectively. The British Pound gained 0.1% against the U.S. Dollar, while the Canadian Dollar finished the month nearly unchanged against its U.S. counterpart.
Stock Indices
All major U.S. Stock Market indices continued to weaken in February. The DJIA finished at 12,266.4, down 3.0%. The S&P 500 Index and the NASDAQ Composite finished down 3.5% and 5.0% respectively. Stock indices in Europe fell as well in February. CAC-40 futures fell 2.8%, DAX index futures were down 3.2% but FTSE Index futures finished slightly higher.
Energy
In February, energy prices surged as investors sought refuge in commodities to offset a slowing economy and a declining U.S. dollar. Crude oil futures for April delivery hit a new all-time high on February 29th, finishing up 11.1% at $101.84/bbl. Natural gas and heating oil futures for March delivery also strengthened during the month, finishing higher by 16.0% and 11.9% respectively. Gasoline futures prices finished higher by 6.4%.
Metals
Gold futures continued to strengthen during February and surged to a new all-time high of $975/oz on February 29th, finishing up 5.1% for the month. Platinum and palladium futures prices also rallied to new all-time highs during the month, finishing up 25.5% and 44.9% respectively. Silver futures also strengthened, finishing up 16.5%.
Commodities
Soybean futures prices have rallied sharply since August of last year, resulting in the highest prices in three decades. Soybean futures for May delivery surged to an all-time high on February 29th, finishing up 18.9% for the month. Corn futures also continued their upward path, finishing 8.4% for February. Wheat futures strengthened as well and hit an all-time intraday high on February 27th, finishing the month up 14.9%. Coffee, sugar and cocoa futures also gained during the month, settling up 18.6%, 13.7% and 18.0%, respectively. Lean hog futures dropped sharply the latter part of February, finishing down 9.8%. Cotton futures rose to new all-time highs, finishing the month higher by 19.3%.
March 2008
Interest Rates
Weakening U.S. economic data led the U.S. Federal Reserve to lower its target for the Fed Funds rate by 75 basis points on March 18th. US interest rate futures across the entire curve declined after the rate cut, to finish mixed for the month. European interest rate futures across the entire curve dropped precipitously during the latter part of March and finished lower for the month.
75
Table of Contents
Currencies
The Federal Reserve’s rate cut in March, which brought the Fed Funds rate down to 2.25%, contributed to further weaken the U.S. Dollar Index. The U.S. Dollar Index which measures the performance of the U.S. Dollar against a basket of currencies, finished down 2.6% at another new record low monthly close. The Euro reached a new all time high against the U.S. Dollar, finishing up 4.0%. The Japanese Yen also strengthened against the U.S. Dollar, finishing up 4.1%. The Canadian Dollar and the Australian Dollar weakened against their U.S. counterpart, finishing down 3.7% and 1.9% respectively.
Stock Indices
The DJIA weakened in the beginning of March, but recouped some of the loss to finish nearly unchanged. The S&P 500 Index finished down 0.6% and NASDAQ Composite finished up 1.9%. Stock indices in Europe fell slightly in March. FTSE index futures dropped by 2.9%, CAC-40 futures fell 1.2% and DAX index futures finished lower by 2.3%.
Energy
Crude oil futures hit a new intra-day high on March 17th, but later pulled back after several days of high volatility to finish the month nearly unchanged. Gasoline futures prices also experienced high volatility mid-month, and finished lower by 2.2%. Natural gas and heating oil futures for May delivery strengthened, finishing up 7.3% and 4.7% respectively.
Metals
The combination of a declining U.S. dollar, low interest rates and surging inflation have been contributing to the rise in gold futures prices during the last couple of months. After hitting a new intra-day high on March 17th, gold futures for June delivery tumbled the latter part of the month, finishing down 6.0% at $921.50/oz. Other precious metals futures prices also dropped after lower than expected U.S. interest rate cuts. Silver futures for May delivery fell 13.1% and platinum futures for July delivery finished down 6.6%. Copper futures finished the month nearly unchanged.
Commodities
Corn futures continued to strengthen in March, finishing higher by 1.9%. Soybean futures, which have been on an upward path since August of last year, dropped precipitously in March to finish lower by 22.08%. Wheat futures for May delivery also weakened, finishing down 14.5%. Coffee, sugar and cocoa futures followed the same path, finishing lower by 23.6%, 20.0% and 16.4% respectively. After reaching new all time highs on March 5th, cotton futures also dropped sharply during the latter part of the month, finishing down 15.3%. Lean hog futures and live cattle futures also finished lower by 11.0% and 8.0% respectively.
April 2008
Interest Rates
The Federal Open Market Committee decided on April 30th to lower its target for the Fed Funds rate by 25 basis points, down to 2%. U.S. interest rate futures across the entire curve dropped the latter part of April to finish lower for the month. European interest rate futures across the entire curve behaved similarly and dropped the latter part of April, finishing lower for the month.
Currencies
The US Dollar, which has been on a downward path for most of the year, strengthened during the latter part of April after reports of weak economic data from Europe. The U.S. Dollar Index reversed its downtrend and finished the month up 1%. The Euro, which reached a new all time high against the U.S. Dollar in March, weakened against the U.S. Dollar and finished lower by 1%. The Japanese Yen also weakened against the U.S. Dollar, finishing down 4.1%. The Australian Dollar and the Canadian Dollar gained against their U.S. counterpart, finishing up 3.3% and 1.8% respectively.
76
Table of Contents
Stock Indices
The Dow Jones Industrial Average (DJIA) recouped some of the loss from previous months, finishing up 4.5% for April. The S&P 500 Index also finished higher by 4.8%. The NASDAQ Composite finished up 5.9%. Stock indices in Europe strengthened as well during the month. FTSE index futures gained 6.3%, CAC-40 futures finished higher by 6.0% and DAX index futures finished up 5.2%.
Energy
Crude oil futures surged to new all time highs on April 28th after widespread concerns about disruptions in the supply of crude oil. A strike at Scotland’s largest oil refinery closed a pipeline system that delivers a third of Britain’s North Sea oil to its refineries. Rebel attacks in Nigeria, Africa’s largest oil producer, also caused concerns about supply disruptions and contributed to the upward pressure on crude oil prices. Crude oil futures for June delivery finished the month up 12.2% at $113.46/bbl. Gasoline futures prices and heating oil futures prices also strengthened in April, finishing higher by 10.8% and 10.6% respectively. Natural gas futures prices for June delivery finished the month up 6.5%.
Metals
Gold futures, which hit new intra-day highs in March, fell the latter part of April to finish lower by 6.1% at $865/oz. Other precious metals futures prices also dropped in April. Silver futures and Platinum futures for July delivery fell 4.6% and 5.3% respectively. Palladium futures prices finished lower by 6.1%. Copper finished the month slightly up, 1.9%.
Agriculturals
Corn futures continued their upward path, finishing up 5.2% for April. Soybean futures recouped some of the March loss, settling up 8.1%. Cocoa futures for July delivery also strengthened, finishing up 18.2%. Wheat futures for July delivery continued to weaken, finishing lower by 14.5%. Sugar and cotton futures also weakened during the month, finishing lower by 2.6% and 2.2% respectively. Coffee futures for July delivery finished the month higher by 4.2%. Lean Hogs and Live Cattle recouped some of the March loss, finishing up 8.1% and 6.5% respectively.
May 2008
Interest Rates
The US Federal Reserve lowered its target for the Fed Funds rate to 2% on April 30th, after weaker than expected economic activity, lower household and business spending and softening labor markets. U.S. interest rate futures across the entire curve dropped the latter part of May to finish lower for the month. European interest rate futures across the entire curve also finished lower for the month.
Currencies
During May the U.S. dollar stabilized against most other major currencies. For the second month in a row the U.S. Dollar Index finished the month slightly up, 0.5%. The Euro weakened against the U.S. Dollar and finished lower by 0.4%. The Japanese Yen also weakened against the U.S. Dollar, finishing down 1.5%. The Australian Dollar and the Canadian Dollar continued to gain against their U.S. counterpart, finishing up 1.3% and 1.4% respectively. The British pound finished nearly unchanged against the U.S. Dollar.
Stock Indices
The Dow Jones Industrial Average (DJIA) dropped the latter part of May, finishing down 1.4%. The S&P 500 Index finished the month higher by 1.1%. The NASDAQ Composite finished up 4.6%. Stock indices in Europe finished mixed for the month. FTSE index futures fell 0.6%, CAC-40 futures finished higher by 2.3% and DAX index futures finished up 2.2%.
77
Table of Contents
Energy
Crude oil futures surged to new all time highs in May. Crude oil futures for July delivery finished the month up 13.0% at $127.35/bbl. Gasoline futures prices and Heating oil futures prices also continued to strengthen in May, finishing higher by 15.5% and 15.7% respectively. Natural gas futures prices for July delivery finished the month up 6.6%.
Metals
Gold futures finished the month up 2.5%, settling at 891.50/oz. Silver futures for July delivery dropped the latter part of May, to finish lower by 1.6%. Platinum recouped some of the April loss, up 4.1% for the month. Palladium futures prices finished higher by 2.9%. Copper futures for July delivery finished lower by 7.6%.
Agriculturals
Wheat futures, which have been on a downward path since mid March, continued to weaken, finishing down 4.9%. Soybean and soybean oil futures finished the month up 3.8% and 5.1% respectively. Sugar, cotton and orange juice futures for July delivery continued to weaken, settling down 15.2%, 7.6% and 9.6%. Lean hogs and live cattle continued to strengthen, finishing up 3.7% and 2.9%. Corn, coffee and cocoa futures finished slightly down 2.1%, 1.1% and 1.9% respectively.
June 2008
Interest Rates
The Federal Open Market Committee decided on June 25th to keep its target for the Federal Funds rate at 2 percent. Federal Reserve policymakers, along with foreign central bank officials, have expressed greater concerns about inflation, stressing the importance of keeping inflation expectations contained. US interest rate futures across the entire curve dropped the first part of June, but bounced back the latter part of the month to finish higher. European interest rate futures across the entire curve dropped the first part of June to finish lower for the month.
Currencies
The U.S. Dollar Index finished the month slightly down, falling by 0.6%. The Euro strengthened against the U.S. Dollar and finished higher by 1.3%. The British Pound also strengthened against the U.S. Dollar, finishing up 0.5%. The Australian Dollar gained against its U.S. counterpart, up 0.3%. The Canadian Dollar weakened against the U.S. Dollar, finishing down 2.8%. The Japanese Yen also weakened against the U.S. dollar, finishing down 0.7%.
Stock Indices
All major U.S. stock market indices weakened in June. The DJIA dropped precipitously during the month, finishing lower by 10.2%. The S&P 500 Index finished the month down 8.6%. The NASDAQ Composite fell 9.1% in June. Stock indices in Europe finished lower as well. FTSE index futures fell 7.4%, CAC-40 futures finished down 12.1% and DAX index futures finished lower by 10.2%.
Energy
Energy prices have risen sharply since the beginning of the year. Crude oil futures surged to new all time highs in June. Crude oil futures for August delivery finished the month up 9.8% at $140/bbl. Gasoline futures prices and heating oil futures prices for August delivery also continued to strengthen, finishing higher by 5.8% and 5.9% respectively. Natural gas futures prices, which have been on an upward path since December last year, finished the month up 13.2%.
Metals
Gold futures finished the month up 4.1%, settling at $928/oz. Silver futures for September delivery also strengthened, finishing higher by 3.2%. Platinum and Palladium futures finished the month up 2.8% and 5.9% respectively. Copper futures recouped the May loss, finishing higher by 7.6%.
78
Table of Contents
Agriculturals
Grains continued their rally from the previous months. Virtually all information from USDA and farmers points to great stress in the grain markets. After a wet spring and late plantings for both corn and soybeans, flooding has now destroyed hundreds of thousands of acres of crops in the Midwest. In June, December 2008 futures contracts for corn finished up 20.8% reaching record highs of nearly $8.00 per bushel. Soybean and soybean oil futures also strengthened, finishing up 16.2% and 7.7% respectively. Wheat futures reversed its downward trend and finished the month up 10.5%. Coffee, cocoa and sugar futures also strengthened during the month, finishing up 12.4%, 16.2% and 14.6% respectively. Lean hogs dropped the latter part of June, finishing lower by 10.2%.
July 2008
Interest Rates
Loan finance giants Fannie Mae and Freddie Mac, which own or guarantee about half the $12 trillion U.S. mortgage market, contributed to rising mortgage rates in July, as the mortgage companies’ stock plummeted after fears resurfaced over the lending crisis and that the two companies would need to raise billions of dollars in new capital. Even as policy makers rushed to support Fannie Mae and Freddie Mac, home loan rates approached their highest levels in several years. The FOMC decided to maintain its target for the federal funds rate at 2% as the financial markets remained under considerable stress. The European Central Bank, in contrast, raised its benchmark interest rate a quarter of a percentage point to 4.25% on July 3rd, after concerns about soaring prices for food and fuel. Short-term and mid-term U.S. interest rate futures finished higher in July, while long-term futures finished lower for the month. European interest rate futures across the entire curve gained the latter part of July to finish higher.
Currencies
The U.S. Dollar strengthened against most other major currencies in July. The U.S. Dollar Index finished the month up 1.1 %. The Euro weakened against the U.S. Dollar and finished lower by 1.0%. The Australian Dollar and the Canadian Dollar also weakened against their U.S. counterpart, down 1.7% and 0.2% respectively. The British Pound finished lower by 0.4% against the U.S. Dollar. The Japanese Yen also weakened against the U.S. Dollar, finishing down 1.6%.
Stock Indices
The DJIA finished the month nearly unchanged, up 0.2%. The S&P 500 Index finished the month down 1.0%. The NASDAQ Composite gained 1.4% in July. Stock indices in Europe finished mixed as well. FTSE index futures fell 4.5%, CAC-40 futures finished down 1.3%, and DAX index futures finished higher by 0.5%.
Energy
Energy prices, which had risen sharply since the beginning of the year, dropped precipitously in July. Natural gas futures prices for September delivery finished the month lower by 32.0%. Heating oil futures dropped as well, finishing down by 12.4%. Crude oil and gasoline futures prices for September delivery also weakened, finishing lower by 11.7% and 12.41% respectively.
Metals
Gold futures finished the month down 1.6%, settling at $923/oz. Copper futures for September delivery also weakened, finishing lower by 5.7%. Platinum and palladium futures dropped sharply the latter part of July, finishing down 15.0% and 17.5% respectively.
Agriculturals
Grains prices tumbled in July as the U.S. Dollar strengthened, which lessened the appeal of commodities as a hedge against the weakening currency. In July, December 2008 futures contracts for corn finished down 19.7%. Soybean and soybean oil futures also weakened, finishing down 10.8% and 12.2% respectively. Wheat futures for September delivery finished down 8.7%. Coffee and cocoa futures also weakened during the month, finishing down 9.0% and 10.2% respectively.
79
Table of Contents
August 2008
Interest Rates
The Federal Open Market Committee decided to maintain its target for the federal funds rate at 2% as the financial markets remain under considerable stress. U.S. interest rate futures across the entire curve finished higher in August. Mid-term and long-term European interest rate futures finished higher as well, while short-term European interest rate futures and Eurodollar rate futures finished the month nearly unchanged.
Currencies
The U.S. Dollar continued to strengthen against most other major currencies in August. The U.S. Dollar Index finished the month up 5.7%. The Euro weakened against the U.S. Dollar and finished lower by 6.0%. The British Pound also weakened against the U.S. Dollar, finishing lower by 8.2% for the month. The Australian Dollar and the Canadian Dollar also dropped against their U.S. counterpart, down 9.0% and 3.7% respectively. The Japanese Yen weakened against the U.S. dollar as well, finishing down 0.8%.
Stock Indices
The DJIA finished the month up 1.4%. The S&P 500 Index and the NASDAQ Composite gained as well, finishing up 1.2% and 1.8% respectively for August. Stock indices in Europe finished mixed for the month. FTSE index futures finished higher by 4.7%, CAC-40 futures up 2.0% and DAX index futures finished lower by 1.2%.
Energy
Energy prices have dropped sharply since the beginning of July. Natural gas futures prices for October delivery finished the month lower by 13.9%. Heating oil futures dropped as well, finishing down by 8.6%. Crude oil and gasoline futures prices for October delivery also weakened, finishing lower by 7.3% and 4.3% respectively.
Metals
Gold futures finished the month down 9.5%, settling at $835/oz. Copper futures for September delivery also weakened, finishing lower by 7.0%. Silver, platinum and palladium futures dropped sharply in August, finishing down 23.6%, 15.4% and 20.7% respectively.
Agriculturals
In August, December 2008 futures contracts for corn finished down 3.7%. Soybean and soybean oil futures also weakened, finishing down 5.7% and 8.9% respectively. Wheat futures for December delivery finished down 0.9% and sugar futures for October delivery dropped 8.4% for the month. Rough rice finished the month up 12.2%. Coffee and cocoa futures also strengthened during the month, finishing up 1.8% and 0.2% respectively.
September 2008
Interest Rates
U.S. Treasury officials unveiled an extraordinary takeover of Fannie Mae and Freddie Mac on September 7, putting the government in charge of the two mortgage giants and the $5 trillion in home loans they back. The rescue plan for these two government sponsored enterprises commits the government to provide as much as $100 billion to each company to backstop any shortfalls in capital. On September 17, the Federal Reserve announced that it was taking control of the insurance giant American International Group (“AIG”), in an $85 billion bailout meant to prevent the havoc across international markets that would likely follow the company’s collapse. Struggling to fend off financial market collapse, the Bush administration on September 19, laid out a radical bailout plan to take over a half-trillion dollars or more mortgage backed securities and bad debt from struggling financial institutions. It is the most expensive financial bailout in American history and the most far-reaching government intervention to rescue failing
80
Table of Contents
financial institutions since the Great Depression. The FOMC decided to maintain its target for the federal funds rate at 2% for September as the financial markets remained under considerable stress. Short-term U.S. interest rate futures finished higher in September, while long-term U.S. interest rate futures finished lower for the month. European interest rate futures across the entire curve finished higher for the month.
Currencies
The U.S. Dollar continued to strengthen against most other major currencies in September. The U.S. Dollar Index finished the month up 2.7%. The Euro weakened against the U.S. Dollar and finished lower by 3.9%. The British Pound also weakened against the U.S. Dollar, finishing lower by 2.2% for the month. The Australian Dollar also dropped against its U.S. counterpart, down 7.6%. The Japanese Yen strengthened against the U.S. Dollar, finishing up 2.6%, while the Canadian Dollar finished the month nearly unchanged against the U.S. Dollar.
Stock Indices
After the bailout plan was announced on September 19th, investors sent stocks soaring on Wall Street and around the globe. However, the jump was not enough to off-set the drop the latter part of the month. The DJIA finished the month down 6.0%. The S&P 500 Index and the NASDAQ Composite dropped as well, finishing lower by 9.1% and 12.0% respectively. Stock indices in Europe finished lower as well during the month. FTSE index futures finished down 10.7%, CAC-40 futures finished lower by 8.5% and DAX index futures dropped 8.2%.
Energy
Energy prices continued to drop in September. Crude oil futures for November delivery finished the month down 13.1%. Natural gas futures and gasoline futures prices for November delivery finished the month lower by 11.1% and 12.7% respectively. Heating oil futures dropped as well, finishing lower by 10.1%.
Metals
Gold futures for December delivery jumped the latter part of the month to finish higher by 5.5% finishing at $881/oz. Platinum and palladium futures continued to drop sharply during September, finishing down 31.4% and 33.9% respectively. Since the beginning of July, platinum and palladium futures have dropped more than 50%. Copper and silver futures for December delivery also weakened during the month, finishing lower by 15.0% and 10.4% respectively.
Agriculturals
Most agricultural futures contracts finished lower in September. December 2008 futures contracts for soybean and soybean oil weakened, finishing down 21.1% and 17.9% respectively. Corn and wheat futures for December delivery also dropped, finishing 16.7% and 15.1% respectively. Cotton, coffee and sugar futures for December delivery dropped 18.0%, 10.5% and 6.2%.
Frontier Diversified Series
2009
The Frontier Diversified Series began trading operations on June 9, 2009. The Frontier Diversified Series – Class 1 Net Asset Value lost 1.1% for the period ended September 30, 2009, net of fees and expenses; the Frontier Diversified Series – Class 2 Net Asset Value lost 0.5% for the period ended September 30, 2009, net of fees and expenses.
For the period ended September 30, 2009 the Frontier Diversified Series recorded a net gain on investments of $489,733, net interest of $208,849, and total expenses of $550,844, resulting in a net increase in Owners’ capital from operations of $147,738. The Net Asset Value per Unit, Class 1, decreased from $100.00 at June 8, 2009, to $98.95 as of September 30, 2009. The Net Asset Value per Unit, Class 2, decreased from $100.00 at June 8, 2009, to $99.50 as of September 30, 2009. Total Class 1 subscriptions for the period were $10,410,312. There were no redemptions. Total Class 2 subscriptions for the period were $8,896,064. There were no redemptions. Ending capital at September 30, 2009, was $10,475,231 for Class 1 and $8,978,883 for Class 2.
81
Table of Contents
The Frontier Diversified Series may have both long and short exposure to the Interest Rates, Currencies, Stock Indices, Energies, Metals, and Commodities sectors. See comments above under Market Conditions for Nine Months Ended September 30, 2009, for additional information regarding these sectors.
Sector Attribution for the Frontier Diversified Series
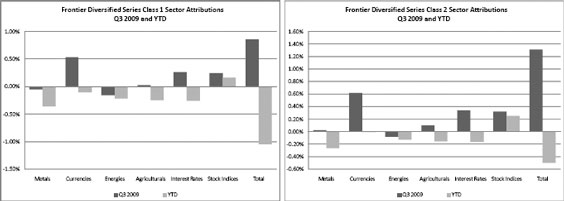
Frontier Dynamic Series
2009
The Frontier Dynamic Series began trading operations on June 9, 2009. The Frontier Dynamic Series – Class 1 Net Asset Value lost 3.4% for the period ended September 30, 2009, net of fees and expenses; the Frontier Dynamic Series – Class 2 Net Asset Value lost 2.9% for the period ended September 30, 2009, net of fees and expenses.
For the period ended September 30, 2009 the Frontier Dynamic Series recorded a net gain on investments of $78,195, net interest of $160,028, and total expenses of $241,663, resulting in a net decrease in Owners’ capital from operations of $3,440. The Net Asset Value per Unit, Class 1, decreased from $100.00 at June 8, 2009, to $96.56 as of September 30, 2009. The Net Asset Value per Unit, Class 2, decreased from $100.00 at June 8, 2009, to $97.09 as of September 30, 2009. Total Class 1 subscriptions for the period were $254,118. There were no redemptions. Total Class 2 subscriptions for the period were $144,200. There were no redemptions. Ending capital at September 30, 2009, was $252,375 for Class 1 and $142,503 for Class 2.
The Frontier Dynamic Series may have both long and short exposure to the Interest Rates, Currencies, Stock Indices, Energies, Metals, and Commodities sectors. See comments above under Market Conditions for Nine Months Ended September 30, 2009, for additional information regarding these sectors.
The Dynamic Series invests in an option market basket of which the underlying investments are not transparent to the Trust. Therefore there are no Sector Attribution charts for the Dynamic Series.
Frontier Long/Short Commodity Series
2009
The Frontier Long/Short Commodity Series – Class 1 Net Asset Value gained 9.8% for the nine months ended September 30, 2009, net of fees and expenses; the Frontier Long/Short Commodity Series – Class 2 Net Asset Value gained 12.2% for the nine months ended September 30, 2009, net of fees and expenses; the Frontier Long/Short Commodity Series – Class 3 Net Asset Value lost 0.1% for the nine months ended September 30, 2009, net of fees
82
Table of Contents
and expenses; the Frontier Long/Short Commodity Series – Class 1a Net Asset Value lost 1.4% for the nine months ended September 30, 2009, net of fees and expenses; the Frontier Long/Short Commodity Series – Class 2a Net Asset Value lost 0.9% for the nine months ended September 30, 2009, net of fees and expenses.
For the nine months ended September 30, 2009, the Frontier Long/Short Commodity Series recorded net gain on investments of $19,081,775, net interest of $936,679, and total expenses of $5,059,308, resulting in a net increase in Owners’ capital from operations of $6,201,418 after non-controlling interests of ($8,757,728). The Net Asset Value per Unit, Class 1, increased from $100.39 at December 31, 2008, to $110.22 as of September 30, 2009. The Net Asset Value per Unit, Class 2, increased from $109.28 at December 31, 2008, to $122.58 as of September 30, 2009. The Net Asset Value per Unit, Class 3, decreased from $122.70 at May 29, 2009, to $122.58 as of September 30, 2009. The Net Asset Value per Unit, Class 1a, decreased from $100.00 at June 8, 2009, to $98.57 as of September 30, 2009. The Net Asset Value per Unit, Class 2a, decreased from $100.00 at June 8, 2009, to $99.09 as of September 30, 2009. Total Class 1 subscriptions and redemptions for the nine months were $7,034,013 and $12,427,347, respectively. Total Class 2 subscriptions and redemptions for the nine months were $3,221,195 and $1,365,434, respectively. Total Class 3 subscriptions and redemptions for the nine months were $6,696,779 and $462,935, respectively. Total Class 1a subscriptions for the nine months were $330,539. There were no redemptions. Total Class 2a subscriptions for the nine months were $287,000. There were no redemptions. Ending capital at September 30, 2009, was $45,829,180 for Class 1, $14,593,785 for Class 2, $6,204,677 for Class 3, $332,195 for Class 1a and $287,686 for Class 2a. Ending capital at December 31, 2008, was $46,525,406 for Class 1 and $11,206,889 for Class 2.
The Frontier Long/Short Commodity Series may have both long and short exposure to the Interest Rates, Currencies, Stock Indices, Energies, Metals, and Commodities sectors, although the majority of the exposure will typically be in the Energies, Metals, and Commodities sectors. See comments above under Market Conditions for Nine Months Ended September 30, 2009, for additional information regarding these sectors.
Sector Attribution for the Frontier Long/Short Commodity Series
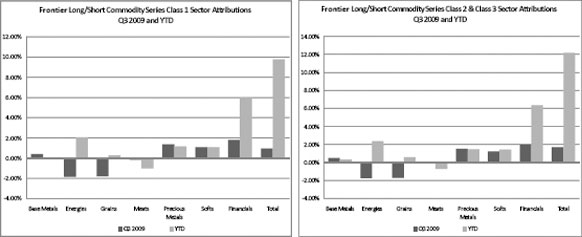
2008
The Long/Short Commodity Series – Class 1 Net Asset Value gained 2.9% for the nine months ended September 30, 2008, net of fees and expenses; the Long/Short Commodity Series – Class 2 Net Asset Value gained 5.2% for the nine months ended September 30, 2008, net of fees and expenses.
For the nine months ended September 30, 2008, the Long/Short Commodity Series recorded net gain on investments of $12,531,194, net interest of $681,270, and total expenses of $3,742,359, resulting in a net decrease in Owners’ capital from operations of $46,703 after non-controlling interests of ($9,516,808). The Net Asset Value per Unit,
83
Table of Contents
Class 1, increased from $101.47 at December 31, 2007, to $104.39 as of September 30, 2008. The Net Asset Value per Unit, Class 2, increased from $107.19 at December 31, 2007, to $112.78 as of September 30, 2008. Total Class 1 subscriptions and redemptions for the nine months were $24,853,677 and $4,356,405, respectively. Total Class 2 subscriptions and redemptions for the nine months were $7,073,727 and $240,913, respectively. Ending capital at September 30, 2008, was $51,589,347 for Class 1 and $10,445,672 for Class 2. Ending capital at December 31, 2007, was $31,092,746 for Class 1 and $3,658,890 for Class 2.
The Long/Short Commodity Series may have both long and short exposure to the Interest Rates, Currencies, Stock Indices, Energies, Metals, and Commodities sectors, although the majority of the exposure will typically be in the Energies, Metals, and Commodities sectors. See comments above under Market Conditions for Nine Months Ended September 30, 2008, for additional information regarding these sectors.
Sector Attribution for the Long/Short Commodity Series
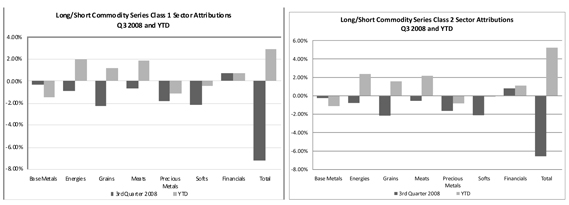
Frontier Masters Series
2009
The Frontier Masters Series began trading operations on June 9, 2009. The Frontier Masters Series – Class 1 Net Asset Value lost 1.7% for the period ended September 30, 2009, net of fees and expenses; the Frontier Masters Series – Class 2 Net Asset Value lost 1.3% for the period ended September 30, 2009, net of fees and expenses.
For the period ended September 30, 2009 the Frontier Masters Series recorded a net gain on investments of $314,648, net interest of $155,405, and total expenses of $388,275, resulting in a net increase in Owners’ capital from operations of $81,778. The Net Asset Value per Unit, Class 1, decreased from $100.00 at June 8, 2009, to $98.32 as of September 30, 2009. The Net Asset Value per Unit, Class 2, decreased from $100.00 at June 8, 2009, to $98.87 as of September 30, 2009. Total Class 1 subscriptions for the period were $4,230,662. There were no redemptions. Total Class 2 subscriptions for the period were $2,540,707. There were no redemptions. Ending capital at September 30, 2009, was $4,273,621 for Class 1 and $2,579,526 for Class 2.
The Frontier Masters Series may have both long and short exposure to the Interest Rates, Currencies, Stock Indices, Energies, Metals, and Commodities sectors. See comments above under Market Conditions for Nine Months Ended September 30, 2009, for additional information regarding these sectors.
84
Table of Contents
Sector Attribution for the Frontier Masters Series
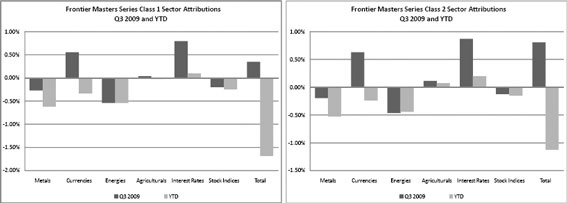
Balanced Series
2009
The Balanced Series – Class 1 Net Asset Value lost 2.2% for the nine months ended September 30, 2009, net of fees and expenses; the Balanced Series – Class 1a Net Asset Value lost 2.6% for the nine months ended September 30, 2009, net of fees and expenses; the Balanced Series – Class 2 Net Asset Value lost 0.1% for the nine months ended September 30, 2009, net of fees and expenses; the Balanced Series – Class 2a Net Asset Value lost 0.4% for the nine months ended September 30, 2009, net of fees and expenses; the Balanced Series – Class 3a Net Asset Value lost 0.9% for the period ended September 30, 2009, net of fees and expenses.
For the nine months ended September 30, 2009, the Balanced Series recorded net gain on investments of $5,408,915, net interest of $707,619, and total expenses of $14,950,141, resulting in a net decrease in Owners’ capital from operations of $7,389,917 after non-controlling interests of $ 1,443,690. The Net Asset Value per Unit, Class 1, decreased from $125.17 at December 31, 2008, to $122.45 at September 30, 2009. For Class 1a, the Net Asset Value per Unit decreased from $112.09 at December 31, 2008, to $109.21 at September 30, 2009. The Net Asset Value per Unit, Class 2, increased from $142.44 at December 31, 2008, to $142.52 at September 30, 2009. For Class 2a, the Net Asset Value per Unit decreased from $121.30 at December 31, 2008, to $120.82 at September 30, 2009. For Class 3a, the Net Asset Value per Unit decreased from $121.97 at June 3, 2009, to $120.82 at September 30, 2009. Total Class 1 subscriptions and redemptions for the nine months were $75,390,578 and $22,615,409, respectively. Total Class 1a subscriptions and redemptions for the nine month period were $3,818,107 and $1,536,131, respectively. Total Class 2 subscriptions and redemptions for the nine months were $25,917,174 and $7,317,608, respectively. Total Class 2a subscriptions and redemptions for the nine month period were $1,802,212 and $184,699, respectively. Total Class 3a subscriptions and redemptions for the period were $687,282 and $24,851, respectively. Ending capital at September 30, 2009, was $302,366,242 for Class 1, $10,129,451 for Class 1a, $85,578,099 for Class 2, $3,485,156 for Class 2a and $665,797 for Class 3a. At December 31, 2008, ending capital was $256,550,829 for Class 1, $8,136,165 for Class 1a, $67,109,662 for Class 2 and $1,886,351 for Class 2a.
The Balanced Series may have both long and short exposure to the Interest Rates, Currencies, Stock Indices, Energies, Metals, and Commodities sectors. See comments above under Market Conditions for Nine Months Ended September 30, 2009, for additional information regarding these sectors.
85
Table of Contents
Sector Attribution for the Balanced Series
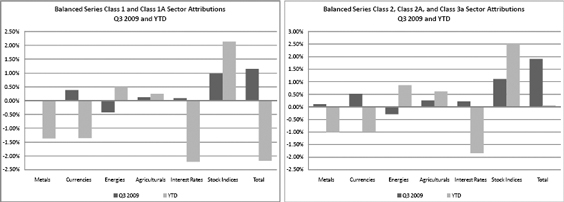
2008
The Balanced Series – Class 1 Net Asset Value gained 11.4% for the nine months ended September 30, 2008, net of fees and expenses; the Balanced Series – Class 1a Net Asset Value gained 11.3% for the nine months ended September 30, 2008, net of fees and expenses; the Balanced Series – Class 2 Net Asset Value gained 14.0% for the nine months ended September 30, 2008, net of fees and expenses; the Balanced Series – Class 2a Net Asset Value gained 13.8% for the nine months ended September 30, 2008, net of fees and expenses.
For the nine months ended September 30, 2008, the Balanced Series recorded net gain on investments of $53,573,074, net interest of $1,030,977, and total expenses of $16,074,174, resulting in a net increase in Owners’ capital from operations of $28,865,812 after non-controlling interests of ($ 9,664,065). The Net Asset Value per Unit, Class 1, increased from $101.46 at December 31, 2007, to $113.04 at September 30, 2008. For Class 1a, the Net Asset Value per Unit increased from $90.90 at December 31, 2007, to $101.18 at September 30, 2008. The Net Asset Value per Unit, Class 2, increased from $112.00 at December 31, 2007, to $127.66 September 30, 2008. For Class 2a, the Net Asset Value per Unit increased from $95.47 at December 31, 2007, to $108.67 at September 30, 2008. Total Class 1 subscriptions and redemptions for the nine months were $29,380,651 and $37,572,590, respectively. Total Class 1a subscriptions and redemptions for the nine month period were $839,065 and $755,956, respectively. Total Class 2 subscriptions and redemptions for the nine months were $7,116,211 and $7,149,357, respectively. Total Class 2a subscriptions and redemptions for the nine month period were $575,073 and $130,400, respectively. Ending capital at September 30, 2008, was $218,322,458 for Class 1, $6,342,839 for Class 1a, $52,232,182 for Class 2 and $1,855,876 for Class 2a. At December 31, 2007, ending capital was $204,740,748 for Class 1, $5,638,500 for Class 1a, $45,954,042 for Class 2 and $1,251,556 for Class 2a.
The Balanced Series may have both long and short exposure to the Interest Rates, Currencies, Stock Indices, Energies, Metals, and Commodities sectors. See comments above under Market Conditions for Nine Months Ended September 30, 2008, for additional information regarding these sectors.
86
Table of Contents
Sector Attribution for the Balanced Series
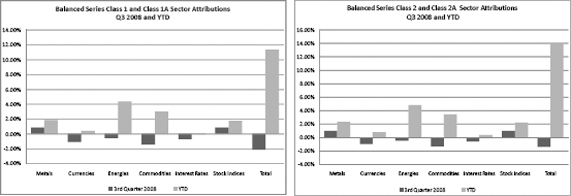
Campbell/Graham/Tiverton Series
2009
The Campbell/Graham/Tiverton Series – Class 1 Net Asset Value lost 4.7% for the nine months ended September 30, 2009, net of fees and expenses; the Campbell/Graham/Tiverton Series – Class 2 Net Asset Value lost 2.6% for the nine months ended September 30, 2009, net of fees and expenses.
For the nine months ended September 30, 2009, the Campbell/Graham/Tiverton Series recorded net loss on investments of $1,556,324, net interest of $267,239, and total expenses of $3,819,353, resulting in a net decrease in Owners’ capital from operations of $3,771,912 after non-controlling interests of $1,336,526. The Net Asset Value per Unit, Class 1, decreased from $110.54 at December 31, 2008, to $105.29 as of September 30, 2009. The Net Asset Value per Unit, Class 2, decreased from $124.14 at December 31, 2008, to $120.92 as of September 30, 2009. Total Class 1 subscriptions for the nine months ended September 30, 2009, were $10,892,203 and redemptions were $5,522,023. Total Class 2 subscriptions and redemptions for the nine months ended September 30, 2009, were $4,025,676, and $1,093,173, respectively. Ending capital at September 30, 2009, was $71,804,566 for Class 1 and $10,491,134 for Class 2. Ending capital at December 31, 2008, was $69,957,155 for Class 1 and $7,807,774 for Class 2.
The Campbell/Graham/Tiverton Series may have both long and short exposure to the Interest Rates, Currencies, Stock Indices, Energies, Metals, and Commodities sectors. See comments above under Market Conditions for Nine Months Ended September 30, 2009, for additional information regarding these sectors.
87
Table of Contents
Sector Attribution for the Campbell/Graham/Tiverton Series
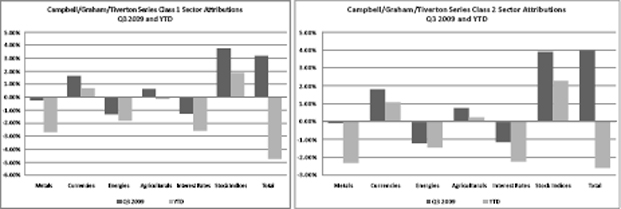
2008
The Campbell/Graham/Tiverton Series – Class 1 Net Asset Value gained 6.1% for the nine months ended September 30, 2008, net of fees and expenses; the Campbell/Graham/Tiverton Series – Class 2 Net Asset Value gained 8.5% for the nine months ended September 30, 2008, net of fees and expenses.
For the nine months ended September 30, 2008, the Campbell/Graham/Tiverton Series recorded net gain on investments of $9,421,439, net interest of $236,839, and total expenses of $4,054,096, resulting in a net increase in Owners’ capital from operations of $3,783,455 after non-controlling interests of ($1,820,727). The Net Asset Value per Unit, Class 1, increased from $91.90 at December 31, 2007, to $97.46 as of September 30, 2008. The Net Asset Value per Unit, Class 2, increased from $100.20 at December 31, 2007, to $108.68 as of September 30, 2008. Total Class 1 subscriptions for the nine months ended September 30, 2008, were $9,952,791 and redemptions were $9,401,137. Total Class 2 subscriptions and redemptions for the nine months ended September 30, 2008, were $1,207,453, and $1,188,714, respectively. Ending capital at September 30, 2008, was $59,386,945 for Class 1 and $6,317,807 for Class 2. Ending capital at December 31, 2007, was $55,530,902 for Class 1 and $5,820,002 for Class 2.
The Campbell/Graham/Tiverton Series may have both long and short exposure to the Interest Rates, Currencies, Stock Indices, Energies, Metals, and Commodities sectors. See comments above under Market Conditions for Nine Months Ended September 30, 2008, for additional information regarding these sectors.
88
Table of Contents
Sector Attribution for the Campbell/Graham Series
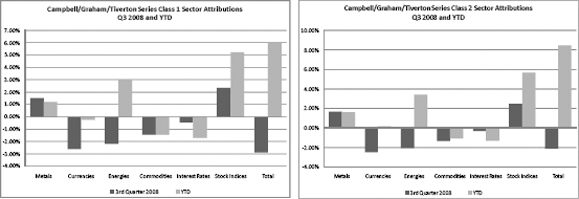
Currency Series
2009
The Currency Series – Class 1 Net Asset Value lost 12.8% for the nine months ended September 30, 2009, net of fees and expenses; the Currency Series – Class 2 Net Asset Value lost 10.8% for the nine months ended September 30, 2009, net of fees and expenses.
For the nine months ended September 30, 2009, the Currency Series recorded net loss on investments of $1,376,752, net interest of $56,439, and total expenses of $467,554, resulting in a net decrease in Owners’ capital from operations of $1,787,867. The Net Asset Value per Unit, Class 1, decreased from $96.19 at December 31, 2008, to $83.87 as of September 30, 2009. The Net Asset Value per Unit, Class 2, decreased from $109.30 at December 31, 2008, to $97.47 as of September 30, 2009. Total Class 1 subscriptions and redemptions for the nine months ending September 30, 2009 were $551,301, and $1,698,922, respectively. Total Class 2 subscriptions and redemptions for the nine months ending September 30, 2009, was $82,125 and $169,080, respectively. Ending capital at September 30, 2009, was $9,277,783 for Class 1 and $2,546,559 for Class 2. Ending capital at December 31, 2008, was $11,900,185 for Class 1 and $2,946,600 for Class 2.
The Currency Series may have both long and short exposure to the Currencies sector only. See comments above under Market Conditions for Nine Months Ended September 30, 2009, for additional information regarding these sectors.
Because all returns are from the Currencies sector, there are no Sector Attribution charts for the Currency Series.
2008
The Currency Series – Class 1 Net Asset Value lost 4.9% for the nine months ended September 30, 2008, net of fees and expenses; the Currency Series – Class 2 Net Asset Value lost 2.8% for the nine months ended September 30, 2008, net of fees and expenses.
For the nine months ended September 30, 2008, the Currency Series recorded net loss on investments of $481,516, net interest of $68,817, and total expenses of $471,482, resulting in a net decrease in Owners’ capital from operations of $884,181. The Net Asset Value per Unit, Class 1, decreased from $100.66 at December 31, 2007, to $95.71 as of September 30, 2008. The Net Asset Value per Unit, Class 2, decreased from $111.00 at December 31, 2007, to $107.94 as of September 30, 2008. Total Class 1 subscriptions and redemptions for the nine months ending September 30, 2008 were $4,127,682, and $1,256,918, respectively. Total Class 2 subscriptions and redemptions for
89
Table of Contents
the nine months ending September 30, 2008, were $2,149,750 and $261,786, respectively. Ending capital at September 30, 2008, was $11,966,129 for Class 1 and $2,500,424 for Class 2. Ending capital at December 31, 2007, was $9,791,812 for Class 1 and $800,194 for Class 2.
The Currency Series may have both long and short exposure to the Currencies sector only. See comments above under Market Conditions for Nine Months Ended September 30, 2008, for additional information regarding these sectors.
Because all returns are from the Currencies sector, there are no Sector Attribution charts for the Currency Series.
Long Only Commodity Series
2009
The Long Only Commodity Series – Class 1 Net Asset Value gained 10.2% for the nine months ended September 30, 2009, net of fees and expenses; the Long Only Commodity Series – Class 2 Net Asset Value gained 11.6% for the nine months ended September 30, 2009, net of fees and expenses.
For the nine months ended September 30, 2009, the Long Only Commodity Series recorded net gain on investments of $492,054, net interest of $55,508, and total expenses of $104,311, resulting in a net increase in Owners’ capital from operations of $443,251. The Net Asset Value per Unit, Class 1, increased from $70.31 at December 31, 2008 to $77.48 as of September 30, 2009. The Net Asset Value per Unit, Class 2, increased from $74.46 at December 31, 2008, to $83.10 as of September 30, 2009. Total Class 1 subscriptions and redemptions for the nine months were $409,118 and $481,572, respectively. Total Class 2 subscriptions and redemptions for the nine months were $86,800 and $87,025, respectively. Ending capital at September 30, 2009, was $3,528,604 for Class 1 and $884,441 for Class 2. Ending capital at December 31, 2008, was $3,254,226 for Class 1 and $788,247 for Class 2.
The Long Only Commodity Series may have long-only exposure in the Energies, Metals, and Commodities sectors. See comments above under Market Conditions for Nine Months Ended September 30, 2009, for additional information regarding these sectors.
The Long Only Commodity Series invests approximately equally in the Jefferies Commodity Performance Index and the Reuters/Jefferies CRB Index. There are no Sector Attribution charts for the Long Only Commodity Series.
2008
The Long Only Commodity Series – Class 1 Net Asset Value lost 2.2% for the nine months ended September 30, 2008, net of fees and expenses; the Long Only Commodity Series – Class 2 Net Asset Value lost 0.7% for the nine months ended September 30, 2008, net of fees and expenses.
For the nine months ended September 30, 2008, the Long Only Commodity Series recorded net loss on investments of $342,421, net interest of $91,076, and total expenses of $174,552, resulting in a net decrease in Owners’ capital from operations of $425,897. The Net Asset Value per Unit, Class 1, decreased from $110.79 at December 31, 2007 to $108.34 as of September 30, 2008. The Net Asset Value per Unit, Class 2, decreased from $115.04 at December 31, 2007, to $114.21 as of September 30, 2008. Total Class 1 subscriptions and redemptions for the nine months were $1,931,482 and $851,824, respectively. Total Class 2 subscriptions and redemptions for the nine months were $901,500 and $24,534, respectively. Ending capital at September 30, 2008, was $5,559,860 for Class 1 and $1,000,935 for Class 2. Ending capital at December 31, 2007, was $4,730,889 for Class 1 and $299,179 for Class 2.
The Long Only Commodity Series may have long-only exposure in the Energies, Metals, and Commodities sectors. See comments above under Market Conditions for Nine Months Ended September 30, 2008, for additional information regarding these sectors.
The Long Only Commodity Series invests approximately equally in the Jefferies Commodity Performance Index and the Reuters/Jefferies CRB Index. There are no Sector Attribution charts for the Long Only Commodity Series.
90
Table of Contents
Managed Futures Index Series
2009
The Managed Futures Index Series – Class 1 Net Asset Value lost 10.9% for the nine months ended September 30, 2009, net of fees and expenses; the Managed Futures Index Series – Class 2 Net Asset Value lost 9.6% for the nine months ended September 30, 2009, net of fees and expenses.
For the nine months ended September 30, 2009 the Managed Futures Index Series recorded a net loss on investments of $342,665, net interest of $51,136, and total expenses of $103,032, resulting in a net decrease in Owners’ capital from operations of $394,561. The Net Asset Value per Unit, Class 1, decreased from $132.18 at December 31, 2008, to $117.73 as of September 30, 2009. The Net Asset Value per Unit, Class 2, decreased from $139.70 at December 31, 2008, to $126.24 as of September 30, 2009. Total Class 1 subscriptions and redemptions for the nine months were $708,699 and $720,251, respectively. Total Class 2 subscriptions and redemptions for the nine months were $1,271,138 and $7,431, respectively. Ending capital at September 30, 2009, was $2,021,313 for Class 1 and $2,239,332 for Class 2. Ending capital at December 31, 2008, was $2,266,977 for Class 1 and $1,136,074 for Class 2.
The Managed Futures Index Series may have both long and short exposure to the Interest Rates, Currencies, Stock Indices, Energies, Metals, and Commodities sectors. See comments above under Market Conditions for Nine Months Ended September 30, 2009, for additional information regarding these sectors.
Sector Attribution for the Managed Futures Index Series
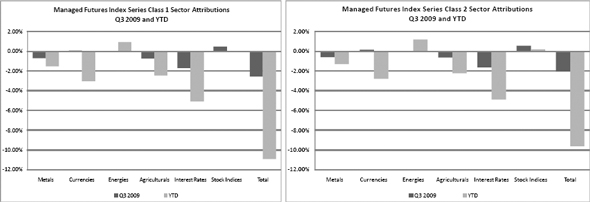
2008
The Managed Futures Index Series – Class 1 Net Asset Value gained 2.2% for the nine months ended September 30, 2008, net of fees and expenses; the Managed Futures Index Series – Class 2 Net Asset Value gained 3.6% for the nine months ended September 30, 2008, net of fees and expenses.
For the nine months ended September 30, 2008 the Managed Futures Index Series recorded a net gain on investments of $2,942, net interest of $20,959, and total expenses of $43,838, resulting in a net decrease in Owners’ capital from operations of $19,937. The Net Asset Value per Unit, Class 1, increased from $100.59 at December 31, 2007, to $102.76 as of September 30, 2008. The Net Asset Value per Unit, Class 2, increased from $104.42 at December 31, 2007, to $108.21 as of September 30, 2008. Total Class 1 subscriptions and redemptions for the nine months were $1,280,605 and $350,116, respectively. Total Class 2 subscriptions and redemptions for the nine months were $435,930 and $15,877, respectively. Ending capital at September 30, 2008, was $1,534,248 for Class 1 and $753,806 for Class 2. Ending capital at December 31, 2007, was $621,740 for Class 1 and $335,709 for Class 2.
91
Table of Contents
The Managed Futures Index Series may have both long and short exposure to the Interest Rates, Currencies, Stock Indices, Energies, Metals, and Commodities sectors. See comments above under Market Conditions for Nine Months Ended September 30, 2008, for additional information regarding these sectors.
Sector Attribution for the Managed Futures Index Series
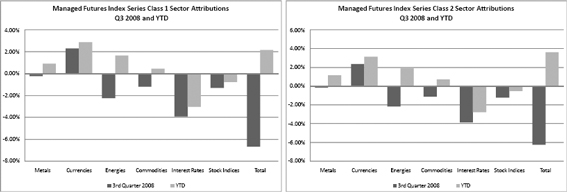
Winton Series
2009
The Winton Series – Class 1 Net Asset Value lost 9.4% for the nine months ended September 30, 2009, net of fees and expenses; the Winton Series – Class 2 Net Asset Value lost 7.4% for the nine months ended September 30, 2009, net of fees and expenses.
For the nine months ended September 30, 2009, the Winton Series recorded net loss on investments of $8,377,862, net interest of $296,808, and total expenses of $2,533,310, resulting in a net decrease in Owners’ capital from operations of $6,547,371 after non-controlling interests of $4,066,993. The Net Asset Value per Unit, Class 1, decreased from $130.41 at December 31, 2008, to $118.12 as of September 30, 2009. The Net Asset Value per Unit, Class 2, decreased from $140.04 at December 31, 2008, to $129.62 as of September 30, 2009. Total Class 1 subscriptions for the nine months were $220,835 and redemptions were $5,360,163. Total Class 2 subscriptions and redemptions for the nine month period were $200,000, and $742,864, respectively. Ending capital at September 30, 2009, was $51,465,175 for Class 1 and $10,334,288 for Class 2. Ending capital at December 31, 2008, was $62,283,659 for Class 1 and $11,743,367 for Class 2.
The Winton Series may have both long and short exposure to the Interest Rates, Currencies, Stock Indices, Energies, Metals, and Commodities sectors. See comments above under Market Conditions for Nine Months Ended September 30, 2009, for additional information regarding these sectors.
92
Table of Contents
Sector Attribution for the Winton Series
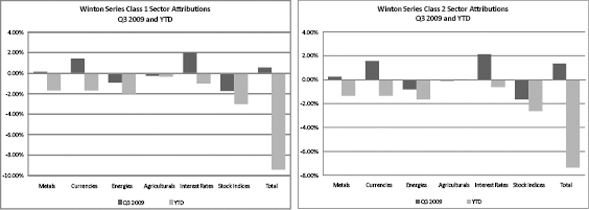
2008
The Winton Series – Class 1 Net Asset Value gained 3.5% for the nine months ended September 30, 2008, net of fees and expenses; the Winton Series – Class 2 Net Asset Value gained 5.8% for the nine months ended September 30, 2008, net of fees and expenses.
For the nine months ended September 30, 2008, the Winton Series recorded net gain on investments of $2,540,101, net interest of $240,620, and total expenses of $4,083,913, resulting in a net increase in Owners’ capital from operations of $1,036,414 after non-controlling interests of 2,339,606. The Net Asset Value per Unit, Class 1, increased from $113.83 at December 31, 2007, to $117.78 as of September 30, 2008. The Net Asset Value per Unit, Class 2, increased from $118.61 at December 31, 2007, to $125.52 as of September 30, 2008. Total Class 1 subscriptions for the nine months were $25,371,264 and redemptions were $3,262,611. Total Class 2 subscriptions and redemptions for the nine month period were $0, and $276,678, respectively. Ending capital at September 30, 2008, was $58,196,947 for Class 1 and $10,710,603 for Class 2. Ending capital at December 31, 2007, was $35,664,260 for Class 1 and $10,374,901 for Class 2.
The Winton Series may have both long and short exposure to the Interest Rates, Currencies, Stock Indices, Energies, Metals, and Commodities sectors. See comments above under Market Conditions for Nine Months Ended September 30, 2008, for additional information regarding these sectors.
Sector Attribution for the Winton Series
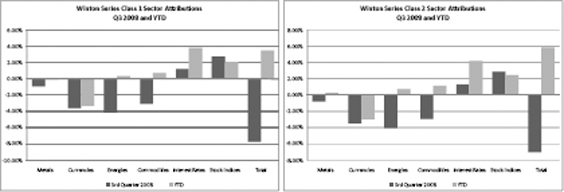
93
Table of Contents
Winton/Graham Series
2009
The Winton/Graham Series – Class 1 Net Asset Value lost 4.5% for the nine months ended September 30, 2009, net of fees and expenses; the Winton/Graham Series – Class 2 Net Asset Value lost 2.3% for the nine months ended September 30, 2009, net of fees and expenses.
For the nine months ended September 30, 2009, the Winton/Graham Series recorded net gain on investments of $3,050,072, net interest of $199,524, and total expenses of $2,583,867, resulting in a net decrease in Owners’ capital from operations of $2,451,879, after non-controlling interest of ($3,081,608). The Net Asset Value per Unit, Class 1, decreased from $ 116.18 at December 31, 2008, to $110.94 as of September 30, 2009. The Net Asset Value per Unit, Class 2, decreased from $131.49 at December 31, 2008, to $128.44 as of September 30, 2009. Total Class 1 subscriptions and redemptions for the nine months were $20,167,922 and $4,094,963, respectively. Total Class 2 subscriptions and redemptions for the nine months were $360,401 and $1,565,441, respectively. Ending capital at September 30, 2009, was $49,794,837 for Class 1 and $12,852,432 for Class 2. Ending capital at December 31, 2008, was $35,760,835 for Class 1 and $14,434,394 for Class 2.
The Winton/Graham Series may have both long and short exposure to the Interest Rates, Currencies, Stock Indices, Energies, Metals, and Commodities sectors. See comments above under Market Conditions for Nine Months Ended September 30, 2009, for additional information regarding these sectors.
Sector Attribution for the Winton/Graham Series
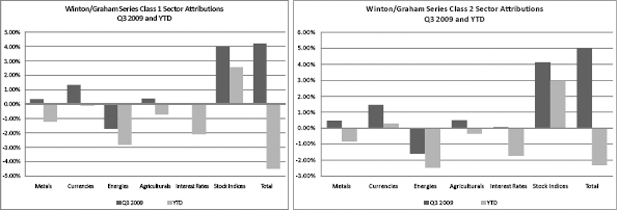
2008
The Winton/Graham Series – Class 1 Net Asset Value gained 9.7% for the nine months ended September 30, 2008, net of fees and expenses; the Winton/Graham Series – Class 2 Net Asset Value gained 12.2% for the nine months ended September 30, 2008, net of fees and expenses.
For the nine months ended September 30, 2008, the Winton/Graham Series recorded net gain on investments of $1,106,158, net interest of $47,920, and total expenses of $1,102,623, resulting in a net increase in Owners’ capital from operations of $51,455. The Net Asset Value per Unit, Class 1, increased from $ 95.04 at December 31, 2007, to $104.30 as of September 30, 2008. The Net Asset Value per Unit, Class 2, increased from $104.37 at December 31, 2007, to $117.15 as of September 30, 2008. Total Class 1 subscriptions and redemptions for the nine months were $18,543,048 and $909,697, respectively. Total Class 2 subscriptions and redemptions for the nine months were $9,144,068 and $45,673, respectively. Ending capital at September 30, 2008, was $23,765,244 for Class 1 and $10,886,940 for Class 2. Ending capital at December 31, 2007, was $6,060,207 for Class 1 and $1,808,776 for Class 2.
94
Table of Contents
The Winton/Graham Series may have both long and short exposure to the Interest Rates, Currencies, Stock Indices, Energies, Metals, and Commodities sectors. See comments above under Market Conditions for Nine Months Ended September 30, 2008, for additional information regarding these sectors.
Sector Attribution for the Winton/Graham Series
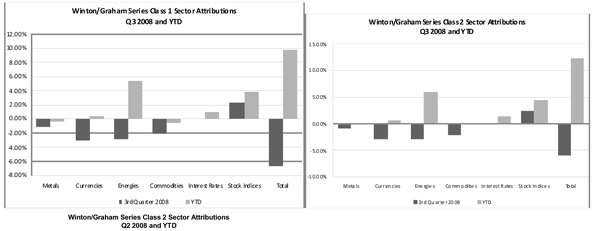
Contractual Obligations
None.
| ITEM 3. | QUANTITATIVE AND QUALITATIVE DISCLOSURES ABOUT MARKET RISK |
The Series are speculative commodity pools. The market sensitive instruments which are held by the Trading Companies in which the Series are invested are acquired for speculative trading purposes, and all or a substantial amount of the Series’ assets are subject to the risk of trading loss. Unlike an operating company, the risk of market sensitive instruments is integral, not incidental, to the Series’ main line of business.
Market movements result in frequent changes in the fair market value of each Trading Company’s open positions and, consequently, in each Series of the Trust’s earnings and cash flow. The Trading Companies’ and consequently the Series’ market risk is influenced by a wide variety of factors, including the level and volatility of exchange rates, interest rates, equity price levels, the market value of financial instruments and contracts, the diversification effects among the open positions and the liquidity of the markets in which trades are made.
Each Trading Company rapidly acquires and liquidates both long and short positions in a wide range of different markets. Consequently, it is not possible to predict how a particular future market scenario will affect performance, and the past performance for any Series is not necessarily indicative of the future results of such Series.
The Trading Companies’ and consequently the Series’ primary market risk exposures as well as the strategies used and to be used by the Trading Advisors for managing such exposures are subject to numerous uncertainties, contingencies and risks, any one of which could cause the actual results of the Trust’s and the Managing Owner’s risk controls to differ materially from the objectives of such strategies. Government interventions, defaults and expropriations, illiquid markets, the emergence of dominant fundamental factors, political upheavals, changes in historical price relationships, an influx of new market participants, increased regulation and many other factors could result in material losses as well as in material changes to the risk exposures and the risk management strategies of the Trading Companies and consequently the Trust. There can be no assurance that the Trading Companies’ current market exposure and/or risk management strategies will not change materially or that any such strategies will be effective in either the short- or long-term. Investors must be prepared to lose all or substantially all of their investment in a Series.
95
Table of Contents
Quantitative Market Risk
Trading Risk
The Series’ approximate risk exposure in the various market sectors traded by its trading advisors is quantified below in terms of value at risk. Due to the Series’ mark-to-market accounting, any loss in the fair value of the Series’ (through the Trading Companies) open positions is directly reflected in the Series’ earnings, realized or unrealized.
Exchange maintenance margin requirements have been used by the Trust as the measure of its value at risk. Maintenance margin requirements are set by exchanges to equal or exceed the maximum losses reasonably expected to be incurred in the fair value of any given contract in 95% to 99% of any one-day interval. The maintenance margin levels are established by brokers, dealers and exchanges using historical price studies as well as an assessment of current market volatility and economic fundamentals to provide a probabilistic estimate of the maximum expected near-term one-day price fluctuation. Maintenance margin has been used rather than the more generally available initial margin, because initial margin includes a credit risk component that is not relevant to value at risk.
In the case of market sensitive instruments that are not exchange-traded, including currencies and some energy products and metals, the margin requirements for the equivalent futures positions have been used as value at risk. In those cases in which a futures-equivalent margin is not available, dealers’ margins have been used.
In the case of contracts denominated in foreign currencies, the value at risk figures include foreign currency margin amounts converted into U.S. Dollars with an incremental adjustment to reflect the exchange rate risk inherent to the Series, which is valued in U.S. Dollars, in expressing value at risk in a functional currency other than U.S. Dollars.
In quantifying each Series’ value at risk, 100% positive correlation in the different positions held in each market risk category has been assumed. Consequently, the margin requirements applicable to the open contracts have simply been aggregated to determine each trading category’s aggregate value at risk. The diversification effects resulting from the fact that the Series’ positions held through the Trading Companies are rarely, if ever, 100% positively correlated have not been reflected.
Value at Risk by Market Sectors
The following table presents the trading value at risk associated with each Series’ exposure to open positions (as held by the Trading Companies) by market sector as of September 30, 2009 and December 31, 2008. All open position trading risk exposures of the Series have been included in calculating the figures set forth below.
96
Table of Contents
Frontier Diversified Series: (1)
| September 30, 2009 | December 31, 2008 | |||||||||||
| MARKET SECTOR |
VALUE AT RISK |
% OF TOTAL CAPITALIZATION |
VALUE AT RISK |
% OF TOTAL CAPITALIZATION |
||||||||
| Interest Rates |
$ | 733,957 | 1.4 | % | $ | — | 0 | % | ||||
| Currencies |
$ | 569,513 | 1.0 | % | $ | — | 0 | % | ||||
| Stock Indices |
$ | 998,204 | 1.8 | % | $ | — | 0 | % | ||||
| Metals |
$ | 235,848 | 0.4 | % | $ | — | 0 | % | ||||
| Agriculturals/Softs |
$ | 489,438 | 0.9 | % | $ | — | 0 | % | ||||
| Energy |
$ | 673,544 | 1.2 | % | $ | — | 0 | % | ||||
| Total: |
$ | 3,700,504 | 6.7 | % | $ | — | 0 | % | ||||
Frontier Dynamic Series: (2)
| September 30, 2009 | December 31, 2008 | |||||||||||
| MARKET SECTOR |
VALUE AT RISK |
% OF TOTAL CAPITALIZATION |
VALUE AT RISK |
% OF TOTAL CAPITALIZATION |
||||||||
| Interest Rates |
$ | — | 0 | % | $ | — | 0 | % | ||||
| Currencies |
$ | — | 0 | % | $ | — | 0 | % | ||||
| Stock Indices |
$ | — | 0 | % | $ | — | 0 | % | ||||
| Metals |
$ | — | 0 | % | $ | — | 0 | % | ||||
| Agriculturals/Softs |
$ | — | 0 | % | $ | — | 0 | % | ||||
| Energy |
$ | — | 0 | % | $ | — | 0 | % | ||||
| Total: |
$ | — | 0 | % | $ | — | 0 | % | ||||
Frontier Long/Short Commodity Series:
| September 30, 2009 | December 31, 2008 | |||||||||||
| MARKET SECTOR |
VALUE AT RISK |
% OF TOTAL CAPITALIZATION |
VALUE AT RISK |
% OF TOTAL CAPITALIZATION |
||||||||
| Interest Rates |
$ | 411,211 | 0.6 | % | $ | 190,975 | 0.3 | % | ||||
| Currencies |
$ | 180,851 | 0.3 | % | $ | 215,085 | 0.4 | % | ||||
| Stock Indices |
$ | 174,839 | 0.3 | % | $ | 99,892 | 0.2 | % | ||||
| Metals |
$ | 548,435 | 0.8 | % | $ | 1,217,781 | 2.1 | % | ||||
| Agriculturals/Softs |
$ | 3,915,056 | 5.8 | % | $ | 2,210,340 | 3.8 | % | ||||
| Energy |
$ | 9,441,960 | 14.0 | % | $ | 1,094,515 | 1.9 | % | ||||
| Total: |
$ | 14,672,352 | 21.8 | % | $ | 5,028,588 | 8.7 | % | ||||
97
Table of Contents
Frontier Masters Series: (3)
| September 30, 2009 | December 31, 2008 | |||||||||||
| MARKET SECTOR |
VALUE AT RISK |
% OF TOTAL CAPITALIZATION |
VALUE AT RISK |
% OF TOTAL CAPITALIZATION |
||||||||
| Interest Rates |
$ | 520,461 | 1.5 | % | $ | — | 0 | % | ||||
| Currencies |
$ | 407,018 | 1.2 | % | $ | — | 0 | % | ||||
| Stock Indices |
$ | 727,591 | 2.1 | % | $ | — | 0 | % | ||||
| Metals |
$ | 147,795 | 0.4 | % | $ | — | 0 | % | ||||
| Agriculturals/Softs |
$ | 190,797 | 0.6 | % | $ | — | 0 | % | ||||
| Energy |
$ | 82,090 | 0.2 | % | $ | — | 0 | % | ||||
| Total: |
$ | 2,075,752 | 6.0 | % | $ | — | 0 | % | ||||
98
Table of Contents
Balanced Series: (4), (5)
| September 30, 2009 | December 31, 2008 | |||||||||||
| MARKET SECTOR |
VALUE AT RISK |
% OF TOTAL CAPITALIZATION |
VALUE AT RISK |
% OF TOTAL CAPITALIZATION |
||||||||
| Interest Rates |
$ | 8,288,006 | 2.1 | % | $ | 2,002,489 | 0.6 | % | ||||
| Currencies |
$ | 6,179,374 | 1.5 | % | $ | 3,124,541 | 0.9 | % | ||||
| Stock Indices |
$ | 13,471,074 | 3.3 | % | $ | 5,250,263 | 1.6 | % | ||||
| Metals |
$ | 3,009,331 | 0.7 | % | $ | 355,150 | 0.1 | % | ||||
| Agriculturals/Softs |
$ | 5,814,903 | 1.4 | % | $ | 1,553,216 | 0.5 | % | ||||
| Energy |
$ | 8,198,847 | 2.0 | % | $ | 624,306 | 0.2 | % | ||||
| Total: |
$ | 44,961,535 | 11.0 | % | $ | 12,909,965 | 3.9 | % | ||||
Campbell/Graham/Tiverton Series:
| September 30, 2009 | December 31, 2008 | |||||||||||
| MARKET SECTOR |
VALUE AT RISK |
% OF TOTAL CAPITALIZATION |
VALUE AT RISK |
% OF TOTAL CAPITALIZATION |
||||||||
| Interest Rates |
$ | 4,086,802 | 5.0 | % | $ | 828,192 | 1.1 | % | ||||
| Currencies |
$ | 4,104,737 | 5.0 | % | $ | 1,067,847 | 1.4 | % | ||||
| Stock Indices |
$ | 2,739,344 | 3.3 | % | $ | 915,299 | 1.2 | % | ||||
| Metals |
$ | 471,061 | 0.6 | % | $ | 68,164 | 0.1 | % | ||||
| Agriculturals/Softs |
$ | 1,064,443 | 1.3 | % | $ | 199,871 | 0.3 | % | ||||
| Energy |
$ | 236,637 | 0.3 | % | $ | 88,512 | 0.1 | % | ||||
| Total: |
$ | 12,703,024 | 15.5 | % | $ | 3,167,885 | 4.2 | % | ||||
Currency Series: (6)
| September 30, 2009 | December 31, 2008 | |||||||||||
| MARKET SECTOR |
VALUE AT RISK |
% OF TOTAL CAPITALIZATION |
VALUE AT RISK |
% OF TOTAL CAPITALIZATION |
||||||||
| Interest Rates |
$ | — | 0 | % | $ | — | 0 | % | ||||
| Currencies |
$ | 210,581 | 0.8 | % | $ | 181,098 | 1.2 | % | ||||
| Stock Indices |
$ | — | 0 | % | $ | — | 0 | % | ||||
| Metals |
$ | — | 0 | % | $ | — | 0 | % | ||||
| Agriculturals/Softs |
$ | — | 0 | % | $ | — | 0 | % | ||||
| Energy |
$ | — | 0 | % | $ | — | 0 | % | ||||
| Total: |
$ | 210,581 | 0.8 | % | $ | 181,098 | 1.2 | % | ||||
99
Table of Contents
Long Only Commodity Series:
| September 30, 2009 | December 31, 2008 | |||||||||||
| MARKET SECTOR |
VALUE AT RISK |
% OF TOTAL CAPITALIZATION |
VALUE AT RISK |
% OF TOTAL CAPITALIZATION |
||||||||
| Interest Rates |
$ | — | 0.0 | % | $ | — | 0.0 | % | ||||
| Currencies |
$ | — | 0.0 | % | $ | — | 0.0 | % | ||||
| Stock Indices |
$ | — | 0.0 | % | $ | — | 0.0 | % | ||||
| Metals |
$ | 108,000 | 2.4 | % | $ | 105,600 | 2.6 | % | ||||
| Agriculturals/Softs |
$ | 153,000 | 3.4 | % | $ | 149,600 | 3.7 | % | ||||
| Energy |
$ | 189,000 | 4.2 | % | $ | 184,800 | 4.6 | % | ||||
| Total: |
$ | 450,000 | 10.0 | % | $ | 440,000 | 10.9 | % | ||||
Managed Futures Index Series:
| September 30, 2009 | December 31, 2008 | |||||||||||
| MARKET SECTOR |
VALUE AT RISK |
% OF TOTAL CAPITALIZATION |
VALUE AT RISK |
% OF TOTAL CAPITALIZATION |
||||||||
| Interest Rates |
$ | 188,557 | 4.4 | % | $ | 87,004 | 2.6 | % | ||||
| Currencies |
$ | 191,017 | 4.5 | % | $ | 85,655 | 2.5 | % | ||||
| Stock Indices |
$ | 39,609 | 0.9 | % | $ | 14,610 | 0.4 | % | ||||
| Metals |
$ | 23,730 | 0.6 | % | $ | — | 0.0 | % | ||||
| Agriculturals/Softs |
$ | 34,276 | 0.8 | % | $ | 17,047 | 0.5 | % | ||||
| Energy |
$ | 21,092 | 0.5 | % | $ | — | 0.0 | % | ||||
| Total: |
$ | 498,281 | 11.7 | % | $ | 204,316 | 6.0 | % | ||||
100
Table of Contents
Winton Series:
| September 30, 2009 | December 31, 2008 | |||||||||||
| MARKET SECTOR |
VALUE AT RISK |
% OF TOTAL CAPITALIZATION |
VALUE AT RISK |
% OF TOTAL CAPITALIZATION |
||||||||
| Interest Rates |
$ | 2,241,617 | 3.6 | % | $ | 1,076,982 | 1.5 | % | ||||
| Currencies |
$ | 1,993,707 | 3.2 | % | $ | 1,360,405 | 1.8 | % | ||||
| Stock Indices |
$ | 744,523 | 1.2 | % | $ | 67,599 | 0.1 | % | ||||
| Metals |
$ | 279,451 | 0.5 | % | $ | 69,327 | 0.1 | % | ||||
| Agriculturals/Softs |
$ | 513,149 | 0.8 | % | $ | 532,693 | 0.7 | % | ||||
| Energy |
$ | 107,563 | 0.2 | % | $ | 72,478 | 0.1 | % | ||||
| Total: |
$ | 5,880,010 | 9.5 | % | $ | 3,179,484 | 4.3 | % | ||||
Winton/Graham Series:
| September 30, 2009 | December 31, 2008 | |||||||||||
| MARKET SECTOR |
VALUE AT RISK |
% OF TOTAL CAPITALIZATION |
VALUE AT RISK |
% OF TOTAL CAPITALIZATION |
||||||||
| Interest Rates |
$ | 4,213,497 | 6.7 | % | $ | 451,517 | 0.9 | % | ||||
| Currencies |
$ | 4,347,572 | 6.9 | % | $ | 433,230 | 0.9 | % | ||||
| Stock Indices |
$ | 1,680,746 | 2.7 | % | $ | 54,758 | 0.1 | % | ||||
| Metals |
$ | 353,469 | 0.6 | % | $ | 43,737 | 0.1 | % | ||||
| Agriculturals/Softs |
$ | 1,312,389 | 2.1 | % | $ | 185,563 | 0.4 | % | ||||
| Energy |
$ | 135,768 | 0.2 | % | $ | 38,493 | 0.1 | % | ||||
| Total: |
$ | 12,043,441 | 19.2 | % | $ | 1,207,298 | 2.5 | % | ||||
101
Table of Contents
| (1) | As of September 30, 2009, a portion of the assets of the Frontier Diversified Series was invested in an Option basket of futures contracts with a notional value of $27,218,501. Margin information is not available for this contract therefore no value at risk calculations were included in the table for this investment. |
| (2) | As of September 30, 2009, a portion of the assets of the Frontier Dynamic Series was invested in an Option basket of futures contracts with a notional value of $28,491,909. Margin information is not available for this contract therefore no value at risk calculations were included in the table for this investment. |
| (3) | As of September 30, 2009, a portion of the assets of the Frontier Masters Series was invested in an Option basket of futures contracts with a notional value of $9,742,916. Margin information is not available for this contract therefore no value at risk calculations were included in the table for this investment. |
| (4) | As of September 30, 2009 and December 31, 2008, a portion of the assets of the Balanced Series was invested in the Currency Series, Frontier Diversified Series, Frontier Dynamic Series and Frontier Masters Series. The Balanced Series effective ownership in these Series as of September 30, 2009 was 52.5%, 64.2%, 98.7% and 80.2%, respectively. As of December 31, 2008 the Balanced Series effective ownership was 49.7% of the Currency Series only. Including its investment in this Series, total value at risk for the Balanced Series would be $47,417,455, or 11.8% of capitalization as of September 30, 2009 and $13,000,001, or 3.9% of capitalization as of December 31, 2008. |
| (5) | As of September 30, 2009 and December 31, 2008, a portion of the assets of the Balanced Series was invested in an Option basket of futures contracts with a notional value of $112,958,718 and $101,715,457, respectively. Margin information is not available for this contract therefore no value at risk calculations were included in the table for this investment. |
| (6) | As of September 30, 2009 and December 31, 2008, a portion of the assets of the Currency Series was invested in an Option basket of futures contracts with a notional value of $20,979,642 and $25,015,994, respectively. Margin information is not available for this contract therefore no value at risk calculations were included in the table for this investment. |
Material Limitations on Value at Risk as an Assessment of Market Risk
The face value of the market sector instruments held on behalf of the Series is typically many times the applicable maintenance margin requirement, which generally ranges between approximately 1% and 10% of the contract’s face value, as well as many times the capitalization of the Series. The magnitude of each Series’ open positions creates a risk of loss not typically found in most other investment vehicles. Because of the size of their positions, certain market conditions, although unusual, but historically recurring from time to time, could cause a Series to incur severe losses over a short period of time. The value at risk tables above, as well as the past performance of the Series, gives no indication of this risk of loss.
Non-Trading Risk
The Series have non-trading market risk on their foreign cash balances not needed for margin. However, these balances, as well as the market risk they represent, are immaterial. The Series also have non-trading market risk as a result of investing a portion of their available assets in U.S. government securities which include any security issued or guaranteed as to principal or interest by the United States, or by a person controlled by or supervised by and acting as an instrumentality of the government of the United States pursuant to authority granted by Congress of the United States or any certificate of deposit for any of the foregoing, including U.S. treasury bonds, U.S. treasury bills and issues of agencies of the U.S. government, and certain cash items such as money market funds, certificates of deposit (under nine months) and time deposits. The market risk represented by these investments is also immaterial.
102
Table of Contents
Qualitative Market Risk
The following are the primary trading risk exposures of the Series of the Trust as of September 30, 2009, by market sector.
Interest rates
Interest rate risk is one of the principal market exposures of each Series. Interest rate movements directly affect the price of interest rate futures positions held and indirectly the value of a Trading Company’s stock index and currency positions. Interest rate movements in one country as well as relative interest rate movements between countries materially impact profitability. The primary interest rate exposure is to interest rate fluctuations in the United States and the other G-7 countries. However, the Trading Companies also may take futures positions on the government debt of smaller nations. The Managing Owner anticipates that G-7 interest rates will remain the primary market exposure of each Trading Company and accordingly of each Series for the foreseeable future. The changes in interest rates which are expected to have the most effect on the Series are changes in long-term, as opposed to short-term rates. Most of the speculative positions to be held by the Trading Companies will be in medium- to long-term instruments. Consequently, even a material change in short-term rates is expected to have little effect on the Series if the medium- to long-term rates remain steady. Aggregate interest income from all sources, including assets held at clearing brokers, up to 2% (annualized) is paid to the Managing Owner by the Balanced Series (Class 1 and Class 2 only), Winton Series, Campbell/Graham/Tiverton Series, Currency Series and Winton/Graham Series. For the Balanced Series (Class 1a and Class 2a only), Long Only Commodity Series, Frontier Long/Short Commodity Series, Managed Futures Index Series, Frontier Diversified Series, Frontier Dynamic Series and Frontier Masters Series, 20% of the total interest allocated to each Series is paid to the Managing Owner. In addition, if interest rates fall below 0.75%, the Managing Owner is paid the difference between the Trust’s annualized interest income that is allocated to each of such Series and 0.75%. Interest income above what is paid to the Managing Owner is retained by the Series.
Currencies
Exchange rate risk is a significant market exposure of each Series of the Trust in general and the Currency Series in particular. For each Series of the Trust in general, and the Currency Series in particular, currency exposure is to exchange rate fluctuations, primarily fluctuations that disrupt the historical pricing relationships between different currencies and currency pairs. These fluctuations are influenced by interest rate changes as well as political and general economic conditions. The Trading Advisors on behalf of a Series trade in a large number of currencies, including cross-rates, which are positions between two currencies other than the U.S. Dollar. The Managing Owner does not anticipate that the risk profile of the Series’ currency sector will change significantly in the future.
Stock Indices
For each Series (other than the Currency Series), its primary equity exposure is equity price risk in the G-7 countries as well as other smaller jurisdictions. Each Series of the Trust (other than the Currency Series) is primarily exposed to the risk of adverse price trends or static markets in the major U.S., European and Japanese indices.
Metals
For each Series (other than the Currency Series), its metals market exposure is fluctuations in the price of both precious metals, including gold and silver, as well as base metals including aluminum, copper, nickel and zinc. Some metals, such as gold, are used as surrogate stores of value, in place of hard currency, and thus have an associated currency or interest rate risk associated with them relative to their price in a specific currency. Other metals, such as silver, platinum, copper and steel, have substantial industrial applications, and may be subject to forces affecting industrial production and demand.
103
Table of Contents
Agriculturals/Softs
Each Series (other than the Currency Series) may also invest in raw commodities and may thus have exposure to agricultural price movements, which are often directly affected by severe or unexpected weather conditions or by political events in countries that comprise significant sources of commodity supply.
Energy
For each Series (other than the Currency Series), its primary energy market exposure is in oil, gas and other energy product price movements, often resulting from political developments and ongoing conflicts in the Middle East. Oil and gas prices can be volatile and substantial profits and losses have been and are expected to continue to be experienced in this market.
Other Trading Risks
As a result of leverage, small changes in the price of a Trading Company’s positions may result in substantial losses for a Series. Futures, forwards and options are typically traded on margin. This means that a small amount of capital can be used to invest in contracts of much greater total value. The resulting leverage means that a relatively small change in the market price of a contract can produce a substantial loss. Like other leveraged investments, any purchase or sale of a contract may result in losses in excess of the amount invested in that contract. The Trading Companies may lose more than their initial margin deposits on a trade.
The Trading Companies’ trading is subject to execution risks. Market conditions may make it impossible for the Trading Advisors to execute a buy or sell order at the desired price, or to close out an open position. Daily price fluctuation limits are established by the exchanges and approved by the CFTC. When the market price of a contract reaches its daily price fluctuation limit, no trades can be executed at prices outside the limit. The holder of a contract may therefore be locked into an adverse price movement for several days or more and lose considerably more than the initial margin put up to establish the position. Thinly traded or illiquid markets also can make it difficult or impossible to execute trades.
The Trading Advisors’ positions are subject to speculative limits. The CFTC and domestic exchanges have established speculative position limits on the maximum futures position which any person, or group of persons acting in concert, may hold or control in particular futures contracts or options on futures contracts traded on U.S. commodity exchanges. Under current regulations, other accounts of the Trading Advisors are combined with the positions held by them on behalf of the applicable Trading Company for position limit purposes. This trading could preclude additional trading in these commodities by the Trading Advisors for the accounts of the Series.
Systematic strategies do not consider fundamental types of data and do not have the benefit of discretionary decision making. The assets of the Series are allocated to Trading Advisors that rely on technical, systematic strategies that do not take into account factors external to the market itself (although certain of these strategies may have minor discretionary elements incorporated into their systematic strategy). The widespread use of technical trading systems frequently results in numerous trading advisors attempting to execute similar trades at or about the same time, altering trading patterns and affecting market liquidity. Furthermore, the profit potential of trend-following systems may be diminished by the changing character of the markets, which may make historical price data (on which technical programs are based) only marginally relevant to future market patterns. Systematic strategies are developed on the basis of a statistical analysis of market prices. Consequently, any factor external to the market itself that dominates prices that a discretionary decision maker may take into account may cause major losses for a systematic strategy. For example, a pending political or economic event may be very likely to cause a major price movement, but a systematic strategy may continue to maintain positions indicated by its trading method that might incur major losses if the event proved to be adverse.
However, because certain of the Trading Advisors’ strategies involve some discretionary aspects in addition to their technical factors, certain of the Trading Advisors may occasionally use discretion in investing the assets of a Series. For example, the Trading Advisors often use discretion in selecting contracts and markets to be followed. In exercising such discretion, such Trading Advisor may take positions opposite to those recommended by the Trading Advisor’s trading system or signals. Discretionary decision making may also result in a Trading Advisor failing to capitalize on certain price trends or making unprofitable trades in a situation where another trader relying solely on a
104
Table of Contents
systematic approach might not have done so. Furthermore, such use of discretion may not enable the relevant Series of the Trust to avoid losses, and in fact, such use of discretion may cause such Series to forego profits which it may have otherwise earned had such discretion not been used.
Qualitative Disclosures Regarding Means of Managing Risk Exposure
The means by which the Managing Owner attempts to manage the risk of the Trust’s open positions is essentially the same in all market categories traded. The Managing Owner applies risk management policies to trading which generally are designed to limit the total exposure of assets under management. In addition, the Managing Owner follows diversification guidelines which are often formulated in terms of the balanced volatility between markets and correlated groups.
| ITEM 4. | CONTROLS AND PROCEDURES |
Evaluation of disclosure controls and procedures
Under the supervision and with the participation of the management of the Managing Owner, including its Chief Executive Officer and Chief Financial Officer, the Trust evaluated the effectiveness of the design and operation of the disclosure controls and procedures (as defined in Rule 13(a)-15(e) under the Securities Exchange Act of 1934, as amended (the “Exchange Act”), for the Trust and each Series as of September 30, 2009 (the “Evaluation Date”). Any control system, no matter how well designed and operated, can provide only reasonable (not absolute) assurance that its objectives will be met. Furthermore, no evaluation of controls can provide absolute assurance that all control issues and instances of fraud, if any, have been detected. Based upon our evaluation, the Chief Executive Officer and Chief Financial Officer of the Managing Owner concluded that, as of the Evaluation Date, the disclosure controls and procedures for the Trust and each Series were effective to provide reasonable assurance that they are timely alerted to the material information relating to the Trust and each Series required to be included in the Trust’s periodic SEC filings.
Changes in Internal Control Over Financial Reporting
There were no changes made in internal controls during this reporting period that have materially affected or are reasonably likely to materially affect the internal controls over financial reporting for the Trust or any Series.
Scope of Exhibit 31 Certifications
The certifications of the Chief Executive Officer and the Chief Financial Officer of the Managing Owner included as Exhibits 31.1 and 31.2, respectively, to this Form 10-Q apply not only to the Trust as a whole but also to each Series individually.
105
Table of Contents
PART II. OTHER INFORMATION
| ITEM 1. | LEGAL PROCEEDINGS. |
None
| ITEM 1A. | RISK FACTORS. |
The following risk factor relating to The Frontier Fund supplements the risk factors under the heading “Operating Risks” previously disclosed in the Trust’s Annual Report on Form 10-K for its fiscal year ended December 31, 2008, under the caption “Item 1A. Risk Factors.”
Trading Company Allocations
More than one Series may invest in a single Trading Company to access a particular Trading Advisor. While the assets of certain Trading Companies are traded by only one Trading Advisor, the assets of certain other Trading Companies are traded by multiple Trading Advisors. If a particular Trading Advisor accessed through a Trading Company with multiple Trading Advisors were to incur losses in excess of the amounts allocated to such Trading Advisor, the remaining assets of the Trading Company (including assets not allocated to such Trading Advisor), would be available to offset such losses. As a result, any Series invested in that Trading Company would bear such losses in proportion to their allocation to such Trading Company.
| ITEM 2. | UNREGISTERED SALES OF EQUITY SECURITIES AND USE OF PROCEEDS. |
The following table provides information regarding the sale of unregistered Units by the Registrant for the three months ended September 30, 2009. The number of Units listed below for each transaction is the aggregate number of Units in the particular Series of the Trust purchased in such transaction. The consideration listed below for each transaction is, except as otherwise noted, the aggregate amount of cash paid for the Units purchased. For each transaction reported below, the price per Unit was Net Asset Value per Unit at the time of the transaction and the Managing Owner of the Trust was the purchaser of the Units. No underwriting discount or sales commission was paid or received with respect to any of the transactions reported below. The Registrant claims an exemption from registration of each of the transactions listed below under Section 4(2) of the Securities Act, as a sale by an issuer not involving a public offering.
| SERIES |
DATE | UNITS | CONSIDERATION | ||||
| FRONTIER DIVERSIFIED SERIES - 2 |
SEPTEMBER 29, 2009 | 1,506.90580 | $ | 150,000 | |||
| FRONTIER MASTERS SERIES - 2 |
SEPTEMBER 29, 2009 | 152.15850 | $ | 15,000 | |||
| ITEM 3. | DEFAULTS UPON SENIOR SECURITIES. |
None
| ITEM 4. | SUBMISSION OF MATTERS TO A VOTE OF SECURITY HOLDERS. |
None
| ITEM 5. | OTHER INFORMATION. |
None
106
Table of Contents
| ITEM 6. | EXHIBITS. |
Exhibits (numbered in accordance with Item 601 of Regulation S-K)
| 1.1 | Form of Selling Agent Agreement among the Registrant, Equinox Fund Management, LLC and the Selling Agents**** | |
| 1.2 | Form of Amendment Agreement among the Registrant, Equinox Fund Management, LLC and the Selling Agents** | |
| 1.3 | Form of Amendment Agreement among the Registrant, Equinox Fund Management, LLC and the Selling Agents*** | |
| 1.4 | Form of Amendment Agreement among the Registrant, Equinox Fund Management, LLC and the Selling Agents*** | |
| 1.6 | Form of Amendment Agreement among the Registrant, Equinox Fund Management, LLC and the Selling Agents **** | |
| 1.7 | Form of Amendment Agreement among the Registrant, Equinox Fund Management, LLC and the Selling Agents**** | |
| 1.8 | Selling Agent Agreement among the Registrant, Equinox Management, LLC, Ameriprise Financial Services and Ameriprise Advisor Services, Inc. +++ | |
| 1.9 | Selling Agent Agreement among the Registrant, Equinox Management, LLC and Raymond James & Associates, Inc. +++ | |
| 4.1 | Declaration of Trust and Amended and Restated Trust Agreement of the Registrant (annexed to the Prospectus as Exhibit A)**** | |
| 4.2 | Form of Subscription Agreement (annexed to the Prospectus as Exhibit B)**** | |
| 4.3 | Form of Exchange Request (annexed to the Prospectus as Exhibit C)**** | |
| 4.4 | Form of Request for Redemption (annexed to the Prospectus as Exhibit D)**** | |
| 4.5 | Form of Request for Additional Subscription (annexed to the Prospectus as Exhibit E)**** | |
| 4.6 | Form of Application for Transfer of Ownership / Re-registration Form (annexed to the Prospectus as Exhibit F)**** | |
| 4.7 | Form of Privacy Notice (annexed to the Prospectus as Exhibit G)**** | |
| 10.1 | Form of Amended and Restated Escrow Agreement among the Registrant, Equinox Fund Management, LLC, Bornhoft Group Securities Corporation and the U.S. Bank National Association, Denver Colorado*** | |
| 10.2 | Form of Brokerage Agreement between each Trading Company and UBS Securities, LLC* | |
| 10.21 | Form of Brokerage Agreement between each Trading Company and Banc of America Futures Incorporated* | |
| 10.22 | Form of Brokerage Agreement between the Managing Owner, acting as agent on behalf of certain Trading Companies, and Deutsche Bank AG London** | |
| 10.23 | Form of Brokerage Agreement between each Trading Company and Man Financial Inc. *** | |
107
Table of Contents
| 10.24 | Form of Amendment Agreement between the Managing Owner, acting as agent on behalf of certain Trading Companies, and Deutsche Bank AG London*** | |
| 10.25 | Form of Brokerage Agreement between each Trading Company and Fimat USA, LLC+ | |
| 10.26 | Form of Guaranty made by The Frontier Fund, in favor of UBS Securities, LLC. | |
| 10.3 | Form of Advisory Agreement among the Registrant, the Trading Company, Equinox Fund Management, LLC, and each Trading Advisor**** | |
| 10.31 | Form of International Swaps and Derivatives Association Master Agreement, including all Schedules thereto and the Credit Support Annex thereto entered into for the Long Only Commodity Series of the Registrant*** | |
| 10.32 | Form of License Agreement among Jefferies Financial Products, LLC, Reuters America LLC, the Registrant and Equinox Fund Management, LLC*** | |
| 10.33 | Form of License Agreement among Jefferies Financial Products, the Registrant and Equinox Fund Management, LLC*** | |
| 10.34 | Form of Guaranty made by Jefferies Group, Inc. in favor of Frontier Trading Company VIII, LLC*** | |
| 10.35 | Form of International Swaps and Derivatives Association Master Agreement, including all Schedules thereto and the Credit Support Annex thereto entered into for the Currency Series of the Registrant*** | |
| 10.36 | Form of International Swaps and Derivatives Association Master Agreement, including all Schedules thereto and the Credit Support Annex thereto entered into for the Managed Futures Index Series of the Registrant*** | |
| 10.37 | Form of International Swaps and Derivatives Association Master Agreement, including all Schedules thereto and the Credit Support Annex thereto entered into for the Balanced Series of the Registrant ++ | |
| 10.38 | Form of International Swaps and Derivatives Association Master Agreement, including all Schedules thereto and the Credit Support Annex thereto entered into for the Frontier Master Series of the Registrant +++ | |
| 10.4 | Form of Cash Management Agreement between Equinox Fund Management, LLC and Merrill Lynch** | |
| 10.41 | Form of Cash Management Agreement between Equinox Fund Management, LLC and STW Fixed Income Management Ltd.*** | |
| 10.5 | Form of single-member limited liability company operating agreement governing each Trading Company*** | |
| 10.51 | Form of amended and restated limited liability company operating agreement (furnished herewith) | |
| 21.1 | Subsidiaries of the Registrant | |
| 31.1 | Certification of Principal Executive Officer of the Managing Owner pursuant to Rules 13a-14(a) and 15(d)-14(a) of the Securities Exchange Act of 1934 (furnished herewith) | |
| 31.2 | Certification of Principal Executive Officer of the Managing Owner pursuant to Rules 13a-14(a) and 15(d)-14(a) of the Securities Exchange Act of 1934 (furnished herewith) | |
108
Table of Contents
| 32.1 | Certification pursuant to 18 U.S.C. Section 1350, as enacted by Section 906 of The Sarbanes- Oxley Act of 2002. (furnished herewith) | |
| 32.2 | Certification pursuant to 18 U.S.C. Section 1350, as enacted by Section 906 of The Sarbanes- Oxley Act of 2002. (furnished herewith) | |
| 32.3 | Certification pursuant to 18 U.S.C. Section 1350, as enacted by Section 906 of The Sarbanes- Oxley Act of 2002. (furnished herewith) | |
| 32.4 | Certification pursuant to 18 U.S.C. Section 1350, as enacted by Section 906 of The Sarbanes- Oxley Act of 2002. (furnished herewith) | |
| 32.5 | Certification pursuant to 18 U.S.C. Section 1350, as enacted by Section 906 of The Sarbanes- Oxley Act of 2002. (furnished herewith) | |
| 32.6 | Certification pursuant to 18 U.S.C. Section 1350, as enacted by Section 906 of The Sarbanes- Oxley Act of 2002. (furnished herewith) | |
| 32.7 | Certification pursuant to 18 U.S.C. Section 1350, as enacted by Section 906 of The Sarbanes- Oxley Act of 2002. (furnished herewith) | |
| 32.8 | Certification pursuant to 18 U.S.C. Section 1350, as enacted by Section 906 of The Sarbanes- Oxley Act of 2002. (furnished herewith) | |
| 32.9 | Certification pursuant to 18 U.S.C. Section 1350, as enacted by Section 906 of The Sarbanes- Oxley Act of 2002. (furnished herewith) | |
| 32.10 | Certification pursuant to 18 U.S.C. Section 1350, as enacted by Section 906 of The Sarbanes- Oxley Act of 2002. (furnished herewith) | |
| 32.11 | Certification pursuant to 18 U.S.C. Section 1350, as enacted by Section 906 of The Sarbanes- Oxley Act of 2002. (furnished herewith) | |
| 32.12 | Certification pursuant to 18 U.S.C. Section 1350, as enacted by Section 906 of The Sarbanes- Oxley Act of 2002. (furnished herewith) | |
| * | Previously filed as like-numbered exhibit to the initial filing or the first, second, third or fourth pre-effective amendment or the first or second post-effective amendment to Registration Statement No. 333-108397 and incorporated by reference herein. |
| ** | Previously filed as like-numbered exhibit to the initial filing or the first pre-effective amendment or the first or second post-effective amendment to Registration Statement No. 333-119596 and incorporated by reference herein. |
| *** | Previously filed as like-numbered exhibit to the initial filing or the first pre-effective amendment or the first post-effective amendment to Registration Statement No. 333-129701 and incorporated by reference herein. |
| **** | Previously filed as like-numbered exhibit to the initial filing or the first pre-effective amendment or the second, fourth or fifth post-effective amendment to Registration Statement No. 333-140240 and incorporated by reference herein. |
| + | Previously filed as like-numbered exhibit to Form 10-Q for the period ended September 30, 2007. |
| ++ | Previously filed as like-numbered exhibit to Form 10-Q for the period ended June 30, 2008. |
| +++ | Previously filed as like-numbered exhibit to Form 10-Q for the period ended June 30, 2009. |
109
Table of Contents
Pursuant to the requirements of the Securities Exchange Act of 1934, the registrant has duly caused this report to be signed on its behalf by the undersigned thereunto duly authorized.
| The Frontier Fund | ||||
| (Registrant) | ||||
| Date: November 12, 2009 | ||||
| By: | /S/ ROBERT J. ENCK | |||
| Robert J. Enck | ||||
| President and Chief Executive Officer of Equinox Fund Management, LLC, the Managing Owner of The Frontier Fund | ||||
110
Table of Contents
SIGNATURES
Pursuant to the requirements of the Securities Exchange Act of 1934, the registrant has duly caused this report to be signed on its behalf by the undersigned thereunto duly authorized.
| Balanced Series, | ||||
| a Series of The Frontier Fund | ||||
| (Registrant) | ||||
| Date: November 12, 2009 | ||||
| By: | /S/ ROBERT J. ENCK | |||
| Robert J. Enck | ||||
| President and Chief Executive Officer of Equinox Fund Management, LLC, the Managing Owner of The Frontier Fund | ||||
111
Table of Contents
SIGNATURES
Pursuant to the requirements of the Securities Exchange Act of 1934, the registrant has duly caused this report to be signed on its behalf by the undersigned thereunto duly authorized.
| Winton/Graham Series, | ||||
| a Series of The Frontier Fund | ||||
| (Registrant) | ||||
| Date: November 12, 2009 | By: | /S/ ROBERT J. ENCK | ||
| Robert J. Enck | ||||
| President and Chief Executive Officer of Equinox Fund Management, LLC, the Managing Owner of The Frontier Fund | ||||
112
Table of Contents
SIGNATURES
Pursuant to the requirements of the Securities Exchange Act of 1934, the registrant has duly caused this report to be signed on its behalf by the undersigned thereunto duly authorized.
| Winton Series, | ||||
| a Series of The Frontier Fund | ||||
| (Registrant) | ||||
| Date: November 12, 2009 | By: | /S/ ROBERT J. ENCK | ||
| Robert J. Enck | ||||
| President and Chief Executive Officer of Equinox Fund Management, LLC, the Managing Owner of The Frontier Fund | ||||
113
Table of Contents
SIGNATURES
Pursuant to the requirements of the Securities Exchange Act of 1934, the registrant has duly caused this report to be signed on its behalf by the undersigned thereunto duly authorized.
| Campbell/Graham/Tiverton Series, | ||||
| a Series of The Frontier Fund | ||||
| (Registrant) | ||||
| Date: November 12, 2009 | By: | /S/ ROBERT J. ENCK | ||
| Robert J. Enck | ||||
| President and Chief Executive Officer of Equinox Fund Management, LLC, the Managing Owner of The Frontier Fund | ||||
114
Table of Contents
SIGNATURES
Pursuant to the requirements of the Securities Exchange Act of 1934, the registrant has duly caused this report to be signed on its behalf by the undersigned thereunto duly authorized.
| Currency Series, | ||||
| a Series of The Frontier Fund | ||||
| (Registrant) | ||||
| Date: November 12, 2009 | By: | /S/ ROBERT J. ENCK | ||
| Robert J. Enck | ||||
| President and Chief Executive Officer of Equinox Fund Management, LLC, the Managing Owner of The Frontier Fund | ||||
115
Table of Contents
SIGNATURES
Pursuant to the requirements of the Securities Exchange Act of 1934, the registrant has duly caused this report to be signed on its behalf by the undersigned thereunto duly authorized.
| Long Only Commodity Series, | ||||
| a Series of The Frontier Fund | ||||
| (Registrant) | ||||
| Date: November 12, 2009 | By: | /S/ ROBERT J. ENCK | ||
| Robert J. Enck | ||||
| President and Chief Executive Officer of | ||||
| Equinox Fund Management, LLC, the | ||||
| Managing Owner of The Frontier Fund | ||||
116
Table of Contents
SIGNATURES
Pursuant to the requirements of the Securities Exchange Act of 1934, the registrant has duly caused this report to be signed on its behalf by the undersigned thereunto duly authorized.
| Frontier Long/Short Commodity Series, | ||||
| a Series of The Frontier Fund | ||||
| (Registrant) | ||||
| Date: November 12, 2009 | By: | /S/ ROBERT J. ENCK | ||
| Robert J. Enck | ||||
| President and Chief Executive Officer of | ||||
| Equinox Fund Management, LLC, the | ||||
| Managing Owner of The Frontier Fund | ||||
117
Table of Contents
SIGNATURES
Pursuant to the requirements of the Securities Exchange Act of 1934, the registrant has duly caused this report to be signed on its behalf by the undersigned thereunto duly authorized.
| Managed Futures Index Series, | ||||
| a Series of The Frontier Fund | ||||
| (Registrant) | ||||
| Date: November 12, 2009 | By: | /S/ ROBERT J. ENCK | ||
| Robert J. Enck | ||||
| President and Chief Executive Officer of | ||||
| Equinox Fund Management, LLC, the | ||||
| Managing Owner of The Frontier Fund | ||||
118
Table of Contents
SIGNATURES
Pursuant to the requirements of the Securities Exchange Act of 1934, the registrant has duly caused this report to be signed on its behalf by the undersigned thereunto duly authorized.
| Frontier Diversified Series, | ||||
| a Series of The Frontier Fund | ||||
| (Registrant) | ||||
| Date: November 12, 2009 | By: | /S/ ROBERT J. ENCK | ||
| Robert J. Enck | ||||
| President and Chief Executive Officer of | ||||
| Equinox Fund Management, LLC, the | ||||
| Managing Owner of The Frontier Fund | ||||
119
Table of Contents
SIGNATURES
Pursuant to the requirements of the Securities Exchange Act of 1934, the registrant has duly caused this report to be signed on its behalf by the undersigned thereunto duly authorized.
| Frontier Dynamic Series, | ||||
| a Series of The Frontier Fund | ||||
| (Registrant) | ||||
| Date: November 12, 2009 | By: | /S/ ROBERT J. ENCK | ||
| Robert J. Enck | ||||
| President and Chief Executive Officer of | ||||
| Equinox Fund Management, LLC, the | ||||
| Managing Owner of The Frontier Fund | ||||
120
Table of Contents
SIGNATURES
Pursuant to the requirements of the Securities Exchange Act of 1934, the registrant has duly caused this report to be signed on its behalf by the undersigned thereunto duly authorized.
| Frontier Masters Series, | ||||
| a Series of The Frontier Fund | ||||
| (Registrant) | ||||
| Date: November 12, 2009 | By: | /S/ ROBERT J. ENCK | ||
| Robert J. Enck | ||||
| President and Chief Executive Officer of | ||||
| Equinox Fund Management, LLC, the | ||||
| Managing Owner of The Frontier Fund | ||||
121