Attached files
| file | filename |
|---|---|
| 8-K - FORM 8-K - BlueLinx Holdings Inc. | c92379e8vk.htm |
Exhibit 99.1

| BlueLinx Corporation D.A. Davidson Investor Conference November 11, 2009 |

| Safe Harbor Statement Forward-Looking Statement Safe Harbor - This presentation includes "forward-looking statements" within the meaning of the Private Securities Litigation Reform Act of 1995. All of these forward-looking statements are based on estimates and assumptions made by our management that, although believed by us to be reasonable, are inherently uncertain. Forward-looking statements involve risks and uncertainties, including, but not limited to, economic, competitive, governmental and technological factors outside of our control, that may cause our business, strategy or actual results to differ materially from the forward-looking statements. These risks and uncertainties may include, among other things: changes in the supply and/or demand for products which we distribute, especially as a result of conditions in the residential housing market; general economic and business conditions in the United States; the activities of competitors; changes in significant operating expenses; changes in the availability of capital; the ability to identify acquisition opportunities and effectively and cost-efficiently integrate acquisitions; adverse weather patterns or conditions; acts of war or terrorist activities; variations in the performance of the financial markets; and other factors described in the "Risk Factors" section in our Annual Report on Form 10-K for the fiscal year ended January 3, 2009, and in our other periodic reports filed with the SEC. In addition, the statements in this presentation are made as of November 11, 2009. We undertake no obligation to update any of the forward-looking statements made herein, whether as a result of new information, future events, changes in expectation or otherwise. These forward-looking statements should not be relied upon as representing our views as of any date subsequent to November 11, 2009. Use of Non-GAAP and Adjusted Financial Information - To supplement GAAP financial information, we use adjusted measures of operating results which are non-GAAP measures. This non-GAAP adjusted financial information is provided as additional information for investors. These adjusted results exclude certain costs, expenses, gains and losses, and we believe their exclusion can enhance an overall understanding of our past financial performance and also our prospects for the future. These adjustments to our GAAP results are made with the intent of providing both management and investors a more complete understanding of our operating performance by excluding non-recurring, infrequent or other non-cash charges that are not believed to be material to the ongoing performance of our business. The presentation of this additional information is not meant to be considered in isolation or as a substitute for GAAP measures of net earnings, diluted earnings per share or net cash provided by (used in) operating activities prepared in accordance with generally accepted accounting principles in the United States. |

| George Judd Chief Executive Officer |

| BlueLinx Overview: Investment Considerations Largest building products distributor in highly fragmented industry Unique, centralized distribution platform, national footprint, national sales force with local market focus, and a high-service & solutions-based value proposition for both customers and vendors Diversified products, customers & end use segments Positioned at the center of the supply chain to create maximum value for both manufacturers and customers State-of-the-Art Sales Intelligence, Logistics and related systems Experienced Management Team Solid capital structure built to allow acquisitions The BlueLinx Advantage |

| BlueLinx Overview: The Right Products... Wide breath of products used primarily in Residential & Industrial applications Global Sourcing with quality assurance drives down costs Focused on products that are environmentally friendly Source of info & specs on over 10,000 products with 70,000 SKU's |

| BlueLinx Overview: The Right Products...To the Right Place... Value to Manufacturers Reliable channels to market Consistent production runs Limits inventory investment Limits credit risk and receivable investment Demand creation for early life cycle products Nation-wide sales representation Market intelligence Value to Customers Reliable source of many materials Break bulk quantities Near 100% fill rates Limits vendors, inventory investment & related carrying costs Just in time deliveries Safety stock Distribution Services Sales knowledge and product training Product resources, knowledgeable staff & nationwide foot print make us a valuable partner to vendors and customers - ensuring products make it to the right place at the right time. Building Products Manufacturers Dealers Residential & Non- Residential Construction Industrial & Manufactured Housing Repair & Remodeling Home Improvement Centers One-Step Two-Step |

| BlueLinx Overview: The Right Products...To the Right Place...At the Right Time BlueLinx' 70+ locations are positioned in high growth areas allowing us to get the right products to the right place at the right time. CTPAT Customs "Fast Pass" for Imports State of the Art logistics Technology for tracking & visibility ~ 25,000 customer locations Near 100% Fill Rates w/ the industry's largest private fleet FSC Certification: Chain of custody from manufacturer to end user |

| BlueLinx Overview: Diversified Products, Suppliers and Customers Diverse & Growing Supply Base: 750+ Vendor Partners World Class, Loyal Customers: 11,500+ Customer Partners Industrials/ Manufactured Housing National Dealers National Home Centers Regional Dealers Dealers Dealers Dealers Dealers Dealers Dealers |

| Operating Environment: Largest Competitors BlueLinx is the largest building products distributor (1) in the United States Annual Revenue (1) Annual Revenue (1) 1 BlueLinx $2.8 billion $2.8 billion 2 Weyerhaeuser $2.5 billion $2.5 billion 3 Universal Forest Products $2.2 billion $2.2 billion 4 Boise Cascade $2.1 billion $2.1 billion 5 PrimeSource (2) $1.7 billion $1.7 billion (1) Except as indicated below, 2008 revenue per Home Channel News; July 13, 2009 Except as indicated below, 2008 revenue per Home Channel News; July 13, 2009 (2) 2007 Revenues per Home Channel News; July 13, 2009 |

| Operating Environment: Structural Pricing Trends Source: Data from Random Lengths Publications, Inc., updated as of October 30, 2009 Pricing for key grades of structural wood products at low levels due to severely limited demand. Potential for increase in underlying prices once demand increases. Level of increase dependent upon level and timing of production ramp-up. Price declines have impacted current spend per house on lumber and panels? Current spend is 60% less than peak and 40% less than 6 year average. Impacts both revenue dollars and margin dollars. dollars and margin dollars. dollars and margin dollars. dollars and margin dollars. dollars and margin dollars. dollars and margin dollars. dollars and margin dollars. dollars and margin dollars. dollars and margin dollars. dollars and margin dollars. dollars and margin dollars. dollars and margin dollars. dollars and margin dollars. dollars and margin dollars. dollars and margin dollars. dollars and margin dollars. dollars and margin dollars. dollars and margin dollars. dollars and margin dollars. dollars and margin dollars. dollars and margin dollars. dollars and margin dollars. dollars and margin dollars. dollars and margin dollars. dollars and margin dollars. dollars and margin dollars. dollars and margin dollars. dollars and margin dollars. dollars and margin dollars. dollars and margin dollars. dollars and margin dollars. dollars and margin dollars. dollars and margin dollars. dollars and margin dollars. dollars and margin dollars. dollars and margin dollars. dollars and margin dollars. dollars and margin dollars. dollars and margin dollars. dollars and margin dollars. dollars and margin dollars. dollars and margin dollars. dollars and margin dollars. dollars and margin dollars. dollars and margin dollars. dollars and margin dollars. |

| Operating Environment: Achievements Gross Margin % Achieving gross margins well above historical levels through our ongoing management of product pricing and sales discipline Aligned cost structure with operating environment Tightly managed working capital Expanded supplier relationships Radiata Pine from Arauco Nichiha LiteSteel(r) beam from LiteSteel Technologies America United Stone Veneer produced by PlyGem Hebel(r) Aerated Concrete Products from Xella Aircrete North America Owens Corning Continued building long-term business with customers and suppliers, and making it more efficient and profitable for our customers and vendors to conduct business with us Targeting our share of fast growing "green building products" . |

| BlueLinx Long-Term Objectives: Grow Specialty Products Partner with manufacturers to introduce new products Grow share in under-represented market segments (e.g. Industrials) Further penetrate geographic markets |

| BlueLinx Long-Term Objectives: Structural Products Increase utilization of vendor managed inventory programs Expand imports from Brazil and China and other areas offering lowest-cost sourcing Focus on premium brand products Focus on improved profitability and reduced risk |

| BlueLinx Long-Term Objectives: Outgrow an Expanding Market Specialty unit volume will drive share growth over time Long-term objective is to grow specialty unit volume relative to the estimated overall end-use market Maintaining structural product profitability takes priority over share gain in times of structural price declines |

| Looking Forward: Macro Factors Remain Strong Third party composite housing start forecasts average approximately ~800 thousand Our current view is 700 thousand starts Generally stable to higher wood product prices Unemployment peaks in mid-2010 then begins to recede Credit continues to emerge 2009 2010 2011 2012 2013 SAAR Industrial Production 0.979 1 1.035 1.038 1.069 2009 2010 2011 2012 2013 SAAR Residential Improvements 84.3 81.3 90.5 93.1 96.7 2009 2010 2011 2012 2013 SAAR Annual Housing Starts 0.574 0.885 1.25 1.61 1.89 Composite 0.573 0.785 1.029 Source: Data from Resource Information Systems, Inc.,: North American Wood Panels Forecast - 5-Year Forecast Composite data represents the average of 5 to 7 third-party economic forecasts selected by BlueLinx SAAR represents seasonally adjusted annual rate 2010 Outlook 2011 Outlook Third party composite housing start forecasts average of approximately 1.0 million. Our current view is 900 thousand starts Higher wood prices Unemployment continues to recede 2009 2010 2011 2012 2013 RISI 0.63 1.08 1.45 1.61 1.89 Composite 0.575 0.799 1.051 |

| Doug Goforth Chief Financial Officer |
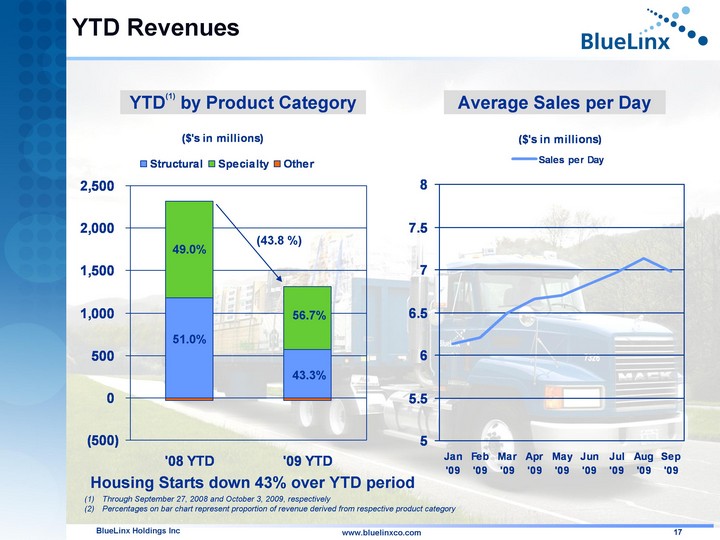
| YTD Revenues '08 YTD '09 YTD Structural 1181.2 567.6 Specialty 1132.7 741.8 Other -35.6 -29.4 Jan '09 Feb '09 Mar '09 Apr '09 May '09 Jun '09 Jul '09 Aug '09 Sep '09 Sales per Day 6.13 6.21 6.49 6.66 6.7 6.83 6.97 7.13 6.98 YTD(1) by Product Category Average Sales per Day (43.8 %) Housing Starts down 43% over YTD period 49.0% 51.0% 56.7% 43.3% Through September 27, 2008 and October 3, 2009, respectively Percentages on bar chart represent proportion of revenue derived from respective product category |

| Gross Margin & Operating Expenses YTD '08 YTD '09 YTD Structural 120.9 56.8 Specialty 161.3 101.4 Other -13.8 -10.3 GM$ by Product Category (1) Operating Expenses (1) '08 YTD '09 YTD Other 46.6 11.3 Fuel 15.5 6.8 Deprec 15 13.2 Gen Maint 18.2 14.6 Payroll & Related 155.4 113.4 57.2% 42.8% 64.1% 35.9% $155.4 $113.4 Through September 27, 2008 and October 3, 2009, respectively Percentages on bar chart represent proportion of revenue derived from respective product category |

| Gross Margin Trend Achieving gross margins above historical levels Q1 '06 Q2 '06 Q3 '06 Q4 '06 Q1 '07 Q2 '07 Q3 '07 Q4 '07 Q1 '08 Q2 '08 Q3 '08 Q4 '08 Q1 '09 Q2 '09 Q3 '09 Gross Profit Dollars 130 136.4 120.9 92.5 103.8 119.2 102.8 66.1 77.8 107.4 83.2 46.4 44.3 48.3 55.3 Gross Margin % 0.094 0.099 0.1 0.098 0.108 0.11 0.101 0.085 0.109 0.129 0.115 0.093 0.109 0.114 0.123 Adjusted Gross Margin % 0.094 0.099 0.1 0.098 0.108 0.11 0.101 0.098 0.109 0.116 0.115 0.093 0.109 0.114 0.123 [1] [2] (1) 4Q '07 adjusted for SKU rationalization initiative estimated impact of 130 basis points (2) Q2 '08 adjusted for metals price run-up estimated impact of 130 basis points |

| Operating Expenses Managing operating expenses to demand environment Q1 '06 Q2 '06 Q3 '06 Q4 '06 Q1 '07 Q2 '07 Q3 '07 Q4 '07 Q1 '08 Q2 '08 Q3 '08 Q4 '08 Q1 '09 Q2 '09 Q3 '09 OPEX 102.3 103.2 104.8 92 93.9 98.7 89.9 111.2 85.6 86.3 78.7 73.3 62.7 55.1 58.9 (1) 4Q '07 includes approximately $17.1MM of restructuring charges (2) Q2 '09 excludes benefit of $17.4MM gain on early cancellation of Master Supply Agreement with Georgia-Pacific [1] [2] |

| EBITDA 2008 to 2009 EBITDA Bridge ($ in millions) 2008 YTD EBITDA Change in GM Change in OPEX 2009 YTD EBITDA |

| Cash Cycle Days Managing working capital 3Q '07 4Q '07 1Q '08 2Q '08 3Q '08 4Q '08 1Q '09 2Q '09 3Q '09 Inv 45.8 44.7 46.3 46.3 45.3 43.9 44 44.7 44.7 A/R 34.7 32.9 34.5 35.3 34.7 32.4 33 35.6 35.6 A/P & OD's -28.7 -27.3 -28.3 -28.8 -27.8 -26.4 -27 -28.4 -28.9 Cash cycle days equal accounts receivable days + inventory days - accounts payable days using a trailing twelve month average beginning and ending balance. The days calculations use calendar days. A/P and OD's Inv A/R |
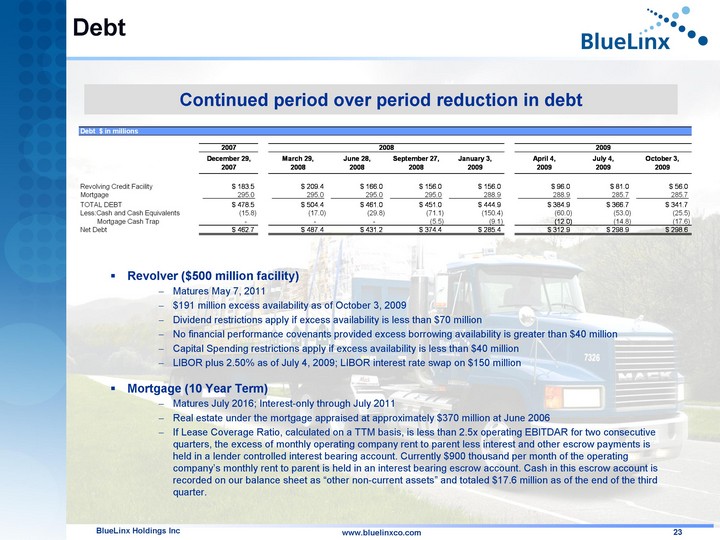
| Debt Revolver ($500 million facility) Matures May 7, 2011 $191 million excess availability as of October 3, 2009 Dividend restrictions apply if excess availability is less than $70 million No financial performance covenants provided excess borrowing availability is greater than $40 million Capital Spending restrictions apply if excess availability is less than $40 million LIBOR plus 2.50% as of July 4, 2009; LIBOR interest rate swap on $150 million Mortgage (10 Year Term) Matures July 2016; Interest-only through July 2011 Real estate under the mortgage appraised at approximately $370 million at June 2006 If Lease Coverage Ratio, calculated on a TTM basis, is less than 2.5x operating EBITDAR for two consecutive quarters, the excess of monthly operating company rent to parent less interest and other escrow payments is held in a lender controlled interest bearing account. Currently $900 thousand per month of the operating company's monthly rent to parent is held in an interest bearing escrow account. Cash in this escrow account is recorded on our balance sheet as "other non-current assets" and totaled $17.6 million as of the end of the third quarter. Continued period over period reduction in debt |

| Closing Comments Strong relationships with specialty product manufactures, brand name products, and sales expertise necessary to continue specialty products growth strategy, while also focusing on offering premium brand structural products National footprint with sophisticated logistics network enabling just in time delivery Demonstrated price discipline resulting in gross margin %'s above historical levels Cost structure aligned with operating environment and anticipate limited increases in cost structure relative to revenue growth allowing for increased profitability Ample liquidity to fund operations as revenue grows BlueLinx is Well-Positioned to take Advantage of the Housing Recovery |

| Question & Answer www.BlueLinxco.com |

| Appendix |

| EBITDA Reconciliation |

| Additional Information Additional information for Bluelinx can be found at our website www.bluelinxco.com or by contacting: Russ Zukowski Vice President - Finance Russ.Zukowski@bluelinxco.com (770) 953-7620 |