Attached files
| file | filename |
|---|---|
| 8-K - FORM 8-K - ViewPoint Financial Group | c92230e8vk.htm |

| EXHIBIT 99 |

| When used in filings by ViewPoint Financial Group ("the Company") with the Securities and Exchange Commission (the "SEC") in the Company's press releases or other public or shareholder communications, and in oral statements made with the approval of an authorized executive officer, the words or phrases "will likely result," "are expected to," "will continue," "is anticipated," "estimate," "project," "intends" or similar expressions are intended to identify "forward- looking statements" within the meaning of the Private Securities Litigation Reform Act of 1995. Such statements are subject to certain risks and uncertainties, including, among other things, changes in economic conditions, legislative changes, changes in policies by regulatory agencies, fluctuations in interest rates, the risks of lending and investing activities, including changes in the level and direction of loan delinquencies and write-offs and changes in estimates of the adequacy of the allowance for loan losses, the Company's ability to access cost-effective funding, fluctuations in real estate values and both residential and commercial real estate market conditions, demand for loans and deposits in the Company's market area, competition, changes in management's business strategies and other factors set forth under Risk Factors in our Form 10-K, that could cause actual results to differ materially from historical earnings and those presently anticipated or projected. The Company wishes to advise readers that the factors listed above could materially affect the Company's financial performance and could cause the Company's actual results for future periods to differ materially from any opinions or statements expressed with respect to future periods in any current statements. The Company does not undertake - and specifically declines any obligation - to publicly release the result of any revisions which may be made to any forward-looking statements to reflect events or circumstances after the date of such statements or to reflect the occurrence of anticipated or unanticipated events. Safe Harbor Statement |

| Our Unique Structure |

| Total Assets: $2.35 billion Total Net Loans: $1.47 billion Total Deposits: $1.74 billion Market Capitalization: $350.0 million Number of Locations: 23 Community Bank Offices 16 Loan Production Offices Employees (FTE): 606.5 57 years in Texas market #1 in market share of those banks based in Collin County Top 5 in market share in Addison, Allen, Plano, Richardson and Wylie Texas Franchise: Overview |

| Competitive Advantage Our commitment to being a Community Bank! Actively putting a 'face on banking' in the communities we serve. Continue to expand our bank network while competitors are downsizing. Allocating resources and dollars to build strong relationships within our communities. |

| Competitive Advantage 2009 Community Banking success stories: Three new bank locations opened. Gary Base named the Plano Chamber of Commerce's Business Executive of the Year New Absolute Checking reaches $140 million in deposits. Over 1,800 volunteer hours partnering with local non-profits. We're getting great press! Voted 2009 Best Community Bank |
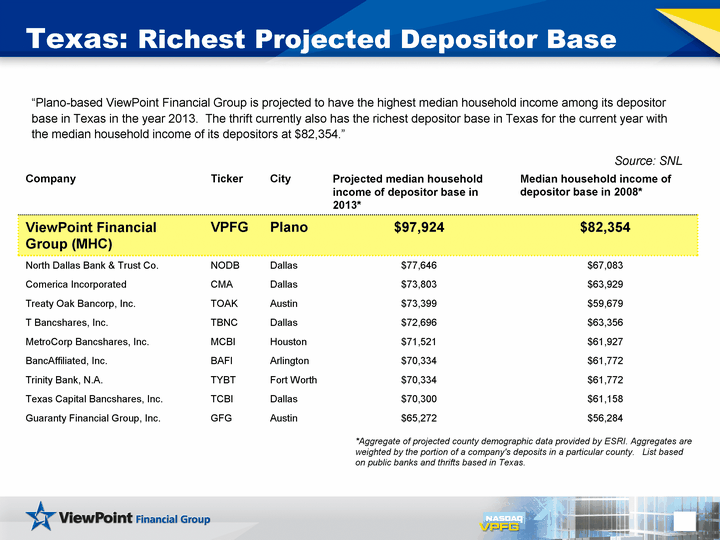
| Company Ticker City Projected median household income of depositor base in 2013* Median household income of depositor base in 2008* ViewPoint Financial Group (MHC) VPFG Plano $97,924 $82,354 North Dallas Bank & Trust Co. NODB Dallas $77,646 $67,083 Comerica Incorporated CMA Dallas $73,803 $63,929 Treaty Oak Bancorp, Inc. TOAK Austin $73,399 $59,679 T Bancshares, Inc. TBNC Dallas $72,696 $63,356 MetroCorp Bancshares, Inc. MCBI Houston $71,521 $61,927 BancAffiliated, Inc. BAFI Arlington $70,334 $61,772 Trinity Bank, N.A. TYBT Fort Worth $70,334 $61,772 Texas Capital Bancshares, Inc. TCBI Dallas $70,300 $61,158 Guaranty Financial Group, Inc. GFG Austin $65,272 $56,284 *Aggregate of projected county demographic data provided by ESRI. Aggregates are weighted by the portion of a company's deposits in a particular county. List based on public banks and thrifts based in Texas. Texas: Richest Projected Depositor Base "Plano-based ViewPoint Financial Group is projected to have the highest median household income among its depositor base in Texas in the year 2013. The thrift currently also has the richest depositor base in Texas for the current year with the median household income of its depositors at $82,354." Source: SNL |

| Dallas/Fort Worth: Lower Unemployment Rates 3/1/2008 6/1/2008 9/1/2008 12/1/2008 3/1/2009 6/1/2009 9/1/2009 US* 5.1 5.6 6.2 7.2 8.5 9.5 9.8 Collin County** 4.1 4.7 4.7 5.5 6.8 7.7 DFW* 4.4 5.1 5.2 5.9 7 8.2 8.3 Unemployment Rates * Bureau of Labor Statistics ** Real Estate Center at Texas A&M University |

| Q4 2004 Q4 2005 Q4 2006 Q4 2007 Q4 2008 Q2 2009 Dallas / Plano / Irving 2.88 3.14 3.37 3.16 2.37 1.13 US 9.29 9.36 3.65 -0.97 -8.24 -6.13 Source: Federal Housing Finance Agency House Price Index Percent Change Dallas Metroplex: Stable Home Prices |

| Dallas/Fort Worth Counties Market Rank Number of Branches Company Deposits in Market ($000) Deposit Market Share (%) Total Population 2008 (Actual) Population Change 2000-2008 (%) Projected Population Change (%) 2008-2013 Median HH Income 2008 ($) HH Income Change 2000-2008 (%) Projected HH Income Change 2008-2013 (%) Collin 3 12 1,119,682 9.29 739,133 50.33 23.04 77,663 9.4 6.1 Dallas 17 10 580,602 0.65 2,362,368 6.77 5.16 47,747 7.9 4.9 Tarrant 57 2 21,804 0.05 199,397 13.06 9.37 71,525 9.7 6.1 ViewPoint Bank's Deposit Market Share by County |

| ViewPoint's Strategy In order to improve our profitability, and maintain a strong capital position and high asset quality, we will continue to focus on our three primary engines: Commercial Real Estate Residential Mortgage Purchase Program Consumer Residential Real Estate Commerical Real Estate Commerical Non-mortgage Mortgage Loans Held for Sale 0.07 0.38 0.3 0.01 0.24 Loan Mix |
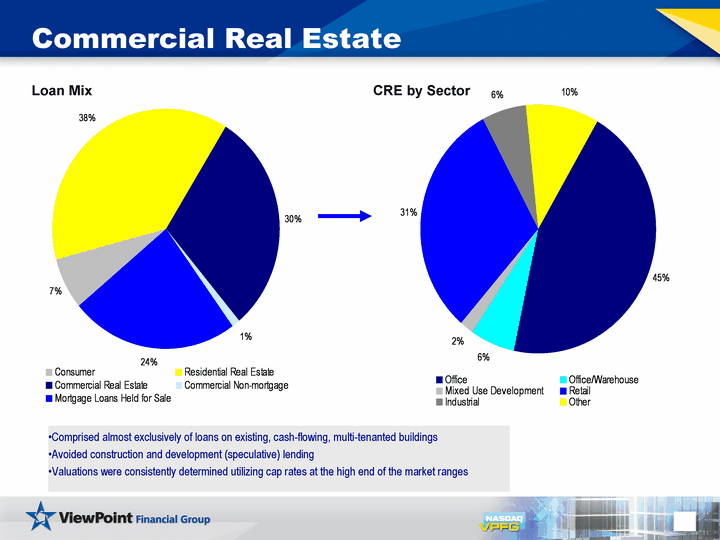
| Office Office/Warehouse Mixed Use Development Retail Industrial Other 0.45 0.06 0.02 0.31 0.06 0.1 CRE by Sector Comprised almost exclusively of loans on existing, cash-flowing, multi-tenanted buildings Avoided construction and development (speculative) lending Valuations were consistently determined utilizing cap rates at the high end of the market ranges Commercial Real Estate Loan Mix Consumer Residential Real Estate Commerical Real Estate Commerical Non-mortgage Mortgage Loans Held for Sale 0.07 0.38 0.3 0.01 0.24 |
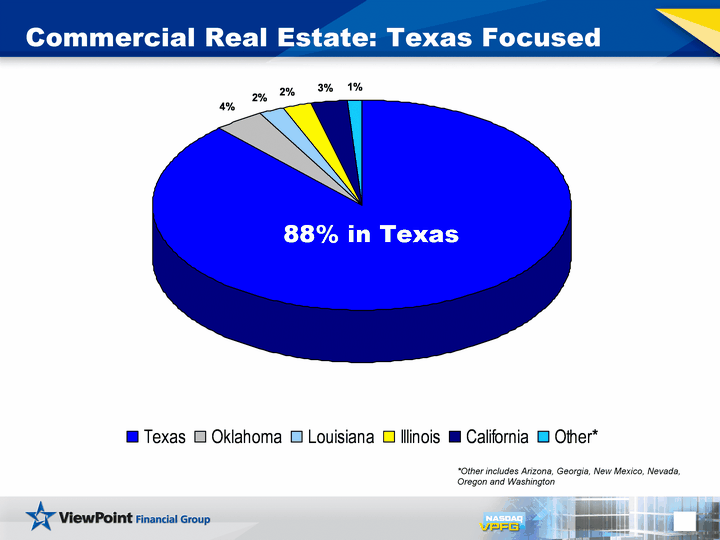
| *Other includes Arizona, Georgia, New Mexico, Nevada, Oregon and Washington Commercial Real Estate: Texas Focused Texas Oklahoma Louisiana Illinois California Other* Percentage of Porfolio 0.88 0.04 0.02 0.02 0.03 0.01 88% in Texas |
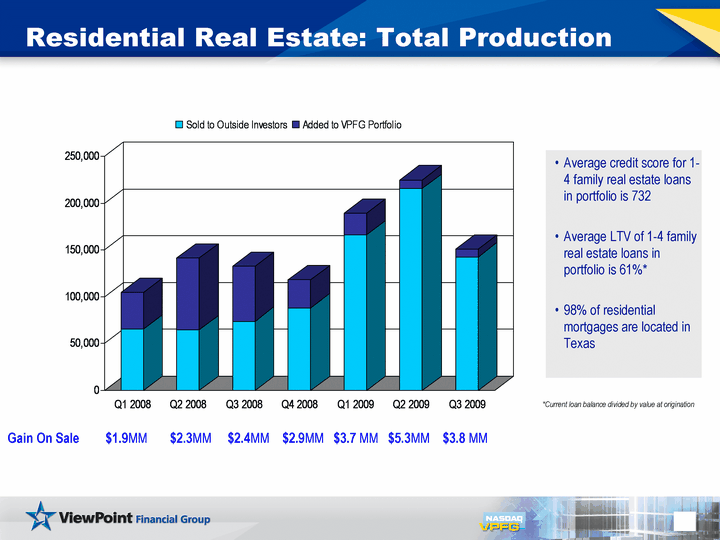
| Residential Real Estate: Total Production Average credit score for 1- 4 family real estate loans in portfolio is 732 Average LTV of 1-4 family real estate loans in portfolio is 61%* 98% of residential mortgages are located in Texas Q1 2008 Q2 2008 Q3 2008 Q4 2008 Q1 2009 Q2 2009 Q3 2009 Sold to Outside Investors 65167 64568 73808 88288 165914 215955 142625 Added to VPFG Portfolio 39728 76827 58630 30004 23603 8920 8512 Gain On Sale $1.9MM $2.3MM $2.4MM $2.9MM $3.7 MM $5.3MM $3.8 MM *Current loan balance divided by value at origination |
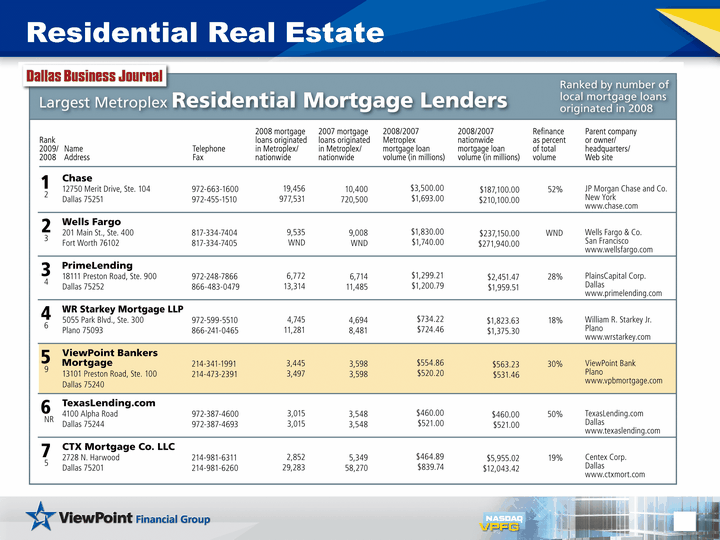
| Residential Real Estate |

| Purchase Program New program launched in July 2008 Generates three sources of earnings: YTD fee income $1,239,447, or 8.8% of fee income YTD interest income $6,767,511 Non-interest bearing deposits $27,784,823 at Sept. 30 High quality underwriting standards Conforming loans Minimum tangible net worth of $2,000,000 Personal guarantees Historical profitability |

| 2006 2007 2008 2009 YTD Total Deposits 1234881 1297593 1548090 1738081 Deposit growth in all categories Deposit growth fueled by Absolute Checking relationships Cost of funds steadily declining 2009 Deposit Growth 2 year CAGR 12% |
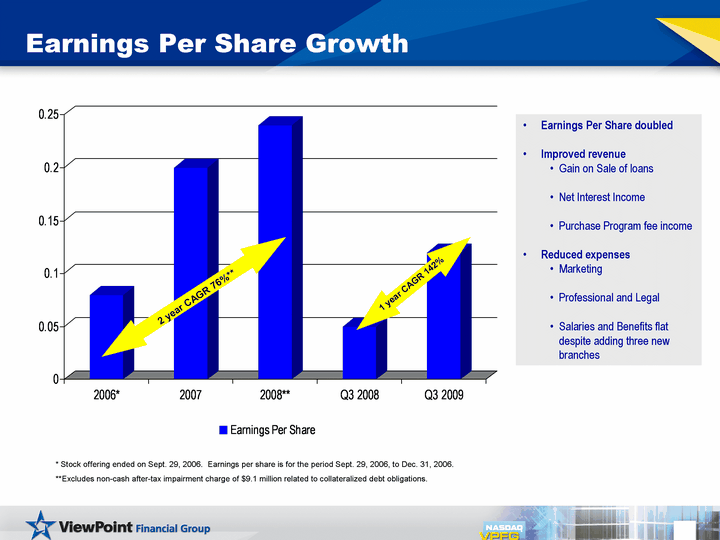
| Earnings Per Share Growth * Stock offering ended on Sept. 29, 2006. Earnings per share is for the period Sept. 29, 2006, to Dec. 31, 2006. **Excludes non-cash after-tax impairment charge of $9.1 million related to collateralized debt obligations. 2006* 2007 2008** Q3 2008 Q3 2009 Earnings Per Share 0.08 0.2 0.24 0.05 0.12 2 year CAGR 76%** 1 year CAGR 142% Earnings Per Share doubled Improved revenue Gain on Sale of loans Net Interest Income Purchase Program fee income Reduced expenses Marketing Professional and Legal Salaries and Benefits flat despite adding three new branches |

| Low Risk Investment Mix Agency MBS Agency CMO Agency Bond SBA Pools Muni 50 40 7 1 2 98% in government-backed agency investments |
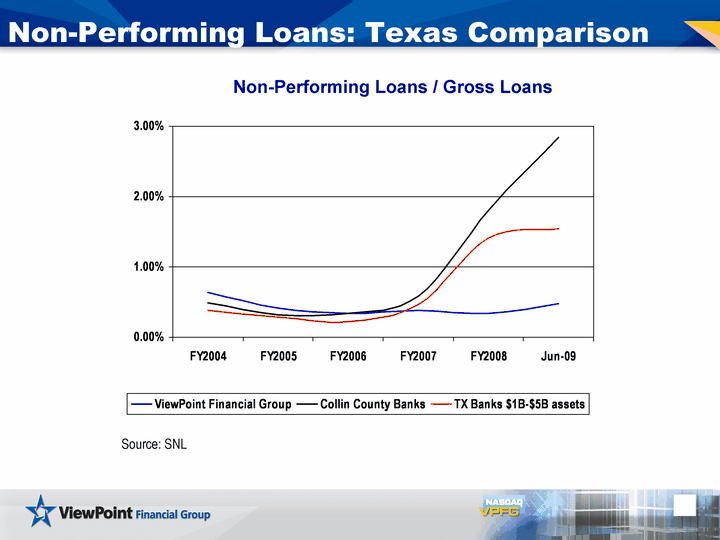
| *Source: SNL Non-Performing Loans: Texas Comparison Non-Performing Loans / Gross Loans FY2004 FY2005 FY2006 FY2007 FY2008 6/1/2009 ViewPoint Financial Group 0.0064 0.0042 0.0034 0.0038 0.0034 0.0048 Collin County Banks 0.0049 0.0032 0.0034 0.0059 0.0181 0.0284 TX Banks $1B-$5B assets 0.0038 0.0029 0.0022 0.0047 0.0141 0.0154 Source: SNL |

| Net charge-offs have declined from 0.30% of average loans at Dec. 31, 2008, to 0.26% of average loans at Sept. 30, 2009. Commercial Non-Mortgage Other Consumer Autos and Consumer Unsecured/LOC YE 2006 YE 2007 YE 2008 YTD 2009 Net Charge-Offs 0.37 0.39 0.3 0.26 Net Charge-Offs |

| *Ratios calculated at ViewPoint Bank level ViewPoint Bank Regulatory Capital Tier 1 Capital / Risk Weighted Assets Total Capital / Risk Weighted Assets Tier 1 Capital / Adjusted Assets Actual 3Q2009 as reported 0.136 0.1433 0.0765 Well-Capitalized Regulatory Capital Requirements 0.06 0.1 0.05 Tier 1 Capital / Risk Weighted Assets 13.60% 6% 14.33% 10% 7.65% 5% Total Capital / Risk Weighted Assets ViewPoint Actual Q3 2009 as reported Well-Capitalized Regulatory Capital Tier I Capital / Adjusted Assets |
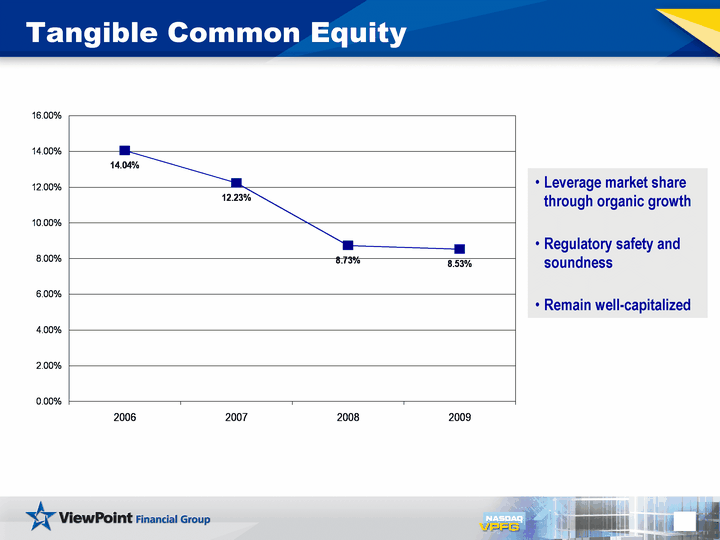
| Leverage market share through organic growth Regulatory safety and soundness Remain well-capitalized Tangible Common Equity 2006 2007 2008 2009 Tangible Common Equity 0.1404 0.1223 0.0873 0.0853 |
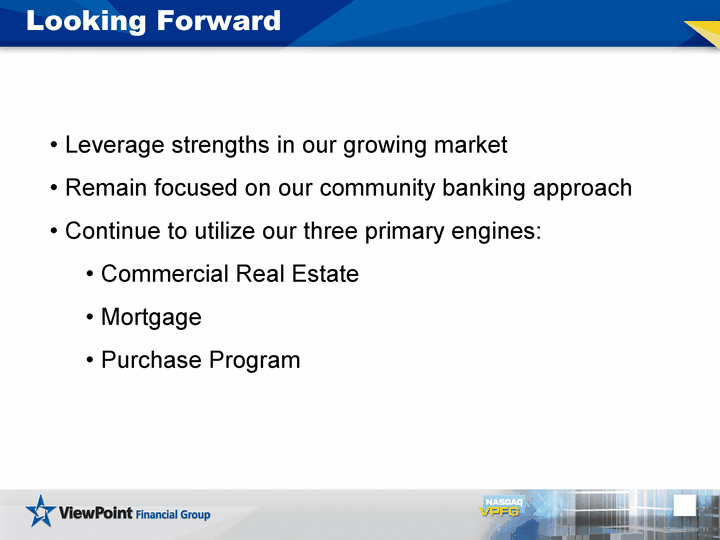
| Leverage strengths in our growing market Remain focused on our community banking approach Continue to utilize our three primary engines: Commercial Real Estate Mortgage Purchase Program Looking Forward |

