Attached files
| file | filename |
|---|---|
| 8-K - FORM 8-K 3RD QTR INVESTOR PRESENTATION - COMFORT SYSTEMS USA INC | form8-k.htm |

As
of November 10, 2009

This
presentation contains “forward-looking statements” within the meaning of the
Private Securities Litigation
Reform Act of 1995. These statements are based on the current plans and expectations of future events of
Comfort Systems USA, Inc. and involve risks and uncertainties that could cause actual future activities and
results of operations to be materially different from those set forth in the forward-looking statements. Important
factors that could cause actual results to differ include, among others, the use of incorrect estimates for bidding
a fixed-price contract, undertaking contractual commitments that exceed our labor resources, failing to perform
contractual obligations efficiently enough to maintain profitability; national or regional weakness in construction
activity and economic conditions, financial difficulties affecting projects, vendors, customers, or subcontractors,
difficulty in obtaining or increased costs associated with bonding and insurance, shortages of labor and
specialty building materials, retention of key management, our backlog failing to translate into actual revenue or
profits, errors in our percentage-of-completion method of accounting, the result of competition in our markets,
seasonal fluctuation in the demand for HVAC systems, the imposition of past and future liability from
environmental, safety, and health regulations including the inherent risk associated with self-insurance, adverse
litigation results and other risks detailed in our reports filed with the Securities and Exchange Commission. A
further list and description of these risks, uncertainties and other factors are discussed under “Item 1A.
Company Risks Factors” in the Company’s Annual Report on
Form
10-K for the
year ended December 31, 2008. These forward-looking statements speak only as of
the
date of this filing. Comfort Systems USA, Inc. expressly disclaims any obligation or undertaking to release
publicly any updates or revisions to any forward-looking statement contained herein to reflect any change in our
expectations with regard thereto or any change in events, developments, conditions or circumstances on which
any such statement is based.
Safe Harbor
Statement

3
To
be the nation’s premier
HVAC and mechanical
systems installation
HVAC and mechanical
systems installation
and
services provider.
Vision

4
Mission
To
provide the best value HVAC and
mechanical systems installation and
service, principally in the mid-market
commercial, industrial, and institutional
sectors, while caring for our customers,
employees and the environment and
realizing superior returns for our
stockholders.
mechanical systems installation and
service, principally in the mid-market
commercial, industrial, and institutional
sectors, while caring for our customers,
employees and the environment and
realizing superior returns for our
stockholders.
5
● Act
with honesty and integrity.
● Show
respect for all stakeholders.
● Exceed
customer expectations.
● Seek
“win-win” solutions.
● Demonstrate
spirit, drive, and teamwork.
● Pursue
innovation.
● Achieve
premier safety performance.
● Commit
to energy efficiency.
● Communicate
openly…..and often.
● Impact
our communities positively.
Values
6
Comfort Systems
USA
§ National
§ Commercial,
Industrial, Institutional
§ HVAC/Piping/Plumbing/Energy
Efficiency
§ Strong
balance sheet
§ Substantial
positive cash flow
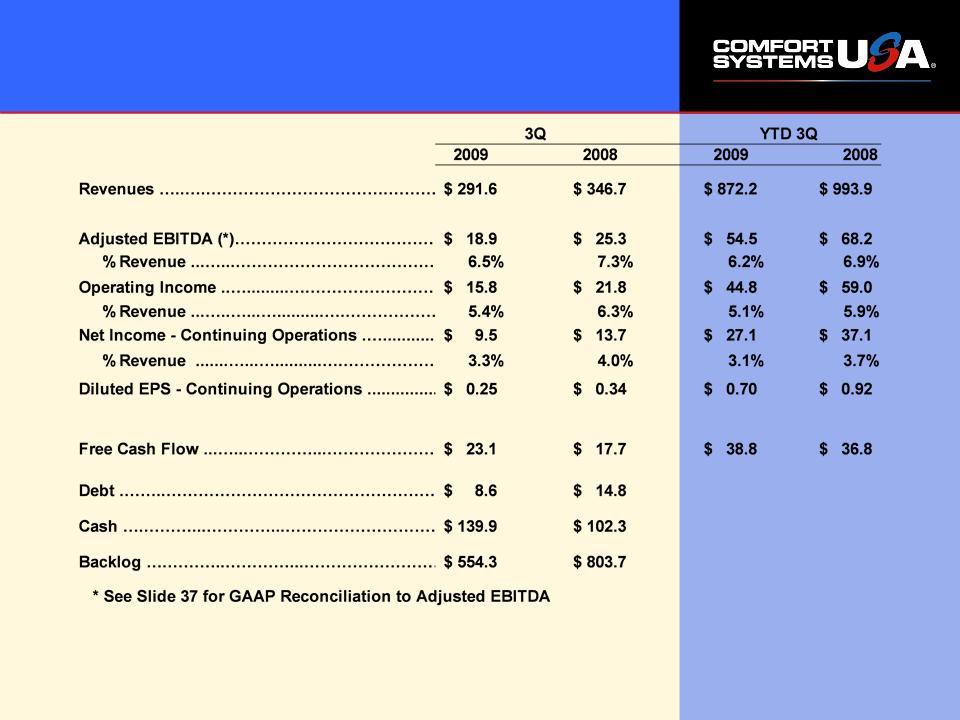
§ 52%
new construction; 48% service, repair,
retrofit (YTD Q3 09)
retrofit (YTD Q3 09)
§ 2008
Full Year Revenues $1.3 billion
§ 2009
Full Year Run Rate $1.15 billion
7
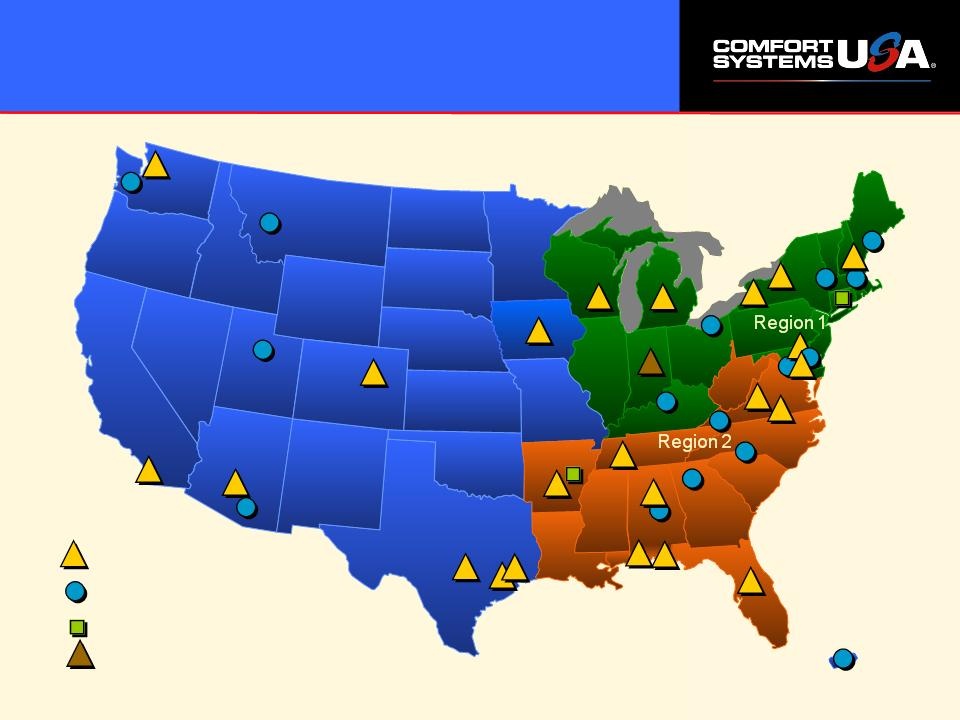
Comfort
Today
Over $20M
$10M
- $20M
Comfort
Systems USA Energy Services
Comfort
Systems USA National Accounts
ANNUAL
REVENUES
Region
3

8
What We
Do
Commercial
HVAC
§ Building
comfort
a “necessity”
a “necessity”
§ Mechanical
equipment -
requires service, repair,
replacement
requires service, repair,
replacement
§ Increasing
technical
content and building
automation
content and building
automation
§ Energy
efficiency and
Indoor Air Quality (IAQ)
emerging
Indoor Air Quality (IAQ)
emerging
§ Outsourcing
D
R I V E R S
Commercial,
Industrial, Institutional HVAC - A $40B+ Industry
Applied
Systems
Piping
Energy
Efficiency

9
Industry Trend
Toward Service &
Replacement (Recurring Revenue)
Replacement (Recurring Revenue)
§ 5+
million
commercial
buildings (DOE)
commercial
buildings (DOE)
§ Recurring
service
§ 20
year
replacement
cycle
replacement
cycle
§ “Inventory”
of
future business
future business
§ OEMs
note
significant deferred
maintenance &
replacement over
recent years
significant deferred
maintenance &
replacement over
recent years
Source:
The Trane Company
NEW
CONSTRUCTION
70%
30%
0%
50%
100%
1980
Share
of
Industry
Revenues
Industry
Revenues
Time
70%
30%
SERVICE
& REPLACEMENT

10
14%
34%
52%
Revenues by
Activity
New
Construction/
Installation
Installation
Replacement
Service
and
Maintenance
Maintenance
September
2009 YTD

11
PROJECT
SIZE
#
OF PROJECTS (As
of September 30, 2009)
Diverse Project
Mix
Average
Project Size
$425,000
$425,000
Average
Project Length
6-9 months
6-9 months
Value
of Projects >$1M
$1,286.0M
$1,286.0M
Value
of Projects <$1M
$612.5M
$612.5M
4,149
241
53
19
6
TOTAL
PROJECTS = 4,468

12
Healthcare
Education
Government
Manufacturing
Office
Building
Multi-Family
Retail/Restaurants
Other
Residential
24%
14%
12%
11%
9%
8%
12
%
%
1%
2%
Top
Ten Customers
Diverse End-Use
Base
§ Served
by 10 different Comfort operating units
§ Largest
customer = less than 2% of revenues
Lodging
& Entertainment
September
2009 YTD
4%
3%
Religious
& Not-for-Profit

13
Diverse End-Use
Base
Omni
Orlando Resort at ChampionsGate
Orlando,
Florida
University
Hospital
Little
Rock, Arkansas
Arboretum
Elementary School
Waunakee,
Wisconsin
Iowa
Renewal Energy
Washington,
Iowa
14
Competitive
Advantages
§ High
quality operations
§ Ability
to leverage and proliferate
technical expertise
technical expertise
§ Ability
to collaborate on large jobs
and share labor
and share labor
§ Energy
efficiency services
§ National
multi-location service capability
§ Purchasing
economics
§ Balance
sheet strength
§ Bonding
and insurance
§ Strong
safety record

15
§ OSHA
Incident Rate decreased from
3.21 to 2.94
3.21 to 2.94
§ Lost
Time Injury Rate is 63% less than
industry average
industry average
§ WC
claims cost per payroll dollar down
from 3.5% to <1%
from 3.5% to <1%
§ Achieved
97.6% training completed
§ 26%
reduction in the overall CSUSA
Composite Safety Index Score from
January to September
Composite Safety Index Score from
January to September
Source: Bureau
of Labor Statistics, Standard Industry Classification (SIC)
Code 20 1710 - Specialty Trades Contractors - HVAC and Plumbing & North American
Industry Classification System (NAICS) Code 23822
Code 20 1710 - Specialty Trades Contractors - HVAC and Plumbing & North American
Industry Classification System (NAICS) Code 23822
Safety
48% Difference
20% Difference
Industry
Average
(October
2008 - latest available data)
Comfort
Systems USA
(September
2009 data)
Our
safety record is no accident.

16
History -
Financial
Nonresidential
Construction
Spending
(FW
Dodge)
9/11/01
298
854
1,370
1,591
1,546
819
785
767
893
1,057
1,110
1,329
Revenues
Acquisition
Phase
and Industry Growth
and Industry Growth
Sale
of Assets

Financial
Overview
18
Financial
Profile
($ in millions, except per share amounts)
($ in millions, except per share amounts)

19
Revenues
Note:
Excludes all divested and discontinued operations

20
Operating Margins
(a)
(a) This
table includes non-GAAP financial information as the information
provided excludes goodwill impairment charges of $0.6 million and
$33.9 million for 2004 and 2005, respectively. No goodwill impairment
charge was recorded for 2006, 2007 or 2008.
provided excludes goodwill impairment charges of $0.6 million and
$33.9 million for 2004 and 2005, respectively. No goodwill impairment
charge was recorded for 2006, 2007 or 2008.
(b) Operating
margins for the nine months ended September 30, 2009 were
5.1%.
5.1%.

Backlog (in
millions)
Note:
Excludes all divested and discontinued operations

22
Strong Cash Flows
(in millions)

23
Financial
Strengths
§ Market
share up - revenue and profit
performance better than industry
performance better than industry
§ Commitment
to cost containment
§ $139.9
million cash at 9/30/09; substantial
credit capacity if needed
credit capacity if needed
§ Positive
free cash flow for ten calendar
years
years
24
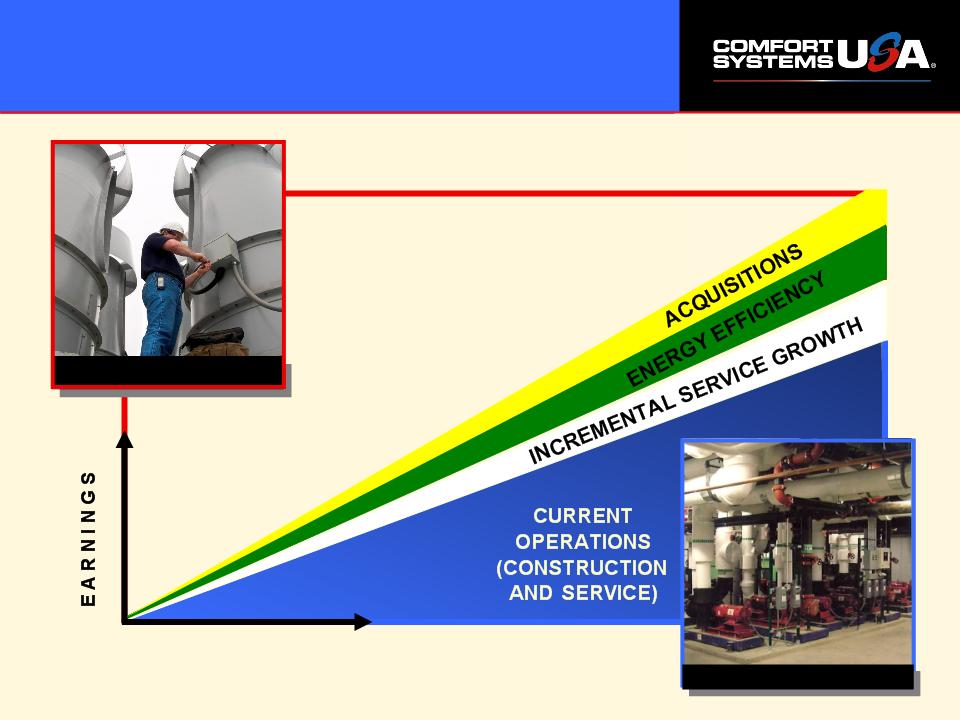
Profile For
Growth
T
I M E
Service
Commercial
HVAC

25
Operations
Increase
Productivity
§ Education
– Leadership
– Project
Managers
– Superintendents
– Service
Sales
– Service
Operations
– Craft
– Safety
§ Best
Practices
– Project
Management
– Estimating
§ Cooperation
with suppliers
§ Prefabrication
§ New
materials and methods
26
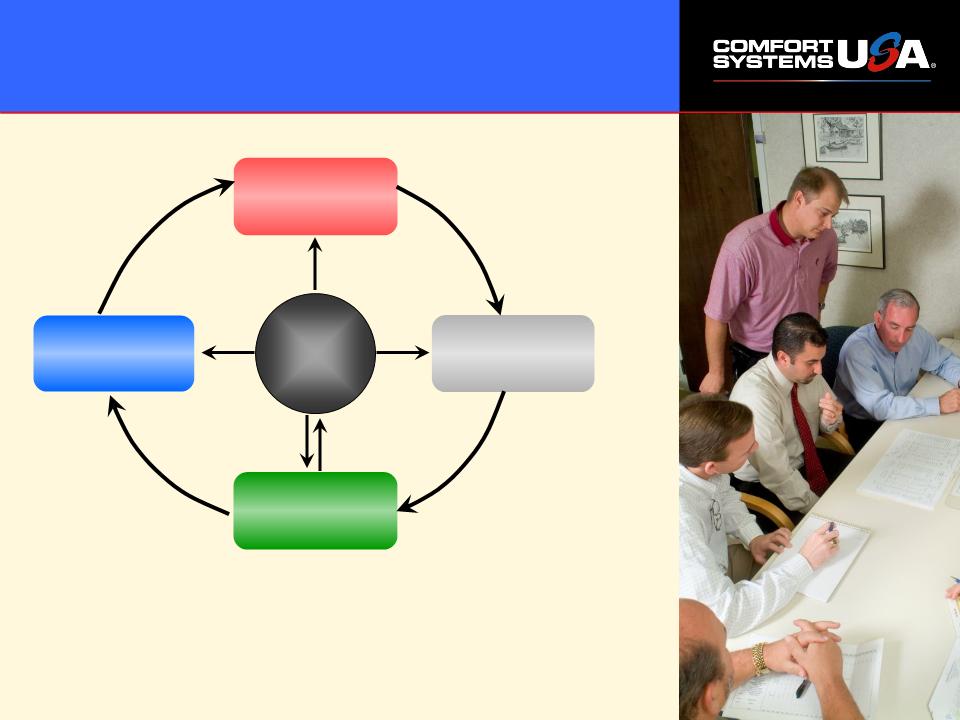
Job
Loop
Project
Estimating
Post-Project
Review
Review
We
review projects and apply what we have
learned to improve our performance.
learned to improve our performance.
Project
Pricing
Project
Qualification
Project
Management

27
The
only things that evolve by
themselves in an organization are
disorder, friction and
malperformance.
themselves in an organization are
disorder, friction and
malperformance.
-Peter
Drucker
28
Service
Increase
Service*
§ Grow
Maintenance Base
§ Education
–Employees and
Customers
§ Higher
margin opportunity
§ Recurring
revenue
§ National
accounts
§ $2.50+
of repair and replacement
for every $1.00 of maintenance
for every $1.00 of maintenance
§ Target
Retrofit Projects
–Energy
Efficiency
–Indoor Air Quality
(IAQ)
*
Maintenance, service, repair, retrofit
29
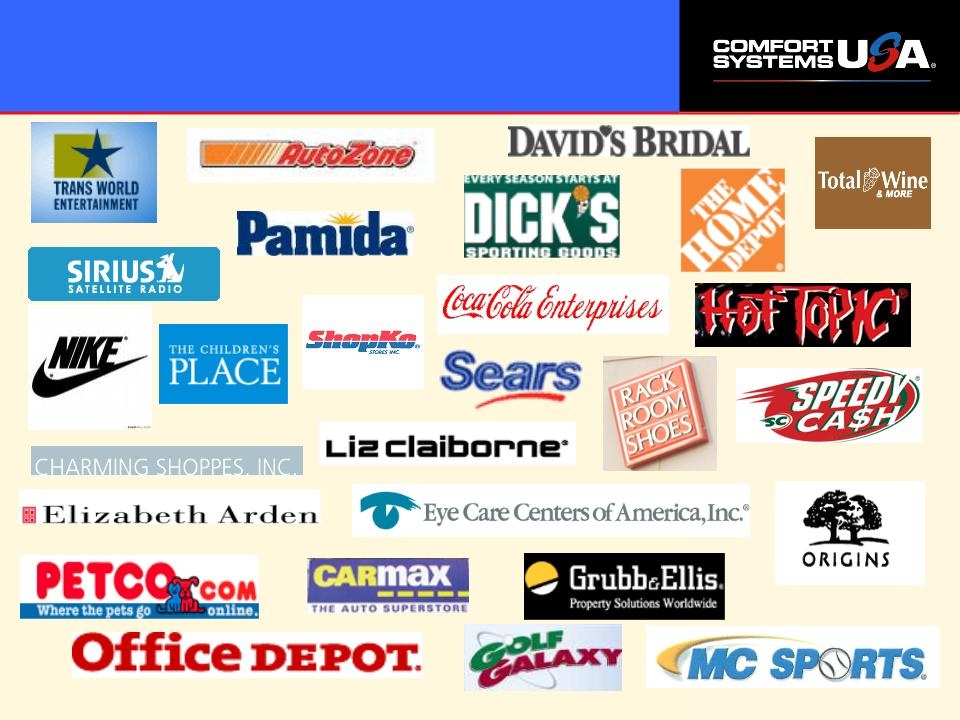
National Account
Customers
*Trademarks
and logos are the property of their respective owners.

30
Energy
Efficiency-Retrofitting HVAC
Green
Is Part Of Our Business
§ Energy
costs drive need for efficiency
§ HVAC
30% - 65 % electric usage
§ Energy
Star (Dept. of Energy/EPA) / LEED
(USGBC)
(USGBC)
Use
Our Energy to Save Yours! ™
31
Growth
§ Internal
– More of what we do
best
– Service
– Energy
efficiency
§ Step
Out Growth
– New locations for
existing companies
– Techs “on their
own”
§ Targeted
acquisitions
– Best HVAC oriented
mechanical in
new area
new area

32
● $20
million + in revenue
● Construction
and service
● In
a growing market in new area
● Company
that has performed well in the
past and has continuing demonstrable
upside
past and has continuing demonstrable
upside
● Organizational
structure capable of
sustaining/improving the company
sustaining/improving the company
● Ownership/management
that wants to
stay on to operate company
stay on to operate company
The Ideal
Candidate

33
● Boise,
ID
● Charleston,
SC
● Columbia/Florence,
SC
● Dallas/Fort
Worth, TX
● El
Paso, TX
● Ft.
Lauderdale, FL
● Los
Angeles, CA
● Nashville,
TN
● Norfolk,
VA
Target
Markets
(Listed
Alphabetically)
● Omaha,
NE
●
Portland,
OR
● Raleigh,
NC
● Richmond,
VA
● San
Antonio, TX
● Savannah,
GA
●
Spartanburg/Greenville,
SC
● Tampa,
FL
● Tulsa,
OK

34
Outlook
Long-Term
§ $40+
billion fragmented industry
§ HVAC
is a basic necessity
§ Commercial
construction continuing
§ Growing
installed base for recurring
maintenance, service, repair and retrofit
maintenance, service, repair and retrofit
§ Scale
opportunities - service, purchasing,
prefab, bonding, best practices
prefab, bonding, best practices
§ Diverse
customer base and geography
§ Energy
efficiency and
Indoor Air Quality
§ Financially
and operationally sound - continuing
to grow organically and by acquisition
to grow organically and by acquisition
35
What We
Do

37
Appendix
38
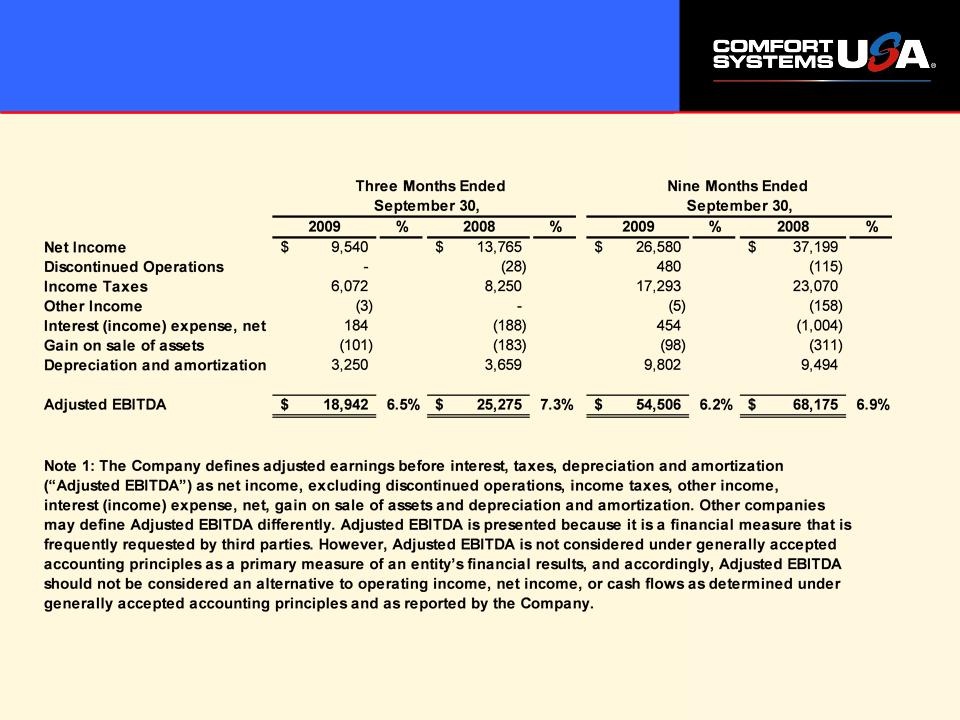
Appendix - GAAP
Reconciliation To
Adjusted EBITDA (in thousands)
Adjusted EBITDA (in thousands)

C
O N T A C T:
Bill
George
Executive
Vice President and CFO
1-800-723-8431
bgeorge@comfortsystemsusa.com
www.comfortsystemsusa.com