Attached files
| file | filename |
|---|---|
| 8-K - FORM 8-K - Allied World Assurance Co Holdings, AG | c92365e8vk.htm |
Exhibit 99.1

| INVESTOR PRESENTATION 3rd Quarter 2009 |
| Forward Looking Statements & Safe Harbor This presentation contains certain statements, estimates and forecasts with respect to future performance and events. These statements, estimates and forecasts are "forward-looking statements". In some cases, forward- looking statements can be identified by the use of forward-looking terminology such as "may," "might," "will," "should," "expect," "plan," "intend," "estimate," "anticipate," "believe," "predict," "potential" or "continue" or the negatives thereof or variations thereon or similar terminology. All statements other than statements of historical fact included in this presentation are forward-looking statements and are based on various underlying assumptions and expectations and are subject to known and unknown risks, uncertainties and assumptions, may include projections of our future financial performance based on our growth strategies and anticipated trends in our business. These statements are only predictions based on our current expectations and projections about future events. There are important factors that could cause our actual results, level of activity performance or achievements to differ materially from the results, level of activity, performance or achievements expressed or implied in the forward-looking statements. As a result, there can be no assurance that the forward-looking statements included in this presentation will prove to be accurate or correct. In light of these risks, uncertainties and assumptions, the future performance or events described in the forward- looking statements in this presentation might not occur. Accordingly, you should not rely upon forward-looking statements as a prediction of actual results and we do not assume any responsibility for the accuracy or completeness of any of these forward-looking statements that may be made from time to time. We are under no obligation (and expressly disclaim any such obligation) to update or revise any forward-looking statements, whether as a result of new information, future developments or otherwise. |
| Executive Summary Direct Insurance Reinsurance Financial Results and Strength Peer Comparison / Conclusion Appendix Agenda |
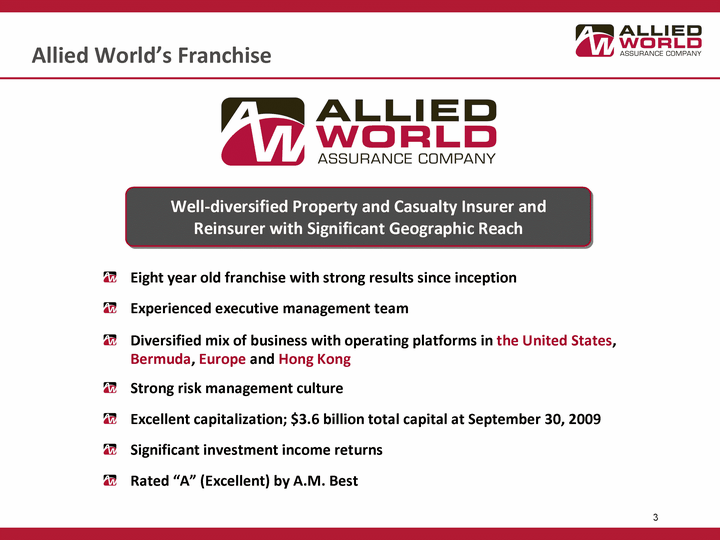
| Allied World's Franchise Eight year old franchise with strong results since inception Experienced executive management team Diversified mix of business with operating platforms in the United States, Bermuda, Europe and Hong Kong Strong risk management culture Excellent capitalization; $3.6 billion at September 30, 2009 Significant investment income returns Rated "A" (Excellent) by A.M. Best Well-diversified Property and Casualty Insurer and Reinsurer with Significant Geographic Reach |
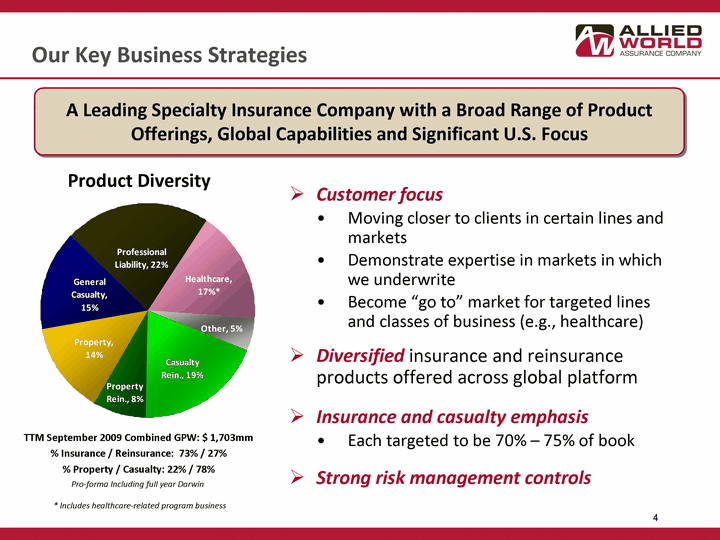
| Customer focus Moving closer to clients in certain lines and markets Demonstrate expertise in markets in which we underwrite Become "go to" market for targeted lines and classes of business (e.g., healthcare) Diversified insurance and reinsurance products offered across global platform Insurance and casualty emphasis Each targeted to be 70% - 75% of book Strong risk management controls Our Key Business Strategies TTM September 2009 Combined GPW: $ 1,703mm % Insurance / Reinsurance: 73% / 27% % Property / Casualty: 22% / 78% Product Diversity A Leading Specialty Insurance Company with a Broad Range of Product Offerings, Global Capabilities and Significant U.S. Focus Pro-forma Including full year Darwin * Includes healthcare-related program business General Casualty Prof. Liability Healthcare Prog. Other Casualty Rein. Property Rein. Property 0.15 0.22 0.17 0 0.05 0.19 0.08 0.14 |
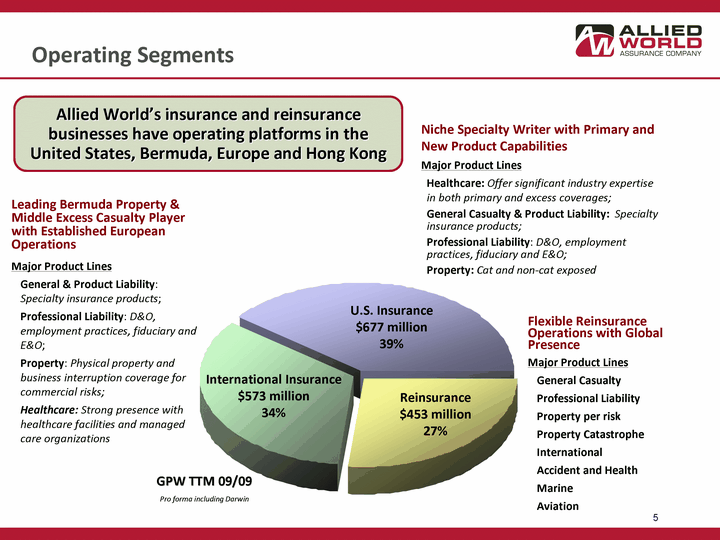
| Reinsurance International Insurance U.S. GWP 454 573 667 Operating Segments Niche Specialty Writer with Primary and New Product Capabilities Major Product Lines Healthcare: Offer significant industry expertise in both primary and excess coverages; General Casualty & Product Liability: Specialty insurance products; Professional Liability: D&O, employment practices, fiduciary and E&O; Property: Cat and non-cat exposed Leading Bermuda Property & Middle Excess Casualty Player with Established European Operations Major Product Lines General & Product Liability: Specialty insurance products; Professional Liability: D&O, employment practices, fiduciary and E&O; Property: Physical property and business interruption coverage for commercial risks; Healthcare: Strong presence with healthcare facilities and managed care organizations Flexible Reinsurance Operations with Global Presence Major Product Lines General Casualty Professional Liability Property per risk Property Catastrophe International Accident and Health Marine Aviation GPW TTM 09/09 Pro forma including Darwin Allied World's insurance and reinsurance businesses have operating platforms in the United States, Bermuda, Europe and Hong Kong International Insurance $573 million 34% U.S. Insurance $677 million 39% Reinsurance $453 million 27% |
| Market Conditions Market Dislocation Distressed carriers are using government aided balance sheets to remain viable Opportunities exist in casualty marketplace but are dampened by economic headwinds Competitive Pricing Remains Casualty rate increases small, slow to emerge and often offset by premium decreases from exposure changes Property rates were up nicely through September 2009 but have begun to tail off after benign catastrophe season Strong book value growth and reserve positions will temper rate increases Reinsurance Pricing Reinsurance purchasing is increasing demand as cedents look to diversify carriers Some tightening of terms Inflationary Pressures Slow economy has led to continued concern over lowering of interest rates; however U.S. government's significant deficit spending increases inflationary pressures We believe inflation concerns may pressure key insurance loss drivers such as medical cost inflation and building materials in the intermediate turn |
| Expanded direct U.S. insurance operating platform Investments in U.S. operations deepened underwriting talent and expanded regional presence; now with 10 branch office locations throughout the U.S. Expanded primary business capabilities - Darwin acquisition over year old and company is fully integrated. Business improves cycle management capabilities by increasing access to attractive, less price-sensitive, small account primary and healthcare business Established U.S. reinsurance company Increases access to U.S. regional business and "decision makers" Statutory surplus in excess of $600 million Senior staff in place Expanded presence in Europe and Asia Now have international offices in London, Dublin, Switzerland, and Hong Kong to better position company to meet developing opportunities and build out a global platform Reduced writings in lines that did not meet our underwriting requirements Scaled back certain financial institution professional liability and energy lines of business Positioned to Succeed Recent Actions Consistent with Strategies to Build Sustainable Franchise that Performs Well in all Market Conditions |
| Allied World expanded the breadth of its operations and meaningfully increased its capital position in 2008 and through the third quarter 2009 despite the financial crisis and 2008 catastrophe events Superior Execution in a Challenging Marketplace Record Capital Level $3.6 billion total capital base at September 30, 2009 Consistently Strong Operating Performance Operating Income - $406 million through September 2009, a 20.8% annualized operating return on average shareholders' equity Consistent Performance - Combined ratio below 85% and operating ROE in excess of 20% for 2006 through 2008 and through September 2009 Favorable Reserve Development - Each of last 6 years, $170 million year-to-date September 2009 Investment Returns Supplement Underwriting - $227 million net investment income through September 2009; $309 million in full year 2008 Strong Operating Cash Flows - $567 million through September 2009; $657 million in full year 2008 Book Value Growth Diluted book value per share increased 24% through September 2009 to $57.20; Increased 8% in 2008 despite turbulent year |
| Executive Summary Direct Insurance Reinsurance Financial Results and Strength Peer Comparison / Conclusion Appendix Agenda |
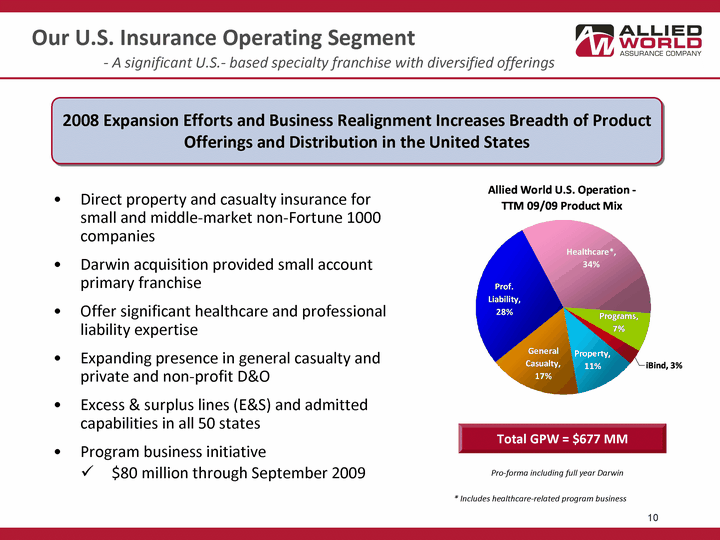
| General Casualty Prof. Liability Healthcare Programs iBind Property East 0.17 0.28 0.33 0.08 0.03 0.11 Our U.S. Insurance Operating Segment - A significant U.S.- based specialty franchise with diversified offerings Direct property and casualty insurance for small and middle-market non-Fortune 1000 companies Darwin acquisition provided small account primary franchise Offer significant healthcare and professional liability expertise Expanding presence in general casualty and private and non-profit D&O Excess & surplus lines (E&S) and admitted capabilities in all 50 states Program business initiative $80 million through September 2009 Total GPW = $677 MM 2008 Expansion Efforts and Business Realignment Increases Breadth of Product Offerings and Distribution in the United States Pro-forma including full year Darwin * Includes healthcare-related program business |

| Expanding U.S. Operating Platform Significant infrastructure investments made throughout 2008 and 2009 Dedicated U.S. management team with significant industry experience 403 staff count, 64% of Allied World group Enhancements implemented to IT platform Opened and expanded offices in strategically important locations throughout the U.S. Allied World's Expanded Presence in U.S. has Significantly Enhanced the Market Profile of our Domestic Operations National niche excess & surplus writer Admitted capabilities in 50 states One of few approved Defense-Based Act underwriters San Francisco Los Angeles Costa Mesa Dallas Chicago Atlanta Boston Farmington New York St. Petersburg |
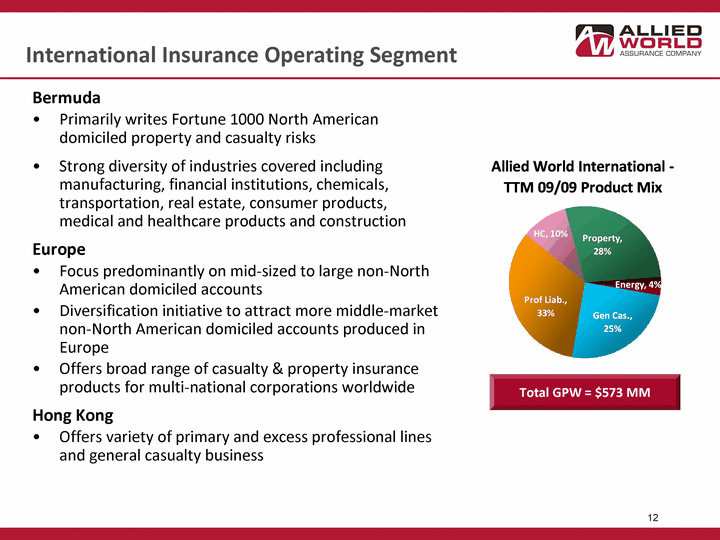
| International Insurance Operating Segment Prof Liab. HC Proprty Energy Gen Cas. East 0.33 0.1 0.28 0.04 0.26 Bermuda Primarily writes Fortune 1000 North American domiciled property and casualty risks Strong diversity of industries covered including manufacturing, financial institutions, chemicals, transportation, real estate, consumer products, medical and healthcare products and construction Europe Focus predominantly on mid-sized to large non-North American domiciled accounts Diversification initiative to attract more middle-market non-North American domiciled accounts produced in Europe Offers broad range of casualty & property insurance products for multi-national corporations worldwide Hong Kong Offers variety of primary and excess professional lines and general casualty business Established Singapore presence Total GPW = $573 MM |
| Executive Summary Direct Insurance Reinsurance Financial Results and Strength Peer Comparison / Conclusion Appendix Agenda |
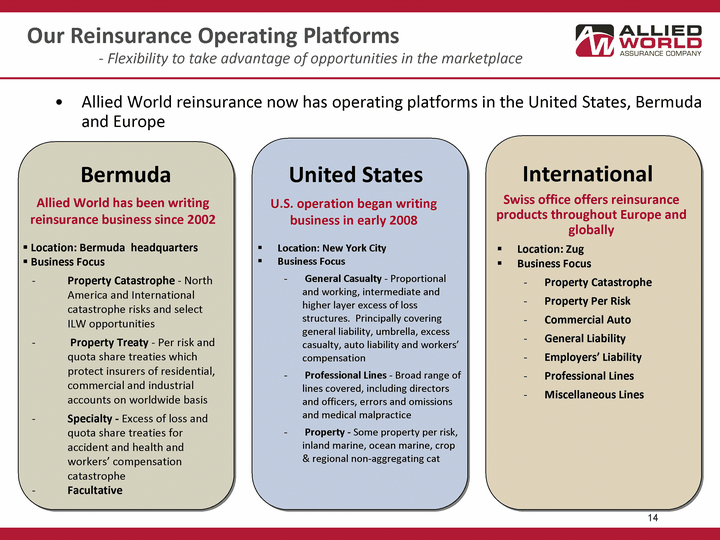
| Bermuda Allied World has been writing reinsurance business since 2002 Location: Bermuda headquarters Business Focus Property Catastrophe - North America and International catastrophe risks and select ILW opportunities Property Treaty - Per risk and quota share treaties which protect insurers of residential, commercial and industrial accounts on worldwide basis Specialty - Excess of loss and quota share treaties for accident and health and workers' compensation catastrophe Facultative United States U.S. operation began writing business in early 2008 Location: New York City Business Focus General Casualty - Proportional and working, intermediate and higher layer excess of loss structures. Principally covering general liability, umbrella, excess casualty, auto liability and workers' compensation Professional Lines - Broad range of lines covered, including directors and officers, errors and omissions and medical malpractice Property - Some property per risk, inland marine, ocean marine, crop & regional non-aggregating cat Allied World reinsurance now has operating platforms in the United States, Bermuda and Europe International Swiss office offers reinsurance products throughout Europe and globally Our Reinsurance Operating Platforms - Flexibility to take advantage of opportunities in the marketplace Location: Zug Business Focus Property Catastrophe Property Per Risk Commercial Auto General Liability Employers' Liability Professional Lines Miscellaneous Lines |
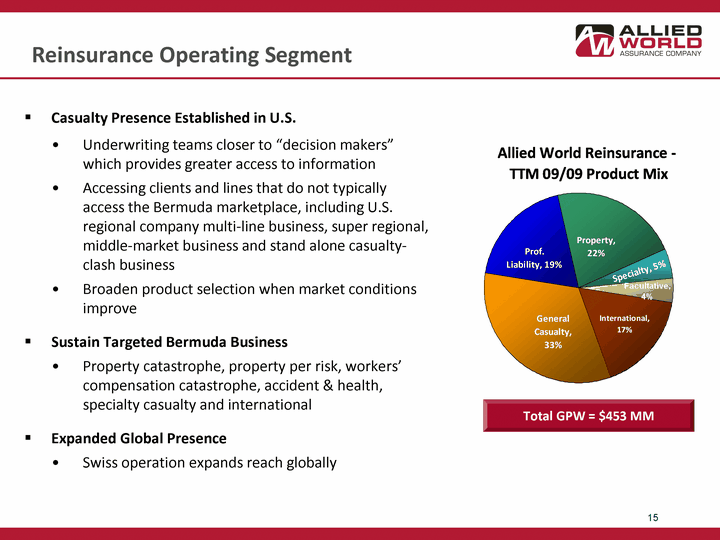
| Reinsurance Operating Segment Casualty Presence Established in U.S. Underwriting teams closer to "decision makers" which provides greater access to information Accessing clients and lines that do not typically access the Bermuda marketplace, including U.S. regional company multi-line business, super regional, middle-market business and stand alone casualty- clash business Broaden product selection when market conditions improve Sustain Targeted Bermuda Business Property catastrophe, property per risk, workers' compensation catastrophe, accident & health, specialty casualty and international Expanded Global Presence Swiss operation expands reach globally General Casualty Prof. Liability General Property Specialty Facultative International 0.33 0.19 0.22 0.05 0.04 0.17 Total GPW = $453 MM |
| Executive Summary Direct Insurance Reinsurance Financial Results and Strength Peer Comparison / Conclusion Appendix Agenda |
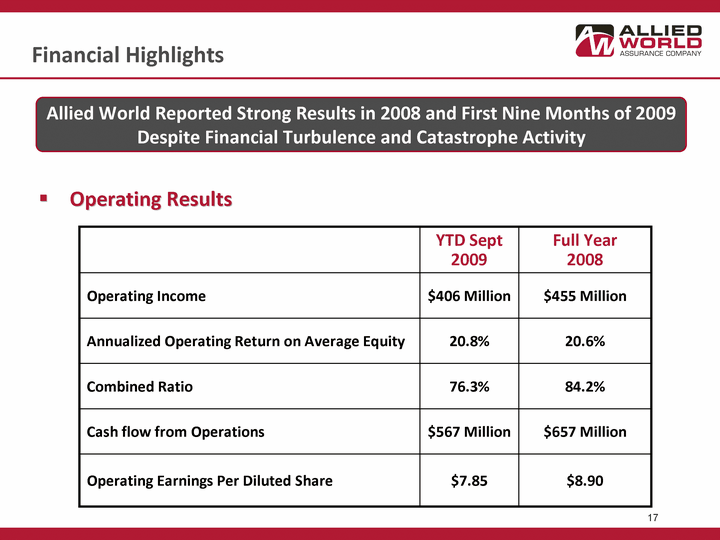
| Operating Results Allied World Reported Strong Results in 2008 and First Nine Months of 2009 Despite Financial Turbulence and Catastrophe Activity Financial Highlights YTD Sept 2009 Full Year 2008 Operating Income $406 Million $455 Million Annualized Operating Return on Average Equity 20.8% 20.6% Combined Ratio 76.3% 84.2% Cash flow from Operations $567 Million $657 Million Operating Earnings Per Diluted Share $7.85 $8.90 |
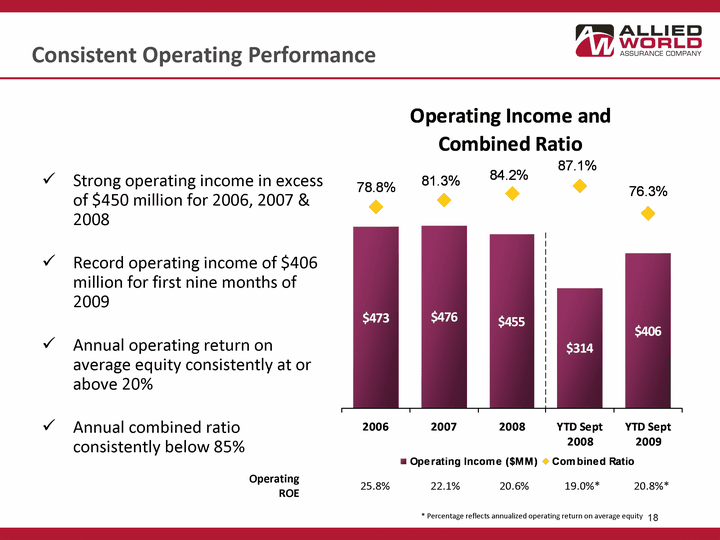
| Consistent Operating Performance Operating Income ($MM) Combined Ratio 2006 473 0.788 2007 476 0.813 2008 455 0.842 YTD Sept 2008 314 0.871 YTD Sept 2009 406 0.763 Operating ROE 25.8% 22.1% 20.6% 19.0%* 20.8%* Strong operating income in excess of $450 million for 2006, 2007 & 2008 Record operating income of $406 million for first nine months of 2009 Annual operating return on average equity consistently at or above 20% Annual combined ratio consistently below 85% * Percentage reflects annualized operating return on average equity |
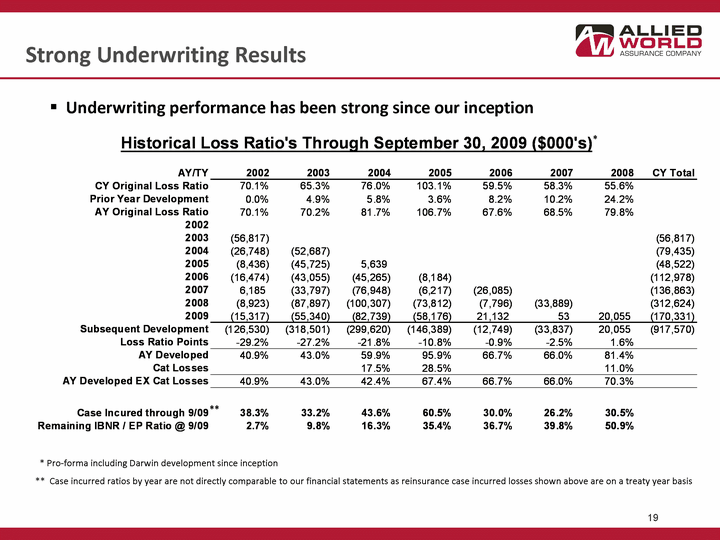
| Strong Underwriting Results Underwriting performance has been strong since our inception * * Pro-forma including Darwin development since inception ** Case incurred ratios by year are not directly comparable to our financial statements as reinsurance case incurred losses shown above are on a treaty year basis ** |
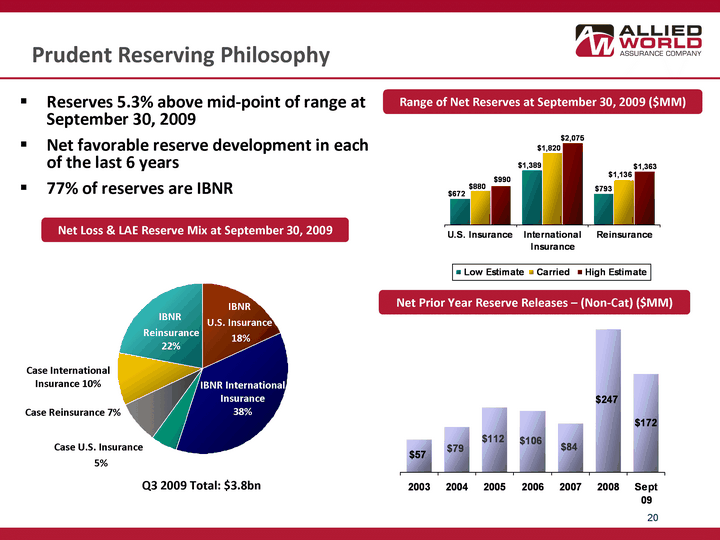
| 2003 2004 2005 2006 2007 2008 Sept 09 Reserves 5.3% above mid-point of range at September 30, 2009 Net favorable reserve development in each of the last 6 years 77% of reserves are IBNR U.S. Insurance International Insurance Reinsurance Low Estimate 672.4 1388.9 793.2 Carried 880.3 1819.5 1135.8 High Estimate 990.3 2075 1362.8 Net Loss & LAE Reserve Mix at September 30, 2009 3/31/2009 IBNR U.S. Insurance 0.18 IBNR International Insurance 0.37 OSLR U.S. Insurance 0.05 OSLR Reins 0.08 OSLR International Insurance 0.1 IBNR Reinsurance 0.22 Case U.S. Insurance 5% IBNR International Insurance 38% Case International Insurance 10% IBNR Reinsurance 22% Case Reinsurance 7% IBNR U.S. Insurance 18% Q3 2009 Total: $3.8bn Net Prior Year Reserve Releases - (Non-Cat) ($MM) Range of Net Reserves at September 30, 2009 ($MM) Prudent Reserving Philosophy |
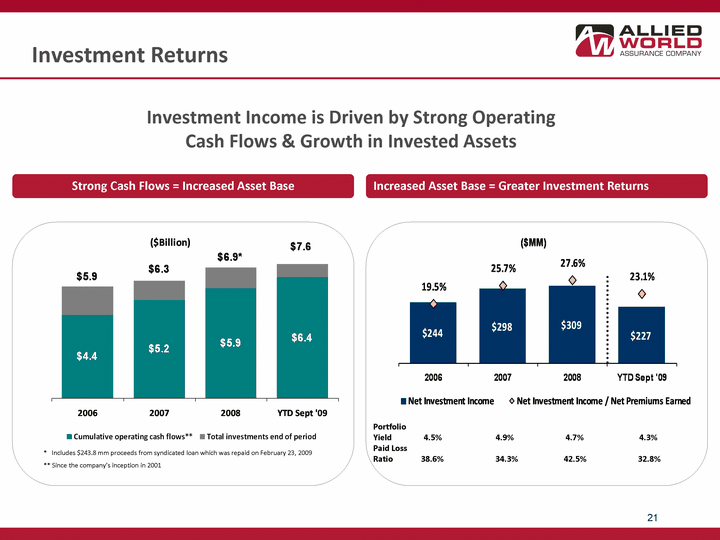
| Investment Returns Cumulative operating cash flows** Total investments end of period Combined Ratio (ex. Cats) Combined Ratio (with Cats) 2004 2.8 1.4 129 113 2005 3.6 1.3 179 192.3 2006 4.4 1.5 240 2007 5.2 1 265.6 2008 5.8 1.1 YTD Sept '09 6.4 1.2 Investment Income is Driven by Strong Operating Cash Flows & Growth in Invested Assets Portfolio Yield 4.5% 4.9% 4.7% 4.3% Paid Loss Ratio 38.6% 34.3% 42.5% 32.8% Net Investment Income Net Investment Income / Net Premiums Earned 2004 129 0.097 2005 179 0.14 2006 244 0.195 2007 297.9 0.257 2008 308.8 0.276 YTD Sept '09 227.4 0.231 Increased Asset Base = Greater Investment Returns Strong Cash Flows = Increased Asset Base * Includes $243.8 mm proceeds from syndicated loan which was repaid on February 23, 2009 ** Since the company's inception in 2001 |
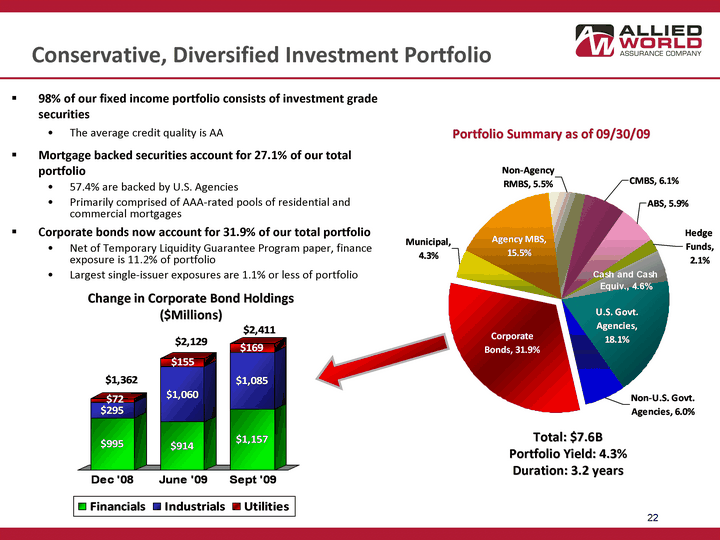
| 98% of our fixed income portfolio consists of investment grade securities The average credit quality is AA Mortgage backed securities account for 27.1% of our total portfolio 57.4% are backed by U.S. Agencies Primarily comprised of AAA-rated pools of residential and commercial mortgages Corporate bonds now account for 31.9% of our total portfolio Net of Temporary Liquidity Guarantee Program paper, finance exposure is 11.2% of portfolio Largest single-issuer exposures are 1.1% or less of portfolio Portfolio Summary as of 09/30/09 U.S. Govt. Agencies 0.181 Non-U.S. government securities 0.06 Corporate Bonds 0.319 Municipal 0.043 Agency MBS 0.155 Non-Agency RMBS 0.055 CMBS 0.061 ABS 0.059 Hedge Funds 0.021 Cash and Cash Equiv. 0.046 Total: $7.6B Portfolio Yield: 4.3% Duration: 3.2 years Conservative, Diversified Investment Portfolio Dec '08 June '09 Sept '09 Financials 995 914 1157 Industrials 295 1060 1085 Utilities 72 155 169 Total 1368 2129 2411 Change in Corporate Bond Holdings ($Millions) |
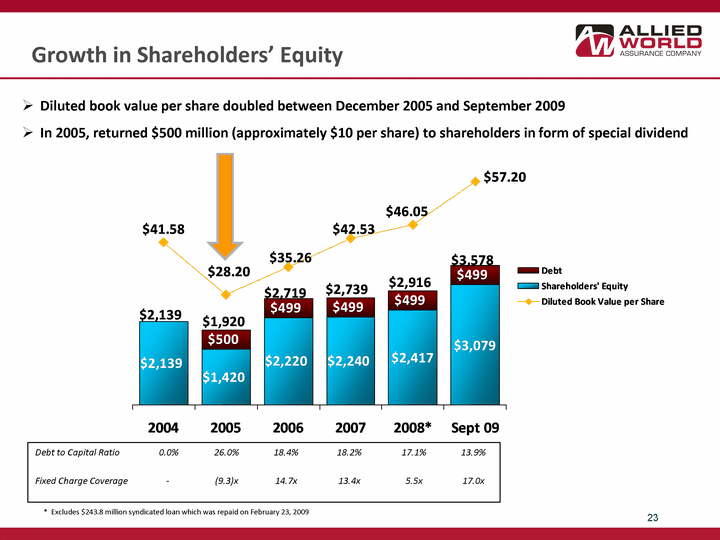
| Growth in Shareholders' Equity Diluted book value per share doubled between December 2005 and September 2009 In 2005, returned $500 million (approximately $10 per share) to shareholders in form of special dividend 2004 2005 2006 2007 2008* Sept 09 Shareholders' Equity 2139 1420 2220 2240 2417 3079 Debt $- 500 499 499 499 499 Debt to Capital Ratio 0.0% 26.0% 18.4% 18.2% 17.1% 13.9% Fixed Charge Coverage - (9.3)x 14.7x 13.4x 5.5x 17.0x * Excludes $243.8 million syndicated loan which was repaid on February 23, 2009 |
| Executive Summary Direct Insurance Reinsurance Financial Results and Strength Peer Comparison / Conclusion Appendix Agenda |
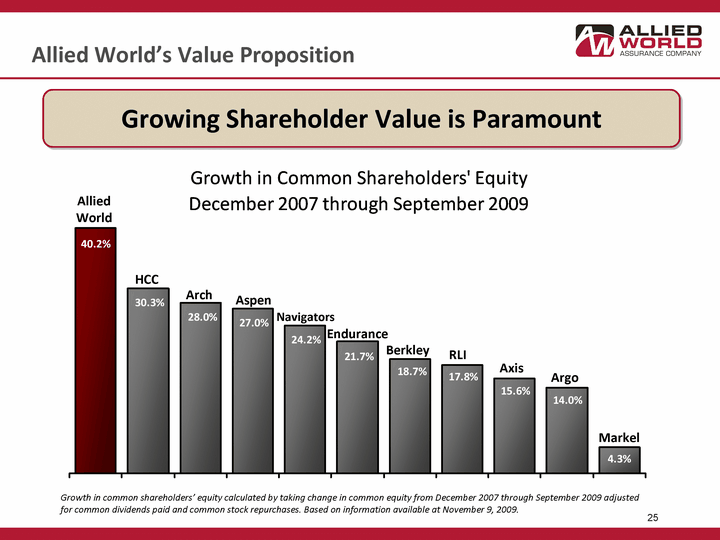
| Allied World Navigators HCC Aspen Argo Arch Endurance RLI Axis Markel Berkly 0.375 0.225 0.224 0.192 0.136 0.115 0.085 0.068 0.051 0.02 0.003 Allied World's Value Proposition Allied World HCC Aspen Arch RLI Berkley Endurance Axis Growing Shareholder Value is Paramount Markel Navigators Argo |
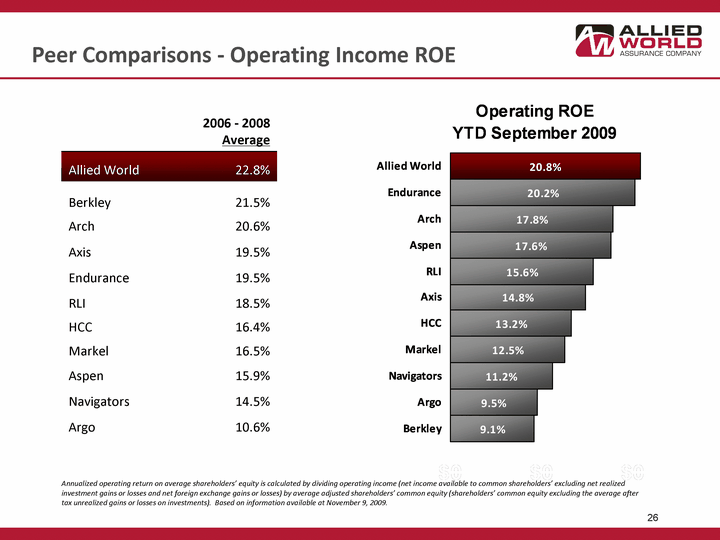
| Bermuda Peers U.S. Peers Berkley 0.091 Argo 0.095 Navigators 0.112 Markel 0.125 HCC 0.132 Axis 0.148 RLI 0.156 Aspen 0.167 Arch 0.178 Endurance 0.202 Allied World 0.208 Peer Comparisons - Operating Income ROE Annualized operating return on average shareholders' equity is calculated by dividing operating income (net income available to common shareholders' excluding net realized investment gains or losses and net foreign exchange gains or losses) by average adjusted shareholders' common equity (shareholders' common equity excluding the average after tax unrealized gains or losses on investments). Based on information available at November 9, 2009. 2006 - 2008 Average Allied World 22.8% Berkley 21.5% Arch 20.6% Axis 19.5% Endurance 19.5% RLI 18.5% HCC 16.4% Markel 16.5% Aspen 15.9% Navigators 14.5% Argo 10.6% |
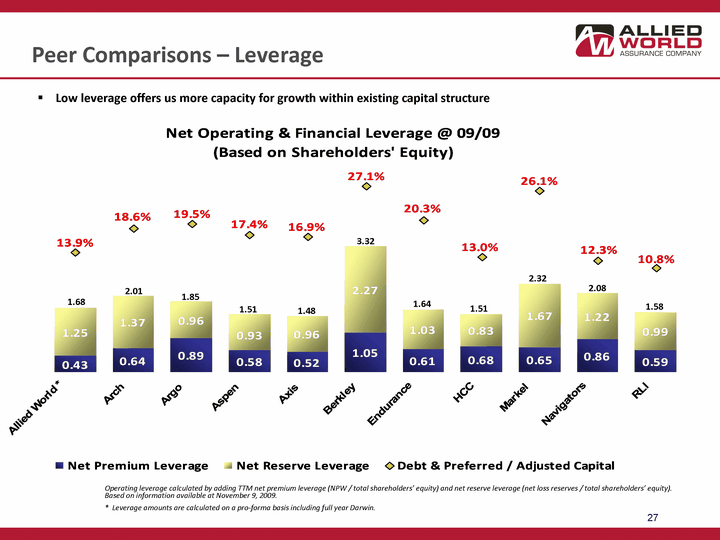
| Net Premium Leverage Net Reserve Leverage Debt & Preferred / Adjusted Capital Allied World * 0.43 1.25 0.139 Arch 0.64 1.37 0.186 Argo 0.89 0.96 0.195 Aspen 0.58 0.93 0.174 Axis 0.52 0.96 0.169 Berkley 1.05 2.27 0.271 Endurance 0.61 1.03 0.203 HCC 0.68 0.83 0.13 Markel 0.65 1.67 0.261 Navigators 0.86 1.22 0.123 RLI 0.59 0.99 0.108 Peer Comparisons - Leverage Operating leverage calculated by adding net premium leverage (NPW / total shareholders' equity) and net reserve leverage (net loss reserves / total shareholders' equity). * Leverage amounts are calculated on a pro-forma basis including full year Darwin. Low leverage offers us more capacity for growth within existing capital structure 2.01 1.51 1.48 1.64 1.51 2.32 1.68 3.32 1.58 2.08 1.85 |
| Conclusion Allied World Expects to Generate a Mid-teen ROE, Assuming Normalized Catastrophe Activity Strong underwriting franchise diversified by product and geography Experienced executive management team in place Excellent capitalization, strong balance sheet and financial flexibility Significant infrastructure investments made during 2008 One year later, the Darwin acquisition is compete and has strengthened our U.S. specialty franchise Well positioned to capitalize on market dislocation Current valuation inconsistent with history of strong returns |
| Executive Summary Direct Insurance Reinsurance Financial Results and Strength Peer Comparison / Conclusion Appendix Agenda |
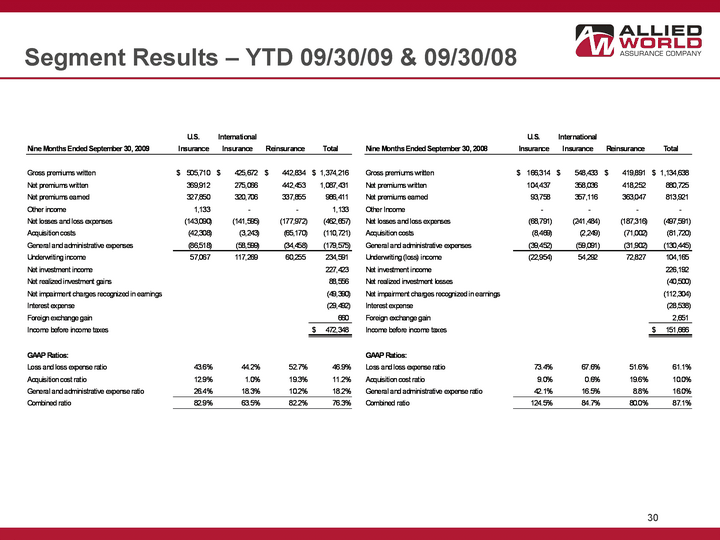
| Segment Results - YTD 09/30/09 & 09/30/08 |
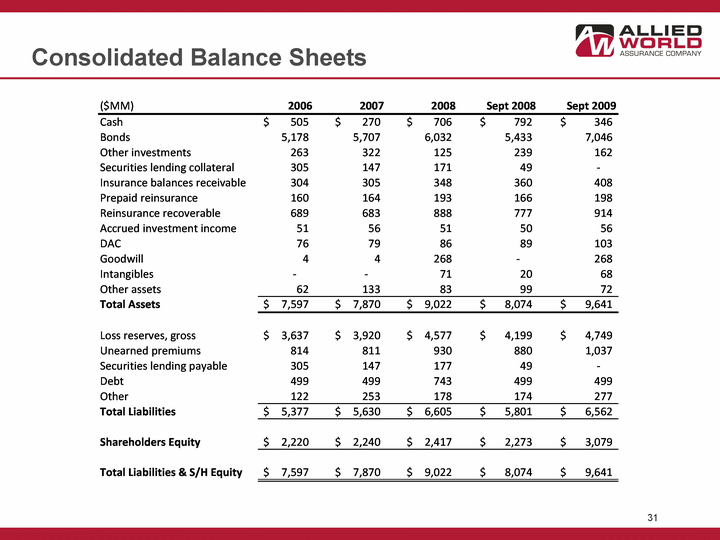
| Consolidated Balance Sheets |
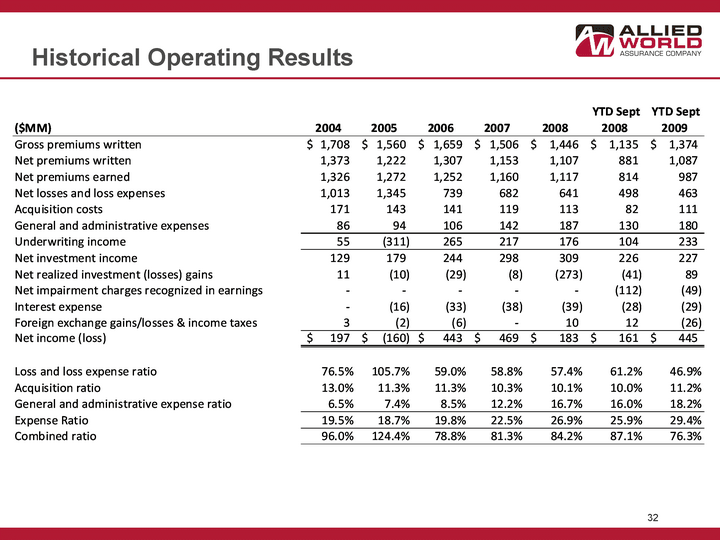
| Historical Operating Results |
| Non-GAAP Financial Measures In presenting the company's results, management has included and discussed in this press release certain non-GAAP financial measures within the meaning of Regulation G as promulgated by the U.S. Securities and Exchange Commission. Management believes that these non-GAAP measures, which may be defined differently by other companies, better explain the company's results of operations in a manner that allows for a more complete understanding of the underlying trends in the company's business. However, these measures should not be viewed as a substitute for those determined in accordance with GAAP. "Operating Income" is an internal performance measure used by the company in the management of its operations and represents after-tax operational results excluding, as applicable, net realized investment gains or losses, net impairment charges recognized in earnings and foreign exchange gains or losses. The company excludes net realized investment gains or losses, net impairment charges recognized in earnings and net foreign exchange gains or losses from its calculation of operating income because the amount of these gains or losses is heavily influenced by, and fluctuates in part according to, the availability of market opportunities. The company believes these amounts are largely independent of its business and underwriting process and including them distorts the analysis of trends in its operations. In addition to presenting net income determined in accordance with GAAP, the company believes that showing operating income enables investors, analysts, rating agencies and other users of its financial information to more easily analyze the company's results of operations in a manner similar to how management analyzes the company's underlying business performance. Operating income should not be viewed as a substitute for GAAP net income. The company has included "diluted book value per share" because it takes into account the effect of dilutive securities; therefore, the company believes it is a better measure of calculating shareholder returns than book value per share. "Annualized Return on Shareholders' Average Equity" ("ROAE") is calculated using average equity, excluding the average after tax unrealized gains or losses on investments. Unrealized gains (losses) on investments are primarily the result of interest rate movements and the resultant impact on fixed income securities. Such gains (losses) are not related to management actions or operational performance, nor are they likely to be realized. Therefore, the company believes that excluding these unrealized gains (losses) provides a more consistent and useful measurement of operating performance, which supplements GAAP information. In calculating ROAE, the net income (loss) available to shareholders for the period is multiplied by the number of such periods in a calendar year in order to arrive at annualized net income (loss) available to shareholders. The company presents ROAE as a measure that is commonly recognized as a standard of performance by investors, analysts, rating agencies and other users of its financial information. "Annualized operating return on average shareholders' equity" is calculated using operating income (as defined above and annualized in the manner described for net income (loss) available to shareholders under ROAE above), and average equity, excluding the average after tax unrealized gains (losses) on investments. Unrealized gains (losses) are excluded from equity for the reasons outlined in the annualized return on average equity explanation above. See slides 34 - 36 for a reconciliation of non-GAAP measures used in this presentation to their most directly comparable GAAP measures. |
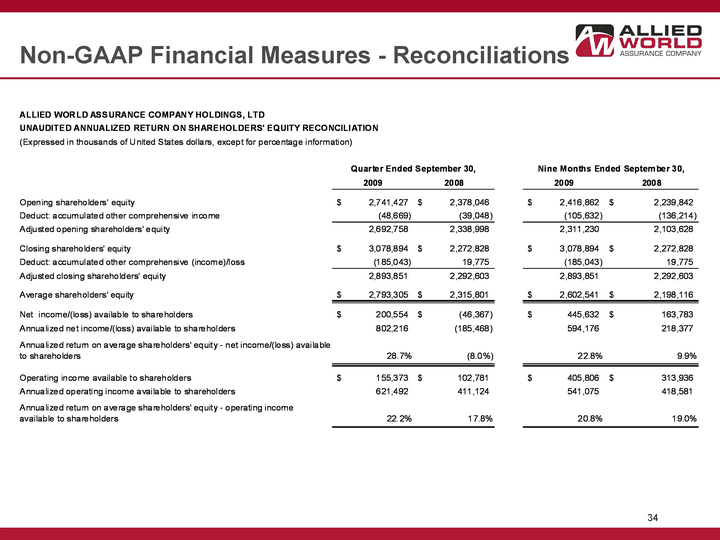
| Non-GAAP Financial Measures - Reconciliations |
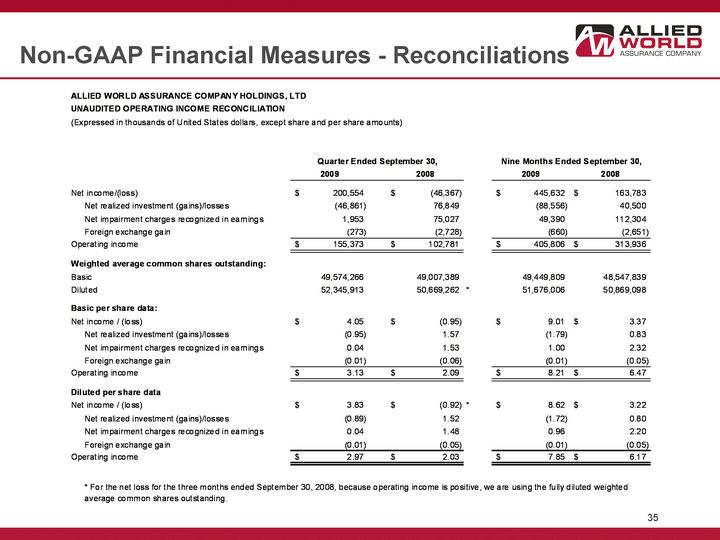
| Non-GAAP Financial Measures - Reconciliations |
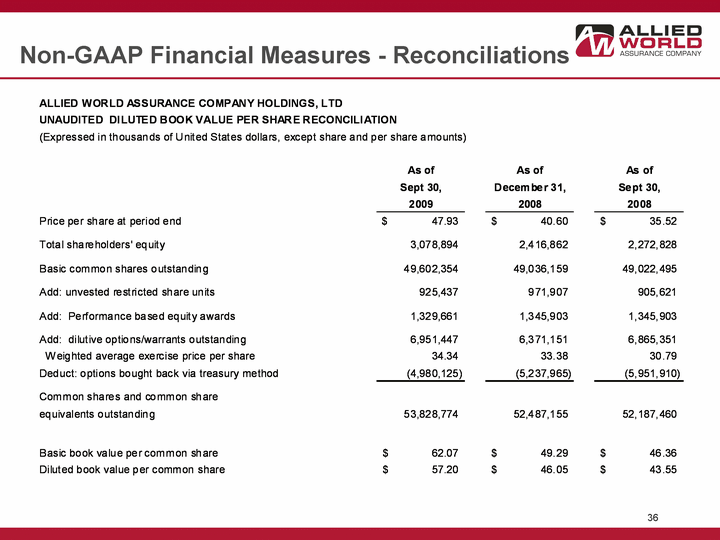
| Non-GAAP Financial Measures - Reconciliations |