Attached files
| file | filename |
|---|---|
| 8-K - FORM 8-K - Global Brands Acquisition Corp. | d70032e8vk.htm |
| EX-2.1 - EX-2.1 - Global Brands Acquisition Corp. | d70032exv2w1.htm |
| EX-99.1 - EX-99.1 - Global Brands Acquisition Corp. | d70032exv99w1.htm |
Exhibit 99.2

| Investor Presentation November 2009 |

| Contents 1 Transaction Highlights 2 Gerrity Platform 3 Market Opportunity and Investment Strategy Financial Overview Appendix |

| This presentation is being presented by Global Brands Acquisition Corp. ("Global Brands" or "GBAC") and Gerrity Group. Neither Global Brands, Gerrity Group nor any of their respective affiliates makes any representation or warranty as to the accuracy or completeness of the information contained in this presentation. The sole purpose of this presentation is to assist persons in deciding whether they wish to proceed with a further review of the proposed transaction discussed herein and is not intended to be all-inclusive or to contain all the information that a person may desire in considering the proposed transaction discussed herein. It is not intended to form the basis of any investment decision or any other decision in respect of the proposed transaction. Global Brands intends to file proxy statements with the Securities and Exchange Commission ("SEC") in connection with the proposed transaction. Stockholders of Global Brands are urged to read the proxy statements when they become available because they will contain important information. Such persons can also read Global Brands' final prospectus, dated December 6, 2007, its annual report on form 10-K for the fiscal year ended March 31, 2009 (the "Annual Report") and other reports as filed with the SEC, for a description of the security holdings of Global Brands' officers and directors and their affiliates and their other respective interests in the successful consummation of the proposed transaction. The definitive proxy statements will be mailed to stockholders as of record dates to be established for voting on the proposed transaction. Free copies of these documents can also be obtained, when available, at the SEC's internet site (http://www.sec.gov) or by directing a request to: Global Brands Acquisition Corp., 11 West 42nd Street, 21st floor, New York, New York 10036, attention: Jay Desai, 212-201-8371. Global Brands, Gerrity Group and their respective directors and executive officers may be deemed to be participants in the solicitation of proxies for the special meetings of Global Brands' stockholders to approve the proposed transaction. Information about Global Brands' directors and executive officers is available in its Annual Report. Additionally, the underwriters in Global Brands' initial public offering may assist Global Brands in these efforts. The underwriters may be entitled to receive deferred underwriting compensation upon completion of the proposed transaction. Additional information regarding the interests of potential participants will be included in the proxy statements and other materials to be filed by Global Brands with the SEC. This presentation shall not constitute a solicitation of a proxy, consent or authorization with respect to any securities or in respect of the proposed transaction. This presentation shall not constitute an offer to sell or the solicitation of an offer to buy any securities, nor shall there be any sale of securities in any jurisdictions in which such offer, solicitation or sale would be unlawful prior to registration or qualification under the securities laws of any such jurisdiction. No offering of securities shall be made except by means of a prospectus meeting the requirements of section 10 of the Securities Act of 1933, as amended. 3 Disclaimer |

| This presentation includes "forward-looking statements" within the meaning of the safe harbor provisions of the United States Private Securities Litigation Reform Act of 1995. Global Brands' actual results may differ from its expectations, estimates and projections and, consequently, you should not rely on these forward looking statements as predictions of future events. Words such as "expect," "estimate," "project," "budget," "forecast," "anticipate," "intend," "plan," "may," "will," "could," "should," "believes," "predicts," "potential," "continue," and similar expressions are intended to identify such forward-looking statements. These forward-looking statements include, without limitation, Global Brands' expectations with respect to future performance and anticipated financial impacts of the proposed transactions; approval of the proposed certificate of incorporation amendments and related transactions by shareholders; consummation of the warrant exchange; the satisfaction of the closing conditions to the proposed transactions; and the timing of the completion of the proposed transactions. These forward-looking statements involve significant risks and uncertainties that could cause the actual results to differ materially from the expected results. Most of these factors are outside Global Brands' control and difficult to predict. Factors that may cause such differences include, but are not limited to, the possibility that the expected growth will not be realized, or will not be realized within the expected time period, due to, among other things, (1) the REIT environment; (2) changes in the commercial finance and the real estate markets; (3) general economic conditions; and (4) legislative and regulatory changes (including changes to laws governing the taxation of REITs). Other factors include the possibility that the transactions contemplated by the framework agreement do not close, including due to the failure to receive required stockholder approvals, warrant exchange or the failure of other closing conditions. Global Brands cautions that the foregoing list of factors is not exclusive. Additional information concerning these and other risk factors is contained in Global Brands' most recent filings with the Securities and Exchange Commission ("SEC"). All subsequent written and oral forward-looking statements concerning Global Brands, the framework agreement, the related transactions or other matters and attributable to Global Brands or any person acting on its behalf are expressly qualified in their entirety by the cautionary statements above. Global Brands cautions readers not to place undue reliance upon any forward-looking statements, which speak only as of the date made. Global Brands does not undertake or accept any obligation or undertaking to release publicly any updates or revisions to any forward-looking statement to reflect any change in its expectations or any change in events, conditions or circumstances on which any such statement is based. 4 Disclaimer Forward Looking Statements |

| Transaction Highlights 1 |

| 6 Transaction Highlights Global Brands to convert from a SPAC to a perpetual existence internally managed equity retail REIT Gerrity team assumes management roles and establishes new board of directors Transaction Overview Established Retail Real Estate Platform Compelling Market Opportunity Experienced real estate professionals with sourcing, underwriting and operating capabilities 7 person team comprises a substantial in-place operating platform Prior success and reputation for prudent capital allocation 1996 - 1999: Partnership with Morgan Stanley Real Estate Funds (GMS Realty) 2000 - 2006: Partnership with Washington State Investment Board and Principal Enterprise Capital I 2007 - 2009: Partnership with Morgan Stanley Real Estate Funds to develop 10 Wal-Mart enclosed retail centers in China (GMS Asia) Compelling investment opportunities in retail real estate assets Consumer staples-oriented, primarily grocery anchored shopping centers, expected to offer stable returns with low relative fundamental risk Limited universe of qualified buyers with sufficient capital Historically attractive pricing; bid-ask spread is shrinking and transactions expected to occur Opportunities expected from loan maturities and defaults Necessity-based retail properties with a focus on the West Coast Aggressive sourcing and rigorous underwriting Moderate leverage Defining NewCo |

| 7 Transaction Summary and Key Dates Notes Subject to change after the conversion Assumes section 3(a)(9) exemption |
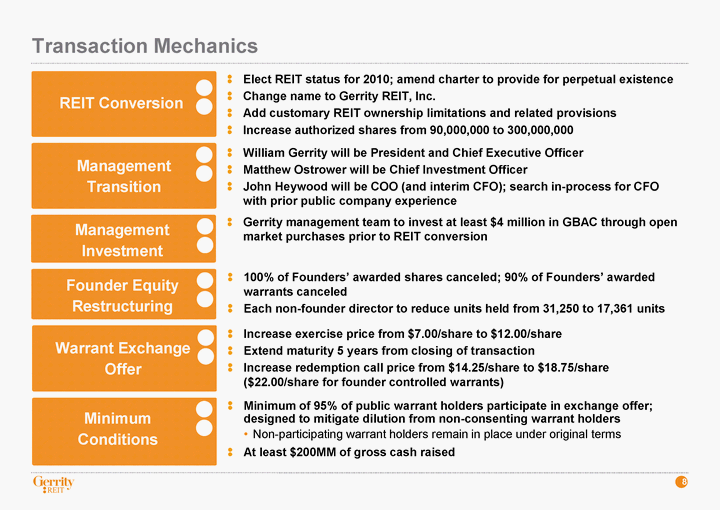
| 8 Transaction Mechanics Elect REIT status for 2010; amend charter to provide for perpetual existence Change name to Gerrity REIT, Inc. Add customary REIT ownership limitations and related provisions Increase authorized shares from 90,000,000 to 300,000,000 William Gerrity will be President and Chief Executive Officer Matthew Ostrower will be Chief Investment Officer John Heywood will be COO (and interim CFO); search in-process for CFO with prior public company experience 100% of Founders' awarded shares canceled; 90% of Founders' awarded warrants canceled Each non-founder director to reduce units held from 31,250 to 17,361 units Gerrity management team to invest at least $4 million in GBAC through open market purchases prior to REIT conversion Increase exercise price from $7.00/share to $12.00/share Extend maturity 5 years from closing of transaction Increase redemption call price from $14.25/share to $18.75/share ($22.00/share for founder controlled warrants) Minimum of 95% of public warrant holders participate in exchange offer; designed to mitigate dilution from non-consenting warrant holders Non-participating warrant holders remain in place under original terms At least $200MM of gross cash raised REIT Conversion Management Transition Management Investment Founder Equity Restructuring Warrant Exchange Offer |

| Gerrity Platform 2 |

| 10 Established Organization With In-Place Infrastructure Experienced real estate company with sourcing, underwriting, and operating capabilities Established team consisting of strong executive suite, acquisitions team, and supporting infrastructure Organizational Structure Confirmed New Board Members (in addition to William Gerrity and Matthew Ostrower) C. William Hosler - Board member of CapitalSource, Inc. Previously CFO of Catellus Development Corp. Richard Green - Director, Lusk Center for Real Estate, University of Southern California Michael Foster - Former Global Head of Asset Management for Morgan Stanley Real Estate and former CEO of Morgan Stanley Properties Retained Board Members Joel Horowitz - Current CEO of Global Brands. Former Chairman and CEO of Tommy Hilfiger. Current board member of Tommy Hilfiger John Muse - Chairman, HM Capital Partners. Director of Dean Foods and Anderson School of Business of UCLA 7-member Board of Directors, unclassified board, separate Chairman and CEO after interim period, no poison pill Board of Directors Corporate Governance |

| 11 Experienced, In-Place Senior Management Team 25+ year veteran property developer / manager / acquirer Founder and CEO of GMS Realty and GMS Asia Financial backers have included Morgan Stanley, Principal Financial and State of Washington Policy Advisory Board Member - Fisher Centre for Real Estate and Urban Economics at UC-Berkeley Board of the New America Foundation BA History, UCLA Bill Gerrity President and CEO 25+ years in real estate Infrastructure creation, integration, organizational planning GMS Asia, Ernst & Young, Mapeley, BP and Lend Lease Led Ernst & Young's advisory practice focusing on REIT SOX 404, risk mgmt and business transformation B.Business (Accounting), University of Technology, Sydney John Heywood COO and Interim CFO 10 years in real estate & financial services Investor reporting (MSREF), financial statement, audit & tax package preparation, treasury management, financial forecasting & budgeting Kearney Real Estate Company, Pacifica Capital Group, American Express CPA; MS Accountancy, Loyola University; MS Molecular Cell Biology, Weizmann Institute Wen Svinos Controller IT development, infrastructure Built information technology platform for Pan Pacific (PNP); managed IT migrations of multiple public company mergers at PNP GMS Asia, GMS Realty, HG Fenton, Excel Realty BS Information Systems, National University (part of Navy SPANWAR) Rick Gierke Information Technology 30+ years in shopping center investments, specializing in acquisitions and development GMS Realty, GMS Asia Previous experience at TrizecHahn, New Plan Excel Realty Trust, and Westfield BS Management, Arizona State University Rick Froese Acquisitions 25+ years in shopping center investments, redevelopment and development SGPA, GMS Realty, GMS Asia BARCH Registered Architect Ron Mourey Asset Management 15 years of public real estate securities experience Former Managing Director and Head of REIT research at Morgan Stanley Portfolio Manager for Pioneer's REIT mutual fund Joint MS RE / City Planning, MIT; BA Tufts Board of Ramco-Gershenson Properties Trust CFA Matt Ostrower Chief Investment Officer |
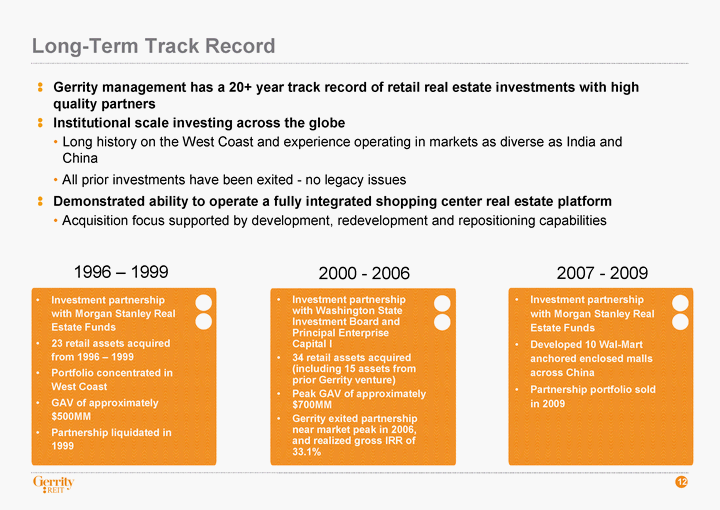
| 12 Long-Term Track Record Gerrity management has a 20+ year track record of retail real estate investments with high quality partners Institutional scale investing across the globe Long history on the West Coast and experience operating in markets as diverse as India and China All prior investments have been exited - no legacy issues Demonstrated ability to operate a fully integrated shopping center real estate platform Acquisition focus supported by development, redevelopment and repositioning capabilities 1996 - 1999 Investment partnership with Morgan Stanley Real Estate Funds 23 retail assets acquired from 1996 - 1999 Portfolio concentrated in West Coast GAV of approximately $500MM Partnership liquidated in 1999 2000 - 2006 Investment partnership with Washington State Investment Board and Principal Enterprise Capital I 34 retail assets acquired (including 15 assets from prior Gerrity venture) Peak GAV of approximately $700MM Gerrity exited partnership near market peak in 2006 2007 - 2009 Investment partnership with Morgan Stanley Real Estate Funds Developed 10 Wal-Mart anchored enclosed malls across China Partnership portfolio sold in 2009 |

| 13 Sourcing Network of contacts with owners, brokers, lenders, operators, and agents built over 20+ years of West Coast retail real estate experience Familiarity with local real estate professionals, demographics, and assets Established market presence and reputation at times provides access to off- market or narrowly marketed opportunities In many cases having once owned, sold or managed assets being evaluated Cross-disciplined acquisitions team with finance and management backgrounds Underwriting Highly analytical, fully-developed underwriting process evaluates property demographics, competition, tenant quality and credit profile, risk vs. reward, and physical asset characteristics Underwriting performed at the highest institutional standards consistent with previous Gerrity investment partnerships Key focus on income per available square foot in a trade area Enables team to identify investment opportunities in locations that are often overlooked (i.e. densely populated, low income areas with limited competition for customer spend) Local market expertise enables efficient underwriting Gerrity REIT will focus on acquiring high quality retail assets in attractive locations at compelling risk-adjusted returns Targeting necessity-based retail assets with strong tenants in markets with supportive demographics Specific focus on West Coast markets; historical relationships provide sourcing advantage Highly analytical approach to underwriting Fully Articulated Investment Strategy and Underwriting Process |
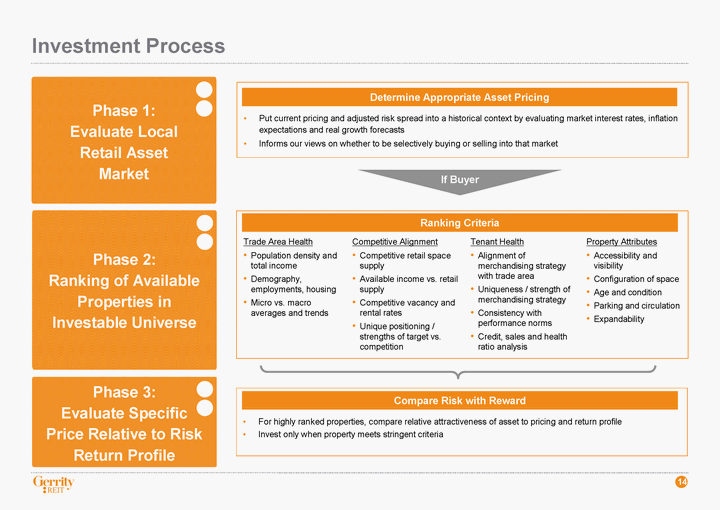
| 14 Investment Process Phase 1: Evaluate Local Retail Asset Market Phase 2: Ranking of Available Properties in Investable Universe Phase 3: Evaluate Specific Price Relative to Risk Return Profile If Buyer Put current pricing and adjusted risk spread into a historical context by evaluating market interest rates, inflation expectations and real growth forecasts Informs our views on whether to be selectively buying or selling into that market Determine Appropriate Asset Pricing Trade Area Health Population density and total income Demography, employments, housing Micro vs. macro averages and trends Competitive Alignment Competitive retail space supply Available income vs. retail supply Competitive vacancy and rental rates Unique positioning / strengths of target vs. competition Tenant Health Alignment of merchandising strategy with trade area Uniqueness / strength of merchandising strategy Consistency with performance norms Credit, sales and health ratio analysis Property Attributes Accessibility and visibility Configuration of space Age and condition Parking and circulation Expandability Ranking Criteria Compare Risk with Reward For highly ranked properties, compare relative attractiveness of asset to pricing and return profile Invest only when property meets stringent criteria |

| 3 Market Opportunity & Investment Strategy |
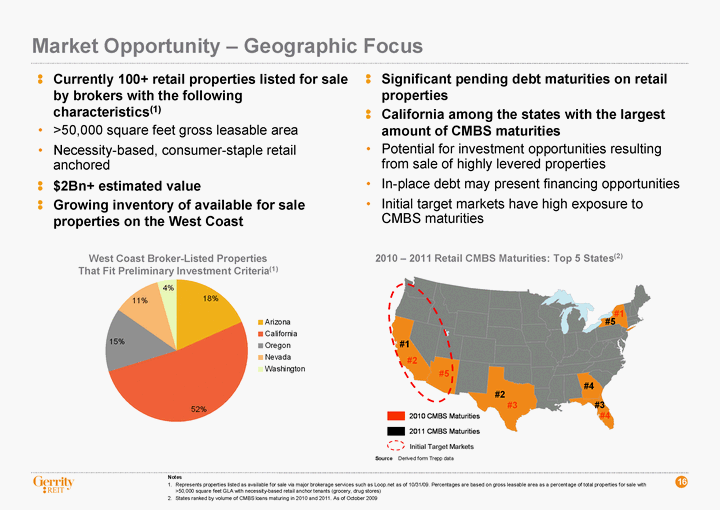
| 16 Market Opportunity - Geographic Focus Currently 100+ retail properties listed for sale by brokers with the following characteristics(1) >50,000 square feet gross leasable area Necessity-based, consumer-staple retail anchored $2Bn+ estimated value Growing inventory of available for sale properties on the West Coast Significant pending debt maturities on retail properties California among the states with the largest amount of CMBS maturities Potential for investment opportunities resulting from sale of highly levered properties In-place debt may present financing opportunities Initial target markets have high exposure to CMBS maturities Notes Represents properties listed as available for sale via major brokerage services such as Loop.net as of 10/31/09. Percentages are based on gross leasable area as a percentage of total properties for sale with >50,000 square feet GLA with necessity-based retail anchor tenants (grocery, drug stores) States ranked by volume of CMBS loans maturing in 2010 and 2011. As of October 2009 2010 - 2011 Retail CMBS Maturities: Top 5 States(2) Source Derived form Trepp data West Coast Broker-Listed Properties That Fit Preliminary Investment Criteria(1) Initial Target Markets |
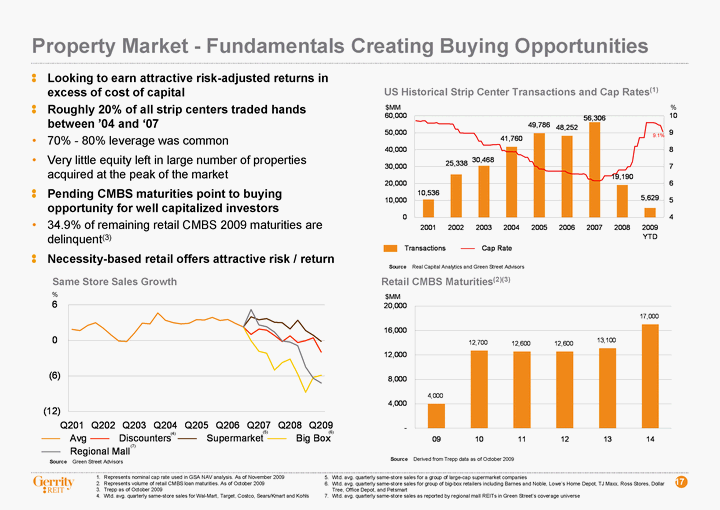
| 17 Represents nominal cap rate used in GSA NAV analysis. As of November 2009 Represents volume of retail CMBS loan maturities. As of October 2009 Trepp as of October 2009 Wtd. avg. quarterly same-store sales for Wal-Mart, Target, Costco, Sears/Kmart and Kohls 9.1% Source Real Capital Analytics and Green Street Advisors US Historical Strip Center Transactions and Cap Rates(1) $MM Looking to earn attractive risk-adjusted returns in excess of cost of capital Roughly 20% of all strip centers traded hands between '04 and '07 70% - 80% leverage was common Very little equity left in large number of properties acquired at the peak of the market Pending CMBS maturities point to buying opportunity for well capitalized investors 34.9% of remaining retail CMBS 2009 maturities are delinquent(3) Necessity-based retail offers attractive risk / return Retail CMBS Maturities(2)(3) Property Market - Fundamentals Creating Buying Opportunities $MM Source Derived from Trepp data as of October 2009 Same Store Sales Growth Source Green Street Advisors (4) (5) (6) % Wtd. avg. quarterly same-store sales for a group of large-cap supermarket companies Wtd. avg. quarterly same-store sales for group of big-box retailers including Barnes and Noble, Lowe's Home Depot, TJ Maxx, Ross Stores, Dollar Tree, Office Depot, and Petsmart Wtd. avg. quarterly same-store sales as reported by regional mall REITs in Green Street's coverage universe % (7) |

| Financial Overview 4 |

| 19 Financing Strategy and Expected Distribution Policy Maintain a conservative and flexible capital structure Implement prudent capital structure both at the asset and corporate level; ideally utilizing a significant amount of preferred equity Establish a line-of-credit with relationship lenders to provide added financial flexibility Target maximum leverage of 30%-35% debt to asset value on a corporate basis Research suggests negative relationship between excessive leverage and relative returns; core strategy not dependent upon leverage to produce expected returns Public markets also afford access to favorably priced preferred equity with appropriate duration Utilize warrants to provide favorably priced equity capital over time Provides equity capital at over 20% premium to current Trust Value per share Public warrants must be exercised in cash; potential for >$335MM of future equity capital Distributions will be maintained at minimum REIT requirements Retained cash provides ability to fund attractive opportunities Estimate 65% AFFO payout ratio Notes Assumes $9.95/share stock price. Please refer to appendix for details behind dividend yield calculation Assumes all acquisitions occur at the indicated nominal cap rate Assumes investments are evenly distributed over all quarters until equity is fully invested (3) Assumes all investments made in quarter 1. Dividend yield shown represents annualized dividend yield 1-year post closing |
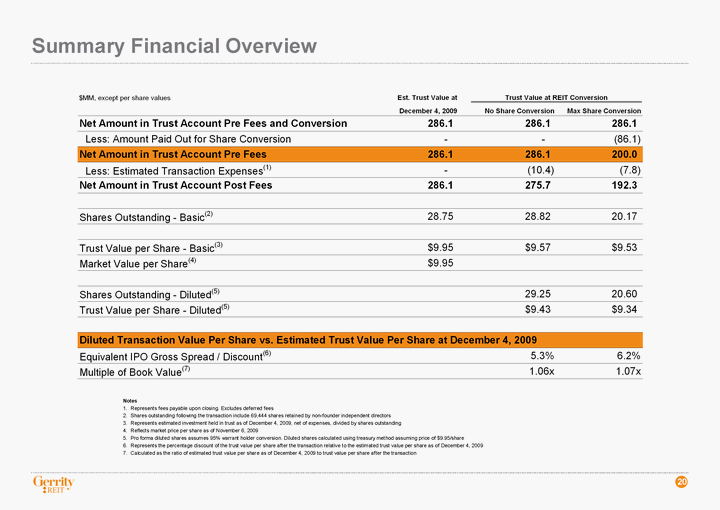
| 20 Summary Financial Overview Notes Represents fees payable upon closing. Excludes deferred fees Shares outstanding following the transaction include 69,444 shares retained by non-founder independent directors Represents estimated investment held in trust as of December 4, 2009, net of expenses, divided by shares outstanding Reflects market price per share as of November 6, 2009 Pro forma diluted shares assumes 95% warrant holder conversion. Diluted shares calculated using treasury method assuming price of $9.95/share Represents the percentage discount of the trust value per share after the transaction relative to the estimated trust value per share as of December 4, 2009 Calculated as the ratio of estimated trust value per share as of December 4, 2009 to trust value per share after the transaction |

| Appendix 5 |

| 22 Select Shopping Center REITs Notes Includes shares and operating partnership units Aggregate value equals total market capitalization less cash Estimates from First Call as of November 6, 2009, unless otherwise noted Consensus AFFO estimates from SNL Financial as of November 6, 2009, unless otherwise noted Total market capitalization equals the sum of equity market value, preferred securities at liquidation preference, consolidated and company's share of unconsolidated debt Per Green Street Advisors weekly pricing update dated November 6, 2009 Represents most recent dividend annualized Represents dividend yield of class A common shares |

| 23 Illustrative Company Expansion Notes Assumes no shareholders elect conversion to pro rata share of trust. Uninvested equity is net of fees. Deferred fee is paid from retained cash in quarter following equity investment Assumes acquisitions made at an 8.5% cap rate; NOI grown at 2% annually Assumes initial annual corporate G&A of $3MM grown at 2% annually Assumes all acquisitions made at 30% leverage with 7.0% interest only debt Analysis assumes maintenance capex equals 5.0% of total revenue (assuming 75% NOI margin) Based on estimated cash in trust per share at December 4, 2009 of $9.95. Assumes 65% AFFO payout Represents illustrative deployment of initial capital at closing |

| 24 Illustrative Company Expansion Notes Assumes 8.65MM shares elect conversion to pro rata share of trust. Uninvested equity is net of fees. Deferred fee is paid from retained cash in quarter following equity investment Assumes acquisitions made at an 8.5% cap rate; NOI grown at 2% annually Assumes initial annual corporate G&A of $3MM grown at 2% annually Assumes all acquisitions made at 30% leverage with 7.0% interest only debt Analysis assumes maintenance capex equals 5.0% of total revenue (assuming 75% NOI margin) Based on estimated cash in trust per share at December 4, 2009 of $9.95. Assumes 65% AFFO payout Represents illustrative deployment of initial capital at closing |
