Attached files
| file | filename |
|---|---|
| 8-K - CURRENT REPORT - FIFTH THIRD BANCORP | d8k.htm |
 Fifth Third Bank | All Rights Reserved Bank of America Merrill Lynch Banking & Financial Services Conference Kevin Kabat Chairman, President & CEO November 10, 2009 Please refer to earnings release dated October 22, 2009 and 10-Q dated November 6, 2009 for further information, including full results reported on a U.S. GAAP basis Exhibit 99.1 |
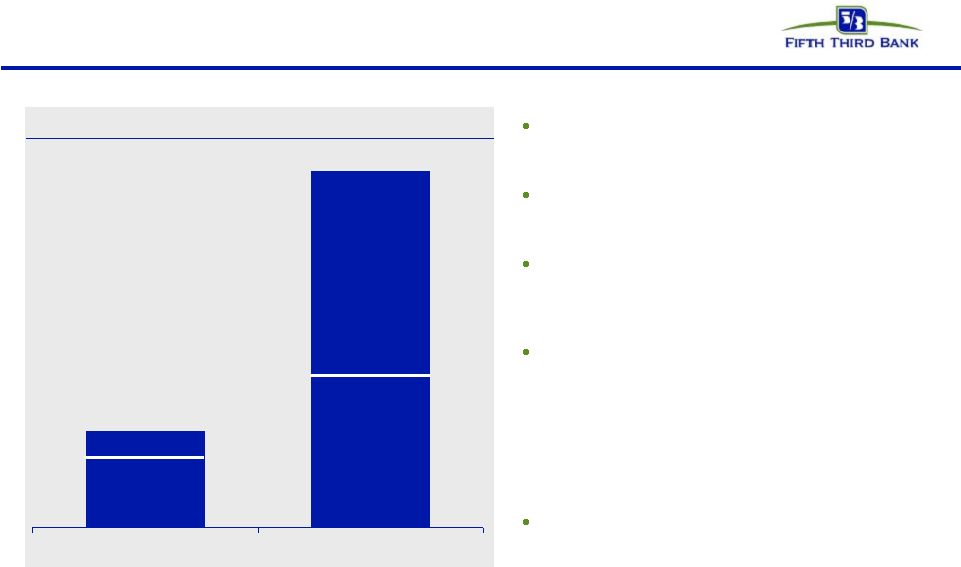
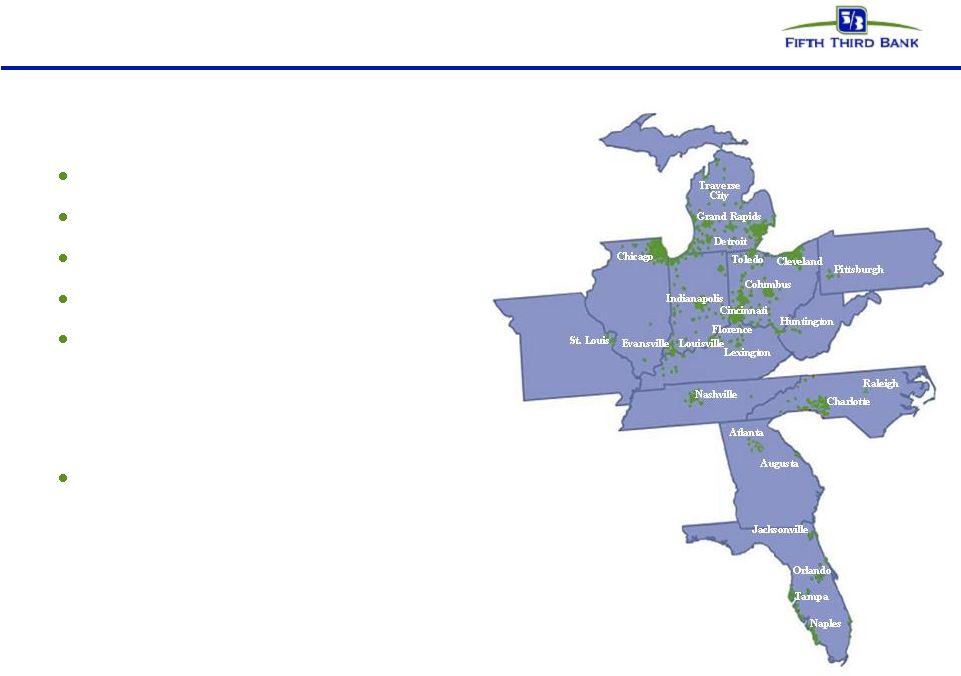 2 © Fifth Third Bank | All Rights Reserved Fifth Third overview * As of 3Q09 ** Fortune magazine, March 16, 2009 $111 billion assets #13 * 1,306 banking centers Over 2,372 ATMs 16 affiliates in 12 states Fifth Third Bank has been dedicated to serving the needs of Midwestern families and businesses for more than 150 years Top 10 Superregional Bank for 8 consecutive years ** |
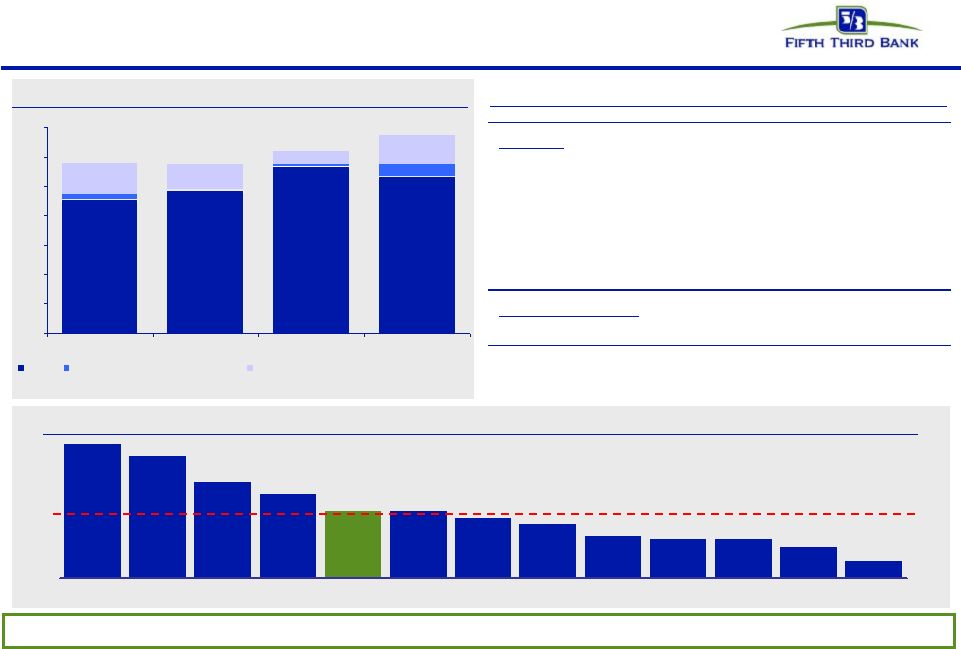
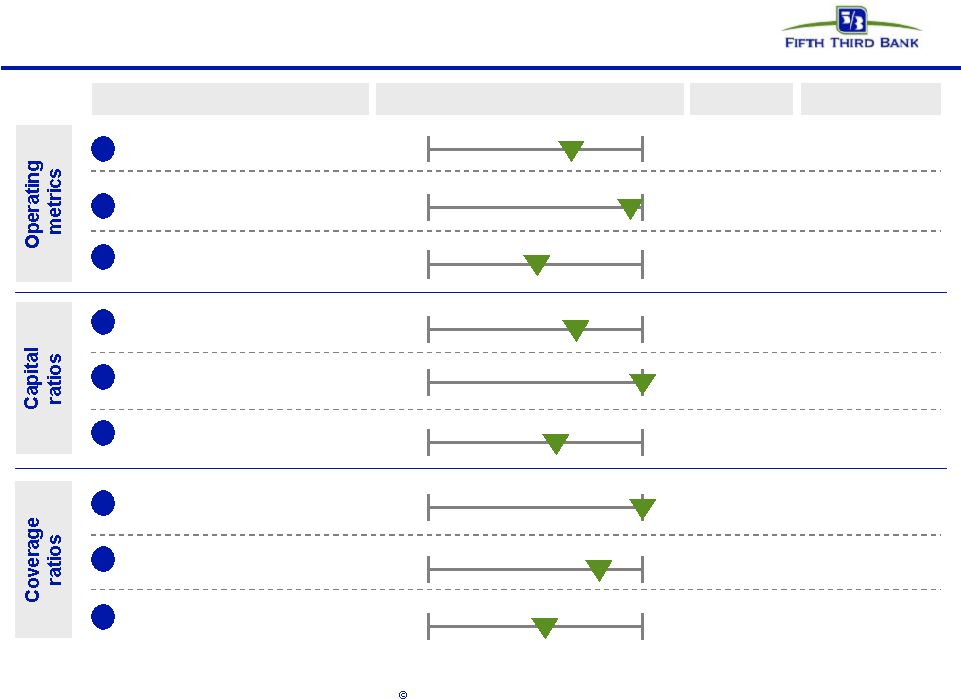 3 Fifth Third Bank | All Rights Reserved 3Q09 results vs. peers Range Metric Rank / 13 Peer average Net interest margin 7 3.36% 2.68% 4.36% 3.43% Seq. net interest margin growth 2 7 bps (18 bps) 18 bps 17 bps Seq. net interest income growth 3 2.3% (4.2%) 9.2% 4.5% Tangible common equity ratio 5 5.9% 3.2% 8.0% 6.7% Tier 1 ratio 1 11.0% 8.4% 13.2% 13.2% 7 6.9% 5.2% 8.4% 7.0% Tier 1 common ratio 1 2.79% 1 2 3 4 5 6 7 1.66% 4.69% 4.69% Reserves / loans 2 75% 8 44% 130% 114% Reserves / NPAs 4 110% 9 66% 185% 122% Reserves / annualized NCOs Peers include: BBT, CMA, HBAN, KEY, MI, MTB, PNC, RF, STI, USB, WFC, ZION. Source: SNL
and company reports NPAs exclude HFS portion for all banks. Exclude covered
assets for BBT, USB, and ZION. MTB Tier 1 common ratio as of 6/30/2009. |
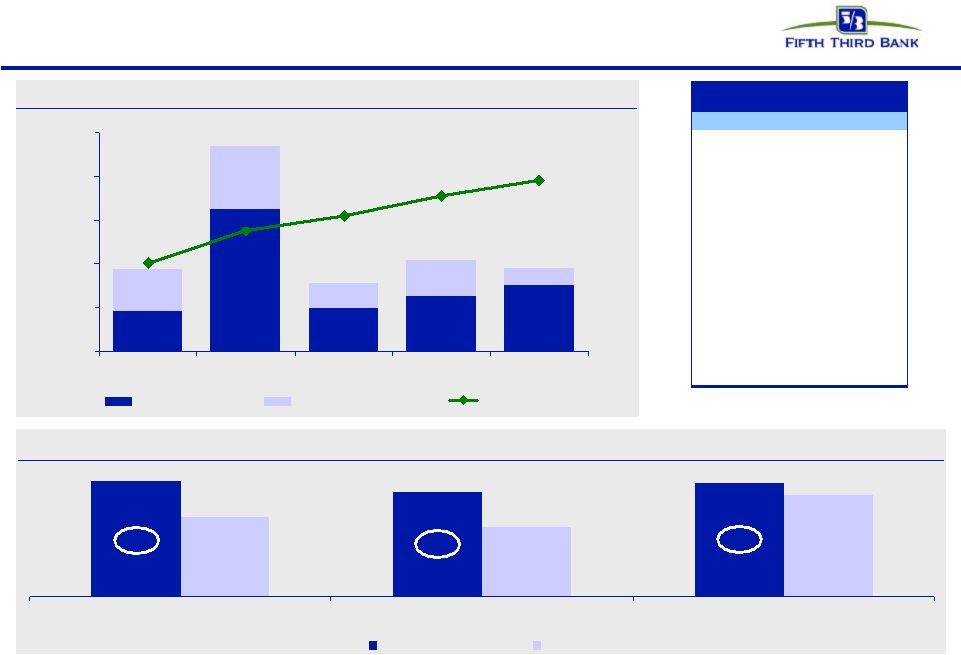
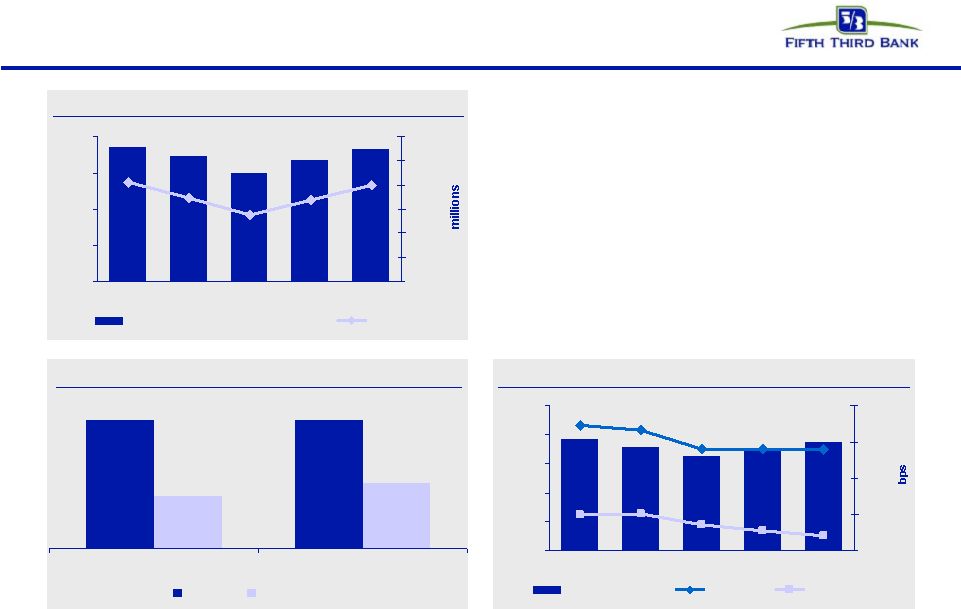 4 © Fifth Third Bank | All Rights Reserved Net interest income 1.0% 2.0% 3.0% 4.0% 5.0% 6.0% 3Q08 4Q08 1Q09 2Q09 3Q09 0 100 200 300 400 Spread (right axis) Asset yield Liability rate 3.33% 3.13% 2.92% 3.15% 3.37% 2.0% 2.5% 3.0% 3.5% 4.0% 3Q08 4Q08 1Q09 2Q09 3Q09 $300 $400 $500 $600 $700 $800 $900 Net interest income (right axis) NIM Core NII and NIM • Trends in net interest income and net interest margin compare favorably with peers – Stable NII in 4Q09 • Expect continued expansion in NIM in 4Q09 – Approximately 10 bps Yields and rates SEQ NII and NIM growth compared to peers 4.5% 17 bps 2.3% 7 bps NIM growth NII growth FITB Peer average Peers include: BBT, CMA, HBAN, KEY, MI, MTB, PNC, RF, STI, USB, WFC, ZION Source: SNL and company reports Results above exclude $130M and $6M charge related to leveraged lease litigation in 2Q08 and 1Q09,
respectively. Also excluded is $215M, $81M, $41M, $35M, and $27M in loan discount accretion
from the First Charter acquisition in 3Q08 , 4Q08, 1Q09,2Q09, and 3Q09 respectively. |
 5 © Fifth Third Bank | All Rights Reserved Deposit share momentum Source: FDIC, SNL Financial; branches included are full service retail / brick and
mortar; data excludes headquarters branches with over $250 million in deposits • Continued focus on customer satisfaction and building full relationships has given strong momentum to the retail network • Fifth Third grew deposits in 15 of 16 affiliate markets in 2009 – Market share rank increases in South and Central Florida – Modest attrition in North Carolina acquisition market • Fifth Third grew deposit market share in 75% of affiliate markets in 2009 5.3% 4.8% -4.4% (113,631) North Carolina 8.7% 8.1% 0.3% 2,608 Central Kentucky 8.3% 8.4% 4.7% 139,354 Central Indiana 3.3% 3.5% 12.8% 142,615 Tennessee 18.4% 18.4% 2.1% 149,252 Western Michigan 15.4% 16.2% 7.5% 177,122 Northwestern Ohio 8.2% 8.9% 13.0% 194,593 Louisville 4.0% 4.1% 8.6% 195,169 Southern Indiana 21.9% 21.5% 2.2% 212,656 Cincinnati 11.2% 11.1% 5.6% 213,971 Central Ohio 3.1% 3.5% 24.5% 334,080 Tampa 2.5% 3.0% 28.9% 338,091 Central Florida 5.0% 5.4% 11.9% 418,525 Eastern Michigan 2.8% 3.1% 21.1% 579,342 South Florida 3.8% 4.2% 17.0% 606,708 Northeastern Ohio 3.8% 4.0% 9.8% 788,601 Chicago 2008 2009 Share (%) ($) Deposit Name 5/3 Market Share 5/3 Deposit (08-09) Affiliate |
 6 © Fifth Third Bank | All Rights Reserved Pre-tax pre-provision earnings 5.4% 4.9% 3.9% 3.4% 2.7% 2.7% 2.4% 2.2% 1.7% 1.6% 1.6% 1.3% 0.7% WFC USB PNC BBT FITB MTB HBAN ZION CMA RF STI MI KEY Peer average: 2.6% Core PPNR / Average Loans* Core PPNR trend Reconciliation to core PPNR 4Q08 1Q09 2Q09 3Q09 Reported PPNR (GAAP) (488) 511 2,393 844 Adjustments: Gain on sale of Visa shares - - - (244) BOLI charges 34 54 - - Gain from sale of processing interest - - (1,764) 6 Divested merchant and EFT revenue (160) (155) (169) - Securities gains/losses 40 24 (5) (8) Visa litigation reserve expense 8 - - (73) Goodwill impairment charge 965 - - - Seasonal pension expense - - - 10 FDIC special assessment - - 55 - Divested merchant and EFT expense (estimated) 51 49 54 - Core PPNR 451 483 565 535 Credit Related Adjustments: OREO write-downs, FV adjs, & G/L on loan sales 22 3 8 45 Problem asset work-out expenses 106 87 46 100 Credit adjusted PPNR 579 574 620 679 451 483 565 535 45 106 87 46 100 8 3 22 $0 $100 $200 $300 $400 $500 $600 $700 4Q08 1Q09 2Q09 3Q09 Core Fee Income Effect from Credit Noninterest Expense Effect from Credit * Peer core PPNR excludes securities gains/losses, gains/losses from debt extinguishments, Visa gains
and expense reversals, leveraged lease gains/losses, and gains from FDIC transactions.
Fifth Third’s pre-tax, pre-provision net revenue (PPNR) to RWA higher than most SCAP
regional banks |
 7 © Fifth Third Bank | All Rights Reserved Loss mitigation effort impact on PPNR • Commercial Special Assets Group — Approximately 275 full-time employees, compared with 100 at the beginning of 2009 — Special vertical teams and “war rooms” dedicated to existing and emerging problem areas – Construction – Income-producing property – Auto manufacturing – Dealer floor plan — Increasing use of structured situations in workouts – Commercial recoveries as a percentage of gross charge-offs up significantly in the third quarter • Consumer Collections — Approximately 650 full-time employees, compared with 445 at the beginning of 2009, a nearly 50% increase — Over $2.1 billion of loan modifications since program inception in 2007 – $400 million of modifications in the third quarter of 2009 — Approximately 25% redefault rate on total pool; 40% lagged redefault rate • Nearly 5% of total workforce currently focused on loss mitigation and collections — Approaching targeted staffing levels 3Q07 3Q08 2Q09 3Q09 Credit related fee income: Losses on the sale of OREO ($2) ($12) ($13) ($22) Gains/losses on sale of loans - (1) 11 8 FV adjustments to loans HFS - - (6) (30) Total impact to fee income ($2) ($13) ($8) ($45) Credit related noninterest expense: Provision for unfunded commitments $2 $17 $8 $45 Derivative valuation adjustments - - 2 21 Other work-out related expenses 12 25 32 28 OREO expense 2 3 4 6 Total impact to noninterest expense $16 $45 $46 $100 Total PPNR effect ($18) ($58) ($55) ($145) Effect on 3Q09 PPRN relative to: 2Q09: ($90) 3Q08: ($87) 3Q07: ($127) |
 8 © Fifth Third Bank | All Rights Reserved Portfolio performance drivers Performance Largely Driven By No Participation In Discontinued or Suspended Lending * Residential construction-related consumer mortgages intended to be held in
portfolio until permanent financing complete. Jumbo mortgage originations currently being held due to market conditions. Geography • Florida and Michigan most stressed • Remaining Midwest and Southeast performance reflect economic trends Products • Homebuilder/developer charge-offs $108 million in 3Q09 – Total charge-off ratio 3.7% (3.3% ex-HBs) – Commercial charge-off ratio 4.2% (3.4% ex- HBs) • Brokered home equity charge-offs 6.0% in 3Q09 – Direct home equity portfolio 1.9% 3Q09 NCO Ratios Coml Cons Total FL/MI 6.6% 5.6% 6.1% Other 3.3% 2.2% 2.9% • Subprime • Option ARMs Discontinued in 2007 • Brokered home equity ($2.0B) Suspended in 2008 • Homebuilder/residential development ($1.8B) • Other non-owner occupied commercial RE excluding homebuilder/developer ($8.2B) • All mortgages originated for intended sale* Total 4.2% 3.1% 3.7% Mortgage portfolio |
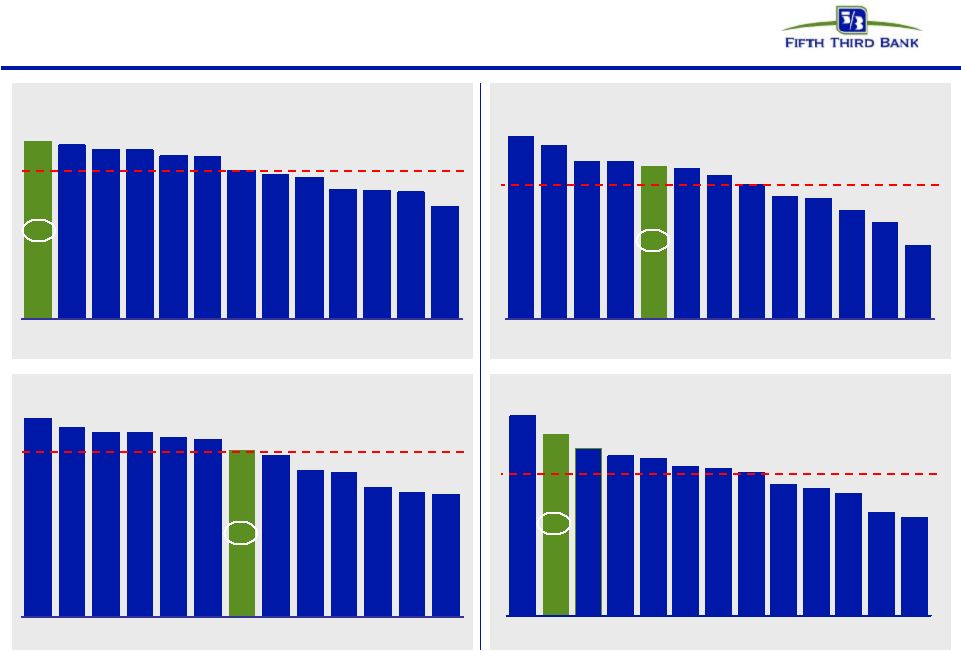
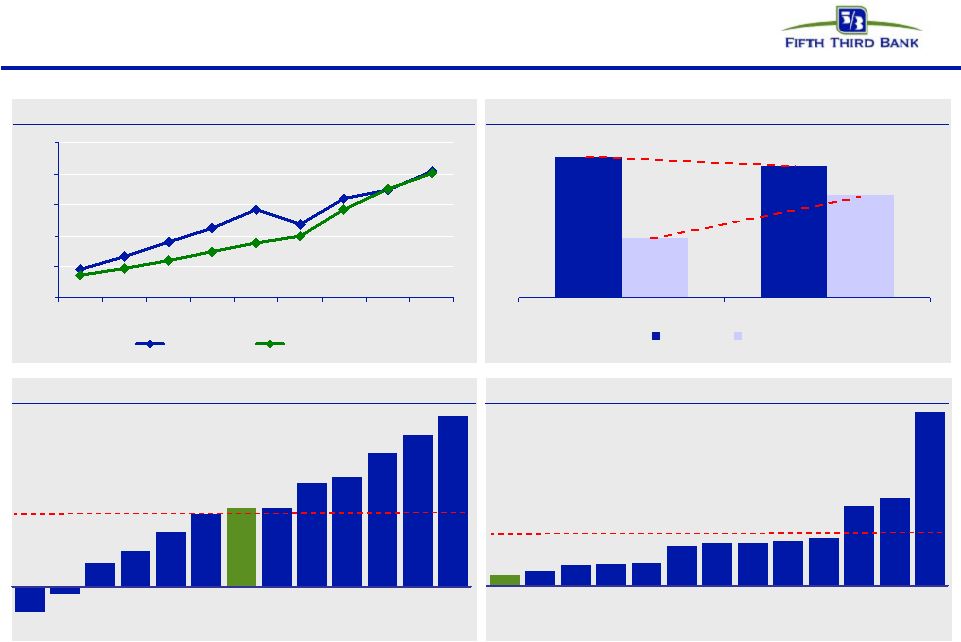 9 © Fifth Third Bank | All Rights Reserved 545% 273% 251% 149% 141% 135% 134% 126% 70% 66% 65% 48% 31% FITB CMA STI MI MTB RF KEY ZIION BBT USB HBAN WFC PNC 3Q09 credit results 0.0% 1.0% 2.0% 3.0% 4.0% 5.0% 3Q07 4Q07 1Q08 2Q08 3Q08 4Q08 1Q09 2Q09 3Q09 FITB Peer Average Source: SNL and company reports. NPAs exclude held-for-sale NPAs for all
banks. 3.2% 3.0% 1.4% 2.4% 2008 2009 YTD FITB Peer Average NPA ratio versus peers Net charge-off ratio versus peers Sequential NPA growth versus peers -4% -1% 4% 6% 9% 12% 13% 13% 17% 18% 22% 25% 28% MI STI KEY CMA MTB USB FITB ZION HBAN BBT RF PNC WFC Year-over-year NPA growth versus peers Peer average: 167% Peer average: 12% |
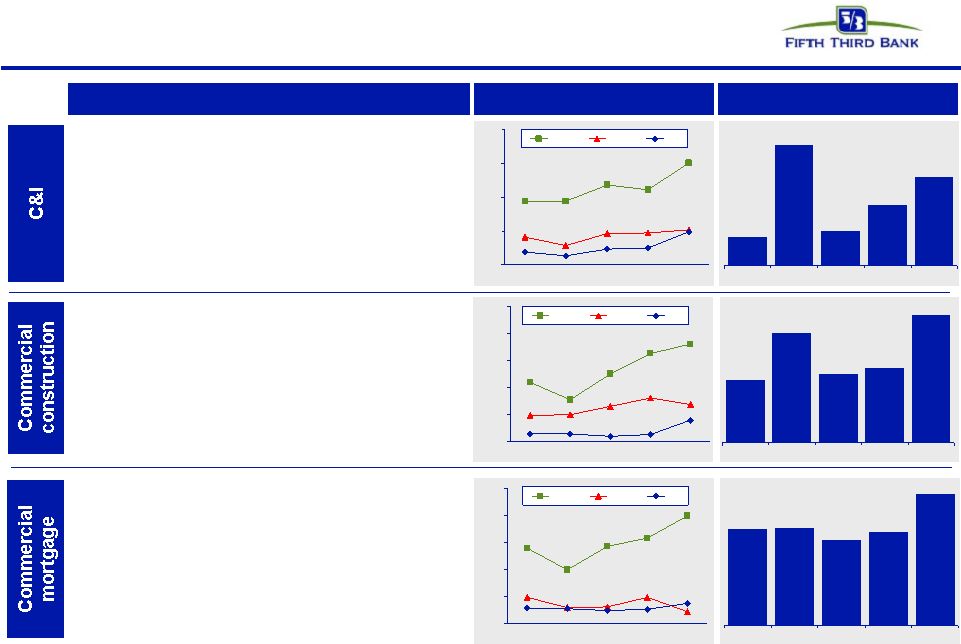 10 © Fifth Third Bank | All Rights Reserved Commercial credit summary 1.19% 5.03% 1.45% 2.53% 3.70% 3Q08 4Q08 1Q09 2Q09 3Q09 Portfolio comments Delinquency trends Note: NPAs excluded loans held-for-sale. Net charge-offs exclude losses on
loans sold or transferred to held-for-sale in 4Q08. 0.0% 1.0% 2.0% 3.0% 4.0% 3Q08 4Q08 1Q09 2Q09 3Q09 NPAs 30-89 90+ 2.82% 2.84% 2.50% 2.73% 3.82% 3Q08 4Q08 1Q09 2Q09 3Q09 0.0% 2.0% 4.0% 6.0% 8.0% 10.0% 3Q08 4Q08 1Q09 2Q09 3Q09 NPAs 30-89 90+ 5.71% 10.00% 6.21% 6.76% 11.56% 3Q08 4Q08 1Q09 2Q09 3Q09 0.0% 5.0% 10.0% 15.0% 20.0% 25.0% 3Q08 4Q08 1Q09 2Q09 3Q09 NPAs 30-89 90+ Loss trends • 18% of 3Q09 losses on loans to auto dealers and companies in real estate related industries – Loans to auto dealers of $1.2B, of which $0.8B are C&I loans; YTD NCO ratio on C&I portion: 6.8% – Loans to real estate related industries of $3.5B; YTD NCO ratio of 3.8% • Low exposure to FL (7% of loans, 7% of losses in 3Q09) • SNC losses of $60 million in 3Q09 versus $17 million in 2Q09 • Owner occupied YTD NCO ratio of 1.6%, other non-owner occupied YTD NCO ratio of 6.1% • In 4Q08 reduced concentrations in most stressed markets (FL and MI) • Loans from FL/MI represented 55% of total losses in 3Q09, 39% of total loans • 35% of total commercial mortgage losses from homebuilder/develop portfolio • Declining valuations in residential and land development • In 4Q08 reduced concentrations in most stressed markets (FL/MI) • Continued stress expected through 2009 • Loans from FL/MI represented 50% of total losses in 3Q09, 34% of total loans • SNC losses of $34 million in 3Q09 versus no SNC losses in 2Q09 • 45% of total commercial construction losses from homebuilder/developer portfolio |
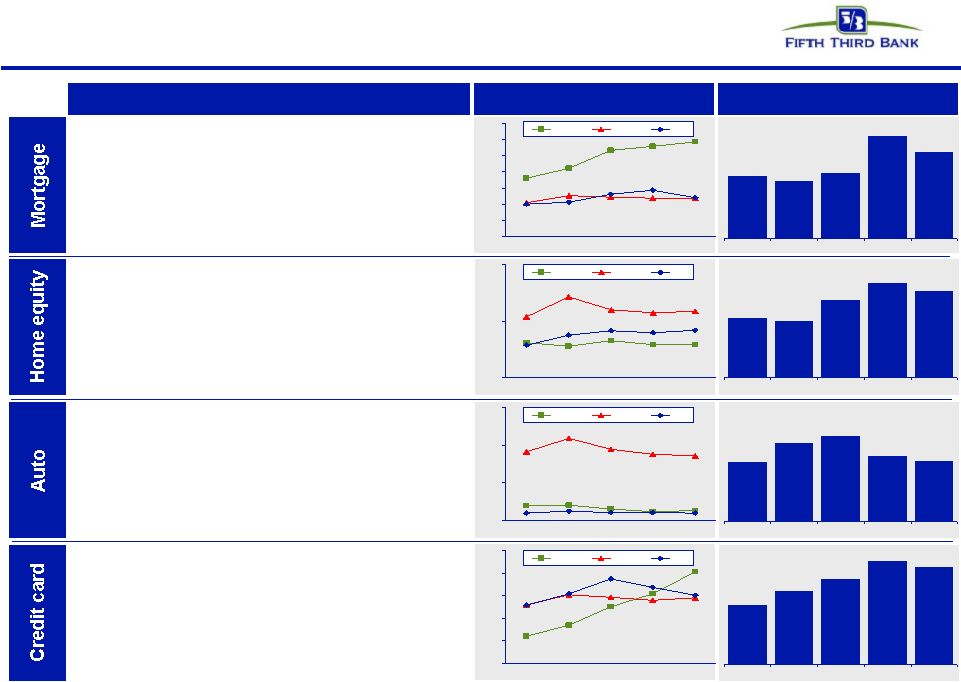 11 © Fifth Third Bank | All Rights Reserved Consumer credit summary 3.16% 2.90% 3.30% 5.17% 4.38% 3Q08 4Q08 1Q09 2Q09 3Q09 Portfolio comments Delinquency trends 0.0% 1.0% 2.0% 3.0% 4.0% 5.0% 6.0% 7.0% 3Q08 4Q08 1Q09 2Q09 3Q09 NPAs 30-89 90+ Loss trends • Brokered home equity represented 16% of total portfolio in 3Q09 and 38% of total losses • Branch originated home equity YTD loss rate of 1.8% • 1st liens: 25%; 2nd liens: 75% • Weighted average origination FICO: 757 • Aggressive home equity line management strategies in place • Improved values on used cars sold at auction drove lower losses in 3Q09 • YTD loss rates similar on all vehicles types • YTD loss rate on loans with >100% advance rate: 2.6%; YTD loss rate on loans with <100%: 1.1% 1.77% 1.68% 2.28% 2.81% 2.54% 3Q08 4Q08 1Q09 2Q09 3Q09 0.0% 1.0% 2.0% 3Q08 4Q08 1Q09 2Q09 3Q09 NPAs 30-89 90+ 1.51% 2.00% 2.17% 1.65% 1.52% 3Q08 4Q08 1Q09 2Q09 3Q09 0.0% 1.0% 2.0% 3.0% 3Q08 4Q08 1Q09 2Q09 3Q09 NPAs 30-89 90+ 5.54% 6.82% 7.92% 9.64% 9.08% 3Q08 4Q08 1Q09 2Q09 3Q09 0.0% 1.0% 2.0% 3.0% 4.0% 5.0% 3Q08 4Q08 1Q09 2Q09 3Q09 NPAs 30-89 90+ • 29% FL concentration driving 66% of total losses • FL lots ($299M) running at 32% annualized loss rate (YTD) • Mortgage company originations targeting 95% salability • 1st liens: 100% ; weighted average LTV: 78% • Weighted average origination FICO: 727 • Owner occupied represents 85% of portfolio; YTD loss rate of 2.5% • High unemployment and weakened economic conditions continue to adversely impact the credit card portfolio • Relatively small portfolio: ~$2B • Relationship based product |
 12 © Fifth Third Bank | All Rights Reserved Total net charge-offs YTD 2009 were $1.9B, much lower than the assumption under the SCAP adverse scenario Loan losses are not expected to approach the losses assumed under the SCAP adverse scenario Through half of assessment period (4 of 8 quarters), expect to have incurred roughly 28% of total assumed losses under the adverse scenario Current charge-off outlook: — Expect 4Q commercial losses to be modestly lower than 3Q09, with lower C&I losses and continued elevated CRE losses. — Expect 4Q consumer losses to be generally consistent with 3Q09 levels. Current NPA outlook: — Commercial: mid-teen percentage growth in 4Q — Consumer: mid-single digit percentage growth in 4Q $1.9 2009 YTD FITB SCAP Adverse Scenario Net charge-offs ($B) $9.1 Net loan losses vs. SCAP adverse scenario 2009 FY Est. 2009 losses* * Line represents Fifth Third’s estimate of approximate 2009 losses under
supervisory more adverse scenario. Supervisory estimates of total two-year losses under more adverse scenario not allocated by period. Estimate allocates total
two-year supervisory losses using the allocation under Fifth Third’s submission. |
 13 © Fifth Third Bank | All Rights Reserved Strong reserve position 463 1,627 490 626 756 478 729 283 415 196 2.41% 4.28% 4.69% 3.72% 3.31% $0 $500 $1,000 $1,500 $2,000 $2,500 3Q08 4Q08 1Q09 2Q09 3Q09 Net Charge-offs Additional Provision Reserves Industry leading reserve level Coverage ratios are strong relative to peers 1.25% 1.14% 1.22% 0.86% 0.75% 1.10% Reserves / NPLs Reserves / NPAs Reserves / 3Q09 Annualized NCOs FITB Peer Average Source: SNL and company reports. NPAs/NPLs exclude held-for-sale portion for all
banks. Excludes covered assets for BBT, USB, and ZION. 1. FITB 4.69 2. KEY 4.00 3. ZION 3.44 4. MI 3.07 5. WFC 3.00 6. PNC 2.99 7. RF 2.83 8. HBAN 2.77 9. USB 2.64 10. STI 2.60 11. BBT 2.29 12. CMA 2.19 13. MTB 1.66 Peer Average 2.79 Reserves / Total Loans |
 14 © Fifth Third Bank | All Rights Reserved Fifth Third’s capital levels strengthened through prudent actions in 2008 and 2009
intended to maintain ratios within or above target ranges — In 2Q08, issued $1.1 billion of Tier 1 capital in the form of convertible preferred
securities — In 2Q08 and 4Q08, reduced quarterly common dividend, preserving approximately $1B of capital annually versus the prior $0.44 quarterly dividend level — In 4Q08, completed $3.4B U.S. Treasury preferred investment — In 2Q09, completed sale of interest in processing business, generating $1.3B in Tier 1
common; issued $1B of common equity through public issuance; and generated $441M in Tier 1 common through exchange of Series G convertible preferred for cash
and common equity — In 3Q09, sold Visa Class B stake for $206M Current capital levels are strong and significantly above regulatory requirements and
internal targets: Capital management activities 3Q09 "Well-capitalized" minimum Current Target Tier 1 common equity ratio 7.0% >4% >4% TCE/RWA 7.1% NA 5% - 6% Tier 1 capital 13.2% 6% 8% - 9% Total capital 17.5% 10% 11.5% - 12.5% |
 15 © Fifth Third Bank | All Rights Reserved Strong capital position Tier 1 common ratio Tier 1 capital ratio 13.2% 13.0% 12.6% 12.6% 12.2% 12.1% 11.1% 10.8% 10.6% 9.7% 9.6% 9.5% 8.4% FITB HBAN KEY STI CMA RF BBT PC WFC ZION MI USB MTB* Peer average: 11.0% 8.4% 8.0% 7.8% 7.8% 7.6% 7.5% 7.0% 6.8% 6.2% 6.1% 5.5% 5.3% 5.2% BBT CMA HBAN RF KEY STI FITB USB MI ZION PNC MTB* WFC Peer average: 6.9% * MTB Tier 1 common ratio as of 6/30/2009. Source: SNL and company reports. TCE + Reserves / Loans Tangible common equity ratio 8.0% 7.6% 6.9% 6.9% 6.7% 6.6% 6.3% 5.9% 5.4% 5.3% 4.8% 4.2% 3.2% CMA KEY STI MI FITB RF HBAN BBT ZION USB MTB WFC PNC Peer average: 5.9% 15.7% 14.3% 13.1% 12.5% 12.3% 11.7% 11.5% 11.2% 10.3% 10.0% 9.6% 8.1% 7.7% KEY FITB CMA STI RF MI HBAN BBT ZION USB WFC PNC MTB Peer average: 11.1% |
 16 © Fifth Third Bank | All Rights Reserved Summary Fifth Third continues to execute on its strategic initiatives and is focused on being well-positioned for the turn of the cycle. • Dedicated to serving the needs of Midwestern families and businesses for more than 150 years • Core businesses creating new and profitable opportunities to enhance value • Trends in NII and NIM compare favorably with peers • Ongoing expense control • Continued shift back toward core funding Core franchise is solid • Strong reserve coverage of problem loans • Aggressive management has mitigated areas of highest risk • Significantly enhanced SAG and workout resources, while continuing prudent lending practices • Some positive signs in 3Q09 results, though challenges will continue Aggressive management of credit issues • Successfully completed June 2008 capital plan and post- SCAP capital actions • Exceeded Tier 1 common equity commitment by 60% • Current capital levels could withstand additional economic deterioration as described in the SCAP assessment • Demonstrated ability to further augment capital if external targets move Strong capital levels |
 17 © Fifth Third Bank | All Rights Reserved Cautionary statement This report may contain statements that we believe are “forward-looking statements” within the meaning of Section 27A of the Securities Act of 1933, as amended, and Rule 175 promulgated thereunder, and Section 21E of the
Securities Exchange Act of 1934, as amended, and Rule 3b-6 promulgated
thereunder. These statements relate to our financial condition, results of operations, plans, objectives, future performance or business. They usually can be identified by the use of forward-looking language such as “will likely result,” “may,” “are expected to,” “is anticipated,” “estimate,” “forecast,” “projected,” “intends to,” or may include other similar words or phrases such as “believes,” “plans,” “trend,” “objective,” “continue,” “remain,” or similar expressions, or future or conditional verbs such as “will,” “would,” “should,” “could,” “might,” “can,” or similar verbs. You should not place undue reliance on these statements, as they are
subject to risks and uncertainties, including but not limited to the risk factors set forth in our most recent Annual Report on Form 10-K and our most recent quarterly report on Form 10-Q. When considering these forward-looking
statements, you should keep in mind these risks and uncertainties,
as well as any cautionary statements we may make. Moreover, you should treat these statements as speaking only as of the date they are made and based only on information then actually known to us. There are a number of important factors that could cause future results to differ
materially from historical performance and these forward- looking
statements. Factors that might cause such a difference include, but are not limited to: (1) general economic conditions and weakening in the economy, specifically the real estate market, either nationally or in
the states in which Fifth Third, one or more acquired entities and/or the
combined company do business, are less favorable than expected; (2) deteriorating credit quality; (3) political developments, wars or other hostilities may disrupt or increase volatility in securities
markets or other economic conditions; (4) changes in the interest rate
environment reduce interest margins; (5) prepayment speeds, loan origination and sale volumes, charge-offs and loan loss provisions; (6) Fifth Third’s ability to maintain required capital levels and
adequate sources of funding and liquidity; (7) maintaining capital
requirements may limit Fifth Third’s operations and potential growth; (8) changes and trends in capital markets; (9) problems encountered by larger or similar financial institutions may adversely affect the banking
industry and/or Fifth Third (10) competitive pressures among depository institutions increase significantly; (11) effects of critical accounting policies and judgments; (12) changes in accounting policies or procedures as may be required by the Financial Accounting
Standards Board (FASB) or other regulatory agencies; (13) legislative
or regulatory changes or actions, or significant litigation, adversely affect Fifth Third, one or more acquired entities and/or the combined company or the businesses in which Fifth Third, one or more acquired entities and/or the combined company are engaged; (14) ability to maintain favorable ratings from rating agencies; (15) fluctuation of Fifth Third’s stock price; (16) ability to attract and retain key personnel; (17) ability to receive dividends from its subsidiaries; (18) potentially
dilutive effect of future acquisitions on current shareholders’
ownership of Fifth Third; (19) effects of accounting or financial results of one
or more acquired entities; (20) lower than expected gains related to
any sale or potential sale of businesses; (21) difficulties in separating Fifth Third Processing Solutions from Fifth Third; (22) loss of income from any sale or potential sale of businesses that could have
an adverse effect on Fifth Third’s earnings and future growth;(23)
ability to secure confidential information through the use of computer systems and telecommunications networks; and (24) the impact of reputational risk created by these developments on such matters as business generation and retention, funding and liquidity. You should refer to our periodic and current reports filed with the Securities and Exchange Commission, or “SEC,” for further information on other factors which could cause actual results to be significantly different from
those expressed or implied by these forward-looking statements.
|
 18 © Fifth Third Bank | All Rights Reserved Appendix |
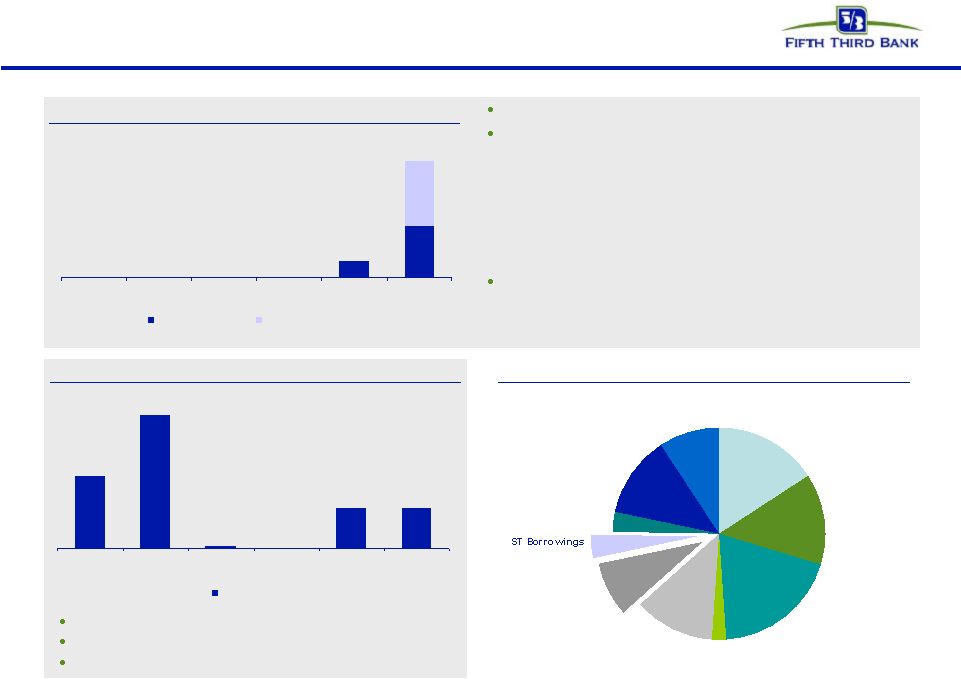 19 © Fifth Third Bank | All Rights Reserved Strong liquidity profile 31 0 500 500 1,639 888 10/1-12/31/09 2010 2011 2012 2013 2014 on Fifth Third Bank Current unused available borrowing capacity $22B FHLB borrowings $2B; core deposits $70B; equity $14B All market borrowings by Fifth Third Bank Holding Company cash at 9/30/09: $2.1B Expected cash obligations over the next 12 months — $0 debt maturities — ~$32M common dividends — ~$205M preferred dividends – ~$35MM Series G dividend – ~$170MM TARP dividend — ~$286M interest and other expenses Cash currently sufficient to satisfy all fixed obligations over the next twenty-four months (debt maturities, common and preferred dividends, interest and other expenses) without accessing capital markets; relying on dividends from subsidiaries; proceeds from asset sales Holding company unsecured debt maturities ($M) 2009 2010 2011 2012 2013 2014 on Fifth Third Bancorp Fifth Third Capital Trust 5,018 750 0 0 0 0 Bank unsecured debt maturities ($M) Demand 16% Interest Checking 14% Savings / MMDA 20% Foreign Office 2% Consumer Time 12% Non-core Deposits 8% 4% Equity 12% Long Term Debt 9% Other liabilities 3% Heavily core funded (Bancorp) |
 20 © Fifth Third Bank | All Rights Reserved Consumer portfolio Home Equity Balance $12.4B NPA + 90+ Ratio: 1.4% NCO Ratio: 2.6% Brokered $2.0B NPA + 90+ Ratio 2.8% NCO Ratio 6.6% Direct $10.4B NPA + 90+ Ratio 1.1% NCO Ratio 1.8% Mortgage Balance $8.2B NPA + 90+ Ratio: 8.2% NCO Ratio: 4.5% Other Card $2.0B NPA + 90+ Ratio 7.1% NCO Ratio 8.9% Other $0.9B NPA + 90+ Ratio 0.2% NCO Ratio 2.1% Auto $9.0B NPA + 90+ Ratio 0.5% NCO Ratio 1.7% HELOAN $1.7B NPA + 90+ Ratio 1.9% NCO Ratio 3.5% HELOC $10.7B NPA + 90+ Ratio 1.3% NCO Ratio 2.4% Lots $0.7B NPA + 90+ Ratio 16.1% NCO Ratio 18.0% Resi Construct $0.1B NPA + 90+ Ratio 1.4% NCO Ratio NM Owner Occ’d $7.0B NPA + 90+ Ratio 6.6% NCO Ratio 2.5% Non-owner Occ’d $0.5B NPA + 90+ Ratio 21.1% NCO Ratio 14.4% NCO ratios are YTD |
 21 © Fifth Third Bank | All Rights Reserved Commercial portfolio FL 7% MI 16% Other 77% FL 19% MI 15% Other 66% C&I Balance $26.2B NPA Ratio: 3.0% NCO Ratio: 2.5% Commercial Mortgage Balance $12.1B NPA Ratio: 8.0% NCO Ratio: 3.0% Owner Occ’d $5.6B NPA Ratio 4.3% NCO Ratio 1.7% Non-owner Occ’d $6.5B NPA Ratio 11.2% NCO Ratio 4.2% NCO ratios are YTD. NPA ratios exclude loans held-for-sale Commercial Construction Balance $4.1B NPA Ratio: 18.1% NCO Ratio: 8.1% Owner Occ’d $0.6B NPA Ratio 8.8% NCO Ratio 1.2% Non-owner Occ’d $3.5B NPA Ratio 19.8% NCO Ratio 9.4% C&I loans by state Commercial mortgage by state Commercial construction by state Homebuilder $0.8B NPA Ratio 33.2% NCO Ratio 13.4% Homebuilder $0.8B NPA Ratio 36.5% NCO Ratio 18.6% Homebuilder $0.2B NPA Ratio 16.7% NCO Ratio 8.7% FL 13% MI 26% Other 61% Included in totals above |
 22 © Fifth Third Bank | All Rights Reserved Share dilution * vs. TCE creation since 1Q09 $1,974 $ 287 $ 116 $ 104 Avoided preferred dividends “At the Market” offering Preferred exchange Visa sale share ^ Total $1,000 $ 467 Fifth Third actions Tier 1 Common impact JV gains > estimate SCAP Tier 1 Common Target $1,100 19% 41% 63% 28% 32% 29% 40% 19% 13% 24% 104% -3% -74% -39% -45% -19% -8% -1% -5% -9% -12% -19% -25% -29% -100% -80% -60% -40% -20% 0% 20% 40% 60% 80% 100% 120% PNC JPM USB WFC COF BBT FITB BAC STI KEY RF C Capital raise required? Efficiency- TCE creation Dilution TCE Growth 1.4x 0.5x 0.3x 0.7x 1.6x 1.5x 7.1x (0.2)x 1.7x 2.4x 5.2x 4.1x • TCE generation through more efficient means to minimize shareholder dilution • Exceeded SCAP capital requirement by ~$850 million SOURCE: SNL Financial and company filings. Financial data as of September 30, 2009 or most recent
available. * Share dilution on an if-converted basis, etc. Dilution represents new common shares divided by
current if- converted share count. ^ Includes absorption of DTAs originally assumed to be disallowed under more adverse scenario
|