Attached files
| file | filename |
|---|---|
| 8-K - 8-K - FGX International Holdings LTD | a09-33098_18k.htm |
Exhibit 99.1
|
|
Investor Presentation November 2009 |
|
|
FORWARD LOOKING STATEMENTS This presentation contains forward-looking statements (as defined in the Private Securities Litigation Reform Act of 1995) that are based on current expectations, estimates, forecasts and projections, as the case may be, and as such involve substantial risks and uncertainties. All statements, other than statements of historical facts, included in this presentation regarding our strategy, future operations, prospects, plans and objectives of management are forward-looking statements. The words “anticipates”, “believes”, “estimates”, “expects”, “intends”, “may”, “plans”, “will”, “would”, “could” and similar expressions are intended to identify forward-looking statements, although not all forward looking statements contain these identifying words. These statements are not guarantees of future performance, and are subject to risks and uncertainties which could cause actual results or events to differ materially from those contemplated by the forward-looking statements. These risks and uncertainties include, but are not limited to: the Company’s ability to successfully integrate acquired businesses including Corinne McCormack, Inc. and Eye-Bar Inc.; the effect of adverse economic conditions and low levels of consumer confidence and the resulting adverse impact on consumer discretionary spending, which could reduce our sales; adverse changes in our customers' inventory and working capital policies; the bankruptcy or other lack of commercial success of one or more of our significant customers; the actual charges incurred for product returns and markdowns related to the divestiture of the costume jewelry business may be greater than expected; we or others may discover that our products must be recalled because of defects; unexpected products returns and related claims pertaining to current or prior periods; the concentration of manufacturing of our products in China, which increases our vulnerability to disruptions in that region; interruptions of supply from our Asian product manufacturers; political instability or changing conditions in manufacturing or transportation services in foreign countries; other risks associated with our international operations, including foreign currency exchange rate fluctuations and the impact of quotas, tariffs, or other restrictions on the importation or exportation of our products; a material reduction, cessation, or postponement of purchases by our customers; failure to comply with federal or state regulation of the distribution or sale of our products; the expense and uncertainty of the litigation process including the risk of an unfavorable result in current or future litigation; adverse interest rate fluctuations; our credit insurance does not cover all of our outstanding accounts receivable; unknown potential effects of outbreaks of communicable diseases, including the swine flu, on our business; and disruption due to weather, fire or other unforeseen circumstances in our principal distribution center. These and other risks and uncertainties that could cause our actual results to differ from those contemplated by any forward-looking statement are discussed in more detail in the “Risk Factors” section of our most recently filed Form 10-K, which we may update in Quarterly Reports on Form 10-Q. The oral statements made in connection with this presentation may include forward-looking statements regarding the Company, including statements about its operations and prospects. Past performance is not necessarily indicative of future results. The Company’s actual results and other circumstances could differ materially from any results or circumstances anticipated in any forward-looking statements as a result of uncertainties described above and in our Risk Factors. Except as required under the federal securities laws and the rules and regulations of the SEC, we do not assume any obligation to update or revise any forward-looking statements after we distribute this presentation, or to update the reasons actual results could differ materially from those anticipated in these forward-looking statements, even if new information becomes available in the future. |
|
|
Who we are Leading marketer of non-prescription reading glasses and popular priced sunglasses #1 share in both categories Strong iconic brands – Foster Grant, Magnivision, SolarShield, Corinne McCormack Sold in over 68,000 retail locations Balanced distribution across mass merchant, drug store, grocery and variety retail channels; recent acquisition opens up mid and upper tier channels 3-year sales and EBITDA CAGR of 14% and 13%, respectively 3 |
|
|
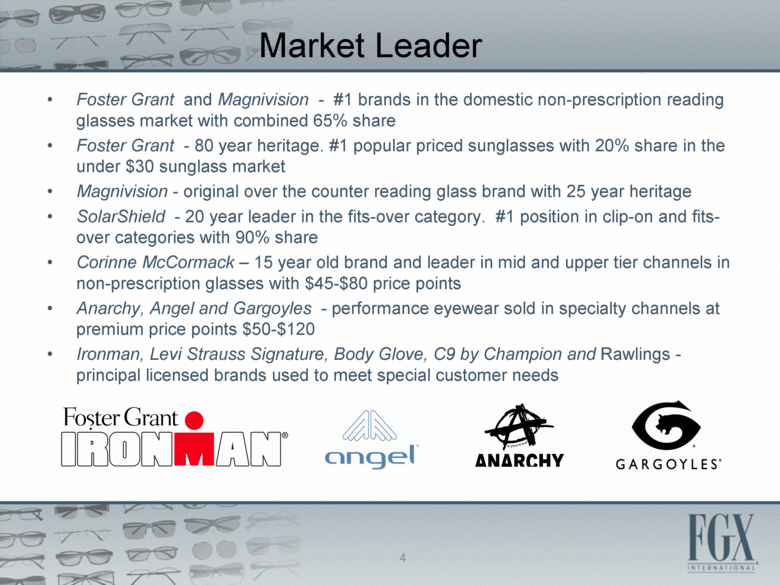
Market Leader Foster Grant and Magnivision - #1 brands in the domestic non-prescription reading glasses market with combined 65% share Foster Grant - 80 year heritage. #1 popular priced sunglasses with 20% share in the under $30 sunglass market Magnivision - original over the counter reading glass brand with 25 year heritage SolarShield - 20 year leader in the fits-over category. #1 position in clip-on and fits-over categories with 90% share Corinne McCormack – 15 year old brand and leader in mid and upper tier channels in non-prescription glasses with $45-$80 price points Anarchy, Angel and Gargoyles - performance eyewear sold in specialty channels at premium price points $50-$120 Ironman, Levi Strauss Signature, Body Glove, C9 by Champion and Rawlings - principal licensed brands used to meet special customer needs 4 |
|
|
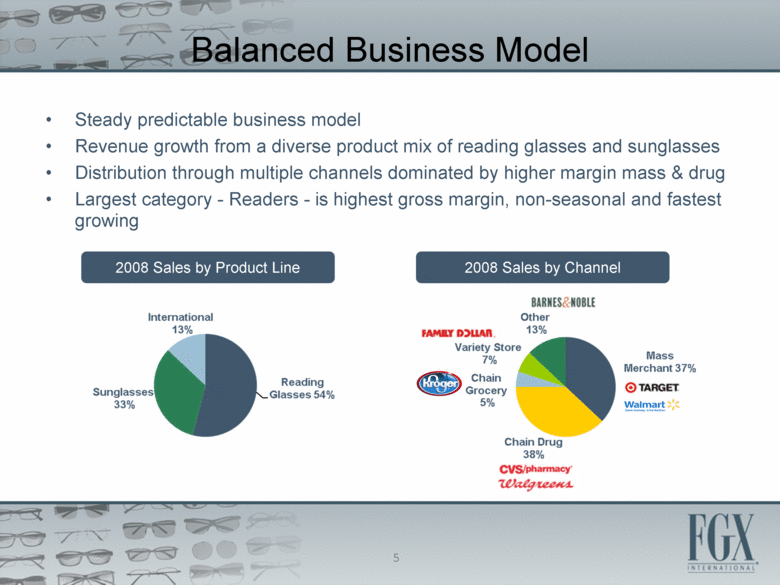
Balanced Business Model Steady predictable business model Revenue growth from a diverse product mix of reading glasses and sunglasses Distribution through multiple channels dominated by higher margin mass & drug Largest category - Readers - is highest gross margin, non-seasonal and fastest growing 2008 Sales by Product Line 2008 Sales by Channel 5 |
|
|
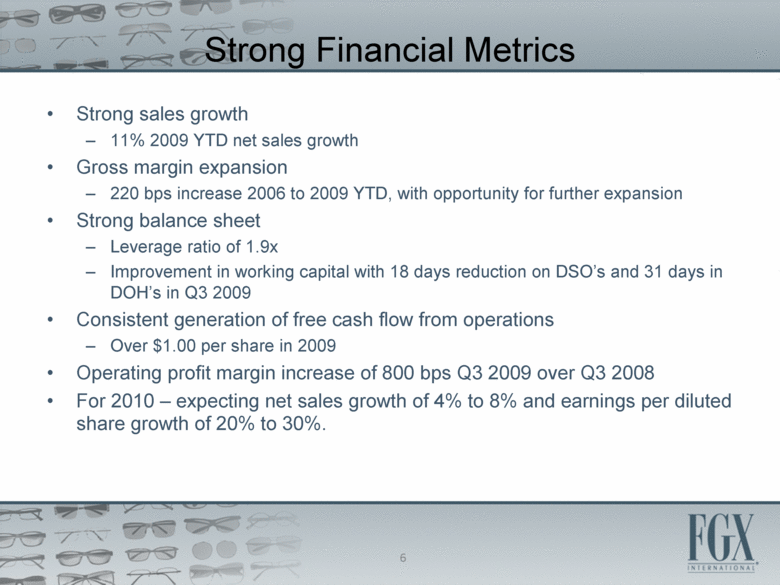
Strong Financial Metrics Strong sales growth 11% 2009 YTD net sales growth Gross margin expansion 220 bps increase 2006 to 2009 YTD, with opportunity for further expansion Strong balance sheet Leverage ratio of 1.9x Improvement in working capital with 18 days reduction on DSO’s and 31 days in DOH’s in Q3 2009 Consistent generation of free cash flow from operations Over $1.00 per share in 2009 Operating profit margin increase of 800 bps Q3 2009 over Q3 2008 For 2010 – expecting net sales growth of 4% to 8% and earnings per diluted share growth of 20% to 30%. 6 |
|
|
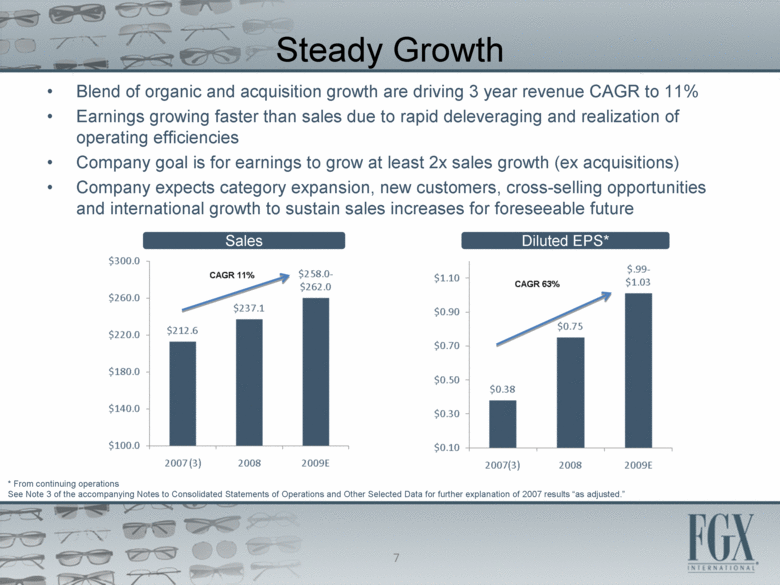
Steady Growth Sales Diluted EPS* Blend of organic and acquisition growth are driving 3 year revenue CAGR to 11% Earnings growing faster than sales due to rapid deleveraging and realization of operating efficiencies Company goal is for earnings to grow at least 2x sales growth (ex acquisitions) Company expects category expansion, new customers, cross-selling opportunities and international growth to sustain sales increases for foreseeable future 7 * From continuing operations See Note 3 of the accompanying Notes to Consolidated Statements of Operations and Other Selected Data for further explanation of 2007 results “as adjusted.” |
|
|
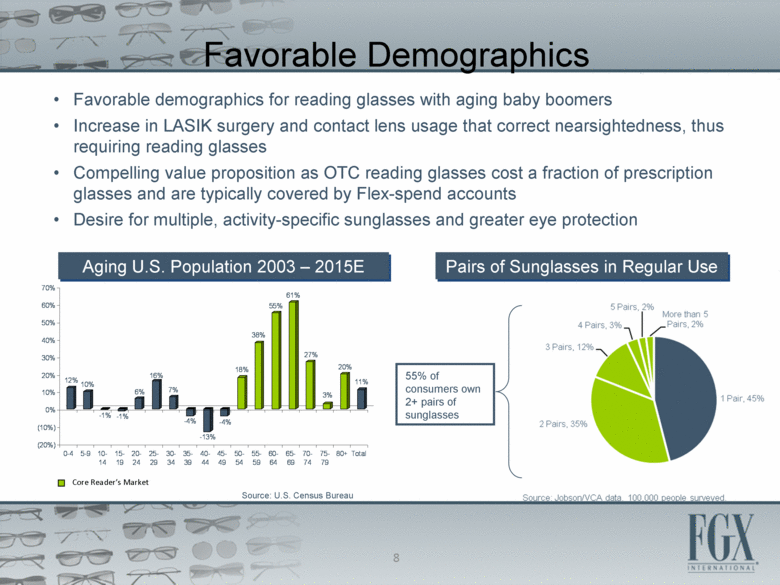
Favorable Demographics Favorable demographics for reading glasses with aging baby boomers Increase in LASIK surgery and contact lens usage that correct nearsightedness, thus requiring reading glasses Compelling value proposition as OTC reading glasses cost a fraction of prescription glasses and are typically covered by Flex-spend accounts Desire for multiple, activity-specific sunglasses and greater eye protection Aging U.S. Population 2003 – 2015E Pairs of Sunglasses in Regular Use Core Reader’s Market Source: U.S. Census Bureau 55% of consumers own 2+ pairs of sunglasses 8 12% 10% -1% -1% 6% 16% 7% -4% -13% -4% 18% 38% 55% 61% 27% 3% 20% 11% (20%) (10%) 0% 10% 20% 30% 40% 50% 60% 70% 0-4 5-9 10- 14 15- 19 20- 24 25- 29 30- 34 35- 39 40- 44 45- 49 50- 54 55- 59 60- 64 65- 69 70- 74 75- 79 80+ Total |
|
|
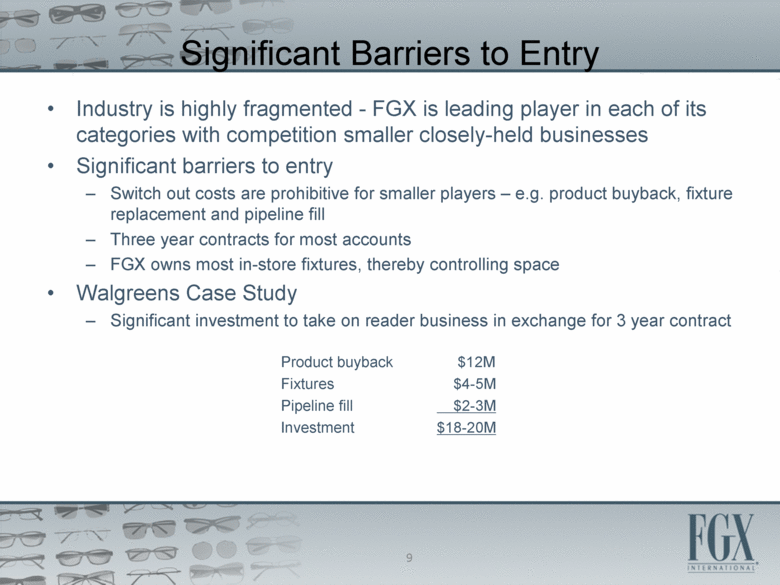
Significant Barriers to Entry Industry is highly fragmented - FGX is leading player in each of its categories with competition smaller closely-held businesses Significant barriers to entry Switch out costs are prohibitive for smaller players – e.g. product buyback, fixture replacement and pipeline fill Three year contracts for most accounts FGX owns most in-store fixtures, thereby controlling space Walgreens Case Study Significant investment to take on reader business in exchange for 3 year contract Product buyback $12M Fixtures $4-5M Pipeline fill $2-3M Investment $18-20M 9 |
|
|
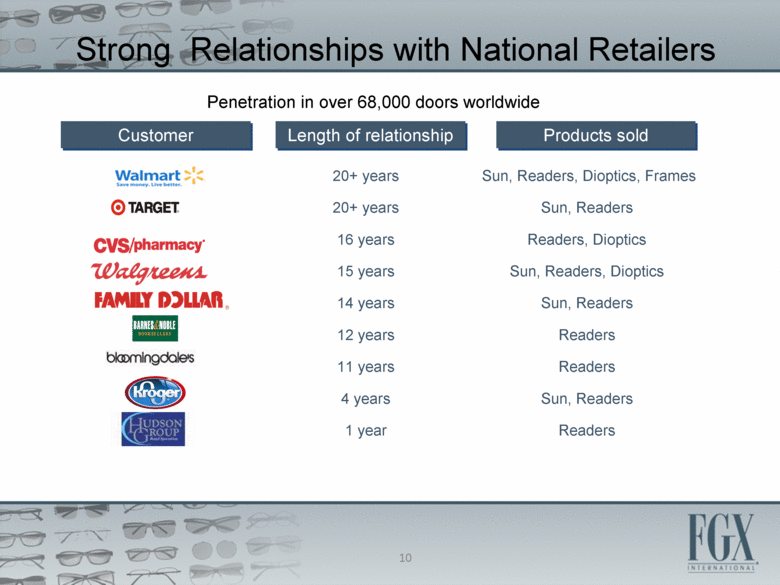
20+ years 20+ years 16 years 15 years 14 years 12 years 11 years 4 years 1 year Strong Relationships with National Retailers Penetration in over 68,000 doors worldwide Sun, Readers, Dioptics, Frames Sun, Readers Readers, Dioptics Sun, Readers, Dioptics Sun, Readers Readers Readers Sun, Readers Readers 10 Customer Length of relationship Products sold |
|
|
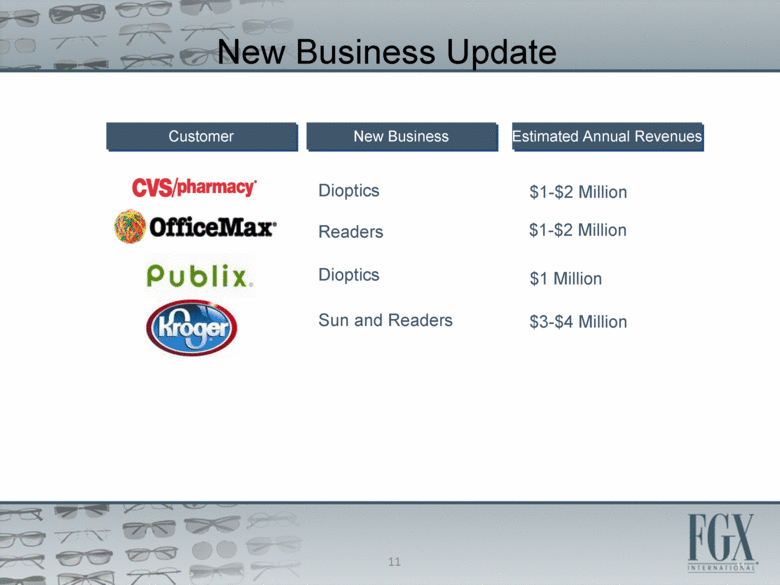
11 New Business Update Readers Dioptics Dioptics $1-$2 Million $1 Million $1-$2 Million Sun and Readers $3-$4 Million 11 Customer New Business Estimated Annual Revenues |
|
|
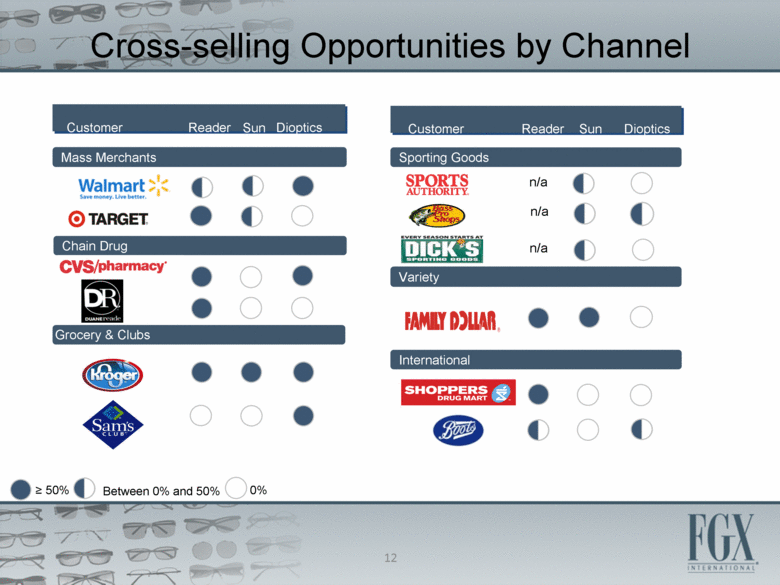
Reader Sun Dioptics Customer Chain Drug Mass Merchants Cross-selling Opportunities by Channel Grocery & Clubs Sporting Goods Variety International Customer Reader Sun Dioptics Between 0% and 50% n/a n/a > 50% 0% n/a 12 |
|
|
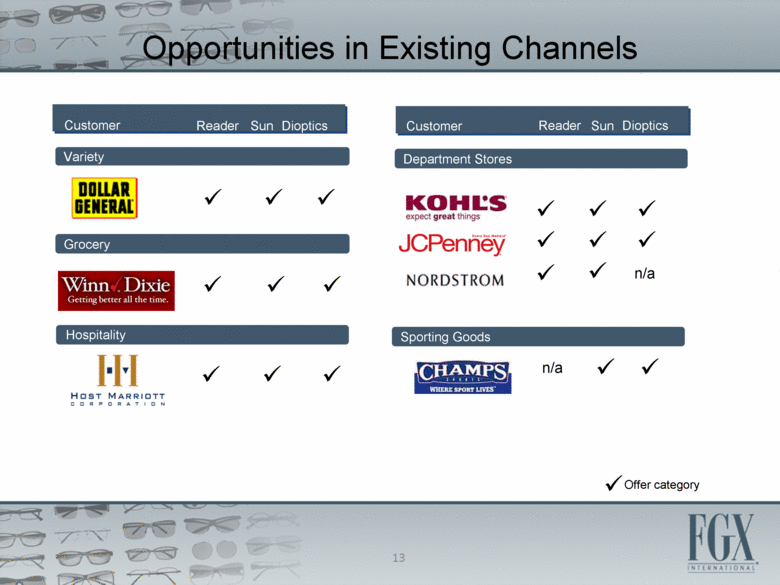
Reader Customer Grocery Variety Opportunities in Existing Channels Hospitality Department Stores Sporting Goods Offer category n/a ü 13 Reader Sun Dioptics Customer Sun Dioptics |
|
|
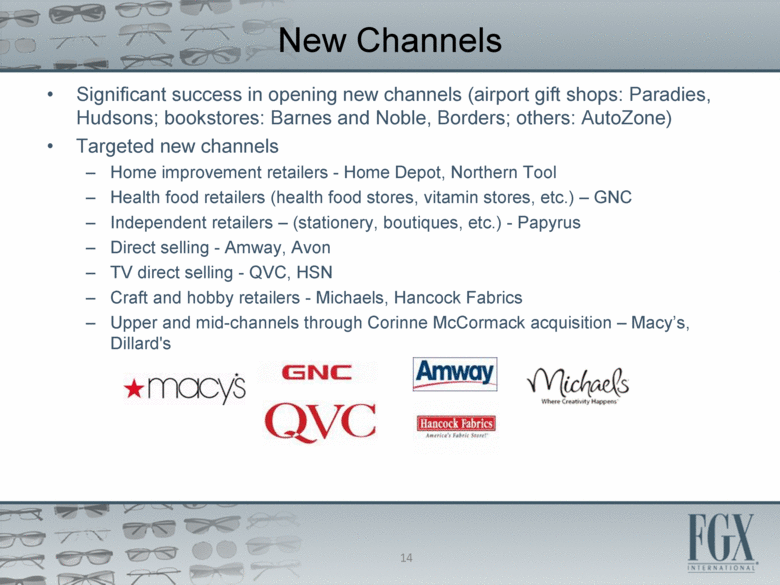
New Channels Significant success in opening new channels (airport gift shops: Paradies, Hudsons; bookstores: Barnes and Noble, Borders; others: AutoZone) Targeted new channels Home improvement retailers - Home Depot, Northern Tool Health food retailers (health food stores, vitamin stores, etc.) – GNC Independent retailers – (stationery, boutiques, etc.) - Papyrus Direct selling - Amway, Avon TV direct selling - QVC, HSN Craft and hobby retailers - Michaels, Hancock Fabrics Upper and mid-channels through Corinne McCormack acquisition – Macy’s, Dillard's 14 |
|
|
International Market Opportunities International sales represent approximately 13% of revenue United Kingdom, Canada and Mexico are only meaningful international markets Canada – significant market share similar to U.S. Latin America – new opportunities in Mexico and Venezuela Europe – leverage UK infrastructure to expand to adjacent countries Asia – exploit existing retailer relationships 15 |
|
|
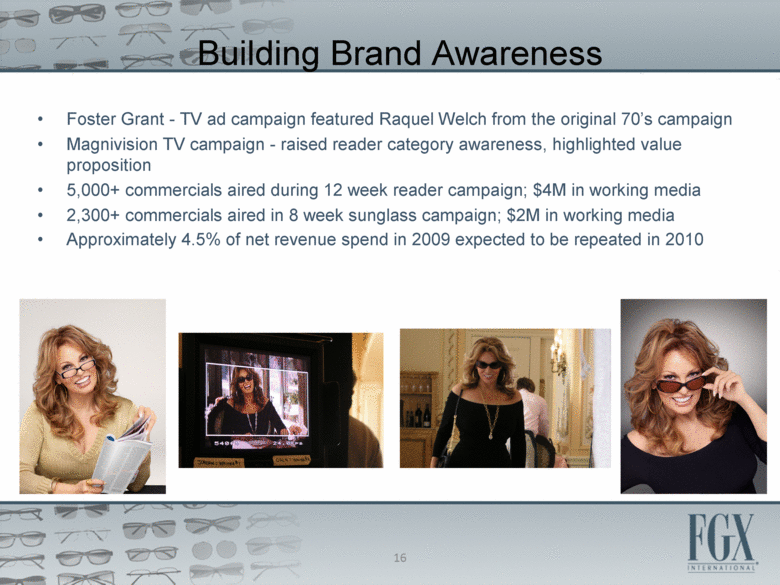
Building Brand Awareness Foster Grant - TV ad campaign featured Raquel Welch from the original 70’s campaign Magnivision TV campaign - raised reader category awareness, highlighted value proposition 5,000+ commercials aired during 12 week reader campaign; $4M in working media 2,300+ commercials aired in 8 week sunglass campaign; $2M in working media Approximately 4.5% of net revenue spend in 2009 expected to be repeated in 2010 16 |
|
|
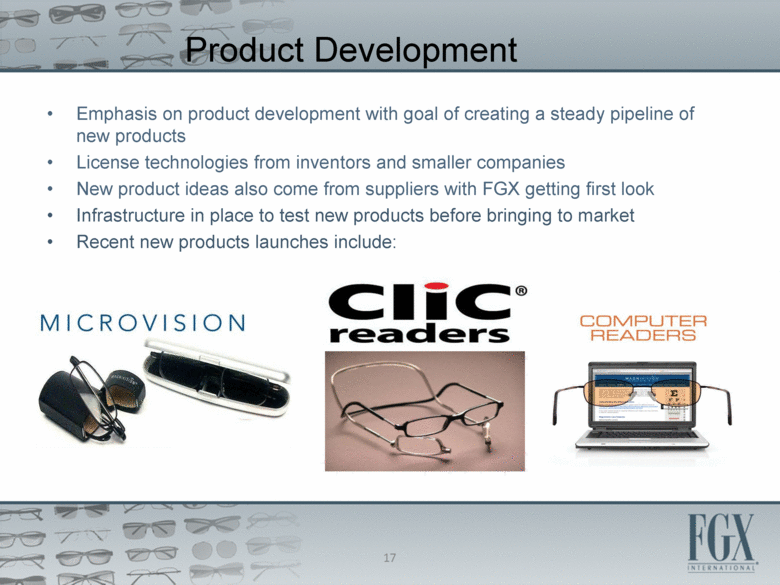
Product Development Emphasis on product development with goal of creating a steady pipeline of new products License technologies from inventors and smaller companies New product ideas also come from suppliers with FGX getting first look Infrastructure in place to test new products before bringing to market Recent new products launches include: 17 |
|
|
Disciplined Acquisition Strategy Add third leg to the stool Key criteria High growth and strong margin brands inside or outside of optical space Category leader - #1 or #2 Cross selling opportunities Leverage existing FGX infrastructure - supply chain management, field service and back office functions Accretive to earnings Acquisition funding $40-45M free cash flow in 2009 Favorably priced revolving credit facility with $47M of availability at end of Q3 Ability to use stock for portion of purchase price 18 |
|
|
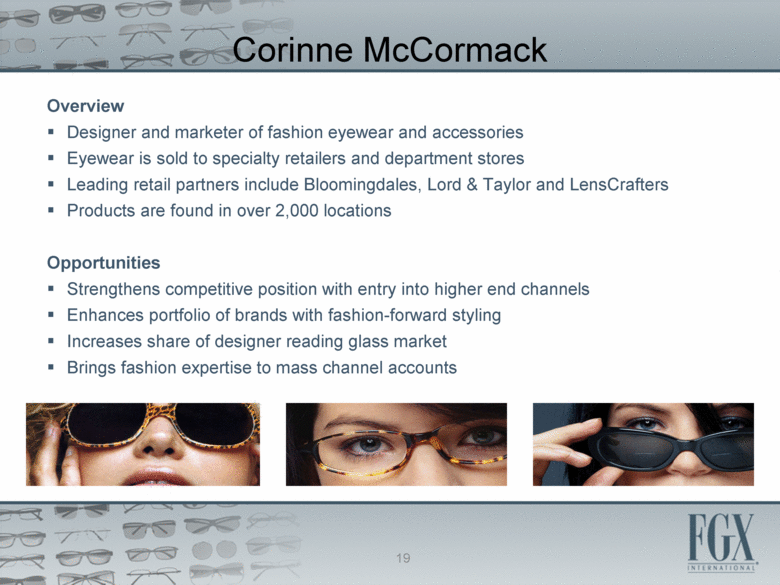
Corinne McCormack Overview Designer and marketer of fashion eyewear and accessories Eyewear is sold to specialty retailers and department stores Leading retail partners include Bloomingdales, Lord & Taylor and LensCrafters Products are found in over 2,000 locations Opportunities Strengthens competitive position with entry into higher end channels Enhances portfolio of brands with fashion-forward styling Increases share of designer reading glass market Brings fashion expertise to mass channel accounts 19 |
|
|
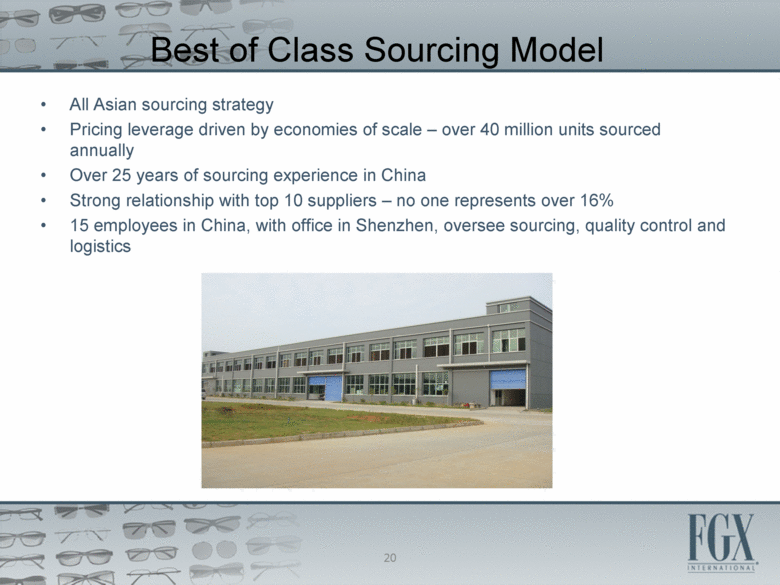
Best of Class Sourcing Model All Asian sourcing strategy Pricing leverage driven by economies of scale – over 40 million units sourced annually Over 25 years of sourcing experience in China Strong relationship with top 10 suppliers – no one represents over 16% 15 employees in China, with office in Shenzhen, oversee sourcing, quality control and logistics 20 |
|
|
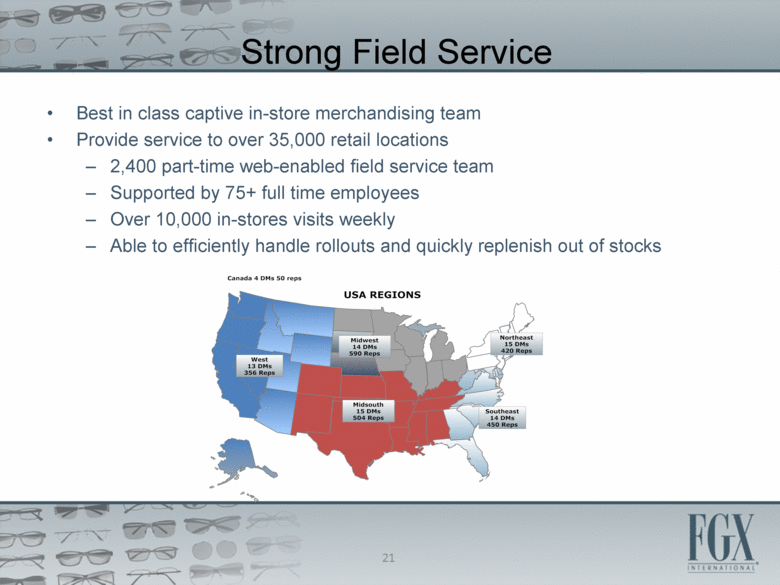
Best in class captive in-store merchandising team Provide service to over 35,000 retail locations 2,400 part-time web-enabled field service team Supported by 75+ full time employees Over 10,000 in-stores visits weekly Able to efficiently handle rollouts and quickly replenish out of stocks 21 Strong Field Service USA REGIONS West 13 DMs 356 Reps Midsouth 15 DMs 504 Reps Midwest 14 DMs 590 Reps Northeast 15 DMs 420 Reps Southeast 14 DMs 450 Reps Canada 4 DMs 50 reps |
|
|
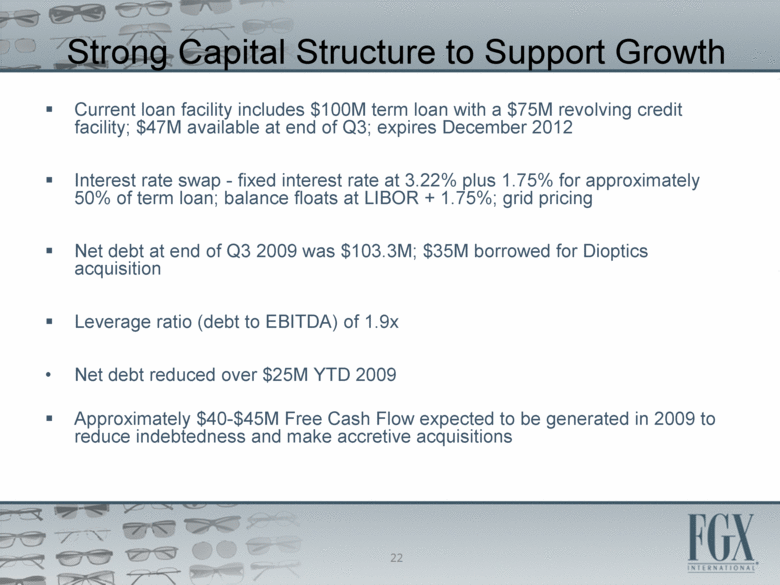
Strong Capital Structure to Support Growth Current loan facility includes $100M term loan with a $75M revolving credit facility; $47M available at end of Q3; expires December 2012 Interest rate swap - fixed interest rate at 3.22% plus 1.75% for approximately 50% of term loan; balance floats at LIBOR + 1.75%; grid pricing Net debt at end of Q3 2009 was $103.3M; $35M borrowed for Dioptics acquisition Leverage ratio (debt to EBITDA) of 1.9x Net debt reduced over $25M YTD 2009 Approximately $40-$45M Free Cash Flow expected to be generated in 2009 to reduce indebtedness and make accretive acquisitions 22 |
|
|
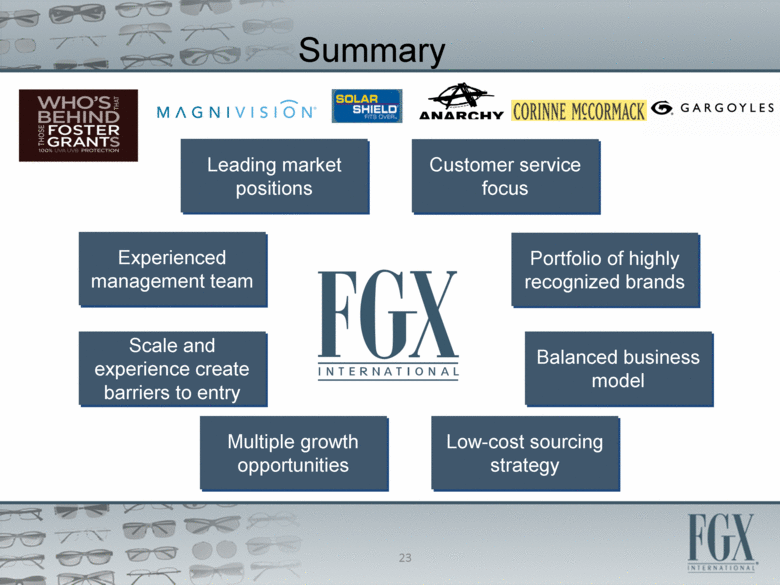
Summary Leading market positions Balanced business model Portfolio of highly recognized brands Low-cost sourcing strategy Scale and experience create barriers to entry Multiple growth opportunities Experienced management team Customer service focus 23 |
|
|
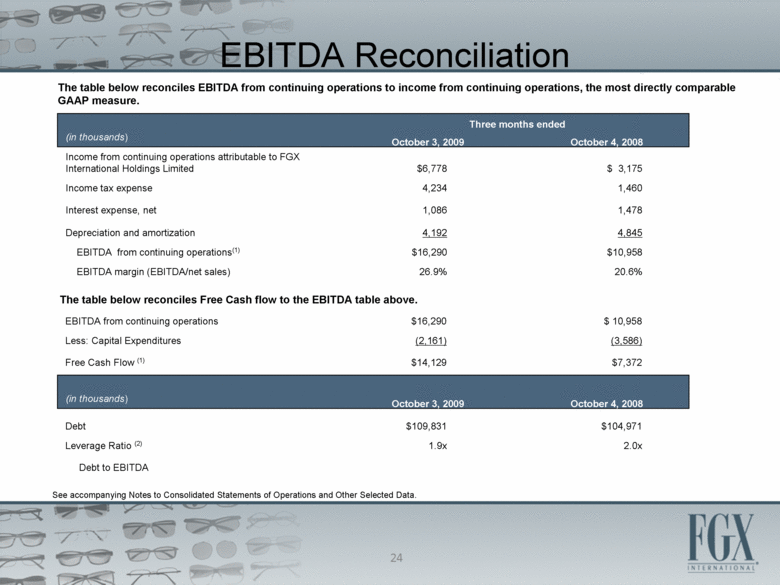
EBITDA Reconciliation (in thousands) The table below reconciles EBITDA from continuing operations to income from continuing operations, the most directly comparable GAAP measure. Three months ended October 3, 2009 October 4, 2008 The table below reconciles Free Cash flow to the EBITDA table above See accompanying Notes to Consolidated Statements of Operations and Other Selected Data. Income from continuing operations attributable to FGX International Holdings Limited $6,778 $ 3,175 Income tax expense 4,234 1,460 Interest expense, net 1,086 1,478 Depreciation and amortization 4,192 4,845 EBITDA from continuing operations(1) $16,290 $10,958 EBITDA margin (EBITDA/net sales) 26.9% 20.6% EBITDA from continuing operations $16,290 $ 10,958 Less: Capital Expenditures (2,161) (3,586) Free Cash Flow (1) $14,129 $7,372 Debt $109,831 $104,971 Leverage Ratio (2) 1.9x 2.0x Debt to EBITDA 24 (in thousands) October 3, 2009 October 4, 2008 |
|
|
NOTES TO CONSOLIDATED STATEMENTS OF OPERATIONS AND OTHER SELECTED DATA 1. EBITDA from continuing operations represents income from continuing operations before interest, income taxes, depreciation and amortization. Free cash flow represents EBITDA from continuing operations less capital expenditures. Net debt represents long-term and revolving debt less cash. We believe that EBITDA, free cash flow, and net debt are performance measures that provide securities analysts, investors and other interested parties with a measure of operating results unaffected by differences in capital structures, capital investment cycles and ages of related assets among otherwise comparable companies in our industry. We further believe that EBITDA is frequently used by securities analysts, investors and other interested parties in their evaluation of companies, many of which present an EBITDA measure when reporting their results. We believe EBITDA facilitates company-to-company operating performance comparisons by adjusting for potential differences caused by variations in capital structures (affecting net interest expense), taxation (such as the impact of differences in effective tax rates or net operating losses) and the age and book depreciation of facilities and equipment (affecting relative depreciation expense), which may vary for different companies for reasons unrelated to operating performance. We believe net debt is helpful in analyzing leverage and use it as a performance measure. Net debt should not be considered as an alternative to total debt determined in accordance with GAAP. EBITDA, free cash flow and net debt have limitations, including that they are not necessarily comparable to other similarly titled financial measures of other companies due to the potential inconsistencies in the method of calculation. These measures should not be considered either in isolation or as a substitute for analysis of our results as reported under U.S. GAAP. Because of these limitations, neither EBITDA nor free cash flow should be considered as a measure of discretionary cash available to us to invest in the growth of our business. Net debt should not be considered as an alternative to total debt determined in accordance with GAAP. We compensate for these limitations by relying primarily on our results presented in accordance with U.S.GAAP and using these measures only supplementally. The Leverage Ratios of Debt to EBITDA for the fiscal quarters ended October 3, 2009 and October 4, 2008 are calculated by dividing the Company’s Debt balance at period then ended by the associated EBITDA measure on a trailing 12-month basis. This ratio of Debt to EBITDA is a credit metric commonly used by investors and credit agencies as an indicator of financial risk, including a company’s ability to repay or refinance its debt obligations. This ratio as defined above may not be similar to measures used by other companies, is not a measurement under GAAP and should be considered in addition to, but not as a substitute for, the information contained in our consolidated financial statements. Fiscal 2007 “As Adjusted” results exclude the following: a $4,407 pre-tax charge in connection with the continued vacancy at the Company’s Mirimar, Florida facility; a $2,780 pre-tax charge related to the early extinguishment of debt relative to the Company’s refinancing of its remaining indebtedness to more favorable terms; and an aggregate $196 pre-tax charge in connection with the recall of children’s sunglasses. Fiscal 2006 “As Adjusted” results include the following: a $3.6 million pre-tax charge related to the return of non-prescription reading glasses resulting from commitments made to a majority of U.K. retail customers. This charge is in connection with the implementation of a change in U.K. business strategy and merchandising including new fixtures, updated product line offerings and new signage; and a $1.4 million pre-tax charge incurred in connection with the write off of an asset related to the buyback of competitive product due to the loss of business from a customer that sold certain retail stores to a third party. 25 |

