Attached files
| file | filename |
|---|---|
| 8-K - FORM 8-K - Discover Financial Services | d8k.htm |
 Investor Presentation – Discover Bank Subordinated Debt Issuance November 9, 2009 Exhibit 99.1 |
 2 Notice The following slides are part of a presentation by Discover Bank (the “Bank") and are intended to be viewed as part of that presentation. No representation is made that the information in these slides is complete. The Bank has prepared a preliminary offering circular dated November 9, 2009 (the
“Preliminary Offering Circular”) to which this communication relates. Before you invest, you should read the Preliminary Offering Circular, including the documents incorporated by reference therein, for more information concerning the Bank, Discover Financial Services or the Subordinated
Fixed Rate Notes of the Bank described herein. The Bank and any underwriter
or any dealer participating in the offering will arrange to send you a copy of the Preliminary Offering Circular if you request it by calling Goldman, Sachs & Co. toll free at (866) 471-2526.
The information provided herein may include certain non-GAAP financial measures. The reconciliations of such measures to the comparable GAAP figures are included in Discover Financial Services’ (“DFS” or the “Company”) Current Report on Form 8-K filed on September 17, 2009, Quarterly Report on Form 10-Q for the quarter ended August 31, 2009, and the
Company’s Annual Report on Form 10-K for the year ended November 30, 2008, which are on file with the SEC and available on the Company’s website at www.discoverfinancial.com. Certain
reconciliations are also included at the end of this presentation. The presentation contains forward-looking statements. You are cautioned not to place
undue reliance on forward-looking statements, which speak only as of the
date on which they are made, which reflect management’s estimates, projections, expectations or beliefs at that time and which are subject to risks and uncertainties that may cause actual results to differ
materially. For a discussion of certain risks and uncertainties that may
affect the future results of the Company, please see "Special Note Regarding Forward-Looking Statements," "Risk Factors," "Business – Competition," "Business – Supervision and Regulation" and "Management’s Discussion and Analysis of
Financial Condition and Results of Operations" in the Company’s Annual Report on Form 10-K for the year ended November 30, 2008, and “Risk Factors” and “Management’s Discussion and Analysis of Financial Condition and Results of Operations” in the Company’s Quarterly Reports on Form 10-Q for the quarters ended February 28, 2009, May 31, 2009 and August 31, 2009, which are on file with the SEC. Certain historical financial information about the Company that we have included in this
presentation has been derived from Morgan Stanley’s consolidated
financial statements and does not necessarily reflect what our financial condition, results of operations or cash flows would have been had we operated as a separate, stand-alone company during the periods
presented. We own or have rights to use the trademarks, trade names and
service marks that we use in conjunction with the operation of our business, including, but not limited to: Discover®, PULSE®, Cashback Bonus®, Discover® Network and Diners Club International®. All other trademarks, trade names and service marks included in this presentation are the property of their
respective owners. 2 |
 3 Debt Issuance Overview General corporate purposes Use of proceeds: Goldman, Sachs & Co. Bookrunner: Minimum denominations of $250,000 and multiples of $1,000 in excess thereof Denominations: 3.625% due August 15, 2019 Treasury Benchmark: November [ ], 2019 Expected Maturity: November [ ], 2009 Expected Pricing: $[TBD] Principal Amount: Ba1 (neg) / BBB- (stable) / BBB- (neg) (Moody’s / S&P / Fitch) (1) Expected Ratings: Subordinated Fixed Rate Notes Exempt from Registration under Section 3(a)(2) Security Description: Discover Bank Issuer: The Notes are not deposits of the Bank and are not insured by the FDIC or any other
governmental agency, or guaranteed by the FDIC or any other governmental agency. The Notes are issued by the Bank and are not obligations of, or guaranteed by, the Bank’s parent company, Discover Financial Services, or any other affiliate of the Bank. (1) Security ratings are not recommendations to buy, sell or hold the Notes and are
subject to revision or withdrawal at any time. |
 4 Rationale for Discover Bank Debt Issuance • Provides capital benefits both at the Discover Financial Services consolidated and Discover Bank levels • Enhances Tier 2 capital to both the Discover Financial Services consolidated and Discover Bank capital structure – Currently Tier 2 capital includes only loan loss reserves and, at the Discover Bank level, certain inter-company debt – Provides additional liquidity |
 5 DFS: An Overview (1) Note(s) 1. Balances as of August 31, 2009 (Fiscal 3Q09); volume based on the trailing four quarters
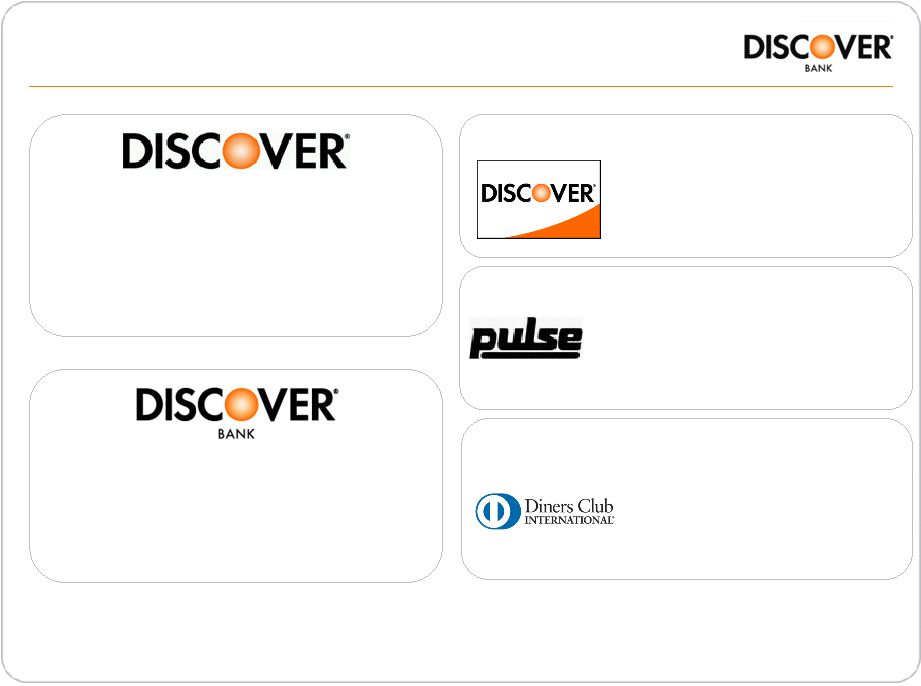
ending August 31, 2009 • Leading cash rewards program • $48Bn in managed credit card receivables • $29Bn deposit base • $3Bn personal and student loans • $110Bn volume • 4,500+ issuers • $97Bn volume • 30+ issuers • $26Bn volume • 49 franchises • 185 countries/ territories PIN Debit/ ATM Network International Signature Network North American Signature Network |
 6 DFS: Management Team 9 EVP, Card Programs & Chief Marketing Officer 48 Harit Talwar 2 1 SVP & Treasurer SVP & Chief Accounting Officer 49 42 Steve Etherington Mark Zaeske 7 SVP & Chief Credit Risk Officer 57 James Panzarino 11 EVP, Payment Services 52 Diane Offereins 9 EVP, Cardmember Services & Consumer Banking 47 Carlos Minetti 27 EVP, Gen Counsel & Secretary 49 Kathryn McNamara Corley 4 EVP & CFO 56 Roy Guthrie 11 President & COO 45 Roger Hochschild 11 Chairman & CEO 48 David Nelms Years at DFS Position Age Name |
 7 DFS: Highlights • Credit quality leader – Conservative portfolio by geography, tenure and demographics – Controlled growth and underwriting • Unique opportunities to accelerate growth / diversify revenues – Direct-to-consumer deposits – Global credit and debit payments businesses • Emphasis on strong capital, funding and liquidity profile |
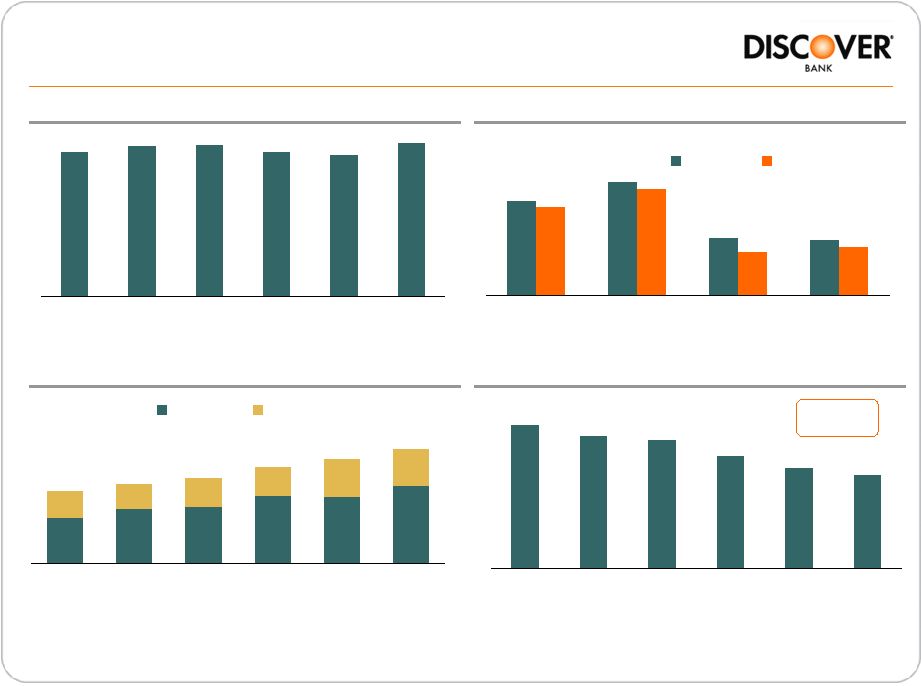 8 734 738 734 732 739 737 2004 2005 2006 2007 2008 2009 73% 44% 43% 88% 37% 33% 68% 82% Married Homeowner College Graduate Income > $75K Discover Other Issuers 10% 12% 12% 15% 15% 17% 6% 6% 6% 6% 8% 8% DFS JPM COF C BAC AXP California Florida DFS: Conservative Portfolio/Customer Profile 72% 63% 56% 53% 74% 81% DFS C BAC AXP COF JPM Average FICO of New Accounts (1) Demographic Profile (2) Notes: 1. Internal Data, 2009 FICO data is fiscal YTD, through Sept 30, 2009 2. 2008 TNS Card Research 3. Master Trust Receivables; Trust Data as of: Discover (DFS): Jul-09, AMEX (AXP): Jul-09, BofA (BAC): Sep-09, Capital One (COF): Mar-09, Citi (C ): Jun-09, JPM Chase (JPM): Jun-09. JPM represents Chase Issuance Trust (CHAIT)
only Tenure (3) Geography (3) >5 years (YTD) |
 9 Managed Net Charge-off Rate – 3Q09 (1) DFS: Credit Quality Leader 8.6% 8.9% 9.6% 10.2% 10.3% 13.9% DFS AXP COF C JPM BAC (2) (3) (4) (3) (5) (3) Loss Guidance – Total Managed Portfolio • Continue to expect 4Q09 managed net charge-off rate* to be in range of 8.5-9% versus 8.4% in 3Q09 • Will continue to maintain reserves reflecting credit conditions Source: Company Earnings Releases Note(s) 1. Reported, as of fiscal 3Q09 2. U.S Card, Credit card only, please refer to p.19 for reconciliation of GAAP to managed
data 3. U.S Card 4. NA Card 5. Card Services, 9.4% excluding WaMu U.S. Credit Card Portfolio * - includes credit card, student and personal loan portfolios |
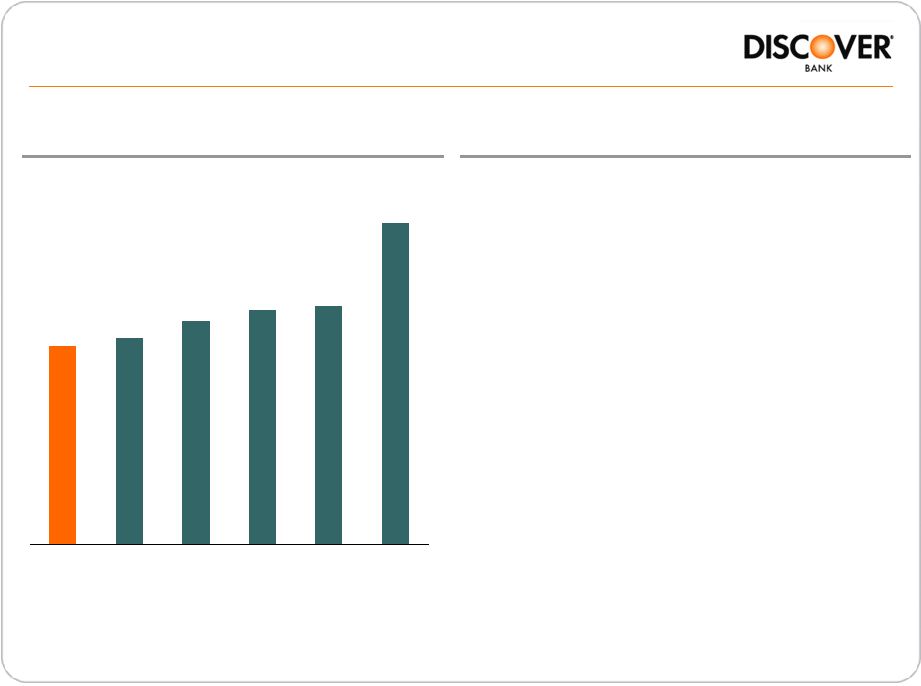
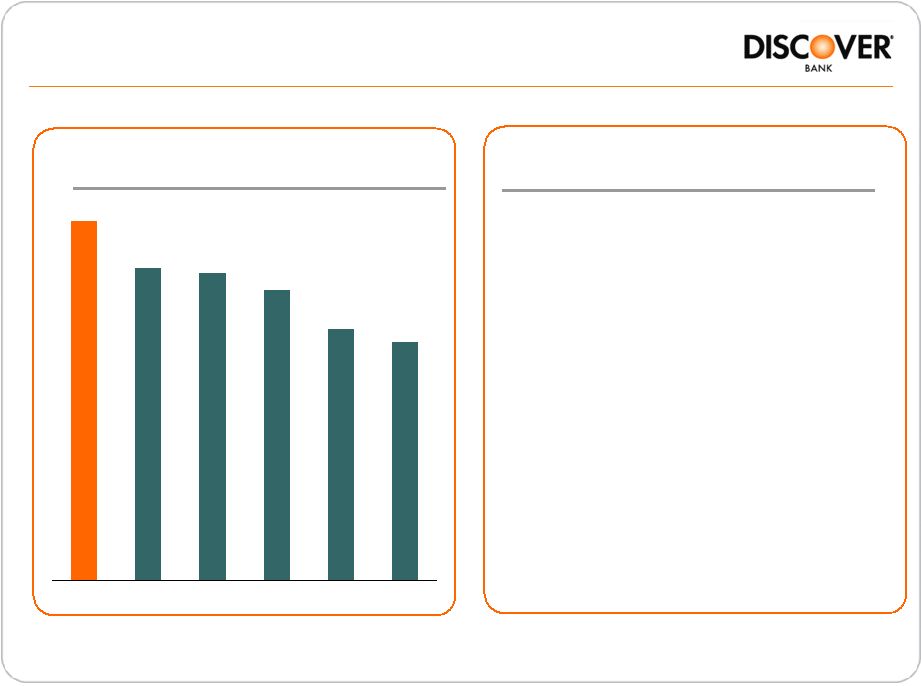
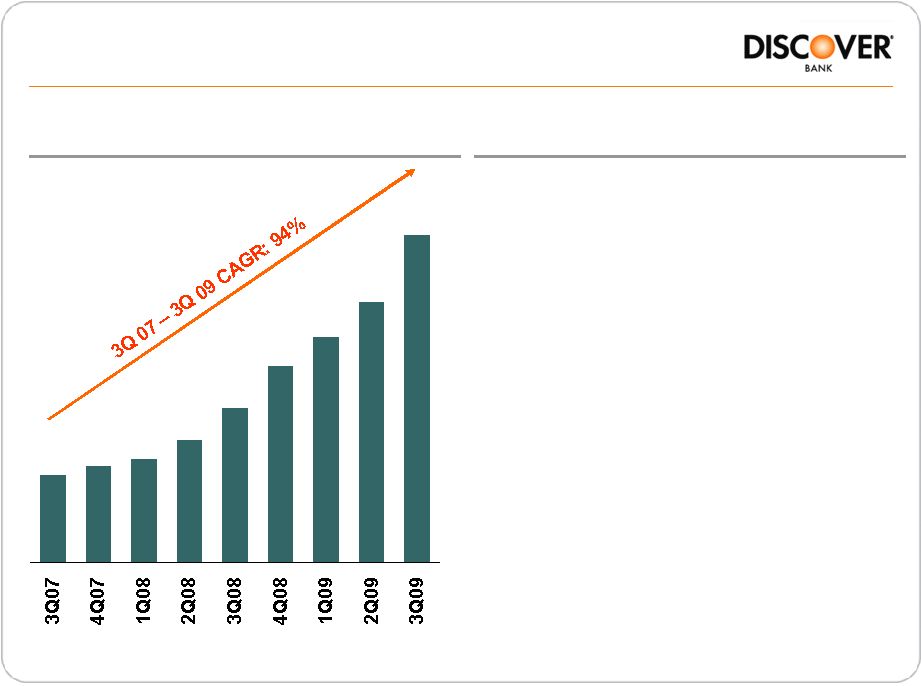 10 Priorities Growth in Direct Deposits (Bn) Direct-to-Consumer Deposit Growth • Create best-in-class customer experience • Expand product suite • Grow time deposits to improve maturity balance • Increase Discover deposits advertising/marketing $7.0 $8.1 $10.2 $6.1 $4.8 $3.8 $3.2 $3.0 $2.7 Note Includes deposits originated through affinity relationships
|
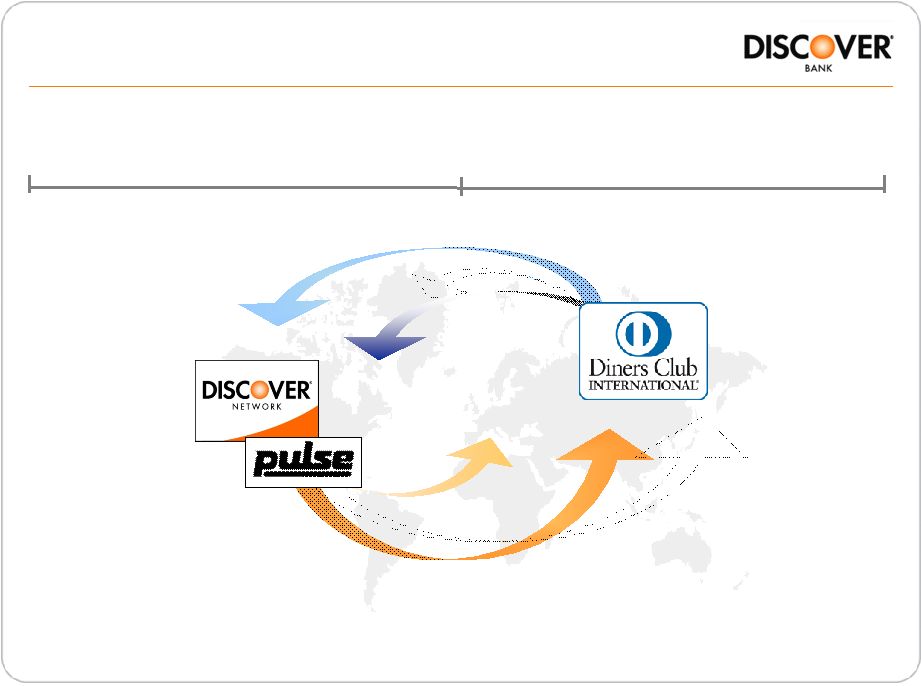           11 DFS: Global Payments 2009 2010 2011 • In July the Pulse network became the global ATM network for Diners Club • By year-end 2009 Discover cards are expected to be accepted in over 50 countries
|
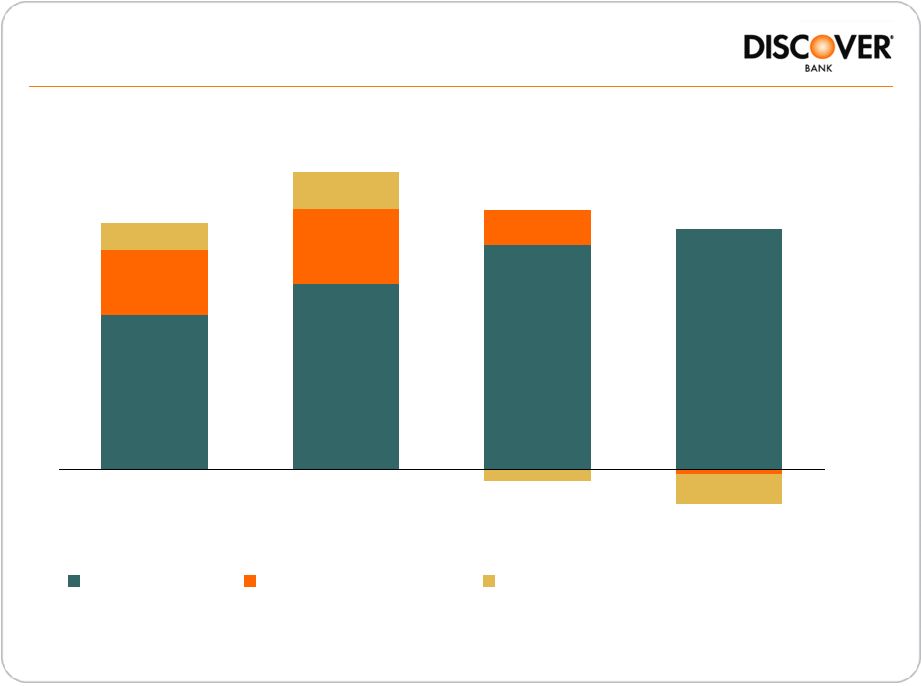 12 DFS: Managed Loan Loss Provisions (1) 691 829 1004 1079 157 165 $1,106 $1,334 $1,111 340 (21) 292 (134) 123 (50) $924 4Q08 1Q09 2Q09 3Q09 Net Charge-offs Reserve Build/Release Impact of ABS Maturities/Issuance (2) Note(s) 1. Please refer to p. 19 for reconciliation of GAAP to managed data 2. ABS maturities funded on-balance sheet |
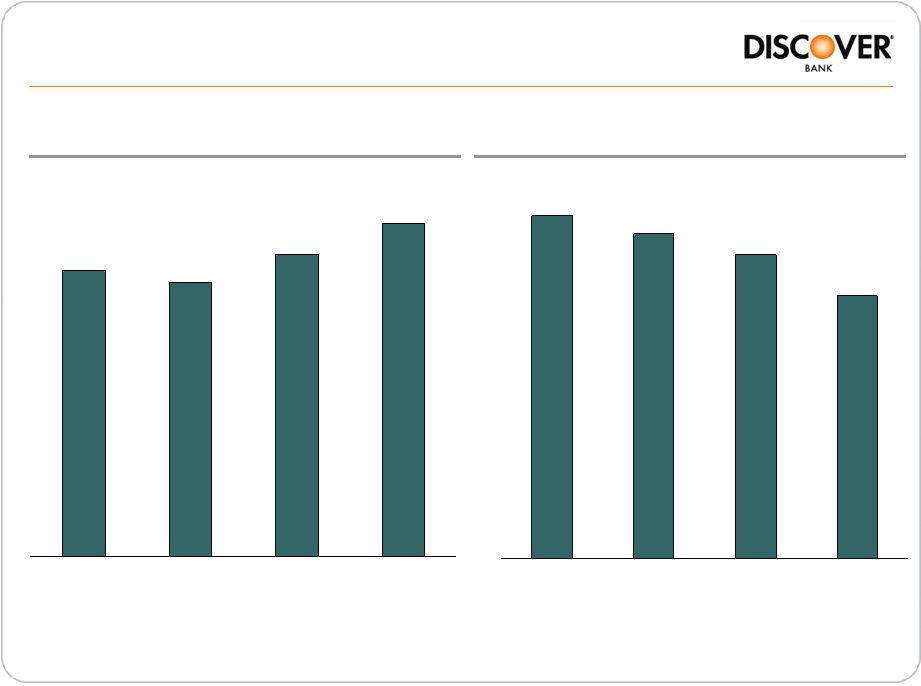 13 Non-interest Expense (2) (%) Managed Net Interest Margin (1) (%) 8.08% 7.75% 8.55% 9.42% 2006 2007 2008 YTD 3Q09 DFS: Margin Expansion and Expense Control 5.56% 5.28% 4.93% 4.27% 2006 2007 2008 YTD 3Q09 Note(s) 1. Managed net interest income as a percent of average managed loans, please refer to p. 20
for reconciliation of GAAP to managed data 2. Non-interest expense as a percent of average managed loans, please refer to p. 20
for reconciliation of GAAP to managed data 3. Annualized based on YTD 3Q09 numbers (3) (3) |
 14 CARD Act • Recent credit card reform legislation (CARD Act) – Repricing restrictions Risk-based pricing Delinquency repricing – Payment allocation Promotional rates Cash advance rates – Opt-in on overlimit fees • Potential impact – Pricing strategies – redistribution of consumer economics – Promotional offers – availability, pricing and duration |
 15 DFS Capital Ratios- 3Q09 (1) Note(s) 1. Sourced from Company Earnings Releases and filings – Fiscal 3Q09 2. COF Tier 2 ratio as of 2Q09, 3Q09 Tier 2 number not yet reported 3. Ratio = ( Tier 2 Capital / RWA ) Tier 2 Ratios (1) (3) DFS 1.3% C 3.9% BAC 4.2% COF 3.8% JPM 3.6% AXP 2.1% Tier 1 Ratios (1) 14.6% 12.7% 12.5% 11.8% 10.2% 9.7% DFS C BAC COF JPM AXP (2) |
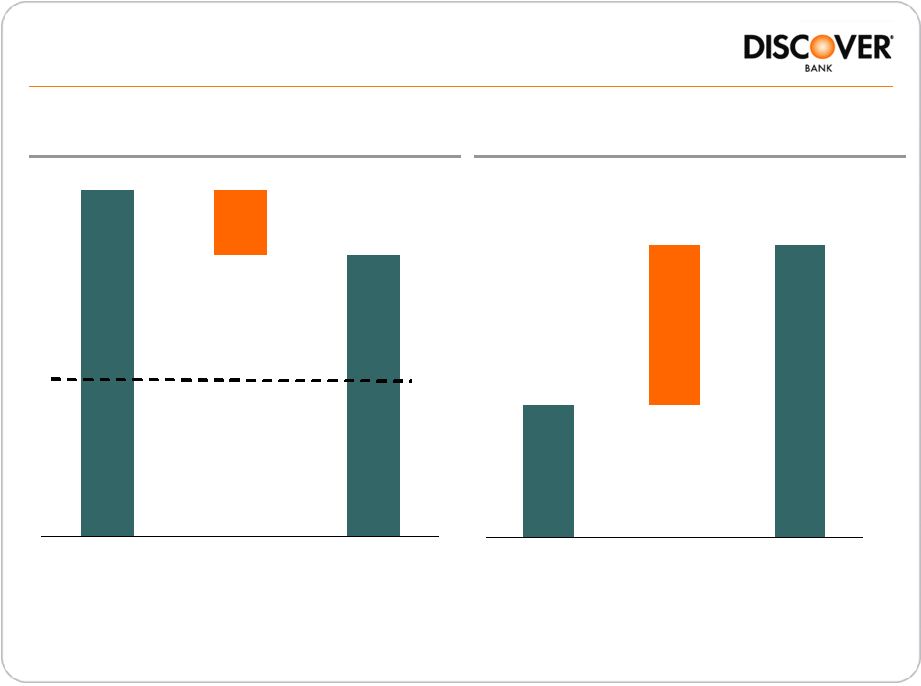 16 Pro-Forma Tier 1 Risk-Weighted Capital Ratio (%) Discover Bank: Estimated Impact of FAS 166/167 12.61% 2.35% 10.26% 9/30/2009 Actual FAS 166/167 9/30/2009 Proforma $1.7 $2.1 $3.8 9/30/2009 Actual FAS 166/167 9/30/2009 Proforma Well-Capitalized: 6% Pro-Forma Loan Loss Reserves ($Bn) (1) Note(s) 1. FAS 166/167 implementation (expected 12/2009) assumes historic costs for asset/liability consolidation, 3Q09 credit card reserve rate used for calculating additional allowance or loan losses (1) |
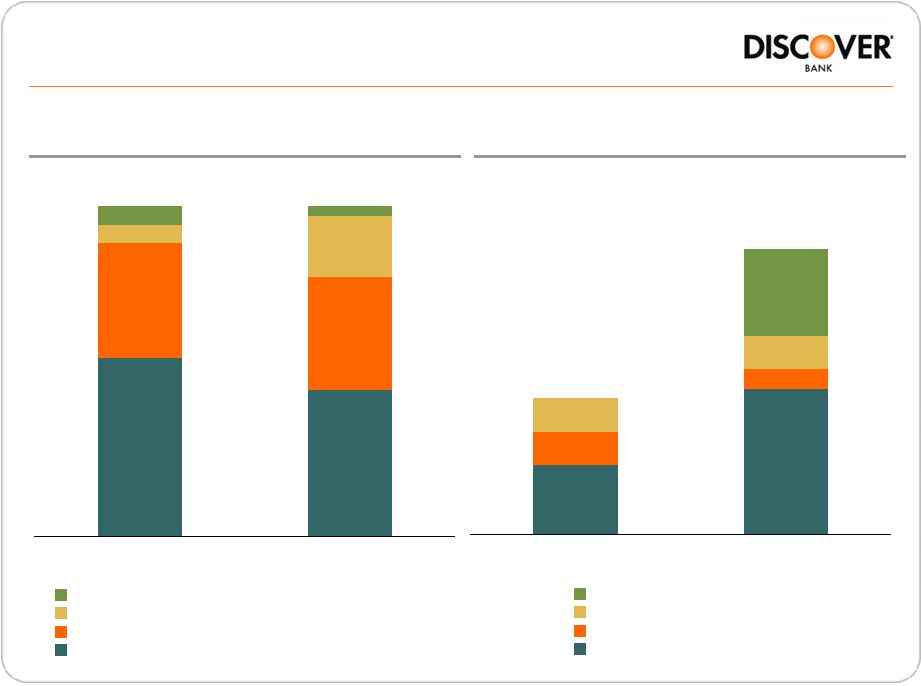 17 54% 35% 34% 5% 18% 45% 3% 6% June 07 Spin-off 3Q09 Other Direct-to-Consumer & Affinity Deposits Brokered Deposits ABS 5.1 10.6 2.4 1.5 2.5 2.4 6.4 $20.9 $10.0 June 07 Spin-off 3Q09 Fed Discount Window Committed Credit ABCP Open Lines Liquidity Reserve DFS: Funding and Liquidity Funding Mix (%) Contingent Liquidity ($Bn) $49Bn $56Bn |
 18 • Equity Raise – July – First offering of public equity since spin-off from Morgan Stanley – Sold approximately 60 million shares raising $534 million • Senior Debt Issuance – July – $400MM of 10.25% senior notes, first bond offering from DFS since spin in 2007
– Senior notes were well received by the market • ABS TALF Transactions – July / September – Prime credit card TALF eligible transaction – $1.5Bn, 3 year maturity (July) – $1.3Bn, 3 year maturity (September) – Priced at 1ML+130bps (Both transactions) – Well distributed, attracting TALF and non-TALF investors – Credit card ABS market (TALF & non-TALF) currently unavailable, awaiting
resolution of FDIC / legal isolation issue related to upcoming accounting
changes DFS: Recent Capital Market Transactions 18 |
 19 Appendix: DFS: Reconciliation of GAAP to Managed Data 3Q09 (8/31/2009) Average Credit Card Loans ($000s) GAAP Basis $24,051,037 Securitization Adjustments 24,590,853 Managed Basis $48,641,890 Managed Net Charge-off Rate (%) GAAP Basis 8.48% Securitization Adjustments 8.77% Managed Basis 8.63% 4Q08 1Q09 2Q09 3Q09 Provisions for Loan Losses ($000s) GAAP Basis $714,176 $937,813 $643,861 $380,999 Securitization Adjustments 391,795 395,860 467,371 543,428 Managed Basis $1,105,971 $1,333,673 $1,111,232 $924,427 Note: Charge off rates apply to managed credit card portfolio
|
 20 FY2006 FY 2007 FY 2008 YTD 3Q09 Average Total Loans ($000s) GAAP Basis $19,252,929 $19,947,784 $21,348,493 $27,454,927 Securitization Adjustments 25,156,303 26,965,690 27,662,655 23,868,274 Managed Basis $44,409,232 $46,913,474 $49,011,148 $51,323,201 Net Interest Income ($000s) GAAP Basis $1,372,912 $1,361,132 $1,404,559 $1,569,868 Securitization Adjustments 2,216,995 2,276,414 2,784,351 2,060,392 Managed Basis $3,589,907 $3,637,546 $4,188,910 $3,630,260 Net Interest Margin (%) GAAP Basis 7.13% 6.82% 6.58% 7.62% Securitization Adjustments 8.81% 8.44% 10.07% 11.50% Managed Basis 8.08% 7.75% 8.55% 9.42% Non-interest Expense ($000s) $2,467,058 $2,478,214 $2,415,797 $1,643,589 Non-interest Expense (%) GAAP Basis 12.81% 12.42% 11.32% 7.97% Securitization Adjustments 0.00% 0.00% 0.00% 0.00% Managed Basis 5.56% 5.28% 4.93% 4.27% Appendix: DFS: Reconciliation of GAAP to Managed Data (cont’d) Note: Total loans include credit card, personal loan and student loan portfolios |
 Investor Presentation – Discover Bank Subordinated Debt Offering November 9, 2009 |