Attached files
| file | filename |
|---|---|
| 10-Q - FORM 10-Q - CRAWFORD & CO | g20705e10vq.htm |
| EX-15 - EX-15 - CRAWFORD & CO | g20705exv15.htm |
| EX-31.1 - EX-31.1 - CRAWFORD & CO | g20705exv31w1.htm |
| EX-99.1 - EX-99.1 - CRAWFORD & CO | g20705exv99w1.htm |
| EX-32.2 - EX-32.2 - CRAWFORD & CO | g20705exv32w2.htm |
| EX-31.2 - EX-31.2 - CRAWFORD & CO | g20705exv31w2.htm |
| EX-32.1 - EX-32.1 - CRAWFORD & CO | g20705exv32w1.htm |
| EX-10.2 - EX-10.2 - CRAWFORD & CO | g20705exv10w2.htm |
Exhibit 99.2

| Third Quarter 2009 Earnings Conference Call Monday, November 9, 2009 |

| 2 Third Quarter Earnings Review November 9, 2009 Founded in 1941, Crawford is the largest independent global provider of claims management solutions and a fully integrated global provider of these solutions for the growing multi-national market. Crawford is divided into four operating segments that support the strategic positioning of the Company in a changing market place: U.S. Property & Casualty Serves the U.S. insurance company market International Operations Serves the global insurance industry and multinational corporations Broadspire Serves large national accounts, carriers and self-insured entities Legal Settlement Administration Provides administration for class action settlements and bankruptcy matters Crawford's independence, global presence and diversified business lines are key competitive advantages which set the Company apart from its competitors. |

| 3 Forward-looking Statements and Segment Operating Earnings Forward Looking Statements: This presentation contains forward-looking statements, including statements about the future financial condition, results of operations and earnings outlook of Crawford & Company. Statements, both qualitative and quantitative, that are not historical may be "forward-looking" statements as defined in the Private Securities Litigation Reform Act of 1995. Forward-looking statements involve a number of risks and uncertainties that could cause actual results to differ materially from historical experience or Crawford & Company's present expectations. Accordingly, no one should place undue reliance on forward-looking statements, which speak only as of the date on which they are made. Crawford & Company does not undertake to update forward-looking statements to reflect the impact of circumstances or events that may arise or not arise after the date the forward-looking statements are made. Results for any interim period presented herein are not necessarily indicative of results to be expected for the full year or for any other future period. For further information regarding Crawford & Company, and the risks and uncertainties involved in forward-looking statements, please read Crawford & Company's reports filed with the United States Securities and Exchange Commission and available at www.sec.gov or in the Investor Relations section of Crawford & Company's website at www.crawfordandcompany.com. Segment Operating Earnings: Under Statement of Financial Accounting Standards Number 131, Disclosures about Segments of an Enterprise and Related Information, segment operating earnings is the primary measure used by the Company to evaluate the results of each of its four operating segments. Segment operating earnings exclude income taxes, interest expense, amortization of customer-relationship intangible assets, stock option expense, earnings or loss attributable to non- controlling interests, and certain other nonrecuring gains and expenses. Non-GAAP Financial Information: For additional information about the non-GAAP financial information presented herein, see the Appendix following this presentation. |

| Working Together - The Crawford Difference Agenda: Welcome and Opening Comments Overview of 2009 Third Quarter 2009 Third Quarter Financial Review Segment Operating Highlights Outlook for Fiscal 2009 4 |

| 5 Third Quarter Overview Solid financial performance in a difficult operating environment Third quarter consolidated revenue decline of 7.9% as a strong U.S. dollar negatively affected revenues by $14.7 million $46.9 million non-cash impairment charge reduced earnings per share by $0.90 Slowdown in U.S. Property & Casualty U.S. Property & Casualty revenue down 7.1% Case referrals weakening International Operations revenue grew 0.9% on a constant dollar basis Improvements in Canada and Asia Pacific Large projects benefited Legal Settlement Administration Macroeconomic factors affecting Broadspire Revenues down 8.4% U.S. employment levels continue to decline 3Q 2009 3Q 2008 Revenue 245.8 266.9 $ in millions 3Q 2009 3Q 2008 Net Income Attributable to Crawford & Company before Impairment Charge 7.4 6.922 $ in millions $245.8 $266.9 $7.2 $6.9 |

| Revenue and Earnings Per Share Bridge Third Quarter 2008 to 2009 6 |

| Third Quarter 2009 Financial Review |

| 8 Third Quarter 2009 Financials |

| 9 3Q 2009 3Q 2008 Revenue 101.7 115.4 Revenue at 2008 FX rates 14.7 3Q 2009 3Q 2008 Operating Earnings 7.063 8.594 Operating Earnings at 2008 FX rates 1 $ in millions $ in millions Third Quarter 2009 Financials $101.7 $115.4 $1.0 $8.6 Revenue increased 0.9% on a constant dollar basis Operating earnings declined 3.7% on constant dollar basis $14.7 $7.3 *At third quarter 2008 average FX rates **At third quarter 2009 average FX rates |

| 10 3Q 2009 3Q 2008 Revenue 52.253 56.227 3Q 2009 3Q 2008 Operating Earnings 4.862 6.781 $ in millions $ in millions $56.2 $52.3 $6.8 $4.9 Catastrophe revenue flat with last year at $6.3 million Overall revenue declined due to lower claims volumes Third Quarter 2009 Financials |

| 11 3Q 2009 3Q 2008 Revenue 70.43 76.911 3Q 2009 3Q 2008 Operating Loss (Earnings) -1.171 1.1 $ in millions $ in millions $70.4 $76.9 $1.1 ($1.2) Revenues and earnings declined due to lower workers' compensation claim referrals Impact of economic crisis being felt most by this segment Third Quarter 2009 Financials |

| 12 3Q 2009 3Q 2008 Revenue 21.344 18.416 3Q 2009 3Q 2008 Operating Earnings 4.097 2.853 $ in millions $ in millions $21.3 $18.4 $2.9 $4.1 Revenue and operating earnings increase reflects benefit of significant bankruptcy and securities class action administration cases awarded in 2009 Backlog of $55.4 million Third Quarter 2009 Financials |

| 13 Third Quarter 2009 Financials |

| 14 Third Quarter 2009 Financials |

| Amended Credit Agreement Provides increased financial flexibility: Extension of the revolving credit agreement from October 30, 2011 to October 30, 2013 Crawford may increase the amount of its debt by up to $50 million Crawford may issue other, unsecured debt of up to $200 million Certain covenants updated to provide greater financial flexibility Leverage ratio increased from 2.50 times EBITDA to 3.25 times EBITDA at December 31, 2009 Step downs begin June 30, 2011 through maturity date Revised applicable interest rates upward 2.00% LIBOR floor added to base rate 50 bps increase in spread for revolver borrowings and Term Loan B 15 |

| Third Quarter 2009 Segment Highlights |

| 17 Third Quarter 2009 Financials 3Q 2009 2Q 2009 1Q 2009 4Q 2008 3Q 2008 International Claims 142.4 139.5 150.3 144.9 154.7 Claims referred in 000s 142.4 154.7 International Operations Global revenue growth of 0.9% before currency impacts FX impact on second quarter revenues was negative 12.8%, or $14.7 million Improvements in Canada and Asia Pacific Operating margin decreased to 7.1% from 7.4% Claims referred decreased 7.9% as weather affected claims in U.K. and Canada saw fewer auto claims 139.5 150.3 144.9 |

| 18 Third Quarter 2009 Financials U.S. Property & Casualty Revenue declined 7.1% Operating margin of 9.3%, compared with 12.1% in 2008 third quarter Claims referred decreased 15.4% due to: Decreases in volumes of high revenue complex claims Decreases in warranty and CAT- related claims Industrywide, the estimated number of property claims YTD is 1.5 million versus 3.1 million in 2008* *per Property Claims Service (PCS) 3Q 2009 2Q 2009 1Q 2009 4Q 2008 3Q 2008 U.S. P&C Claims 113.4 116.7 115.3 102.9 134 CAT claims 12.5 6.5 Claims referred in 000s 113.4 116.7 115.3 102.9 134.0 |

| 19 U.S. Catastrophe (CAT) Activity 3Q 2009 3Q 2008 8.7 12.5 3Q 2009 3Q 2008 Revenues 6.3 6.3 Revenues 11.6 6.5 North $6.3 $6.3 $ in millions Quarter Ended September 30: Revenues In 000s U.S. Catastrophe Catastrophe revenue of $6.3 million in 2009 and 2008 third quarter Year-to-date CAT events totaled 27 in the 2009 period compared to 35 in 2008 2008 reflects hurricane claims in U.S. from Gustav and Ike Lag between when claims referred and when services were performed and revenue recognized Cases |

| 20 Third Quarter 2009 Highlights 3Q 2009 2Q 2009 1Q 2009 4Q 2008 3Q 2008 Broadspire Claims 56.7 57.2 55.4 55.4 63.1 Claims referred in 000s 56.7 Broadspire Workers' Compensation market remains challenging due to high U.S. unemployment levels Revenue decrease of 8.4% on 10.1% decline in claims Claim volume stabilizing since 2008 fourth quarter Cost control program ongoing; headcount reduced by 127 in 2009 Hosted data center contract cancellation in September 57.2 55.4 55.4 63.1 |

| 21 Third Quarter 2009 Highlights Legal Settlement Administration Revenue increased 15.9% Operating income increased 43.6% on improved operating margins Increase in bankruptcy related and securities class action revenues led by several major cases awarded in 2009 Backlog of $55.4 million 3Q 2009 3Q 2008 Backlog 55.4 43.5 Backlog in millions $55.4 $43.5 |

| 22 2009 Guidance Full Year 2009 Guidance: Consolidated revenue before reimbursements between $970 million and $975 million Consolidated operating earnings between $48.5 million and $51.5 million Consolidated cash provided by operating activities between $30 and $35 million. After reflecting stock-based compensation expense, net corporate interest expense, customer-relationship intangible amortization expense, special credits and charges and income taxes, net loss attributable to Crawford & Company on a GAAP basis between ($120.0) million and ($122.0) million Loss per share of ($2.32) to ($2.36) Before reflecting the special charge related to the preliminary goodwill impairment, net income attributable to Crawford & Company on a non-GAAP basis between $19.1 million and $21.2 million, or $0.37 to $0.41 diluted earnings per share |

| Third Quarter 2009 Earnings Conference Call Monday, November 9, 2009 |

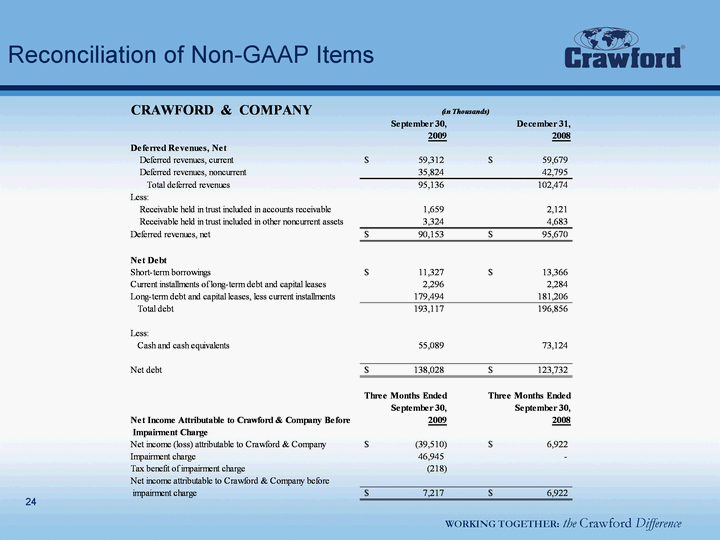
| Reconciliation of Non-GAAP Items 24 |
