Attached files
| file | filename |
|---|---|
| 8-K - FORM 8-K - COMERICA INC /NEW/ | d8k.htm |
 Comerica Incorporated Sandler O’Neill East Coast Financial Services Conference November 11-12, 2009 Ralph Babb Chief Executive Officer Beth Acton Chief Financial Officer John Killian Executive Vice President, Credit Policy Exhibit 99.1 |
 2 Safe Harbor Statement Any statements in this presentation that are not historical facts are
forward-looking statements as defined in the Private Securities
Litigation Reform Act of 1995. Words such as "anticipates," "believes," "feels," "expects," "estimates," "seeks," "strives," "plans," "intends," "outlook,"
"forecast," "position," "target," "mission," "assume," "achievable," "potential," "strategy," "goal," "aspiration," "outcome," "continue,"
"remain," "maintain," "trend," "objective" and variations of such words and similar expressions, or future or conditional verbs such as "will," "would,"
"should," "could," "might," "can," "may" or similar expressions, as they relate to Comerica or its management, are intended to identify
forward-looking statements. Forward- looking statements may include
descriptions of plans and objectives of Comerica’s management for future or past operations, products or services, and forecasts of Comerica’s revenue, earnings or other
measures of economic performance, including statements of profitability, business segments and subsidiaries, estimates of credit trends and global stability. Such statements reflect the view of Comerica’s management as of this date with respect
to future events and are subject to risks and uncertainties. Should one or
more of these risks materialize or should underlying beliefs or assumptions
prove incorrect, Comerica’s actual results could differ materially from
those discussed. Factors that could cause or contribute to such differences are further economic downturns, changes in the pace of an economic recovery
and related changes in employment levels, changes in real estate values,
fuel prices, energy costs or other events that could affect customer income levels or general economic conditions, changes related to the headquarters relocation or
to its underlying assumptions, the effects of recently enacted legislation,
such as the Emergency Economic Stabilization Act of 2008 and the American Recovery and Reinvestment Act of 2009, and actions taken by the U.S. Department of
Treasury, the Board of Governors of the Federal Reserve System, the Texas
Department of Banking and the Federal Deposit Insurance Corporation,
the effects of war and other armed conflicts or acts of terrorism, the
effects of natural disasters including, but not limited to, hurricanes, tornadoes, earthquakes, fires, droughts and floods, the disruption of private or
public utilities, the implementation of Comerica’s strategies and
business models, management’s ability to maintain and expand customer relationships, changes in customer borrowing, repayment, investment and deposit practices, management’s
ability to retain key officers and employees, changes in the accounting treatment of any particular item, the impact of regulatory examinations, declines or other changes in the businesses or industries in which Comerica has a concentration of
loans, including, but not limited to, the automotive production industry and
the real estate business lines, the anticipated performance of any new banking centers, the entry of new competitors in Comerica’s markets, changes in the level
of fee income, changes in applicable laws and regulations, including those
concerning taxes, banking, securities and insurance, changes in trade, monetary and fiscal policies, including the interest rate policies of the Board of Governors of the Federal
Reserve System, fluctuations in inflation or interest rates, changes in
general economic, political or industry conditions and related credit and market conditions, the interdependence of financial service companies and adverse conditions in the stock
market. Comerica cautions that the foregoing list of factors is not
exclusive. For discussion of factors that may cause actual results to differ from expectations, please refer to our filings with the Securities and Exchange Commission.
Forward-looking statements speak only as of the date they are made.
Comerica does not undertake to update forward-looking statements to reflect facts, circumstances, assumptions or events that occur after the date the forward-looking statements are
made. For any forward-looking statements made in this presentation or in
any documents, Comerica claims the protection of the safe harbor for forward- looking statements contained in the Private Securities Litigation Reform Act of
1995. |
 3 Comerica: A Brief Overview Among the top 25 U.S. bank holding companies Largest bank with corporate headquarters in Texas $60 billion in assets Founded 160 years ago Major markets include: Continued investments in growth markets Strong capital position • California • Arizona • Florida • Michigan • Texas At September 30, 2009 |
 4 Comerica Key Differentiators Relationships are Priority One • Focused on growing and maintaining long-term relationships • Relationship Managers known for ingenuity, flexibility and responsiveness Business Bank Focus • Emphasis on having a clear understanding of our customers and their banking needs • Natural entry point to cross-sell other services Credit management • Consistent credit standards • Exposure limits • Relationship banking strategy: originate and hold Size • Wide array of products and services • Community bank feel Conservative investment strategy • MBS investment portfolio (AAA- rated and liquid) • No off-balance sheet structures Deposit focus • Average noninterest-bearing deposits grew $835 million in 3Q09 • New and enhanced products Controlling expenses and workforce carefully Quality of capital is solid Main Street Bank 1 MBS: Mortgage-backed security 2 Excludes Financial Services Division balances 1 2 |
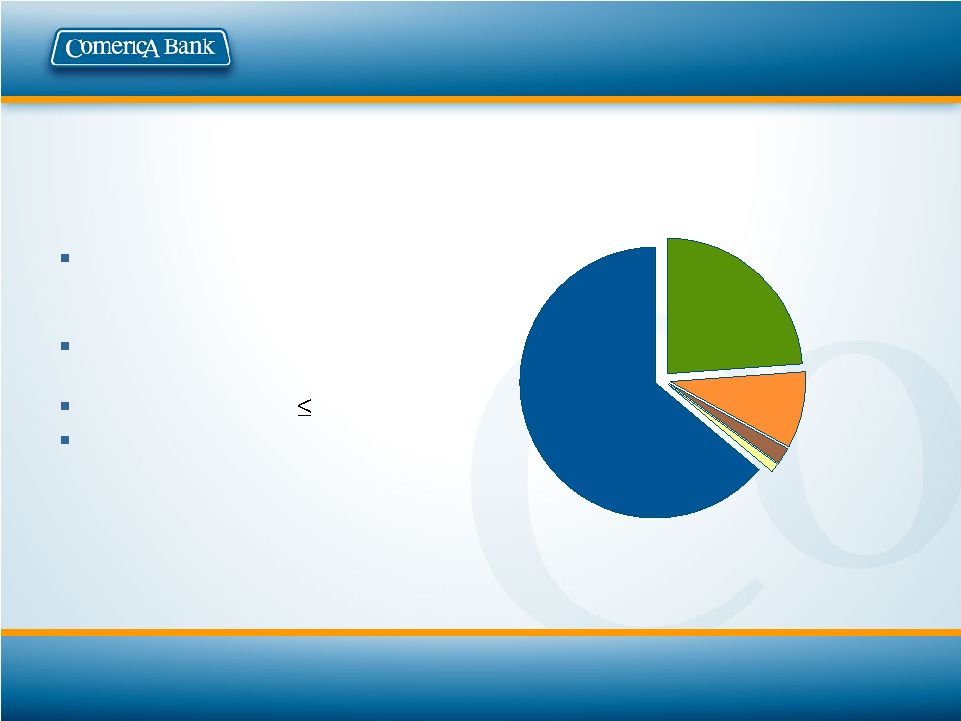
 5 W&IM $328MM 16% Retail Bank $522MM 25% Business Bank $1,199MM 59% Our Core Businesses Business Bank Wide spectrum of credit and non-credit financial products, cash management and international trade services Retail Bank Personalized financial products & services to consumers and small businesses Wealth & Institutional Management Serves the needs of affluent clients, foundations, organizations and corporations 2009 YTD Revenue By Business Segment 1 As of September 30, 2009: YTD revenues of $2.049 billion from continuing operations
(FTE) excluding Finance & Other Businesses 1
|
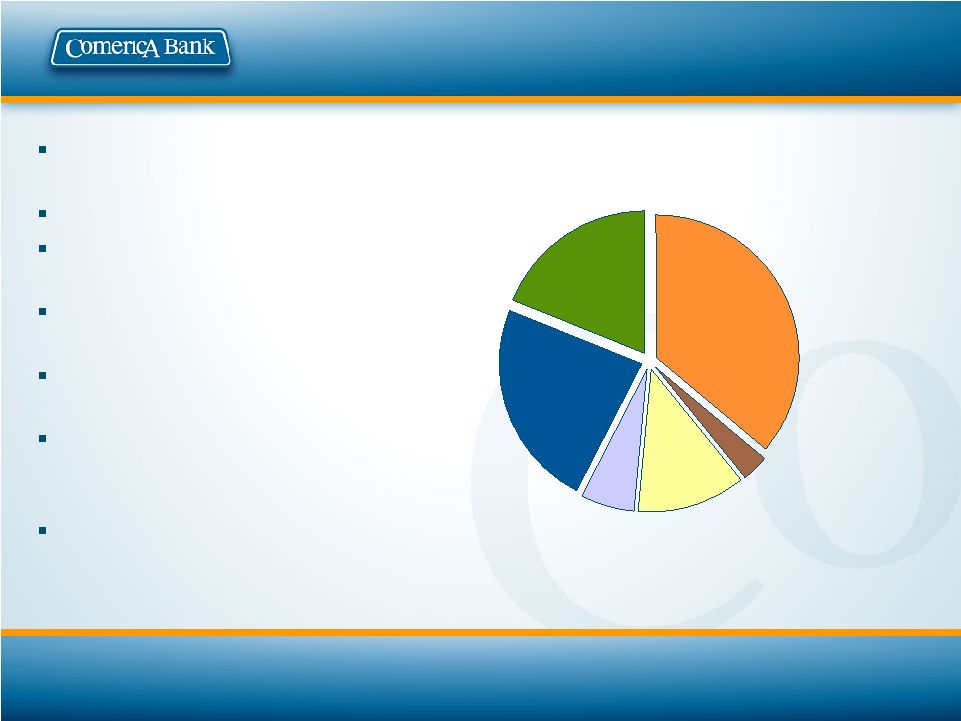
 6 Florida $42MM 2% Int'l $75MM 4% Other Markets $158MM 8% Texas $283MM 14% Western $561MM 27% Midwest $930MM 45% Where We Operate 1 Source: The U.S. Census Bureau 2 As of September 30, 2009: YTD revenues of $2.049 billion from continuing operations (FTE) excluding Finance & Other Businesses; Geography based on office of origination; Midwest includes: MI, OH, IL; Western includes:
CA, AZ, NV, CO, WA; Other Markets include markets not separately identified
above in addition to businesses with a national perspective Exporting our 160
year relationship banking expertise to high growth markets Operate in seven of the eleven largest U.S. cities California, Arizona, Texas and Florida to account for over one- half of U.S. population growth between 2000 and 2030 Geographic footprint diversifies earnings mix 2009 YTD Revenue By Market Segment 2 1 1 |
 7 Global Corp Banking $5.8B 13% Commercial Real Estate $6.0B 13% Middle Market $13.9B 31% Nat'l Dealer Services $3.1B 7% Specialty Businesses 1,2 $5.1B 11% Personal Banking $2.0B 5% Small Business Banking $3.9B 9% Private Banking $4.8B 11% Diverse Loan Portfolio 1 Excluding Financial Services Division ($209 million) 2 Specialty Businesses includes: Entertainment, Energy, Leasing, Technology and Life
Sciences, and Mortgage Banker Finance Geography based on office of
origination; Midwest: MI, OH, IL; Western: CA, AZ, NV, CO, WA; Other Markets include markets not separately identified above in addition to businesses with a national perspective Average 3Q09: $44.6 billion 1 Other Markets $3.7B 8% Int'l $1.9B 4% Florida $1.7B 4% Midwest $16.4B 37% Western $13.7B 31% Texas $7.2B 16% 1 |
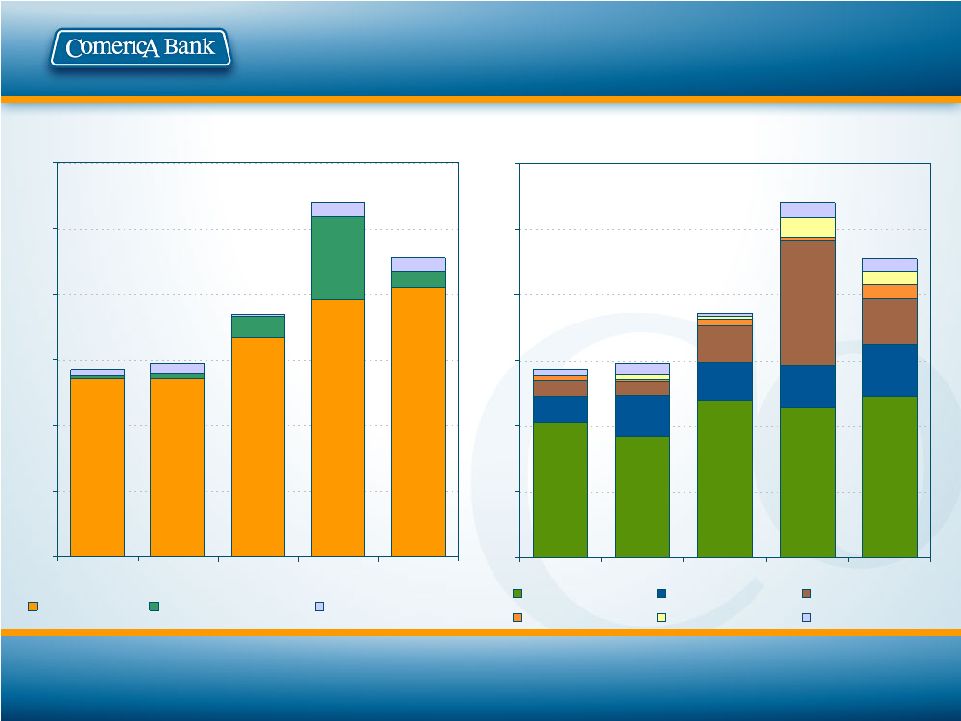
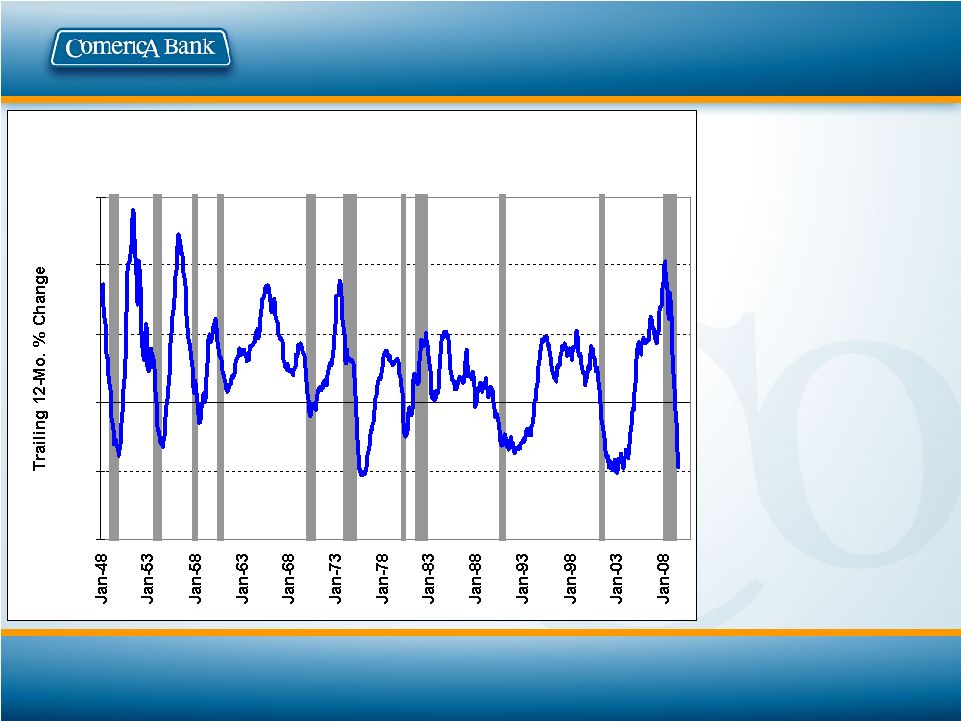 8 Loan Growth Post-Recession Comerica Commercial and Consumer Lending Activity New commitments: 1Q09: $1.4 Billion 2Q09: $1.6 Billion 3Q09: $1.6 Billion Renewed commitments: 1Q09: $4.2 Billion 2Q09: $8.6 Billion 3Q09: $10.2 Billion Recessionary periods noted by gray shaded areas C&I Loans, All U.S. Commercial Banks Deflated by the CPI -20% -10% 0% 10% 20% 30% |
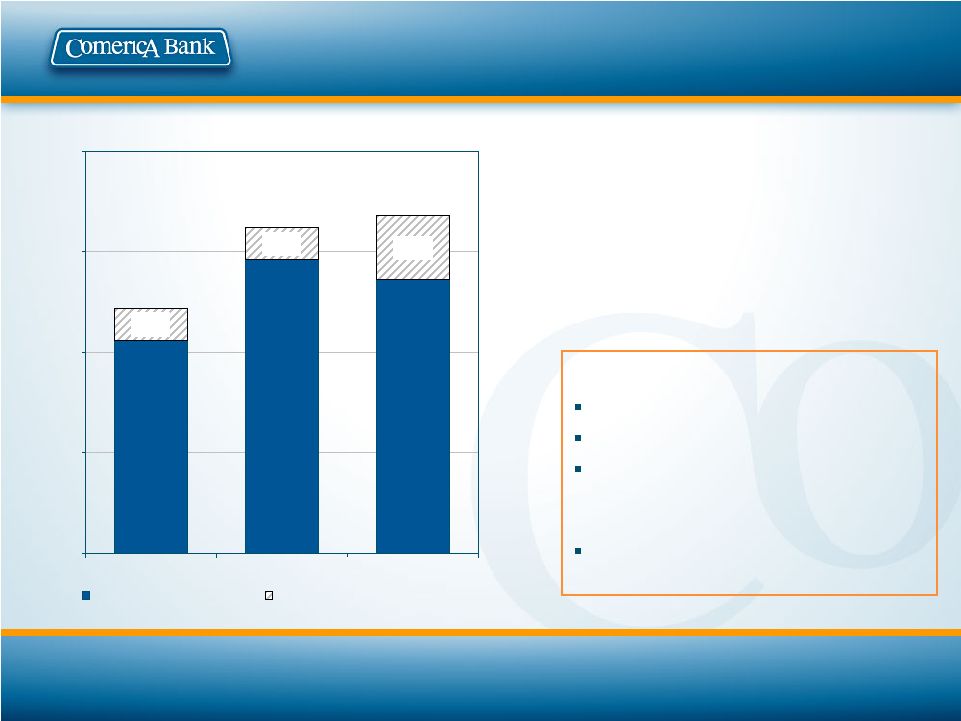 9 2.53% 2.73% 2.68% 0.08% 0.08% 0.16% 2.61% 2.81% 2.84% 2.00% 2.25% 2.50% 2.75% 3.00% 1Q09 2Q09 3Q09 Reported Net Interest Margin Impact of Excess Liquidity Net Interest Margin Net interest margin of 2.68% which reflected: + Loan spread improvement + Higher-cost time deposits matured + Noninterest-bearing deposit growth - Higher excess liquidity Excess liquidity position: Average $3.5B 3Q09 ($1.8B 2Q09) $2.2 billion at 9/30/09 Resulted from strong deposit growth and the sale of investment securities Negative impact on 3Q09 margin was approximately 16 basis points Excess liquidity represented by deposits held at the Federal Reserve Bank.
|
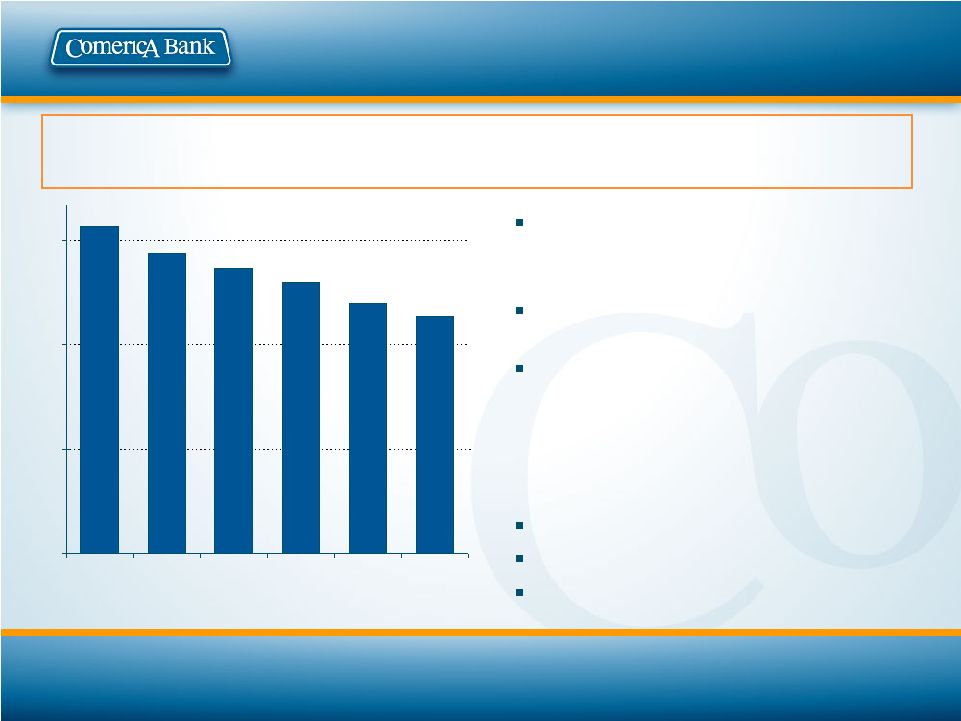
 10 A Leaner, More Efficient Company 6,000 8,000 10,000 12,000 2001 2002 2003 2004 2005 2006 2007 2008 3Q09 200 250 300 350 400 450 Full-time Equivalent Employees Banking Centers Headcount Reduced by about 1,000 Positions or 9% of the Workforce (9/30/09 vs. 9/30/08) Period-end figures |
 11 Third Quarter 2009 Credit Quality Credit quality stable, as was expected • Net credit charge-offs decreased to $239 million ($248 million in 2Q09) • Inflows greater than $2 million to nonaccrual loans slowed to $361 million, down $58 million from 2Q09 • Non-commercial real estate nonperforming assets declined $10 million from 2Q09 59% average carrying value to contractual value of nonaccrual loans (41% write-down) Continued to build reserves with provision for credit losses exceeding net charge-offs by $74 million Allowance for credit losses to total loans increased to 2.19% Net charge-off and nonperforming asset metrics continue to be better than peer averages Expect net charge-offs to improve modestly in 4Q09 1 This outlook is provided as of the date of the filing of the 10-Q, October 30,
2009 1 |
 12 Commercial Real Estate $694MM 58% Middle Market $235MM 20% Small Business Banking $104MM 9% Global Corp Banking $51MM 4% Other Business Lines $110MM 9% Nonaccrual Loans September 30, 2009: $1,194 million By Line of Business Period-end balances in $ millions (MM) 1 Reflects office of origination Nonaccrual loans : • Western 42% • Midwest 31% • Florida 12% • Texas 5% • Other 10% Granularity of commercial nonaccrual loans: 4 143 Over $25MM 757 $1,194 Total 23 341 $10–$25MM 40 285 $5–$10MM 690 $425 Under $5MM 1 Outstanding # of Relationships |
 13 Average carrying value of 59% (41% write-down) reflects current appraisals Reserves taken in excess of charge offs to reflect weak environment Included in nonperforming assets: • Only $2MM in Reduced Rate loans • $10MM in Troubled Debt Restructurings (TDRs) • Minimal Foreclosed Property of $109MM Accruing TDRs total $8MM No Held-For-Sale loans Sold $41MM in nonperforming loans Nonaccrual Loans Carrying Value of Nonaccrual Loans as % of Contractual Value Proactively review nonaccrual loans every quarter Charge-offs and reserves taken to reflect current market conditions 72% 68% 66% 64% 61% 59% 25% 40% 55% 70% 2Q08 3Q08 4Q08 1Q09 2Q09 3Q09 |
 14 -5% 0% 5% 10% 15% 20% 25% MI STI CMA MTB USB KEY HBAN FITB ZION RF PNC BBT 0% 2% 4% 6% 8% MTB CMA USB PNC BBT KEY ZION RF FITB STI HBAN MI Nonperforming Asset Comparison 3Q09 NPAs as % of Total Loans and Foreclosed Property Third Quarter 2009 vs Second Quarter 2009 Nonperforming Asset Growth Total Comerica: 2.99% Peer Group Average: 5.16% At September 30, 2009 Peer Source: Company Reports NPAs defined as nonperforming loans + foreclosed property + restructured loans Comerica: 6.1% Peer Group Average: 12.1% |
 15 Net Loan Charge-offs
by Market and Line of Business 3Q09: $239 million $ in millions 1 Specialty Businesses includes: Entertainment, Energy, Leasing, Technology and Life
Sciences, Mortgage Banker Finance and Financial Services Division Small Business Banking $25MM WIM $10MM CRE Line of Business $91MM Personal Banking $8MM Middle Market $64MM Global Corp Banking $23MM Specialty Businesses 1 $18MM Midwest $102MM Texas $22MM Florida $9MM Western $95MM Other/Int'l $11MM |
 16 Net Charge-Offs to Average Total Loans 0.51% 0.73% 0.61% 0.52% 0.66% 0.76% 1.35% 1.53% 0.50% 0.38% 0.38% 0.35% 1.25% 1.18% 2.86% 1.88% 2.60% 2.93% 2.14% 0.85% 0.90% 2.08% 1.27% 1.04% 0.00% 0.50% 1.00% 1.50% 2.00% 2.50% 3.00% 2Q08 3Q08 4Q08 1Q09 2Q09 3Q09 CMA CRE* CMA Non-CRE* Peer Group Average Net Charge-Off History Represents annualized quarterly figures Source: Company Reports *CRE: Commercial Real Estate Peer Group: BBT, FITB, HBAN, KEY, MI, MTB, PNC, RF, STI, USB, ZIONS
|
 17 Commercial Real Estate Loan Portfolio 3Q09: $14.4 billion 3Q09 averages in $billions 1 Included in Commercial Real Estate line of business Commercial Real Estate line of business: Nonaccrual loans of $694MM Loans over $2mm transferred to nonaccrual totaled $211MM Net loan charge-offs of $91MM Commercial Mortgages 1 $1.7B 12% Real Estate Construction 1 $3.4B 24% Primarily Owner- Occupied Commercial Mortgages $9.3B 64% |
 18 Multi-use $0.5B 9% Office $0.5B 10% Comml/Other $0.3B 6% Multi-family $1.2B 24% Retail $1.0B 21% Single Family $0.7B 13% Land Development $0.3B 7% Land Carry $0.5B 10% Other Markets $0.6B 13% Florida $0.6B 12% Western $1.9B 38% Michigan $0.7B 13% Texas $1.2B 24% Commercial Real Estate Line of Business September 30, 2009 Loan Outstandings: $5.0 billion By Project Type By Location of Property Period-end balances in $billions; additional Commercial Real Estate information can
be found in the appendix 1 Excludes $0.9B in Commercial Real Estate line of business loans not secured by real estate 1 |
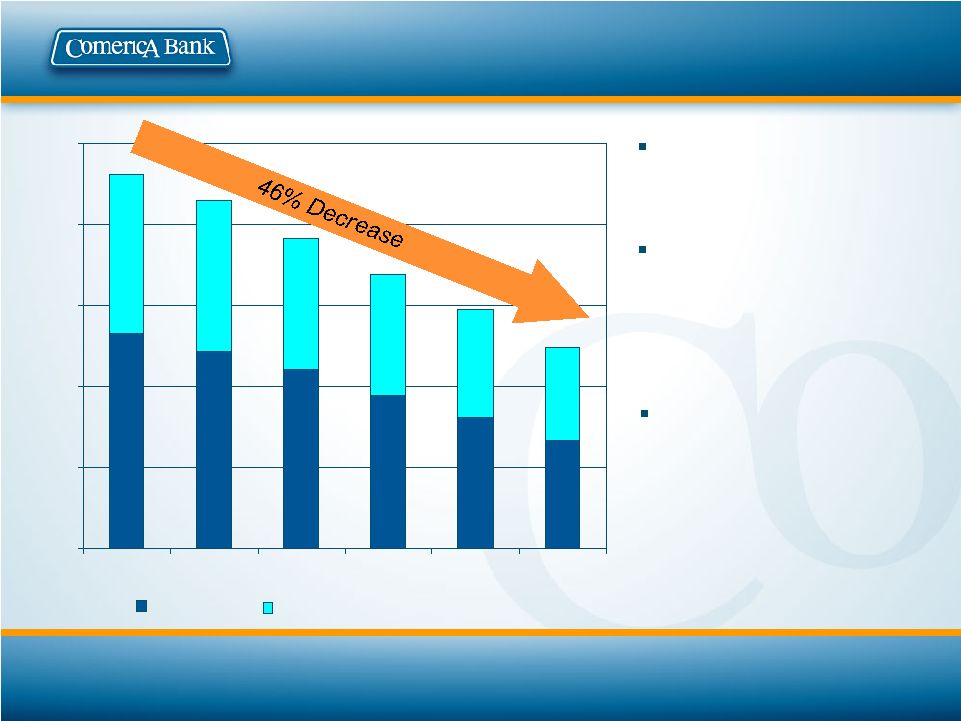 19 Residential Real Estate Development Period-end balances in $millions Reduced Residential Real Estate Development exposure by $1.1B since 6/08 Geographic breakdown: • Western 47% • Florida 16% • Texas 15% • Michigan 13% • Other 9% Reduced Western Market Local Residential Real Estate Developer Portfolio to $287MM at 9/30/09 from $932MM at 12/31/07 $0 $500 $1,000 $1,500 $2,000 $2,500 30-Jun-08 30-Sep-08 31-Dec-08 30-Mar-09 30-Jun-09 30-Sep-09 Residential - Land Carry/Development Single Family |
 20 $57 $59 $74 $108 $91 $0 $20 $40 $60 $80 $100 $120 3Q08 4Q08 1Q09 2Q09 3Q09 Residential Other Commercial Not Secured by RE $57 $59 $74 $108 $91 $0 $20 $40 $60 $80 $100 $120 3Q08 4Q08 1Q09 2Q09 3Q09 Western Midwest Florida Texas Other Not Secured by RE Commercial Real Estate Line of Business Net Charge Offs By Location of Property By Project Type $millions RE: Real Estate Residential: Single Family, Residential Land Carry and Land Development Other Commercial: Multi-Family, Retail, Office, Warehouse, Multi-use and
Commercial |
 21 $4 $6 $8 $10 $12 $14 Avg Noninterest-bearing FSD DDA Growing Core Deposits Total avg. core deposits of $34.2B, a $1.1B or 3% increase Avg. core noninterest-bearing deposits grew $835MM or 8% Total avg. deposits increased in: • All major geographic markets • All commercial lines of business Financial Services Division (FSD) average noninterest-bearing deposits declined $1.3B since 3Q07 Average Noninterest-Bearing Deposits $ in billions; 3Q09 vs 2Q09 1 Core deposits exclude Institutional CDs, Retail Brokered CDs, foreign office time
deposits and Financial Services Division balances 1 1 |
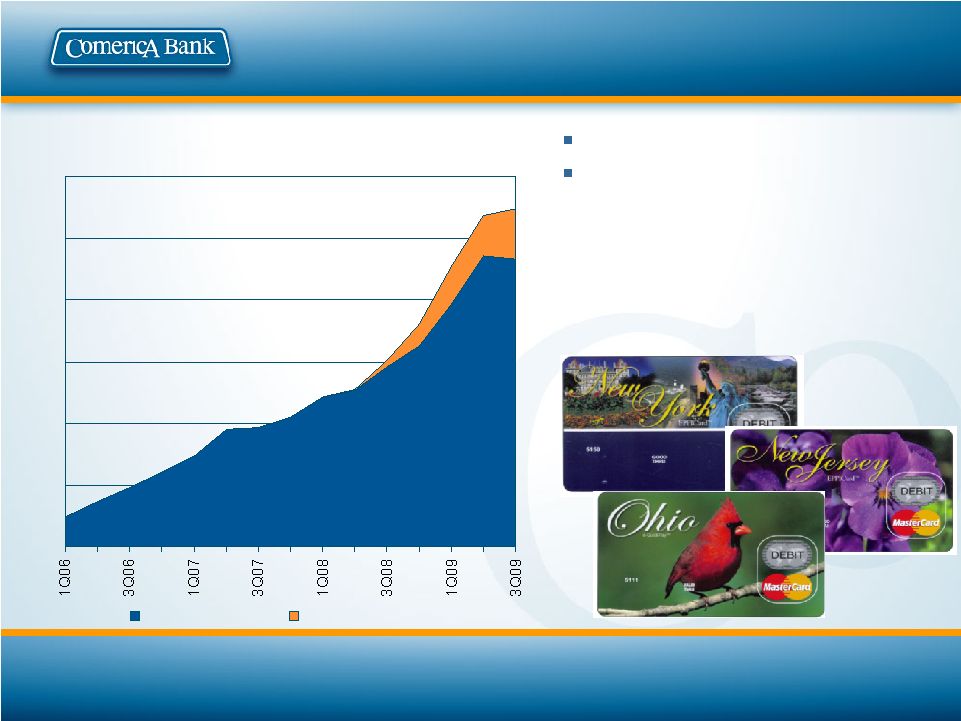 22 Quarterly Average Noninterest-Bearing Deposits ($millions) $0 $100 $200 $300 $400 $500 $600 State Card Programs US Treasury Program Government Card Programs #2 prepaid card issuer in US Currently service: • 26 state government benefit plus US Treasury Direct Programs • Over 3.7 million cards issued under these programs 1 Source: 2008 Nilson Report, a leading payment systems publication 1 |
 23 Strong Capital Peer Source: Company Reports – 3Q Averages and results exclude PNC as this ratio was not published *Non-GAAP Financial Measure: See Supplemental Financial Data for reconcilements of
Comerica’s non-GAAP financial measures **Peer group consists of the
following: BBT, FITB, HBAN, KEY, MTB, MI, PNC, RF, STI, USB, and ZION 2009
Third Quarter Tangible Common Equity Ratio* 6.34% 7.47% 7.60% 7.21% 7.27% 7.55% 7.96% 5.38% 5.37% 4.74% 4.92% 5.85% 0% 2% 4% 6% 8% 2Q08 3Q08 4Q08 1Q09 2Q09 3Q09 Peer Group Average Comerica 0% 2% 4% 6% 8% Peer Group Average: 6.34% |
 24 Comerica: Poised for the Future Consistent strategy • Based on relationship banking model • Traditional Commercial Banking provides a natural entry point to cross-sell: • Wealth Management services to business owners • Retail products to their employees Net interest margin expected to benefit from continued loan spread expansion and asset sensitive balance sheet Controlled expenses should contribute to positive operating leverage Focused on credit management Solid capital position Investing to accelerate growth and balance • Banking center expansion in high growth markets • New and enhanced products and services Main Street Bank |
 25 Appendix |
 26 Deliver Long-Term Shareholder Value Exporting our expertise to higher growth markets Continuing investments to achieve balance amongst our businesses Building and enhancing customer relationships Systematically managing
risk Holding ourselves
accountable |
 27 Financial Results $ in millions, except per share data 1 Excluding the impact of excess liquidity, net interest margin would have been 2.84% and
2.81% in the 3Q09 and 2Q09, respectively. Excess liquidity had no
impact on the net interest margin in 3Q08. Excess liquidity represented by Federal Reserve Bank deposits. 2 Estimated 3 See Supplemental Financial Data slide for reconciliation of non-GAAP financial
measures 7.60% 7.32% $514 $240 $165 3.11% $466 $0.19 $28 $- $28 3Q08 11.58% 12.18% Tier 1 capital ratio ($16) ($15) Net income (loss) applicable to common stock $34 $34 Preferred stock dividends to U.S. Treasury $429 $399 Noninterest expenses 7.55% 7.96% Tangible common equity ratio $298 $315 Noninterest income $312 $311 Provision for loan losses 2.73% 2.68% Net interest margin $402 $385 Net interest income ($0.10) ($0.10) Diluted earnings (loss) per common share $18 $19 Net income 2Q09 3Q09 1 3 2 |
 28 Third Quarter 2009 Results Analysis of 3Q09 compared to 2Q09 1 Core deposits exclude Institutional CDs, Retail Brokered CDs, foreign office time
deposits and Financial Services Division balances 2 See Supplemental Financial Data slide for reconciliation of non-GAAP financial
measures Average earning assets decreased $2 billion • Average loans declined $2.9 billion • $857 million increase in average other earning assets, primarily short-term investments Average core deposits increased $1.1 billion • Average noninterest-bearing deposits grew $835 million Net interest margin of 2.68% • Excluding impact of excess liquidity, net interest margin would have been 2.84%
• Loan spreads increased and higher-cost time deposits matured Credit quality stable, consistent with outlook • Net credit-related charge-offs were $239 million, compared to $248 million in
2Q09 • Provision for loan losses was $311 million, compared to $312 million in 2Q09
• Allowance for loan losses to total loans increased to 2.19% from 1.89% Noninterest income increased $17 million • Several fee income categories increased • Gains on sales of securities of $107 million ($113 million in 2Q09) Expenses well controlled • Year-to-date noninterest expenses decreased 9% from the same period last year • 9% reduction in workforce from a year ago Strong capital ratios further enhanced • Tangible common equity ratio of 7.96% 1 1 2 |
 29 Expense Management $514 $429 $399 Total Non-Interest
Expenses
(6) 8 4 Deferred compensation plan costs 10 7 7 Share-based compensation $5 $45 $15 FDIC Deposit Insurance 5 14 14 Pension Expense $410 3 6 31 2 $155 3Q08 10 10 Other real estate (1) - Severance $142 $143 Regular Salaries Other Expenses $374 $374 Total Non-Interest
Expenses,
excluding FDIC and ORE 4 4 Travel & Entertainment 15 17 Incentives (including commissions) 2Q09 3Q09 Operations Related Expenses $ in millions 1 Excludes $96 million charge related to an offer to repurchase auction-rate
securities from customers. 1 |
 30 Loans By Geographic Market 4.2 4.2 3.7 Other Markets 1.9 1.8 1.7 Florida 2.3 2.0 1.9 International $51.5 $47.6 $44.8 TOTAL 7.7 7.5 7.2 Texas 16.4 14.7 13.9 Western $19.0 $17.4 $16.4 Midwest 3Q08 2Q09 3Q09 Average loans in $billions; Geography based on office of origination; Midwest: MI, OH,
IL; Western: CA, AZ, NV, CO, WA; Other Markets include markets not
separately identified above in addition to businesses with a national perspective |
 31 Loans by Line of Business $51.5 $47.6 $44.8 TOTAL $4.6 $4.8 $4.8 SUBTOTAL – WEALTH & INSTITUTIONAL MANAGEMENT 4.6 4.8 4.8 Private Banking $6.4 $6.1 $5.9 SUBTOTAL – RETAIL BANK 2.1 2.1 2.0 Personal Banking 4.3 4.0 3.9 Small Business Banking $40.5 $36.7 $34.1 SUBTOTAL – BUSINESS BANK 6.4 5.8 5.3 Specialty Businesses 4.6 3.6 3.1 National Dealer Services 6.4 6.4 5.8 Global Corporate Banking 6.6 6.3 6.0 Commercial Real Estate $16.5 $14.6 $13.9 Middle Market 3Q08 2Q09 3Q09 Average loans in $billions; 1 Specialty Businesses includes: FSD, Entertainment, Energy, Leasing, Mortgage Banker
Finance, and TLS 1 |
 32 Third Quarter 2009 Average Loans Detail $3.7 $-- -- $0.1 0.1 -- $3.6 0.8 0.3 0.7 0.7 $1.1 Other Markets $1.7 $0.7 0.7 $-- -- -- $1.0 -- 0.2 0.1 0.5 $0.2 Florida $44.8 $1.9 $7.2 $13.9 $16.4 TOTAL $4.8 $-- $0.5 $1.7 $1.9 SUBTOTAL – WEALTH & INSTITUTIONAL MANAGEMENT 4.8 -- 0.5 1.7 1.9 Private Banking $5.9 $-- $1.2 $1.0 $3.6 SUBTOTAL – RETAIL BANK 2.0 -- 0.2 0.1 1.6 Personal Banking 3.9 -- 1.0 0.9 2.0 Small Business Banking $34.1 $1.9 $5.5 $11.2 $10.9 SUBTOTAL – BUSINESS BANK 5.3 -- 1.8 1.6 1.1 Specialty Businesses 3.1 -- 0.1 2.0 0.5 National Dealer Services 5.8 1.9 0.3 1.0 1.8 Global Corporate Banking 6.0 -- 1.5 2.2 1.1 Commercial Real Estate $13.9 $-- $1.8 $4.4 $6.4 Middle Market TOTAL International Texas Western Midwest $ in billions; geography based on office of origination. 1 Specialty Businesses includes: FSD, Entertainment, Energy, Leasing and TLS 1 |
 33 Credit Quality $140MM 1.35% $148MM 1.53% Excluding CRE line of business $313MM $988MM $239MM 2.14% 3Q09 $248MM 2.08% Net credit-related charge-offs to average total loans $308MM $913MM Provision for Credit Losses Allowance for Credit Losses 2Q09 1 Includes net loan charge-offs and net charge-offs on lending-related
commitments CRE: Commercial Real Estate Net charge-offs were consistent with 2Q09, as expected Residential real estate development continued to drive charge-offs Continued to build reserves with provision for credit losses exceeding net credit-related charge-offs by $74MM 1 |
 34 Credit Quality 78% 80% Allowance for loan losses to nonperforming loans 2.19% $161MM $1,305MM 2.99% $531MM 1.40% 3Q09 $210MM Loans past due 90 days or more and still accruing $1,230MM 2.64% $541MM 1.34% Nonperforming assets to total loans and foreclosed property Excluding CRE Line of Business 1.89% Allowance for loan losses
to total
loans 2Q09 Non-CRE nonperforming assets declined by $10MM Allowance for loan losses to nonperforming loans increased
|
 35 Key Credit Differentiators Did not loosen credit standards at peak of cycle Conservative exposure thresholds Long tenured relationships 86% of portfolio is secured Personal guarantees are customary for bulk of portfolio Proactive problem resolution and restructuring Quarterly Credit Quality Reviews Portfolio migration closely monitored Established Special Handling Group as a precursor to Special Asset Group Tightened lending standards: • Energy • Technology and Life Sciences • Home equity Curtailed exposure to certain industry segments: • Automotive supplier • Commercial and Residential Construction • SBA Franchise lending Comerica followed its credit policies… …making enhancements to adapt to the changing economy 1 At December 31, 2008 1 |
 36 Smaller local developers 81 projects Reduced to $287MM at 9/30/09 from $932MM at 12/31/07 93% watch list Nonaccrual loans of $175MM National RRE Developers $0.3B Western Local RRE $0.3B Other CRE Businesses $1.3B Western Market CRE September 30, 2009: $1.9 billion September 30, 2009 balances in $billions RRE: Residential Real Estate; Based on location of booking office; includes CA, AZ and
NV 1 Watch list: generally consistent with regulatory defined special mention, substandard
and doubtful loans Western Market Local Residential Real Estate Developer Portfolio: Commercial Real Estate Line of Business 1 |
 37 Real Estate Construction Loans Other CRE: 333 23 15 111 42 142 Land Development 966 85 144 149 89 499 Total Residential 92 26 5 35 25 1 Commercial 792 40 51 365 132 204 Retail 765 163 137 253 6 206 Multi-family 354 19 42 75 34 184 Multi-use 287 33 14 102 19 119 Office 46 26 - 7 - 13 Other $3,328 $395 $393 $1,002 $311 $1,227 TOTAL Residential: 3 $62 Other Markets 26 - 16 6 1 Land Development $633 $129 $38 $47 $357 Single Family TOTAL Florida Texas Michigan Western September 30, 2009 period-end $ in millions Commercial Real Estate Line of Business by Location of Property
|
 38 Commercial Mortgage Loans 275 12 13 6 69 175 Land Carry Other CRE: 273 30 52 41 67 83 Total Residential $36 $3 $8 $8 $3 $14 Single Family Residential: 106 88 - 12 5 1 Multi-use 107 14 - 6 28 59 Commercial 272 62 11 2 57 140 Retail 198 5 18 24 43 108 Office 409 25 102 94 65 123 Multi-family 38 21 - - 11 6 Other $257 27 Other Markets $1,678 $196 $185 $345 $695 TOTAL 237 44 33 64 69 Land Carry TOTAL Florida Texas Michigan Western September 30, 2009 period-end $ in millions Commercial Real Estate Line of Business by Location of Property
|
 39 Automotive Manufacturer Portfolio 3Q09 2Q09 1Q09 4Q08 3Q08 $22.0 $26.7 $4.4 $5.4 ($0.1) Net Charge- offs/(Recoveries) $1.2 $1.5 $1.8 $2.2 $2.7 Total Other Automotive $1.0 $1.2 $1.4 $1.7 $2.0 Domestic Ownership 0.2 0.3 0.4 0.5 0.7 Foreign Ownership 8.5 12/05 16.5 12/06 12.0 12/07 32.6 12/08 32.8 Nonaccrual Loans 08/09 Outstandings 1 Period-end in $billions 2 $millions 3 Period-end in $millions Portfolio includes OEM (Original Equipment Manufacturer), Tier One and Tier Two
suppliers with greater than 50% revenue associated with auto
manufacturing Third Quarter Commentary: Auto exposure continues to decline No direct exposure to GM or Chrysler Primary suppliers = Revenues 50% derived from: • GM: $199MM outstanding as of 8/31/09, down from $228MM at 2/28/09 • Chrysler: $36MM outstanding as of 8/31/09, down from $82MM at 2/28/09 down 57% 1 2 3 |
 40 Diversified National Dealer Services Geographic Dispersion Western 65% Midwest 15% Florida 8% Texas 4% Other 8% 3Q09 Average Loans Outstanding: $3.1 billion Franchise Distribution 1 Franchise distribution based on September 30, 2009 period-end outstandings
2 “Other” includes obligations where a primary franchise is indeterminable (rental car and leasing
companies, heavy truck, recreational vehicles, and non-floor plan
loans) Facts Top tier strategy Majority are Mega franchises (five or more dealers in group) Exposure to dealers that are being closed is relatively small Virtually -0- losses or nonaccruals for many years Average loan outstandings down $1.5 billion or 33% from 3Q08 Detroit 3 nameplates down from 41% at 12/05 to 23% at 09/09 1 Toyota/ Lexus 20% Ford 11% GM 8% Chrysler 4% Mercedes 6% Nissan/ Infinity 4% Other 2 16% Other European 8% Other Asian 6% Honda/ Acura 17% |
 41 Consumer Loan Portfolio 9.5% of total outstandings No sub-prime mortgage programs Self-originated & relationship oriented Net loan charge-offs of $17MM 3Q09: $4.3 billion 3Q09 averages in $billions 1 Residential mortgages we hold on our balance sheet are primarily associated with our
Private Banking customers. The residential mortgages we originate
through our banking centers are typically sold to a third party. 2 The “other” category includes automobile, personal watercraft, student and recreational vehicle
loans. Residential Mortgages 1 $1.7B 40% Consumer Loans-Home Equity $1.8B 42% Consumer loans- Other 2 $0.8B 18% |
 42 Other Markets 1% Florida 2% Western 24% Texas 9% Midwest 64% Home Equity Portfolio 83% home equity lines and 17% home equity loans Avg. FICO score of 752 at origination 86% have CLTV 80% Average loan vintage is 4.3 years Geographic Breakdown 3Q09 averages in $billions Geography based on office of origination 1 Data on loans booked through our Consumer Loan Center which encompasses about 87% of our
Home Equity Lines and Loans 3Q09: $1.8 billion 1 1 1 1 |
 43 Shared National Credit Relationships Outstandings declined $2B from 12/31/08 Approx. 1,000 borrowers Industry diversification mirrors total loan book Majority of relationships include ancillary business Comerica is agent for approximately 15% Adhere to same credit underwriting standards as rest of loan book Credit challenges focused primarily on residential real estate development Global Corp Banking $3.6B 36% Nat'l Dealer Services $0.3B 3% Energy $1.2B 12% Other $0.6B 7% Middle Market $2.3B 23% Commercial Real Estate $1.9B 19% September 30, 2009: $9.9 billion Shared National Credit (SNC): Facilities greater than $20 million shared by three or
more federally supervised financial institutions which are reviewed by
regulatory authorities at the agent bank level. Period-end outstandings
as of September 30, 2009 |
 44 Core Deposits By Geographic Market 1.3 1.6 1.7 Other Markets 0.3 0.3 0.3 Florida 0.5 0.7 0.8 International $31.4 $33.0 $34.2 TOTAL 3.8 4.4 4.5 Texas 9.4 9.0 9.7 Western $16.1 $17.0 $17.2 Midwest 3Q08 2Q09 3Q09 Average deposits in $billions; Geography based on office of origination Western includes: CA, AZ, NV, CO, WA Excludes FSD, Foreign Office Time Deposits and Finance/Other with Inst. & Retail
Brokered CDs: 3Q09-$5.8B; 2Q09-$7.8B; 3Q08-$8.5B |
 45 Line of Business Deposits $39.9 $37.5 6.0 $2.4 2.4 $16.6 12.7 3.9 $14.9 $12.5 5.9 3.5 0.1 3.9 0.7 $4.3 3Q08 5.7 4.0 Finance/Other $40.8 $38.9 $40.0 $38.4 TOTAL > EXCLUDING FSD $2.6 $2.7 SUBTOTAL – WEALTH & INSTITUTIONAL MANAGEMENT 2.6 2.7 Private Banking $17.7 $17.6 SUBTOTAL – RETAIL BANK 13.9 13.7 Personal Banking 3.8 3.9 Small Business Banking $14.8 $12.9 $15.7 $14.1 SUBTOTAL – BUSINESS BANK >Excluding FSD 5.1 3.2 5.0 3.4 Specialty Businesses > Excluding FSD 0.1 0.2 National Dealer Services 4.9 5.4 Global Corporate Banking 0.6 0.6 Commercial Real Estate $4.1 $4.5 Middle Market 2Q09 3Q09 Average deposits in $billions 1 Specialty Businesses includes: Entertainment, Energy, FSD, Leasing and TLS 2 Finance/Other includes Inst. and Retail Brokered CD’s: 3Q09 - $3.6B; 2Q09 - $5.1B; 3Q08 - $5.2B 1 2 |
 46 Third Quarter 2009 Average Deposits Detail $1.7 -- $0.1 0.1 $-- -- -- $1.6 0.8 -- 0.6 0.1 $0.1 Other Markets $0.9 -- $-- -- $-- -- -- $0.9 -- -- 0.9 -- $-- International 4.0 -- -- -- 4.0 Finance/Other $40.0 $0.3 $4.6 $11.1 $21.4 TOTAL $2.7 $0.2 $0.2 $1.6 $0.6 SUBTOTAL – WEALTH & INSTITUTIONAL MANAGEMENT 2.7 0.2 0.2 1.6 0.6 Private Banking $17.6 $-- $2.8 $2.1 $12.7 SUBTOTAL – RETAIL BANK 13.7 -- 1.8 1.1 10.8 Personal Banking 3.9 -- 1.0 1.0 1.9 Small Business Banking $15.7 $0.1 $1.6 $7.4 $4.1 SUBTOTAL – BUSINESS BANK 5.0 0.1 0.4 3.7 0.0 Specialty Businesses 0.2 0.0 0.0 0.1 0.1 National Dealer Services 5.4 0.0 0.7 0.4 2.8 Global Corporate Banking 0.6 0.0 0.1 0.2 0.2 Commercial Real Estate $4.5 $0.0 $0.4 $3.0 $1.0 Middle Market TOTAL Florida Texas Western Midwest $ in billions 1 Specialty Businesses includes: Entertainment, Energy, FSD, Leasing and TLS 2 Finance/Other includes $3.6B in Inst. and Retail Brokered CD’s; included in Finance
Division segment 1 2 |
 47 Financial Services Division Data 1.65% 0.70% 0.47% FSD Interest-bearing Deposits 1.74% 1.71% 1.94% FSD Loans (Primarily Low-rate) Average Rates $2 $1 $1 Customer Services Noninterest Expenses $0.4 $0.2 $0.2 Total Loans $2.4 $1.9 $1.6 Total Deposits 0.9 0.5 0.4 Interest-bearing $1.5 $1.4 $1.2 Noninterest-bearing Average Balance Sheet 3Q08 2Q09 3Q09 Balance Sheet data in $billions; Noninterest Expense data in $millions
|
 48 Investment Securities Portfolio Guideline: portfolio size (excluding Auction Rate Securities) of approx. 10% of average assets Consists primarily of AAA mortgage- backed Freddie Mac and Fannie Mae government agency securities • Realized gains of • $102MM on sale of $2.8 billion in 3Q09 • $109MM on sale of $2.3 billion in 2Q09 • Net unrealized pre-tax gain $96MM as of 9/30/09 • Average life of 3.6 years • As repositioned portfolio, temporarily increased holdings of Treasury securities Repurchased customers’ Auction Rate Securities in 4Q08 • Cumulative redemptions of $334MM (3Q09 $90MM) • Cumulative gains on redemptions of $17MM (3Q09 $5MM) $ in millions $3,500 $4,500 $5,500 $6,500 $7,500 $8,500 $9,500 $10,500 Average Auction Rate Securities Average Investment Securities Available-for-Sale |
 49 MI 233 TX 88 CA 98 FL 10 AZ 15 MI 261 TX 50 CA 42 FL 6 AZ 1 December 2003 360 Banking Centers September 2009 444 Banking Centers Banking Center Network |
 50 10 0 0 4 4 2 Planned 2009 30 2 0 12 3 13 2007 28 0 1 9 4 14 2008 12/31/09 Planned Network 2006 2005 Location of
New Banking Centers 446 232 10 90 16 98 18 1 0 7 2 8 2 Arizona 25 Total 1 Michigan 3 Florida 7 Texas 12 California Banking Center Network Slowed banking center expansion in light of current environment New Banking Centers contributed $2.5 billion in new deposits as of September 2009 |
 51 2009 Outlook Loans: Focus on developing new and expanding existing relationships • Loan demand expected to lag economic recovery Net interest margin: • Expect 4Q09 to increase • Continued improvement in loan spreads • Higher-cost certificates of deposit and wholesale funding maturing • Excess liquidity expected to diminish in 4Q09 Net credit-related charge-offs: • Modest improvement expected in 4Q09 • Provision expected to continue to exceed net charge-offs Noninterest income: • No significant gains on sales of mortgage-backed government agency securities expected in 4Q09 • Investment securities portfolio expected to average about 10% of average assets Noninterest expenses: Mid to high-single digit decrease (FY09 vs. FY08) This outlook is provided as of the date of the filing of the 10-Q, October 30,
2009 |
 52 Supplemental Financial Data The Corporation believes these measurements are meaningful measures of capital adequacy
and used by investors, regulators, and others to evaluate the adequacy of
common equity and to compare against other companies in the industry. 1
Tier 1 capital and risk-weighted assets as defined by regulation 2 September 30, 2009 Regulatory Capital, Tier 1 Capital, and Risk-Weighted assets are
estimated $8,520 $10,774 $10,773 $10,724 $10,640 Total Regulatory Capital 7.21% $67,386 $67,548 150 12 $4,861 $7,152 2,129 150 12 5,181 73,207 7.08% $7,805 2,129 495 12/31/08 7.96% $59,431 $59,590 150 9 $4,732 $7,035 2,145 150 9 5,095 63,518 8.02% $7,735 2,145 495 9/30/09 7.55% $63,470 $63,630 150 10 $4,793 $7,093 2,140 150 10 5,139 67,124 7.66% $7,774 2,140 495 6/30/09 7.27% $67,209 $67,370 150 11 $4,888 $7,183 2,134 150 11 5,131 70,135 7.32% $7,760 2,134 495 3/31/09 $5,100 - 150 12 Total shareholders’ equity Less: Fixed rate cumulative perpetual preferred stock Less: Goodwill Less: Other intangible assets 9/30/08 Reconciliation of non-GAAP financial measures with financial measures defined by GAAP ($ in millions) 7.60% Tangible common equity ratio $65,153 150 12 Total assets Less: Goodwill Less: Other intangible assets $4,938 Tangible common equity $5,576 - 495 Tier 1 capital Less: Fixed rate cumulative perpetual preferred stock Less: Trust preferred securities $64,991 Tangible assets 5,081 76,156 6.67% Tier 1 common capital Risk-weighted assets Tier 1 common capital ratio 2 1,2 2 2 1,2 |
 53 BBB A- BBB A- A- A- BBB+ A- A+ A A+ AA- Fitch A (low) BBB Baa3 Regions Financial BBB BB+ Baa2 Huntington BBB (low) BBB- B2 Zions Bancorporation BBB (high) BBB- A3 Marshall & Ilsley Baa1 Baa1 Baa1 A3 A3 A2 A1 Aa3 Moody’s A (high) A PNC A (low) A- M&T Bank A A- Comerica AA (low) A BB&T A BBB Fifth Third A BBB+ SunTrust A (low) BBB+ KeyCorp AA DBRS S&P Senior Unsecured/Long-Term Issuer Rating A+ US Bancorp Holding Company Debt Ratings As of 11/4/09 Source: SNL Financial |
 54 Contact Us Darlene Persons Director of Investor Relations dppersons@comerica.com 214-462-6831 Walter Galloway Assistant Vice President wtgalloway@comerica.com 214-462-6834 |
 |