Attached files
Table of Contents
UNITED STATES
SECURITIES AND EXCHANGE COMMISSION
Washington, D.C. 20549
FORM 10-Q
| x | QUARTERLY REPORT PURSUANT TO SECTION 13 OR 15(d) OF THE SECURITIES EXCHANGE ACT OF 1934 |
For the quarterly period ended September 30, 2009
OR
| ¨ | TRANSITION REPORT PURSUANT TO SECTION 13 OR 15(d) OF THE SECURITIES EXCHANGE ACT OF 1934 |
For the transition period from to
Commission File Number 1-34243
tw telecom inc.
(Exact name of Registrant as specified in its charter)
| Delaware | 84-1500624 | |
| (State or other jurisdiction of incorporation or organization) |
(I.R.S. Employer Identification Number) | |
| 10475 Park Meadows Drive Littleton, Colorado |
80124 | |
| (Address of principal executive offices) | (Zip Code) | |
Registrant’s telephone number, including area code: (303) 566-1000
Indicate by check mark whether the Registrant: (1) has filed all reports required to be filed by Section 13 or 15(d) of the Securities Exchange Act of 1934 during the preceding 12 months (or for such shorter period that the registrant was required to file such reports), and (2) has been subject to such filing requirements for the past 90 days. Yes x No ¨
Indicate by check mark whether the Registrant has submitted electronically and posted on its corporate Web site, if any, every Interactive Data File required to be submitted and posted pursuant to Rule 405 of Regulation S-T (Section 232.405 of this chapter) during the preceding 12 months (or for such shorter period that the Registrant was required to submit and post such files). Yes ¨ No ¨
Indicate by check mark whether the Registrant is a large accelerated filer, an accelerated filer, a non-accelerated filer, or a smaller reporting company. See the definitions of “large accelerated filer,” “accelerated filer” and “smaller reporting company” in Rule 12b-2 of the Exchange Act.
| Large accelerated filer x |
Accelerated filer ¨ | |||||
| Non-accelerated filer ¨ |
(Do not check if a smaller reporting company) | Smaller reporting company ¨ | ||||
Indicate by check mark whether the Registrant is a shell company (as defined in Rule 12b-2 of the Exchange Act). Yes ¨ No x
The number of shares outstanding of tw telecom inc.’s common stock as of October 31, 2009 was 149,442,569 shares.
Table of Contents
| Page | ||||||
| Item 1. | Financial Statements: | |||||
| Condensed Consolidated Balance Sheets at September 30, 2009 (unaudited) and December 31, 2008 |
3 | |||||
| 4 | ||||||
| 5 | ||||||
| 6 | ||||||
| 7 | ||||||
| Item 2. | Management’s Discussion and Analysis of Financial Condition and Results of Operations |
27 | ||||
| Item 3. | 44 | |||||
| Item 4. | 44 | |||||
| Item 1. | 45 | |||||
| Item 2. | Unregistered Shares of Equity Securities and Use of Proceeds |
45 | ||||
| Item 5. | 45 | |||||
| Item 6. | 47 | |||||
2
Table of Contents
| Item 1. | Financial Statements |
tw telecom inc.
CONDENSED CONSOLIDATED BALANCE SHEETS
| September 30, 2009 |
December 31, 2008 |
|||||||
| (unaudited) | ||||||||
| (amounts in thousands, except share amounts) |
||||||||
| ASSETS | ||||||||
| Current assets: |
||||||||
| Cash and cash equivalents |
$ | 432,331 | $ | 352,176 | ||||
| Receivables, less allowances of $11,011 and $11,271, respectively |
75,313 | 82,391 | ||||||
| Prepaid expenses and other current assets |
12,325 | 10,375 | ||||||
| Deferred income taxes |
10,475 | 10,475 | ||||||
| Total current assets |
530,444 | 455,417 | ||||||
| Long-term investments |
2,990 | 2,990 | ||||||
| Property, plant and equipment |
3,443,554 | 3,266,868 | ||||||
| Less accumulated depreciation |
(2,149,487 | ) | (1,959,958 | ) | ||||
| 1,294,067 | 1,306,910 | |||||||
| Deferred income taxes |
48,275 | 48,275 | ||||||
| Goodwill |
412,694 | 412,694 | ||||||
| Intangible assets, net of accumulated amortization |
34,433 | 41,071 | ||||||
| Other assets, net of accumulated amortization |
11,645 | 14,533 | ||||||
| Total assets |
$ | 2,334,548 | $ | 2,281,890 | ||||
| LIABILITIES AND STOCKHOLDERS’ EQUITY | ||||||||
| Current liabilities: |
||||||||
| Accounts payable |
$ | 45,999 | $ | 46,399 | ||||
| Deferred revenue |
33,110 | 30,419 | ||||||
| Accrued taxes, franchise and other fees |
67,160 | 64,270 | ||||||
| Accrued interest |
9,462 | 17,386 | ||||||
| Accrued payroll and benefits |
43,612 | 38,245 | ||||||
| Accrued carrier costs |
30,502 | 34,818 | ||||||
| Current portion of debt and capital lease obligations (note 2) |
8,264 | 7,221 | ||||||
| Other current liabilities |
39,590 | 34,992 | ||||||
| Total current liabilities |
277,699 | 273,750 | ||||||
| Long-term debt and capital lease obligations (note 2) |
1,297,841 | 1,284,178 | ||||||
| Long-term deferred revenue |
16,506 | 17,734 | ||||||
| Other long-term liabilities |
30,197 | 33,035 | ||||||
| Stockholders’ equity (note 1): |
||||||||
| Preferred stock, $0.01 par value, 20,000,000 shares authorized, no shares issued and outstanding |
— | — | ||||||
| Common stock, $0.01 par value, 439,800,000 shares authorized, 149,335,211 and 147,774,297 shares issued and outstanding, respectively |
1,493 | 1,478 | ||||||
| Additional paid-in capital |
1,785,182 | 1,764,432 | ||||||
| Accumulated other comprehensive loss |
(5,290 | ) | (7,147 | ) | ||||
| Accumulated deficit |
(1,069,080 | ) | (1,085,570 | ) | ||||
| Total stockholders’ equity |
712,305 | 673,193 | ||||||
| Total liabilities and stockholders’ equity |
$ | 2,334,548 | $ | 2,281,890 | ||||
See accompanying notes.
3
Table of Contents
CONDENSED CONSOLIDATED STATEMENTS OF OPERATIONS
(Unaudited)
| Three Months Ended September 30, |
Nine Months Ended September 30, |
|||||||||||||||
| 2009 | 2008 | 2009 | 2008 | |||||||||||||
| (amounts in thousands, except per share amounts) | ||||||||||||||||
| Revenue: |
||||||||||||||||
| Data and Internet services |
$ | 119,977 | $ | 102,282 | $ | 347,848 | $ | 292,390 | ||||||||
| Network services |
93,233 | 96,152 | 280,396 | 291,762 | ||||||||||||
| Voice services |
83,799 | 83,927 | 250,414 | 251,707 | ||||||||||||
| Intercarrier compensation |
7,757 | 9,258 | 24,798 | 28,514 | ||||||||||||
| Total revenue |
304,766 | 291,619 | 903,456 | 864,373 | ||||||||||||
| Costs and expenses (a): |
||||||||||||||||
| Operating (exclusive of depreciation, amortization, and accretion shown separately below) |
127,155 | 123,051 | 374,105 | 365,146 | ||||||||||||
| Selling, general and administrative |
74,611 | 71,408 | 225,935 | 221,371 | ||||||||||||
| Depreciation, amortization, and accretion |
74,280 | 71,537 | 221,877 | 212,315 | ||||||||||||
| Total costs and expenses |
276,046 | 265,996 | 821,917 | 798,832 | ||||||||||||
| Operating income |
28,720 | 25,623 | 81,539 | 65,541 | ||||||||||||
| Interest expense |
(20,732 | ) | (22,758 | ) | (63,217 | ) | (70,031 | ) | ||||||||
| Interest income |
116 | 1,518 | 327 | 5,742 | ||||||||||||
| Other loss |
— | (3,672 | ) | — | (7,767 | ) | ||||||||||
| Income (loss) before income taxes |
8,104 | 711 | 18,649 | (6,515 | ) | |||||||||||
| Income tax expense |
406 | 897 | 2,159 | 1,650 | ||||||||||||
| Net income (loss) |
$ | 7,698 | $ | (186 | ) | $ | 16,490 | $ | (8,165 | ) | ||||||
| Net income (loss) per common share, basic and diluted |
$ | 0.05 | $ | — | $ | 0.11 | $ | (0.06 | ) | |||||||
| Weighted average shares outstanding, basic |
148,082 | 147,443 | 147,969 | 147,131 | ||||||||||||
| Weighted average shares outstanding, diluted |
149,952 | 147,443 | 149,401 | 147,131 | ||||||||||||
| (a) Includes non-cash stock-based employee compensation expense (note 1): |
||||||||||||||||
| Operating |
$ | 961 | $ | 824 | $ | 2,464 | $ | 2,552 | ||||||||
| Selling, general and administrative |
$ | 5,465 | $ | 4,646 | $ | 16,911 | $ | 14,359 | ||||||||
See accompanying notes.
4
Table of Contents
CONDENSED CONSOLIDATED STATEMENTS OF CASH FLOWS
(Unaudited)
| Nine Months Ended September 30, |
||||||||
| 2009 | 2008 | |||||||
| (amounts in thousands) | ||||||||
| Cash flows from operating activities: |
||||||||
| Net income (loss) |
$ | 16,490 | $ | (8,165 | ) | |||
| Adjustments to reconcile net income (loss) to net cash provided by operating activities: |
||||||||
| Depreciation, amortization, and accretion |
221,877 | 212,315 | ||||||
| Stock based compensation |
19,375 | 16,911 | ||||||
| Discount on debt, investment impairment, amortization of deferred debt issue costs and other |
15,044 | 22,311 | ||||||
| Changes in operating assets and liabilities: |
||||||||
| Receivables, prepaid expenses and other assets |
5,785 | 2,762 | ||||||
| Accounts payable, deferred revenue, and other liabilities |
(368 | ) | (36,090 | ) | ||||
| Net cash provided by operating activities |
278,203 | 210,044 | ||||||
| Cash flows from investing activities: |
||||||||
| Capital expenditures |
(194,650 | ) | (201,651 | ) | ||||
| Proceeds from maturities of investments |
— | 3,699 | ||||||
| Other investing activities, net |
914 | (781 | ) | |||||
| Net cash used in investing activities |
(193,736 | ) | (198,733 | ) | ||||
| Cash flows from financing activities: |
||||||||
| Net proceeds from issuance of common stock upon exercise of stock options and vesting of restricted stock awards and units |
1,390 | 6,243 | ||||||
| Payment of debt and capital lease obligations |
(5,702 | ) | (5,398 | ) | ||||
| Net cash (used in) provided by financing activities |
(4,312 | ) | 845 | |||||
| Increase in cash and cash equivalents |
80,155 | 12,156 | ||||||
| Cash and cash equivalents at beginning of period |
352,176 | 321,531 | ||||||
| Cash and cash equivalents at end of period |
$ | 432,331 | $ | 333,687 | ||||
| Supplemental disclosures of cash flow information: |
||||||||
| Cash paid for interest |
$ | 58,667 | $ | 65,380 | ||||
| Cash paid for income taxes |
$ | 2,826 | $ | 1,061 | ||||
| Addition of capital lease obligation |
$ | 7,893 | $ | 2,338 | ||||
See accompanying notes.
5
Table of Contents
CONDENSED CONSOLIDATED STATEMENT OF CHANGES IN STOCKHOLDERS’ EQUITY
Nine Months Ended September 30, 2009
(Unaudited)
| Common Stock | Additional paid-in capital |
Accumulated other comprehensive income (loss) |
Accumulated deficit |
Total stockholders’ equity | |||||||||||||||
| Shares | Amount | ||||||||||||||||||
| (amounts in thousands) | |||||||||||||||||||
| Balance at December 31, 2008 |
147,774 | $ | 1,478 | $ | 1,764,432 | $ | (7,147 | ) | $ | (1,085,570 | ) | $ | 673,193 | ||||||
| Net income |
— | — | — | — | 16,490 | 16,490 | |||||||||||||
| Unrealized gain on cash flow hedging activities, net of tax |
— | — | — | 1,857 | — | 1,857 | |||||||||||||
| Total comprehensive income |
— | — | — | — | — | 18,347 | |||||||||||||
| Shares issued for cash in connection with the exercise of stock options, net of shares withheld to satisfy employee tax obligations upon vesting of awards |
301 | 3 | 1,387 | — | — | 1,390 | |||||||||||||
| Stock-based compensation |
1,260 | 12 | 19,363 | — | — | 19,375 | |||||||||||||
| Balance at September 30, 2009 |
149,335 | $ | 1,493 | $ | 1,785,182 | $ | (5,290 | ) | $ | (1,069,080 | ) | $ | 712,305 | ||||||
See accompanying notes.
6
Table of Contents
NOTES TO CONDENSED CONSOLIDATED FINANCIAL STATEMENTS
1. Organization and Summary of Significant Accounting Policies
Description of Business and Capital Structure
On March 12, 2008, Time Warner Telecom Inc., a Delaware corporation, changed its corporate name to tw telecom inc. (the “Company”) through an amendment to the Company’s Restated Certificate of Incorporation. The Company’s stockholders approved the name change by written consent on September 26, 2006. On July 1, 2008, the Company began using tw telecom inc. as its name and tw telecom as its brand.
The Company is a leading national provider of managed network services, specializing in Ethernet and data networking, Internet access, local and long distance voice, virtual private network (“VPN”), voice over Internet protocol (“VoIP”) and network security services to enterprise organizations and communications services companies throughout the United States and, for IP-VPN services, to their global locations.
The Company has one class of common stock outstanding with one vote per share. The Company also is authorized to issue shares of preferred stock. The Company’s Board of Directors has the authority to establish voting powers, preferences, and special rights for the preferred stock. No shares of preferred stock have been issued. The Company adopted a rights plan on January 20, 2009 that is intended to protect the availability of the Company’s net operating loss carryforwards which can be subject to limitations under federal tax regulations (see Note 6).
Basis of Presentation
The accompanying unaudited interim condensed consolidated financial statements have been prepared pursuant to the rules and regulations of the Securities and Exchange Commission (the “SEC”) for quarterly reports on Form 10-Q and do not include all of the information and note disclosures required by U.S. generally accepted accounting principles (“U.S. GAAP”) for complete financial statements. These condensed consolidated financial statements should therefore be read in conjunction with the consolidated financial statements and notes thereto for the fiscal year ended December 31, 2008, included in our Annual Report on Form 10-K for the year ended December 31, 2008 filed with the SEC. The accompanying unaudited interim condensed consolidated financial statements have been prepared in accordance with U.S. generally accepted accounting principles and include all adjustments of a normal, recurring nature that are, in the opinion of management, necessary to present fairly the financial position and results of operations for the interim periods presented. The results of operations for an interim period are not necessarily indicative of the results of operations for a full fiscal year. The Company has evaluated all subsequent events through November 6, 2009, the date the financial statements were issued.
The preparation of financial statements in conformity with U.S. GAAP requires management to make estimates and assumptions that affect the reported amounts of assets and liabilities at the date of the financial statements and the reported amounts of revenue and expenses during the reporting period. Actual results may differ from those estimates.
Reclassifications
Certain prior period amounts have been reclassified for comparability with the 2009 presentation.
7
Table of Contents
tw telecom inc.
NOTES TO CONDENSED CONSOLIDATED FINANCIAL STATEMENTS—(Continued)
Recently Adopted Accounting Pronouncements
Effective July 2009, the Financial Accounting Standards Board (“FASB”) Accounting Standards Codification (“ASC”) became the single source of authoritative nongovernmental U.S. GAAP, other than guidance issued by the Securities and Exchange Commission. The ASC is not intended to change or alter existing GAAP. The adoption of the ASC did not have an impact on the Company’s condensed consolidated financial statements but changes references to specific accounting standards in the footnotes to its condensed consolidated financial statements.
Effective January 1, 2009, the Company adopted the cash conversion guidance within ASC 470-20, Debt with Conversion and Other Options- Cash Conversion, (formerly FASB Staff Position (“FSP”) APB 14-1, Accounting for Convertible Debt Instruments That May Be Settled in Cash (Including Partial Cash Settlement) upon Conversion (“ASC 470-20”), which requires the Company’s convertible debentures (see Note 2 for a description) to be separated into debt and equity components at issuance and a value to be assigned to each. The value assigned to the debt component is the estimated fair value, as of the issuance date, of a similar instrument without the conversion feature. The difference between the convertible debt instrument cash proceeds and this estimated fair value is recorded as a debt discount and is amortized to interest expense using the interest rate method over the expected term of the convertible debt instrument. ASC 470-20 changes the accounting treatment for the Company’s convertible debentures and requires retrospective application to all periods presented in the financial statements. Although ASC 470-20 does not impact the Company’s actual past or future cash flows, the impact to non-cash interest expense and results of operations was $4.3 million, or $0.03 per share, and $4.0 million, or $0.03 per share, for the three months ended September 30, 2009 and 2008, respectively, and $12.7 million, or $0.09 per share, and $11.7 million, or $0.08 per share, for the nine months ended September 30, 2009 and 2008, respectively (see Note 2). The Company expects the impact to its non-cash interest expense and results of operations to be approximately $17 million and $19 million for the full years ended December 31, 2009 and 2010, respectively.
Effective January 1, 2009, the Company adopted the disclosure requirements within ASC 815, Derivatives and Hedging (formerly FASB Statement of Financial Accounting Standards (“SFAS”) No. 161 Disclosures about Derivative Instruments and Hedging Activities—An Amendment to FASB Statement No. 133) (“ASC 815”), which changed the disclosure requirements for derivative instruments and hedging activities. Companies are required to provide enhanced disclosures about how and why they use derivative instruments, how derivative instruments and related hedged items are accounted for, and how derivative instruments and related hedged items affect their financial position, financial performance, and cash flows. The adoption of the disclosure requirements within ASC 815 did not have an impact on the Company’s consolidated financial position and results of operations (see Note 3).
In April 2009, the FASB issued expanded guidance and disclosure requirements within ASC 820, Fair Value Measurements and Disclosures (formerly FSP FAS 157-4, Determining Fair Value When the Volume and Level of Activity for the Asset or Liability Have Significantly Decreased and Identifying Transactions That Are Not Orderly) (“ASC 820”). ASC 820 provides additional guidance on estimating fair value for an asset or liability when the volume and level of activity have significantly decreased in relation to normal market activity for the asset or liability. ASC 820 also provides additional guidance on circumstances that may indicate that a transaction is not orderly and requires additional disclosure about fair value measurement in annual and interim reporting periods. The expanded guidance and disclosure requirements within ASC 820 was effective for the Company beginning with its reporting period ended June 30, 2009 and did not have an impact on its consolidated financial statements.
In April 2009, the FASB issued expanded disclosure requirements within ASC 825, Financial Instruments (formerly FSP FAS 107-1 and APB 28-1, Interim Disclosures About Fair Value of Financial Instruments) (“ASC 825”), which extends annual disclosure requirements to interim financial statements of publicly traded
8
Table of Contents
tw telecom inc.
NOTES TO CONDENSED CONSOLIDATED FINANCIAL STATEMENTS—(Continued)
companies. The expanded disclosure requirements within ASC 825 were effective for the Company beginning with its reporting period ended June 30, 2009 and did not have an impact on its consolidated financial statements. The Company has provided the additional disclosures required in Note 4.
In April 2009, the FASB issued expanded guidance and disclosure requirements within ASC 320, Investments- Debt and Equity Securities (formerly FSP FAS 115-2, Recognition and Presentation of Other-Than-Temporary Impairments) (“ASC 320”). ASC 320 provides further guidance on the measurement, recognition and presentation of other than temporary impairments of assets and requires additional disclosures. The expanded guidance and disclosure requirements within ASC 320 were effective for the Company beginning with its reporting period ended June 30, 2009 and did not have an impact on its consolidated financial statements. The Company has provided the additional disclosures required below in “Cash Equivalents and Investments”.
In May 2009, the FASB issued ASC 855, Subsequent Events (formerly SFAS No. 165, Subsequent Events) (“ASC 855”). ASC 855 establishes general standards of accounting for and disclosure of events that occur after the balance sheet date but before the financial statements are issued or are available to be issued. It requires the disclosure of the date through which an entity has evaluated subsequent events and the basis for that date (see “Basis of Presentation” above). ASC 855 was effective for the Company beginning with its reporting period ended June 30, 2009, and must be applied prospectively. The adoption of this statement did not have an effect on the Company’s condensed consolidated financial statements except for additional disclosures provided above in “Basis of Presentation”.
Cash Equivalents and Investments
At September 30, 2009 and December 31, 2008, investments of $431.7 million and $351.7 million, respectively, included in cash and cash equivalents were comprised of U.S. treasury money market funds and the carrying values approximate fair value. At September 30, 2009 and December 31, 2008, long term investments of $3.0 million were comprised of the fair value of commercial paper investments purchased in 2007 with exposure to sub-prime mortgages that were past their maturity date (see Note 4).
Revenue
The Company’s revenue is derived primarily from business communications services. Data and Internet services include services that enable customers to connect their internal computer networks and to access external networks, including Internet access at high speeds using Ethernet protocol, metropolitan and wide area Ethernet, and virtual private network solutions. Network services are point-to-point services that transmit voice, data and images as well as enable transmission for storage, using state-of-the-art fiber optics. Voice services include traditional and next generation voice capabilities, including voice services from stand alone and bundled products, long distance, toll free services, and VoIP. Intercarrier compensation is comprised of switched access services and reciprocal compensation. Switched access represents the compensation from another carrier for the delivery of traffic from a long distance carrier’s point of presence to an end-user’s premises provided through the Company’s switching facilities. The Federal Communications Commission (“FCC”) and state public utility commissions regulate switched access rates in their respective jurisdictions. Reciprocal compensation represents compensation from other local exchange carriers (“LECs”) for local exchange traffic originated on their facilities and terminated on the Company’s facilities. Reciprocal compensation rates are established by interconnection agreements between the parties based on federal and state regulatory and judicial rulings.
The Company’s customers are principally enterprise organizations from a wide variety of business segments including, among others, the distribution, health care, finance, service and manufacturing industries, state, local
9
Table of Contents
tw telecom inc.
NOTES TO CONDENSED CONSOLIDATED FINANCIAL STATEMENTS—(Continued)
and federal government entities as well as long distance carriers, incumbent local exchange carriers (“ILECs”), competitive local exchange carriers (“CLECs”), wireless communications companies and Internet service providers (“ISPs”).
Revenue for data and Internet, network and the majority of revenue for voice services is generally billed in advance on a monthly fixed rate basis and recognized over the period the services are provided. Revenue for the majority of intercarrier compensation and certain components of voice services, such as long distance, is generally billed on a transactional basis in arrears based on a customer’s actual usage, with some fixed rate elements. The other transactional elements of voice services are billed in arrears and estimates are used to recognize revenue in the period earned.
The Company evaluates whether receivables are reasonably assured of collection based on certain factors, including the likelihood of billing being disputed by customers. If there is a billing dispute with a customer, revenue generally is not recognized until the dispute is resolved.
The Company classifies certain taxes and fees billed to customers and remitted to government authorities on a gross versus net basis in revenue and expense. The total amount classified as revenue associated with such taxes and fees was approximately $10.8 million and $9.4 million for the three months ended September 30, 2009 and 2008, respectively, and approximately $29.3 million and $27.2 million for the nine months ended September 30, 2009 and 2008, respectively.
Significant Customers
The Company has substantial business relationships with a few large customers, including major long distance and wireless carriers. The Company’s top ten customers accounted for an aggregate of 21% and 23% of the Company’s total revenue for the nine months ended September 30, 2009 and 2008, respectively. No customer accounted for 10% or more of total revenue for the three or nine months ended September 30, 2009 or 2008.
Earnings (Loss) Per Common Share and Potential Common Share
Companies with complex capital structures are required to present basic and diluted earnings or loss per share (“EPS”). Basic EPS is measured as the income or loss available to common stockholders divided by the weighted average outstanding common shares for the period. Diluted EPS is similar to basic EPS but presents the dilutive effect on a per share basis of potential common shares (e.g., convertible securities, stock options, etc.) as if they had been converted to shares at the beginning of the periods presented. Potential common shares that have an anti-dilutive effect (e.g., those that increase income per share or decrease loss per share) are excluded from diluted EPS.
10
Table of Contents
tw telecom inc.
NOTES TO CONDENSED CONSOLIDATED FINANCIAL STATEMENTS—(Continued)
Options to purchase shares of the Company’s common stock, restricted stock awards and restricted stock units to be settled in common stock upon vesting and shares of common stock subject to issuance upon conversion of the Company’s convertible debentures, which were excluded from the computation of diluted weighted average shares outstanding because their inclusion would be anti-dilutive, totaled 30.0 million shares and 30.7 million shares for the three months ended September 30, 2009 and 2008, respectively, and 31.9 million and 29.8 million shares for the nine months ended September 30, 2009 and 2008, respectively. The following table provides the calculation of basic and diluted EPS:
| Three months ended September 30, |
Nine months ended September 30, |
|||||||||||||
| 2009 | 2008 | 2009 | 2008 | |||||||||||
| (amounts in thousands, except per share amounts) | ||||||||||||||
| Net income (loss) as reported |
$ | 7,698 | $ | (186 | ) | $ | 16,490 | $ | (8,165 | ) | ||||
| Basic weighted average shares outstanding |
148,082 | 147,443 | 147,969 | 147,131 | ||||||||||
| Dilutive effect of stock options outstanding |
908 | — | 745 | — | ||||||||||
| Dilutive effect of unvested restricted stock |
962 | — | 687 | — | ||||||||||
| Diluted weighted average shares |
149,952 | 147,443 | 149,401 | 147,131 | ||||||||||
| Earnings (loss) per share—basic and diluted |
$ | 0.05 | $ | — | $ | 0.11 | $ | (0.06 | ) | |||||
Stock-Based Compensation
The Company recognizes the cost of share-based payments as expense over the requisite service period, which is generally the vesting period of the award. The fair value of options was estimated at the date of grant using a Black-Scholes option pricing model. For purposes of the actual expense recognized in the nine months ended September 30, 2009 and 2008, the estimated fair value of the options is amortized to expense on a straight-line basis (net of estimated forfeitures) over the options’ vesting period. The weighted-average fair value of options granted was $3.55 and $7.21 for the nine months ended September 30, 2009 and 2008, respectively, with the following weighted-average assumptions:
| Nine months ended September 30, | ||||
| 2009 | 2008 | |||
| Expected volatility |
56% | 50% | ||
| Risk-free interest rate |
1.7% | 2.5% | ||
| Dividend yield |
0% | 0% | ||
| Expected term |
4 years | 4 years | ||
Expected volatilities are based on historical volatility of the Company’s common stock over a period generally commensurate with the expected term of the option. The risk-free interest rate for stock options granted during the period is determined by using the U.S. Treasury rate for the nearest period that coincides with the expected term. The expected term of stock options represents the weighted-average period the stock options are expected to remain outstanding and is based on historical data.
As of September 30, 2009, there was $23.6 million of total unrecognized compensation expense related to unvested stock options, which is expected to be recognized over a weighted-average period of 2.3 years, and $23.1 million of total unrecognized compensation expense related to unvested restricted stock and restricted stock units, which is expected to be recognized over a weighted-average period of 1.4 years.
11
Table of Contents
tw telecom inc.
NOTES TO CONDENSED CONSOLIDATED FINANCIAL STATEMENTS—(Continued)
2. Long-Term Debt and Capital Lease Obligations
The components of long-term debt and capital lease obligations were as follows:
| September 30, 2009 |
December 31, 2008 |
|||||||
| (amounts in thousands) | ||||||||
| Term Loan B, due 2013 |
$ | 583,500 | $ | 588,000 | ||||
| 9 1/4% Senior Notes, due 2014 |
400,000 | 400,000 | ||||||
| 2.375% Convertible Senior Debentures, due 2026 |
373,750 | 373,750 | ||||||
| Capital lease obligations |
17,706 | 10,782 | ||||||
| Total obligations |
1,374,956 | 1,372,532 | ||||||
| Unamortized premium |
243 | 285 | ||||||
| Unamortized discount |
(69,094 | ) | (81,418 | ) | ||||
| Current portion |
(8,264 | ) | (7,221 | ) | ||||
| Total long-term debt and capital lease obligations |
$ | 1,297,841 | $ | 1,284,178 | ||||
As of September 30, 2009, the Company and its wholly-owned subsidiary, tw telecom holdings inc. (“Holdings”), were in compliance with all of their debt covenants.
Amendment to Undrawn Credit Facility
Holdings has a $680 million senior secured credit facility (the “Credit Facility”) consisting of a $600 million Term Loan B (“Term Loan”) maturing in January 2013, of which $583.5 million was outstanding as of September 30, 2009, and an $80 million undrawn revolving credit facility (the “Revolver”) expiring in October 2011. On January 14, 2009, Holdings amended the Revolver to terminate $20 million of the original $100 million undrawn Revolver because one of the lenders, a Lehman Brothers affiliate, would be unable to meet its commitment to advance funds as a result of bankruptcy proceedings. As a result, the total revolving commitments of the banks under the undrawn Revolver are $80 million.
Convertible Debentures
As of September 30, 2009, the Company had outstanding $373.8 million principal amount of 2 3/8% Convertible Senior Debentures due April 1, 2026 (the “Convertible Debentures”). The Convertible Debentures are general, unsecured obligations of the Company. Interest is payable semi-annually on April 1 and October 1, commencing October 1, 2006. The Convertible Debentures are redeemable in whole or in part at the Company’s option at any time on or after April 6, 2013 at a redemption price equal to 100% of the principal amount of the debentures to be redeemed, plus accrued and unpaid interest. Holders of the Convertible Debentures have the option to require the Company to purchase all or part of the debentures for cash on April 1, 2013, April 1, 2016 or April 1, 2021 at 100% of the principal and unpaid interest, or at any time prior to April 1, 2026, to convert the debentures into shares of the Company’s common stock at a conversion rate of 53.6466 per $1,000 principal amount of debentures representing a conversion price of $18.64 per share. Upon conversion or redemption, the Company will have the right to deliver, in lieu of shares of common stock, cash or a combination of cash and shares of common stock.
As a result of its January 1, 2009 adoption of the cash conversion guidance of ASC 470-20 (see Note 1), the Company separated the Convertible Debentures into debt and equity components at issuance and has assigned a value to each. The value assigned to the debt component was $253.3 million and represents the estimated fair
12
Table of Contents
tw telecom inc.
NOTES TO CONDENSED CONSOLIDATED FINANCIAL STATEMENTS—(Continued)
value, as of the issuance date (March 29, 2006), of a similar instrument without the conversion feature. The difference between the convertible debt instrument cash proceeds and this estimated fair value was recorded as a debt discount and is amortized to interest expense using the interest rate method over the expected seven year term of the debt. The value assigned to the equity component of $120.5 million, net of an allocable portion of deferred debt issuance costs, is included as a component of additional paid in capital. ASC 470-20 requires retrospective application to all periods presented in the financial statements. Although ASC 470-20 does not impact the Company’s actual past or future cash flows, the impact to non-cash interest expense and results of operations was $4.3 million, or $0.03 per share, and $4.0 million, or $0.03 per share, for the three months ended September 30, 2009 and 2008, respectively, and $12.7 million, or $0.09 per share, and $11.7 million, or $0.08 per share, for the nine months ended September 30, 2009 and 2008, respectively. The following table presents the December 31, 2008 balance sheet line items affected as adjusted after retrospective application of ASC 470-20 and as originally reported:
| December 31, 2008 | ||||||||
| As Adjusted | As Reported | |||||||
| (amounts in thousands) | ||||||||
| Other assets, net of accumulated amortization |
$ | 14,533 | $ | 19,648 | ||||
| Long-term debt and capital lease obligations |
$ | 1,284,178 | $ | 1,365,596 | ||||
| Additional paid-in capital |
$ | 1,764,432 | $ | 1,647,626 | ||||
| Accumulated deficit |
$ | (1,085,570 | ) | $ | (1,045,067 | ) | ||
The unamortized liability component of $69.1 million, as of September 30, 2009, will be amortized to interest expense using the interest rate method through March 31, 2013. The following table reflects the liability component included in the condensed consolidated balance sheets as of September 30, 2009 and December 31, 2008:
| September 30, 2009 |
December 31, 2008 |
|||||||
| (amounts in thousands) | ||||||||
| Principal amount of Convertible Debentures |
$ | 373,750 | $ | 373,750 | ||||
| Unamortized discount |
(69,094 | ) | (81,418 | ) | ||||
| Net carrying amount of Convertible Debentures |
$ | 304,656 | $ | 292,332 | ||||
The Company recognized the following amounts to interest expense related to the Convertible Debentures, excluding deferred debt issuance costs, for the three and nine months September 30, 2009 and 2008:
| Three months ended September 30, |
Nine months ended September 30, |
|||||||||||||||
| 2009 | 2008 | 2009 | 2008 | |||||||||||||
| (amounts in thousands) | ||||||||||||||||
| Interest expense, contractual amount at 2.375% |
$ | 2,219 | $ | 2,219 | $ | 6,657 | $ | 6,657 | ||||||||
| Interest expense, amortization of discount |
4,195 | 3,855 | 12,324 | 11,323 | ||||||||||||
| Total interest expense for Convertible Debentures |
$ | 6,414 | $ | 6,074 | $ | 18,981 | $ | 17,980 | ||||||||
| Effective interest rate on liability component |
8.5 | % | 8.5 | % | 8.5 | % | 8.5 | % | ||||||||
13
Table of Contents
tw telecom inc.
NOTES TO CONDENSED CONSOLIDATED FINANCIAL STATEMENTS—(Continued)
3. Derivative Instruments
The variable rate Term Loan exposes the Company to variability in interest payments due to changes in interest rates. In order to mitigate interest rate fluctuations on the Term Loan, Holdings has entered into derivative instruments, specifically interest rate swap agreements. The interest rate swap agreements effectively convert a portion of Holdings’ floating-rate debt to a fixed-rate basis for the term of the agreement to reduce the impact of interest rate changes on future interest expense. The Company has designated its interest rate swap agreements as cash flow hedges.
If certain correlation and risk reduction criteria are met, the derivative is deemed to be highly effective in offsetting the changes in cash flows of the hedged item on a retrospective and prospective basis, and may be specifically designated as a hedge of exposure to changes in cash flow. For derivative instruments that are designated and qualify as a cash flow hedge, the effective portion of the gain or loss on the derivative instrument is reported as a component of other comprehensive income or loss. Amounts excluded from the assessment of hedge effectiveness, if any, as well as the ineffective portion of the gain or loss, are reported in results of operations immediately. During the three and nine months ended September 30, 2009 and 2008, the Company did not recognize any gain or loss in earnings for hedge ineffectiveness.
The following table reflects the terms of Holdings’ interest rate swap agreements in effect at September 30, 2009:
| Term |
Notional amount |
Fixed rate |
Total rate, including spread |
||||||||
| Beginning |
End |
||||||||||
| April 30, 2008 |
April 30, 2010 | $ | 100 million | 3.23 | % | 4.98 | % | ||||
| November 28, 2008 |
November 28, 2011 | $ | 100 million | 2.96 | % | 4.71 | % | ||||
The following table summarizes the fair value of derivatives reported in the condensed consolidated balance sheets:
| Liability Derivatives | ||||||||
| Derivatives- cash flow hedges |
Balance Sheet Location |
September 30, 2009 |
December 31, 2008 | |||||
| (amounts in thousands) | ||||||||
| Interest rate swap agreements |
Other current liabilities | $ | 1,707 | $ | — | |||
| Interest rate swap agreements |
Other long-term liabilities | 3,583 | 7,147 | |||||
| Total fair value of derivatives designated as cash flow hedges |
$ | 5,290 | $ | 7,147 | ||||
14
Table of Contents
tw telecom inc.
NOTES TO CONDENSED CONSOLIDATED FINANCIAL STATEMENTS—(Continued)
The unrecognized losses for the interest rate swap agreements included in accumulated other comprehensive loss at September 30, 2009 and December 31, 2008 was $5.3 million and $7.1 million, respectively. Based on the fair value of $5.3 million at September 30, 2009, the Company expects to recognize in interest expense $4.1 million of net losses on interest rate swap agreements during the next 12 months upon payment of interest associated with the Term Loan. Actual amounts ultimately recognized in interest expense are dependent on the interest rates in effect when settlements on the interest rate swap agreements occur each month. The variable rate, including the applicable spread, in effect at September 30, 2009 for the Term Loan, excluding the impact of the interest rate swap agreements, was 2%. The effect of the interest rate swaps on the condensed consolidated statements of operations was as follows for the three and nine months ended September 30:
| Three Months Ended September 30, |
Nine Months Ended September 30, |
|||||||||||||||
| 2009 | 2008 | 2009 | 2008 | |||||||||||||
| (amounts in thousands) | ||||||||||||||||
| Gain/(Loss) recognized in other comprehensive income/(loss) (effective portion) |
$ | 1,490 | $ | 43 | $ | 5,963 | $ | 271 | ||||||||
| Gain/(Loss) reclassified from accumulated other comprehensive loss into interest expense (effective portion) |
$ | (1,434 | ) | $ | (193 | ) | $ | (4,106 | ) | $ | (295 | ) | ||||
| Gain/(Loss) recognized in income (ineffective portion and amount excluded from effectiveness testing) |
$ | — | $ | — | $ | — | $ | — | ||||||||
4. Fair Value Measurements
Fair value, as defined by relevant accounting standards, is the price that would be received from selling an asset or paid to transfer a liability in an orderly transaction between market participants at the measurement date. When determining the fair value measurements for assets and liabilities required to be recorded at fair value, the Company considers the principal or most advantageous market in which it would complete a transaction and considers assumptions that market participants would use when pricing the asset or liability, such as inherent risk, transfer restrictions and risk of nonperformance.
Fair Value Hierarchy
Relevant accounting standards set forth a fair value hierarchy that requires an entity to maximize the use of observable inputs and minimize the use of unobservable inputs when measuring fair value. A financial instrument’s categorization within the fair value hierarchy is based upon the lowest level of input that is significant to the fair value measurement. Relevant accounting standards establish three levels of inputs that may be used to measure fair value:
| • | Level 1—Quoted prices in active markets for identical assets or liabilities. Level 1 assets that are measured at fair value on a recurring basis consist of the Company’s investment in money market mutual funds that are traded in an active market with sufficient volume and frequency of transactions and are included as a component of cash and cash equivalents in the condensed consolidated balance sheets. |
| • | Level 2—Observable inputs other than Level 1 prices such as quoted prices for similar assets or liabilities; quoted prices in markets with insufficient volume or infrequent transactions (less active markets); or model-derived valuations in which all significant inputs are observable or can be derived principally from or corroborated by observable market data for substantially the full term of the assets or liabilities. Level 2 liabilities that are measured at fair value on a recurring basis include the |
15
Table of Contents
tw telecom inc.
NOTES TO CONDENSED CONSOLIDATED FINANCIAL STATEMENTS—(Continued)
| Company’s interest rate swap agreements priced using discounted cash flow techniques that use observable market inputs, such as LIBOR-based yield curves, forward rates, and credit ratings and are included as a component of other current liabilities and other long-term liabilities in the condensed consolidated balance sheets. |
| • | Level 3—Unobservable inputs to the valuation methodology that are significant to the measurement of fair value of assets or liabilities. Level 3 assets that are measured at fair value include the Company’s investment in commercial paper purchased in 2007 with exposure to sub-prime mortgages that is past its maturity date included in long-term investments in the condensed consolidated balance sheets. The carrying value of the investments as of September 30, 2009 was estimated based principally on data from financial advisors to fiduciaries for the commercial paper holders. The valuation considered a combination of (i) the present value of future principal and interest payments discounted at rates considered to reflect current market conditions; (ii) individual valuation estimates of the instruments underlying the commercial paper using multiple indicators of value; and (iii) the probabilities of repayment of the underlying instruments under various liquidation scenarios. Actual values and amounts the Company receives from these investments may differ from those estimates. |
The following table reflects assets and liabilities that are measured and carried at fair value on a recurring basis as of September 30, 2009:
| Fair Value Measurement Using | Assets/Liabilities at Fair Value | |||||||||||
| Level 1 | Level 2 | Level 3 | ||||||||||
| (amounts in thousands) | ||||||||||||
| Assets |
||||||||||||
| Money market mutual funds |
$ | 431,721 | $ | — | $ | — | $ | 431,721 | ||||
| Long-term investments |
— | — | 2,990 | 2,990 | ||||||||
| Total assets |
$ | 431,721 | $ | — | $ | 2,990 | $ | 434,711 | ||||
| Liabilities |
||||||||||||
| Interest rate swap agreements |
$ | — | $ | 5,290 | $ | — | $ | 5,290 | ||||
| Total liabilities |
$ | — | $ | 5,290 | $ | — | $ | 5,290 | ||||
While the Company’s long term debt has not been listed on any securities exchange or inter-dealer automated quotation system, the Company has estimated the fair value of its long term debt based on indicative pricing published by investment banks. While the Company believes these approximations to be reasonably accurate at the time published, indicative pricing can vary widely depending on volume traded by any given investment bank and other factors. The following table summarizes the carrying amounts and estimated fair values of the Company’s long term debt, including the current portion.
| September 30, 2009 | December 31, 2008 | |||||||||||
| Carrying Value |
Fair Value |
Carrying Value |
Fair Value | |||||||||
| (amounts in thousands) | ||||||||||||
| Term Loan B |
$ | 583,500 | $ | 561,619 | $ | 588,000 | $ | 454,230 | ||||
| 9 1/4% Senior Notes, including premium |
400,243 | 411,000 | 400,285 | 326,500 | ||||||||
| 2.375% Convertible Senior Debentures, net of discount |
304,656 | 362,070 | 292,332 | 242,788 | ||||||||
| Total debt |
$ | 1,288,399 | $ | 1,334,689 | $ | 1,280,617 | $ | 1,023,518 | ||||
16
Table of Contents
tw telecom inc.
NOTES TO CONDENSED CONSOLIDATED FINANCIAL STATEMENTS—(Continued)
5. Commitments and Contingencies
Management routinely reviews the Company’s exposure to liabilities incurred in the normal course of its business operations. Where a probable contingency exists and the amount can be reasonably estimated, the Company records the estimated liability. Considerable judgment is required in analyzing and recording such liabilities and actual results may vary from the estimates.
The Company’s pending legal proceedings are limited to litigation incidental to its business. In the opinion of management, the ultimate resolution of these matters will not have a material adverse effect on the Company’s financial statements.
6. Rights Plan
On January 20, 2009, the Company adopted a rights plan (the “Rights Plan”) that is intended to protect the Company’s net operating losses (“NOLs”) from the potential negative consequence of an ownership change as defined under Section 382 of the Internal Revenue Code. The Company’s ability to use its net operating loss carryforwards to reduce future federal income tax obligations could be substantially limited or NOLs could expire before being used if there is an ownership change as defined under Section 382. Although the Rights Plan is meant to deter an ownership change that could adversely affect the Company’s use of its NOLs by diluting the acquiring party’s interest, the operation of the Rights Plan does not necessarily prevent an ownership change from occurring.
Under the Rights Plan, commencing January 20, 2009, each share of common stock carries with it one preferred share purchase right (a “Right”) until the distribution date (the date the Rights become exercisable) or earlier expiration of the Rights as defined in the Rights Plan. The Rights will trade with and be inseparable from the common stock until the distribution date. The Rights Plan is designed to deter acquisitions of the Company’s common stock that would result in a stockholder owning 4.9% or more of the Company’s outstanding shares or increase an existing 4.9% or greater stockholder’s percentage ownership of the Company’s stock as of January 20, 2009 by greater than 0.5% of the Company’s outstanding shares by diluting the ownership interest of a stockholder whose ownership after the adoption of the Rights Plan exceeds those thresholds, unless the stockholder obtains an exemption from the Company’s Board of Directors.
The Rights become exercisable after a public announcement that a stockholder’s ownership exceeds the threshold (“Acquiring Party”). If the Rights become exercisable, each Right allows the stockholder, other than the Acquiring Party, to purchase for an exercise price of $30, subject to adjustment, one-one hundredth of a share of Series A Junior Preferred Stock. This portion of a preferred share will give the stockholder approximately the same dividend and liquidation rights as one share of common stock. Instead of the purchase right, the Company may elect to exchange each Right for a share of common stock to be issued to each common stockholder other than the Acquiring Party. The Rights Plan will terminate upon the earliest of (1) the Company’s Board of Directors’ determination that the plan is no longer needed for the preservation of NOLs due to the implementation of legislative changes, or any other reason, (2) January 20, 2012 or (3) certain other events described in the Rights Plan, including the Board of Directors’ determination that termination is in the Company’s best interest. The Company’s stockholders approved the Rights Plan at the Company’s 2009 Annual Meeting of Stockholders.
7. Supplemental Guarantor Information
As of September 30, 2009, Holdings (“Issuer”) had outstanding $400 million principal amount of 9 1/4% Senior Notes due February 2014 (the “2014 Notes”). The 2014 Notes are guaranteed by the Company (“Parent Guarantor”) and the Issuer’s subsidiaries (“Combined Subsidiary Guarantors”). The guarantees are joint and
17
Table of Contents
tw telecom inc.
NOTES TO CONDENSED CONSOLIDATED FINANCIAL STATEMENTS—(Continued)
several. A significant amount of the Issuer’s cash flow is generated by the Combined Subsidiary Guarantors. As a result, funds necessary to meet the Issuer’s debt service obligations are provided in large part by distributions or advances from the Combined Subsidiary Guarantors. The 2014 Notes are governed by an indenture that contains certain restrictive covenants. These restrictions affect, and in many respects significantly limit or prohibit, among other things, the ability of the Company and its subsidiaries to incur indebtedness, make prepayments of certain indebtedness, pay dividends, make investments, engage in transactions with stockholders and affiliates, issue capital stock of subsidiaries, create liens, sell assets, and engage in mergers and consolidations.
18
Table of Contents
tw telecom inc.
NOTES TO CONDENSED CONSOLIDATED FINANCIAL STATEMENTS—(Continued)
The following information sets forth the Company’s Condensed Consolidating Balance Sheets as of September 30, 2009 and December 31, 2008, Condensed Consolidating Statements of Operations for the three and nine months ended September 30, 2009 and 2008, and Condensed Consolidating Statements of Cash Flows for the nine months ended September 30, 2009 and 2008.
tw telecom inc.
CONDENSED CONSOLIDATING BALANCE SHEET
September 30, 2009
| Parent Guarantor |
Issuer | Combined Subsidiary Guarantors |
Eliminations | Consolidated | |||||||||||||||
| (amounts in thousands) | |||||||||||||||||||
| ASSETS | |||||||||||||||||||
| Current assets: |
|||||||||||||||||||
| Cash and cash equivalents |
$ | 24,537 | $ | 407,794 | $ | — | $ | — | $ | 432,331 | |||||||||
| Receivables, net |
— | — | 75,313 | — | 75,313 | ||||||||||||||
| Prepaid expenses and other current assets |
9,228 | 3,097 | — | 12,325 | |||||||||||||||
| Deferred income taxes |
— | 10,475 | — | — | 10,475 | ||||||||||||||
| Total current assets |
24,537 | 427,497 | 78,410 | — | 530,444 | ||||||||||||||
| Long-term investments |
— | 2,990 | — | — | 2,990 | ||||||||||||||
| Property, plant and equipment, net |
— | 36,854 | 1,257,213 | — | 1,294,067 | ||||||||||||||
| Deferred income taxes |
— | 48,275 | — | — | 48,275 | ||||||||||||||
| Goodwill |
— | — | 412,694 | — | 412,694 | ||||||||||||||
| Intangible and other assets, net |
3,843 | 7,622 | 34,613 | — | 46,078 | ||||||||||||||
| Total assets |
$ | 28,380 | $ | 523,238 | $ | 1,782,930 | $ | — | $ | 2,334,548 | |||||||||
| LIABILITIES AND STOCKHOLDERS’ EQUITY (DEFICIT) | |||||||||||||||||||
| Current liabilities: |
|||||||||||||||||||
| Accounts payable |
$ | — | $ | 15,082 | $ | 30,917 | $ | — | $ | 45,999 | |||||||||
| Other current liabilities |
4,438 | 58,366 | 168,896 | — | 231,700 | ||||||||||||||
| Intercompany payable (receivable) |
(1,868,988 | ) | (623,932 | ) | 2,492,920 | — | — | ||||||||||||
| Total current liabilities |
(1,864,550 | ) | (550,484 | ) | 2,692,733 | — | 277,699 | ||||||||||||
| Losses in subsidiary in excess of investment |
875,969 | 1,108,866 | — | (1,984,835 | ) | — | |||||||||||||
| Long-term debt and capital lease obligations |
304,656 | 977,882 | 15,303 | — | 1,297,841 | ||||||||||||||
| Long-term deferred revenue |
— | — | 16,506 | — | 16,506 | ||||||||||||||
| Other long-term liabilities |
— | 8,588 | 21,609 | — | 30,197 | ||||||||||||||
| Stockholders’ equity (deficit) |
712,305 | (1,021,614 | ) | (963,221 | ) | 1,984,835 | 712,305 | ||||||||||||
| Total liabilities and stockholders’ equity (deficit) |
$ | 28,380 | $ | 523,238 | $ | 1,782,930 | $ | — | $ | 2,334,548 | |||||||||
19
Table of Contents
tw telecom inc.
NOTES TO CONDENSED CONSOLIDATED FINANCIAL STATEMENTS—(Continued)
tw telecom inc.
CONDENSED CONSOLIDATING BALANCE SHEET
December 31, 2008
| Parent Guarantor |
Issuer | Combined Subsidiary Guarantors |
Eliminations | Consolidated | |||||||||||||||
| (amounts in thousands) | |||||||||||||||||||
| ASSETS | |||||||||||||||||||
| Current assets: |
|||||||||||||||||||
| Cash and cash equivalents |
$ | 21,033 | $ | 331,143 | $ | — | $ | — | $ | 352,176 | |||||||||
| Receivables, net |
— | — | 82,391 | — | 82,391 | ||||||||||||||
| Prepaid expenses and other current assets |
1,517 | 6,067 | 2,791 | — | 10,375 | ||||||||||||||
| Deferred income taxes |
— | 10,475 | — | — | 10,475 | ||||||||||||||
| Total current assets |
22,550 | 347,685 | 85,182 | — | 455,417 | ||||||||||||||
| Long-term investments |
— | 2,990 | — | — | 2,990 | ||||||||||||||
| Property, plant and equipment, net |
— | 37,142 | 1,269,768 | — | 1,306,910 | ||||||||||||||
| Deferred income taxes |
— | 48,275 | — | — | 48,275 | ||||||||||||||
| Goodwill |
— | — | 412,694 | — | 412,694 | ||||||||||||||
| Intangible and other assets, net |
4,667 | 8,206 | 42,731 | — | 55,604 | ||||||||||||||
| Total assets |
$ | 27,217 | $ | 444,298 | $ | 1,810,375 | $ | — | $ | 2,281,890 | |||||||||
| LIABILITIES AND STOCKHOLDERS’ EQUITY (DEFICIT) | |||||||||||||||||||
| Current liabilities: |
|||||||||||||||||||
| Accounts payable |
$ | — | $ | 12,127 | $ | 34,272 | $ | — | $ | 46,399 | |||||||||
| Other current liabilities |
2,219 | 62,189 | 162,943 | — | 227,351 | ||||||||||||||
| Intercompany payable (receivable) |
(1,836,743 | ) | (708,658 | ) | 2,545,401 | — | — | ||||||||||||
| Total current liabilities |
(1,834,524 | ) | (634,342 | ) | 2,742,616 | — | 273,750 | ||||||||||||
| Losses in subsidiary in excess of investment |
896,216 | 1,123,416 | — | (2,019,632 | ) | — | |||||||||||||
| Long-term debt and capital lease obligations |
292,332 | 982,636 | 9,210 | — | 1,284,178 | ||||||||||||||
| Long-term deferred revenue |
— | — | 17,734 | — | 17,734 | ||||||||||||||
| Other long-term liabilities |
— | 12,549 | 20,486 | — | 33,035 | ||||||||||||||
| Stockholders’ equity (deficit) |
673,193 | (1,039,961 | ) | (979,671 | ) | 2,019,632 | 673,193 | ||||||||||||
| Total liabilities and stockholders’ equity (deficit) |
$ | 27,217 | $ | 444,298 | $ | 1,810,375 | $ | — | $ | 2,281,890 | |||||||||
20
Table of Contents
tw telecom inc.
NOTES TO CONDENSED CONSOLIDATED FINANCIAL STATEMENTS—(Continued)
tw telecom inc.
CONDENSED CONSOLIDATING STATEMENT OF OPERATIONS
Three Months Ended September 30, 2009
| Parent Guarantor |
Issuer | Combined Subsidiary Guarantors |
Eliminations | Consolidated | ||||||||||||||||
| (amounts in thousands) | ||||||||||||||||||||
| Total revenue |
$ | — | $ | — | $ | 304,766 | $ | — | $ | 304,766 | ||||||||||
| Costs and expenses: |
||||||||||||||||||||
| Operating, selling, general and administrative |
— | 39,218 | 162,548 | — | 201,766 | |||||||||||||||
| Depreciation, amortization and accretion |
— | 3,964 | 70,316 | — | 74,280 | |||||||||||||||
| Corporate expense allocation |
— | (43,182 | ) | 43,182 | — | — | ||||||||||||||
| Total costs and expenses |
— | — | 276,046 | — | 276,046 | |||||||||||||||
| Operating income |
— | — | 28,720 | — | 28,720 | |||||||||||||||
| Interest expense, net |
(6,689 | ) | (10,325 | ) | (3,602 | ) | — | (20,616 | ) | |||||||||||
| Interest expense allocation |
6,689 | 10,325 | (17,014 | ) | — | — | ||||||||||||||
| Income before income taxes and equity in undistributed earnings of subsidiaries |
— | — | 8,104 | — | 8,104 | |||||||||||||||
| Income tax expense |
— | — | 406 | — | 406 | |||||||||||||||
| Net income before equity in undistributed earnings of subsidiaries |
— | — | 7,698 | — | 7,698 | |||||||||||||||
| Equity in undistributed earnings of subsidiaries |
7,698 | 7,698 | — | (15,396 | ) | — | ||||||||||||||
| Net income |
$ | 7,698 | $ | 7,698 | $ | 7,698 | $ | (15,396 | ) | $ | 7,698 | |||||||||
21
Table of Contents
tw telecom inc.
NOTES TO CONDENSED CONSOLIDATED FINANCIAL STATEMENTS—(Continued)
tw telecom inc.
CONDENSED CONSOLIDATING STATEMENT OF OPERATIONS
Three Months Ended September 30, 2008
| Parent Guarantor |
Issuer | Combined Subsidiary Guarantors |
Eliminations | Consolidated | |||||||||||||||
| (amounts in thousands) | |||||||||||||||||||
| Total revenue |
$ | — | $ | — | $ | 291,619 | $ | — | $ | 291,619 | |||||||||
| Costs and expenses: |
|||||||||||||||||||
| Operating, selling, general and administrative |
— | 35,159 | 159,300 | — | 194,459 | ||||||||||||||
| Depreciation, amortization and accretion |
— | 2,390 | 69,147 | — | 71,537 | ||||||||||||||
| Corporate expense allocation |
— | (37,549 | ) | 37,549 | — | — | |||||||||||||
| Total costs and expenses |
— | — | 265,996 | — | 265,996 | ||||||||||||||
| Operating income |
— | — | 25,623 | — | 25,623 | ||||||||||||||
| Interest expense, net |
(6,228 | ) | (10,741 | ) | (4,271 | ) | — | (21,240 | ) | ||||||||||
| Other income (loss) |
— | (3,672 | ) | — | — | (3,672 | ) | ||||||||||||
| Interest expense and other loss allocation |
6,228 | 14,413 | (20,641 | ) | — | — | |||||||||||||
| Loss before income taxes and equity in undistributed losses of subsidiaries |
— | — | 711 | — | 711 | ||||||||||||||
| Income tax expense |
— | 20 | 877 | — | 897 | ||||||||||||||
| Net loss before equity in undistributed losses of subsidiaries |
— | (20 | ) | (166 | ) | — | (186 | ) | |||||||||||
| Equity in undistributed losses of subsidiaries |
(186 | ) | (166 | ) | — | 352 | — | ||||||||||||
| Net loss |
$ | (186 | ) | $ | (186 | ) | $ | (166 | ) | $ | 352 | $ | (186 | ) | |||||
22
Table of Contents
tw telecom inc.
NOTES TO CONDENSED CONSOLIDATED FINANCIAL STATEMENTS—(Continued)
tw telecom inc.
CONDENSED CONSOLIDATING STATEMENT OF OPERATIONS
Nine Months Ended September 30, 2009
| Parent Guarantor |
Issuer | Combined Subsidiary Guarantors |
Eliminations | Consolidated | ||||||||||||||||
| (amounts in thousands) | ||||||||||||||||||||
| Total revenue |
$ | — | $ | — | $ | 903,456 | $ | — | $ | 903,456 | ||||||||||
| Costs and expenses: |
||||||||||||||||||||
| Operating, selling, general and administrative |
— | 116,002 | 484,038 | — | 600,040 | |||||||||||||||
| Depreciation, amortization and accretion |
— | 12,386 | 209,491 | — | 221,877 | |||||||||||||||
| Corporate expense allocation |
— | (128,388 | ) | 128,388 | — | — | ||||||||||||||
| Total costs and expenses |
— | — | 821,917 | — | 821,917 | |||||||||||||||
| Operating income |
— | — | 81,539 | — | 81,539 | |||||||||||||||
| Interest expense, net |
(19,800 | ) | (34,494 | ) | (8,596 | ) | — | (62,890 | ) | |||||||||||
| Interest expense allocation |
19,800 | 34,494 | (54,294 | ) | — | — | ||||||||||||||
| Income before income taxes and equity in undistributed earnings of subsidiaries |
— | — | 18,649 | — | 18,649 | |||||||||||||||
| Income tax expense |
— | — | 2,159 | — | 2,159 | |||||||||||||||
| Net income before equity in undistributed earnings of subsidiaries |
— | — | 16,490 | — | 16,490 | |||||||||||||||
| Equity in undistributed earnings of subsidiaries |
16,490 | 16,490 | — | (32,980 | ) | — | ||||||||||||||
| Net income |
$ | 16,490 | $ | 16,490 | $ | 16,490 | $ | (32,980 | ) | $ | 16,490 | |||||||||
23
Table of Contents
tw telecom inc.
NOTES TO CONDENSED CONSOLIDATED FINANCIAL STATEMENTS—(Continued)
tw telecom inc.
CONDENSED CONSOLIDATING STATEMENT OF OPERATIONS
Nine Months Ended September 30, 2008
| Parent Guarantor |
Issuer | Combined Subsidiary Guarantors |
Eliminations | Consolidated | |||||||||||||||
| (amounts in thousands) | |||||||||||||||||||
| Total revenue |
$ | — | $ | — | $ | 864,373 | $ | — | $ | 864,373 | |||||||||
| Costs and expenses: |
|||||||||||||||||||
| Operating, selling, general and administrative |
— | 116,670 | 469,847 | — | 586,517 | ||||||||||||||
| Depreciation, amortization and accretion |
— | 10,155 | 202,160 | — | 212,315 | ||||||||||||||
| Corporate expense allocation |
— | (126,825 | ) | 126,825 | — | — | |||||||||||||
| Total costs and expenses |
— | — | 798,832 | — | 798,832 | ||||||||||||||
| Operating income |
— | — | 65,541 | — | 65,541 | ||||||||||||||
| Interest expense, net |
(18,365 | ) | (38,531 | ) | (7,393 | ) | — | (64,289 | ) | ||||||||||
| Other loss |
— | (7,767 | ) | — | (7,767 | ) | |||||||||||||
| Interest expense and other loss allocation |
18,365 | 46,298 | (64,663 | ) | — | — | |||||||||||||
| Loss before income taxes and equity in undistributed losses of subsidiaries |
— | — | (6,515 | ) | — | (6,515 | ) | ||||||||||||
| Income tax expense |
— | 24 | 1,626 | — | 1,650 | ||||||||||||||
| Net loss before equity in undistributed losses of subsidiaries |
— | (24 | ) | (8,141 | ) | — | (8,165 | ) | |||||||||||
| Equity in undistributed losses of subsidiaries |
(8,165 | ) | (8,141 | ) | — | 16,306 | — | ||||||||||||
| Net loss |
$ | (8,165 | ) | $ | (8,165 | ) | $ | (8,141 | ) | $ | 16,306 | $ | (8,165 | ) | |||||
24
Table of Contents
tw telecom inc.
NOTES TO CONDENSED CONSOLIDATED FINANCIAL STATEMENTS—(Continued)
tw telecom inc.
CONDENSED CONSOLIDATING STATEMENT OF CASH FLOWS
Nine Months Ended September 30, 2009
| Parent Guarantor |
Issuer | Combined Subsidiary Guarantors |
Eliminations | Consolidated | ||||||||||||||||
| (amounts in thousands) | ||||||||||||||||||||
| Cash flows from operating activities: |
||||||||||||||||||||
| Net income |
$ | 16,490 | $ | 16,490 | $ | 16,490 | $ | (32,980 | ) | $ | 16,490 | |||||||||
| Adjustments to reconcile net income to net cash provided by operating activities: |
||||||||||||||||||||
| Depreciation, amortization, and accretion |
— | 12,386 | 209,491 | — | 221,877 | |||||||||||||||
| Intercompany change |
(12,870 | ) | 83,911 | (104,021 | ) | 32,980 | — | |||||||||||||
| Discount on debt, amortization of debt issue costs and other |
13,148 | 1,366 | 530 | — | 15,044 | |||||||||||||||
| Stock based compensation |
— | — | 19,375 | — | 19,375 | |||||||||||||||
| Changes in operating assets and liabilities |
(14,654 | ) | (21,234 | ) | 41,305 | — | 5,417 | |||||||||||||
| Net cash provided by operating activities |
2,114 | 92,919 | 183,170 | — | 278,203 | |||||||||||||||
| Cash flows from investing activities: |
||||||||||||||||||||
| Capital expenditures |
— | (14,249 | ) | (180,401 | ) | — | (194,650 | ) | ||||||||||||
| Other investing activities |
— | 3,219 | (2,305 | ) | — | 914 | ||||||||||||||
| Net cash used in investing activities |
— | (11,030 | ) | (182,706 | ) | — | (193,736 | ) | ||||||||||||
| Cash flows from financing activities: |
||||||||||||||||||||
| Net proceeds (tax withholdings) from issuance of common stock upon exercise of stock options and vesting of restricted stock awards and units |
1,390 | — | — | — | 1,390 | |||||||||||||||
| Payment of debt and capital lease obligations |
— | (5,238 | ) | (464 | ) | — | (5,702 | ) | ||||||||||||
| Net cash used in (provided by) financing activities |
1,390 | (5,238 | ) | (464 | ) | — | (4,312 | ) | ||||||||||||
| Increase in cash and cash equivalents |
3,504 | 76,651 | — | — | 80,155 | |||||||||||||||
| Cash and cash equivalents at beginning of period |
21,033 | 331,143 | — | — | 352,176 | |||||||||||||||
| Cash and cash equivalents at end of period |
$ | 24,537 | $ | 407,794 | $ | — | $ | — | $ | 432,331 | ||||||||||
25
Table of Contents
tw telecom inc.
NOTES TO CONDENSED CONSOLIDATED FINANCIAL STATEMENTS—(Continued)
tw telecom inc.
CONDENSED CONSOLIDATING STATEMENT OF CASH FLOWS
Nine Months Ended September 30, 2008
| Parent Guarantor |
Issuer | Combined Subsidiary Guarantors |
Eliminations | Consolidated | ||||||||||||||||
| (amounts in thousands) | ||||||||||||||||||||
| Cash flows from operating activities: |
||||||||||||||||||||
| Net loss |
$ | (8,165 | ) | $ | (8,165 | ) | $ | (8,141 | ) | $ | 16,306 | $ | (8,165 | ) | ||||||
| Adjustments to reconcile net loss to net cash provided by operating activities: |
||||||||||||||||||||
| Depreciation, amortization, and accretion |
— | 10,155 | 202,160 | — | 212,315 | |||||||||||||||
| Intercompany change |
(3,264 | ) | 17,544 | 2,026 | (16,306 | ) | — | |||||||||||||
| Discount on debt, investment impairment, deferred debt issue and other |
12,146 | 9,082 | 1,083 | — | 22,311 | |||||||||||||||
| Stock based compensation |
— | — | 16,911 | — | 16,911 | |||||||||||||||
| Changes in operating assets and liabilities |
(6,521 | ) | (5,913 | ) | (20,894 | ) | — | (33,328 | ) | |||||||||||
| Net cash (used in) provided by operating activities |
(5,804 | ) | 22,703 | 193,145 | — | 210,044 | ||||||||||||||
| Cash flows from investing activities: |
||||||||||||||||||||
| Capital expenditures |
— | (8,656 | ) | (192,995 | ) | — | (201,651 | ) | ||||||||||||
| Proceeds from maturities of investments |
3,699 | — | — | 3,699 | ||||||||||||||||
| Other investing activities |
— | (1,154 | ) | 373 | — | (781 | ) | |||||||||||||
| Net cash used in investing activities |
— | (6,111 | ) | (192,622 | ) | — | (198,733 | ) | ||||||||||||
| Cash flows from financing activities: |
||||||||||||||||||||
| Net proceeds from issuance of common stock upon exercise of stock options and in connection with the employee stock purchase plan |
6,243 | — | — | — | 6,243 | |||||||||||||||
| Payment of debt and capital lease obligations |
— | (4,875 | ) | (523 | ) | — | (5,398 | ) | ||||||||||||
| Net cash provided by (used in) financing activities |
6,243 | (4,875 | ) | (523 | ) | — | 845 | |||||||||||||
| Increase in cash and cash equivalents |
439 | 11,717 | — | — | 12,156 | |||||||||||||||
| Cash and cash equivalents at beginning of period |
20,563 | 300,968 | — | — | 321,531 | |||||||||||||||
| Cash and cash equivalents at end of period |
$ | 21,002 | $ | 312,685 | $ | — | $ | — | $ | 333,687 | ||||||||||
26
Table of Contents
tw telecom inc.
| Item 2. | Management’s Discussion and Analysis of Financial Condition and Results of Operations |
The following discussion and analysis provides information concerning the results of operations and financial condition of the Company and should be read in conjunction with the accompanying condensed consolidated financial statements and notes thereto. This discussion and analysis also should be read in conjunction with Management’s Discussion and Analysis of Financial Condition and Results of Operations and the consolidated financial statements included in Part II of our Annual Report on Form 10-K for the year ended December 31, 2008. References in this item to “we,” “our,” or “us” are to the Company and its subsidiaries on a consolidated basis unless the context otherwise requires.
Cautions Concerning Forward Looking Statements
This document contains certain “forward-looking statements,” within the meaning of the Private Securities Litigation Reform Act of 1995, including statements regarding, among other items, our expected financial position, expected capital expenditures, the impact of the economic downturn, the impact of accounting changes, expense trends, future liquidity and capital resources, expected revenue mix, growth or stability from particular customer segments, the effects of consolidation in the telecommunications industry, anticipated customer disconnections and churn, Modified EBITDA trends, expected network expansion and grooming, and business and financing plans. These forward-looking statements are based on management’s current expectations and are naturally subject to risks, uncertainties, and changes in circumstances, certain of which are beyond our control. Actual results may differ materially from those expressed or implied by such forward-looking statements.
The words “believe,” “plan,” “target,” “expect,” “intend,” and “anticipate,” and expressions of similar substance identify forward-looking statements. Although we believe that the expectations reflected in such forward-looking statements are reasonable, we can give no assurance that those expectations will prove to be correct or fully accurate. Important factors that may cause actual results to differ materially from the expectations described in this report are set forth under “Risk Factors” in Item 1A and elsewhere in our Annual Report on Form 10-K for the year ended December 31, 2008, and elsewhere in this report. In addition, actual results may differ from our expectations due to increased customer disconnections and churn, increased competition, inability to obtain rights to build networks into commercial buildings, the current or a future economic downturn, delays in launching new products, decreased demand for our products, further declines in the prices of and revenue from our services due to competitive pressures, industry consolidation and other industry conditions, and increases in the price we pay for use of facilities of ILECs due to consolidation in the industry or further deregulation and adverse regulatory rulings or legislative developments. Readers are cautioned not to place undue reliance on these forward-looking statements, which speak only as of their dates. We undertake no obligation to publicly update or revise any forward-looking statements, whether as a result of new information, future events, or otherwise.
Overview
We amended our Restated Certificate of Incorporation to change our corporate name to tw telecom inc. on March 12, 2008. Our stockholders approved the name change by written consent on September 26, 2006. On July 1, 2008, we began using tw telecom inc. as our name and tw telecom as our brand.
We are a leading national provider of managed network services, specializing in Ethernet and data networking, Internet access, local and long distance voice, VPN, VoIP and network security services to enterprise organizations and communications services companies throughout the U.S, and for IP-VPN services, to their global locations. Our customers include, among others, enterprise organizations in the distribution, health care, finance, service and manufacturing industries, state, local and federal government entities and long distance carriers, ILECs, CLECs, wireless communications companies, and ISPs.
27
Table of Contents
tw telecom inc.
Through our subsidiaries, we operate in 75 U.S. metropolitan markets. As of September 30, 2009, our fiber networks spanned approximately 27,100 route miles directly connecting approximately 10,200 buildings served by our metropolitan fiber facilities (on-net) excluding inactive buildings and LEC local servicing offices connected with our fiber. We continue to expand our footprint within our existing markets by connecting our network into additional buildings. We have continued to expand our IP backbone data networking capability between markets supporting end-to-end Ethernet and VPN connections for customers, and also have selectively interconnected existing service areas within regional clusters with fiber optic facilities that we own or lease. In addition, we provide on-net inter-city switched services between our markets that offer customers a virtual presence in a remote city.
On October 31, 2006, we acquired Xspedius Communications, LLC (“Xspedius”), which expanded our markets served from 44 to 75 and increased our market density in 12 markets that we already served. This acquisition provided us with additional opportunities to serve multi-city and multi-location customers and to provide our full product portfolio in additional markets.
Our revenue is derived primarily from business communications services, including network, voice, data, and high-speed Internet access services. Our revenue by customer type by quarter in 2008 and 2009 is as follows:
| For the Three Months Ended | |||||||||||||||||||||
| 2008 | 2009 | ||||||||||||||||||||
| March 31, | June 30, | September 30, | December 31, | March 31, | June 30, | September 30, | |||||||||||||||
| Enterprise / End Users |
71 | % | 72 | % | 73 | % | 74 | % | 74 | % | 75 | % | 75 | % | |||||||
| Carrier |
25 | % | 25 | % | 24 | % | 23 | % | 23 | % | 22 | % | 22 | % | |||||||
| Intercarrier Compensation |
4 | % | 3 | % | 3 | % | 3 | % | 3 | % | 3 | % | 3 | % | |||||||
| Total Revenue |
100 | % | 100 | % | 100 | % | 100 | % | 100 | % | 100 | % | 100 | % | |||||||
The key elements of our business strategy include:
| • | Leveraging our extensive local and regional fiber networks and IP backbone networks to increase customer and building penetration in our existing markets; |
| • | Increasing revenue by focusing on service offerings that meet the sophisticated data needs of our customers, such as our Ethernet and IP business-to-business VPN services, Internet-based services, managed services and converged voice and data bundled services, and developing future services to enhance our customers’ voice and data networking capabilities; |
| • | Continuing to diversify our customer base and increasing revenue from enterprise customers, including businesses and local, state and federal government entities; |
| • | Pursuing opportunities to expand our network reach to serve new customers and additional locations for existing customers; |
| • | Continuing our disciplined approach to capital and operating expenditures in order to increase operating efficiencies, preserve our liquidity and drive us towards greater profitability; and |
| • | Delivering a proactive and comprehensive customer care strategy that differentiates us from our competitors. |
Enterprise Customer Revenue
Revenue from enterprise customers has increased for the past 29 consecutive quarters, including the three months ended September 30, 2009, primarily through sales of our data and Internet services such as Ethernet and IP based products. Revenue from our enterprise customers represented 75% of our total revenue for the three
28
Table of Contents
tw telecom inc.
months ended September 30, 2009 compared to 73% and 70% for the three months ended September 30, 2008 and 2007, respectively. We expect a growing percentage of our revenue will continue to come from our enterprise customer base. Our expanded market footprint resulting from the acquired operations and new capabilities has provided us with opportunities to extend our customer reach and product portfolio. While enterprise revenue continues to grow and service installations have been at consistent levels, the rate of year over year growth has been declining over the past eight quarters primarily due to revenue churn that we believe was mainly related to the economic environment and re-pricing of services in connection with contract renewals (see “Revenue and Customer Churn”), and to a lesser extent, because the revenue base is growing which has impacted the rate of growth.
Carrier Customer Revenue
Revenue from carrier customers declined 2% for the three months ended September 30, 2009 as compared to the same period in 2008. Carrier revenue, at 22% of our total revenue for the three months ended September 30, 2009, represented a smaller percentage of our total revenue than in the comparable prior year period. The continued decline as a percentage of total revenue was due to growth in revenue from enterprise customers, re-pricing of certain services in connection with contract renewals and disconnections resulting from business contractions and cost cutting measures driven by the economic environment. We believe revenue declines from carriers and ISPs may continue due to disconnections, re-pricing and other factors.
Intercarrier Compensation Revenue
Intercarrier compensation revenue, which consists of switched access and reciprocal compensation, represented 3% of our total revenue for both the three months ended September 30, 2009 and 2008, and may decline as a percentage of total revenue due to growth in revenue from enterprise customers and federal and state mandated rate reductions. Intercarrier compensation revenue may also fluctuate from quarter to quarter based on variations in minutes of use terminating on our network and the resolution of disputes. We believe intercarrier compensation revenue will continue to decline as a result of expected further federal and state mandated rate reductions and possible changes in the regulatory regime for intercarrier compensation. Switched access revenue is compensation we receive from other carriers for the delivery of traffic between a long distance carrier’s point of presence and an end user’s premises provided through our switching facilities. Switched access rates are regulated by the FCC and state public utility commissions. Reciprocal compensation represents compensation from a LEC for local exchange traffic originated on their facilities and terminated on our facilities. Reciprocal compensation rates are established by interconnection agreements between the parties based on federal and state regulatory and judicial rulings.
Revenue and Customer Churn
Average lost recurring monthly billing from service disconnects was 1.2.% of monthly revenue for each of the three months ended September 30, 2009 and 2008 compared to an average of 1.2% and 1.1% for the years ended December 31, 2008 and 2007, respectively. Customer and service disconnects occur as part of the normal course of business and are primarily associated with industry consolidation, customer network optimization, cost cutting, business contractions, customer financial difficulties, discontinuance of certain acquired products and price competition from other providers. We also believe that the economic downturn contributed to an increase in churn beginning in late 2007 and continued into the nine months ended September 30, 2009 primarily from customers in our acquired customer base that buy less complex services, other smaller customers, mortgage-related customers and carriers. We are also experiencing increased disconnections in our other enterprise customer segments and we expect elevated revenue churn to continue to pressure revenue growth.
Average monthly customer churn was 1.2% for the three months ended September 30, 2009 compared to 1.5% for the three months ended September 30, 2008 and 1.4% and 1.2% for the years ended December 31, 2008 and 2007, respectively. We define customer churn as the average number of customers disconnecting their
29
Table of Contents
tw telecom inc.
services entirely divided by our monthly customer count. The majority of this customer churn, which we expect to continue, came from our smaller customers.
Our ability to continue to grow revenue depends on increasing sales production and customer acquisition and retention to outpace the impacts of churn and re-pricing of services for renewed contracts. We believe that our future growth rates will be influenced by the initiatives we have implemented to improve sales production and customer retention, product offerings targeted at enterprise customers, our ability to compete for multi-location customers, the extension of our product portfolio into our acquired markets, our extensive fiber network and our strong liquidity, which provides us the ability to invest in opportunities that we believe will increase our revenue. However, we cannot predict whether these initiatives or other factors will offset the impacts of revenue and customer churn, re-pricing of services related to contract renewals or other pressures to revenue growth caused by the current economic conditions and other factors. There is no assurance that we will be able to continue to maintain our sales at a level that will result in future revenue growth if the higher churn that we experienced since late 2007 due to the economic downturn continues.
Pricing
Our revenue continues to be impacted by competitive pricing pressure from other telecommunications service providers that have reduced their prices on various services, particularly with respect to smaller bandwidth customers with single-site needs and very large customers, as well as customers’ heightened cost cutting initiatives due to the economy. In addition, revenue has been impacted by pricing declines to current levels for some existing customers that renewed services with expired terms. We expect this pricing pressure may continue.
Pricing of Special Access Services
We provide special access services over our own fiber facilities in competition with ILECs, and we also purchase special access and other services from ILECs to extend the reach of our network. The ILECs have argued before the FCC that the broadband services that they sell, including special access services we buy from them, should no longer be subject to regulations governing price and quality of service. If the special access services we buy from the ILECs were to be further deregulated, ILECs would have a greater ability to increase the price and reduce the service quality of special access services they sell to us.
We have advocated that the FCC should modify its special access pricing flexibility rules to return these services to price-cap regulation to protect against unreasonable price increases. The FCC is reviewing its regulation of special access pricing in a pending proceeding. In addition, the ILECs have filed numerous petitions for forbearance from regulation of their broadband special access services, including Ethernet services offered as special access. The FCC has generally granted these petitions with the result that prices for the Ethernet and OC-n high capacity data services of the petitioning carriers are no longer regulated. The D.C. Circuit Court of Appeals upheld the FCC’s rulings upon appeal by us and other CLECs. These FCC actions did not impact the availability of the tariffed time division multiplexed special access circuits that we use for access to buildings that are not connected to our network with our fiber. We expect that the ILECs will continue to advocate deregulation of all forms of special access services, and we cannot predict the outcome of the FCC’s proceedings in this regard or the impact of that outcome on our business.
We have a five-year wholesale service agreement with AT&T Inc. (formerly SBC Communications Inc.) under which AT&T supplies us with special access and other services for end user access and transport with certain service level commitments through June 2010 in SBC’s former 13 state local service territories. We have agreed to maintain certain volume levels in order to receive specified discounts and other terms and conditions, and are subject to certain penalties for early termination of the contract. We have agreements or tariffed term and
30
Table of Contents
tw telecom inc.
volume plans with AT&T for the former BellSouth territory and with the other ILECs, which in some cases do not preclude prospective price increases. However, the ability of the ILECs to increase their special access prices is in some cases subject to regulatory constraints.
Other Financial Trends
We have historically experienced and expect to continue to experience fluctuations in our revenue, margins, and cash flows in the normal course of business from customer and service disconnects, the timing of sales and installations, seasonality of sales and usage, customer disputes and dispute resolutions, repricing of services upon contract renewals, ongoing revenue churn and fluctuations in expenses and capital expenditures. The current economic climate may magnify the impact of some of these factors. However, we cannot predict the total impact or timing on revenue, margins, and cash flows from these items.
We have undertaken several initiatives to increase revenue growth, margins and cash flows including revenue assurance and retention initiatives, cost reduction measures such as network grooming and cost optimization intended to reduce as a percentage of revenue the overall access costs paid to carriers, enhancing back office support systems to improve operating efficiencies and network investment initiatives to reduce the cost of equipment to increase overall capital efficiency. We cannot predict whether these initiatives will be sufficient to maintain our current financial performance.
Due to successful collection efforts aided by system enhancements, internal controls and our revenue recognition policies, our bad debt expense remained at less than 1% of our total revenue for 2008 and 2009. However, customers that have experienced financial difficulties have increased our bad debt expense in 2009. Bad debt expense increased to 0.7% for the nine months ended September 30, 2009 compared to 0.6% for the nine months ended September 30, 2008.
Critical Accounting Policies and Estimates
For a description of our critical accounting policies and estimates, see Item 7 in our Annual Report on Form 10-K for the year ended December 31, 2008, “Management’s Discussion and Analysis of Financial Condition and Results of Operations”.
Recently Adopted Accounting Pronouncements
Effective July 2009, the FASB ASC became the single source of authoritative nongovernmental U.S. GAAP, other than guidance issued by the Securities and Exchange Commission. The ASC is not intended to change or alter existing GAAP. The adoption of the ASC did not have an impact on our condensed consolidated financial statements but changes references to specific accounting standards in the footnotes to our condensed consolidated financial statements.
Effective January 1, 2009, we adopted the cash conversion guidance within ASC 470-20, which requires our Convertible Debentures to be separated into debt and equity components at issuance and a value to be assigned to each. The value assigned to the debt component is the estimated fair value, as of the issuance date, of a similar instrument without the conversion feature. The difference between the convertible debt instrument cash proceeds and this estimated fair value is recorded as a debt discount and is amortized to interest expense using the interest rate method over the expected term of the convertible debt instrument. ASC 470-20 changes the accounting treatment for our Convertible Debentures and requires retrospective application to all periods presented in the financial statements. Although ASC 470-20 does not impact our actual past or future cash flows, the impact to non-cash interest expense and results of operations was $4.3 million, or $0.03 per share and $4.0 million, or $0.03 per share, for the three months ended September 30, 2009 and 2008, respectively, and $12.7 million, or
31
Table of Contents
tw telecom inc.
$0.09 per share and $11.7 million, or $0.08 per share, for the nine months ended September 30, 2009 and 2008, respectively. We expect the impact to our non-cash interest expense and results of operations to be approximately $17 million and $19 million for the full years ended December 31, 2009 and 2010, respectively. See Note 2 to our condensed consolidated financial statements.
Effective January 1, 2009, we adopted the disclosure requirements within ASC 815, which changed the disclosure requirements for derivative instruments and hedging activities. Companies are required to provide enhanced disclosures about how and why they use derivative instruments, how derivative instruments and related hedged items are accounted for, and how derivative instruments and related hedged items affect their financial position, financial performance, and cash flows. The adoption of the disclosure requirements within ASC 815 did not have an impact on our consolidated financial position and results of operations. See Note 3 to our condensed consolidated financial statements.
In April 2009, the FASB issued expanded guidance and disclosure requirements within ASC 820 which provides additional guidance on estimating fair value for an asset or liability when the volume and level of activity have significantly decreased in relation to normal market activity for the asset or liability. ASC 820 also provides additional guidance on circumstances that may indicate that a transaction is not orderly and requires additional disclosure about fair value measurement in annual and interim reporting periods. The expanded guidance and disclosure requirements within ASC 820 was effective beginning with our reporting period ended June 30, 2009 and did not have an impact on our consolidated financial statements.
In April 2009, the FASB issued expanded disclosure requirements within ASC 825, which extends annual disclosure requirements to interim financial statements of publicly traded companies. The expanded disclosure requirements within ASC 825 were effective beginning with our reporting period ended June 30, 2009 and did not have an impact on our consolidated financial statements. We have provided the additional disclosures required in Note 4 to our condensed consolidated financial statements.
In April 2009, the FASB issued expanded guidance and disclosure requirements within ASC 320, which provides further guidance on the measurement, recognition and presentation of other than temporary impairments of assets and requires additional disclosures. The expanded guidance and disclosure requirements within ASC 320 were effective beginning with our reporting period ended June 30, 2009 and did not have an impact on our consolidated financial statements. We have provided the additional disclosures required in “Cash Equivalents and Investments” in Note 1 to our condensed consolidated financial statements.
In May 2009, the FASB issued ASC 855, Subsequent Events which establishes general standards of accounting for and disclosure of events that occur after the balance sheet date but before the financial statements are issued or are available to be issued. It requires the disclosure of the date through which an entity has evaluated subsequent events and the basis for that date. ASC 855 was effective for our reporting period ended June 30, 2009, and must be applied prospectively. The adoption of this statement did not have an effect on our condensed consolidated financial statements except for additional disclosures provided in “Basis of Presentation” in Note 1 to our condensed consolidated financial statements.
32
Table of Contents
tw telecom inc.
Results of Operations
The following table sets forth certain data from our unaudited condensed consolidated financial statements presented in thousands of dollars and expressed as a percentage of total revenue. This table should be read together with our condensed consolidated financial statements, including the notes thereto, appearing elsewhere in this report:
| Three Months Ended September 30, | Nine Months Ended September 30, | |||||||||||||||||||||||||||
| 2009 | 2008 | 2009 | 2008 | |||||||||||||||||||||||||
| (amounts in thousands, except per share amounts) |
(amounts in thousands, except per share amounts) |
|||||||||||||||||||||||||||
| Statements of Operations Data: |
||||||||||||||||||||||||||||
| Revenue: |
||||||||||||||||||||||||||||
| Data and Internet services |
$ | 119,977 | 39 | % | $ | 102,282 | 35 | % | $ | 347,848 | 38 | % | $ | 292,390 | 34 | % | ||||||||||||
| Network services |
93,233 | 31 | 96,152 | 33 | 280,396 | 31 | 291,762 | 34 | ||||||||||||||||||||
| Voice services |
83,799 | 27 | 83,927 | 29 | 250,414 | 28 | 251,707 | 29 | ||||||||||||||||||||
| Intercarrier compensation |
7,757 | 3 | 9,258 | 3 | 24,798 | 3 | 28,514 | 3 | ||||||||||||||||||||
| Total revenue |
304,766 | 100 | 291,619 | 100 | 903,456 | 100 | 864,373 | 100 | ||||||||||||||||||||
| Costs and expenses (1): |
||||||||||||||||||||||||||||
| Operating (exclusive of depreciation, amortization, and accretion shown separately below) (1) |
127,155 | 42 | 123,051 | 42 | 374,105 | 41 | 365,146 | 42 | ||||||||||||||||||||
| Selling, general, and |
74,611 | 24 | 71,408 | 24 | 225,935 | 25 | 221,371 | 26 | ||||||||||||||||||||
| Depreciation, amortization, and accretion |
74,280 | 24 | 71,537 | 25 | 221,877 | 25 | 212,315 | 25 | ||||||||||||||||||||
| Total costs and expenses |
276,046 | 91 | 265,996 | 91 | 821,917 | 91 | 798,832 | 92 | ||||||||||||||||||||
| Operating income |
28,720 | 9 | 25,623 | 9 | 81,539 | 9 | 65,541 | 7 | ||||||||||||||||||||
| Interest expense |
(20,732 | ) | (7 | ) | (22,758 | ) | (8 | ) | (63,217 | ) | (7 | ) | (70,031 | ) | (8 | ) | ||||||||||||
| Interest income |
116 | — | 1,518 | 1 | 327 | — | 5,742 | 1 | ||||||||||||||||||||
| Other loss |
— | — | (3,672 | ) | (1 | ) | — | — | (7,767 | ) | (1 | ) | ||||||||||||||||
| Income (loss) before income taxes |
8,104 | 3 | 711 | — | 18,649 | 2 | (6,515 | ) | (1 | ) | ||||||||||||||||||
| Income tax expense |
406 | — | 897 | — | 2,159 | — | 1,650 | — | ||||||||||||||||||||
| Net income (loss) |
$ | 7,698 | 3 | % | $ | (186 | ) | — | % | $ | 16,490 | 2 | % | $ | (8,165 | ) | (1 | )% | ||||||||||
| Net income (loss) per share, basic and diluted |
$ | 0.05 | $ | — | $ | 0.11 | $ | (0.06 | ) | |||||||||||||||||||
| Weighted average shares outstanding, basic |
148,082 | 147,443 | 147,969 | 147,131 | ||||||||||||||||||||||||
| Weighted average shares outstanding, diluted |
149,952 | 147,443 | 149,401 | 147,131 | ||||||||||||||||||||||||
| Modified EBITDA (2)(3) |
$ | 109,426 | 36 | % | $ | 102,630 | 35 | % | $ | 322,791 | 36 | % | $ | 294,767 | 34 | % | ||||||||||||
| Net cash provided by operating activities |
$ | 107,775 | $ | 79,391 | $ | 278,203 | $ | 210,044 | ||||||||||||||||||||
| Net cash used in investing activities |
$ | (66,011 | ) | $ | (71,109 | ) | $ | (193,736 | ) | $ | (198,733 | ) | ||||||||||||||||
| Net cash (used in) provided by financing activities |
$ | (1,234 | ) | $ | 249 | $ | (4,312 | ) | $ | 845 | ||||||||||||||||||
33
Table of Contents
tw telecom inc.
| (1) | Includes the following non-cash stock-based employee compensation: |
| Three Months Ended September 30, |
Nine Months Ended September 30, | |||||||||||
| 2009 | 2008 | 2009 | 2008 | |||||||||
| (amounts in thousands) | ||||||||||||
| Operating |
$ | 961 | $ | 824 | $ | 2,464 | $ | 2,552 | ||||
| Selling, general, and administrative |
$ | 5,465 | $ | 4,646 | $ | 16,911 | $ | 14,359 | ||||
| (2) | “Modified EBITDA” is a non-GAAP financial measure and is defined as net income (loss) before depreciation, amortization and accretion expense, interest expense, interest income, debt extinguishment costs, other income (loss), impairment charges, income tax expense (benefit), cumulative effect of change in accounting principle, and non-cash stock-based compensation. Modified EBITDA is not intended to replace operating income (loss), net income (loss), cash flow and other measures of financial performance and liquidity reported in accordance with accounting principles generally accepted in the United States. Rather, Modified EBITDA is a measure of operating performance and liquidity that investors may consider in addition to such measures. Our management believes that Modified EBITDA is a standard measure of operating performance and liquidity that is commonly reported and widely used by analysts, investors, and other interested parties in the telecommunications industry because it eliminates many differences in financial, capitalization, and tax structures, as well as non-cash and non-operating charges to earnings. We believe that Modified EBITDA trends are a valuable indicator of whether our operations are able to produce sufficient operating cash flow to fund working capital needs, service debt obligations, and fund capital expenditures. We currently use Modified EBITDA for these purposes. Modified EBITDA also is used internally by our management to assess ongoing operations and is a measure used to test compliance with certain covenants of our senior notes, our revolving credit facility and our Term Loan. The definition of EBITDA under our revolving credit facility, our Term Loan and our senior notes differs from the definition of Modified EBITDA used in this table. The definition of EBITDA in our credit facility (see Note 2 to our condensed consolidated financial statements) also excludes certain non-cash losses within certain limits and certain extraordinary gains and the senior notes definition excludes other non-cash items. However, the resulting calculation is not materially different from the calculation of Modified EBITDA as defined for the periods presented. Modified EBITDA as used in this document may not be comparable to similarly titled measures reported by other companies due to differences in accounting and disclosure policies. The reconciliation between net income (loss) and Modified EBITDA is as follows: |
| Three Months Ended September 30, |
Nine Months Ended September 30, |
|||||||||||||||
| 2009 | 2008 | 2009 | 2008 | |||||||||||||
| (amounts in thousands) | ||||||||||||||||
| Net income (loss) |
$ | 7,698 | $ | (186 | ) | $ | 16,490 | $ | (8,165 | ) | ||||||
| Income tax expense |
406 | 897 | 2,159 | 1,650 | ||||||||||||
| Other loss |
— | 3,672 | — | 7,767 | ||||||||||||
| Interest income |
(116 | ) | (1,518 | ) | (327 | ) | (5,742 | ) | ||||||||
| Interest expense |
20,732 | 22,758 | 63,217 | 70,031 | ||||||||||||
| Depreciation, amortization, and accretion |
74,280 | 71,537 | 221,877 | 212,315 | ||||||||||||
| Non-cash stock-based compensation |
6,426 | 5,470 | 19,375 | 16,911 | ||||||||||||
| Modified EBITDA |
$ | 109,426 | $ | 102,630 | $ | 322,791 | $ | 294,767 | ||||||||
34
Table of Contents
tw telecom inc.
The reconciliation between net cash provided by operations and Modified EBITDA is as follows:
| Three Months Ended September 30, |
Nine Months Ended September 30, |
|||||||||||||||
| 2009 | 2008 | 2009 | 2008 | |||||||||||||
| (amounts in thousands) | (amounts in thousands) | |||||||||||||||
| Net cash provided by operations |
$ | 107,775 | $ | 79,391 | $ | 278,203 | $ | 210,044 | ||||||||
| Income tax expense |
406 | 897 | 2,159 | 1,650 | ||||||||||||
| Other loss |
— | 3,672 | — | 7,767 | ||||||||||||
| Interest income |
(116 | ) | (1,518 | ) | (327 | ) | (5,742 | ) | ||||||||
| Interest expense |
20,732 | 22,758 | 63,217 | 70,031 | ||||||||||||
| Discount on debt, amortization of deferred debt issue costs and other |
(4,902 | ) | (9,318 | ) | (15,044 | ) | (22,311 | ) | ||||||||
| Changes in operating assets and liabilities |
(14,469 | ) | 6,748 | (5,417 | ) | 33,328 | ||||||||||
| Modified EBITDA |
$ | 109,426 | $ | 102,630 | $ | 322,791 | $ | 294,767 | ||||||||
| (3) | Modified EBITDA margin represents Modified EBITDA as a percentage of revenue. |
Three Months Ended September 30, 2009 Compared to Three Months Ended September 30, 2008
Revenue. Total revenue increased $13.1 million, or 5%, to $304.8 million for the three months ended September 30, 2009, from $291.6 million for the comparable period in 2008. The primary contributor to the growth in revenue was increased installations of data and Internet services to enterprise customers.
Data and Internet services revenue increased $17.7 million, or 17%, to $120.0 million for the three months ended September 30, 2009, from $102.3 million for the comparable period in 2008. The increase in data and Internet services revenue primarily resulted from growth in installations of our Ethernet and IP-based products to enterprise customers partially offset by disconnects and repricing of some renewed customer contracts.
Revenue from network services decreased $2.9 million, or 3%, to $93.2 million for the three months ended September 30, 2009 from $96.2 million for the comparable period in 2008. The decrease in network services revenue resulted primarily from repricing of some renewed customer contracts and disconnects predominantly from carrier customers, partially offset by increases in collocation and high capacity services revenue.
Voice services revenue decreased $0.1 million to $83.8 million for the three months ended September 30, 2009 from $83.9 million for the comparable period in 2008. The decrease in voice services revenue resulted primarily from customer disconnects offset by growth in bundled and other local product sales. Usage based revenue included in voice services represented 4% of our total revenue for each of the three months ended September 30, 2009 and 2008.
Intercarrier compensation revenue, including switched access and reciprocal compensation, decreased $1.5 million, or 16%, to $7.8 million for the three months ended September 30, 2009, from $9.3 million for the comparable period in 2008. The decrease was primarily due to a decline in minutes of use terminated on our network and rate reductions partially offset by an increase in revenue due to a reduction in disputes.
Operating Expenses. Our operating expenses consist of costs directly related to the operation and maintenance of our networks and the provisioning of our services. These costs include the salaries and related expenses of customer care, provisioning, network maintenance, technical field and network operations and engineering personnel, costs to repair and maintain our network, and costs paid to other carriers for access to their facilities, interconnection, and facilities leased and associated utilities. We carry a significant portion of our
35
Table of Contents
tw telecom inc.
traffic on our own fiber infrastructure, which enhances our ability to minimize and control access costs, which are the costs to purchase network services from other carriers. Operating expenses increased by $4.1 million, or 3%, to $127.2 million for the three months ended September 30, 2009, from $123.1 million for the comparable period in 2008. The increase in operating expenses is primarily due to higher network access costs associated with net growth in installations of service, higher employee costs due to annual merit-based salary increases and a decrease in favorable settlements partially offset by network and other cost efficiencies. Operating expenses represented 42% of total revenue for both the three months ended September 30, 2009 and 2008.
Selling, General, and Administrative Expenses. Selling, general, and administrative expenses consist of salaries and related costs for employees and other expenses related to sales and marketing, bad debt, information technology, billing, regulatory, administrative, and legal functions. Selling, general, and administrative expenses increased by $3.2 million, or 4%, to $74.6 million for the three months ended September 30, 2009, from $71.4 million for the comparable period in 2008. The increase was due to favorable transactional tax settlements in the prior year that did not recur and higher employee costs somewhat offset by lower bad debt expense. Higher employee costs primarily resulted from non-cash stock based compensation and annual merit-based salary increases somewhat offset by lower incentive-based compensation. Selling, general, and administrative expenses represented 24% of total revenue for both the three months ended September 30, 2009 and 2008.
Depreciation, Amortization, and Accretion Expense. Depreciation, amortization, and accretion expense increased $2.7 million, or 4%, to $74.3 million for the three months ended September 30, 2009, from $71.5 million for the comparable period in 2008. The increase was primarily attributable to additions to property, plant and equipment made during 2008 and 2009.
Interest Expense. Interest expense decreased $2.0 million, or 9%, to $20.7 million for the three months ended September 30, 2009, from $22.8 million for the comparable period in 2008. The decrease is primarily due to lower interest rates on our variable rate Term Loan partially offset by an increase in non-cash interest expense associated with our Convertible Debentures. The adoption of ASC 470-20 on January 1, 2009 resulted in an increase in our non-cash interest expense for our Convertible Debentures of $4.3 million and $4.0 million for the three months ended September 30, 2009 and 2008, respectively. We expect the impact of ASC 470-20 to non-cash interest expense and results of operations to be approximately $17 million and $19 million for the years ending December 31, 2009 and 2010, respectively.
Interest Income. Interest income decreased $1.4 million, or 92%, to $0.1 million for the three months ended September 30, 2009, from $1.5 million for the comparable period in 2008. The decrease is due to a decline in interest rates earned on investments. As of September 30, 2009, our investments included in cash and cash equivalents were comprised of U.S. treasury money market funds.
Other Loss. During the three months ended September 30, 2008, we recognized a $3.7 million loss resulting from an impairment of commercial paper investments that we hold past the maturity dates and upon liquidation of one of these securities. There was no such loss during the three months ended September 30, 2009.
Income Tax Expense. Income tax expense was $0.4 million for the three months ended September 30, 2009 for federal and state income taxes compared to $0.9 million for the comparable period in 2008 for state income taxes. During 2002, we established a valuation allowance for deferred taxes. As of September 30, 2009, our valuation allowance was $281.2 million and our net deferred tax assets were $58.8 million. We believe that it is more likely than not that our net deferred tax assets will be realized through future taxable income. The $58.8 million in net deferred tax assets represents our best estimate of the tax benefits that would be realizable utilizing tax planning strategies prior to the time that net operating loss carryforwards of $1.1 billion as of September 30, 2009 are due to expire, beginning in 2019.
36
Table of Contents
tw telecom inc.
Net Income (Loss) and Modified EBITDA. Net income was $7.7 million, or $0.05 per share, for the three months ended September 30, 2009 compared to a net loss of $0.2 million, or $0.00 per share, for the comparable period in 2008. This increase of $7.9 million resulted primarily from increased revenue partially offset by an increase in operating, selling, general and administrative, and depreciation, amortization and accretion expense and the $3.7 million other loss in the comparable period in 2008 as described above that did not recur. Modified EBITDA increased $6.8 million to $109.4 million, or 36% of total revenue for the three months ended September 30, 2009, from $102.6 million, or 35% of total revenue for the comparable period in 2008. The increase in Modified EBITDA and Modified EBITDA margin was primarily the result of the contribution from revenue growth, cost efficiencies from network and other optimization efforts partially offset by settlements in the prior year that did not recur and increases in employee costs. While we anticipate achieving additional efficiencies in our business from optimization efforts, we expect any significant future improvement in our Modified EBITDA margin will have to result from revenue growth rather than cost reductions, given the substantial synergies, efficiencies and scaling we accomplished over the last several years. For the three months ended September 30, 2009 and 2008, Modified EBITDA has been sufficient to cover our capital expenditures and service our debt and we expect to generate sufficient Modified EBITDA in the foreseeable future to cover our expected capital expenditures and interest expense.
Modified EBITDA is a non-GAAP measure. We define Modified EBITDA as net income or loss before depreciation, amortization, and accretion, interest expense, interest income, debt extinguishment costs, other income (loss), impairment charges, income tax expense (benefit), cumulative effect of change in accounting principle, and non-cash stock-based compensation. Modified EBITDA is not intended to replace operating income (loss), net income (loss), cash flow, and other measures of financial performance and liquidity reported in accordance with accounting principles generally accepted in the United States. Rather, Modified EBITDA is a measure of operating performance and liquidity that investors may consider in addition to such measures. We believe that Modified EBITDA is a standard measure of operating performance and liquidity that is commonly reported and widely used by analysts, investors, and other interested parties in the telecommunications industry because it eliminates many differences in financial, capitalization, and tax structures, as well as non-cash and non-operating charges to earnings. We use Modified EBITDA internally to assess on-going operations and it is the basis for various financial covenants contained in our debt agreements. Although we expect to continue to generate positive Modified EBITDA in the future as we expand our business in existing markets, there is no assurance that we will sustain the current level of Modified EBITDA or sufficient positive Modified EBITDA to meet our working capital requirements, comply with our debt agreements, and service our indebtedness. Other companies may define Modified EBITDA or similar terms differently. See Note 2 to the table under “Results of Operations” for a reconciliation between net income (loss) and Modified EBITDA and net cash provided by operations and Modified EBITDA.
Nine Months Ended September 30, 2009 Compared to Nine Months Ended September 30, 2008
Revenue. Total revenue increased $39.1 million, or 5%, to $903.5 million for the nine months ended September 30, 2009, from $864.4 million for the comparable period in 2008. The primary contributor to the growth in revenue was increased installations of data and Internet services to enterprise customers.
Data and Internet services revenue increased $55.5 million, or 19%, to $347.8 million for the nine months ended September 30, 2009, from $292.4 million for the comparable period in 2008. The increase in data and Internet services revenue primarily resulted from growth in installations of our Ethernet and IP-based products to enterprise customers partially offset by disconnects and repricing of some renewed customer contracts.
Revenue from network services decreased $11.4 million, or 4%, to $280.4 million for the nine months ended September 30, 2009 from $291.8 million for the comparable period in 2008. The decrease in network services revenue resulted primarily from repricing of some renewed customer contracts and disconnects
37
Table of Contents
tw telecom inc.
predominantly from carrier customers. These decreases were partially offset by increases in collocation and high capacity services revenue.
Voice services revenue decreased $1.3 million, or 1%, to $250.4 million for the nine months ended September 30, 2009 from $251.7 million for the comparable period in 2008. The decrease in voice services revenue resulted primarily from customer disconnects partially offset by growth in bundled and other local product sales and a reduction in disputes. Usage based revenue included in voice services represented 4% of our total revenue for each of the nine months ended September 30, 2009 and 2008.
Intercarrier compensation revenue, including switched access and reciprocal compensation, decreased $3.7 million, or 13%, to $24.8 million for the nine months ended September 30, 2009, from $28.5 million for the comparable period in 2008. The decrease was primarily due to rate reductions and a decline in minutes of use terminated on our network partially offset by an increase in revenue due to a reduction in disputes.
Operating Expenses. Operating expenses increased by $9.0 million, or 2%, to $374.1 million for the nine months ended September 30, 2009, from $365.1 million for the comparable period in 2008. The increase in operating expenses is primarily due to higher network access costs associated with net growth in installations of service, higher employee expense related to annual merit-based salary increases and a decrease in favorable settlements partially offset by network and other cost efficiencies. Operating expenses declined to 41% of total revenue for the nine months ended September 30, 2009 compared to 42% of total revenue for the same period in 2008, reflecting cost efficiencies from network and other cost optimization efforts.
Selling, General, and Administrative Expenses. Selling, general, and administrative expenses increased $4.6 million, or 2%, to $225.9 million for the nine months ended September 30, 2009, from $221.4 million for the comparable period in 2008. The increase is primarily due to favorable transactional tax settlements in the prior year that did not recur and higher property taxes, employee costs and bad debt expense partially offset by branding expenses associated with our name change in the prior year that did not recur. Higher employee costs resulted primarily from incentive-based compensation for sales employees due to service installations, non-cash stock based compensation and annual merit-based salary increases. Selling, general, and administrative expenses declined to 25% of total revenue for the nine months ended September 30, 2009 compared to 26% of total revenue for the same period in 2008, reflecting employee cost efficiencies and branding expenses in the prior year that did not recur.
Depreciation, Amortization, and Accretion Expense. Depreciation, amortization, and accretion expense increased $9.6 million, or 5%, to $221.9 million for the nine months ended September 30, 2009, from $212.3 million for the comparable period in 2008. The increase was primarily attributable to additions to property, plant and equipment made during 2008 and 2009.
Interest Expense. Interest expense decreased $6.8 million, or 10%, to $63.2 million for the nine months ended September 30, 2009, from $70.0 million for the comparable period in 2008. The decrease is primarily due to lower interest rates on our variable rate Term Loan partially offset by an increase in non-cash interest expense associated with our Convertible Debentures. The adoption of ASC 470-20 on January 1, 2009 resulted in an increase in our non-cash interest expense for our Convertible Debentures of $12.7 million and $11.7 million for the nine months ended September 30, 2009 and 2008, respectively. We expect the impact of ASC 470-20 to non-cash interest expense and results of operations to be approximately $17 million and $19 million for the years ended December 31, 2009 and 2010, respectively.
Interest Income. Interest income decreased $5.4 million, or 94%, to $0.3 million for the nine months ended September 30, 2009, from $5.7 million for the comparable period in 2008. The decrease is due to a decline in interest rates earned on investments. As of September 30, 2009, our investments included in cash and cash equivalents were comprised of U.S. treasury money market funds.
38
Table of Contents
tw telecom inc.
Other Loss. During the nine months ended September 30, 2008, we recognized a $7.8 million loss that resulting from an impairment of commercial paper investments that we hold past the maturity dates and upon liquidation of one of these securities. There was no such loss during the nine months ended September 30, 2009.
Income Tax Expense. Income tax expense was $2.2 million for the nine months ended September 30, 2009 for federal and state income taxes compared to $1.7 million for the comparable period in 2008 for state income taxes. During 2002, we established a valuation allowance for deferred taxes. As of September 30, 2009, our valuation allowance was $281.2 million and our net deferred tax assets were $58.8 million. We believe that it is more likely than not that our net deferred tax assets will be realized through future taxable income. The $58.8 million in net deferred tax assets represents our best estimate of the tax benefits that would be realizable utilizing tax planning strategies prior to the time that net operating loss carryforwards of $1.1 billion as of September 30, 2009 are due to expire, beginning in 2019.
Net Income (Loss) and Modified EBITDA. Net income was $16.5 million, or $0.11 per share, for the nine months ended September 30, 2009 compared to a net loss of $8.2 million, or $0.06 per share, for the comparable period in 2008. This increase of $24.7 million resulted primarily from increased revenue partially offset by an increase in operating, selling and administrative, and depreciation expenses and the $7.8 million other loss in the comparable period in 2008 as described above that did not recur. Modified EBITDA increased $28.0 million to $322.8 million, or 36% of total revenue for the nine months ended September 30, 2009, from $294.8 million, or 34% of total revenue for the comparable period in 2008. The increase in Modified EBITDA and Modified EBITDA margin was primarily the result of the contribution from revenue growth, cost efficiencies from network and other optimization efforts, branding expenses associated with our name change and settlements in the comparable period in 2008 that did not recur, partially offset by increases in property taxes, employee costs and bad debt expense. While we anticipate achieving additional efficiencies in our business from optimization efforts, we expect any significant future improvement in Modified EBITDA margins will have to result from revenue growth rather than cost reduction, given the substantial synergies, efficiencies and scaling we accomplished over the last several years. For the nine months ended September 30, 2009 and 2008, Modified EBITDA has been sufficient to cover our capital expenditures and service our debt and we expect to generate sufficient Modified EBITDA in the foreseeable future to cover our expected capital expenditures and interest expense.
Liquidity and Capital Resources
Historically, we have generated cash flow from operations consisting primarily of payments received from customers for the provision of business communications services offset by payments to other telecommunications carriers, payments to employees, and payments for interest and other operating, selling, general, and administrative costs. We have also generated cash from debt and equity financing activities and have used funds to service our debt obligations, make capital expenditures to expand our networks and fund acquisitions.
At September 30, 2009, we had $1.3 billion of total debt and capital lease obligations and $432.3 million of cash and cash equivalents compared to $1.3 billion of total debt and capital lease obligations and $352.2 million of cash and cash equivalents at December 31, 2008. Net debt (defined as total debt and capital lease obligations less cash and cash equivalents) decreased $65.4 million from December 31, 2008 primarily due to cash provided by operating activities resulting from Modified EBITDA and lower interest payments, partially offset by accretion of the discount on our Convertible Debentures, capital expenditures and a reduction in interest income.
Working capital, defined as current assets less current liabilities, was $252.7 million as of September 30, 2009, an increase of $71.1 million from December 31, 2008. Our working capital ratio, defined as current assets divided by current liabilities, was 1.91 as of September 30, 2009 as compared to 1.66 as of December 31, 2008. The increase in working capital is primarily a result of cash provided by operating activities resulting from higher Modified EBITDA and lower net interest expense.
39
Table of Contents
tw telecom inc.
Cash Flow Activity
Cash and cash equivalents were $432.3 million and $333.7 million as of September 30, 2009 and 2008, respectively. The change in cash and cash equivalents during the periods presented was as follows:
| Nine months ended September 30, |
||||||||
| 2009 | 2008 | |||||||
| (amounts in thousands) | ||||||||
| Cash provided by operating activities |
$ | 278,203 | $ | 210,044 | ||||
| Cash used in investing activities |
(193,736 | ) | (198,733 | ) | ||||
| Cash (used in) provided by financing activities |
(4,312 | ) | 845 | |||||
| Increase in cash and cash equivalents |
$ | 80,155 | $ | 12,156 | ||||
Operations. Cash provided by operating activities was $278.2 million for the nine months ended September 30, 2009 compared to $210.0 million for the same period in 2008. This increase in cash provided by operating activities primarily related to higher Modified EBITDA, lower interest payments as a result of lower average interest rates on the Term Loan and changes in working capital, primarily due to the timing of payments to vendors. The changes in components of working capital are generally subject to fluctuations based on the timing of cash transactions related to collection of receivables and payments to vendors and employees and interest payments, among other items.
Investing. Cash used in investing activities was $193.7 million for the nine months ended September 30, 2009 compared to $198.7 million for the same period in 2008. The change is primarily a result of decreased capital expenditures resulting from integration capital expenditures in the prior year which did not recur and other investing activities. Cash used for capital expenditures in the nine months ended September 30, 2009 was $194.7 million, the majority of which was used to expand our networks in our existing markets and to reach new customer buildings compared to $201.7 million in the nine months ended September 30, 2008, which included capital expenditures for integration of acquired operations of $7.0 million.
Financing. Cash used in financing activities was $4.3 million for the nine months ended September 30, 2009, primarily for payments on the Term Loan and capital lease obligations. Cash provided by financing activities was $0.8 million for the nine months ended September 30, 2008, primarily from proceeds from the exercise of stock options partially offset by payments on the Term Loan.
As of September 30, 2009, we had outstanding $400 million principal amount of 9 1/4% Senior Notes due 2014 (“2014 Notes”), $373.8 million principal amount of Convertible Debentures due 2026 (“Convertible Debentures”), and $583.5 million under our Term Loan B (“Term Loan”) maturing in January 2013. On January 14, 2009, we amended our Revolver maturing in 2011 (“Revolver”) to terminate $20 million of the original $100 million undrawn Revolver because one of the lenders, a Lehman Brothers affiliate, would be unable to meet its commitment to advance funds as a result of bankruptcy proceedings. As a result, the total revolving commitments of the banks under the undrawn Revolver are $80 million. The interest on the Term Loan is computed based on a specified Eurodollar rate plus a spread of 1.75% to 2.0%, of which 1.75% was in effect at September 30, 2009. On April 30, 2008, we entered into a two year interest rate swap with a 3.23% fixed interest rate that hedges the first $100 million of our $600 million principal amount variable rate Term Loan for a total rate, including the applicable spread, of 4.98% on a notional amount of $100 million. On November 5, 2008, we entered into a three year interest rate swap commencing November 28, 2008 with a 2.96% fixed interest rate that hedges the interest rate on the second $100 million of our variable rate Term Loan resulting in a total rate, including the applicable spread, of 4.71% on a notional amount of $100 million. Based on the weighted average effective interest rate of 3.0% at September 30, 2009, aggregate annual interest payments on $583.5 million of borrowings outstanding under the Term Loan, including the interest rate swaps in effect, would be $17.7 million. Aggregate annual interest payments on the 2014 Notes and the Convertible Debentures are $37.0 million and $8.9 million, respectively.
40
Table of Contents
tw telecom inc.
In order to reduce future cash interest payments, as well as future amounts due at maturity or mandatory redemption and reduce our leverage, we or our affiliates may, from time to time, enter into additional interest rate swap agreements or purchase our outstanding 2014 Notes or Convertible Debentures for cash or equity securities in the open market or privately negotiated transactions or engage in other transactions to reduce the principal amount of outstanding 2014 Notes or Convertible Debentures. Under the terms of our Revolver, which is more restrictive than our Term Loan or the indenture for the 2014 Notes, we currently may repurchase a portion of our 2014 Notes or Convertible Debentures if we meet a minimum current liquidity test of $300 million and other tests and do not use the Revolver proceeds for this purpose. In addition, we may consider repurchasing shares of our common stock in public or private transactions. Our Revolver would permit a repurchase of up to $50 million of our common stock in the aggregate if after the transaction we have a minimum of $225 million in cash and cash equivalents and meet certain other conditions. This test under the Revolver is more restrictive than our other debt agreements. We also have the right to prepay our Term Loan in whole or in part. We will evaluate any such transactions in light of market conditions, taking into account our liquidity and prospects for future access to capital, benefits to us of any such transaction and contractual constraints.
The following diagram summarizes our corporate structure in relation to our outstanding indebtedness and undrawn revolver as of September 30, 2009. The diagram does not depict all aspects of ownership structure among the operating and holding entities, but rather summarizes the significant elements relative to our debt in order to provide a basic overview.
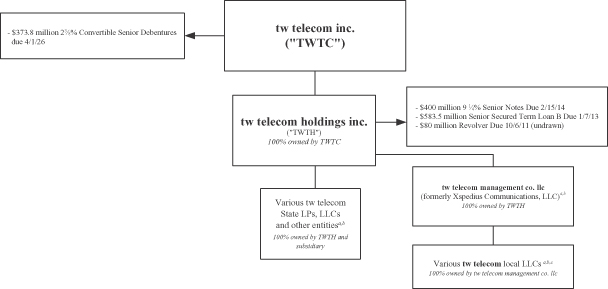
| a | The interests of TWTH in these entities are pledged to secure the Revolver and the Term Loan. |
| b | The assets and limited liability company interests of these subsidiaries are pledged to secure the Revolver and the Term Loan. |
| c | These entities were former Xspedius local limited liability companies (LLCs) that have changed their names to names that include “tw telecom.” Certain of the former Xspedius local LLCs that operated in the same states as existing tw telecom state limited partnerships (LPs) and LLCs were consolidated with the tw telecom local entities through subsidiary mergers. |
41
Table of Contents
tw telecom inc.
Capital Expenditures and Requirements
Our total capital expenditures were $202.5 million for the nine months ended September 30, 2009 compared to $204.0 million for the same period in 2008. We incurred capital expenditures to develop and expand our network, products and systems. The decrease in capital expenditures year over year was primarily due to prior year expenditures that did not recur for expansion of collocation facilities and regional networks, IT enhancements and integration and branding capital expenditures. These decreases were partially offset by increased success-based capital investments, a strategic purchase of fiber assets and other market expansions. Success-based spending consists of short to medium term capital expenditures made primarily to enable revenue producing activities, including costs to connect to new customer locations with our fiber network and increase capacity to our networks, IP backbone and central office infrastructure to serve growing customer demands. Our success-based spending typically fluctuates from quarter to quarter as the volume of our service installations increases or decreases. Since 2005, over 80% of our total annual capital expenditures, excluding integration and branding capital expenditures, were for short to medium term success-based spending. For 2009, we expect total capital expenditures of approximately $275 million (see “Capital Resources” below for discussion on anticipated funding sources), which we expect will be primarily success-based. The remainder of our expected capital expenditures is for strategic market expansion opportunities to further expand our network reach in our existing markets, life cycle expenditures to replace older network components and enhancements to our IT systems to increase efficiencies in our back office operations. We expect that the amount that we must spend to replace older network components, especially electronics, will continue to grow over time. We generally do not make long-term commitments for capital expenditures and have the ability to adjust our capital expenditures if our cash from operations is lower than anticipated or in response to economic conditions.
Capital Resources
Based on current assumptions, we expect to generate sufficient cash from operations along with available cash on hand, including cash equivalents, investments, and borrowing capacity under our Revolver to provide sufficient funds to meet our expected capital expenditure and liquidity needs to operate our business and service our debt for the foreseeable future. We believe that as of September 30, 2009, the absence of significant debt maturities until 2013, the absence of financial maintenance covenants in our outstanding Term Loan, $432.3 million in cash and cash equivalents and an undrawn Revolver, provide us flexibility to make investments that we deem appropriate for ongoing operations. However, if our assumptions prove incorrect or if there are other factors that negatively affect our cash position such as material unanticipated losses, a significant reduction in demand for our products or an acceleration of customer disconnects or other risk factors, we may need to seek additional sources of funds through financing or other means. Due to current or future capital market and credit conditions, we may be unable to obtain such financing on acceptable terms or at all.
Our ability to draw upon the available commitments under our Revolver is subject to compliance with all of the covenants contained in the credit agreement and our continued ability to make certain representations and warranties. In the case of the Revolver, the covenants include financial covenants, such as leverage and interest coverage ratios and limitations on capital expenditures that are primarily derived from Modified EBITDA and debt levels. We are required to comply with these ratios as a condition to any borrowing under the Revolver and for as long as any loans are outstanding under the Revolver. The representations and warranties include the absence of liens on our properties other than certain permitted liens, the absence of litigation or other developments that have or could reasonably be expected to have a material adverse effect on us and our subsidiaries as a whole, and continued effectiveness of the documents granting security for the loans.
A lack of revenue growth or an inability to control costs could negatively impact Modified EBITDA and cause our failure to meet the required minimum ratios under the Revolver. Although we currently believe that we will continue to be in compliance with the covenants, various factors, including further deterioration of the economy, increased competition and loss of revenue from consolidation of large telecommunication companies,
42
Table of Contents
tw telecom inc.
an acceleration of customer disconnects, a significant reduction in demand for our services without adequate reductions in capital expenditures and operating expenses, or an uninsured catastrophic loss of physical assets or other risk factors, could cause us to fail to meet our covenants. If our revenue growth is not sufficient to sustain the Modified EBITDA performance required to meet the debt covenants described above, and we have loans outstanding under the Revolver or wish to draw on it, we would have to consider cost cutting or other measures to maintain required Modified EBITDA levels or to enhance liquidity.
The Revolver and Term Loan limit our ability to declare cash dividends, incur indebtedness, incur liens on property, and undertake acquisitions. The Revolver and Term Loan also include cross default provisions under which we are deemed to be in default if we default under any of our other material outstanding obligations, such as our 2014 Notes. In addition, each group of lenders under the Revolver and Term Loan may require a prepayment if a change of control occurs as defined in the Revolver and Term Loan agreements. If we do not comply with the covenants, we would not be able to draw funds under the Revolver or the lenders could cancel the Revolver unless the lenders agree to further modify the covenants. If we are in default under any of the covenants, we also could potentially be subject to an acceleration of the repayment date of the Term Loan and the Revolver if we have borrowed under that facility. Although we believe our relationships with our lenders are good, there is no assurance that we would be able to obtain the necessary covenant modifications on acceptable terms or at all. The current tightening of the credit markets may make such modifications more difficult to obtain than in the past. If our plans or assumptions change or prove to be inaccurate, or the foregoing sources of funds prove to be insufficient to fund our growth and operations, or if we consummate acquisitions or joint ventures, we would be required to seek additional capital. Additional sources of financing may include public or private debt, equity financing by us or our subsidiaries, or other financing arrangements. There is no assurance that we would be able to obtain additional financing on terms acceptable to us or at all, especially in the current credit environment where traditional sources of financing may not be as readily available to us as in the past. Other risk factors, such as a rating downgrade could further impact our potential access to financing sources.
Our revenue and costs are partially dependent upon factors that are outside our control, such as general economic conditions, regulatory changes, adverse changes in customers’ financial condition, changes in technology, and increased competition. Due to the uncertainty of these and other factors, actual revenue and costs may vary from expected amounts, possibly to a material degree, and these variations would likely affect the level of our future capital expenditures and expansion plans.
As of September 30, 2009, our cash and cash equivalents were held in financial institutions and U.S. treasury money market mutual funds. We are exposed to risks resulting from deterioration in the financial condition of financial institutions holding our cash deposits, decisions of the investment managers of the money market funds and defaults in securities underlying the funds. We actively monitor the depository institutions and the performance of the mutual funds that hold our cash and cash equivalents. Since the beginning of the current financial downturn, we have prioritized safety over investment return in choosing the investment vehicles for cash and cash equivalents and diversified these investments to the extent practical to minimize our exposure to any one mutual fund or financial institution. We may change the nature of our cash and cash equivalent investments as market conditions change.
Commitments. Our long-term commitments have not materially changed from those disclosed in our Annual Report on Form 10-K for the year ended December 31, 2008.
Effects of Inflation
Historically, inflation has not had a material effect on us.
43
Table of Contents
tw telecom inc.
| Item 3. | Quantitative and Qualitative Disclosures About Market Risk |
Our interest income is sensitive to changes in the general level of interest rates. In this regard, changes in interest rates can affect the interest earned on our cash and cash equivalents. Based on our cash and cash equivalents of $432.3 million at September 30, 2009, a one-percent change in the interest rate would change the annual interest earned by $4.3 million. At September 30, 2009, investments included in cash and cash equivalents were comprised of U.S. treasury money market funds. Since the beginning of the current financial downturn, we have prioritized safety over investment return in choosing the investment vehicles for cash and cash equivalents and diversified these investments to the extent practical to minimize our exposure to any one mutual fund or financial institution. We may change the nature of our cash and cash equivalent investments as market conditions change.
At September 30, 2009, we held commercial paper investments purchased in 2007 with a carrying value of $3.0 million with exposure to sub-prime mortgages that were past their maturity dates. These securities are classified as long-term investments in the September 30, 2009 condensed consolidated balance sheet.
We have fixed and variable rate debt. Our exposure to variable rate debt is from changes in the Eurodollar rate as interest on the Term Loan varies based on a specified Eurodollar rate. We have entered into interest rate swap agreements to mitigate interest fluctuations on our variable rate Term Loan. On April 30, 2008, we entered into a two year interest rate swap with a 3.23% fixed interest rate that hedges the interest rate on the first $100 million of our variable rate Term Loan resulting in a total rate, including the applicable spread as of September 30, 2009, of 4.98% on a notional amount of $100 million. On November 5, 2008, we entered into a three year interest rate swap commencing November 28, 2008 with a 2.96% fixed interest rate that hedges the interest rate on the second $100 million of our variable rate Term Loan resulting in a total rate, including the applicable spread as of September 30, 2009, of 4.71% on a notional amount of $100 million. Variable rate debt instruments represented approximately 28% of our total debt at both September 30, 2009 and December 31, 2008. As of September 30, 2009, based on the $583.5 million outstanding balance on the Term Loan and the interest rate swaps in effect, a one-percent change in the applicable rate would change the annual amount of interest we pay by $3.8 million.
At September 30, 2009, the fair values of our fixed rate Term Loan, 2014 Notes and our Convertible Debentures were $561.6 million, $411.0 million and $362.1 million, respectively, as compared to carrying values of $583.5 million, $400.2 million and $304.7 million, respectively, each on the same date. These notes and debentures are not listed on any securities exchange or inter-dealer automated quotation systems, and the estimated market value is based on indicative pricing published by investment banks. While we believe these approximations to be reasonably accurate at the time published, indicative pricing can vary widely depending on volume traded by any given investment bank and other factors.
| Item 4. | Controls and Procedures |
As of September 30, 2009, an evaluation was performed under the supervision and with the participation of our management, including the Chief Executive Officer and Chief Financial Officer, of the effectiveness of the design and operation of our disclosure controls and procedures, as defined in Securities Exchange Act Rules 13a-15(e) and 15d-15(e). Based on that evaluation, our management, including the Chief Executive Officer and Chief Financial Officer, concluded that our disclosure controls and procedures were effective as of September 30, 2009.
There were no changes in our internal control over financial reporting that occurred during the three months ended September 30, 2009 that have materially affected, or are reasonably likely to materially affect, our internal control over financial reporting.
44
Table of Contents
tw telecom inc.
| Item 1. | Legal Proceedings |
We are party to various claims and regulatory proceedings in the ordinary course of business. We do not believe that these claims or proceedings, individually or in the aggregate, are material or will have a material adverse effect on our business, financial condition or results of operations.
| Item 2. | Unregistered Shares of Equity Securities and Use of Proceeds |
The following table presents our purchases of equity securities reportable under Item 703 of Regulation S-K:
ISSUER PURCHASES OF EQUITY SECURITIES
| Period |
(a) Total Number of Shares (or Units) Purchased (1) |
(b) Average Price Paid per Share (or Unit) |
(c) Total Number of Shares (or Units) Purchased as Part of Publicly Announced Plans or Programs |
(d) Maximum Number (or Approximate Dollar Value) of Shares (or Units) that May Yet Be Purchased Under the Plans or Programs | |||||
| July 1—July 31, 2009 |
— | $ | — | — | — | ||||
| August 1—August 31, 2009 |
12,514 | 11.54 | — | — | |||||
| September 1—September 30, 2009 |
— | — | — | — | |||||
| Total |
12,514 | $ | 11.54 | — | — | ||||
| (1) | Consists of restricted shares delivered back to us by certain employees to satisfy tax withholding obligations that arise upon the vesting of restricted stock. Pursuant to our equity compensation plans, we give certain employees the opportunity to tender back to us the number of shares from the award sufficient to satisfy the person’s minimum tax withholding obligation on behalf of the employee. We do not have any publicly announced equity securities repurchase plans or programs. |
(a) Indemnification Agreements
Our Board of Directors approved and we have entered into effective November 4, 2009 a new form of indemnification agreement (the “New Indemnification Agreement”) with directors, executive officers, other Board-elected officers and certain other management employees.
For our current directors who had entered into a previous form of indemnification agreement, the entry into the New Indemnification Agreement will amend and restate the previous agreements. As is the case with the previous form of indemnification agreement, the New Indemnification Agreements commit us to indemnify the indemnitee to the fullest extent permitted under Delaware law and require us to make advance payments of expenses to indemnitees subject to the terms and conditions of the New Indemnification Agreements. All of the directors’ New Indemnification Agreements are in the same form and all of the officers’ New Indemnification Agreements are in the same form. The New Indemnification Agreements for the directors changed some of the mechanics of the advancement of expenses, limit our ability to adversely amend the indemnification provisions of our bylaws after a director terminates service and require us to maintain directors’ and officers’ liability insurance covering the indemnitees subject to the terms and conditions of the agreements. The officers’ New Indemnification Agreements are substantially the same as the directors’ amended forms. The preceding summary of the New Indemnification Agreements is qualified in its entirety by reference to the complete text of the forms of the New Indemnification Agreements, which are filed as Exhibits 10.1 and 10.2 to this report.
45
Table of Contents
tw telecom inc.
(b) Employment Agreement and Change of Control Employment Agreement with Larissa Herda
We entered into a new Employment Agreement and Change of Control Employment Agreement with our Chairman, Chief Executive Officer and President, Larissa Herda, effective November 4, 2009. These agreements replace her Employment Agreement that expired November 1, 2009.
Employment Agreement
The Employment Agreement has a three year term that automatically renews after the initial term for successive two year terms unless either party notifies the other of non-renewal at least 60 days prior to the end of the term or renewal term. The Employment Agreement does not change Ms. Herda’s current base salary of $850,000 or her annual incentive target of 175% of base salary.
Termination With and Without Cause. If we terminate Ms. Herda’s employment other than for Cause, as defined in the employment agreement, she is entitled to a lump sum severance payment, contingent upon releasing us of all claims, equal to 2.99 times her then current base salary and target short term incentive amount, plus certain payments in lieu of 18 months of premiums for health care continuation coverage. In such case, she is bound by non-competition and non-solicitation covenants for 18 months. If we terminate Ms. Herda’s employment for Cause, she will only receive earned and unpaid base salary accrued through the date of termination.
Termination for Disability or Death. We may terminate Ms. Herda’s employment for a disability if she is absent from her duties with us for 180 consecutive days or any 180 days within any 12 month period. If we do so, we must pay her a lump sum equal to 75% of her base salary and target short term incentive amount for 18 months.
If Ms. Herda dies during the term of her agreement, her estate or beneficiaries would receive a payment equal to her base salary for 30 days following the date of death and an amount equal to her target bonus prorated to the date of death, in addition to any other benefits payable to her beneficiaries or estate under the provision of any of our benefit plans.
Change of Control Employment Agreement
The change of control employment agreement with Ms. Herda becomes effective when a Change of Control, as defined in the agreement, occurs and supersedes her employment agreement. The agreement provides for Ms. Herda to be employed by us or our successor for a new term beginning with the Change of Control and continuing for 18 months in a position commensurate with that held by her prior to the Change of Control at a base salary equal to no less than the highest monthly salary during the prior 12 month period multiplied by 12. If a Change of Control occurs and within 18 months thereafter Ms. Herda is terminated by us or our successor without Cause, as defined in the agreement, or she terminates her employment for Good Reason, as defined in the agreement, she is entitled to
| (i) | a lump sum severance payment equal to 2.99 times base salary and target short term incentive amount, |
| (ii) | a prorated target short term incentive for the year in which the Change of Control occurs, and |
| (iii) | certain payments in lieu of health care continuation coverage. |
The payment is subject to the six-month delay mandated by IRC Section 409A, if applicable.
Change of Control, as used in the agreement, means that
| (i) | an individual, entity or group becomes the beneficial owner of 25% or more of our outstanding common stock, |
46
Table of Contents
tw telecom inc.
| (ii) | the current members of our Board, or persons who were approved by a majority of the current members of the Board, cease to constitute a majority of the Board, or |
| (iii) | consummation of a merger, share exchange or sale of substantially all of our assets where we are not the surviving company or the events described in (i) or (ii) above occur. |
Good Reason is defined under the change of control employment agreements as:
| • | the assignment to Ms. Herda of any substantial duties that are substantively inconsistent with her position, authority or responsibilities prior to the Change of Control; |
| • | a requirement to perform services at an office more than 35 miles from her location prior to the Change of Control or at a location other than our principal offices; |
| • | a requirement to travel to a substantially greater degree; |
| • | our breach of any of the material compensation provisions of the agreement; |
| • | the failure of any successor company to assume obligations under the agreement; or |
| • | our purported termination of the agreement other than as permitted. |
The preceding summary of the Employment Agreement and Change of Control Employment Agreement with Larissa Herda is qualified in its entirety by reference to the complete text of the agreements, which are filed as Exhibits 10.3 and 10.4 to this report.
| (c) | Amendments to Change of Control Employment Agreements with three executives |
Effective November 4, 2009, the Company amended its Change of Control Employment Agreements with John Blount, Chief Operating Officer, Mark Peters, Executive Vice President and Chief Financial Officer and Paul Jones, Executive Vice President, General Counsel and Regulatory Policy, to eliminate a provision that provided each of them the right during a 30-day period beginning on the one year anniversary of a Change of Control to terminate his employment for any reason and receive the severance payments provided for in his agreement, as described in the Company’s Definitive Proxy Statement dated April 27, 2009 under “Agreements with Other Named Executives- Change of Control Employment Agreements.” Also, the amendments change from 13 months to 18 months the period following a Change of Control during which each executive is entitled to those severance payments if he is terminated by us or our successor without Cause, or he terminates his employment for Good Reason. Both Cause and Good Reason are defined in the agreements similarly to the definition in Ms. Herda’s Change of Control Employment Agreement described above.
The preceding summary of the Amendments to the Change of Control Employment Agreements with John Blount, Mark Peters and Paul Jones is qualified in its entirety by reference to the complete text of the agreements, which are filed as Exhibits 10.5, 10.6 and 10.7 to this report.
| Item 6. | Exhibits |
The exhibits listed on the accompanying Exhibit Index are filed or incorporated by reference as part of this report and the Exhibit Index is incorporated herein by reference.
47
Table of Contents
Signature
Pursuant to the requirements of the Securities Exchange Act of 1934, the Registrant has duly caused this report to be signed on its behalf by the undersigned thereunto duly authorized.
| tw telecom inc. | ||||
| Date: November 6, 2009 | By: | /s/ JILL R. STUART | ||
| Jill R. Stuart Sr. Vice President, Accounting and Finance and Chief Accounting Officer | ||||
48
Table of Contents
EXHIBIT INDEX
| Exhibit |
Description of Exhibit | |
| 3.1 – | Restated Certificate of Incorporation of the Company (filed as Exhibit 3.1 to the Company’s Quarterly Report on Form 10-Q for the quarter ended June 30, 2007)* | |
| 3.2 – | Certificate of Amendment to Restated Certificate of Incorporation of the Company (filed as Exhibit 3.2 to the Company’s Quarterly Report on Form 10-Q for the quarter ended March 31, 2008)* | |
| 3.3 – | Amended By-laws of the Company (filed as Exhibit 99.1 to the Company’s Current Report on Form 8-K dated September 17, 2007)* | |
| 4.1 – | Indenture between Time Warner Telecom Holdings Inc., Time Warner Telecom Inc., Subsidiary Guarantors parties thereto and Wells Fargo Bank, National Association, as Trustee for 9 1/4% Senior Notes due 2014 (filed as Exhibit 4.7 to the Company’s Annual Report on Form 10-K for the year ended December 31, 2004)* | |
| 4.2 – | Indenture dated as of March 29, 2006 between Time Warner Telecom Inc. and Wells Fargo Bank, National Association, as Trustee (filed as Exhibit 4.1 to the Company’s Quarterly Report on Form 10-Q for the quarter ended March 31, 2006)* | |
| 4.3 – | First Supplemental Indenture dated as of March 29, 2006 between Time Warner Telecom Inc. and Wells Fargo Bank, National Association, creating 2.375% Convertible Senior Debentures due 2026 (filed as Exhibit 4.2 to the Company’s Quarterly Report on Form 10-Q for the quarter ended March 31, 2006)* | |
| 4.4 – | Credit Agreement dated October 6, 2006 between Time Warner Telecom Inc., Time Warner Telecom Holdings Inc., the Several Lenders from Time to Time Party thereto, Lehman Commercial Paper Inc., as syndication agent, Bank of America, N.A., as documentation agent and Wachovia Bank, National Association, as administrative agent and as collateral agent (filed as Exhibit 99.1 to the Company’s Current Report on Form 8-K dated October 11, 2006)* | |
| 4.5 – | Commitment Reduction Agreement dated as of January 14, 2009 among tw telecom inc., tw telecom holdings inc., the Revolving Lenders and Wachovia Bank, National Association, as Administrative Agent (filed as Exhibit 4.5 to the Company’s Quarterly Report on Form 10-Q for the quarter ended March 31, 2009)* | |
| 4.6 – | Certification of Designations of Series A Junior Participating Preferred Stock of tw telecom inc. (filed as Exhibit 4.6 to the Company’s Quarterly Report on Form 10-Q for the quarter ended March 31, 2009)* | |
| 4.7 – | Rights Agreement dated as of January 20, 2009 between tw telecom inc. and Wells Fargo Bank, National Association, as Trustee (filed as Exhibit 4.1 to the Company’s Current Report on Form 8-K dated January 20, 2009).* | |
| 10.1 – | Form of Indemnification Agreement dated as of November 4, 2009 between the Company and each of its directors.** | |
| 10.2 – | Form of Indemnification Agreement dated as of November 4, 2009 between the Company and each of its executive officers.** | |
| 10.3 – | Employment Agreement dated November 4, 2009 between the Company and Larissa Herda.** | |
| 10.4 – | Change of Control Employment Agreement dated November 4, 2009 between the Company and Larissa Herda.** | |
| 10.5 – | Amendment #1 dated November 4, 2009 to Change of Control Employment Agreement between the Company and John Blount** | |
49
Table of Contents
| Exhibit |
Description of Exhibit | |
| 10.6 – | Amendment #1 dated November 4, 2009 to Change of Control Employment Agreement between the Company and Mark Peters** | |
| 10.7 – | Amendment #1 dated November 4, 2009 to Change of Control Employment Agreement between the Company and Paul Jones** | |
| 31.1 – | Certification of Chief Executive Officer pursuant to Item 601(b)(31) of Regulation S-K, as adopted pursuant to Section 302 of the Sarbanes-Oxley Act of 2002 | |
| 31.2 – | Certification of Chief Financial Officer pursuant to Item 601(b)(31) of Regulation S-K, as adopted pursuant to Section 302 of the Sarbanes-Oxley Act of 2002 | |
| 32.1 – | Certification of Chief Executive Officer pursuant to 18 U.S.C. Section 1350, as adopted pursuant to Section 906 of the Sarbanes-Oxley Act of 2002 | |
| 32.2 – | Certification of Chief Financial Officer pursuant to 18 U.S.C. Section 1350, as adopted pursuant to Section 906 of the Sarbanes-Oxley Act of 2002 | |
| * | Incorporated by reference |
| ** | Management contract or compensation plan or arrangement |
50