Attached files
| file | filename |
|---|---|
| 8-K - FORM 8-K - VALLEY NATIONAL BANCORP | d8k.htm |
 Investor Presentation EXHIBIT 99.1 |
 2 This presentation contains forward-looking statements concerning Valley’s
future business outlook, financial condition and operating results. Generally, the words "will," "may," "should," "continue," "believes," "expects," "anticipates" or similar expressions
identify forward-looking statements. Readers are advised not to place undue reliance on these forward looking statements as they are influenced by certain risk factors and unpredictable events. The foregoing contains forward-looking statements within the meaning of the Private
Securities Litigation Reform Act of 1995. Such statements are not
historical facts and include expressions about management’s confidence
and strategies and management’s expectations about new and existing programs and products, relationships, opportunities, taxation, technology and market
conditions. These statements may be identified by such forward-looking terminology as “expect,” “believe,” “view,” “opportunity,” “allow,” “continues,” “reflects,” “typically,” “usually,” “anticipate,” or similar statements or variations of such terms. Such forward-looking statements
involve certain risks and uncertainties. Actual results may differ
materially from such forward-looking statements. Factors that may cause
actual results to differ materially from those contemplated by such forward-looking statements include, but are not limited to those factors disclosed in Valley’s
Annual Report on Form 10-K for the year ended December 31, 2008 and its
subsequent Quarterly Reports on Form 10-Q. Valley disclaims any
obligation to update or revise forward-looking statements for any reason. Information For Investors And Shareholders |
 3 Valley National Bank Today Regional Bank Holding Company Over $14.2 Billion in Assets Headquartered in Wayne, New Jersey 37 th Largest United States Chartered Commercial Bank Largest Commercial Bank Headquartered in New Jersey Operates 199 Branches in 135 Communities Serving 14 counties throughout Northern and Central New Jersey, Manhattan, Brooklyn and Queens Big Bank – Act Like Small Privately Owned Company Sound Asset Quality Strong Financial Performance Consistent Shareholder Returns Traded on the NYSE (VLY) |
 4 Executive Management Office of the Chairman Seven senior executives offering strong senior management succession Tenured at Valley for a combined 147 years 21 years on average Backgrounds include: Regulatory experience CEOs of acquired financial institutions Senior executives with national exposure working for local NJ/NY companies Mortgage banking & thrift experience |
 5 Valley’s Emerging NJ Market Valley’s Core NJ Market Branches Under Construction Current Branches Footprint & Demographics Valley’s Core New Jersey Market Total Market Deposits - $87.7 billion Market Average Deposits per Branch $76.0 million Valley Branches – 136 Branches Under Construction – 1 Valley’s Market Share – 6.63% Valley’s Emerging New Jersey Market Total Market Deposits - $57.1 billion Market Average Deposits per Branch $68.2 million Existing Valley Branches – 38 Branches Under Construction – 4 Valley’s Market Share – 1.59% Source: SNL Financial Inc. as of 06/2009 Headquarters $245 billion $73,077 8.8 million NJ Total $74 billion $61,436 2.9 million Balance of NJ Marketplace $171 billion $78,074 5.9 million Valley’s NJ Marketplace Total Market Deposits Median HH Income Population Region Valley’s NJ Marketplace |
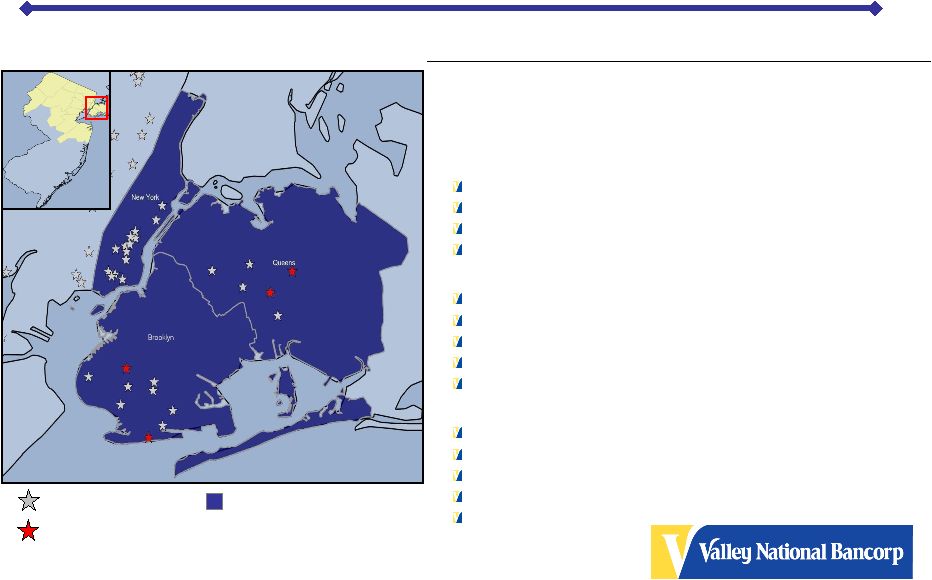 6 Footprint & Demographics Valley’s Emerging Manhattan Market Total Market Deposits - $418.3 billion Market Average Deposits per Branch $621.6 million Existing Valley Branches – 14 Valley’s Market Share – 0.28% Valley’s Emerging Queens Market Total Market Deposits - $41.3 billion Market Average Deposits per Branch $96.3 million Existing Valley Branches – 4 Branches Under Construction - 2 Valley’s Market Share – 0.17% Valley’s Emerging Brooklyn/Kings Market Total Market Deposits - $34.1 billion Market Average Deposits per Branch $99.6 million Existing Valley Branches – 7 Branches Under Construction - 2 Valley’s Market Share – 0.58% Valley’s Emerging NYC Markets Branches Under Construction Current Branches Source: SNL Financial Inc. as of 06/2009 $288 billion $52,640 13.0 million Balance of NY Marketplace $781 billion $52,893 19.5 million NY Total $493 billion $57,864 6.5 million Valley’s NY Marketplace Total Market Deposits Median HH Income Population Region Valley’s NY Marketplace |
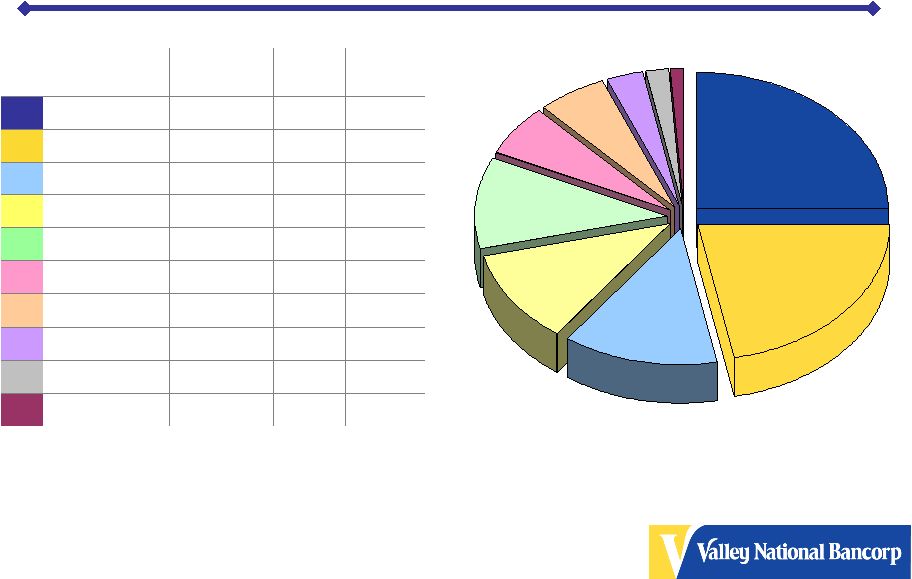
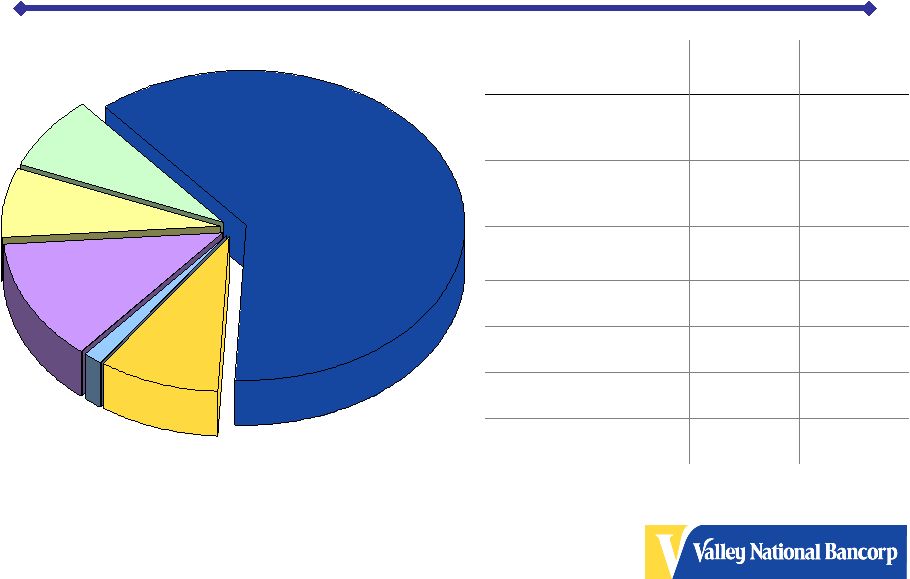
 7 Intangible Assets 2% Other Assets 7% Cash 4% Securities 21% Loans 66% Asset and Loan Composition Total Assets = $14.2 Billion Other Assets includes bank owned branch locations carried at a cost estimated to be $200 million under current market value. As of 09/30/09 Commercial Real Estate 36% Residential Mortgages 21% Commercial Loans 19% Construction Loans 5% Auto Loans 12% Other Consumer 7% Total Loans = $9.5 Billion |
 8 Total Commercial Real Estate - $3,339MM The total CRE loan balance is based on Valley’s internal loan hierarchy
structure and does not reflect loan classifications reported in Valley’s
SEC and bank regulatory reports. Above chart does not include $405 million in Construction loans. As of 9/30/09 45% 1% 19 Other 2% 3% 6% 6% 11% 11% 13% 22% 25% % of Total 58% 53% 50% 63% 46% 47% 54% 55% 51% LTV 359 Mixed Use 355 Apartments 435 Office 741 Industrial 841 Retail 72 Land Loans 87 Residential 211 Specialty 219 Healthcare $ Amount (Millions) Primary Property Type Commercial Real Estate Composition 25% 22% 13% 11% 11% 6% 6% 3% 2% 1% |
 9 28% 21% 17% 12% 6% 6% 4% 4% 2% Total Retail Property Types - $841MM 44% 4% Entertainment Facilities 33% 6% Private & Public Clubs 2% 4% 6% 12% 17% 21% 28% % of Total 56% 52% 50% 53% 57% 53% 50% LTV Auto Dealership Multi-Tenanted - No Anchor Single Tenant Multi-Tenanted - Anchor Retail Property Type Auto Servicing Private Education Facilities Food Establishments Above chart does not include construction loans. As of 9/30/09 Retail Composition of Commercial Real Estate |
 10 CRE Property Valuation Stress Test 100% and Greater Less than 50% 80% - 89% 50% - 79% 90% - 99% 1% 90% to 99% 3% 80% to 89% 58% 50% to 79% 0% 100% and Greater 38% Less than 50% % of Total Portfolio Original LTV Categories 14% 90% to 99% 18% 80% to 89% 38% 50% to 79% 4% 100% and Greater 26% Less than 50% % of Total Portfolio Original LTV Categories LTV ratios do not include construction loans As of 12/31/08 Less than 50% 80% - 89% 50% - 79% 90% - 99% Current LTV 20% Decrease in Property Valuation |
 11 Total Construction Loans - $405MM Construction loan balance is based on Valley’s internal loan hierarchy structure and does not reflect loan classifications reported in Valley’s SEC and bank regulatory reports. As of 9/30/09 15% 8% 4% 3% 2% 1% 1% 1% 52% Construction Loan Composition 1% 5 Specialty 1% 5 Industrial 1% 5 Healthcare 2% 6 Apartments 3% 10 Other 4% 17 Office 8% 32 Retail 13% 54 Land Loans 15% 60 Mixed Use 52% 211 Residential % of Total $ Amount (Millions) Primary Property Type |
 12 0.00% 1.00% 2.00% 3.00% 4.00% 5.00% 6.00% 7.00% Commercial Loans Construction Residential Mortgage Commercial Real Estate Home Equity Automobile 30 Day + Delinquency Trend |
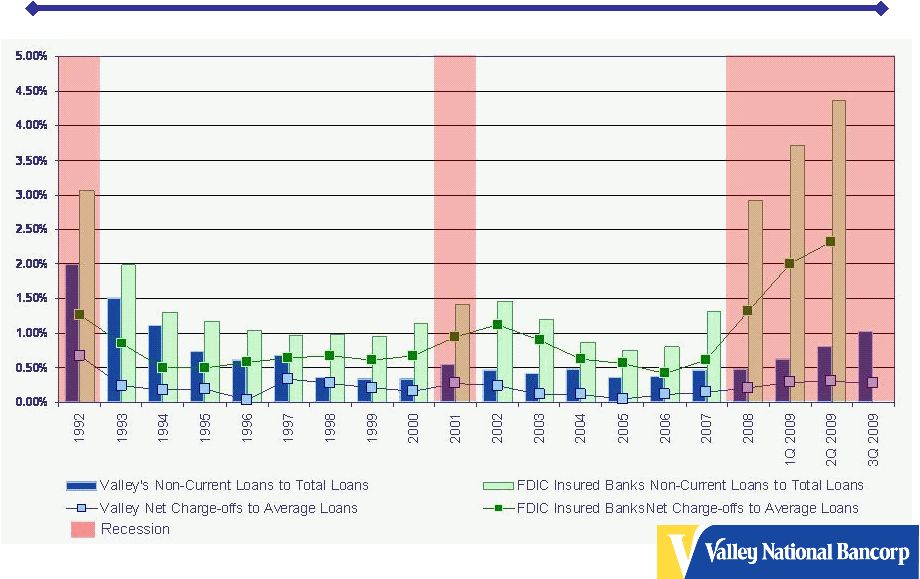 13 Loan Quality 1992 - 2009 Non-Current Loans: Loans and leases 90 days or more past due plus loans in non accrual status, as a percent of gross loans and leases. Source – FDIC Total Loan Portfolio |
 14 Loan Quality 1992 - 2009 Residential Mortgages Valley’s increase between 1993 and 1997 is mainly attributable to acquisitions
Source – FDIC |
 Loan
Quality 1992 - 2009 Valley’s increase between 1993 and 1997 is mainly attributable to acquisitions
Source – FDIC Home Equity 15 |
 16 Net Charge-offs to Average Loans Source - SNL Financial As of 11/4/09 Peer group consists of banks with total assets between $3 billion and $50 billion
2003 - 2008 2009 YTD 0.12% 0.34% 0.40% 1.01% 0.00% 0.21% 0.00% 0.55% 0.24% 0.49% 0.02% 0.11% 0.01% 0.17% 0.00% 0.20% 0.40% 0.60% 0.80% 1.00% 1.20% Net Charge-offs to Average Loans (%) Total Loans Consumer Home Equity Construction & Development Commercial Loans 1-4 Family Peer Group 0.31% 1.17% 1.20% 1.97% 0.00% 0.97% 0.00% 2.76% 0.48% 1.76% 0.01% 0.33% 0.05% 0.85% 0.00% 0.50% 1.00% 1.50% 2.00% 2.50% 3.00% Net Charge-offs to Average Loans (%) Total Loans Consumer Home Equity Construction & Development Commercial Loans Commercial Real Estate 1-4 Family Valley |
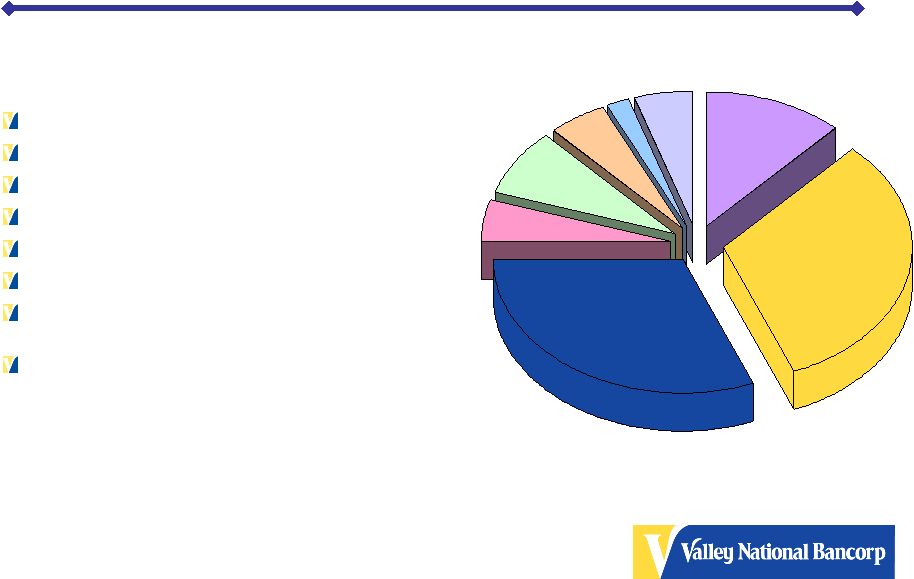 17 Investment Portfolio GSE MBS (GNMA) 32% GSE MBS (FNMA/FHLMC) 31% Single Issuer Trust Preferred 12% State, County, Municipals 8% Private Label MBS 5% Corporate Bonds 5% Other 5% (Fed Reserve & Federal Home Loan Bank) U.S. Treasury 2% Investment Portfolio = $3.0 Billion As of 09/30/09 GSE MBS (GNMA) Other Trust Preferred U.S. Treasury Corporate Bonds State, County, Municipals Private Label MBS GSE MBS (FNMA/FHLMC) |
 18 Securities by Investment Grade AAA Rated 72% AA Rated 5% A Rated 9% BBB Rated 5% Non Investment Grade 3% Not Rated 6% As of 09/30/09 BBB Rated AA Rated A Rated Non Investment Grade Not Rated AAA Rated |
 19 Deposits and Borrowings Composition Total Deposits 73% Other Liabilities 3% Short-term borrowings 1% Long-term borrowings 23% Total Liabilities = $12.9 Billion As of 09/30/09 Savings 43% Non- Interest Bearing 23% Time Deposits 34% Total Deposits = $9.4 Billion |
 20 Equity Composition / Ratios* Tangible Common Equity 62% Preferred Stock 9% Other Equity 1% Trust Preferred 13% Sub-debt 7% LL Reserve 8% Total Tier II Equity = $1.4 Billion Unrealized gain on facilities owned of approximately $200 million over book, not incorporated in capital ratios reflected above. *Non-GAAP reconciliations presented on slides 25 – 27. As of 09/30/09 $5.87 $8.03 8.46% 12.66% 10.77% 8.97% 7.00% As Reported $5.85 $8.02 7.86% 11.74% 9.85% 8.05% 6.32% Without TARP Tangible Book Value Book Value Leverage Tier II Tier I Tangible Common Equity / Risk-Weighted Assets Tangible Common Equity / Tangible Assets Capital Ratios As Reported |
  21 Shareholder Returns Historical Financial Data (1) (Dollars in millions, except for share data) 9/30/2009 14,232 $ 84.0 $ 0.48 $
0.78 % 8.24 % 0.57 $
5/09 - 5% Stock Dividend 2008 14,718 93.6 0.67 0.69 8.74 0.76 5/08 - 5% Stock Dividend 2007 12,749 153.2 1.15 1.25 16.43 0.76 5/07 - 5% Stock Dividend 2006 12,395 163.7 1.21 1.33 17.24 0.74 5/06 - 5% Stock Dividend 2005 12,436 163.4 1.23 1.39 19.17 0.72 5/05 - 5% Stock Dividend 2004 10,763 154.4 1.22 1.51 22.77 0.70 5/04 - 5% Stock Dividend 2003 9,873 153.4 1.21 1.63 24.21 0.66 5/03 - 5% Stock Dividend 2002 9,148 154.6 1.17 1.78 23.59 0.63 5/02 - 5:4 Stock Split 2001 8,590 135.2 0.99 1.68 19.70 0.59 5/01 - 5% Stock Dividend 2000 6,426 106.8 0.95 1.72 20.28 0.56 5/00 - 5% Stock Dividend 1999 6,360 106.3 0.89 1.75 18.35 0.53 5/99 - 5% Stock Dividend 1998 5,541 97.3 0.86 1.82 18.47 0.48 5/98 - 5:4 Stock Split 1997 5,091 85.0 0.78 1.67 18.88 0.41 5/97 - 5% Stock Dividend 1996 4,687 67.5 0.69 1.47 17.23 0.37 5/96 - 5% Stock Dividend 1995 4,586 62.6 0.63 1.40 16.60 0.35 5/95 - 5% Stock Dividend 1994 3,744 59.0 0.70 1.60 20.03 0.34 5/94 - 10% Stock Dividend 1993 3,605 56.4 0.68 1.62 21.42 0.27 4/93 - 5:4 Stock Split 1992 3,357 43.4 0.53 1.36 19.17 0.24 4/92 - 3:2 Stock Split 1991 3,055 31.7 0.39 1.29 15.40 0.23 1990 2,149 28.6 0.35 1.44 14.54 0.23 1989 1,975 36.0 0.44 1.92 19.93 0.22 Year End Total Assets Net Income (2) Common Stock Splits and Dividends Diluted Earnings Per Common Share Return on Average Assets Return on Average Equity Cash Dividends Declared Per Common Share (1) All per share amounts have been adjusted retroactively for stock
splits
and stock
dividends during the periods presented (2) 9/30/2009, 2008 and 2007 include $3.3 million, $9.9 million and $10.4 million, respectively, of after tax other than temporary impairment charges on investment securities.
|
 22 Shareholder Returns 41% -29% -35% -27% -48% -49% -22% -31% -26% -80% -60% -40% -20% 0% 20% 40% 60% 10 Year Total Return 5 Year Total Return 1 Year Total Return VLY S&P 400 Bank Index KBW Bank Index Source: Bloomberg 10 yr, 5yr and 1yr total returns through 10/30/09 |
 23 Valley’s 3Q 2009 Highlights Credit Quality Total 30+ day delinquencies were 1.60% of entire loan portfolio Out of approximately 23,000 residential mortgages and home equity loans, on average, only 211 loans were past due 30 days or more Net charge-offs were only $10.0 million or 0.42% of average total loans on an
annualized basis Total non-performing loans were only 0.78% of total loans Net Income 3Q net income was $31.6 million $6.0 million in accrued preferred stock dividends and accretion ($0.04 EPS*) $2.8 million non-cash charge on change in fair value of Valley’s junior
subordinated debt ($0.01 EPS*) Capital Completed our “at-the-market” common equity offering of 5.67 million shares for net proceeds totaling $71.6 million. Repurchased $125 million ($200 million total) of our TARP preferred stock reducing
the total outstanding balance to $100 million. Continued strong capital ratios Tangible Common Equity to Risk-Weighted Assets of 8.97% *Earnings per common share |
 24 For More Information Log onto our web site: www.valleynationalbank.com Visit our kids site: www.vnbkids.com E-mail requests to: dgrenz@valleynationalbank.com Call Shareholder Relations at: (973) 305-3380 Write to: Valley National Bank 1455 Valley Road Wayne, New Jersey 07470 Attn: Dianne M. Grenz, First Senior Vice President Director of Marketing, Shareholder & Public Relations Log onto our website above or www.sec.gov to obtain free copies of documents filed by Valley with the SEC |
 25 Appendix The subsequent tables present a non-GAAP reconciliation of the following calculations with and without TARP (where applicable): Tangible Common Equity to Tangible Assets Tangible Common Equity to Risk Weighted Assets Tangible Book Value Book Value Tier I Risk Based Capital Ratio Tier II Risk Based Capital Ratio Leverage Capital Ratio |
 26 Non-GAAP disclosure reconciliations ($ in Thousands) 8.05% 8.97% TCE / RWA 6.32% 7.00% TCE / TA Ratios $10,859,587 $10,859,587 Risk Weighted Assets 874,223 974,223 Total Tangible Shareholder’s Equity (100,000) TARP (309,879) (309,879) Intangible Assets Less: $1,284,102 $1,284,102 Total Equity 13,821,991 13,921,991 Total Tangible Assets -309,879 -309,879 Intangible Assets 10,184 10,184 Add: Servicing Intangibles (24,365) (24,365) Intangible Assets (295,698) (295,698) Goodwill Less: $14,131,870 $14,231,870 Total Assets Without TARP As Reported *All data as of 09/30/09 $5.85 $5.87 Tangible Book Value $864,039 $866,414 Tangible shareholders’ equity for book value purposes (320,063) (320,063) Less: Average goodwill and other intangible assets 0 (97,625) Less: Preferred stock (net of discount) $1,184,102 $1,284,102 Shareholders’ equity 147,670,080 147,670,080 Common Shares outstanding Tangible book value per common share $8.02 $8.03 Book Value $1,184,102 $1,186,477 Net Equity Available 0 (97,625) Less: Preferred Stock (net of discount) $1,184,102 $1,284,102 Shareholders’ Equity 147,670,080 147,670,080 Common Shares Outstanding Book Value Calculation Without TARP As Reported 0 |
 27 Non-GAAP disclosure reconciliations ($ in Thousands) 11.74% 12.66% Tier II Ratio w/out TARP 10,859,587 10,859,587 Risk Weighted Assets 1,274,943 1,374,943 Adjusted Tier II Equity (100,000) 0 Less: TARP $1,374,943 $1,374,943 Reported Tier II Equity TIER II Ratio Calculation 9.85% 10.77% Tier I Ratio w/out TARP $10,859,587 $10,859,587 Risk Weighted Assets 1,069,889 1,169,889 Adjusted Tier I Equity (100,000) 0 Less: TARP $1,169,889 $1,169,889 Reported Tier I Equity TIER I Ratio Calculation Without TARP As Reported *All data as of 09/30/09 7.86% 8.46% Leverage Ratio w/out TARP 1,069,889 1,169,889 Adjusted Tier I Equity (100,000) 0 Less: TARP $1,169,889 $1,169,889 Reported Tier I Equity 13,606,948 13,824,256 Adjusted Average Assets (217,308) 0 Less: TARP (Average for Period) $13,824,256 $13,824,256 Reported Average Assets Leverage Ratio Calculation Without TARP As Reported |