Attached files
| file | filename |
|---|---|
| 8-K - FORM 8-K - PNC FINANCIAL SERVICES GROUP, INC. | d8k.htm |
 The PNC
Financial Services Group, Inc. BancAnalysts Association of Boston November 6, 2009 Exhibit 99.1 |
 2 Cautionary Statement Regarding Forward-Looking Information and Adjusted Information This presentation includes “snapshot” information about PNC used by way of
illustration. It is not intended as a full business or financial review and should be viewed in the context of all of the information made available by PNC in its SEC
filings. The presentation also contains forward-looking statements regarding
our outlook or expectations relating to PNC’s future business, operations, financial condition, financial performance, capital and liquidity levels, and asset quality. Forward-looking statements are necessarily subject
to numerous assumptions, risks and uncertainties, which change over time. The forward-looking statements in this presentation are qualified by the factors affecting
forward-looking statements identified in the more detailed Cautionary Statement
included in the Appendix, which is included in the version of the presentation materials posted on our corporate website at www.pnc.com/investorevents. We provide greater detail regarding some of these factors in our
2008 Form 10-K and 2009 Form 10-Qs, including in the Risk Factors and Risk
Management sections of those reports, and in our other SEC filings (accessible on the SEC’s website at www.sec.gov and on or through our corporate website at www.pnc.com/secfilings). We have included web addresses here
and elsewhere in this presentation as inactive textual references only.
Information on these websites is not part of this document. Future events or circumstances may change our outlook or expectations and may also affect the
nature of the assumptions, risks and uncertainties to which our forward-looking
statements are subject. The forward-looking statements in this presentation speak only as of the date of this presentation. We do not assume any duty and do not undertake to update those statements. In this presentation, we may refer to adjusted results to help illustrate the impact of certain
types of items. This information supplements our results as reported in
accordance with GAAP and should not be viewed in isolation from, or a substitute for, our GAAP results. We believe that this additional information and the reconciliations we provide may be useful to investors, analysts, regulators and
others as they evaluate the impact of these items on our results for the periods
presented. In certain discussions, we may also provide information on yields and margins for all
interest-earning assets calculated using net interest income on a taxable-equivalent basis by increasing the interest income earned on tax-exempt assets to
make it fully equivalent to interest income earned on taxable investments. We
believe this adjustment may be useful when comparing yields and margins for all earning assets. This presentation may also include discussion of other non-GAAP financial measures, which, to
the extent not so qualified therein or in the Appendix, is qualified by GAAP
reconciliation information available on our corporate website at www.pnc.com under “About PNC–Investor Relations.” |
 3 Key Messages Overview of PNC The changing credit markets PNC’s credit book Opportunities from PNC’s perspective PNC Is Well-Positioned to Take Advantage of Opportunities in the Marketplace. |
 4 Residential Mortgage Footprint covering nearly 1/3 of the U.S. population Retail A Powerful Franchise (offices in 21 countries) BlackRock CO TX KS OK Global Investment Servicing (international offices) A leading provider of processing, technology and business solutions to the global investment industry Corporate & Institutional A leader in serving middle- market customers and government entities Asset Management One of the largest bank-held asset managers in the U.S. One of the nation’s largest mortgage platforms 7 th $271 billion Assets U.S. Rank 3Q09 6,463 2,553 $184 billion 5 th ATMs 5 th Branches 5 th Deposits (1) Source: SNL DataSource. Amounts and rankings as of quarter end. PNC Overview 1 |
 5 3Q09 Performance Review Our business model performed well We believe the economy has stabilized The balance sheet remained well-positioned – further increased capital and reserves and maintained strong bank liquidity Pace of credit quality deterioration eased Strong revenue performance and disciplined expense management resulted in pretax pre-provision earnings well in excess of credit costs Positive client trends continued to drive product sales above plan PNC’s Performance Validates Realistic Opportunities for Growth. .11 $1.03 $530 1Q09 .21 $1.00 $559 3Q09 .52 .21 EPS impact of TARP preferred dividends $1,296 $207 Net income, millions $.14 2Q09 $2.17 YTD09 Earnings per diluted common share Financial overview (1) Total revenue less noninterest expense. Further information is provided in the Appendix.
PNC Overview 1 |
 6 Building a High Quality, Differentiated Balance Sheet Change from ($8) 2 - ($3) ($7) (3) (5) $1 ($8) (8) (4) $4 June 30, 2009 ($20) $271 Total liabilities and equity ($10) $42 Borrowed funds (13) 11 Other time/savings ($9) $184 Total deposits (4) 16 Other (7) 51 Retail CDs $11 $122 Transaction deposits 3 29 Shareholders’ equity (16) 56 Other assets (15) 161 Total loans ($20) $271 Total assets $54 Sept 30, 2009 $11 Dec 31, 2008 Investment securities Category (billions) PNC Is Transitioning Our Balance Sheet to Reflect Our PNC Is Transitioning Our Balance Sheet to Reflect Our Business Model. Business Model. Loans/Assets 59% Investment securities/Assets 20% Loans/Deposits 87% Tier 1 risk-based ratio 10.8% Tier 1 common ratio 5.5% Sept 30, 2009 Key Ratios PNC Overview (1) Estimated. 1 1 |
 7 Marketplace Credit Spreads Sources: Loan Pricing Corp, S&P LCD. Average spreads vs. LIBOR by rating Credit Market Overview 0 100 200 300 400 500 600 Oct-99 Oct-00 Oct-01 Oct-02 Oct-03 Oct-04 Oct-05 Oct-06 Oct-07 Oct-08 Oct-09 AA Primary A Primary BBB Primary BB Primary B Primary Credit Spreads Are Dramatically Lower but Still Wide by Credit Spreads Are Dramatically Lower but Still Wide by Historical Standards. Historical Standards. AA Primary A Primary BBB Primary BB Primary B Primary |
 8 Increasing Bond Issuance & Decreasing Loan Issuance in the Market $- $100 $200 $300 $400 $500 $600 $700 $800 Credit Market Overview The Collapse of the Leveraged Loan Market Helped Drive Higher Bond Issuances. Q1 Q2 Q3 Q4 Q1 Q2 Q3 Q4 Q1 Q2 Q3 2007 2008 2009 Source: Loan Pricing Corp. Leveraged loans Investment grade loans High yield bonds Investment grade bonds |
 9 PNC Loan Balances $175.5 $171.4 $165.0 $160.6 $0 $60 $120 $180 4Q08 1Q09 2Q09 3Q09 Avg. originated loans and commitments to lend equal about $27 billion per qtr. Despite Solid Loan Originations, Soft Demand Continued to Despite Solid Loan Originations, Soft Demand Continued to Contribute to a Decline in Loans Outstanding. Contribute to a Decline in Loans Outstanding. Commercial loans down 14% from year end Consumer loans down 1% from year end PNC’s Credit Book Loan balances as of quarter end. |
 10
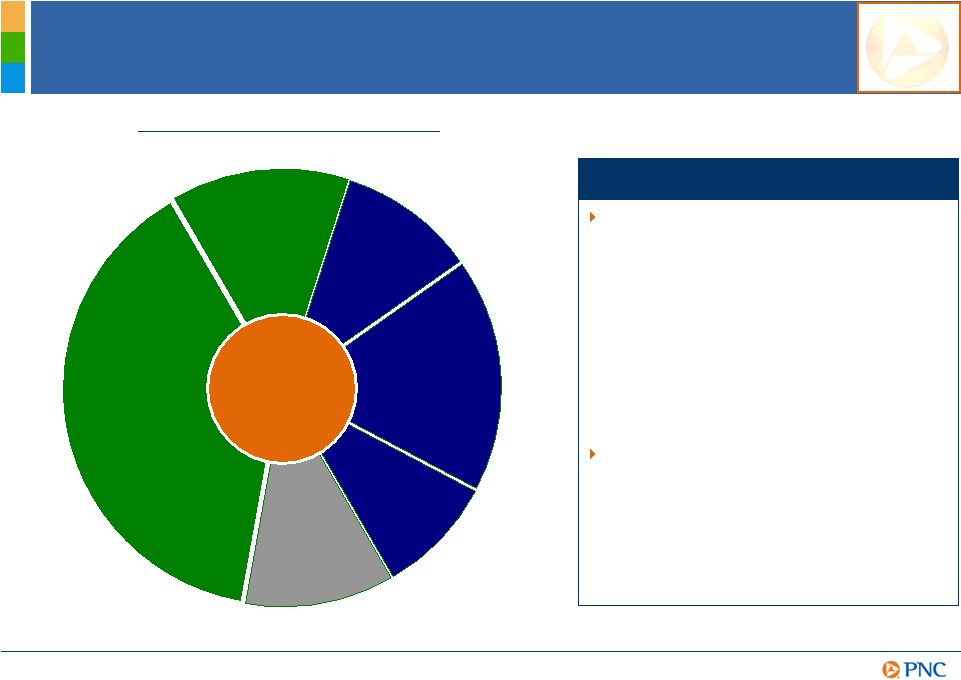
PNC Loan Portfolio Commercial and equipment leasing $62.3 Commercial real estate $21.4 3Q09 Total loans $160.6 Home Equity $29.6 Residential real estate $11.1 Distressed $19.7 Other consumer $16.5 As of September 30, 2009. (1) Includes commercial and equipment leasing, commercial real estate,
home equity, residential real estate and other consumer loans assigned to the
Distressed Assets Portfolio segment totaling approximately $19.7 billion at September 30, 2009. Further information regarding the categories of loans in the Distressed Assets Portfolio
segment and in the overall loan portfolio is provided in the Appendix. (2) Impaired
loans and/or fair value marks relate to loans acquired from National City that were impaired per FASB ASC 310-30. Held for Investment (billions) Core portfolio of $141 billion - Primarily in our footprint with a majority collateralized - Relatively well balanced - No sector concentrations in commercial portfolio - Core CRE well diversified in terms of asset classes and geography - Core consumer 71% home equity and residential real estate Distressed portfolio of $20 billion - Includes impaired loans with a carrying value of $7.8 billion marked down by 37% - Overall carried at about 75% of customer outstandings considering allowance and fair value marks Highlights 39% 13% 10% 19% 7% 12% PNC’s Credit Book 2 1 2 |
 11
Relative Credit Risk Profile Peers represents average of BBT, BAC, COF, CMA, FITB, JPM, KEY, MTB, RF, STI, USB and WFC.
Sources: SNL DataSource, company reports. (1) As of or for the three months ended
September 30, 2009. Net charge-offs percentage is annualized. (2) Impaired loans and/or fair value marks relate to loans acquired from National City that were impaired per FASB ASC
310-30. 0.00% 1.00% 2.00% 3.00% 4.00% Nonperforming loans to total loans Nonperforming assets to total assets Net charge- offs to average loans Allowance for loan and lease losses to loans 3.19% 3.43% 2.08% 2.48% 1.59% 2.93% 2.99% 3.20% Key 3Q09 metrics Reserves plus fair value marks as a % of outstanding: Commercial real estate 10% Commercial 5% Residential real estate 9% Consumer 3% Total loans 7% PNC Sept. 30, 2009 PNC’s Credit Book 1 2 PNC’s Commitment to Prudent Risk Management Is Reflected in Our Credit Metrics. |
 12
30% 20% 16% 14% 13% 13% 13% 11% 9% 9% 9% 3% 3% MTB RF CMA STI KEY USB BBT WFC FITB COF PNC BAC JPM Commercial Real Estate (CRE) Peer source: company reports. (1) Impaired loans and/or fair value marks relate to loans
acquired from National City that were impaired per FASB ASC 310-30. PNC’s Commercial Real Estate Outstandings Are Smaller as a Percentage of Assets on a Relative Peer Basis. CRE as a % of assets as of June 30, 2009 PNC’s Credit Book The fair value marks on impaired CRE plus the allocated CRE allowance for losses as a % of total CRE outstandings was 10% as of Sept. 30, 2009 Sept. 30, 2009 also 9% 1 |
 13
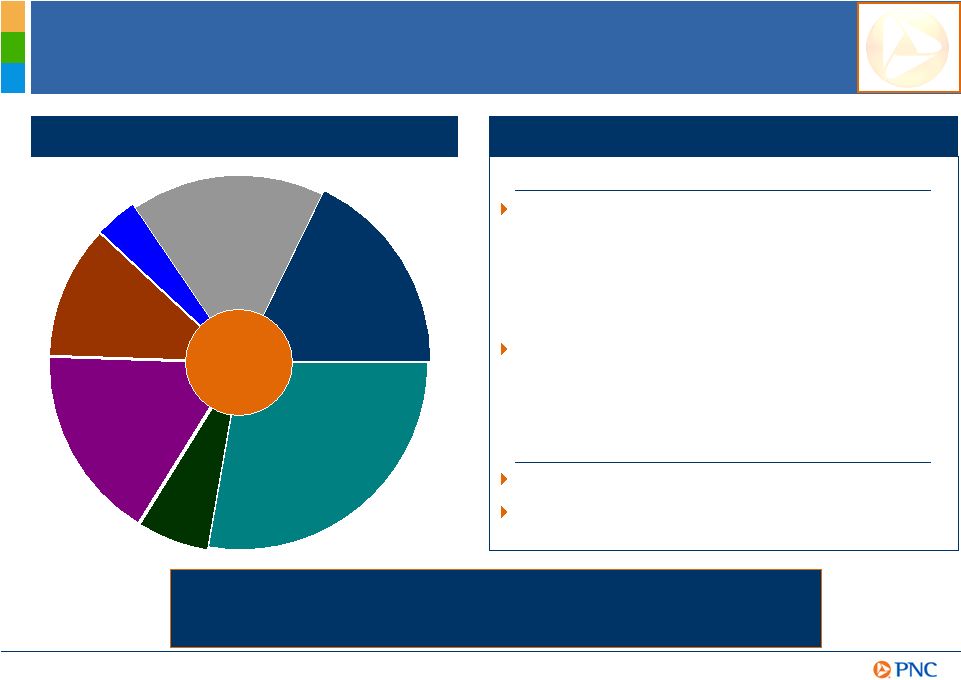
PNC Commercial Real Estate (CRE) As of September 30, 2009. (1) Other includes healthcare, mobile home parks, self storage, golf
courses, senior housing, mixed use properties, special purpose, churches, raw land and
other miscellaneous property types. (2) Impaired loans and/or fair value marks relate
to loans acquired from National City that were impaired per FASB ASC 310-30. 17% Multifamily 18% Office 27% Other Industrial/ Warehousing 17% Retail 11% Residential development Lodging 6% 4% PNC 3Q09 CRE loans by type $24.1B PNC’s Credit Book Highlights Core CRE Portfolio Majority from larger national / regional developers - Continuing to work closely with borrowers - Current stress has been manageable Remainder smaller balance loans - Primarily from bank acquisitions - Most with recourse to borrowers Distressed CRE Portfolio Majority continued to perform Aggressively managing portfolio leveraging Midland Loan Services PNC’s Commercial Real Estate Portfolio Is Granular and Diversified. 1 |
 14
Midland Loan Services One of the leading third-party providers of loan servicing, asset management and technology solutions for the commercial real estate finance industry. $20.0 billion O/S principal balance 1,081 Loans Government services $282.3 billion O/S principal balance 27,239 Loans Total servicing portfolio $9.9 billion O/S principal balance 702 Loans Active special servicing portfolio $104.5 billion O/S principal balance 9,626 Loans 179 Transactions Total special servicing PNC’s Real Estate Finance Group Is Recognized as a Leader in the Field. The only company in the industry with the highest U.S. servicer and special servicer ratings from Fitch and S&P Opportunities As of September 30, 2009. |
 15
Commercial Real Estate Debt Market Opportunities Commercial banks Life Insurance Companies Savings Institutions Others CMBS GSEs 45% 23% 18% 13% 4% 5% 1990 = $1.1 Trillion Holders Commercial banks Life Insurance Cos. Savings Institutions GSEs CMBS Others 9% 6% 8% 25% 7% 2Q09 = $3.5 Trillion Holders 37% Midland CMBS master servicing portfolio $125 billion 14% of total CMBS Source: Midland Loan Services and Federal Reserve Bulletin. |
 16
CMBS Markets Remain Challenging Opportunities $0 $50 $100 $150 $200 $250 '90 '91 '92 '93 '94 '95 '96 '97 '98 '99 '00 '01 '02 '03 '04 '05 '06 '07 '08 '09 $0 $15 $30 $45 Data through September 2009. Sources: Commercial Mortgage Alert, Midland Loan Services, PNC
Real Estate Research, Trepp LLC. Total U.S. CMBS Issuances (left axis) Midland Servicing Portfolio Issuances (right axis) $0 $50 $100 $150 $200 $250 Office Retail Multi - Family Lodging Mixed Use Industrial / Warehouse Self Storage Mobile Home Other Health Care Co-op Housing $0 $10 $20 $30 $40 Total U.S. CMBS Outstandings (left axis) Midland Servicing Portfolio (right axis) ($ billions) (at September 30, 2009, $ billions) |
 17
Commercial Mortgage Maturities 2010-2011 Opportunities Qualify for bank / insurance / agency refinance Recapitalization (REITs, funds, institutional investors, others) Debt pay down required for qualification Distressed / liquidation 46% 28% 14% 12% Source: Midland Loan Services. Estimated resolution for commercial mortgages serviced by Midland |
 18
PNC portfolio spreads above LIBOR Corporate & Institutional Banking Loan Spreads Opportunities Loan Spreads in the C&IB Banking Segment Are Showing Loan Spreads in the C&IB Banking Segment Are Showing Gradual and Steady Improvement. Gradual and Steady Improvement. 4.80% 3.53% 2.49% 2.27% 2.06% 2.83% 1.50% 2.50% 3.50% 4.50% 5.50% 1H06 2H06 1H07 2H07 1H08 2H08 1H09 3Q09 Asset based lending Real estate finance Corporate banking |
 19
Substantial Cross Sell Opportunities $5 MM $5 MM DHE $2.5 MM / 2.4% $2.5 MM / 3.4% Outstanding balance / loan spread Metrics Credit only Cross sold Opportunities $85 $130 $13 $33 8% 18% Cross sold relationship Credit only relationship Revenue Economic profit Risk adjusted return on capital Illustration of credit only vs. cross sold relationship Assumptions: |
 20
(6) (5) (4) (3) (2) (1) 0 1 2 3 4 0% 1% 2% 3% 4% 5% 6% Proactively Managing the Balance Sheet Opportunities PNC Duration of Equity (At Quarter End) Fed Fund Effective Rate (At Quarter End) 2007 2008 2009 1.4% 100 bps increase (5.5%) 100 bps decrease Effect on NII in 2 year from gradual interest rate change over preceding 12 months Effect on NII in 1 year from gradual interest rate change over following 12 months PNC 3Q09 NII Sensitivity (2.0%) .9% 100 bps decrease 100 bps increase Q1 Q2 Q3 Q4 Q1 Q2 Q3 Q4 Q1 Q2 Q3 nd st |
 21
Summary PNC Continues to Build a Great Company. PNC Continues to Build a Great Company. PNC’s business model has performed well during the economic downturn PNC believes the economy has stabilized and the pace of our credit quality deterioration has eased PNC’s realistic opportunities for growth are expected to deliver significant value |
 22
This presentation includes “snapshot” information about PNC used by way of
illustration and is not intended as a full business or financial review. It should not be viewed in isolation but rather in the context of all of the information made
available by PNC in its SEC filings. We also make statements in this presentation, and we may from time to time make other statements,
regarding our outlook or expectations for earnings, revenues, expenses, capital levels,
liquidity levels, asset quality and/or other matters regarding or affecting PNC that are forward-looking statements within the meaning of the Private Securities Litigation Reform Act.
Forward-looking statements are typically identified by words such as “believe,” “plan,” “expect,” “anticipate,”
“intend,” “outlook,” “estimate,” “forecast,” “will,” “project” and other similar words and expressions. Forward- looking statements are subject to numerous assumptions, risks and uncertainties, which change over
time. Forward-looking statements speak only as of the date they are made. We do not assume any duty
and do not undertake to update our forward-looking statements. Actual results
or future events could differ, possibly materially, from those that we anticipated in our forward-looking statements, and future results could differ materially from our historical performance. Our forward-looking statements are subject to the following principal risks and
uncertainties. We provide greater detail regarding some of these factors in our
2008 Form 10-K and 2009 Form 10-Qs, including in the Risk Factors and Risk Management sections of those reports, and in our other SEC filings. Our forward-looking statements may also be subject to other risks and uncertainties, including
those that we may discuss elsewhere in this presentation or in our filings with the SEC,
accessible on the SEC’s website at www.sec.gov and on or through our corporate website at www.pnc.com/secfilings. We have included these web addresses as inactive textual references only. Information on these
websites is not part of this document. • Our businesses and financial results are affected by business and economic conditions, both
generally and specifically in the principal markets in which we operate. In particular,
our businesses and financial results may be impacted by: o
Changes in interest rates and valuations in the debt, equity and other financial
markets. o Disruptions in the liquidity and other functioning of financial markets, including such disruptions
in the markets for real estate and other assets commonly securing financial products.
o Actions by the Federal Reserve and other government agencies, including those that impact money
supply and market interest rates. o Changes in our customers’, suppliers’ and other counterparties’ performance in
general and their creditworthiness in particular. o
Changes in levels of unemployment. o Changes in customer preferences and behavior, whether as a result of changing business and economic
conditions or other factors. • A continuation of recent turbulence in significant portions of the US and global financial markets,
particularly if it worsens, could impact our performance, both directly by affecting
our revenues and the value of our assets and liabilities and indirectly by affecting our counterparties and the economy generally. • Our business and financial performance could be impacted as the financial industry restructures in
the current environment, both by changes in the creditworthiness and performance of our
counterparties and by changes in the competitive and regulatory landscape. • Given current economic and financial market conditions, our
forward-looking financial statements are subject to the risk that these conditions will be substantially different than we are currently expecting. These statements are based on our
current expectations that interest rates will remain low through 2009 with continued
wide market credit spreads, and our view that national economic trends currently point to the end of recessionary conditions in the later half of 2009 followed by a subdued recovery in 2010. Cautionary Statement Regarding Forward-Looking Information Appendix |
 23
Cautionary Statement Regarding Forward-Looking Information (continued) Appendix •Legal and regulatory developments could have an impact on our ability to operate our
businesses or our financial condition or results of operations or our
competitive position or reputation. Reputational impacts, in turn, could affect matters such as business generation and retention, our ability to attract and retain management, liquidity, and funding. These legal and regulatory developments could include: o Changes resulting from legislative and regulatory responses to the current economic and financial
industry environment, including current and future conditions or restrictions imposed
as a result of our participation in the TARP Capital Purchase Program. o Other legislative and regulatory reforms, including broad-based restructuring of financial
industry regulation as well as changes to laws and regulations involving tax, pension,
bankruptcy, consumer protection, and other aspects of the financial institution industry. o Increased litigation risk from recent regulatory and other governmental developments. o Unfavorable resolution of legal proceedings or other claims and regulatory and other governmental
inquiries. o The results of the regulatory examination and supervision process, including our failure to satisfy
the requirements of agreements with governmental agencies. o Changes in accounting policies and principles. •Our issuance of securities to the US Department of the Treasury may limit our ability to
return capital to our shareholders and is dilutive to our common shares. If we
are unable previously to redeem the shares, the dividend rate increases substantially after five years. •Our business and operating results are affected by our ability to identify and effectively
manage risks inherent in our businesses, including, where appropriate, through the effective use of third-party insurance, derivatives, and capital management techniques, and by our ability to meet evolving regulatory capital standards. •The adequacy of our intellectual property protection, and the extent of any costs associated
with obtaining rights in intellectual property claimed by
others, can impact our business and operating results. •Our ability to anticipate
and respond to technological changes can have an impact on our ability to respond to customer needs and to meet competitive demands. •Our ability to implement our business initiatives and strategies could affect our financial performance over the next several years. •Competition can have an impact on customer acquisition, growth and retention, as well as on
our credit spreads and product pricing, which can affect market
share, deposits and revenues. •Our business and operating results can also be
affected by widespread natural disasters, terrorist activities or international hostilities, either as a result of the impact on the economy and capital and other financial markets generally or on us or on our customers, suppliers or other counterparties specifically. •Also, risks and uncertainties that could affect the results anticipated in
forward-looking statements or from historical performance relating to our equity
interest in BlackRock, Inc. are discussed in more detail in BlackRock’s filings with the SEC, including in the Risk Factors sections of BlackRock’s reports. BlackRock’s SEC filings are accessible on the SEC’s website and on or through
BlackRock’s website at www.blackrock.com. This material is referenced for
informational purposes only and should not be deemed to constitute a part of this document. In addition, our recent acquisition of National City Corporation (“National City”) presents us with a number of risks and uncertainties related both to the acquisition itself and to the integration of the acquired businesses into PNC. These
risks and uncertainties include the following: •The anticipated benefits of the transaction, including anticipated cost savings and strategic gains, may be significantly harder or take longer to achieve than expected or may not be achieved in their entirety as a result of unexpected factors or
events. |
 24
Cautionary Statement Regarding Forward-Looking Information (continued) Appendix •Our ability to achieve anticipated results from this transaction is dependent on the state going forward of the economic and financial markets, which have been under significant stress recently. Specifically, we may incur more credit
losses from National City’s loan portfolio than expected. Other issues
related to achieving anticipated financial results include the possibility that deposit attrition or attrition in key client, partner and other relationships may be greater than expected. •Legal proceedings or other claims made and governmental investigations currently pending
against National City, as well as others that may be filed, made or commenced relating
to National City’s business and activities before the acquisition, could adversely impact our financial results. •Our ability to achieve anticipated results is also dependent on our ability to bring National
City’s systems, operating models, and controls into conformity with ours and to do so on our planned time schedule. The integration of National City’s business and operations into PNC, which will include conversion of National City’s different systems and procedures, may take longer than
anticipated or be more costly than anticipated or have
unanticipated adverse results relating to National City’s or PNC’s existing businesses. PNC’s ability to integrate National City successfully may be adversely affected by the fact that this transaction has resulted in PNC entering several
markets where PNC did not previously have any meaningful retail presence. In addition to the National City transaction, we grow our business from time to time by acquiring
other financial services companies. Acquisitions in general present us with risks, in addition to those presented by the nature of the business acquired, similar to some or all of those described above relating to the National City acquisition. Any annualized, proforma, estimated, third party or consensus numbers in this presentation are used
for illustrative or comparative purposes only and may not reflect actual results.
Any consensus earnings estimates are calculated based on the earnings projections made by analysts who cover that company. The analysts’ opinions, estimates or forecasts (and therefore the consensus earnings estimates) are theirs alone, are not those of PNC or its management, and may not reflect PNC’s or other company’s actual or anticipated
results. |
 25
Non-GAAP to GAAP Reconcilement Appendix In millions, for the three months ended Pretax Net income Reported net income (loss) ($246) National City conforming provision for credit losses $504 328 Net income (loss) excluding National City conforming provision for credit losses $82 December 31, 2008 PNC believes that information adjusted for the impact of this item may be useful due to the extent
to which the item is not indicative of our ongoing operations. Nine months ended
March 31, 2009 June 30, 2009 Sept. 30, 2009 June 30, 2009 in millions Total revenue $3,871 $3,987 $4,048 $11,906 Noninterest expense 2,328 2,658 2,379 7,365 Pretax pre-provision earnings $1,543 $1,329 $1,669 $4,541 PNC believes that pretax pre-provision earnings is useful as a tool to help evaluate ability to
provide for credit costs through operations. Three months ended As of September 30, 2009, in millions Total PNC Loans assigned to the Distressed Assets Portfolio segment Total PNC after reassigning Distressed Asset Portfolio loans % of core PNC loan portfolio % of total PNC loan portfolio Commercial and equipment leasing $63,211 $892 $62,319 44% 39% Commerical real estate 24,064 2,659 21,405 15% 13% Total core commercial lending $83,724 59% 52% Other consumer 16,505 11 $16,494 12% 10% Home equity 36,370 6,772 29,598 21% 19% Residential real estate 20,458 9,348 11,110 8% 7% Total core consumer lending $57,202 41% 36% Total core portfolio $140,926 100% 88% Distressed 19,682 12% Total loans $160,608 $19,682 $160,608 100% |
 26
Peer Group of Banks Appendix The PNC Financial Services Group, Inc. PNC BB&T Corporation BBT Bank of America Corporation BAC Capital One Financial, Inc. COF Comerica Inc. CMA Fifth Third Bancorp FITB JPMorgan Chase JPM KeyCorp KEY M&T Bank MTB Regions Financial Corporation RF SunTrust Banks, Inc. STI U.S. Bancorp USB Wells Fargo & Company WFC Ticker |