Attached files
| file | filename |
|---|---|
| EX-31.1 - Breitburn Energy Partners LP | exhibit31_1.htm |
| EX-32.2 - Breitburn Energy Partners LP | exhibit32_2.htm |
| EX-32.1 - Breitburn Energy Partners LP | exhibit32_1.htm |
| EX-10.3 - Breitburn Energy Partners LP | exhibit10_3.htm |
| EX-32.3 - Breitburn Energy Partners LP | exhibit32_3.htm |
| EX-31.2 - Breitburn Energy Partners LP | exhibit31_2.htm |
| EX-31.3 - Breitburn Energy Partners LP | exhibit31_3.htm |
UNITED
STATES SECURITIES AND EXCHANGE COMMISSION
Washington,
D.C. 20549
Form
10-Q
R Quarterly Report Pursuant To Section
13 or 15(d) of the Securities Exchange Act Of 1934
For
the quarterly period ended September 30, 2009
or
£ Transition Report Pursuant To Section
13 or 15(d) of the Securities Exchange Act Of 1934
For
the transition period from ___ to ___
Commission
File Number 001-33055
BreitBurn
Energy Partners L.P.
(Exact
name of registrant as specified in its charter)
|
Delaware
|
74-3169953
|
|
(State
or other jurisdiction of
|
(I.R.S.
Employer
|
|
incorporation
or organization)
|
Identification
Number)
|
|
515
South Flower Street, Suite 4800
|
|
|
Los
Angeles, California
|
90071
|
|
(Address
of principal executive offices)
|
(Zip
Code)
|
Registrant’s
telephone number, including area code: (213) 225-5900
Indicate by check mark
whether the registrant (1) has filed all reports required to be filed by Section
13 or 15(d) of the Securities Exchange Act of 1934 during the preceding 12
months (or for such shorter period that the registrant was required to file such
reports), and (2) has been subject to such filing requirements for the past 90
days. Yes þ No
£
Indicate
by check mark whether the registrant has submitted electronically and posted on
its corporate Web site, if any, every Interactive Data File required to be
submitted and posted pursuant to Rule 405 of Regulation S-T (§232.405 of this
chapter) during the preceding 12 months (or for such shorter period that the
registrant was required to submit and post such files). Yes £ No
£ (not yet
applicable to registrant)
Indicate
by check mark whether the registrant is a large accelerated filer, an
accelerated filer, or a non-accelerated filer. See definition of “accelerated
filer and large accelerated filer” in Rule 12b-2 of the Exchange
Act. (Check one):
|
Large
accelerated filer þ
|
Accelerated
filer o
|
|
Non-accelerated
filer o
(Do
not check if a smaller reporting company)
|
Smaller
reporting company o
|
Indicate
by check mark whether the registrant is a shell company (as defined in Rule
12b-2 of the Exchange Act).
Yes £ No
R
As of
November 6, 2009, the registrant had 52,784,201 Common Units
outstanding.
|
INDEX
|
||
|
Page
|
||
|
No.
|
||
|
FINANCIAL
INFORMATION
|
||
|
OTHER
INFORMATION
|
||
|
|
|
|
|
|
||
CAUTIONARY STATEMENT RELEVANT TO FORWARD-LOOKING
INFORMATION
Forward-looking
statements are included in this report and may be included in other public
filings, press releases, our website and oral and written presentations by
management. Statements other than historical facts are
forward- looking and may be identified by words such as “believes,”
“estimates,” “impact,” “future,” “projection,” “forecasts,” “affect,”
“restrict,” “result,” “expand,” “pursue,” “engage,” “could,” “will,” variations
of such words and words of similar meaning. These statements are not
guarantees of future performance and are subject to certain risks, uncertainties
and other factors, some of which are beyond our control and are difficult to
predict. Therefore, actual outcomes and results may differ materially
from what is expressed or forecasted in such forward-looking
statements. The reader should not place undue reliance on these
forward-looking statements, which speak only as of the date of this
report.
Among the
important factors that could cause actual results to differ materially from
those in the forward-looking statements are changes in crude oil and natural gas
prices; a significant reduction in the borrowing base under our bank credit
facility; the impact of the current economic downturn on our business
operations, financial condition and ability to raise capital; our level of
indebtedness; the ability of financial counterparties to perform their
obligations under existing agreements; delays in planned or expected drilling;
the discovery of previously unknown environmental issues; the competitiveness of
alternate energy sources or product substitutes; technological developments; the
uncertainty related to the litigation instituted by Quicksilver against us;
potential disruption or interruption of our net production due to accidents or
severe weather; the effects of changed accounting rules under generally accepted
accounting principles promulgated by rule-setting bodies; and the factors set
forth under “Cautionary Statement Relevant to Forward Looking Information” and
Part I—Item 1A. “—Risk Factors’’ of our Annual Report on Form 10-K for the year
ended December 31, 2008 (the “Annual Report”), Part II —Item 1A of our Quarterly
Reports on Form 10-Q for the quarters ended March 31, 2009 and June 30, 2009,
and in Part II—Item 1A of this report. Unpredictable or unknown
factors not discussed herein also could have material adverse effects on
forward-looking statements.
All
forward-looking statements, expressed or implied, included in this report
and attributable to us are expressly qualified in their entirety by this
cautionary statement. This cautionary statement should also be
considered in connection with any subsequent written or oral forward-looking
statements that we or persons acting on our behalf may
issue.
We
undertake no obligation to update the forward-looking statements in this report
to reflect future events or circumstances.
Available
Information
Our
internet website address is www.breitburn.com. We make available,
free of charge at the “Investor Relations” portion of our website, our annual
reports on Form 10-K, quarterly reports on Form 10-Q, current reports on Form
8-K and all amendments to those reports filed or furnished pursuant to Section
13(a) or 15(d) of the Securities Exchange Acts of 1934, as amended, as soon
as reasonably practicable after such reports are electronically filed
with, or furnished to, the Securities and Exchange Commission
(“SEC”). The information contained on our website does not constitute
part of this report.
1
The
following is a description of the meanings of some of the oil and gas industry
terms that may be used in this report. The definition of proved
reserves has been abbreviated from the applicable definitions contained in
Rule 4-10(a)(2-4) of Regulation S-X.
Bbl: One
stock tank barrel, or 42 U.S. gallons liquid volume, of crude oil or other
liquid hydrocarbons.
Bbl/d: Bbl
per day.
Boe: One
barrel of oil equivalent, determined using a ratio of six Mcf of natural gas to
one Bbl of crude oil.
Boe/d: Boe
per day.
Btu: British
thermal unit, which is the quantity of heat required to raise the temperature of
a one-pound mass of water by one degree Fahrenheit.
exploitation: A
drilling or other project which may target proven or unproven reserves (such as
probable or possible reserves), but which generally has a lower risk than that
associated with exploration projects.
field: An
area consisting of a single reservoir or multiple reservoirs, all grouped on or
related to the same individual geological structural feature and/or
stratigraphic condition.
LIBOR: London
Interbank Offered Rate.
MichCon: Michigan Consolidated Gas
Company.
MBbls: One
thousand barrels of crude oil or other liquid hydrocarbons.
MBoe: One
thousand barrels of crude oil equivalent.
MBoe/d: MBoe
per day.
Mcf: One
thousand cubic feet of natural gas.
MMcf: One
million cubic feet of natural gas.
MMcfe: One
million cubic feet of natural gas equivalent, determined using a ratio of one
Bbl of crude oil to six Mcf of natural gas.
MMBtu/d: One
million British thermal units per day.
NGLs: The
combination of ethane, propane, butane and natural gasolines that when removed
from natural gas become liquid under various levels of higher pressure and lower
temperature.
NYMEX: New
York Mercantile Exchange.
oil: Crude
oil, condensate and natural gas liquids.
2
proved
reserves: The estimated quantities of crude oil, natural gas
and natural gas liquids that geological and engineering data demonstrate with
reasonable certainty to be recoverable in future years from known reservoirs
under existing economic and operating conditions. This definition of
proved reserves has been abbreviated from the applicable definitions contained
in Rule 4-10(a)(2-4) of Regulation S-X.
reserve: That
part of a mineral deposit which could be economically and legally extracted or
produced at the time of the reserve determination.
reservoir:
A porous and permeable underground formation containing a natural accumulation
of producible oil and/or natural gas that is confined by impermeable rock or
water barriers and is individual and separate from other reserves.
West Texas
Intermediate (“WTI”): Light, sweet crude oil with high API
gravity and low sulfur content used as the benchmark for U.S. crude oil refining
and trading. WTI is deliverable at Cushing, Oklahoma to fill NYMEX
futures contracts for light, sweet crude oil.
3
_____________________________________
References
in this filing to “the Partnership,” “we,” “our,” “us” or like terms refer to
BreitBurn Energy Partners L.P. and its subsidiaries. References in
this filing to “BEC” or the “Predecessor” refer to BreitBurn Energy Company
L.P., our predecessor, and its predecessors and
subsidiaries. References in this filing to “BreitBurn GP” or the
“General Partner” refer to BreitBurn GP, LLC, our general partner and our
wholly-owned subsidiary as of June 17, 2008. References in this
filing to “Provident” refer to Provident Energy Trust. References in
this filing to “BreitBurn Corporation” refer to BreitBurn Energy Corporation, a
corporation owned by Randall Breitenbach and Halbert Washburn, the Co-Chief
Executive Officers of our general partner. References in this filing
to “BreitBurn Management” refer to BreitBurn Management Company, LLC, our asset
manager and operator, and wholly-owned subsidiary as of June 17,
2008. References in this filing to “BOLP” or “BreitBurn Operating”
refer to BreitBurn Operating L.P., our wholly-owned operating
subsidiary. References in this filing to “BOGP” refer to BreitBurn
Operating GP, LLC, the general partner of BOLP. References in this
filing to “our properties” refer to, as of December 31, 2006, the oil and gas
properties contributed to us and our subsidiaries by BEC in connection with our
initial public offering. These oil and gas properties include certain
fields in the Los Angeles Basin in California, including interests in the Santa
Fe Springs, Rosecrans and Brea Olinda Fields, and the Wind River and Big Horn
Basins in central Wyoming. As of January 1, 2007, “our properties”
include any additional properties that we have acquired since that date. As of
July 1, 2009, “our properties” exclude the Lazy JL Field, which was sold
effective July 1, 2009. References to “Quicksilver” refer to Quicksilver
Resources Inc. from whom we acquired oil and gas properties and facilities in
Michigan, Indiana and Kentucky on November 1, 2007. References in
this filing to “Calumet” refer to Calumet Florida L.L.C., from whom we acquired
certain interests in oil leases and related assets located in Florida on May 24,
2007. References in this filing to “BEPI” refer to BreitBurn Energy
Partners I, L.P. References in this filing to “TIFD” refer to TIFD
X-III LLC, from whom we acquired a 99 percent limited partner interest in BEPI
on May 25, 2007, which owned interests in the Sawtelle and East Coyote oil
fields located in California.
_____________________________________
4
PART I. FINANCIAL INFORMATION
Item 1. Financial
Statements
|
Unaudited
Consolidated Statements of Operations
|
||||||||||||||||
|
Three
Months Ended
|
Nine
Months Ended
|
|||||||||||||||
|
September
30,
|
September
30,
|
|||||||||||||||
|
Thousands
of dollars, except unit amounts
|
2009
|
2008
|
2009
|
2008
|
||||||||||||
|
Revenues
and other income items:
|
||||||||||||||||
|
Oil,
natural gas and natural gas liquid sales
|
$ | 62,674 | $ | 130,249 | $ | 180,189 | $ | 386,060 | ||||||||
|
Gains
(losses) on commodity derivative instruments, net (note
14)
|
12,719 | 407,441 | (14,520 | ) | (29,228 | ) | ||||||||||
|
Other
revenue, net (note 9)
|
261 | 806 | 930 | 2,324 | ||||||||||||
|
Total
revenues and other income items
|
75,654 | 538,496 | 166,599 | 359,156 | ||||||||||||
|
Operating
costs and expenses:
|
||||||||||||||||
|
Operating
costs
|
33,888 | 41,915 | 100,273 | 118,952 | ||||||||||||
|
Depletion,
depreciation and amortization
|
24,130 | 21,477 | 81,393 | 64,228 | ||||||||||||
|
General
and administrative expenses
|
9,318 | 6,479 | 27,265 | 24,073 | ||||||||||||
|
Loss
on sale of assets (note 4)
|
5,470 | - | 5,470 | - | ||||||||||||
|
Total
operating costs and expenses
|
72,806 | 69,871 | 214,401 | 207,253 | ||||||||||||
|
Operating
income (loss)
|
2,848 | 468,625 | (47,802 | ) | 151,903 | |||||||||||
|
Interest
and other financing costs, net
|
4,549 | 9,021 | 14,682 | 19,569 | ||||||||||||
|
Losses
on interest rate swaps (note 14)
|
3,792 | 2,964 | 5,557 | 3,937 | ||||||||||||
|
Other
income, net
|
(84 | ) | (464 | ) | (124 | ) | (114 | ) | ||||||||
|
Total
other expense
|
8,257 | 11,521 | 20,115 | 23,392 | ||||||||||||
|
Gain
(loss) before taxes
|
(5,409 | ) | 457,104 | (67,917 | ) | 128,511 | ||||||||||
|
Income tax expense (benefit)
(note 5)
|
(13 | ) | 2,599 | (354 | ) | 1,262 | ||||||||||
|
Net
income (loss)
|
(5,396 | ) | 454,505 | (67,563 | ) | 127,249 | ||||||||||
|
Less:
Net income attributable to noncontrolling interest (note
13)
|
(12 | ) | (51 | ) | (14 | ) | (175 | ) | ||||||||
|
Net
income (loss) attributable to the partnership
|
(5,408 | ) | 454,454 | (67,577 | ) | 127,074 | ||||||||||
|
General
partner loss
|
- | - | - | (2,019 | ) | |||||||||||
|
Net
income (loss) attributable to limited partners
|
$ | (5,408 | ) | $ | 454,454 | $ | (67,577 | ) | $ | 129,093 | ||||||
|
Basic
net income (loss) per unit
|
$ | (0.10 | ) | $ | 8.43 | $ | (1.28 | ) | $ | 2.06 | ||||||
|
Diluted
net income (loss) per unit
|
$ | (0.10 | ) | $ | 8.40 | $ | (1.28 | ) | $ | 2.06 | ||||||
|
Weighted
average number of units used to calculate
|
||||||||||||||||
|
Basic
net income (loss) per unit
|
52,770,011 | 53,922,984 | 52,747,861 | 62,604,519 | ||||||||||||
|
Diluted
net income (loss) per unit
|
52,770,011 | 54,071,521 | 52,747,861 | 62,752,289 | ||||||||||||
See
accompanying notes to consolidated financial statements.
5
|
Unaudited
Consolidated Balance Sheets
|
||||||||
|
September
30,
|
December
31,
|
|||||||
|
Thousands
of dollars, except unit amounts
|
2009
|
2008
|
||||||
|
ASSETS
|
||||||||
|
Current
assets:
|
||||||||
|
Cash
|
$ | 2,199 | $ | 2,546 | ||||
|
Accounts
receivable, net
|
38,198 | 47,221 | ||||||
|
Derivative
instruments (note 14)
|
63,249 | 76,224 | ||||||
|
Related
party receivables (note 6)
|
4,744 | 5,084 | ||||||
|
Inventory
(note 7)
|
4,960 | 1,250 | ||||||
|
Prepaid
expenses
|
6,880 | 5,300 | ||||||
|
Intangibles
(note 8)
|
807 | 2,771 | ||||||
|
Other
current assets
|
170 | 170 | ||||||
|
Total
current assets
|
121,207 | 140,566 | ||||||
|
Equity investments (note
9)
|
8,686 | 9,452 | ||||||
|
Property,
plant and equipment
|
||||||||
|
Oil
and gas properties
|
2,046,860 | 2,057,531 | ||||||
|
Non-oil
and gas assets
|
8,145 | 7,806 | ||||||
| 2,055,005 | 2,065,337 | |||||||
|
Accumulated
depletion and depreciation
|
(300,831 | ) | (224,996 | ) | ||||
|
Net
property, plant and equipment
|
1,754,174 | 1,840,341 | ||||||
|
Other
long-term assets
|
||||||||
|
Intangibles
(note 8)
|
125 | 495 | ||||||
|
Derivative
instruments (note 14)
|
97,500 | 219,003 | ||||||
|
Other
long-term assets
|
8,362 | 6,977 | ||||||
|
Total
assets
|
$ | 1,990,054 | $ | 2,216,834 | ||||
|
LIABILITIES
AND EQUITY
|
||||||||
|
Current
liabilities:
|
||||||||
|
Accounts
payable
|
$ | 18,246 | $ | 28,302 | ||||
|
Book
overdraft
|
160 | 9,871 | ||||||
|
Derivative
instruments (note 14)
|
14,770 | 10,192 | ||||||
|
Revenue
distributions payable
|
10,727 | 16,162 | ||||||
|
Salaries
and wages payable
|
6,111 | 6,249 | ||||||
|
Accrued
liabilities
|
14,559 | 9,214 | ||||||
|
Total
current liabilities
|
64,573 | 79,990 | ||||||
|
Long-term
debt (note 10)
|
585,000 | 736,000 | ||||||
|
Deferred
income taxes (note 5)
|
3,385 | 4,282 | ||||||
|
Asset
retirement obligation (note 11)
|
35,692 | 30,086 | ||||||
|
Derivative
instruments (note 14)
|
31,322 | 10,058 | ||||||
|
Other
long-term liabilities
|
2,120 | 2,987 | ||||||
|
Total
liabilities
|
722,092 | 863,403 | ||||||
|
Equity:
|
||||||||
|
Partners'
equity (note 12)
|
1,267,528 | 1,352,892 | ||||||
|
Noncontrolling
interest (note 13)
|
434 | 539 | ||||||
|
Total
equity
|
1,267,962 | 1,353,431 | ||||||
|
Total
liabilities and equity
|
$ | 1,990,054 | $ | 2,216,834 | ||||
|
Common
units outstanding
|
52,770,011 | 52,635,634 | ||||||
See
accompanying notes to consolidated financial statements.
6
|
Unaudited
Consolidated Statements of Cash Flows
|
||||||||
|
Nine
Months Ended
|
||||||||
|
September
30,
|
||||||||
|
Thousands
of dollars
|
2009
|
2008
|
||||||
|
Cash
flows from operating activities
|
||||||||
|
Net
income (loss)
|
$ | (67,563 | ) | $ | 127,249 | |||
|
Adjustments
to reconcile to cash flow from operating activities:
|
||||||||
|
Depletion,
depreciation and amortization
|
81,393 | 64,228 | ||||||
|
Unit
based compensation expense
|
9,736 | 5,192 | ||||||
|
Unrealized
gain (loss) on derivative instruments
|
160,319 | (39,398 | ) | |||||
|
Distributions
greater than income from equity affiliates
|
766 | 772 | ||||||
|
Deferred
income tax
|
(897 | ) | 625 | |||||
|
Amortization
of intangibles
|
2,334 | 2,339 | ||||||
|
Loss
on sale of assets
|
5,470 | - | ||||||
|
Other
|
2,472 | 1,803 | ||||||
|
Changes
in net assets and liablities:
|
||||||||
|
Accounts
receivable and other assets
|
3,590 | 1,463 | ||||||
|
Inventory
|
(3,710 | ) | (2,292 | ) | ||||
|
Net
change in related party receivables and payables
|
340 | 27,614 | ||||||
|
Accounts
payable and other liabilities
|
(10,279 | ) | 1,366 | |||||
|
Net
cash provided by operating activities
|
183,971 | 190,961 | ||||||
|
Cash
flows from investing activities
|
||||||||
|
Capital
expenditures
|
(18,603 | ) | (86,811 | ) | ||||
|
Proceeds
from sale of assets
|
23,034 | - | ||||||
|
Property
acquisitions
|
- | (9,988 | ) | |||||
|
Net
cash provided (used) by investing activities
|
4,431 | (96,799 | ) | |||||
|
Cash
flows from financing activities
|
||||||||
|
Purchase
of common units
|
- | (336,216 | ) | |||||
|
Distributions
|
(28,038 | ) | (93,304 | ) | ||||
|
Proceeds
from the issuance of long-term debt
|
218,475 | 659,093 | ||||||
|
Repayments
of long-term debt
|
(369,475 | ) | (321,493 | ) | ||||
|
Book
overdraft
|
(9,711 | ) | 7,603 | |||||
|
Long-term
debt issuance costs
|
- | (4,974 | ) | |||||
|
Net
cash used by financing activities
|
(188,749 | ) | (89,291 | ) | ||||
|
Increase
(decrease) in cash
|
(347 | ) | 4,871 | |||||
|
Cash
beginning of period
|
2,546 | 5,929 | ||||||
|
Cash
end of period
|
$ | 2,199 | $ | 10,800 | ||||
See
accompanying notes to consolidated financial statements.
7
Notes to Consolidated Financial Statements
1. Organization
and Description of Operations
We are an
independent oil and gas partnership focused on the exploitation, development and
acquisition of oil and gas properties in the United States. We are a
Delaware limited partnership formed on March 23, 2006. Our general
partner is BreitBurn GP, a Delaware limited liability company, also formed on
March 23, 2006, and our wholly-owned subsidiary since June 17,
2008. The board of directors of our General Partner has sole
responsibility for conducting our business and managing our
operations. We conduct our operations through a wholly-owned
subsidiary, BOLP and BOLP’s general partner BOGP. We own all of the
ownership interests in BOLP and BOGP.
Prior to
June 17, 2008, the membership interests in our General Partner were held by
BreitBurn Management. In addition, prior to that date, 95.55 percent
of the membership interests in BreitBurn Management were held by Provident and
the remaining 4.45 percent of the membership interests in BreitBurn Management
were held by BreitBurn Energy Corporation, a California corporation wholly-owned
by the Co-Chief Executive Officers of our General Partner. On June
17, 2008, we, BreitBurn Corporation, BreitBurn Management, Provident and certain
of its subsidiaries completed a series of transactions (the “Purchase,
Contribution and Partnership Transactions”), pursuant to which, among other
things, our General Partner and BreitBurn Management became our wholly-owned
subsidiaries, the economic portion of the General Partner’s 0.66473 percent
general partner interest in us was eliminated and our limited partners were
given a right to nominate and vote in the election of directors to the Board of
Directors of the General Partner. The General Partner has no other
economic interests, does not conduct other operations, and has no assets or
liabilities. See Part I—Item 1 “—Business —Ownership and Structure”
in our Annual Report for a further discussion of the Purchase, Contribution and
Partnership Transactions.
BreitBurn Management manages our assets
and performs other administrative services for us such as accounting, corporate
development, finance, land administration, legal and engineering. See
Note 6 for information regarding our relationship with BreitBurn
Management. In connection with the acquisition of Provident’s ownership in
BEC by Metalmark Capital Partners, Greenhill Capital Partners, a third party
institutional investor and members of senior management, BreitBurn Management
entered into the Second Amended and Restated Administrative Services Agreement
to manage BEC's properties for a term of five years. In addition, we
entered into an Omnibus Agreement with BEC detailing rights with respect to
business opportunities and providing us with a right of first offer with respect
to the sale of assets by BEC.
BreitBurn
Finance Corporation was incorporated under the laws of the State of Delaware on
June 1, 2009, is wholly owned by us, and has no assets or
liabilities. Its activities are limited to co-issuing debt securities
and engaging in other activities incidental thereto.
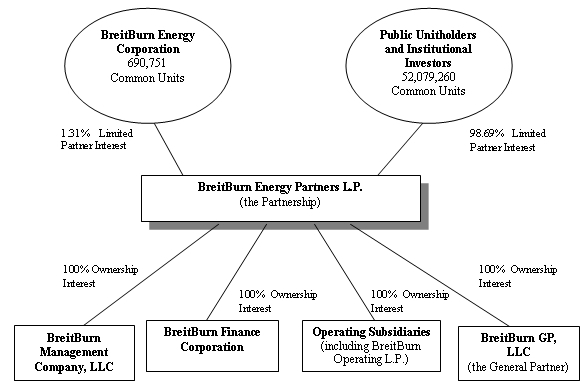
8
The following diagram depicts our
organizational structure as of September 30, 2009:
2. Basis
of Presentation
The
accompanying unaudited consolidated financial statements have been prepared in
accordance with United States generally accepted accounting principles (“GAAP”)
for interim financial information and with the instructions to Form 10-Q and
Article 10 of Regulation S-X. Accordingly, they do not include all of
the information and footnotes required by GAAP for complete financial
statements. In the opinion of management, all adjustments considered
necessary for a fair statement have been included. Operating results
for the three months and nine months ended September 30, 2009 are not
necessarily indicative of the results that may be expected for the year ending
December 31, 2009. The consolidated balance sheet at December 31,
2008 has been derived from the audited consolidated financial statements at that
date but does not include all of the information and footnotes required by GAAP
for complete financial statements. We follow the successful efforts
method of accounting for oil and gas activities. Depletion,
depreciation and amortization of proved oil and gas properties is computed using
the units-of-production method net of any estimated residual salvage
values. For further information, refer to the consolidated financial
statements and footnotes thereto included in our Annual Report.
9
In the
first quarter of 2009, we began classifying regional operation management
expenses as operating costs rather than general and administrative expenses to
better align our operating and management costs with our organizational
structure and to be more consistent with industry practices. As such,
we have revised classification of these expenses for the three months and nine
months ended September 30, 2008. The reclassification did not affect
previously reported total revenues, net income or net cash provided by operating
activities. The following table reflects all classification changes
for the three months and nine months ended September 30, 2008:
|
Three
Months Ended
|
Nine
Months Ended
|
|||||||
|
Thousands
of dollars
|
September
30, 2008
|
September
30, 2008
|
||||||
|
Operating
costs
|
||||||||
|
As
previously reported
|
$ | 39,515 | $ | 110,210 | ||||
|
District
expense reclass from G&A
|
2,400 | 8,742 | ||||||
|
As
revised
|
$ | 41,915 | $ | 118,952 | ||||
|
G&A
expenses
|
||||||||
|
As
previously reported
|
$ | 8,879 | $ | 32,815 | ||||
|
District
expense reclass to operating costs
|
(2,400 | ) | (8,742 | ) | ||||
|
As
revised
|
$ | 6,479 | $ | 24,073 | ||||
3. Recently
Issued Accounting Standards
We
adopted new accounting standards in the first nine months of 2009 related to
fair value measurements as discussed in Notes 11 and 14, the earnings per share
impact of instruments granted in share-based payment transactions as discussed
in Note 12, noncontrolling interests as discussed in Note 13, disclosures about
derivative instruments and hedging activities as discussed in Note 14,
subsequent events as discussed in Note 17 and business combinations, which we
will apply prospectively to business combinations with acquisition dates after
January 1, 2009.
Financial
Accounting Standards Board (“FASB”) Accounting Standards Codification (“ASC”)
Topic 105 “Generally Accepted Accounting Principles” establishes the FASB ASC as
the source of authoritative accounting principles recognized by the FASB to be
applied in the preparation of financial statements in conformity with
GAAP. ASC 105 explicitly recognizes rules and interpretive releases
of the SEC under federal securities laws as authoritative GAAP for SEC
registrants. This topic, which has changed the way we reference GAAP,
is effective for financial statements ending after September 15,
2009. This topic does not change GAAP and did not have an impact on
our financial position, results of operations or cash flows.
SEC Release No. 33-8995,
“Modernization of Oil and Gas Reporting” (“Release
33-8995”). In December 2008, the SEC issued Release
33-8995 adopting new rules for reserves estimate calculations and related
disclosures. The new reserve estimate disclosures apply to all annual
reports for fiscal years ending on or after December 31, 2009 and thereafter,
and to all registration statements filed after that date. The new
rules do not permit companies to voluntarily comply at an earlier
date. The revised proved reserve definition incorporates a new
definition of “reasonable certainty” using the PRMS (Petroleum Resource
Management System) standard of “high degree of confidence” for deterministic
method estimates, or a 90 percent recovery probability for probabilistic methods
used in estimating proved reserves. The new rules also permit a company to
establish undeveloped reserves as proved with appropriate degrees of reasonable
certainty established absent actual production tests and without artificially
limiting such reserves to spacing units adjacent to a producing well. For
reserve reporting purposes, the new rules also replace the end-of-the-year oil
and gas reserve pricing with an unweighted average first-day-of-the-month
pricing for the past 12 fiscal months. This would impact depletion
calculations. Costs associated with reserves will continue to be measured on the
last day of the fiscal year. A revised tabular presentation of reserves by
development category, final product type, and oil and gas activity disclosure by
geographic regions and significant fields and a general disclosure of the
internal controls a company uses to assure objectivity in reserves estimation
will be required. We are evaluating the impact Release 33-8995 will
have on our financial position, results of operations or cash flows. The
adoption of Release No. 33-8995 is expected to have a material impact, which
cannot be quantified at this point, on the calculation of our crude oil and
natural gas reserves.
10
Accounting Standards Update (“ASU”) 2009-05, “Fair Value Measurement and Disclosure: Measuring Liabilities at Fair Value” (“ASU 2009-05” or ASC 820-10). In August 2009, the FASB issued ASU 2009-05 (ASC 820-10) to provide clarification on measuring liabilities at fair value when a quoted price in an active market is not available. In particular, ASU 2009-05 specifies that a valuation technique should be applied that uses either the quote of the liability when traded as an asset, the quoted prices for similar liabilities when traded as assets, or another valuation technique consistent with existing fair value measurement guidance. ASU 2009-05 (ASC 820-10) is prospectively effective for financial statements issued for interim or annual periods ending after October 1, 2009. We do not expect the adoption of ASU 2009-05 (ASC 820-10) to have an impact our financial position, results of operations or cash flows.
4. Disposition
of Assets
On July
17, 2009, we sold the Lazy JL Field located in the Permian Basin of West Texas
to a private buyer for $23 million in cash. This transaction was
effective July 1, 2009. The proceeds from this transaction were used
to reduce our outstanding borrowings under our credit facility. In
connection with the sale, the borrowing base under our credit facility was
reduced by $3 million to $732 million.
The Lazy
JL Field properties produced approximately 249 Boe per day during the first six
months of 2009. 96 percent of the production was crude
oil. As of December 31, 2008, these assets contained estimated proved
reserves of 1.2 MMBoe, or approximately 1 percent of our total estimated proved
reserves of 103.6 MMBoe. The net carrying value at the date of sale
was $28.5 million, of which $28.7 million was reflected in net property, plant
and equipment on the balance sheet and $0.2 million was reflected in asset
retirement obligation on the balance sheet. We recognized a loss of
$5.5 million in the third quarter of 2009 related to the sale of the Lazy JL
Field.
5. Income Taxes
The
following tables present our income tax expense or benefit during the three
months and nine months ended September 30, 2009 and 2008 as well as our deferred
income tax liability at September 30, 2009 and December 31,
2008:
|
Three
Months Ended
|
Nine
Months Ended
|
|||||||||||||||
|
September
30,
|
September
30,
|
|||||||||||||||
|
Thousands
of dollars
|
2009
|
2008
|
2009
|
2008
|
||||||||||||
|
Federal
current tax expense
|
$ | 407 | $ | 146 | $ | 432 | $ | 138 | ||||||||
|
Deferred
federal tax expense (benefit) (a)
|
(276 | ) | 2,315 | (946 | ) | 725 | ||||||||||
|
State
income tax expense (benefit) (b)
|
(144 | ) | 138 | 160 | 399 | |||||||||||
|
Total
income tax expense (benefit)
|
$ | (13 | ) | $ | 2,599 | $ | (354 | ) | $ | 1,262 | ||||||
|
As
of
|
||||||||
|
Thousands
of dollars
|
September
30, 2009
|
December
31, 2008
|
||||||
|
Deferred
income tax liability (a)
|
$ | 3,385 | $ | 4,282 | ||||
(a)
Related to Phoenix Production Company, a tax-paying corporation and our
wholly-owned subsidiary.
(b)
Related to various forms of state taxes imposed on profit margin or net income,
primarily in Michigan and California.
6. Related Party Transactions
BreitBurn Management operates our
assets and performs other administrative services for us such as accounting,
corporate development, finance, land administration, legal and
engineering. All of our employees, including our executives, are
employees of BreitBurn Management. Prior to June 17, 2008, BreitBurn
Management provided services to us and to BEC, and allocated its expenses
between the two entities. On June 17, 2008, in connection with the
Purchase, Contribution and Partnership Transactions, BreitBurn Management became
our wholly-owned subsidiary and entered into an Amended and Restated
Administrative Services Agreement with BEC, pursuant to which BreitBurn
Management agreed to continue to provide administrative services to BEC, in
exchange for a monthly fee of approximately $775,000 for indirect
expenses.
11
Beginning
on June 17, 2008, all of the costs charged to BOLP are consolidated with our
results. On August 26, 2008, BreitBurn Management entered into the
Second Amended and Restated Administrative Services Agreement (the
“Administrative Services Agreement”) to manage BEC's properties for a term of
five years. In addition to the monthly fee, BreitBurn Management
charges BEC for all direct expenses including incentive plan costs and direct
payroll and administrative costs related to BEC properties and
operations. The monthly fee is contractually based on an annual
projection of anticipated time spent by each employee who provides services to
both us and BEC during the ensuing year and is subject to renegotiation annually
by the parties during the term of the agreement. For 2009, each
BreitBurn Management employee estimated his or her time allocation independently
based on 2008. These estimates were then reviewed and approved by
each employee’s manager or supervisor. The results of this process
were provided to both the audit committee of the board of directors of our
General Partner (composed entirely of independent directors) (the “audit
committee”) and the board of representatives of BEC’s parent (the “BEC
board”). The audit committee and the non-management members of the
BEC board agreed on the 2009 monthly fee as provided in the Administrative
Services Agreement. Effective January 1, 2009, the monthly fee was
renegotiated to $500,000. The reduction in the monthly fee is
attributable to the overall reduction in general and administrative expenses,
excluding unit-based compensation, for BreitBurn Management for 2009, the new
time allocation study described above and the fact that additional costs are
being charged separately to us and BEC compared to prior years.
In addition, we entered into an Omnibus
Agreement with BEC detailing rights with respect to business opportunities and
providing us with a right of first offer with respect to the sale of assets by
BEC.
At
September 30, 2009 and December 31, 2008, we had current receivables of $4.0
million and $4.4 million, respectively, due from BEC related to the
Administrative Services Agreement, outstanding liabilities for employee related
costs and oil and gas sales made by BEC on our behalf from certain
properties. During the first nine months of 2009, the monthly charges
to BEC for indirect expenses totaled $4.5 million and charges for direct
expenses including direct payroll and administrative costs totaled $3.5
million. For the three months and nine months ended September 30,
2009, total oil and gas sales made by BEC on our behalf were approximately $0.4
million and $0.9 million, respectively. For the three months and nine
months ended September 30, 2008, total oil and gas sales made by BEC on our
behalf were approximately $0.6 million and $1.8 million,
respectively. At September 30, 2009, we had receivables of $0.5
million due from equity investments.
Pursuant
to a transition services agreement through March 2008, Quicksilver provided to
us services for accounting, land administration, and marketing and charged us
$0.9 million for the first quarter of 2008. These charges were
included in general and administrative expenses on the consolidated statements
of operations. Quicksilver also buys natural gas from us in
Michigan. For the three months and nine months ended September 30,
2009, total net gas sales to Quicksilver were approximately $0.5 million and
$2.1 million respectively. For the three months and nine months ended
September 30, 2008, total net gas sales to Quicksilver were approximately $1.7
million and $6.4 million respectively. The related receivables were
$0.2 million at September 30, 2009 and $0.6 million as of December 31,
2008.
7. Inventory
Our crude
oil inventory from our Florida operations at September 30, 2009 and December 31,
2008 was $5.0 million and $1.3 million, respectively. In the nine
months ended September 30, 2009, we sold 388 gross MBbls of crude oil and
produced 460 gross MBbls of crude oil from our Florida
operations. Inventory additions are stated at cost and represent our
production costs. We match production expenses with crude oil
sales. Production expenses associated with unsold crude oil inventory
are recorded to inventory. Crude oil sales are a function of the
number and size of crude oil shipments in each quarter and thus crude oil sales
do not always coincide with volumes produced in a given quarter.
For our
properties in Florida, there are a limited number of alternative methods of
transportation for our production. Substantially all of our oil
production is transported by pipelines, trucks and barges owned by third
parties. The inability or unwillingness of these parties to provide
transportation services for a reasonable fee could result in our having to find
transportation alternatives, increased transportation costs, or involuntary
curtailment of our oil production in Florida, which could have a negative impact
on our future consolidated financial position, results of operations or cash
flows.
12
8. Intangibles
In May
2007, we acquired certain interests in Florida oil leases and related assets
through the acquisition of a limited liability company from
Calumet. As part of this acquisition we assumed certain crude oil
sales contracts for the remainder of 2007 and for 2008 through
2010. A $3.4 million intangible asset was established to value the
portion of the crude oil contracts that were above market at closing in the
purchase price allocation. Realized gains or losses from these
contracts being recognized as part of oil sales and the intangible asset is
being amortized over the life of the contracts. As of September 30,
2009, our intangible asset related to the crude oil sales contracts was $0.7
million, of which $0.1 million is reflected in long-term intangibles on the
consolidated balance sheet.
In
November 2007, we acquired oil and gas properties and facilities located in
Michigan, Indiana and Kentucky from Quicksilver. Included in the
Quicksilver purchase price was a $5.2 million intangible asset related to
retention bonuses. In connection with the acquisition, we entered
into an agreement with Quicksilver which provides for Quicksilver to fund
retention bonuses payable to 139 former Quicksilver employees in the event these
employees remain continuously employed by BreitBurn Management from November 1,
2007 through November 1, 2009 or in the event of termination without cause,
disability or death. Amortization expense of $0.5 million and $1.6
million for the three months and nine months ended September 30, 2009 is
included in the operating costs line on the consolidated statements of
operations. For the same periods of 2008, $0.5 million and $1.6
million of amortization expense related to Quicksilver retention bonuses was
included in operating costs. As of September 30, 2009, our intangible
asset related to Quicksilver retention bonuses was $0.2 million, reflected in
current intangibles on the consolidated balance sheet.
9. Equity
Investments
We had
equity investments at September 30, 2009 and December 31, 2008 of $8.7 million
and $9.5 million, respectively. These investments are reported in the
“Equity investments” line on the consolidated balance sheets and primarily
represent investments in natural gas processing facilities. For the
three months and nine months ended September 30, 2009, we recorded an immaterial
amount and $0.1 million respectively, in earnings from equity investments and an
immaterial amount and $0.7 million respectively, in dividends. For
the three months and nine months ended September 30, 2008, we recorded $0.1
million and $0.6 million, respectively, in earnings from equity
investments. Amounts recorded for dividends during the three months
and nine months ended September 30, 2008 were $1.1 million and $1.2 million,
respectively. Earnings from equity investments are reported in the
“Other revenue, net” line on the consolidated statements of
operations.
10. Long-Term
Debt
On
November 1, 2007, in connection with the Quicksilver Acquisition, BOLP, as
borrower, and we and our wholly-owned subsidiaries, as guarantors, entered into
a four-year, $1.5 billion amended and restated revolving credit facility with
Wells Fargo Bank, N.A., Credit Suisse Securities (USA) LLC and a syndicate of
banks (the “Amended and Restated Credit Agreement”). The initial
borrowing base of the Amended and Restated Credit Agreement was $700 million and
was increased to $750 million on April 10, 2008.
On June
17, 2008, in connection with the Purchase, Contribution and Partnership
Transactions, we and our wholly-owned subsidiaries entered into the First
Amendment to the Amended and Restated Credit Agreement (“Amendment No. 1 to the
Credit Agreement”), with Wells Fargo Bank, National Association, as
administrative agent (the “Agent”). Amendment No. 1 to the Credit
Agreement increased the borrowing base available under the Amended and Restated
Credit Agreement, from $750 million to $900 million. In addition,
Amendment No. 1 to the Credit Agreement enacted certain additional amendments,
waivers and consents to the Amended and Restated Credit Agreement and the
related Security Agreement, dated November 1, 2007, among BOLP, certain of its
subsidiaries and the Agent, necessary to permit the Amendment No. 1 to the First
Amended and Restated Limited Partnership Agreement and the transactions
consummated in the Purchase, Contribution and Partnership
Transactions. Under Amendment No. 1 to the Credit Agreement, the
interest margins applicable to borrowings, the letter of credit fee and the
commitment fee under the Amended and Restated Credit Agreement were increased by
amounts ranging from 12.5 to 25 basis points.
In
January 2009, we monetized certain in-the-money commodity hedges for
approximately $46 million, the net proceeds of which were used to reduce
outstanding borrowings under our credit facility. In April 2009, in
connection with a scheduled redetermination, our borrowing base under our
Amended and Restated Credit Agreement was redetermined at $760
million. In June 2009, we monetized additional in-the-money commodity
hedges for approximately $25 million, the net proceeds of which were used to
reduce outstanding borrowings under our credit facility. As a result
of the monetization, our borrowing base was reset at $735 million.
13
On July
17, 2009, we sold the Lazy JL Field for $23 million in cash. The
proceeds from this transaction were used to reduce outstanding borrowings under
our credit facility and our borrowing base was reduced by $3 million to $732
million.
In
October 2009, in connection with our semi-annual borrowing base redetermination,
our borrowing base was reaffirmed at $732 million (see Note 17).
As of
September 30, 2009 and December 31, 2008, we had approximately $585.0 million
and $736.0 million, respectively, in indebtedness outstanding under the Amended
and Restated Credit Agreement. The credit facility will mature on
November 1, 2011. At September 30, 2009, the 1-month LIBOR interest
rate plus an applicable spread was 2.000 percent on the 1-month LIBOR portion of
$484.0 million, the 6-month LIBOR interest rate plus an applicable spread was
3.210 percent on the 6-month LIBOR portion of $100.0 million and the prime rate
plus an applicable spread was 4.000 percent on the prime debt portion of $1.0
million. The amounts reported on
our consolidated balance sheets for long-term debt approximate fair value due to
the variable nature of our interest rates.
The
credit facility contains customary covenants, including restrictions on our
ability to: incur additional indebtedness; make certain investments, loans or
advances; make distributions to our unitholders (including the restriction on
our ability to make distributions unless after giving effect to such
distribution, our outstanding debt is less than 90 percent of the borrowing
base, and we have the ability to borrow at least 10 percent of the borrowing
base while remaining in compliance with all terms and conditions of our credit
facility, including the leverage ratio not exceeding 3.50 to 1.00 (which is
total indebtedness to EBITDAX); make dispositions or enter into sales and
leasebacks; or enter into a merger or sale of our property or assets, including
the sale or transfer of interests in our subsidiaries.
As of
September 30, 2009 and December 31, 2008, we were in compliance with the credit
facility’s covenants. At September 30, 2009 and December 31, 2008, we
had $0.3 million in letters of credit outstanding.
Our
interest expense is detailed in the following table:
|
Three
Months Ended
|
Nine
Months Ended
|
|||||||||||||||
|
September
30,
|
September
30,
|
|||||||||||||||
|
Thousands
of dollars
|
2009
|
2008
|
2009
|
2008
|
||||||||||||
|
Credit
agreement (including commitment fees)
|
$ | 3,726 | $ | 8,202 | $ | 12,213 | $ | 17,793 | ||||||||
|
Amortization
of discount and deferred issuance costs
|
823 | 819 | 2,469 | 1,776 | ||||||||||||
|
Total
|
$ | 4,549 | $ | 9,021 | $ | 14,682 | $ | 19,569 | ||||||||
|
Cash
paid for interest (including realized gains/losses on interest rate
swaps)
|
$ | 7,136 | $ | 8,842 | $ | 21,521 | $ | 18,916 | ||||||||
14
11. Asset
Retirement Obligation
Our asset
retirement obligation is based on our net ownership in wells and facilities and
our estimate of the costs to abandon and remediate those wells and facilities as
well as our estimate of the future timing of the costs to be
incurred. Payments to settle asset retirement obligations occur over
the operating lives of the assets, estimated to be from 7 to 50
years. Estimated cash flows have been discounted at our credit
adjusted risk free rate of 7 percent and adjusted for inflation using a rate of
2 percent. Our credit adjusted risk free rate is calculated based on
our cost of borrowing adjusted for the effect of our credit standing and
specific industry and business risk.
ASC 820
“Fair Value Measurements and
Disclosures” establishes a fair value hierarchy that prioritizes the
inputs to valuation techniques into three broad levels based upon how observable
those inputs are. The highest priority of Level 1 is given to unadjusted
quoted prices in active markets for identical assets or liabilities. Level
2 includes inputs other than quoted prices that are included in Level 1 and can
be derived by observable data, including third party data providers. These
inputs may also include observable transactions in the market place. Level
3 is given to unobservable inputs. We consider the inputs to our asset
retirement obligation valuation to be Level 3 as fair value is determined using
discounted cash flow methodologies based on standardized inputs that are not
readily observable in public markets.
Changes
in the asset retirement obligation for the nine months ended September 30, 2009
and the year ended December 31, 2008 are presented in the following
table:
|
|
|
|||||||
|
Nine
Months Ended
|
Year
Ended
|
|||||||
|
Thousands
of dollars
|
September
30, 2009
|
December
31, 2008
|
||||||
|
Carrying
amount, beginning of period
|
$ | 30,086 | $ | 27,819 | ||||
|
Liabilities
settled in the current period
|
- | (1,054 | ) | |||||
|
Revisions
(a)
|
4,073 | 1,363 | ||||||
|
Acquisitions
(dispositions) (b)
|
(252 | ) | - | |||||
|
Accretion
expense
|
1,785 | 1,958 | ||||||
|
Carrying
amount, end of period
|
$ | 35,692 | $ | 30,086 | ||||
|
(a)
Increased cost estimates and revisions to reserve life.
|
||||||||
|
(b)
Relates to disposition of Lazy JL field.
|
||||||||
12. Partners’
Equity
At
September 30, 2009, we had 52,770,011 Common Units outstanding representing
limited partner interests in us (“Common Units”), and at December 31, 2008, we
had 52,635,634 Common Units outstanding.
At
September 30, 2009 and December 31, 2008, we had 6,700,000 units authorized for
issuance under our long-term incentive compensation plans. At
September 30, 2009 and December 31, 2008, there were 2,960,731 and 1,422,171,
respectively, of partnership-based units outstanding that are eligible to be
paid in Common Units upon vesting.
Earnings
per Common Unit
ASC 260 “Earnings per Share” requires
use of the “two-class” method of computing earnings per unit for all periods
presented. The “two-class” method is an earnings allocation formula
that determines earnings per unit for each class of Common Unit and
participating security as if all earnings for the period had been
distributed. Unvested restricted unit awards that earn
non-forfeitable dividend rights qualify as participating securities and,
accordingly, are included in the basic computation. Our unvested
restricted phantom units (“RPUs”) and convertible phantom units (“CPUs”)
participate in dividends on an equal basis with Common Units; therefore, there
is no difference in undistributed earnings allocated to each participating
security. Accordingly, the presentation below is prepared on a
combined basis and is presented as earnings per Common Unit.
15
The following is a reconciliation of
net earnings and weighted average units for calculating basic net earnings per
Common Unit and diluted net earnings per Common Unit. For the three
months and nine months ended September 30, 2009, RPUs and CPUs have been
excluded from the calculation of basic earnings per unit, as we were in a net
loss position.
|
Three
Months Ended
|
Nine
Months Ended
|
|||||||||||||||
|
September
30,
|
September
30,
|
|||||||||||||||
|
Thousands
of dollars, except unit amounts
|
2009
|
2008
|
2009
|
2008
|
||||||||||||
|
Net
income (loss) attributable to limited partners
|
$ | (5,408 | ) | $ | 454,454 | $ | (67,577 | ) | $ | 129,093 | ||||||
|
Distributions
on participating units not expected to vest
|
- | 6 | 24 | 16 | ||||||||||||
|
Net
income (loss) attributable to common unitholders and participating
securities
|
$ | (5,408 | ) | $ | 454,460 | $ | (67,553 | ) | $ | 129,109 | ||||||
|
Weighted
average number of units used to calculate basic and diluted net income
(loss) per unit:
|
||||||||||||||||
|
Common
Units
|
52,770,011 | 52,635,634 | 52,747,861 | 61,455,638 | ||||||||||||
|
Participating
securities (a)
|
- | 1,287,350 | - | 1,148,880 | ||||||||||||
|
Denominator
for basic earnings per Common Unit
|
52,770,011 | 53,922,984 | 52,747,861 | 62,604,519 | ||||||||||||
|
Dilutive
units (b)
|
- | 148,537 | - | 147,770 | ||||||||||||
|
Denominator
for diluted earnings per Common Unit
|
52,770,011 | 54,071,521 | 52,747,861 | 62,752,289 | ||||||||||||
|
Net
income (loss) per common unit
|
||||||||||||||||
|
Basic
|
$ | (0.10 | ) | $ | 8.43 | $ | (1.28 | ) | $ | 2.06 | ||||||
|
Diluted
|
$ | (0.10 | ) | $ | 8.40 | $ | (1.28 | ) | $ | 2.06 | ||||||
|
(a)
The three and nine months ended September 30, 2009 exclude 2,848,962 and
2,599,438 potentially issuable weighted average RPUs and CPUs from
participating securities, as we were in a loss position. For the
three months and nine months ended September 30, 2008, basic earnings per
unit is based upon the weighted average number of Common Units outstanding
plus the weighted average number of potentially issuable RPUs and
CPUs.
|
||||||||||||||||
|
(b)
The three months and nine months ended September 30, 2009, exclude 106,280
and 105,460 weighted average anti-dilutive units from the calculation of
the denominator for diluted earnings per Common Unit. The three
months and nine months ended September 30, 2008 includes dilutive units
potentially issuable under compensation plans.
|
||||||||||||||||
Cash
Distributions
On
February 13, 2009, we paid a cash distribution of approximately $27.4
million to our common unitholders of record as of the close of business on
February 9, 2009. The distribution that was paid to unitholders was
$0.52 per Common Unit. During the three months ended March 31, 2009,
we also paid cash equivalent to the distribution paid to our unitholders of $0.7
million to holders of outstanding Restricted Phantom Units and Convertible
Phantom Units issued under our Long-Term Incentive Plans.
With the
borrowing base redetermination in April 2009 (see Note 10), our borrowings
exceeded 90 percent of the reset borrowing base and, therefore, under the terms
of our credit facility we were restricted from making a distribution for the
first quarter of 2009. Although we were not restricted from making
distributions under the terms of our credit facility for the second and third
quarters of 2009, we elected not to declare distributions in light of total
leverage levels and other factors. We are restricted from paying
distributions under our credit facility unless, after giving effect to such
distribution, our outstanding debt is less than 90 percent of the borrowing base
and we have the ability to borrow at least 10 percent of the borrowing base
while remaining in compliance with all terms and conditions of our credit
facility, including the leverage ratio not exceeding 3.50 to 1.00 (which is
total indebtedness to EBITDAX).
16
13. Noncontrolling
interest
ASC
810“Consolidation”
requires that noncontrolling interests be classified as a component of
equity and establishes reporting requirements that provide sufficient
disclosures that clearly identify and distinguish between the interests of the
parent and the interests of the noncontrolling owners.
On May
25, 2007, we acquired the limited partner interest (99 percent) of BEPI from
TIFD. As such, we are fully consolidating the results of BEPI and
thus are recognizing a noncontrolling interest liability representing the book
value of the general partner’s interests. At September 30, 2009 and
December 31, 2008, the amount of this noncontrolling interest liability was $0.4
million and $0.5 million, respectively.
BEPI’s
general partner interest is held by a wholly owned subsidiary of
BEC. The general partner of BEPI holds a 35 percent reversionary
interest under the existing limited partnership agreement applicable to the
properties. This reversionary interest is expected to occur at a
defined payout, which is estimated to occur in 2013 based on quarter-end price
and cost projections.
14. Financial
Instruments
Fair
Value of Financial Instruments
Our risk
management programs are intended to reduce our exposure to commodity prices and
interest rates and to assist with stabilizing cash flow. Routinely,
we utilize derivative financial instruments to reduce this
volatility. To the extent we have hedged prices for a significant
portion of our expected production through commodity derivative instruments and
the cost for goods and services increase, our margins would be adversely
affected.
Credit
and Counterparty Risk
Financial
instruments which potentially subject us to concentrations of credit risk
consist principally of derivatives and accounts receivable. Our
derivatives expose us to credit risk from counterparties. As of
September 30, 2009, our derivative counterparties were Barclays Bank PLC,
Bank of Montreal, Citibank, N.A, Credit Suisse International, Credit Suisse
Energy LLC, Union Bank, Wells Fargo Bank N.A., JP Morgan Chase Bank N.A., Royal
Bank of Scotland plc, The Bank of Nova Scotia and Toronto-Dominion
Bank. We terminated all derivative financial instruments with Lehman
Brothers on September 19, 2008. Our counterparties are all
lenders under our Amended and Restated Credit Agreement. During
2008, there was extreme volatility and disruption in the capital and credit
markets which reached unprecedented levels. Continued volatility and
disruption may adversely affect the financial condition of our derivative
counterparties. On all transactions where we are exposed to
counterparty risk, we analyze the counterparty's financial condition prior to
entering into an agreement, establish limits, and monitor the appropriateness of
these limits on an ongoing basis. We periodically obtain credit
default swap information on our counterparties. As of September
30, 2009, each of these financial institutions carried an S&P credit rating
of A- or above. Although we currently do not believe we have a specific
counterparty risk with any party, our loss could be substantial if any of these
parties were to default. As of September 30, 2009, our largest
derivative asset balances were with JP Morgan Chase Bank N.A., who accounted for
approximately 61 percent of our derivative asset balances, and Credit Suisse
International and Credit Suisse Energy LLC, who together accounted for
approximately 27 percent of our derivative asset balances.
Commodity
Activities
The
derivative instruments we utilize are based on index prices that may and often
do differ from the actual crude oil and natural gas prices realized in our
operations. These variations often result in a lack of adequate
correlation to enable these derivative instruments to qualify for cash flow
hedges under ASC 815 “Derivatives and
Hedging.” Accordingly, we do not attempt to account for our
derivative instruments as cash flow hedges for financial reporting purposes and
instead recognize changes in the fair value immediately in
earnings. We had a realized gain of $24.3 million and an unrealized
loss of $11.6 million for the three months ended September 30, 2009 relating to
our various market-based commodity contracts. We had a realized gain
of $149.9 million and an unrealized loss of $164.4 million for the nine months
ended September 30, 2009 relating to our various market-based commodity
contracts. We had net financial instruments receivable relating to
our commodity contracts of $127.9 million at September 30, 2009.
17
In
January 2009, we terminated a portion of our 2011 and 2012 crude oil derivative
contracts and replaced them with new contracts with the same counterparty for
the same volumes at market prices. We realized $32.3 million from
this termination. In January 2009, we also terminated a portion of
our 2011 and 2012 natural gas derivative contracts and replaced them with new
contracts with the same counterparty for the same volumes at market
prices. We realized $13.3 million from this
termination. Proceeds from these contracts were used to pay down
outstanding borrowings under our credit facility.
In June
2009, we terminated an additional portion of our 2011 and 2012 crude oil and
natural gas derivative contracts and replaced them with new contracts for the
same volumes at market prices. We realized $18.9 million from the
termination of natural gas derivative contracts and $6.1 million from the
termination of crude oil contracts. Proceeds from these contracts
were used to pay down outstanding borrowings under our credit
facility.
Including the impact of the changes
noted above and new contracts entered into during the quarter ended September
30, 2009, we had the following contracts in place at September 30,
2009:
|
Year
|
||||||||||||||||||||
|
2009
|
2010
|
2011
|
2012
|
2013
|
||||||||||||||||
|
Gas
Positions:
|
||||||||||||||||||||
|
Fixed
Price Swaps:
|
||||||||||||||||||||
|
Hedged
Volume (MMBtu/d)
|
22,362 | 43,869 | 25,955 | 19,129 | 27,000 | |||||||||||||||
|
Average
Price ($/MMBtu)
|
$ | 8.16 | $ | 8.20 | $ | 7.26 | $ | 7.10 | $ | 6.92 | ||||||||||
|
Collars:
|
||||||||||||||||||||
|
Hedged
Volume (MMBtu/d)
|
1,063 | 3,405 | 16,016 | 19,129 | - | |||||||||||||||
|
Average
Floor Price ($/MMBtu)
|
$ | 9.00 | $ | 9.00 | $ | 9.00 | $ | 9.00 | $ | - | ||||||||||
|
Average
Ceiling Price ($/MMBtu)
|
$ | 15.40 | $ | 12.79 | $ | 11.28 | $ | 11.89 | $ | - | ||||||||||
|
Total:
|
||||||||||||||||||||
|
Hedged
Volume (MMMBtu/d)
|
23,424 | 47,275 | 41,971 | 38,257 | 27,000 | |||||||||||||||
|
Average
Price ($/MMBtu)
|
$ | 8.20 | $ | 8.26 | $ | 7.92 | $ | 8.05 | $ | 6.92 | ||||||||||
|
Oil
Positions:
|
||||||||||||||||||||
|
Fixed
Price Swaps:
|
||||||||||||||||||||
|
Hedged
Volume (Bbls/d)
|
1,468 | 2,808 | 2,616 | 2,539 | 3,500 | |||||||||||||||
|
Average
Price ($/Bbl)
|
$ | 70.18 | $ | 81.35 | $ | 66.22 | $ | 67.24 | $ | 76.79 | ||||||||||
|
Participating
Swaps: (a)
|
||||||||||||||||||||
|
Hedged
Volume (Bbls/d)
|
1,205 | 1,993 | 1,439 | - | - | |||||||||||||||
|
Average
Price ($/Bbl)
|
$ | 66.48 | $ | 64.40 | $ | 61.29 | $ | - | $ | - | ||||||||||
|
Average
Participation %
|
60.7 | % | 55.5 | % | 53.2 | % | - | - | ||||||||||||
|
Collars:
|
||||||||||||||||||||
|
Hedged
Volume (Bbls/d)
|
257 | 1,279 | 2,048 | 2,477 | - | |||||||||||||||
|
Average
Floor Price ($/Bbl)
|
$ | 89.57 | $ | 102.85 | $ | 103.42 | $ | 110.00 | $ | - | ||||||||||
|
Average
Ceiling Price ($/Bbl)
|
$ | 118.83 | $ | 136.16 | $ | 152.61 | $ | 145.39 | $ | - | ||||||||||
|
Floors:
|
||||||||||||||||||||
|
Hedged
Volume (Bbls/d)
|
250 | 500 | - | - | - | |||||||||||||||
|
Average
Floor Price ($/Bbl)
|
$ | 100.00 | $ | 100.00 | $ | - | $ | - | $ | - | ||||||||||
|
Total:
|
||||||||||||||||||||
|
Hedged
Volume (Bbls/d)
|
3,180 | 6,580 | 6,103 | 5,016 | 3,500 | |||||||||||||||
|
Average
Price ($/Bbl)
|
$ | 72.69 | $ | 81.81 | $ | 77.51 | $ | 88.35 | $ | 76.79 | ||||||||||
(a) A
participating swap combines a swap and a call option with the same strike
price.
18
Interest
Rate Activities
We are
subject to interest rate risk associated with loans under our credit facility
that bear interest based on floating rates. As of September 30, 2009,
our total debt outstanding was $585.0 million. In order to mitigate
our interest rate exposure, we had the following interest rate derivative
contracts in place at September 30, 2009, to fix a portion of floating
LIBOR-based debt on our credit facility:
|
Notional
amounts in thousands of dollars
|
Notional
Amount
|
Fixed
Rate
|
||||||
|
Period
Covered
|
||||||||
|
October
1, 2009 to January 8, 2010
|
$ | 100,000 | 3.3873 | % | ||||
|
October
1, 2009 to December 20, 2010
|
300,000 | 3.6825 | % | |||||
|
January
20, 2010 to October 20, 2011
|
100,000 | 1.6200 | % | |||||
|
December
20, 2010 to October 20, 2011
|
200,000 | 2.9900 | % | |||||
We had
realized losses related to our interest rate derivative contracts of $3.4
million and $9.7 million for the three months and nine months ended September
30, 2009, respectively. We had unrealized losses related to our
interest rate derivative contracts of $0.4 million and unrealized gains of $4.1
million for the three months and nine months ended September 30, 2009,
respectively. We had net payables related to the interest rate
derivative contracts of $13.2 million at September 30, 2009.
ASC 815
requires disclosures about how and why an entity uses derivative instruments,
how derivative instruments and related hedge items are accounted for under ASC
815, and how derivative instruments and related hedged items affect an entity’s
financial position, financial performance, and cash flows. This topic
requires the disclosures detailed below.
Fair
value of derivative instruments not designated as hedging instruments under ASC
815:
|
Balance
sheet location, thousands of dollars
|
Oil
Commodity Derivatives
|
Natural
Gas Commodity Derivatives
|
Interest
Rate Derivatives
|
Total
Financial Instruments
|
||||||||||||
|
September
30, 2009
|
||||||||||||||||
|
Assets
|
||||||||||||||||
|
Current
assets - derivative instruments
|
$ | 21,980 | $ | 41,269 | $ | - | $ | 63,249 | ||||||||
|
Other
long-term assets - derivative instruments
|
59,358 | 38,142 | - | 97,500 | ||||||||||||
|
Total
assets
|
81,338 | 79,411 | - | 160,749 | ||||||||||||
|
Liabilities
|
||||||||||||||||
|
Current
liabilities - derivative instruments
|
(4,245 | ) | - | (10,525 | ) | (14,770 | ) | |||||||||
|
Long-term
liabilities - derivative instruments
|
(25,985 | ) | (2,660 | ) | (2,677 | ) | (31,322 | ) | ||||||||
|
Total
liabilities
|
(30,230 | ) | (2,660 | ) | (13,202 | ) | (46,092 | ) | ||||||||
|
Net
assets (liabilities)
|
$ | 51,108 | $ | 76,751 | $ | (13,202 | ) | $ | 114,657 | |||||||
|
December
31, 2008
|
||||||||||||||||
|
Assets
|
||||||||||||||||
|
Current
assets - derivative instruments
|
$ | 44,086 | $ | 32,138 | $ | - | $ | 76,224 | ||||||||
|
Other
long-term assets - derivative instruments
|
145,061 | 73,942 | - | 219,003 | ||||||||||||
|
Total
assets
|
189,147 | 106,080 | - | 295,227 | ||||||||||||
|
Liabilities
|
||||||||||||||||
|
Current
liabilities - derivative instruments
|
(1,115 | ) | - | (9,077 | ) | (10,192 | ) | |||||||||
|
Long-term
liabilities - derivative instruments
|
(1,820 | ) | - | (8,238 | ) | (10,058 | ) | |||||||||
|
Total
liabilities
|
(2,935 | ) | - | (17,315 | ) | (20,250 | ) | |||||||||
|
Net
assets (liabilities)
|
$ | 186,212 | $ | 106,080 | $ | (17,315 | ) | $ | 274,977 | |||||||
19
Gains and
losses on derivative instruments not designated as hedging instruments under ASC
815:
|
Location
of gain/loss, thousands of dollars
|
Oil
Commodity Derivatives (a)
|
Natural
Gas Commodity Derivatives (a)
|
Interest
Rate Derivatives (b)
|
Total
Financial Instruments
|
||||||||||||
|
Three
Months Ended September 30, 2009
|
||||||||||||||||
|
Realized
gains (losses)
|
$ | 3,646 | $ | 20,710 | $ | (3,411 | ) | $ | 20,945 | |||||||
|
Unrealized
gains (losses)
|
9,728 | (21,365 | ) | (381 | ) | (12,018 | ) | |||||||||
|
Net
gains (losses)
|
$ | 13,374 | $ | (655 | ) | $ | (3,792 | ) | $ | 8,927 | ||||||
|
Three
Months Ended September 30, 2008
|
||||||||||||||||
|
Realized
losses
|
$ | (13,649 | ) | $ | (10,474 | ) | $ | (1,304 | ) | $ | (25,427 | ) | ||||
|
Unrealized
gains (losses)
|
213,901 | 217,663 | (1,660 | ) | 429,904 | |||||||||||
|
Net
gains (losses)
|
$ | 200,252 | $ | 207,189 | $ | (2,964 | ) | $ | 404,477 | |||||||
|
Nine
Months Ended September 30, 2009
|
||||||||||||||||
|
Realized
gains (losses)
|
$ | 64,829 | $ | 85,083 | $ | (9,670 | ) | $ | 140,242 | |||||||
|
Unrealized
gains (losses)
|
(135,104 | ) | (29,328 | ) | 4,113 | (160,319 | ) | |||||||||
|
Net
gains (losses)
|
$ | (70,275 | ) | $ | 55,755 | $ | (5,557 | ) | $ | (20,077 | ) | |||||
|
Nine
Months Ended September 30, 2008
|
||||||||||||||||
|
Realized
losses
|
$ | (44,916 | ) | $ | (25,979 | ) | $ | (1,668 | ) | $ | (72,563 | ) | ||||
|
Unrealized
gains (losses)
|
1,112 | 40,555 | (2,269 | ) | 39,398 | |||||||||||
|
Net
gains (losses)
|
$ | (43,804 | ) | $ | 14,576 | $ | (3,937 | ) | $ | (33,165 | ) | |||||
|
(a)
Included in gains (losses) on commodity derivative instruments on the
consolidated statements of operations.
|
||||||||||||||||
|
(b)
Included in loss on interest rate swaps on the consolidated statements of
operations.
|
||||||||||||||||
ASC 820 “Fair Value
Measurements and Disclosures” defines fair value, establishes a framework
for measuring fair value and establishes required disclosures about fair value
measurements. Fair value measurement under ASC 820 is based upon a
hypothetical transaction to sell an asset or transfer a liability at the
measurement date, considered from the perspective of a market participant that
holds the asset or owes the liability. The objective of fair value
measurement as defined in ASC 820 is to determine the price that would be
received in selling the asset or transferring the liability in an orderly
transaction between market participants at the measurement date. If
there is an active market for the asset or liability, the fair value measurement
shall represent the price in that market whether the price is directly
observable or otherwise obtained using a valuation
technique.
ASC 820
requires valuation techniques consistent with the market approach, income
approach or cost approach to be used to measure fair value. The
market approach uses prices and other relevant information generated by market
transactions involving identical or comparable assets or
liabilities. The income approach uses valuation techniques to convert
future cash flows or earnings to a single present value amount and is based upon
current market expectations about those future amounts. The cost
approach, sometimes referred to as the current replacement cost approach, is
based upon the amount that would currently be required to replace the service
capacity of an asset.
We
principally use the income approach for our recurring fair value measurements
and strive to use the best information available. We use valuation
techniques that maximize the use of observable inputs and obtain the majority of
our inputs from published objective sources or third party market
participants. We incorporate the impact of nonperformance risk,
including credit risk, into our fair value measurements.
ASC 820
also establishes a fair value hierarchy that prioritizes the inputs to valuation
techniques into three broad levels based upon how observable those inputs
are. The highest priority of Level 1 is given to unadjusted quoted
prices in active markets for identical assets or liabilities and the lowest
priority of Level 3 is given to unobservable inputs. We categorize
our fair value financial instruments based upon the objectivity of the inputs
and how observable those inputs are. The three levels of inputs as
defined in ASC 820 are described further as follows:
Level 1 –
Unadjusted quoted prices in active markets for identical assets or liabilities
as of the reporting date. Active markets are markets in which
transactions for the asset or liability occur with sufficient frequency and
volume to provide pricing information on an ongoing basis. An example
of a Level 1 input would be quoted prices for exchange traded commodity futures
contracts.
20
Level 2 –
Inputs other than quoted prices that are included in Level 1. Level 2
includes financial instruments that are actively traded but are valued using
models or other valuation methodologies. These models include
industry standard models that consider standard assumptions such as quoted
forward prices for commodities, interest rates, volatilities, current market and
contractual prices for underlying assets as well as other relevant
factors. Substantially all of these inputs are evident in the market
place throughout the terms of the financial instruments and can be derived by
observable data, including third party data providers. These inputs
may also include observable transactions in the market place. We
consider the over the counter (“OTC”) commodity and interest rate swaps in our
portfolio to be Level 2. These are assets and liabilities that can be
bought and sold in active markets and quoted prices are available from multiple
potential counterparties.
Level 3 –
Inputs that are not directly observable for the asset or liability and are
significant to the fair value of the asset or liability. These inputs
generally reflect management’s estimates of the assumptions market participants
would use when pricing the instruments. Level 3 includes financial
instruments that are not actively traded and have little or no observable data
for input into industry standard models. Level 3 instruments
primarily include derivative instruments for which we do not have sufficient
corroborating market evidence, such as binding broker quotes, to support
classifying the asset or liability as Level 2. Level 3 also
includes complex structured transactions that sometimes require the use of
non-standard models.
Certain
OTC derivatives that trade in less liquid markets or contain limited observable
model inputs are currently included in Level 3. We include these
assets and liabilities in Level 3 as required by current interpretations of ASC
820. As of December 31, 2008 and September 30, 2009, our Level 3
derivative assets and liabilities consisted entirely of OTC commodity put and
call options.
Financial
assets and liabilities that are categorized in Level 3 may later be
reclassified to the Level 2 category at the point we are able to obtain
sufficient binding market data or the interpretation of Level 2 criteria is
modified in practice to include non-binding market corroborated
data.
As
mentioned in Note 6, our wholly-owned subsidiary BreitBurn Management provides
us with general management services, including risk management
activities. BreitBurn Management contracted with Provident on a month
to month basis for certain derivative instrument valuation services provided to
us.
Provident’s
risk management group calculated the fair values of our commodity swaps using
risk management software that marks to market monthly fixed price delivery swap
volumes using forward commodity price curves and market interest
rates. This pricing approach is commonly used by market participants
to value commodity swap contracts for sale to the market. Inputs are
obtained from third party data providers and are verified to published data
where available (e.g., NYMEX).
Fair
value measurements for our interest rate swaps have also been provided by
Provident. Monthly outstanding notional amounts are marked to market
for each specific swap using forward interest rate curves. This
pricing approach is commonly used by market participants to value interest rate
swap contracts for sale to the market. Inputs are obtained from third
party data providers and are verified to published data where available (e.g.,
LIBOR).
Provident’s
risk management group uses industry standard option pricing models contained in
their risk management software to calculate the fair values associated with our
commodity options. Inputs to the option pricing models include fixed
monthly commodity strike prices and volumes from each specific contract,
commodity prices from commodity forward price curves, volatility and interest
rate factors and time to expiry. Model inputs are obtained from third
party data providers and are verified to published data where available (e.g.,
NYMEX).
We
reviewed the fair value calculations for our derivative instruments that we
received from Provident’s risk management group on a monthly
basis. We also compared these fair value amounts to the fair value
amounts that we received from the counterparties to our derivative
instruments. We investigated differences and resolved and recorded
any required changes prior to the issuance of our financial
statements.
21
Beginning
in the fourth quarter of 2009, we will calculate the fair value of our commodity
and interest rate swaps and options internally.
Financial
assets and liabilities carried at fair value on a recurring basis are presented
in the table below. Our assessment of the significance of an input to
its fair value measurement requires judgment and can affect the valuation of the
assets and liabilities as well as the category within which they are
categorized.
Recurring fair value measurements at
September 30, 2009 and December 31, 2008:
|
As
of September 30, 2009
|
||||||||||||||||
|
Thousands
of dollars
|
Level
1
|
Level
2
|
Level
3
|
Total
|
||||||||||||
|
Assets
(liabilities):
|
||||||||||||||||
|
Commodity
derivatives (swaps, put and call options)
|
$ | - | $ | 8,550 | $ | 119,309 | $ | 127,859 | ||||||||
|
Other
dervivatives (interest rate swaps)
|
- | (13,202 | ) | - | (13,202 | ) | ||||||||||
|
Total
|
$ | - | $ | (4,652 | ) | $ | 119,309 | $ | 114,657 | |||||||
|
As
of December 31, 2008
|
||||||||||||||||
|
Thousands
of dollars
|
Level
1
|
Level
2
|
Level
3
|
Total
|
||||||||||||
|
Assets
(liabilities):
|
||||||||||||||||
|
Commodity
derivatives (swaps, put and call options)
|
$ | - | $ | 139,074 | $ | 153,218 | $ | 292,292 | ||||||||
|
Other
derivatives (interest rate swaps)
|
- | (17,315 | ) | - | (17,315 | ) | ||||||||||
|
Total
|
$ | - | $ | 121,759 | $ | 153,218 | $ | 274,977 | ||||||||
The following table sets forth a
reconciliation primarily of changes in fair value of our derivative instruments
classified as Level 3:
|
Three
Months Ended
|
Nine
Months Ended
|
|||||||||||||||
|
September
30,
|
September
30,
|
|||||||||||||||
|
Thousands
of dollars
|
2009
|
2008
|
2009
|
2008
|
||||||||||||
|
Assets
(liabilities):
|
||||||||||||||||
|
Beginning
balance
|
$ | 113,355 | $ | 78,391 | $ | 153,218 | $ | 44,236 | ||||||||
|
Realized
and unrealized gains (losses)
|
5,954 | 22,889 | (33,909 | ) | 53,754 | |||||||||||
|
Purchases
and issuances
|
- | 4,162 | - | 7,452 | ||||||||||||
|
Settlements
|
- | (4,624 | ) | - | (4,624 | ) | ||||||||||
|
Ending
balance
|
$ | 119,309 | $ | 100,818 | $ | 119,309 | $ | 100,818 | ||||||||
For the
three months and nine months ended September 30, 2009, realized gains of $0.6
million and $15.0 million respectively, related to our derivative instruments
classified as Level 3 are included in Gains (losses) on commodity derivative
instruments, net on the consolidated statements of operations. For
the three months and nine months ended September 30, 2009, unrealized gains of
$5.4 million and unrealized losses of $48.9 million respectively, related to our
derivative instruments classified as Level 3 are included in Gains (losses) on
commodity derivative instruments, net on the consolidated statements of
operations. For the three months and nine months ended September 30,
2008, realized losses of $11.1 million and $11.9 million, respectively, related
to our derivative instruments classified as Level 3 are included in Gains
(losses) on commodity derivative instruments, net on the consolidated statements
of operations. For the three months and nine months ended September
30, 2008, unrealized gains of $34.0 million and $65.7 million, respectively,
related to our derivative instruments classified as Level 3 are included in
Gains (losses) on commodity derivative instruments, net on the consolidated
statements of operations. Determination of fair values incorporates
various factors as required by ASC 820 including, but not limited to, the credit
standing of the counterparties, the impact of guarantees as well as our own
abilities to perform on our liabilities.
22
15. Unit
and Other Valuation-Based Compensation Plans
Unit-based
compensation expense for the three months and nine months ended September 30,
2009 was $3.5 million and $9.7 million, respectively, and for the three months
and nine months ended September 30, 2008 was $0.5 million and $5.2 million
respectively.
During
the third quarter of 2009, the board of directors of the General Partner
approved the grant of 39,892 RPUs to new employees of BreitBurn Management under
our 2006 Long-Term Incentive Plan (“LTIP”), which brings the total RPUs granted
in the first nine months to 1,790,589 units. Our outside directors were granted
56,736 phantom units under our LTIP during the first quarter of
2009. The fair market value of the RPUs granted during 2009 for
computing the compensation expense under ASC 718 “Compensation—Stock
Compensation” averaged $8.17 per unit.
On
February 19, 2009, 134,377 Common Units were issued to employees for RPUs
granted in 2008, which vested on January 1, 2009.
For the
three months and nine months ended September 30, 2009, we paid nothing and
approximately $0.1 million, respectively, for various liability based
compensation plans. For the three months and nine months ended September
30, 2008, we paid approximately $1.0 million and $6.3 million, respectively, in
cash for various liability based compensation plans. For the three
months and nine months ended September 30, 2009, we paid nothing and
approximately $0.7 million, respectively, in cash equivalent to distributions
paid to our unitholders on RPUs and CPUs. For the three months and
nine months ended September 30, 2008, we paid $0.7 million and $1.7 million,
respectively, in cash equivalent to distributions paid to our unitholders on
RPUs and CPUs.
During
October 2009, 14,190 Common Units vested and were issued to outside directors
for phantom units granted in 2006. See Note 17.
For
detailed information on our various compensation plans, see our Annual
Report.
16. Commitments
and Contingencies
Surety
Bonds and Letters of Credit
In the
normal course of business, we have performance obligations that are secured, in
whole or in part, by surety bonds or letters of credit. These
obligations primarily cover self-insurance and other programs where governmental
organizations require such support. These surety bonds and letters of
credit are issued by financial institutions and are required to be reimbursed by
us if drawn upon. At September 30, 2009 and December 31, 2008, we had
various surety bonds for $10.6 million and $10.1 million,
respectively. At September 30, 2009 and December 31, 2008, we had
$0.3 million in letters of credit outstanding.
Legal
Proceedings
On
October 31, 2008, Quicksilver, an owner of 40.44 percent of our Common Units,
instituted a lawsuit in the District Court of Tarrant County, Texas naming us as
a defendant along with BreitBurn GP, BOLP, BOGP, Randall H. Breitenbach, Halbert
S. Washburn, Gregory J. Moroney, Charles S. Weiss, Randall J. Findlay, Thomas W.
Buchanan, Grant D. Billing and Provident. On August 3, 2009,
Quicksilver filed the Third Amended Petition and asserted twelve different
counts against the various defendants. The primary claims are as
follows: Quicksilver alleges that BOLP breached the Contribution Agreement
with Quicksilver, dated September 11, 2007, based on allegations that we made
false and misleading statements relating to its relationship with
Provident. Quicksilver also alleges common law and statutory fraud claims
against all of the defendants by contending that the defendants made false and
misleading statements to induce Quicksilver to acquire Common Units in us.
Finally, Quicksilver alleges claims for breach of the Partnership’s First
Amended and Restated Agreement of Limited Partnership, dated as of October 10,
2006 (“Partnership Agreement”), and other common law claims relating to certain
transactions and an amendment to the Partnership Agreement that occurred in June
2008. Quicksilver seeks a permanent injunction, a declaratory judgment
relating primarily to the interpretation of the Partnership Agreement and the
voting rights in that agreement, indemnification, punitive or exemplary damages,
avoidance of BreitBurn GP's assignment to us of all of its economic interest in
us, attorneys’ fees and costs, pre- and post-judgment interest, and monetary
damages. Pursuant to an agreement among the parties to the lawsuit, a
hearing on Quicksilver’s request for a permanent injunction and declaratory
relief was scheduled for September 2009. The hearing on
the permanent injunction and declaratory relief has now been rescheduled, and
all of Quicksilver’s claims, including those previously set for hearing in
September 2009, are set for trial in April 2010.
23
We are
defending ourselves vigorously in connection with the allegations in the
lawsuit. At this stage, we cannot predict the manner and timing of the
resolution of the lawsuit or its outcome, or estimate a range of possible
losses, if any, that could result in the event of an adverse verdict in the
lawsuit.
Although
we may, from time to time, be involved in litigation and claims arising out of
our operations in the normal course of business, we are not currently a party to
any material legal proceedings other than as mentioned above. In addition,
we are not aware of any material legal or governmental proceedings against us,
or contemplated to be brought against us, under the various environmental
protection statues to which we are subject.
We have
no independent assets or operations other than those of our
subsidiaries. BOLP or BOGP may guarantee debt securities that may be
issued by us and BreitBurn Finance Corporation, our wholly owned
subsidiary. See Note 1 for a description of BreitBurn Finance
Corporation. The guarantees will be full and unconditional and joint
and several.
|
17.
|
Subsequent
Events
|
In
October 2009, in connection with our semi-annual borrowing base redetermination,
our borrowing base was reaffirmed at $732 million. Our next
semi-annual borrowing base redetermination is scheduled for April
2010.
In
October 2009, 14,190 Common Units were issued to outside directors for phantom
units and distribution equivalent rights which were granted in 2006 and vested
in October 2009.
On
October 21, 2009, we completed the transfer and sale of our claims in the
bankruptcy cases filed by Lehman Brothers Commodity Services Inc. and Lehman
Brothers Holdings Inc. (together referred to as Lehman Brothers), to a third
party. The claims related to amounts owed to us by Lehman Brothers for crude oil
derivative contracts that were terminated on September 19, 2008 due to the
commencement of the bankruptcy case.
ASC 855
“Subsequent Events”
requires disclosure of the date through which an entity has evaluated subsequent
events and the basis for that date, that is, whether that date represents the
date the financial statements were issued or were available to be
issued. We have evaluated subsequent events through November 6, 2009,
the date of issuance of our financial statements for the quarter ended September
30, 2009.
24
Item 2. Management’s Discussion
and Analysis of Financial Condition and Results of
Operations
You
should read the following discussion and analysis in conjunction with
Management’s Discussion and Analysis in Part II—Item 7 of our Annual Report and
the consolidated financial statements and related notes herein and
therein. Our Annual Report contains a discussion of other matters not
included herein, such as disclosures regarding critical accounting policies and
estimates and contractual obligations. You should also read the
following discussion and analysis together with the cautionary statement
relevant to forward-looking information on page 1 of this report, Part II—Item
1A “—Risk Factors” of this report, Part II—Item 1A “—Risk Factors” of our
Quarterly Reports on Form 10-Q for the quarters ended March 31, 2009 and June
30, 2009 and the “Cautionary Statement Relevant to Forward Looking Information”
in our Annual Report and Part I—Item 1A “—Risk Factors’’ of our Annual
Report.
Overview
We are an
independent oil and gas partnership focused on the acquisition, exploitation and
development of oil and gas properties in the United States. Our
objective is to manage our oil and gas producing properties for the purpose of
generating cash flow and making distributions to our unitholders. Our
assets consist primarily of producing and non-producing crude oil and natural
gas reserves located in Northern Michigan, the Los Angeles Basin in California,
the Wind River and Big Horn Basins in central Wyoming, the Sunniland Trend in
Florida and the New Albany Shale in Indiana and Kentucky.
Given the
economic climate during 2009 and the ongoing distress in the financial and
credit markets, we elected to focus on financial flexibility and liquidity in
2009. Our goals for 2009 are to fund our operations, capital
expenditures, interest payments and reduction of bank debt from our internally
generated cash flow and to preserve financial flexibility and liquidity to
maintain our assets and operations in anticipation of future improvement in the
overall economic environment, commodity prices and financial
markets. Consistent with these goals, we took a number of significant
steps to reduce costs, conserve capital, generate cash flow and reduce
debt. These included:
|
a)
|
Capital
Spending Reductions - In response to last year’s substantial decline in
oil and natural gas prices, the outlook for the broader economy and the
turmoil in the financing markets, we elected to significantly reduce our
capital spending and drilling activity in 2009. Our original
capital program was expected to be approximately $24 million in 2009,
compared to approximately $129 million in 2008. However, this
quarter we accelerated capital spending for the balance of 2009 in light
of recent improvements in crude oil prices and declines in development
costs, and currently anticipate our capital expenditures to be
approximately $32 million in 2009. The increase will be focused
on capital spending for our oil producing properties including spending in
California for the drilling of wells and for facility optimization
projects, in Michigan for several drilling projects and facility
optimization projects and in Wyoming for the drilling of wells and well
optimization projects.
|
|
b)
|
General
and Administrative Expense Reductions - We conducted a comprehensive
review of costs during the first quarter of 2009 and made reductions in
numerous areas. Chief among these were the consolidation of
operating divisions and the elimination of a number of professional and
administrative positions, as well as significant targeted reductions in
other third party related expenses and incentive compensation
costs. Selective headcount reductions have continued throughout
the third quarter of 2009.
|
|
c)
|
Hedge
Monetization Program - In January 2009, we terminated a portion of our
2011 and 2012 crude oil and natural gas derivative contracts and replaced
them with new contracts for the same volumes at market
prices. We realized $45.6 million in net proceeds from this
termination which was used to reduce debt. In June 2009, we
terminated a portion of our 2011 and 2012 crude oil and natural gas
derivative contracts and replaced them with new contracts for the same
volumes at market prices. We realized $25.0 million in net
proceeds from this termination which was also used to reduce
debt.
|
|
d)
|
Sale
of Non-Core Assets - On July 17, 2009, we sold the Lazy JL Field located
in the Permian Basin of West Texas to a private buyer for $23 million in
cash. The proceeds from this transaction were used to reduce
debt.
|
|
e)
|
Reduction
of Bank Debt - We reduced our outstanding bank debt in 2009, by applying
the proceeds from the two monetization transactions, a portion of the cash
flow from operations for the first ten months of 2009 and the proceeds
from the sale of the Lazy JL Field (see Note 4 to our consolidated
financial statements contained elsewhere in this report). In
total, we have reduced our outstanding borrowings under our credit
facility by $160 million in the first ten months of 2009. As of
October 31, 2009, we had approximately $576 million in borrowings
outstanding under our credit
facility.
|
25
We will continue to consider
alternatives for increasing our liquidity on terms acceptable to us which may
include additional hedge monetizations, asset sales, issuance of new equity or
debt and other transactions. We reduced our outstanding bank debt by
approximately $55 million in the third quarter and continue to believe that
maintaining our financial flexibility by reducing our bank debt should remain a
priority. We plan to continue applying a portion of our cash flow
generated from operations to repayment of debt. Maintaining financial
flexibility in 2009 supports our stated long-term goals of providing stability
and growth, reinstatement of distributions to unitholders, and continuing to
follow our core investment strategy, which includes the following
principles:
|
·
|
Acquire
long-lived assets with low-risk exploitation and development
opportunities;
|
|
·
|
Use
our technical expertise and state-of-the-art technologies to identify and
implement successful exploitation techniques to optimize reserve
recovery;
|
|
·
|
Reduce
cash flow volatility through commodity price derivatives;
and
|
|
·
|
Maximize
asset value and cash flow stability through operating and technical
expertise.
|
Operational
Focus and Capital Expenditures
As
discussed above and consistent with our goals for 2009, we elected to
significantly reduce our capital expenditures and drilling activity in
2009. Because of the reduced capital program in 2009 and the natural
decline in our production rates, we expect to produce less oil and natural gas
in 2009 than we did in 2008. As crude oil prices have been improving,
and operating and development costs have been declining, we recently reviewed
and will continue to review the scope of our capital program and opportunities
to further accelerate capital spending in 2009, primarily on our oil producing
properties. We currently anticipate actual capital expenditures in
2009 to be approximately $32 million as compared to $129.5 million in
2008.
Our daily
production for the third quarter of 2009 averaged 17.7 MBoe/d, which was a 4
percent decrease from the same period a year ago. Our oil and gas
capital expenditures were $7.2 million in the third quarter of 2009 and $53.0
million in the third quarter of 2008.
Outlook
Our
revenues and net income are sensitive to oil and natural gas
prices. Our operating expenses are highly correlated to oil and
natural gas prices, and as commodity prices rise and fall, our operating
expenses will directionally rise and fall. Significant factors that
will impact near-term commodity prices include global demand for oil and natural
gas, political developments in oil producing countries, the extent to which
members of the OPEC and other oil exporting nations are able to manage oil
supply through export quotas and variations in key North American natural gas
and refined products supply and demand indicators.
In the
third quarter of 2009, WTI averaged $68 per barrel, compared with approximately
$118 per barrel a year earlier. In the first nine months of 2009, WTI
averaged $57 per barrel, compared to $113 per barrel a year
earlier. The average price for WTI in October 2009 was approximately
$76 per barrel. In 2008, the NYMEX WTI spot price averaged
approximately $100 per barrel. Crude-oil prices remain volatile and
have decreased significantly since they peaked at approximately $145 per barrel
in the middle of July 2008. Since January 2009, crude oil prices have
rebounded, but they remain volatile and are significantly lower than the 2008
average.
Prices
for natural gas have historically fluctuated widely and in many regional markets
are more closely aligned with supply and demand conditions in those
markets. Fluctuations in the price for natural gas in the United
States are closely associated with the volumes produced in North America and the
inventory in underground storage relative to customer demand. U.S.
natural gas prices are also typically higher during the winter period when
demand for heating is greatest. In the first nine months of 2009, the
NYMEX wholesale natural gas price was very volatile and ranged from a low of
$2.51 per MMBtu to a high of $6.07 per MMBtu. The average NYMEX
wholesale natural gas price in October 2009 was approximately $4.78 per
MMBtu. During 2008, the monthly average NYMEX wholesale natural gas
price ranged from a low of $5.79 per MMBtu for December to a high of $12.78 per
MMBtu for June.
26
While our
commodity price risk management program is intended to reduce our exposure to
commodity prices and assist with stabilizing cash flow and distributions, to the
extent we have hedged a significant portion of our expected production and the
cost for goods and services increases, our margins would be adversely
affected.
Operating
expenses are the costs incurred in the operation of producing
properties. Our operating expenses have decreased by $18.7 million in
the first nine months of 2009 as compared to the same period of 2008 primarily
due to our cost cutting efforts including the consolidation of operating
divisions and the elimination of a number of employee positions in
operations. Also contributing to the decrease in operating expenses
is the decline in oil and natural gas prices since July
2008. Historically operating costs have been highly correlated to
commodity prices. Expenses for utilities, direct labor, water
injection and disposal, production taxes and materials and supplies comprise the
most significant portion of our operating expenses. A majority of our
operating cost components are variable and increase or decrease along with our
levels of production. For example, we incur power costs in connection
with various production related activities such as pumping to recover oil and
gas, separation and treatment of water produced in connection with our oil and
gas production, and re-injection of water produced into the oil producing
formation to maintain reservoir pressure. Although these costs
typically vary with production volumes, they are driven not only by volumes of
oil and gas produced but also volumes of water
produced. Consequently, fields that have a high percentage of water
production relative to oil and gas production, also known as a high water cut,
will experience higher levels of power costs for each Boe
produced. Certain items, however, such as direct labor and materials
and supplies, generally remain relatively fixed across broad production volume
ranges, but can fluctuate depending on activities performed during a specific
period. For instance, repairs to our pumping equipment or surface
facilities result in increased expenses in periods during which they are
performed.
Starting
in the first quarter of 2009, we have shifted regional operation management
costs from general and administrative expenses to lease operating expenses to
better align our operating and management costs with our organization structure
and to be more consistent with industry practice. For comparability, the results
for the quarter and nine months ended September 30, 2008 have been reclassified
to reflect this shift.
27
Results
of Operations
The table
below summarizes certain of the results of operations for the periods
indicated. The data for all periods reflects our results as they are
presented in our unaudited consolidated financial statements included elsewhere
in this report.
|
Three
Months Ended
|
Nine
Months Ended
|
|||||||||||||||||||||||||||||||
|
September
30,
|
Increase
/
|
September
30,
|
Increase
/
|
|||||||||||||||||||||||||||||
|
Thousands
of dollars, except as indicated
|
2009
|
2008
|
(Decrease)
|
%
|
2009
|
2008
|
(Decrease)
|
%
|
||||||||||||||||||||||||
|
Total
production (MBoe)
|
1,628 | 1,689 | (61 | ) | -4 | % | 4,885 | 5,120 | (235 | ) | -5 | % | ||||||||||||||||||||
|
Oil
and NGLs (MBoe)
|
743 | 762 | (19 | ) | -2 | % | 2,247 | 2,311 | (64 | ) | -3 | % | ||||||||||||||||||||
|
Natural
gas (MMcf)
|
5,308 | 5,564 | (256 | ) | -5 | % | 15,826 | 16,854 | (1,028 | ) | -6 | % | ||||||||||||||||||||
|
Average
daily production (Boe/d)
|
17,697 | 18,359 | (662 | ) | -4 | % | 17,894 | 18,686 | (792 | ) | -4 | % | ||||||||||||||||||||
|
Sales
volumes (MBoe)
|
1,605 | 1,657 | (52 | ) | -3 | % | 4,823 | 5,098 | (275 | ) | -5 | % | ||||||||||||||||||||
|
Average
realized sales price (per Boe) (a) (b) (c)
|
$ | 54.37 | $ | 64.17 | (9.79 | ) | -15 | % | $ | 53.96 | $ | 61.92 | $ | (7.96 | ) | -13 | % | |||||||||||||||
|
Oil
and NGLs (per Boe) (a) (b) (c)
|
67.40 | 81.82 | (14.42 | ) | -18 | % | 65.08 | 76.78 | (11.70 | ) | -15 | % | ||||||||||||||||||||
|
Natural
gas (per Mcf) (a) (b)
|
7.30 | 8.38 | (1.08 | ) | -13 | % | 7.45 | 8.30 | (0.85 | ) | -10 | % | ||||||||||||||||||||
|
Oil,
natural gas and NGL sales (d)
|
$ | 62,674 | $ | 130,249 | (67,575 | ) | -52 | % | $ | 180,189 | $ | 386,060 | (205,871 | ) | -53 | % | ||||||||||||||||
|
Realized
gains (losses) on commodity derivative instruments (e)
|
24,356 | (24,123 | ) | 48,479 | n/a | 149,912 | (70,895 | ) | 220,807 | n/a | ||||||||||||||||||||||
|
Unrealized
gains (losses) on commodity derivative instruments (e)
|
(11,637 | ) | 431,564 | (443,201 | ) | -103 | % | (164,432 | ) | 41,667 | (206,099 | ) | n/a | |||||||||||||||||||
|
Other
revenues, net
|
261 | 806 | (545 | ) | -68 | % | 930 | 2,324 | (1,394 | ) | -60 | % | ||||||||||||||||||||
|
Total
revenues
|
$ | 75,654 | $ | 538,496 | (462,842 | ) | -86 | % | $ | 166,599 | $ | 359,156 | (192,557 | ) | -54 | % | ||||||||||||||||
|
Lease
operating expenses and processing fees
|
$ | 29,052 | $ | 35,611 | (6,559 | ) | -18 | % | $ | 86,720 | $ | 93,405 | (6,685 | ) | -7 | % | ||||||||||||||||
|
Production
and property taxes
|
4,422 | 7,814 | (3,392 | ) | -43 | % | 13,315 | 24,378 | (11,063 | ) | -45 | % | ||||||||||||||||||||
|
Total
lease operating expenses
|
$ | 33,474 | $ | 43,425 | (9,951 | ) | -23 | % | $ | 100,035 | $ | 117,783 | (17,748 | ) | -15 | % | ||||||||||||||||
|
Transportation
expenses
|
799 | 351 | 448 | 128 | % | 2,898 | 3,081 | (183 | ) | -6 | % | |||||||||||||||||||||
|
Purchases
|
18 | 118 | (100 | ) | -85 | % | 58 | 296 | (238 | ) | -80 | % | ||||||||||||||||||||
|
Change
in inventory
|
(403 | ) | (1,979 | ) | 1,576 | n/a | (2,818 | ) | (2,208 | ) | (610 | ) | n/a | |||||||||||||||||||
|
Uninsured
loss
|
- | - | - | n/a | 100 | - | 100 | n/a | ||||||||||||||||||||||||
|
Total
operating costs
|
$ | 33,888 | $ | 41,915 | (8,027 | ) | -19 | % | $ | 100,273 | $ | 118,952 | (18,679 | ) | -16 | % | ||||||||||||||||
|
Lease
operating expenses pre taxes per Boe (f)
|
$ | 17.53 | $ | 20.77 | (3.25 | ) | -16 | % | $ | 17.43 | $ | 17.94 | $ | (0.51 | ) | -3 | % | |||||||||||||||
|
Production
and property taxes per Boe
|
2.72 | $ | 4.63 | (1.91 | ) | -41 | % | 2.73 | 4.76 | (2.04 | ) | -43 | % | |||||||||||||||||||
|
Total
lease operating expenses per Boe
|
20.25 | 25.40 | (5.15 | ) | -20 | % | 20.16 | 22.70 | (2.54 | ) | -11 | % | ||||||||||||||||||||
|
Depletion,
depreciation and amortization (DD&A)
|
$ | 24,130 | $ | 21,477 | 2,653 | 12 | % | $ | 81,393 | $ | 64,228 | 17,165 | 27 | % | ||||||||||||||||||
|
DD&A
per Boe
|
14.82 | 12.72 | 2.11 | 17 | % | 16.66 | 12.54 | 4.12 | 33 | % | ||||||||||||||||||||||
|
(a)
Includes realized gains (losses) on commodity derivative
instruments.
|
||||||||||||||||||||||||||||||||
|
(b)
Excludes the effects of the early terminations of hedge contracts
monetized in January 2009 ($32,317 of oil hedges and $13,315 of natural
gas hedges) and June 2009 ($6,030 of oil hedges and $18,925 of natural gas
hedges).
|
||||||||||||||||||||||||||||||||
|
(c)
Excludes amortization of an intangible asset related to crude oil sales
contracts. Includes crude oil purchases.
|
||||||||||||||||||||||||||||||||
|
(d)
Includes amortization of an intangible asset related to crude oil sales
contracts.
|
||||||||||||||||||||||||||||||||
|
(e)
Includes the effects of the early terminations of hedge contracts
monetized in January 2009 for $45,632 and June 2009 for
$24,955.
|
||||||||||||||||||||||||||||||||
|
(f)
Includes lease operating expenses and processing fees. Excludes
amortization of intangible asset related to the Quicksilver
Acquisition.
|
||||||||||||||||||||||||||||||||
28
Comparison
of Results for the Three Months and Nine Months Ended September 30, 2009 and
2008
The
variance in our results was due to the following components:
Production
For the
quarter ended September 30, 2009 as compared to the same period a year ago,
production volumes decreased by 61 MBoe, or 4 percent. This decrease
was primarily due to natural field declines in Michigan, Indiana and Kentucky,
which decreased by 24 MBoe (147 MMcfe), in Florida, which decreased by 11 MBbl,
and in Wyoming, which decreased by 6 MBoe. We also sold our Lazy JL
Field properties effective July 1, 2009, which produced 19 MBoe in the third
quarter of 2008. For the nine months ended September 30, 2009 as
compared to the same period a year ago, production volumes decreased by 235
MBoe, or 5 percent, primarily due to natural field declines in Michigan, Indiana
and Kentucky, which accounted for 134 MBoe of the decrease. In
addition, for the nine months ended September 30, 2009 as compared to the same
period a year ago, Florida production was 65 MBbl lower due to natural field
declines and four Florida wells that were offline for most of the first quarter
of 2009, California production was 20 MBoe lower due to natural field declines
and Texas production was l7 MBoe lower due to the sale of our Lazy JL
Field.
Revenues
Oil,
natural gas and NGLs sales revenue decreased $67.6 million in the third quarter
of 2009 as compared to the third quarter of 2008, due to lower commodity prices
and lower sales volume. Realized gains from commodity derivative
instruments during the third quarter of 2009 were $24.3 million compared to
realized losses of $24.1 million in the third quarter of 2008, due to lower
commodity prices in the third quarter of 2009 as compared to the third quarter
of 2008. Unrealized losses on commodity derivative instruments were $11.6
million in the third quarter of 2009, which was due to an increase in commodity
futures prices in the third quarter of 2009. This compares to
unrealized gains of $431.6 million in the third quarter of 2008, which was due
to the significant decline in commodity prices during the third quarter of
2008.
Oil,
natural gas and NGLs sales revenue decreased $205.9 million in the first nine
months of 2009 as compared to the first nine months of 2008. Realized
gains from commodity derivative instruments during the first nine months of 2009
were $149.9 million compared to realized losses of $70.9 million in the first
nine months of 2008. Unrealized losses on commodity derivative instruments
were $164.4 million in the first nine months of 2009 compared to unrealized
gains of $41.7 million in the first nine months of 2008. The effect of net
proceeds of $45.6 million in hedge contracts monetized in January 2009 and $25.0
million in June 2009 are reflected in realized and unrealized gains and losses
on commodity derivative instruments in the first nine months of
2009.
Lease
operating expenses
Pre-tax
lease operating expenses and processing fees for the third quarter of 2009
totaled $29.1 million, or $17.53 per Boe, which is 16 percent lower per Boe than
the third quarter of 2008. The decrease in per Boe lease operating
expenses is primarily attributable to our cost cutting efforts, including the
consolidation of operating divisions, and the decline in oil and natural gas
prices since July 2008. For the third quarter of 2009, $2.9 million
or $1.78 per Boe of regional management costs were included in lease operating
expenses compared to $2.4 million or $1.42 per Boe for the third quarter of
2008.
Production
and property taxes for the third quarter of 2009 totaled $4.4 million, or $2.72
per Boe, which is 41 percent lower per Boe than the third quarter of
2008. The decreases in production and property taxes compared to last
year result primarily from lower commodity prices.
Pre-tax
lease operating expenses and processing fees, for the first nine months of 2009
totaled $86.7 million, or $17.43 per Boe, which is 3 percent lower per Boe than
the first nine months of 2008. The decrease in per Boe lease
operating expenses is primarily attributable to cost cutting efforts and the
lower commodity price environment in 2009. For the first nine months
of 2009, $7.9 million or $1.62 per Boe of regional management costs were
included in lease operating expenses compared to $8.7 million or $1.71 per Boe
for the first nine months of 2008. The decrease in regional
management costs as compared to the first nine months of 2008 is primarily due
to the consolidation of operating divisions in early 2009. Production
and property taxes for the first nine months of 2009 totaled $13.3 million, or
$2.73 per Boe, which is 43 percent lower per Boe than the first nine months of
2008.
Transportation
expenses
In
Florida, our crude oil sales are transported from the field by trucks and
pipelines and then transported by barge to the sale
point. Transportation costs incurred in connection with such
operations are reflected as an operating cost on the consolidated statement of
operations. In the third quarter of 2009 and 2008, transportation
costs totaled $0.8 million and $0.4 million, respectively. In the
first nine months of 2009 and 2008, transportation costs totaled $2.9 million
and $3.1 million, respectively.
29
Change
in inventory
In
Florida, our crude oil sales are a function of the number and size of crude oil
shipments in each quarter and thus crude oil sales do not always coincide with
volumes produced in a given quarter. Sales occur on average every six
to eight weeks. We match production expenses with crude oil
sales. Production expenses associated with unsold crude oil inventory
are credited to operating costs through the change in inventory
account. Production expenses are charged to operating costs through
the change in inventory account when they are sold. For the third
quarter of 2009 and 2008, the change in inventory account amounted to $(0.4)
million and $(2.0) million, respectively. For the first nine months
of 2009 and 2008, the change in inventory account amounted to $(2.8) million and
$(2.2) million, respectively.
Depletion,
depreciation and amortization
Depletion,
depreciation and amortization (“DD&A”) expense totaled $24.1 million, or
$14.82 per Boe, in the third quarter of 2009, an increase of approximately 17
percent per Boe from the same period a year ago. The increase in
DD&A compared to last year is primarily due to price related reserve
revisions at year end 2008 and their impact on 2009 DD&A rates.
DD&A
expense totaled $81.4 million, or $16.66 per Boe, for the first nine months of
2009, an increase of approximately 33 percent per Boe from the same period a
year ago.
General
and administrative expenses
Our
general and administrative (“G&A”) expenses totaled $9.3 million and $6.5
million for the quarters ended September 30, 2009 and 2008,
respectively. This included $3.5 million and $0.5 million,
respectively, in unit-based compensation expense related to management incentive
plans. For the third quarter of 2009, G&A expenses, excluding
unit-based compensation, were $5.8 million, which was $0.2 million lower than
the third quarter of 2008. This decrease is primarily due to expense
reductions including the elimination of a number of professional and
administrative positions.
G&A
expenses totaled $27.3 million and $24.1 million for the nine months ended
September 30, 2009 and 2008, respectively. This included $9.7 million
and $4.8 million, respectively, in unit-based compensation expense related to
management incentive plans. The increase in unit-based compensation
expense was primarily due to new awards granted in first quarter of
2009. For the first nine months of 2009, G&A expenses, excluding
unit-based compensation, were $17.6 million, which was $1.7 million lower than
the first nine months of 2008 primarily due to our focus on reducing
costs.
Loss
on sale of assets
Loss on
sale of assets totaled $5.5 million for the quarter and nine months ended
September 30, 2009. In the third quarter of 2009, we sold the Lazy JL
Field and recognized a loss of $5.5 million related to the sale. We
had no loss on sale of assets in 2008.
Interest
and other financing costs
Our
interest and financing costs totaled $4.5 million and $9.0 million for the three
months ended September 30, 2009 and 2008, respectively. This decrease
in interest expense is primarily attributable to a lower average debt balance
and lower interest rates. We are subject to interest rate risk
associated with loans under our credit facility that bear interest based on
floating rates. See Part I—Item 3 within this report for a discussion
of our interest rate derivative contracts. We had realized losses of
$3.4 million and $1.3 million for the three months ended September 30, 2009 and
2008, respectively, relating to our interest rate derivative
contracts. We had unrealized losses of $0.4 million and $1.7 million
for the quarters ended September 30, 2009 and 2008, respectively, relating to
our interest rate derivative contracts.
Our
interest and financing costs totaled $14.7 million and $19.6 million for the
nine months ended September 30, 2009 and 2008, respectively. This
decrease in interest expense is attributable to lower interest rates partially
offset by a higher average debt balance. We had realized losses of
$9.7 million and $1.7 million for the nine months ended September 30, 2009 and
2008, respectively, relating to our interest rate derivative
contracts. We had an unrealized gain of $4.1 million and an
unrealized loss of $2.3 million for the nine months ended September 30, 2009 and
2008, respectively, relating to our interest rate derivative
contracts.
30
Credit
and Counterparty Risk
Financial
instruments which potentially subject us to concentrations of credit risk
consist principally of derivatives and accounts receivable. Our
derivatives expose us to credit risk from counterparties. As of
September 30, 2009 and October 31, 2009, our derivative counterparties
were Barclays Bank PLC, Bank of Montreal, Citibank, N.A, Credit Suisse
International, Credit Suisse Energy LLC, Union Bank N.A., Wells Fargo Bank N.A.,
JP Morgan Chase Bank N.A., Royal Bank of Scotland plc, The Bank of Nova Scotia
and Toronto-Dominion Bank. Our counterparties are all lenders
who participate in our Amended and Restated
Credit Agreement. During 2008 and 2009, there has been extreme
volatility and disruption in the capital and credit
markets which reached unprecedented levels and may adversely
affect the financial condition of our derivative counterparties. On
all transactions where we are exposed to counterparty risk, we analyze the
counterparty's financial condition prior to entering into an agreement,
establish limits, and monitor the appropriateness of these limits on an ongoing
basis. We periodically obtain credit default swap information on our
counterparties. As of September 30, 2009 and October 31, 2009,
each of these financial institutions carried an S&P credit rating of A- or
above. Although we currently do not believe we have a specific
counterparty risk with any party, our loss could be substantial if any of these
parties were to default. As of September 30, 2009, our largest
derivative asset balances were with JP Morgan Chase Bank N.A., who accounted for
approximately 61 percent of our derivative asset balances, and Credit Suisse
International and Credit Suisse Energy LLC, who together accounted for
approximately 27 percent of our derivative asset balances.
Accounts
receivable are primarily from purchasers of oil and natural gas
products. We have a portfolio of crude oil and natural gas sales
contracts with large, established refiners and utilities. Because our
products are commodity products sold primarily on the basis of price and
availability, we are not dependent upon one purchaser or a small group of
purchasers. During the nine months ended September 30, 2009, our
largest purchasers were ConocoPhillips, Marathon Oil Company and Plains
Marketing and Transportation LLC, who accounted for 30 percent, 16 percent and
12 percent of total net sales revenue, respectively.
31
Liquidity
and Capital Resources
Our
primary sources of liquidity are cash generated from operations and amounts
available under our revolving credit facility. Historically, our
primary uses of cash have been for our operating expenses, capital expenditures
and cash distributions to unitholders.
In April
2009, as a result of a redetermination of our credit facility borrowing base to
$760 million, we suspended making distributions to our
unitholders. We reduced our outstanding bank debt by approximately
$55 million in the third quarter of 2009 and continue to believe that
maintaining our financial flexibility by reducing our bank debt should remain a
priority. We plan to continue applying a portion of our cash flow
generated from operations to repayment of that debt.
We began
reducing our outstanding bank debt in 2009 by applying the proceeds from the two
monetization transactions, a portion of the cash flow from operations for the
first ten months of 2009 and the proceeds from the July sale of the Lazy JL
Field. In total, we have reduced our outstanding borrowings under our
credit facility by approximately $151 million in the first nine months of
2009. As of September 30, 2009 and October 31, 2009, we had
approximately $585 million and $576 million, respectively, in borrowings
outstanding under our credit facility.
Operating
activities. Our cash flow from operating activities for the
nine months ended September 30, 2009 was $184.0 million. Our cash
flow from operations for the nine months ended September 30, 2008 was $191.0
million. Included in cash flow from operating activities in the 2009
period are realized gains on commodity derivatives of $149.9 million including
net proceeds of $45.6 million and $25.0 million in hedge contract monetizations
completed in January and June 2009, respectively. See “Liquidity”
below. Offsetting the impact of realized gains on commodity
derivatives, including the 2009 monetizations, is lower crude oil and natural
gas revenues compared to prior year due to lower commodity prices.
Investing
activities. Net cash provided by investing activities for the
nine months ended September 30, 2009 was $4.4 million, which included proceeds
from the sale of the Lazy JL Field of $23.0 million offset by capital
expenditures of $18.6 million spent primarily on facility and infrastructure
projects and well recompletions. Net cash used in investing
activities for the nine months ended September 30, 2008 was $96.8 million, which
was spent on capital expenditures, primarily drilling and completion, and on
property acquisitions. We elected to reduce our capital spending and
drilling activity in 2009 partially due to last year’s substantial decline in
oil and natural gas prices.
Financing
activities. Net cash used in financing activities for the nine
months ended September 30, 2009 was $188.7 million. Our cash
distributions totaled $28.0 million. We had outstanding borrowings
under our credit facility of $585.0 million at September 30, 2009 and $736.0
million at December 31, 2008. For the nine months ended September 30,
2009, we borrowed $218.5 million and repaid $369.5 million under the credit
facility. For the nine months ended September 30, 2008, we purchased
$336.2 million in Common Units, made cash distributions of $93.3 million,
borrowed $659.1 million and repaid $321.5 million.
Liquidity. Our
goals for 2009 are to fund our operations, capital expenditures, interest
payments and reduction of bank debt from our internally generated cash flow and
to preserve financial flexibility and liquidity to maintain our assets and
operations in anticipation of future improvement in the overall economic
environment, commodity prices and the financial markets.
In
response to last year’s rapid and substantial decline in oil and natural gas
prices, the outlook for the broader economy and the turmoil in the financing
markets, we elected to significantly reduce our capital expenditures and
drilling activity in 2009. Our original capital program was expected
to be approximately $24 million in 2009, compared to approximately $129 million
in 2008. However, this quarter we accelerated capital spending for
the balance of 2009 in light of recent improvements in crude oil prices and
declines in development costs, and currently anticipate our capital expenditures
to be approximately $32 million in 2009. See “Overview” section of
Part I—Item 2 “—Management’s Discussion and Analysis of Financial Condition and
Results of Operations.
In
January 2009, we terminated a portion of our 2011 and 2012 crude oil derivative
contracts and replaced them with new contracts for the same volumes at market
prices. We realized $32.3 million from this
termination. In January 2009, we also terminated a portion of our
2011 and 2012 natural gas derivative contracts and replaced them with new
contracts with the same counterparty for the same volumes at market
prices. We realized $13.3 million from this
termination. Proceeds from these contracts were used to pay down
outstanding borrowings under our credit facility.
32
In June
2009, we terminated a portion of our 2011 and 2012 crude oil and natural gas
derivative contracts and replaced them with new contracts for the same volumes
at market prices. We realized $18.9 million from the termination of
natural gas derivative contracts and $6.1 million from the termination of crude
oil contracts. Net proceeds from these contracts were used to pay
down outstanding borrowings under our credit facility.
In July
2009, we sold the Lazy JL Field located in the Permian Basin of West Texas to a
private buyer for $23 million in cash. The proceeds from this
transaction were used to pay down outstanding borrowings under our credit
facility.
In the first nine months of 2009, we
have reduced our outstanding borrowings under our credit facility by
approximately $151 million. As of September 30, 2009 and October 31,
2009, we had approximately $585 million and $576 million, respectively, in
borrowings outstanding under our credit facility.
Successfully
pursuing acquisitions remains a part of our long-term strategy. However, a
continuation of the economic downturn could result in continued reduced demand
for oil and natural gas and keep downward pressure on commodity
prices. As discussed, these price declines have negatively
impacted our revenues and cash flows. This, together with the
contraction in the debt and equity markets and the redetermination of our
borrowing base, have limited our ability to pursue and
complete significant acquisitions during 2009.
Credit
Facility
On
November 1, 2007, in connection with the Quicksilver Acquisition, BOLP, as
borrower, and we and our wholly-owned subsidiaries, as guarantors, entered into
the four year, $1.5 billion Amended and Restated Credit
Agreement. Our credit facility limits the amounts we can borrow to a
borrowing base amount determined by the lenders at their sole discretion based
on their evaluation of our proved reserves and their internal criteria. The initial borrowing
base under the Amended and Restated Credit Agreement was $700 million and was
increased to $750 million on April 10, 2008. On June 17, 2008, in
connection with the Purchase, Contribution and Partnership Transactions, we and
our wholly-owned subsidiaries entered into Amendment No. 1 to the Amended and
Restated Credit Agreement with the Agent, which increased the borrowing base
available under the Amended and Restated Credit Agreement, from $750 million to
$900 million. Under the Amended and Restated Credit Agreement,
borrowings may be used (i) to pay a portion of the purchase price for the
Quicksilver Acquisition and related expenses, (ii) for standby letters of
credit, (iii) for working capital purposes, (iv) for general company
purposes and (v) for certain acquisitions and payments permitted by the credit
facility. Borrowings under the Amended and Restated Credit Agreement
are secured by a first-priority lien on and security interest in substantially
all of our and certain of our subsidiaries’ assets. As of September
30, 2009 and December 31, 2008, we had approximately $585 million and $736
million, respectively, in indebtedness outstanding under the Amended and
Restated Credit Agreement. As of October 31, 2009, we had
approximately $576 million in indebtedness outstanding under our credit
facility. Our credit facility will mature on November 1,
2011.
In April
2009, our borrowing base under our Amended and Restated Credit Agreement was
redetermined at $760 million, primarily as a result of the steep decline in oil
and natural gas prices. The redetermination was completed with no
modifications to the terms of the facility, including no additional fees and no
increase in borrowing rates, which are currently very advantageous for
us. In June 2009, in connection with the June 2009 termination of
derivative contracts, our borrowing base was reduced to $735
million. On July 17, 2009, the borrowing base was reduced by $3
million to $732 million as a result of the sale of the Lazy JL
Field. See Note 17 to our consolidated financial statements contained
elsewhere in this report for a discussion of the borrowing base
reduction. We have no other debt outstanding other than borrowings
under the facility. Our semi-annual borrowing base was redetermined
in October 2009, as a result of which our borrowing base remains unchanged at
$732 million. Oil and natural gas prices remain volatile, and we
expect that the lenders under our credit facility may further decrease our
borrowing base at the next scheduled redetermination in April
2010. We will continue to consider alternatives for increasing our
liquidity on terms acceptable to us which may include additional hedge
monetizations, asset sales, issuance of new equity or debt and other
transactions.
33
As of
October 31, 2009, the lending group under the Amended and Restated Credit
Agreement included 18 banks. Of the $732 million in total commitments
under the credit facility, Wells Fargo Bank, National Association held
approximately 12.6 percent of the commitments. Ten banks held between
5 percent and 7.5 percent of the commitments, including Union Bank N.A., BMO
Capital Markets Financing, Inc., The Bank of Nova Scotia, US Bank National
Association, Credit Suisse (Cayman Islands), Bank of Scotland plc, Barclays Bank
PLC, BNP Paribas, Fortis Capital Corporation and The Royal Bank of Scotland,
plc, with each remaining lender holding less than 5 percent of the
commitments. In addition to our relationships with these institutions
under the credit facility, from time to time we engage in other transactions
with a number of these institutions. Such institutions or their
affiliates may serve as underwriter or initial purchaser of our debt and equity
securities and/or serve as counterparties to our commodity and interest rate
derivative agreements.
The
Amended and Restated Credit Agreement contains customary covenants, including
restrictions on our ability to: incur additional indebtedness; make certain
investments, loans or advances; make distributions to unitholders or repurchase
units unless after giving effect to such distribution, our outstanding debt is
less than 90 percent of the borrowing base, and we have the ability to borrow at
least 10 percent of the borrowing base while remaining in compliance with all
terms and conditions of our credit facility, including the leverage ratio not
exceeding 3.50 to 1.00 (which is total indebtedness to EBITDAX); make
dispositions; or enter into a merger or sale of our property or assets,
including the sale or transfer of interests in our subsidiaries. In
2009, we expect to continue to reduce our outstanding bank debt with cash from
our operations.
The
Amended and Restated Credit Agreement also requires us to maintain a leverage
ratio (defined as the ratio of total debt to EBITDAX) as of the last day of each
quarter, on a last twelve month basis, of not more than 3.50 to
1.00. In addition, the Amended and Restated Credit Agreement requires
us to maintain a current ratio as of the last day of each quarter, of not less
than 1.00 to 1.00. Furthermore, we are required to maintain an
interest coverage ratio (defined as the ratio of EBITDAX to consolidated
interest expense) as of the last day of each quarter, of not less than 2.75 to
1.00. As of September 30, 2009, we were in compliance with these
covenants.
The
events that constitute an Event of Default (as defined in the Amended and
Restated Credit Agreement) include: payment defaults; misrepresentations;
breaches of covenants; cross-default and cross-acceleration to certain other
indebtedness; adverse judgments against us in excess of a specified amount;
changes in management or control; loss of permits; failure to perform under a
material agreement; certain insolvency events; assertion of certain
environmental claims; and occurrence of a material adverse effect.
Please
see Part II—Item 1A “—Risk Factors — Risks Related to Our Business — Our credit
facility has substantial restrictions and financial covenants that may restrict
our business and financing activities and our ability to pay distributions”
below for more information on the effect of an event of default under the
Amended and Restated Credit Facility.
As of
September 30, 2009, we do not have any off-balance sheet
arrangements. As of September 30, 2009 and December 31, 2008, our
asset retirement obligation was $35.7 million and $30.1 million,
respectively.
34
Item 3. Quantitative and Qualitative
Disclosures About Market Risk
The
primary objective of the following information is to provide forward-looking
quantitative and qualitative information about our potential exposure to market
risks. The term ‘‘market risk’’ refers to the risk of loss arising
from adverse changes in oil and gas prices and interest rates. The
disclosures are not meant to be precise indicators of expected future losses,
but rather indicators of reasonably possible losses. This
forward-looking information provides indicators of how we view and manage our
ongoing market risk exposures. All of our market risk sensitive
instruments were entered into for purposes other than speculative
trading. Please see “Cautionary Statement Relevant to Forward-Looking
Information.”
Commodity Price
Risk
Due to
the historical volatility of crude oil and natural gas prices, we have entered
into various derivative instruments to manage exposure to volatility in the
market price of crude oil and natural gas. We use options (including
collars) and fixed price swaps for managing risk relating to commodity
prices. All contracts are settled with cash and do not require the
delivery of physical volumes to satisfy settlement. While this
strategy may result in our having lower revenues than we would otherwise have if
we had not utilized these instruments in times of higher oil and natural gas
prices, management believes that the resulting reduced volatility of prices and
cash flow is beneficial. While our commodity price risk management
program is intended to reduce our exposure to commodity prices and assist with
stabilizing cash flow, to the extent we have hedged a significant portion of our
expected production and the cost for goods and services increases, our margins
would be adversely affected. Please see Part I— Item 1A “—Risk
Factors — Risks Related to Our Business — Our derivative activities could result
in financial losses or could reduce our income, which may adversely affect our
ability to pay distributions to our unitholders. To the extent we
have hedged a significant portion of our expected production and actual
production is lower than expected or the costs of goods and services increase,
our profitability would be adversely affected” in our Annual
Report.
35
As of
September 30, 2009, we had the following derivatives as summarized below
(utilizing NYMEX WTI and NYMEX wholesale natural gas
prices):
|
Year
|
||||||||||||||||||||
|
2009
|
2010
|
2011
|
2012
|
2013
|
||||||||||||||||
|
Gas
Positions:
|
||||||||||||||||||||
|
Fixed
Price Swaps:
|
||||||||||||||||||||
|
Hedged
Volume (MMBtu/d)
|
22,362 | 43,869 | 25,955 | 19,129 | 27,000 | |||||||||||||||
|
Average
Price ($/MMBtu)
|
$ | 8.16 | $ | 8.20 | $ | 7.26 | $ | 7.10 | $ | 6.92 | ||||||||||
|
Collars:
|
||||||||||||||||||||
|
Hedged
Volume (MMBtu/d)
|
1,063 | 3,405 | 16,016 | 19,129 | - | |||||||||||||||
|
Average
Floor Price ($/MMBtu)
|
$ | 9.00 | $ | 9.00 | $ | 9.00 | $ | 9.00 | $ | - | ||||||||||
|
Average
Ceiling Price ($/MMBtu)
|
$ | 15.40 | $ | 12.79 | $ | 11.28 | $ | 11.89 | $ | - | ||||||||||
|
Total:
|
||||||||||||||||||||
|
Hedged
Volume (MMMBtu/d)
|
23,424 | 47,275 | 41,971 | 38,257 | 27,000 | |||||||||||||||
|
Average
Price ($/MMBtu)
|
$ | 8.20 | $ | 8.26 | $ | 7.92 | $ | 8.05 | $ | 6.92 | ||||||||||
|
Oil
Positions:
|
||||||||||||||||||||
|
Fixed
Price Swaps:
|
||||||||||||||||||||
|
Hedged
Volume (Bbls/d)
|
1,468 | 2,808 | 2,616 | 2,539 | 3,500 | |||||||||||||||
|
Average
Price ($/Bbl)
|
$ | 70.18 | $ | 81.35 | $ | 66.22 | $ | 67.24 | $ | 76.79 | ||||||||||
|
Participating
Swaps: (a)
|
||||||||||||||||||||
|
Hedged
Volume (Bbls/d)
|
1,205 | 1,993 | 1,439 | - | - | |||||||||||||||
|
Average
Price ($/Bbl)
|
$ | 66.48 | $ | 64.40 | $ | 61.29 | $ | - | $ | - | ||||||||||
|
Average
Participation %
|
60.7 | % | 55.5 | % | 53.2 | % | - | - | ||||||||||||
|
Collars:
|
||||||||||||||||||||
|
Hedged
Volume (Bbls/d)
|
257 | 1,279 | 2,048 | 2,477 | - | |||||||||||||||
|
Average
Floor Price ($/Bbl)
|
$ | 89.57 | $ | 102.85 | $ | 103.42 | $ | 110.00 | $ | - | ||||||||||
|
Average
Ceiling Price ($/Bbl)
|
$ | 118.83 | $ | 136.16 | $ | 152.61 | $ | 145.39 | $ | - | ||||||||||
|
Floors:
|
||||||||||||||||||||
|
Hedged
Volume (Bbls/d)
|
250 | 500 | - | - | - | |||||||||||||||
|
Average
Floor Price ($/Bbl)
|
$ | 100.00 | $ | 100.00 | $ | - | $ | - | $ | - | ||||||||||
|
Total:
|
||||||||||||||||||||
|
Hedged
Volume (Bbls/d)
|
3,180 | 6,580 | 6,103 | 5,016 | 3,500 | |||||||||||||||
|
Average
Price ($/Bbl)
|
$ | 72.69 | $ | 81.81 | $ | 77.51 | $ | 88.35 | $ | 76.79 | ||||||||||
(a) A
participating swap combines a swap and a call option with the same strike
price.
36
We enter
into swaps, collars and option contracts in order to mitigate the risk of market
price fluctuations to achieve more predictable cash flows. While our
current use of these derivative instruments limits the downside risk of adverse
price movements, it also limits future revenues from favorable price
movements. The use of derivatives also involves the risk that the
counterparties to such instruments will be unable to meet the financial terms of
such contracts.
In order
to qualify for hedge accounting, the relationship between the hedging instrument
and the hedged item must be highly effective in achieving the offset of changes
in cash flows attributable to the hedged risk both at the inception of the
contract and on an ongoing basis. We measure effectiveness on a
quarterly basis. Hedge accounting is discontinued prospectively when
a hedge instrument is no longer considered highly effective. Our
derivative instruments do not currently qualify for hedge accounting under ASC
815 due to the ineffectiveness created by variability in our price discounts or
differentials. For instance, our physical oil sales contracts for our
Wyoming properties are tied to the price of Bow River crude oil, while its
derivative contracts are tied to NYMEX WTI crude oil prices. During
2008, the average discounts we received for our production relative to NYMEX WTI
benchmark prices per barrel were $5.15, $18.86 and $14.45 for our California,
Wyoming and Florida-based production, respectively. During the third
quarter of 2009, the average discounts we received for our production relative
to NYMEX WTI benchmark prices per barrel were $0.63, $8.91 and $14.92 for our
California, Wyoming and Florida-based production,
respectively. During the first nine months of 2009, the average
discounts we received for our production relative to NYMEX WTI benchmark prices
per barrel were $0.56, $7.57 and $14.75 for our California, Wyoming and
Florida-based production, respectively.
All
derivative instruments are recorded on the balance sheet at fair
value. Fair value is generally determined based on the difference
between the fixed contract price and the underlying market price at the
determination date, and/or confirmed by the counterparty. Changes in
the fair value of commodity derivatives that do not qualify as a hedge or are
not designated as a hedge are recorded in gains (losses) on commodity derivative
instruments on the consolidated statements of operations, including a loss of
$11.6 million for the third quarter of 2009 compared to a gain of $431.6 million
for the same period a year ago and a loss of $164.4 million for the first nine
months of 2009 compared to a gain of $41.7 million for the same period a year
ago.
Interest
Rate Risk
We are
subject to interest rate risk associated with loans under our credit facility
that bear interest based on floating rates. As of September 30, 2009
our total debt outstanding was $585.0 million and as of October 31, 2009, was
$576.0 million. Therefore, from time to time we use interest rate
derivatives to hedge our interest obligations.
In 2009,
in order to mitigate our interest rate exposure, we had the following interest
rate derivative contracts in place at September 30, 2009, to fix a portion of
floating LIBOR-based debt on our credit facility:
|
Notional
amounts in thousands of dollars
|
Notional
Amount
|
Fixed
Rate
|
||||||
|
Period
Covered
|
||||||||
|
October
1, 2009 to January 8, 2010
|
$ | 100,000 | 3.3873 | % | ||||
|
October
1, 2009 to December 20, 2010
|
300,000 | 3.6825 | % | |||||
|
January
20, 2010 to October 20, 2011
|
100,000 | 1.6200 | % | |||||
|
December
20, 2010 to October 20, 2011
|
200,000 | 2.9900 | % | |||||
If
interest rates on the floating portion of our variable interest rate debt of
$185.0 million increase or decrease by 1 percent, our annual interest cost would
increase or decrease by approximately $1.9 million.
37
Changes
in Fair Value
The fair
value of our outstanding oil and gas commodity derivative instruments was a net
asset of approximately $127.9 million at September 30, 2009 and approximately
$292.3 million at December 31, 2008. With a $5.00 per barrel increase
or decrease in the price of oil, and a corresponding $1.00 per Mcf change in
natural gas, the fair value of our outstanding oil and gas commodity derivative
instruments at September 30, 2009, would have increased or decreased our
liability by approximately $85 million.
Price
risk sensitivities were calculated by assuming across-the-board increases in
price of $5.00 per barrel for oil and $1.00 per Mcf for natural gas regardless
of term or historical relationships between the contractual price of the
instruments and the underlying commodity price. In the event of
actual changes in prompt month prices equal to the assumptions, the fair value
of our derivative portfolio would typically change by less than the amounts
given due to lower volatility in out-month prices.
The fair
value of our outstanding interest rate derivative instruments was a net
liability of approximately $13.2 million and $17.3 million at September 30, 2009
and December 31, 2008. With a one percent increase or decrease in the
LIBOR rate, the fair value of our outstanding interest rate derivative
instruments at September 30, 2009 would have decreased or increased our net
liability by approximately $7 million.
ASC 820
defines fair value, establishes a framework for measuring fair value and
establishes required disclosures about fair value measurements. ASC
815 requires enhanced disclosures about how and why an entity uses derivative
instruments, how derivative instruments and related hedge items are accounted
for under ASC 815, and how derivative instruments and related hedge items affect
an entity’s financial position, financial performance, and cash
flows. Please see Note 14 to our consolidated financial statements
contained elsewhere in this report for disclosures required by these
pronouncements.
38
Item 4. Controls and
Procedures
Controls
and Procedures
We
maintain disclosure controls and procedures that are designed to ensure that
information required to be disclosed in the reports that we file or submit under
the Securities and Exchange Act of 1934, as amended (the “Exchange Act”), is
recorded, processed, summarized and reported within the time periods specified
in the SEC's rules and forms, and that such information is accumulated and
communicated to management, including our principal executive officers and
principal financial officer, as appropriate, to allow timely decisions regarding
required disclosures. See “Management’s Report to Unitholders on
Internal Control Over Financial Reporting” and “Reports of Independent
Registered Public Accounting Firm” in our Annual Report.
Our
General Partner’s Chief Executive Officers and Chief Financial Officer, after
evaluating the effectiveness of our “disclosure controls and procedures” (as
defined in Rules 13a-15(e) and 15d-15(e) under the Exchange Act), as of
September 30, 2009, concluded that our disclosure controls and procedures were
effective.
Changes
in Internal Control over Financial Reporting
There
were no changes in our internal control over financial reporting that occurred
during the three months ended September 30, 2009 that materially affected, or
are reasonably likely to materially affect, our internal control over financial
reporting.
39
PART II. OTHER INFORMATION
Item 1. Legal
Proceedings
Please
see Part I—Item 3 “—Legal Proceedings” in our Annual Report and Note 16 within
this report for more information on the pending lawsuit instituted by
Quicksilver.
Although
we may, from time to time, be involved in litigation and claims arising out of
our operations in the normal course of business, we are not currently a party to
any material legal proceedings other than as mentioned above. In addition,
we are not aware of any material legal or governmental proceedings against us,
or contemplated to be brought against us, under the various environmental
protection statutes to which we are subject.
Item 1A. Risk Factors
Except as set forth below, there have
been no material changes to the Risk Factors disclosed in our Annual Report and
in our Quarterly Reports on Form 10-Q for the quarters ended March 31, 2009 and
June 30, 2009, respectively. The following risk factors update
and amend certain of the “Risks Related to Our Business” included
in our Annual Report and in our Quarterly Reports on Form 10-Q for the
quarters ended March 31, 2009 and June 30, 2009, respectively.
Risks
Related to Our Business
Even
if we are able to pay quarterly distributions on our Common Units under the
terms of our credit facility, we may not elect to pay quarterly distributions on
our Common Units because we do not have sufficient cash flow from operations
following establishment of cash reserves, reduction of debt and payment of fees
and expenses.
Our credit facility limits the amounts
we can borrow to a borrowing base amount, which is determined by the lenders in
their sole discretion based on their valuation of our proved reserves and their
internal criteria. For example, in April 2009, our borrowing base was
decreased from $900 million to $760 million as a result of a scheduled borrowing
base redetermination; in June 2009, it was decreased to $735 million as a result
of the monetization of $25 million in crude oil and natural gas derivative
contracts; and in July 2009, it was decreased to $732 million as a result of our
sale of the Lazy JL Field. Our semi-annual borrowing base was
redetermined in October 2009, as a result of which our borrowing base remains
unchanged at $732 million. While we currently are not restricted by
our credit facility from declaring a distribution as we were in April 2009, we
may again be restricted from paying a distribution in the future. We
may be restricted from making distributions in the future under the terms of our
credit facility unless, after giving effect to such distribution, our
outstanding debt is less than 90 percent of the borrowing base, and we have the
ability to borrow at least 10 percent of the borrowing base while remaining in
compliance with all terms and conditions of our credit facility, including the
leverage ratio not exceeding 3.50 to 1.00 (which is total indebtedness to
EBITDAX).
Even if
we are able to pay quarterly distributions on our Common Units under the terms
of our credit facility, we may not have sufficient available cash each
quarter to pay quarterly distributions on our Common Units. Under the
terms of our partnership agreement, the amount of cash otherwise available for
distribution will be reduced by our operating expenses, debt reduction and the
amount of any cash reserve amounts that our general partner establishes to
provide for future operations, future capital expenditures, future debt service
requirements and future cash distributions to our unitholders. In the
future we may reserve a substantial portion of our cash generated from
operations to develop our oil and natural gas properties and to acquire
additional oil and natural gas properties in order to maintain and grow our
level of oil and natural gas reserves.
The
amount of cash we actually generate will depend upon numerous factors related to
our business that may be beyond our control, including among other
things:
|
·
|
the
amount of oil and natural gas we produce, which we expect to decline in
2009 due to decreased capital
expenditures;
|
|
·
|
demand
for and prices of our oil and natural gas, which prices decreased
significantly beginning in the third quarter of
2008;
|
|
·
|
the
level of our operating costs, including reimbursement of expenses to our
general partner;
|
|
·
|
prevailing
distressed economic conditions;
|
|
·
|
unexpected
defense and other costs associated with our ongoing litigation with
Quicksilver
|
|
·
|
continued
development of oil and natural gas wells and proved undeveloped
reserves;
|
|
·
|
the
level of competition we face;
|
|
·
|
fuel
conservation measures;
|
|
·
|
alternate
fuel requirements;
|
|
·
|
government
regulation and taxation; and
|
|
·
|
technical
advances in fuel economy and energy generation
devices.
|
40
In
addition, the actual amount of cash that we will have available for distribution
will depend on other factors, including:
|
·
|
our
ability to borrow under our credit facility to pay
distributions;
|
|
·
|
debt
service requirements and restrictions on distributions contained in our
credit facility or future debt
agreements;
|
|
·
|
the
level of our capital expenditures;
|
|
·
|
sources
of cash used to fund acquisitions;
|
|
·
|
fluctuations
in our working capital needs;
|
|
·
|
general
and administrative expenses;
|
|
·
|
cash
settlement of hedging positions;
|
|
·
|
timing
and collectability of receivables;
and
|
|
·
|
the
amount of cash reserves established for the proper conduct of our
business.
|
For a
description of additional restrictions and factors that may affect our ability
to make cash distributions, please read Part I—Item 2 “—Management's Discussion
and Analysis of Financial Condition and Results of Operations—Liquidity and
Capital Resources.”
Our
credit facility has substantial restrictions and financial covenants that may
restrict our business and financing activities and our ability to pay
distributions.
As of
October 31, 2009, we had approximately $576 million in borrowings outstanding
under our credit facility. Our credit facility limits the amounts we
can borrow to a borrowing base amount, determined by the lenders in their sole
discretion based on their valuation of our proved reserves and their internal
criteria. For example, in April 2009, our borrowing base was
decreased from $900 million to $760 million as a result of a scheduled borrowing
base redetermination; in June 2009; it was decreased to $735 million as a result
of the monetization of $25 million in crude oil and natural gas derivative
contracts in June 2009; and in July 2009, it was decreased to $732 million as a
result of the sale of the Lazy JL Field. The borrowing base is
redetermined semi-annually and the available borrowing amount could be further
decreased as a result of such redeterminations. Decreases in the
available borrowing amount could result from declines in oil and natural gas
prices, operating difficulties or increased costs, declines in reserves, lending
requirements or regulations or certain other circumstances. Our
semi-annual borrowing base was redetermined in October 2009, as a result of
which our borrowing base remains unchanged at $732 million Oil
and natural gas prices remain volatile, and we expect that the lenders under our
credit facility may further decrease our borrowing base at the next scheduled
redetermination in April 2010. A future decrease in our borrowing
base could be substantial and could be to a level below our outstanding
borrowings. Outstanding borrowings in excess of the borrowing base
are required to be repaid, or we are required to pledge other oil and natural
gas properties as additional collateral, within 30 days following notice from
the administrative agent of the new or adjusted borrowing base. If we do not have
sufficient funds on hand for repayment, we may be required to seek a waiver or
amendment from our lenders, refinance our credit facility or sell assets or debt
or Common Units. We may not be able obtain such financing or complete
such transactions on terms acceptable to us, or at all. Failure to
make the required repayment could result in a default under our credit facility,
which could adversely affect our business, financial condition and results or
operations.
41
The
operating and financial restrictions and covenants in our credit facility
restrict and any future financing agreements likely will restrict our ability to
finance future operations or capital needs or to engage, expand or pursue our
business activities or to pay distributions. Our credit facility
restricts and any future credit facility likely will restrict our ability
to:
|
·
|
incur
indebtedness;
|
|
·
|
grant
liens;
|
|
·
|
make
certain acquisitions and
investments;
|
|
·
|
lease
equipment;
|
|
·
|
make
capital expenditures above specified
amounts;
|
|
·
|
redeem
or prepay other debt;
|
|
·
|
make
distributions to unitholders or repurchase
units;
|
|
·
|
enter
into transactions with affiliates;
and
|
|
·
|
enter
into a merger, consolidation or sale of
assets.
|
Our
credit facility restricts our ability to make distributions to unitholders or
repurchase units unless after giving effect to such distribution, our
outstanding debt is less than 90 percent of the borrowing base, and we have the
ability to borrow at least 10 percent of the borrowing base while remaining in
compliance with all terms and conditions of our credit facility, including the
leverage ratio not exceeding 3.50 to 1.00 (which is total indebtedness to
EBITDAX). While we currently are not restricted by our credit facility from
declaring a distribution as we were in April 2009, we may again be restricted
from paying a distribution in the future.
We also
are required to comply with certain financial covenants and
ratios. Our ability to comply with these restrictions and covenants
in the future is uncertain and will be affected by the levels of cash flow from
our operations and events or circumstances beyond our control. In
light of the current weak economic conditions and the deterioration of oil and
natural gas prices, our ability to comply with these covenants may be
impaired. If we violate any of the restrictions, covenants, ratios or
tests in our credit facility, a significant portion of our indebtedness may
become immediately due and payable, our ability to make distributions will be
inhibited and our lenders’ commitment to make further loans to us may
terminate. We might not have, or be able to obtain, sufficient funds
to make these accelerated payments. In addition, our obligations
under our credit facility are secured by substantially all of our assets, and if
we are unable to repay our indebtedness under our credit facility, the lenders
can seek to foreclose on our assets. See Part I—Item 2 “—Management's
Discussion and Analysis of Financial Condition and Results of
Operations—Liquidity and Capital Resources—Credit Facility” for a
discussion of our credit facility covenants.
We
are subject to complex federal, state, local and other laws and regulations that
could adversely affect the cost, manner or feasibility of conducting our
operations.
Our oil
and natural gas exploration, production, gathering and transportation operations
are subject to complex and stringent laws and regulations. In order
to conduct our operations in compliance with these laws and regulations, we must
obtain and maintain numerous permits, approvals and certificates from various
federal, state and local governmental authorities. We may incur
substantial costs in order to maintain compliance with these existing laws and
regulations. In addition, our costs of compliance may increase if
existing laws, including tax laws, and regulations are revised or reinterpreted,
or if new laws and regulations become applicable to our operations. For
example, there is currently proposed federal legislation in four areas (tax,
climate change, derivatives and hydraulic fracturing) that if adopted could
significantly affect our operations. The following are brief
descriptions of the proposed laws:
|
·
|
With
respect to proposed tax legislation, President Obama’s Proposed 2010
Fiscal Year Budget includes proposed legislation that would, if enacted
into law, make significant changes to United States tax laws, including
the elimination of certain key U.S. federal income tax incentives
currently available to oil and natural gas exploration and production
companies. The
passage of any legislation as a result of these proposals or any other
similar changes in U.S. federal income tax laws could eliminate
certain tax deductions that are currently available with respect to oil
and gas exploration and development, and any such change could negatively
affect our financial condition and results of
operations.
|
42
|
·
|
On
June 26, 2009, the U.S. House of Representatives acted on climate change
legislation by approving the adoption of the “American Clean Energy and
Security Act of 2009,” also known as the “Waxman-Markey cap-and-trade
legislation” or ACESA. The purpose of ACESA is to control and
reduce emissions of carbon dioxide, methane and other
“greenhouse gases,” or “GHGs,” in the United States.
ACESA would require a reduction in emissions of GHGs by 17 percent (from
2005 levels) by 2020 and by more than 80 percent by 2050, which would
necessitate a very significant reduction in the use of carbon-based fuels
such as oil and natural gas. The Senate is currently considering
similar legislation that, if approved, would need to be reconciled with
ACESA before it could become law. Any laws or regulations that may
be adopted to restrict or reduce emissions of GHGs would likely require us
to incur increased operating costs, and could have an adverse effect on
demand for the oil and natural gas we produce. A Senate committee approved
its own version of GHG cap-and-trade legislation on November 5, 2009, but
the bill has not yet been scheduled for consideration by the full Senate
and, if adopted, the bill would need to be reconciled with ACESA and
reapproved by both houses of Congress before it could be adopted as
law.
|
|
·
|
Congress
is also currently considering legislation to impose restrictions on
certain transactions involving derivatives, which could affect the
use of derivatives in hedging transactions. Separately, two
committees of the House of Representatives, the Financial Services and
Agriculture Committees, acted on October 15 and October 21, 2009,
respectively, to adopt legislation that would impose comprehensive
regulation on the over-the-counter (OTC) derivatives marketplace.
This legislation would subject swap dealers and major swap participants to
substantial supervision and regulation, including capital standards,
margin requirements, business conduct standards, and recordkeeping and
reporting requirements. It also would require central clearing for
transactions entered into between swap dealers or major swap participants,
and would provide the CFTC with authority to impose position limits in the
OTC derivatives markets. A major swap participant generally would be
someone other than a dealer who maintains a "substantial" position in
outstanding swaps other than swaps used for commercial hedging, or whose
positions create substantial exposure to its counterparties or the
system. Any
laws or regulations that may be adopted that subject us to additional
capital or margin requirements relating to, or to additional restrictions
on, our trading and commodity positions could have an adverse effect on
our ability to hedge risks associated with our business or on the cost of
our hedging activity.
|
|
·
|
Congress
is currently considering legislation to amend the federal Safe Drinking
Water Act to require the disclosure of chemicals used by the oil and gas
industry in the hydraulic fracturing process. Hydraulic fracturing
involves the injection of water, sand and chemicals under pressure into
rock formations to stimulate natural gas production. Sponsors
of bills currently pending before the Senate and House of Representatives
have asserted that chemicals used in the fracturing process could
adversely affect drinking water supplies, and the proposed legislation
would require the reporting and public disclosure of chemicals used in the
fracturing process. These bills, if adopted, could establish an
additional level of regulation at the federal level that could lead to
operational delays or increased operating costs and could result in
additional regulatory burdens that could make it more difficult to perform
hydraulic fracturing and increase our costs of compliance and doing
business.
|
A change
in the jurisdictional characterization of our gathering assets by federal, state
or local regulatory agencies or a change in policy by those agencies with
respect to those assets may result in increased regulation of those
assets.
Our
business is subject to federal, state and local laws and regulations as
interpreted and enforced by governmental authorities possessing jurisdiction
over various aspects of the exploration for, and production of, oil and natural
gas. Failure to comply with such laws and regulations, as interpreted
and enforced, could have a material adverse effect on our business, financial
condition, results of operations and ability to make distributions to
you. Please read Part I—Item 1 of our Annual Report
“—Business—Operations—Environmental Matters and Regulation” and
“—Business—Operations—Other Regulation of the Oil and Gas Industry” for a
description of the laws and regulations that affect us.
43
Item 2. Unregistered Sales of
Equity Securities and Use of Proceeds
There
were no sales of unregistered equity securities during the period covered by
this report.
Item 3. Defaults Upon
Senior Securities
None.
Item 4. Submission of
Matters to a Vote of Security Holders
None.
Item 5. Other
Information
None.
44
Item 6. Exhibits
|
NUMBER
|
|
DOCUMENT
|
|
3.1
|
First
Amended and Restated Agreement of Limited Partnership of BreitBurn Energy
Partners L.P. (incorporated herein by reference to Exhibit 3.1 to the
Current Report on form 8-K dated October 10, 2006 and filed October 16,
2006).
|
|
|
3.2
|
Amendment
No. 1 to the First Amended and Restated Agreement of Limited Partnership
of BreitBurn Energy Partners L.P. (incorporated herein by reference to
Exhibit 3.1 to the Current Report on form 8-K dated June 17, 2008 and
filed June 23, 2008).
|
|
|
3.3
|
Amendment
No. 2 to the First Amended and Restated Agreement of Limited Partnership
of BreitBurn Energy Partners L.P. (incorporated herein by reference to
Exhibit 3.1 to the Current Report on form 8-K dated April 7, 2009 and
filed April 9, 2009).
|
|
|
3.4
|
Second
Amended and Restated Limited Liability Company Agreement of BreitBurn GP,
LLC (incorporated herein by reference to Exhibit 3.2 to the Current Report
on form 8-K dated June 17, 2008 and filed June 23,
2008).
|
|
|
3.5
|
Amendment
No. 3 to the First Amended and Restated Agreement of Limited Partnership
of BreitBurn Energy Partners L.P. (incorporated herein by reference to
Exhibit 3.1 to the Current Report on form 8-K dated August 27, 2009 and
filed September 1, 2009).
|
|
|
10.1
|
Indemnity
Agreement between BreitBurn Energy Partners L.P., BreitBurn GP, LLC and
Halbert S. Washburn, together with a schedule identifying other
substantially identical agreements between BreitBurn Energy Partners L.P.,
BreitBurn GP, LLC and each of its executive officers and non-employee
directors identified on the schedule (incorporated herein by reference to
Exhibit 10.1 to the Current Report on form 8-K dated October 29, 2009 and
filed November 4, 2009).
|
|
|
10.2
|
First
Amendment to the BreitBurn Energy Partners L.P. 2006 Long-Term Incentive
Plan Convertible Phantom Unit Agreements (incorporated herein by reference
to Exhibit 10.2 to the Current Report on form 8-K dated October 29, 2009
and filed November 4, 2009).
|
|
|
10.3*
|
First
Amended and Restated BreitBurn Energy Partners L.P. 2006 Long-Term
Incentive Plan effective October 29, 2009.
|
|
|
31.1*
|
Certification
of Registrant’s Co-Chief Executive Officer pursuant to Rule 13a-14(a) of
the Securities Exchange Act of 1934 and Section 302 of the Sarbanes-Oxley
Act of 2002.
|
|
|
31.2*
|
Certification
of Registrant’s Co-Chief Executive Officer pursuant to Rule 13a-14(a) of
the Securities Exchange Act of 1934 and Section 302 of the Sarbanes-Oxley
Act of 2002.
|
|
|
31.3*
|
Certification
of Registrant’s Chief Financial Officer pursuant to Rule 13a-14(a) of the
Securities Exchange Act of 1934 and Section 302 of the Sarbanes-Oxley Act
of 2002.
|
|
|
32.1*
|
Certification
of Registrant’s Co-Chief Executive Officer pursuant to Rule 13a-14(b) of
the Securities Exchange Act of 1934 and 18 U.S.C. Section 1350, as created
by Section 906 of the Sarbanes-Oxley Act of 2002. This
certification is being furnished solely to accompany this Quarterly Report
on Form 10-Q and is not being filed for purposes of Section 18 of the
Securities Exchange Act of 1934, as amended, and is not to be incorporated
by reference into any filing of the Partnership.
|
|
|
32.2*
|
Certification
of Registrant’s Co-Chief Executive Officer pursuant to Rule 13a-14(b) of
the Securities Exchange Act of 1934 and 18 U.S.C. Section 1350, as created
by Section 906 of the Sarbanes-Oxley Act of 2002. This
certification is being furnished solely to accompany this Quarterly Report
on Form 10-Q and is not being filed for purposes of Section 18 of the
Securities Exchange Act of 1934, as amended, and is not to be incorporated
by reference into any filing of the Partnership.
|
|
|
32.3*
|
Certification
of Registrant’s Chief Financial Officer pursuant to Rule 13a-14(b) of the
Securities Exchange Act of 1934 and 18 U.S.C. Section 1350, as created by
Section 906 of the Sarbanes-Oxley Act of 2002. This
certification is being furnished solely to accompany this Quarterly Report
on Form 10-Q and is not being filed for purposes of Section 18 of the
Securities Exchange Act of 1934, as amended, and is not to be incorporated
by reference into any filing of the
Partnership.
|
* Filed
herewith.
45
Pursuant to the requirements of the
Securities Exchange Act of 1934, the Registrant has duly caused this report to
be signed on its behalf by the undersigned thereunto duly
authorized.
|
BREITBURN
ENERGY PARTNERS L.P.
|
|
By:
|
BREITBURN
GP, LLC,
|
|
|
its
General Partner
|
||
|
Dated: November
6, 2009
|
By:
|
/s/ HALBERT S. WASHBURN
|
|
Halbert
S. Washburn
|
||
|
Co-Chief
Executive Officer
|
||
|
Dated: November
6, 2009
|
By:
|
/s/ RANDALL H.
BREITENBACH
|
|
Randall
H. Breitenbach
|
||
|
Co-Chief
Executive Officer
|
||
|
Dated: November
6, 2009
|
By:
|
/s/ JAMES G. JACKSON
|
|
James
G. Jackson
|
||
|
Chief
Financial Officer
|
46
EXHIBIT INDEX
* Filed
herewith.
47